UNITED STATES
SECURITIES AND EXCHANGE COMMISSION
Washington, D.C. 20549
FORM 10-K
| x | ANNUAL REPORT PURSUANT TO SECTION 13 OR 15(d) OF THE SECURITIES EXCHANGE ACT OF 1934 |
| | For the fiscal year ended December 31, 2009 |
OR
| ¨ | TRANSITION REPORT PURSUANT TO SECTION 13 OR 15(d) OF THE SECURITIES EXCHANGE ACT OF 1934 |
| | For the transition period from to |
Commission File Number 001-32686
VIACOM INC.
(Exact name of registrant as specified in its charter)
| | |
| DELAWARE | | 20-3515052 |
(State or other jurisdiction of incorporation or organization) | | (I.R.S. Employer Identification Number) |
1515 Broadway
New York, NY 10036
(212) 258-6000
(Address, including zip code, and telephone number,
including area code, of registrant’s principal executive offices)
Securities Registered Pursuant to Section 12(b) of the Act:
| | |
Title of Each Class | | Name of Each Exchange on Which Registered |
Class A Common Stock, $0.001 par value | | New York Stock Exchange |
Class B Common Stock, $0.001 par value | | New York Stock Exchange |
6.85% Senior Notes due 2055 | | New York Stock Exchange |
Securities Registered Pursuant to Section 12(g) of the Act:
None
(Title Of Class)
Indicate by check mark if the registrant is a well-known seasoned issuer, as defined in Rule 405 of the Securities Act. Yes x No ¨
Indicate by check mark if the registrant is not required to file reports pursuant to Section 13 or Section 15(d) of the Act. Yes ¨ No x
Indicate by check mark whether the registrant (1) has filed all reports required to be filed by Section 13 or 15(d) of the Securities Exchange Act of 1934 during the preceding 12 months (or for such shorter period that the registrant was required to file such reports), and (2) has been subject to such filing requirements for the past 90 days. Yes x No ¨
Indicate by check mark whether the registrant has submitted electronically and posted on its corporate Web site, if any, every Interactive Data File required to be submitted and posted pursuant to Rule 405 of Regulation S-T during the preceding 12 months (or such shorter period that the registrant was required to submit and post such files). Yes x No ¨
Indicate by check mark if disclosure of delinquent filers pursuant to Item 405 of Regulation S-K is not contained herein, and will not be contained, to the best of the registrant’s knowledge, in definitive proxy or information statements incorporated by reference in Part III of this Form 10-K or any amendment to this Form 10-K. x
Indicate by check mark whether the registrant is a large accelerated filer, an accelerated filer, a non-accelerated filer, or a smaller reporting company. See definitions of “large accelerated filer,” “accelerated filer” and “smaller reporting company” in Rule 12b-2 of the Exchange Act. (Check one):
| | | | | | |
| Large accelerated filer x | | Accelerated filer ¨ | | Non-accelerated filer ¨ | | Smaller reporting company ¨ |
Indicate by check mark whether the registrant is a shell company (as defined in Rule 12b-2 of the Act). Yes ¨ No x
As of the close of business on June 30, 2009, the last business day of the registrant’s most recently completed second fiscal quarter, there were 57,363,986 shares of the registrant’s Class A common stock, par value $0.001 per share, and 549,501,904 shares of its Class B common stock, par value $0.001 per share, outstanding. The aggregate market value of Class A common stock held by non-affiliates as of June 30, 2009 was approximately $252.6 million (based upon the closing price of $23.98 per share as reported by the New York Stock Exchange on June 30, 2009). The aggregate market value of Class B common stock held by non-affiliates as of June 30, 2009 was approximately $12.1 billion (based upon the closing price of $22.70 per share as reported by the New York Stock Exchange on June 30, 2009).
As of January 31, 2010, 52,342,953 shares of our Class A common stock and 554,989,599 shares of our Class B common stock were outstanding.
DOCUMENTS INCORPORATED BY REFERENCE
Portions of Viacom Inc.’s Notice of 2010 Annual Meeting of Stockholders and Proxy Statement to be filed with the Securities and Exchange Commission pursuant to Regulation 14A of the Securities Exchange Act of 1934, as amended, are incorporated by reference into this Annual Report on Form 10-K (Portion of Item 5; Part III).
TABLE OF CONTENTS
PART I
Item 1.Business.
OVERVIEW
Viacom is a leading global entertainment content company, engaging audiences on television, motion picture, Internet, mobile and video game platforms through many of the world’s best known entertainment brands. We manage our operations through two reporting segments:Media Networks and Filmed Entertainment. References in this document to “Viacom,” “Company,” “we,” “us” and “our” mean Viacom Inc. and our consolidated subsidiaries through which our various businesses are conducted, unless the context requires otherwise.
Media Networks
OurMedia Networks segment provides entertainment content for consumers in key demographics attractive to advertisers, content distributors and retailers. We create and acquire programming, video games and other content for distribution to our audiences how and where they want to view and interact with it: on television, the Internet, mobile devices, game consoles and through a variety of consumer products and themed entertainment. MTV Networks reaches over 640 million households in more than 160 countries worldwide via its approximately 170 channels and multiplatform properties, which include MTV: Music Television®, VH1®, CMT®: Country Music Television™, Logo®, Nickelodeon®, Nick at Nite®, Nick Jr.®, TeenNick®, COMEDY CENTRAL®, Spike TV® and TV Land®, among others. MTV Networks also has a video game business that includes theRock Band® franchise and casual gaming websites such as AddictingGames.com and Shockwave.com. BET Networks is a leading provider of entertainment, music, news and public affairs programming targeted to the African-American audience, and its channels and properties, which include BET® and CENTRIC™, can be seen in the United States, Canada, the Caribbean, the United Kingdom and sub-Saharan Africa.
OurMedia Networks segment derives revenues principally from advertising sales, affiliate fees and ancillary revenues. Revenues from theMedia Networks segment accounted for 61%, 60% and 60% of our revenues for 2009, 2008 and 2007, respectively.
Filmed Entertainment
TheFilmed Entertainment segment produces, finances and distributes motion pictures and other entertainment content under the Paramount Pictures®, Paramount Vantage®, Paramount Classics®, MTV Films® and Nickelodeon Movies® brands. TheFilmed Entertainment segment also continues to release certain pictures under the DreamWorks® brand. Paramount Pictures has been a leading producer and distributor of motion pictures since 1912 and has a library consisting of approximately 3,300 motion pictures and a small number of television programs. It also acquires films for distribution and has distribution relationships with DreamWorks Animation and MVL Productions LLC (“Marvel”), a subsidiary of The Walt Disney Company. Paramount distributes motion pictures and other entertainment content on DVD and Blu-ray, television, digital and other platforms in the United States and internationally, and has a presence in the games business.
Revenues from theFilmed Entertainment segment are generated primarily from the theatrical release and/or distribution of motion pictures, sale of home entertainment products such as DVDs, and licensing of motion pictures and other content to pay and basic cable television, broadcast television, syndicated television and digital media outlets. Revenues from theFilmed Entertainment segment accounted for 40%, 41% and 41% of our revenues for 2009, 2008 and 2007, respectively, with elimination of intercompany revenues of (1)% each year.
Business Strategy
We produce and distribute television programming, motion pictures and other entertainment content under some of the world’s best known entertainment brands, many of which are household names worldwide. We are focused on providing our audience the entertainment they want to experience, how and when they want to experience it, and exploring new ways to deliver compelling content to them. Key elements of our strategy include:
| | • | | expanding and enhancing our brands worldwide through the creation and acquisition of hit programming, new channels, successful motion pictures, video games and other forms of entertainment; |
1
| | • | | prudently investing in programming and other content that fits into our core businesses and brand portfolios, with a focus on growing ratings across our networks; |
| | • | | strengthening our relationships with our advertising, cable, satellite, online, mobile and licensing partners, as we work together to develop new ways of serving our audiences; |
| | • | | capitalizing on new technologies in the marketplace, including through the continued expansion and monetization of our online and mobile entertainment experiences; |
| | • | | executing on a film slate focused on key tentpole films mixed with smaller productions or acquisitions andMedia Networks branded films, while maintaining our focus on cost savings initiatives; |
| | • | | taking advantage of international growth opportunities and building our international presence in both our media networks and filmed entertainment businesses, including capitalizing on global digital opportunities; and |
| | • | | continued operational discipline throughout our organization to generate efficiencies and effectively execute our strategy. |
In connection with these efforts, we are committed to fostering a creative and diverse culture, which will enable us to continue to develop unique and cutting-edge content for our audiences and maintain our position as a market leader.
Corporate Information
We were organized as a Delaware corporation in 2005 and our principal offices are located at 1515 Broadway, New York, New York 10036. Our telephone number is (212) 258-6000 and our website is www.viacom.com. Information on our website is not intended to be incorporated into this annual report.
In 2010, we are changing our fiscal year end to September 30 from December 31. For comparability purposes, we plan to report our financial results for the nine-month transition period of January 1, 2010 through September 30, 2010 on an Annual Report on Form 10-K and to thereafter file reports for each twelve month period ended September 30.
MEDIA NETWORKS
Our media networks, MTV Networks and BET Networks, operate their program services, websites and other digital media services in the United States and internationally.
Media Networks Revenues
OurMedia Networks segment generates revenues principally in three categories: (i) the sale of advertising time on our program services and digital properties, (ii) the receipt of affiliate fees from cable television operators, direct-to-home satellite operators, mobile networks and other content distributors and (iii) ancillary revenues, which include the creation and publishing of video games and other interactive products, home entertainment sales of our programming, the licensing of our content to third parties and the licensing of our brands and properties for consumer products. In 2009, advertising revenues, affiliate fees and ancillary revenues were approximately 53%, 35% and 12%, respectively, of total revenues for theMedia Networks segment.
Advertising Revenues
The advertising revenues generated by each program service depend on the number of households subscribing to the service, household and viewership demographics, and ratings as determined by third party research
2
companies such as The Nielsen Company (US), LLC (“Nielsen”). Our media networks properties target key audiences considered particularly attractive to advertisers. For example, MTV targets teen and young adult demographics, Nickelodeon targets kids and their families and BET targets African-American audiences.
Our advertising revenues may be affected by the strength of the advertising market and general economic conditions, and may fluctuate depending on the success of our programming at any given time. Advertising revenues may also fluctuate due to seasonal variations, typically being highest in the fourth quarter of the calendar year.
Revenue from our digital businesses is derived from a combination of advertising and sponsorships. OurMedia Networks segment operates approximately 430 digital media properties around the world, and during the fourth quarter of 2009, we collectively averaged approximately 98 million unique visitors per month. Our on-air programming drives traffic to our digital properties and vice versa, allowing convergent, or cross-platform, advertising sales. MTV Networks also syndicates ad-supported long-form and short-form video content to select online destinations which creates additional opportunities for audiences to interact with our content online, ultimately driving viewership back to our core channels and digital properties.
Affiliate Fees
Revenues from affiliate fees are negotiated with cable and satellite television operators, mobile networks and other distributors, generally resulting in multi-year carriage agreements with set rate increases that provide us with a reasonably stable source of revenues. The amount of the fees we receive is generally a function of the number of subscribers and the rates per subscriber paid by our cable and satellite affiliate partners. Expirations of our affiliate agreements are staggered. We are exploring ways to build stronger and more expansive multi-media partnerships with the various distributors of our content that maximize the value of our content for us, our audience and our affiliate partners, such as customized content offerings for video-on-demand and Internet distribution with our cable and satellite partners. We also receive e-commerce revenues from our digital operations.
Ancillary Revenues
Our ancillary revenues are principally derived from the creation and publishing of video games, such as from sales ofRock Band, sales of home entertainment products such as DVDs, content licensing and licensing for consumer products, including licensing of popular characters from our programs. We also receive royalties from third party sales of certain related games and products, includingGuitar Hero, which is published by Activision. Our ancillary revenues may vary based on consumer spending and acceptance of our products.
OurRock Band franchise, which now includesRock Band,Rock Band 2andThe Beatles™: Rock Band, is a music-based video game that uses drum, bass/lead guitar and microphone peripherals to allow players to experience music through the eyes and instruments of the artist.The Beatles: Rock Band offers players an unprecedented experiential progression through the music and artistry of The Beatles, including never before seen footage and previously unreleased authentic voice recordings of The Beatles in the studio.Rock Bandis available on multiple gaming platforms, and gamers can download over 1,000 songs spanning all genres of rock, which provides another source of ancillary revenue for us. Electronic Arts co-manufactures, co-markets and distributesRock Band for us in exchange for certain fees.
We distribute our programming in the home entertainment market through the sale and rental of DVDs, video-on-demand, download-to-own and download-to-rent services. We also license our television programs and the concepts and/or formats of such programs to third parties in exchange for licensing fees and royalties. We have a worldwide consumer products licensing business, which licenses popular characters from our programs, such as those featured inSpongeBob SquarePants, Dora the Explorer,NeopetsandSouth Park, in connection with merchandising, video games and publishing worldwide. We generally are paid a royalty based upon a
3
percentage of the licensee’s wholesale revenues, with an advance and/or guarantee against future expected royalties. Licensing revenue may vary from period to period depending on the popularity of the program available for license in a particular period and the popularity of licensed products among consumers. In addition, we recently concluded a series of transactions to acquire a partial economic interest in a library of music content and to enable us to create our own library of original music content for use by us and our affiliates.
Media Networks Properties
MTV Networks is principally comprised of four groups based on target audience, similarity of programming and other factors: the Music and Logo Group, the Kids and Family Group, the Entertainment Group and International. BET Networks’ businesses include BET, CENTRIC, BET International and BET Digital, among other properties. Information about our key media networks properties is discussed below. Unless otherwise indicated, the domestic television household numbers are according to Nielsen, the Internet user data is according to comScore Media Metrix (U.S. data only unless otherwise indicated) and the video stream data is based on internal tracking. International reach statistics are derived from internal data coupled with external sources when available.
MTV Networks
Music and Logo Group
The Music and Logo Group includes our music-oriented program services and digital properties, which generally provide youth-oriented programming targeting the 18-24 and 18-34 demographics, the Harmonix and MTV Games video game operations, and Logo, our channel for the lesbian, gay, bisexual and transgender audience. Some of our key properties in this group include:
| | | | |

| | MTV: Music Television |
| | • | | A leading global brand and multimedia destination targeting teens and young adults and offering original programming, awards shows, music videos, news and commentary, online communities and virtual worlds, and mobile content. |
| | • | | Programming highlights in 2009 included new original programming such asJersey Shore,The City,16 and Pregnant andTeen Mom, as well as returning favorites such as the VMAs, which were watched by over 26.9 million viewers on MTV, MTV2 and VH1 according to Nielsen, the MTV Movie Awards, which had its highest ratings in five years,The Hills, The Real Worldand Randy Jackson Presents: America’s Best Dance Crew. |
| | • | | MTV reached approximately 98 million domestic television households as of December 31, 2009. MTV reached more than 600 million households in more than 150 countries and territories as of December 31, 2009 via its 65 MTV branded channels, and many more households through branded programming blocks on third party broadcasters. |
| |
 | | MTV2 |
| | • | | A music-oriented network featuring music videos, long form music programs, movie news and trailers and groundbreaking music, as well as irreverent, lifestyle and cross-platform programming. |
| | • | | Programming highlights in 2009 were driven by MTV’s hit series and music-based programs such asRandy Jackson Presents: America’s Best Dance Crew andSucker Free Countdown. |
| | • | | MTV2 reached approximately 77 million domestic television households as of December 31, 2009. |
4
| | | | |
 | | MTV Digital |
| | • | | Online/broadband service featuring a diverse array of entertainment and pop culture content reflecting the core themes of MTV and MTV2, including Virtual MTV (virtual.mtv.com), and the Flux-based community platform, which allows users to interact with content and other users across a network of websites. |
| | • | | In the fourth quarter of 2009, MTV.com averaged approximately 7.5 million monthly unique visitors and 75 million video streams each month. |
| |

| | VH1 |
| | • | | Music and pop culture-driven network featuring a variety of original and acquired programming primarily focused on music artists and celebrities, as well as numerous online destinations, a mobile platform and interests in home video, publishing and consumer products. |
| | • | | Programming highlights in 2009 included new original programming such asThe T.O. Show and Sex Rehab with Dr. Drew, as well as returning favoritesVH1 Divas,I Want to Work for Diddy 2, For the Love of Ray J, Behind the Musicand Tough Love. |
| | • | | VH1 reached approximately 98 million domestic television households as of December 31, 2009. |
| |

| | VH1 Classic |
| | • | | Vintage-themed network featuring music videos, documentaries, movies and concert footage from the 1970s, 1980s and 1990s, as well as other music-themed programs. |
| | • | | Programming highlights in 2009 includedThe Beatles: Rock Band Special,Totally 80s,Michael Jackson’s Human Nature andThat Metal Show. |
| | • | | VH1 Classic reached approximately 56 million domestic television households as of December 31, 2009. |
| |

| | VH1 Digital |
| | • | | Online services featuring music-themed and pop culture content, including live events, performances, news, music videos and original series, at VH1.com, VH1Classic.com, VH1 Mobile, VH1 Games and targeted websites such as BestWeekEver.TV and TheFabLife.com. |
| | • | | In the fourth quarter of 2009, VH1.com averaged approximately 3.5 million monthly unique visitors and 13.7 million video streams each month. |
| |

| | CMT: Country Music Television and CMT.com |
| | • | | Authorities on country music and culture, featuring the latest in country music videos, news, awards and live concerts that reflect its audience’s passion for all things music, family, adventure and comedy, and delivering country’s biggest stars across its digital extensions including CMT.com, CMT On Demand, CMT Mobile and CMT Pure, the network’s all-music digital channel. |
| | • | | Programming highlights in 2009 included hitsWorld’s Strictest ParentsandThe Singing Bee, along with returning favorites such asCMT Music Awards, CMT CrossroadsandCan You Duet?. CMT’s highly-rated weekly staples includeCMT Insider andCMT Top 20 Countdown. |
| | • | | CMT reached approximately 90 million domestic television households as of December 31, 2009. In the fourth quarter of 2009, CMT.com averaged approximately 2.5 million monthly unique visitors and 10.8 million video streams each month. |
5
| | | | |
 | | Logo |
| | • | | A leading destination for the lesbian, gay, bisexual and transgender community featuring series, documentaries, feature films and original shows and specials, as well as a diverse family of websites, including LOGOonline.com, Afterellen.com, Afterelton.com, Downelink.com and 365Gay.com. |
| | • | | Programming highlights in 2009 included original programs such asRuPaul’s Drag Race,Jeffrey & Cole Casserole andThe New Now Next Awards, and acquired programs such asBeautiful People,Were The World Mine,The L WordandFar From Heaven. |
| | • | | Logo reached approximately 45 million domestic television households as of December 31, 2009. |
| |


| | Harmonix and MTV Games |
| | • | | Harmonix is one of the world’s leading developers of music-based games, including ourRock Band franchise andGuitar Hero. MTV Games creates, markets and publishes innovative interactive products that deepen the MTV audience’s connection to MTV’s core content. MTV Games publishes theRock Band franchise. |
| | • | | In 2009,Rock Band,Rock Band 2 andThe Beatles: Rock Band sold over 1.8 million bundles, 2.6 million units of standalone software and 614,000 units of standalone hardware domestically, and players downloaded over 50 million songs. |
| | • | | In September 2009,The Beatles: Rock Banddebuted as the top selling music video game domestically for the month and over 100,000 downloads of “All You Need Is Love” were sold. Harmonix and MTV Games continue to pursue additional partnerships with legendary musicians and bands to provide content for their video games, including a collaboration with Green Day forRock Band that is expected to be released in 2010. |
Other key properties of the Music and Logo Group include mtvU, our on-air, online and on-campus network created by and for the college audience; MTV Films, MTV’s motion picture brand; and Palladia, a music-centric high definition television channel.
Kids and Family Group
The Kids and Family Group provides high-quality entertainment and educational programs, websites and broadband services targeted to kids ages 2-17 and their families. Some of our key properties in this group include:
| | | | |

| | Nickelodeon and Nick at Nite |
| | • | | Celebrating its 30th anniversary in 2009, Nickelodeon has been the number one rated basic cable network for 15 years according to Nielsen. Nickelodeon features original programming for kids during the daytime hours. Nickelodeon produces and distributes television programming worldwide and has a global consumer products business. Nick at Nite airs during the evening and overnight hours and features contemporary family comedies as well as original programming. |

| | • | | In October 2009, Nickelodeon acquired the global rights to theTeenage Mutant Ninja Turtles franchise, including global intellectual property rights to theTMNTtelevision, film and video game properties and all merchandising rights. Nickelodeon is developing a new CG-animatedTMNTtelevision series, expected to premiere in 2012. |
| | • | | Nickelodeon programming highlights in 2009 included new original series such asFanboy & Chum Chum and the hitPenguins of Madagascardeveloped in conjunction with DreamWorks Animation, as well as returning favoritesSpongeBob SquarePants,iCarly,True Jackson, VP andThe Fairly OddParents. Nick at Nite programming highlights included new acquisitionsEverybody Hates Chris andMalcolm In the Middle and the original animated seriesGlenn Martin, DDS. |
6
| | | | |
| | | | Nickelodeon and Nick at Nite reached approximately 100 million domestic television households as of December 31, 2009. Nickelodeon reached more than 330 million households in 111 countries and territories as of December 31, 2009, via its 50 Nickelodeon branded channels, and many more households through branded programming blocks on third party broadcasters. |
| |

| | Nick.com |
| | • | | The destination for all things Nickelodeon, featuring video streaming of Nick content, games and videos, as well as access to the extensive Nickelodeon content library. |
| | • | | In the fourth quarter of 2009, Nick.com sites averaged 8.6 million monthly unique visitors. Nick.com had an average of 55.4 million video streams each month. |
| |

| | Nick Jr. and NickJr.com |
| | • | | Nick Jr. (formerly Noggin) is a commercial-free, educational channel for preschoolers where they can engage with characters they love while building their imaginations, gaining key cognitive and social-emotional skills and learning about the world around them. NickJr.com inspires kids through entertaining and enriching online activities geared toward their interests, ages and developmental levels. |
| | • | | Nick Jr. favorites include original programsDora the Explorer, Go, Diego, Go!,Ni Hao Kai-Lan, The Wonder Pets!, The Backyardigans, Yo Gabba Gabba! andBlue’s Clues. |
| | • | | Nick Jr. reached approximately 71 million domestic television households as of December 31, 2009. In the fourth quarter of 2009, NickJr.com averaged 6.2 million monthly unique visitors. |
| |

| | TeenNick and TeenNick.com |
| | • | | TeenNick (formerly The N) is Nickelodeon’s 24-hour network exclusively for and about teens, featuring award-winning series, original shows and TV favorites with a focus on celebrating the unique everyday realities of being a teen. TeenNick.com features the best episodes and clips of TeenNick shows, as well as games, quizzes and a vibrant user community. |
| | • | | Programming highlights in 2009 included the2009 TeenNick Halo Awards,Degrassi: The Next Generation, What I Like About You, That 70’s Show, Zoey 101, iCarly, True Jackson, VP, One on OneandSaved by the Bell. |
| | • | | TeenNick reached approximately 69 million domestic television households as of December 31, 2009. In the fourth quarter of 2009, TeenNick.com averaged 1 million monthly unique visitors. |
| |

| | NICKTOONS |
| | • | | Leading cartoon destination for kids and animation lovers. |
| | • | | Programming highlights in 2009 includedAvatar: The Last Airbender, Wolverine and the X-Men,Iron Man: Armored Adventures andFantastic Four: World’s Greatest Heroes. |
| | • | | NICKTOONS reached approximately 55 million domestic television households as of December 31, 2009. |
| |

| | Nickelodeon Virtual Worlds |
| | • | | Online youth-focused virtual worlds that allow members to create a virtual identity and participate in a variety of customized gameplay; includes Neopets and Petpet Park, a new immersive environment for younger kids. |
| | • | | Neopets has approximately 60 million members, and in the fourth quarter of 2009, averaged approximately 2.3 million monthly unique visitors. Petpet Park has approximately 1.4 million members, and, in the fourth quarter of 2009, averaged approximately 930,000 monthly unique visitors. |
7
| | | | |

| | ParentsConnect.com |
| | • | | Social networking destination for parents, featuring message boards, expert advice, games, user generated content, baby names, local events and activities and personal profile pages. In the fourth quarter of 2009, ParentsConnect averaged 2.2 million monthly unique visitors. |
| |
| | Nickelodeon Kids and Family Games |
| | • | | Gaming websites offering classic arcade games and puzzles, sports and other games, including our dedicated casual games sites Shockwave.com and AddictingGames.com, as well as several iPhone apps featuring Nick, Nick Jr. and AddictingGames content. |
| | • | | Nickelodeon’s portfolio of gaming sites averaged 24.4 million monthly unique visitors in the fourth quarter of 2009. |
Other Kids and Family Group properties include Nick Jr. Video and The Click, which are the broadband services of Nick Jr. and TeenNick, respectively; Nickelodeon Movies, Nickelodeon’s motion picture brand, under which Paramount releasedHotel for Dogs in 2009 and will release The Last Airbender in 2010, based on the popular cartoon Avatar: The Last Airbender; and the Nickelodeon Animation Studio. In addition, Nickelodeon licenses its brands for hotels, cruises, live tours and other recreational outlets.
Entertainment Group
The Entertainment Group produces and distributes programming and online content and games that generally target adult and male audiences. Some of our key properties in this group include:
| | | | |

| | COMEDY CENTRAL |
| | • | | Television’s only all-comedy network, offering multiplatform content on-air, online and on-the-go. COMEDY CENTRAL also has interests in home video, recorded comedy and a live comedy touring business. |
| | • | | Programming highlights in 2009 included the Emmy® and Peabody® Award-winning seriesThe Daily Show with Jon Stewart,The Colbert Report andSouth Park, as well as favoritesThe Jeff Dunham Show,The Sarah Silverman Program,RENO 911!,Important Things With Demetri Martin,Scrubs and new acquisition30 Rock, which is expected to air in 2011. |
| | • | | COMEDY CENTRAL reached approximately 98 million domestic television households as of December 31, 2009. |
| |

| | Comedycentral.com |
| | • | | Broadband video platform featuring exclusive COMEDY CENTRAL content. Other COMEDY CENTRAL online properties include thedailyshow.com and Colbertnation.com, the official fan sites ofThe Daily Show with Jon StewartandThe Colbert Report, Jokes.com, the largest stand-up comedy library online, and the officialSouth Park website Southparkstudios.com, a joint venture in which COMEDY CENTRAL owns a 51% interest, which features the latest inSouth Park news and content. |
| | • | | In the fourth quarter of 2009, COMEDY CENTRAL’s online properties averaged 5.3 million monthly unique visitors and 77.2 million video streams each month. |
| |

| | Spike TV |
| | • | | Male-oriented network featuring a mix of original and acquired programming, specials, live events, movies and the exclusive domestic cable rights toUFC: The Ultimate Fighter television series. |
| | • | | Programming highlights in 2009 included new original programming such asDeadliest Warrior, new acquisitions such asBand of Brothers, and returning favoritesThe Ultimate Fighter,TNA iMPACT,Manswers, 1,000 Ways to Die, DEA,Pros vs. Joes, Spike’sVideo Game Awards, Spike’s Guys Choice Awardsand Spike’s Scream Awards. |
| | • | | Spike TV reached approximately 99 million domestic television households as of December 31, 2009. |
8
| | | | |

| | SPIKE.com |
| | • | | Leading video entertainment destination for men 18-34, with original and user-generated content, including short films, TV clips, music videos and action sports. |
| | • | | In the fourth quarter of 2009, Spike.com averaged approximately 3.2 million monthly unique visitors and 14.3 million video streams each month. |
| |

| | TV Land |
| | • | | Airs a mix of original programming, classic TV shows and iconic movies designed to appeal to the entertainment needs and attitudes of adults in their 40s and 50s, including TV Land PRIME, a block of primetime original programming. |
| | • | | Programming highlights in 2009 included the new original programsThe Cougar,How’d You Get So Rich? andMake My Day, returning favorites such asHigh School Reunion andShe’s Got The Look, and new acquisitionRoseanne. |
| | • | | TV Land reached approximately 97 million domestic television households as of December 31, 2009. |
Other Entertainment Group properties include Atom.com, a broadband service for original short films and online video clips; AddictingClips.com, which houses entertaining original and user-generated video clips; and GameTrailers.com, which produces broadcast quality video content for video games.
MTV Networks International
Worldwide, MTV Networks’ operations reached over 640 million households in more than 160 countries via its program services as of December 31, 2009. MTV Networks International owns and operates, participates in as a joint venturer, and/or licenses to third parties to operate approximately 170 program services. These program services include extensions of our multimedia brands MTV, VH1, Nickelodeon and COMEDY CENTRAL, as well as program services created specifically for international and/or non-English speaking audiences such as MTV Tr3s, Viva, TMF, Paramount Comedy and Game One, among others. MTVN International also operates approximately 200 online properties internationally. Most of the MTVN International program services are regionally customized for the particular viewers through the inclusion of local music, programming and on-air personalities, and use of the local language. MTV Networks’ operations in Europe, Latin America and Asia represent its largest international presence.
We strategically pursue the delivery of our programming in international markets through ownership of certain program services, either ourselves or jointly with a third party, and through licensing of our content to other third party services. We also engage in the syndication and distribution of consumer products. Our Viacom 18 joint venture in India includes television, film and digital media content across numerous brands as well as consumer products. Colors, its Hindi-language general entertainment channel, has rapidly become a highly rated general entertainment channel in India and is expected to be made available in the United Kingdom and the United States beginning in 2010. In 2009, MTVN International launched “MTV World Stage,” a weekly series featuring multi-genre concerts from around the globe, and “MTV Push,” a monthly update on emerging musical talents.
We continue to focus on efficiently expanding our international presence by ensuring that we have the appropriate forms of ownership interests in our properties worldwide. This involves concentrating our resources in the regions and on the demographics that offer the greatest growth opportunity for our brands, such as Europe and India, and entering into licensing arrangements in other regions that can be best exploited by our partners. In 2009, we launched Viva in the United Kingdom and we plan to continue to expand our brands in various regions through the continued roll-out of the Nickelodeon, Comedy Central and music channel brands.
BET Networks
BET Networks owns and operates program services, including its flagship BET® channel, CENTRIC™ (formerly, BETJ®), BET Gospel® and BET Hip Hop®.
9
| | | | |


| | BET Networks |
| | • | | BET Networks is the nation’s leading television network providing entertainment, music, news and public affairs programming targeted to African-American audiences and consumers of Black culture. In 2009, BET engaged in rebranding efforts to reaffirm BET’s commitment to respect, reflect and elevate its audience through a number of themes, including promoting the strength and endurance of the family, providing tools of encouragement and achievement to the black community, and further cementing BET as the primary media outlet for consumers of black culture. BET is a leading consumer brand in the urban marketplace with a diverse group of branded businesses, including BET, its core channel which focuses on young Black adults; BET Gospel, which focuses on gospel music and spiritual programming; and BET Hip Hop, which features hip hop music programming and performances. |
| | • | | CENTRIC, which launched in September 2009, is a premier destination for multicultural audiences, delivering R&B, soul, jazz and world music artists, along with movies, series, live performances and reality programming. |
| | • | | BET continues to expand its slate of original programming and launched 11 new original series in 2009, includingThe Mo’Nique Show andMonica Still Standing. Programming highlights included theBET Awards ’09, which was dedicated to Michael Jackson and drew 10.6 million viewers according to Nielsen,Tiny & Toya, BET’s all-time top-rated series,College Hill: Season 6,Sunday Best: Season 2and CENTRIC’s 2009 Soul Train Awards, which drew 4 million viewers. |
| | • | | BET reached approximately 90 million domestic television households as of December 31, 2009. According to internal data, CENTRIC, BET Gospel and BET Hip Hop reached approximately 35 million, 5 million and 250,000 domestic television households, respectively. |
| |

| | BET International |
| | • | | BET International licenses BET content on multiple platforms, including 24-hour BET branded networks, BET branded program blocks, and BET branded broadband and mobile offerings. BET International has a BET channel in the United Kingdom, makes BET programming available on multiple platforms in 32 countries in sub-Saharan Africa, and is focused on further expanding the distribution of BET original programming into international markets. |
| | • | | Worldwide, BET can be seen in approximately 104 million households as of December 31, 2009 via its BET branded channels, and additional households through branded programming blocks on third party broadcasters. |
| | |

| | | | BET.com |
| | • | | BET.com is a leading online destination for African-American audiences and offers users content and interactive features for news, entertainment, community and other areas tailored to the unique interests and issues of African-Americans. BET.com also provides interactive entertainment content for BET Networks’ program services. |
| | • | | In the fourth quarter of 2009, BET.com averaged approximately 2.9 million monthly unique visitors. |
Other BET Networks properties include its broadband website, BET on Blast, which features music videos, news, interviews, third party licensed content and other content from BET’s cable networks; and BET Mobile, which delivers music, gaming and video content to its target audiences on mobile devices and digital services across all major service providers.
10
Media Networks Competition
MTV Networks and BET Networks compete for advertising revenue with other cable and broadcast television networks, online and mobile outlets, radio programming and print media. MTV Networks generally competes with other widely distributed cable networks, the broadcast television networks and certain content-distributing digital properties. Each programming service also competes for audience share with competitors’ programming services that target the same audience. For example, Nickelodeon and its related properties compete with other entertainment companies for younger viewers and BET Networks competes with African-American oriented shows on cable and broadcast networks. We also compete with other cable networks for affiliate fees. Our networks compete with other content creators for directors, actors, writers, producers and other creative talent and for new show ideas and the acquisition of popular programming. MTV Networks also releases several video game titles on both console and PC platforms that compete with titles released by major video game publishers. Competition from these sources, other entertainment offerings and/or audience leisure time may affect our revenues.
FILMED ENTERTAINMENT
TheFilmed Entertainment segment produces, finances and distributes motion pictures under the Paramount Pictures, Paramount Vantage, Paramount Classics, MTV Films and Nickelodeon Movies brands. In addition, theFilmed Entertainment segment continues to release certain pictures under the DreamWorks brand. Paramount acquires films for distribution and has distribution and fulfillment services agreements with DreamWorks Animation SKG, Inc. and a distribution agreement with Marvel. In general, motion pictures produced, acquired and/or distributed by theFilmed Entertainment segment are exhibited theatrically in the U.S. and internationally, followed by their release in various windows on DVD and Blu-ray, video-on-demand, pay and basic cable television, broadcast television and syndicated television (the “distribution windows”), digital media outlets, and, in some cases, by other exhibitors such as airlines and hotels.
Filmed Entertainment Revenues
OurFilmed Entertainment segment generates revenues worldwide principally from: (i) the theatrical release and/or distribution of motion pictures, (ii) home entertainment, which includes sales of DVD, Blu-ray and other products relating to the motion pictures we release theatrically and direct-to-DVD, as well as certain other programming, including content we distribute on behalf of third parties and (iii) license fees paid worldwide by third parties for exhibition rights on pay and basic cable television, broadcast television, syndicated television and digital media outlets. TheFilmed Entertainment segment also generates ancillary revenues from providing production services to third parties, primarily at Paramount’s studio lot, consumer products licensing, game distribution and distribution of its content on digital platforms. In 2009, theatrical revenues, home entertainment revenues, license fees and ancillary revenues were approximately 24%, 46%, 25% and 5%, respectively, of total revenues for theFilmed Entertainment segment.
In choosing films to produce, we aim to create a carefully balanced film slate that represents a variety of genres, styles and levels of investment and risk—with the goal of creating entertainment for both niche audiences and worldwide appeal. TheFilmed Entertainment segment releases approximately 14 to 16 films per year domestically, including two to four films produced by DreamWorks Animation and Marvel. Paramount is focused on continuing to improve the profitability of its film slate by focusing on key tentpole films mixed with smaller productions or acquisitions. Paramount is also capitalizing on synergies fromMedia Networks branded films, potential film acquisition, production and re-make opportunities internationally, and continued diversification of revenue streams.
Each motion picture is a separate and distinct product with its profitability dependent upon many factors, among which audience response and cost are of fundamental importance. The theatrical success of a motion picture is a significant factor in determining the revenues it is likely to generate in home entertainment sales and licensing fees during the various other distribution windows. Revenues from motion picture theatrical releases tend to be cyclical with increases during the summer months, around holidays and in the fourth quarter of the calendar year.
11
The costs associated with producing, marketing and distributing a motion picture can be significant, and can also cause our results to vary depending on the timing of a motion picture’s release. For example, marketing costs are generally incurred before and throughout the theatrical release of a film and, to a lesser extent, other distribution windows, and are expensed as incurred. Therefore, we typically incur losses with respect to a particular film prior to and during the film’s theatrical exhibition, and profitability may not be realized until well after a film’s theatrical release. Therefore, the results of theFilmed Entertainment segment can be volatile as films work their way through the various distribution windows. Historically, we have entered into film financing arrangements under which third parties participate in the financing of the production costs of a film or slate of films typically in exchange for a partial copyright interest and may consider such arrangements in the future. We also have agreements with third parties, including other studios, to co-finance certain of our motion pictures. For some motion pictures, we distribute worldwide, and for others, a third party may distribute a picture in certain territories.
Paramount’s home entertainment group is responsible for the worldwide sales, marketing and distribution of DVDs and Blu-ray discs for films distributed by Paramount and other Viacom brands, as well as content we distribute on behalf of third parties. Paramount’s made-for-home entertainment production group, Paramount Famous Productions, develops and produces feature length prequels, sequels and remakes principally based on the Paramount library. Our home entertainment revenues may be affected by consumer tastes and consumption habits, as well as overall economic conditions.
Films produced, owned or distributed by Paramount or DW Studios are licensed for a fee to video-on-demand, pay and basic cable television, broadcast television and syndication worldwide. Paramount also licenses its brands for consumer products, themed restaurants, live stage plays, film clip licensing and theme parks. Revenues are typically derived from royalties based on the licensee’s revenues, with an advance and/or guarantee against future expected royalties, and may vary based on the popularity of the brand or licensed product with consumers.
Paramount also distributes films and other content to consumers through digital platforms. This includes offering certain motion picture titles for sale and rent through third party online destinations, as well as offering motion picture images, ring tones and games for sale through Paramount’s direct mobile movie site, m.paramount.com. Paramount also has a presence in the games business.
In October 2009, we and our joint venture partners Metro-Goldwyn-Mayer Studios Inc. (“MGM Studios”) and Lionsgate launched EPIX™, a multiplatform premium entertainment service offering Paramount, Lionsgate, MGM Studios and certain third party films through a premium pay television channel, video-on-demand service and Internet site. EPIX delivers films from Paramount, Paramount Vantage, MTV Films and Nickelodeon Movies released theatrically on or after January 1, 2008, and MGM Studios, United Artists and Lionsgate titles released theatrically on or after January 1, 2009, which will be available to EPIX subscribers. EPIX also provides access to motion pictures from the libraries of the partner studios.
12
Motion Picture Production and Distribution
| | | | |


| | • | | Theatrical Releases. In 2009, theFilmed Entertainment segment theatrically released in domestic and/or international marketsTransformers: Revenge of the Fallen, Star Trek, G.I. Joe: The Rise of Cobra, Paranormal Activity, Hotel for Dogs andUp In the Air, among others, receiving 12 Academy Award® nominations. Paramount also distributed DreamWorks Animation’sMonsters vs. Aliens. Transformers: Revenge of the Fallen delivered the highest 2009 domestic box office results. Paramount’s 2010 slate is expected to include Marvel’sIron Man 2, Shutter Island, The Last Airbender, Morning Glory and DreamWorks Animation’sShrek Forever After andHow to Train Your Dragon, among others. |
| | • | | Film Library. Paramount has an extensive library consisting of approximately 1,100 motion picture titles produced by Paramount and acquired rights to approximately 2,200 additional motion pictures and a small number of television programs. The library includes many Academy Award winners such asTitanic, Braveheart, Forrest Gump, An Inconvenient Truth, There Will Be Blood and such classics asThe Ten Commandments, Breakfast at Tiffany’s andSunset Boulevard, as well as successful franchises such asIndiana Jones, Transformers,Star Trek,Mission: Impossible andThe Godfather. |
| | • | | Home Entertainment Releases. Key home entertainment releases in 2009 includedTransformers: Revenge of the Fallen,Star Trek, G.I. Joe: The Rise of Cobra, Paranormal Activity,The Curious Case of Benjamin Buttonand DreamWorks Animation’sMonsters vs. Aliens.Paramount also distributes home entertainment products for Nickelodeon, MTV, Comedy Central, BET, CBS Corporation and select PBS programs. |
| | • | | Television Licensing.Paramount licenses the films it releases to video-on-demand, pay and basic cable television, broadcast television and syndication worldwide. 2009 licenses includedIndiana Jones and the Kingdom of the Crystal Skull, Marvel’s Iron Man, Tropic Thunder, Eagle Eye, Cloverfieldand DreamWorks Animation’s Kung Fu Panda, among others. |
| | • | | Digital Distribution. Paramount’s digital entertainment group develops and distributes filmed entertainment across worldwide digital distribution platforms. Key digital releases in 2009 includedCircle of Eight, an original 10-part supernatural thriller premiering exclusively on MySpace, as well asStar Trekavailable in high definition on iTunes, Xbox Live and other digital sites. |
Domestic and International Distribution
In domestic markets, Paramount performs its own marketing and distribution services for theatrical and home entertainment releases. In the domestic pay television distribution window, Paramount’s feature films initially theatrically released in the United States on or after January 1, 2008 are exhibited on EPIX. Certain DreamWorks (including DW Studios) and DreamWorks Animation films are subject to a similar output arrangement under an agreement between DW Studios and Home Box Office (HBO). Paramount also distributes films domestically in the other distribution windows and on various digital platforms.
In international markets, Paramount, through its international affiliates, generally distributes its motion pictures for theatrical release through its own distribution operations or, in some countries, through United International Pictures (“UIP”), a company that we and an affiliate of Universal Studios, Inc. (“Universal”) own jointly. In
13
2009, Paramount set up self-distribution operations in Germany and a representative office to oversee activities in China. In five territories, Paramount continues to distribute through Universal, and in two additional territories, Paramount handles distribution of Universal’s motion pictures, under distribution arrangements that were re-negotiated in 2009. These self-distribution activities represent a significant expansion of Paramount’s international presence.
Key Agreements
In connection with the acquisition of DreamWorks in January 2006, Paramount, DreamWorks and certain of their international affiliates entered into a seven-year agreement with DreamWorks Animation for certain exclusive distribution rights to, and home video fulfillment services for, the animated films produced by DreamWorks Animation, for which Paramount receives certain fees. The output term of the agreement expires on the later of the delivery of 13 qualified animated motion pictures and December 31, 2012, subject to earlier termination under certain limited circumstances.
In September 2008, Paramount and Marvel extended their distribution relationship under a contract pursuant to which Paramount will distribute Marvel’s next four to six self-produced qualified feature films on a worldwide basis, including theatrical distribution in most foreign territories previously serviced by Marvel through local distribution entities, in exchange for distribution fees. The first picture under the new distribution contract will beIron Man 2. In 2009, Marvel was acquired by The Walt Disney Company.
In connection with the acquisition of DreamWorks, we acquired the DreamWorks live-action film library consisting of 59 films released through September 16, 2005. In May 2006, we sold a controlling interest in DW Funding, the owner of the DreamWorks live-action film library, which we reacquired in February 2010. We now own 100% of the live-action film library. Paramount and its international affiliates had the exclusive distribution rights to the live-action film library and received distribution fees during the time we did not own the library.
In October 2008, Viacom, Paramount, DW Studios and the DreamWorks principals Steven Spielberg, David Geffen and Stacey Snider reached an agreement for the departure of those individuals from DW Studios. Pursuant to the agreement, the DreamWorks principals’ new company acquired certain projects in development, which Paramount has the option to co-finance and co-distribute. Our subsidiary, DW Studios, retained all other projects and retains the rights to motion pictures released prior to the departure of the DreamWorks principals, other than the live-action film library owned by DW Funding. Mr. Spielberg continues to produce theTransformers franchise for Paramount, as well as collaborate on certain other DW Studios and Paramount films.
In October 2009, Paramount and Technicolor extended their existing multi-territory DVD replication and distribution services agreements, under which Technicolor will continue to provide authoring and compression, replication and distribution services to Paramount for both DVD and Blu-ray on a multi-year basis, which we expect will result in significant cost efficiencies.
Filmed Entertainment Competition
OurFilmed Entertainment segment competes for audiences for its motion pictures and other entertainment content with the other major motion picture studios as well as independent film producers. Competitive position primarily depends on the number and quality of the films produced, their distribution and marketing success, and public response. We also compete for creative talent, including actors, directors and writers, and scripts for motion pictures, all of which are essential to our success. Our motion picture brands also compete with these studios and other producers of entertainment content for distribution of motion pictures through the various distribution windows and on digital platforms. Competition from other motion pictures released around the same time and/or for audience leisure time generally may affect revenues.
SOCIAL RESPONSIBILITY
Viacom is committed to acting responsibly and proactively in the global community. Our social responsibility commitment leverages the power of our brands and the strength of our audience relationships to encourage action
14
on a variety of pro-social issues that are important to our employees, audiences, partners and shareholders alike. Our social responsibility efforts are spearheaded by our Corporate Responsibility Council, which seeks to provide company-wide guidance and support to the variety of pro-social causes led by our employees and individual program services, and we support and participate in a number of global pro-social initiatives that raise awareness and provide resources in a variety of areas including education, the environment, health, family and politics.
Our businesses allow us to reach a wide range of demographics in various parts of the world, and we strive to fuel social change through our foundations and individual campaigns, such as:
| | • | | Get Schooled, our groundbreaking partnership with the Bill & Melinda Gates Foundation aimed at generating greater awareness and engagement in solving the nation’s education crisis and offering resources and support to students, includingGet Schooled: You Have the Right, a documentary which aired on September 8, 2009 simultaneously across all Viacom networks in a first-ever “roadblock,” featuring the education stories of three professionals who work with President Barack Obama, LeBron James and Kelly Clarkson, and www.getschooled.com; |
| | • | | BET’s Emmy Award-winning Rap-It-Up: raising AIDS/HIV awareness; |
| | • | | Comedy Central’s Address the Mess: raising awareness surrounding environmental issues; |
| | • | | MTV’s A THIN LINE: addressing the emerging and pervasive issue of youth digital abuse; |
| | • | | Nickelodeon’s Let’s Just Play: designed to empower kids to engage in active, healthy and fun play; |
| | • | | VH1’s Save the Music Foundation: restoring instrumental music education in America’s public schools; |
| | • | | Paramount’s Kindergarten to Cap & Gown: employees mentoring students through their entire elementary, middle and high school careers; |
| | • | | Paramount’s Green: encouraging eco-friendly behavior and business practices in the workplace; |
| | • | | Viacom’s annual Viacommunity Day: employees company-wide engage in a day of public service activities. |
We also believe it is important to promote socially responsible business practices both within Viacom and by our business partners. Our Global Business Practices Statement and Supplier Compliance Policy are posted in the “Corporate Governance” section of our website www.viacom.com. We also require that certain partners, such as licensees in our consumer products business, agree to a Code of Conduct as a condition to our doing business with them.
More information about our social responsibility initiatives is available at www.viacom.com, under “Corporate Responsibility.”
REGULATION
Our businesses are subject to and affected by regulations of U.S. federal, state and local governmental authorities, and our international operations are subject to laws and regulations of local countries and pan-national bodies such as the European Union. The laws, rules, regulations, policies and procedures affecting these businesses are constantly subject to change. The descriptions which follow are summaries and should be read in conjunction with the texts of the relevant statutes, rules and regulations. The descriptions do not describe all present and proposed statutes, rules and regulations affecting our businesses.
15
Intellectual Property
We are fundamentally a content company, and the protection of our brands and entertainment content, and the laws affecting our intellectual property, are of paramount importance to us. See the section entitled “Intellectual Property” below for more information on our brands.
Copyright Law and Content
In the United States, under current law, the copyright term for authored works is the life of the author plus 70 years. For works-made-for-hire, the copyright term is the shorter of 95 years from first publication or 120 years from creation.
Copyright Theft
The unauthorized reproduction, distribution or display of copyrighted material over the Internet or through other methods of distribution, such as devices, software or websites that allow or encourage the reproduction, viewing, sharing and/or downloading of entertainment content, interferes with the market for copyrighted works and disrupts our ability to create, distribute and monetize our content. In addition, copyright theft of motion pictures through unauthorized distribution on DVDs, Internet downloads and streaming and other platforms continues to present significant challenges for our industry.
The extent of copyright protection and the use of technological protections, such as encryption, vary in different countries and can be controversial. We are actively engaged in enforcement and other activities to protect our intellectual property, including monitoring notable online destinations that distribute our content and sending takedown notices in appropriate circumstances, using filtering technologies employed by some user-generated content sites, and pursuing litigation against websites and Internet service providers (“ISPs”). We also are actively engaged in educational outreach to guilds, state attorneys general, and other stake holders in an effort to marshal greater resources to combat copyright theft. Additionally, we participate in various industry-wide enforcement initiatives, education and public relations programs and legislative activity on a worldwide basis. One promising area of enforcement activity is to work with network operators, such as ISPs and user-generated content sites, to take action against users who distribute our content without authorization, and we are engaged in discussions with ISPs domestically and abroad. In addition, certain countries have adopted or are considering “graduated response” programs, under which ISPs will impose sanctions (such as termination or suspension of service) on subscribers after a series of escalating notices. For example, France, South Korea and Taiwan have established (although not yet implemented) Internet enforcement regimes that include limitation or termination of a subscriber’s service for repeated acts of copyright theft, and similar legislation is under consideration in Japan, New Zealand and the U.K. Spain is considering legislation which would enable copyright holders to initiate a process which could result in the blocking of access to websites engaging in online copyright theft.
In October 2008, the Prioritizing Resources and Organization for Intellectual Property Act of 2007 (the “PRO-IP Act”) was signed into law in the United States. The PRO-IP Act increases both civil and criminal penalties for counterfeiting and piracy of intellectual property associated with works of music and film, among other things; provides enhanced resources to law enforcement agencies for enforcing intellectual property rights; criminalizes the exportation of counterfeited goods; and creates an “Intellectual Property Enforcement Representative,” a cabinet-level position appointed by the Senate responsible for issuing enforcement policy to, and coordinating the efforts of, U.S. departments and agencies and coordinating the preparation of a plan to reduce counterfeit and infringing goods in the domestic and international supply chain. We strongly support this law and believe it will aid our efforts to appropriately protect our content.
Currently, while many legal protections exist to combat piracy, laws and enforcement activity domestically and internationally are insufficient, and it is likely that we will continue to expend substantial resources to appropriately protect our content. Failure to strengthen these laws and enhance enforcement efforts could make it more difficult for us to adequately protect our intellectual property, which could negatively impact its value and further increase the costs of enforcing our rights.
16
Media Networks
Music Royalties
MTV Networks and BET Networks currently obtain content for their cable networks, websites, video games and other properties from record labels, music publishers, independent producers and artists. We have entered into global music video licensing agreements with certain of the major record companies and music publishers and into global or regional license agreements with certain independent record companies. MTV Networks and BET Networks also obtain certain rights to some of their content, such as performance rights of song composers and rights to non-interactive digital transmission of recordings, pursuant to licenses from performing rights organizations such as ASCAP and BMI and through statutory compulsory licenses established by the Digital Millennium Copyright Act, as amended. The performing rights royalties payable to ASCAP and BMI are either negotiated or set by statutory Rate Courts. Royalties for the compulsory licenses are established periodically by the Copyright Royalty Board.
Net Neutrality
In October 2009, the Federal Communications Commission (the “FCC”) proposed “net neutrality” regulations which could directly impact the right and ability of ISPs to combat intellectual property theft online, and also impact the online delivery of video content. Through various trade associations, we are working with the FCC to ensure that ISPs are permitted to combat intellectual property theft and deliver content in a consumer-friendly manner.
Children’s Programming
Federal legislation and FCC rules limit the amount and content of commercial matter that may be shown on cable channels during programming designed for children 12 years of age and younger, and some U.S. policymakers have sought limitations on food and beverage advertising during such programming. In December 2009, the Federal Trade Commission (the “FTC”), the Center for Disease Control, the Food and Drug Administration and the Department of Agriculture jointly announced nutritional guidelines for food and beverage marketing directed to children and teens ages 17 years and under. Although the guidelines are expected to be voluntary, they could have a negative impact on our Media Networks advertising revenues, particularly for our networks with programming targeted to children and teens. Similar restrictions already exist in the U.K. where the Office of Communications (“OFCOM”) has restricted television ads for foods and drinks high in fat, salt and sugar in and around programming for children and teens 15 years and under. Various other laws and regulations intended to protect the interests of children are applicable to our businesses, including measures designed to protect the privacy of minors online.
Program Access
Under the Communications Act of 1934, vertically integrated cable programmers are generally prohibited from offering different prices, terms or conditions to competing multichannel video programming distributors unless the differential is justified by certain permissible factors set forth in the FCC’s regulations. The FCC’s “program access” rules also limit the ability of a vertically integrated cable programmer to enter into exclusive distribution arrangements with cable television operators. A cable programmer is considered to be vertically integrated if it owns or is owned by a cable television operator in whole or in part under the FCC’s program access attribution rules. Cable television operators for this purpose may include telephone companies that provide video programming directly to subscribers. Our wholly owned program services are not currently subject to the program access rules. Our flexibility to negotiate the most favorable terms available for our content and our ability to offer cable television operators exclusive programming could be adversely affected if we were to become subject to the program access rules.
Filmed Entertainment
Pay-TV Rights
In June 2009, the U.K.’s OFCOM published the third in a series of reports relating to its ongoing investigation regarding the motion picture pay television market. According to the report, OFCOM is considering
17
implementing a new requirement that movie studios sell subscription video-on-demand rights to their films separately from standard pay-TV rights. We believe that any limitation on our ability to sell these rights could have a negative impact on the license fees we derive and would not benefit consumers, and we are strongly opposed to the potential regulatory action.
Marketing to Children
In December 2009, the FTC issued a report calling for stronger industry safeguards on the marketing of violent movies to children, concluding that movie studios intentionally market PG-13 movies to children under 13 and that unrated DVDs undermine the rating system and confuse parents. The FTC has not called for regulation or enforcement against movie studios, but any such government action in this area could have a negative impact on our Filmed Entertainment revenues.
INTELLECTUAL PROPERTY
We create, own and distribute intellectual property worldwide. It is our practice to protect our motion pictures, programs, content, brands, characters, video games, publications and other original and acquired works, and ancillary goods and services. The following brands, logos, trade names, trademarks and related trademark families are among those strongly identified with the product lines they represent and are significant assets of ours: Viacom® , MTV Networks®, MTV: Music Television®, MTV2®, mtvU®, MTV Tr3s®, VH1®, VHI Classic™, CMT®: Country Music Television™, Logo®, MTV Games™, Rock Band®, Harmonix®, Nickelodeon®, Nick at Nite®, Nick Jr.®, TeenNick®, NICKTOONS®, Neopets®, Shockwave®, AddictingGames®, COMEDY CENTRAL®, Spike TV®, TV Land™, MTVN International™, VIVA™, TMF™, BET Networks™, BET®, CENTRIC™, BET.com®, BET Mobile®, Paramount Pictures®, Paramount Vantage™, Paramount Classics™, MTV Films®, Nickelodeon Movies™ and other domestic and international program services and digital properties.
EMPLOYEES AND LABOR MATTERS
At December 31, 2009, we employed approximately 11,200 full-time and part-time employees worldwide. We also had approximately 270 project-based staff on our payroll as of December 31, 2009, and use many other project-based staff and temporary employees in the ordinary course of our business.
We engage the services of writers, directors, actors and other employees who are subject to collective bargaining agreements. In 2008, we reached new three-year agreements with the Writers Guild of America, the American Federation of Television and Radio Employees (AFTRA), the International Alliance of Theatrical and Stage Employees (IATSE) and the Directors Guild of America. In 2009, we reached a new two-year agreement with the Screen Actors Guild. Any labor dispute with these or other organizations could disrupt our operations and reduce our revenues, and we may not be able to negotiate favorable terms for renewals.
FINANCIAL INFORMATION ABOUT SEGMENTS AND FOREIGN AND DOMESTIC OPERATIONS
Financial and other information by reporting segment and revenues by geographic area for the three years ended December 31, 2009 is set forth in Note 18 to our consolidated financial statements.
AVAILABLE INFORMATION
We file annual, quarterly and current reports, proxy and information statements, and other information with the Securities and Exchange Commission (the “SEC”). Our annual reports on Form 10-K, quarterly reports on Form 10-Q, current reports on Form 8-K and any amendments to such reports filed with or furnished to the SEC pursuant to the Securities Exchange Act of 1934, as amended, will be available free of charge on our website at www.viacom.com (under “Investor Relations”) as soon as reasonably practicable after the reports are filed with the SEC. These documents are also available on the SEC’s website at www.sec.gov.
18
CAUTIONARY STATEMENT CONCERNING FORWARD-LOOKING STATEMENTS
This annual report on Form 10-K, including “Item 7. Management’s Discussion and Analysis of Results of Operations and Financial Condition,” contains both historical and forward-looking statements. All statements that are not statements of historical fact are, or may be deemed to be, forward-looking statements within the meaning of Section 27A of the Securities Act of 1933 and Section 21E of the Securities Exchange Act of 1934. These forward-looking statements are not based on historical facts, but rather reflect our current expectations concerning future results and events. Forward-looking statements generally can be identified by the use of statements that include phrases such as “believe,” “expect,” “anticipate,” “intend,” “plan,” “foresee,” “likely,” “will” or other similar words or phrases. Similarly, statements that describe our objectives, plans or goals are or may be forward-looking statements. These forward-looking statements involve known and unknown risks, uncertainties and other factors that are difficult to predict and which may cause our actual results, performance or achievements to be different from any future results, performance and achievements expressed or implied by these statements. These risks, uncertainties and other factors are discussed in “Item 1A. Risk Factors” below. Other risks, or updates to the risks discussed below, may be described from time to time in our news releases and other filings made under the securities laws, including our reports on Form 10-Q and Form 8-K. There may be additional risks, uncertainties and factors that we do not currently view as material or that are not necessarily known. The forward-looking statements included in this document are made only as of the date of this document and, under Section 27A of the Securities Act and Section 21E of the Exchange Act, we do not have any obligation to publicly update any forward-looking statements to reflect subsequent events or circumstances.
Item 1A.Risk Factors.
A wide range of risks may affect our business and financial results, now and in the future. We consider the risks described below to be the most significant. There may be other currently unknown or unpredictable economic, business, competitive, regulatory or other factors that could have material adverse effects on our future results.
Our Success is Dependent upon Audience Acceptance of our Brands, Programming, Motion Pictures, Games and Other Entertainment Content, which is Difficult to Predict
The production and distribution of programming, motion pictures, games and other entertainment content are inherently risky businesses because the revenues we derive from various sources depend primarily on our content’s acceptance by the public, which is difficult to predict. Audience tastes change frequently and it is a challenge to anticipate what offerings will be successful at a certain point in time. In addition, competing entertainment content, the availability of alternative forms of entertainment and leisure time activities, general economic conditions, piracy, and increasing digital and on-demand distribution offerings also affect the audience for our content.
In ourMedia Networks business, our advertising revenues typically are a product of audience size and pricing, which reflect market conditions. Depending on the success of our programming at any given time, our channels can experience ratings fluctuations that negatively affect our advertising revenues. Low audience ratings can also negatively affect the affiliate fees we receive and/or limit a network’s distribution potential. Our expenses may increase moderately as we invest in new programming, and there is no guarantee that the new programming will be successful or generate sufficient revenue to recoup the expenditure. In addition, consumer acceptance of our brands and retail offerings, including theRock Band franchise and consumer products, is key to the success of those businesses and their ability to generate revenues.
In ourFilmed Entertainment business, the theatrical performance of a motion picture affects not only the theatrical revenues we receive but also those from other distribution channels, such as home entertainment sales, television licenses and sales of licensed consumer products.
19
Changes in Advertising Markets Could Cause Our Revenues and Operating Results to Decline Significantly in Any Given Period or in Specific Markets
We derive substantial revenues from the sale of advertising on a variety of platforms, and a decline in advertising expenditures could have a significant adverse affect on our revenues and operating results in any given period. Fluctuations and declines in advertising spending can be caused by the economic prospects of specific advertisers or industries, or the economy in general, and advertisers may adjust their spending priorities based on these or other factors. Changes in the advertising industry, such as the introduction of commercial ratings in 2008, can also affect our advertising revenues.
In addition, the pricing and volume of advertising in the markets where we compete may be affected by shifts in spending toward online and mobile outlets from more traditional media, or toward new ways of purchasing advertising, such as through third parties selling local advertising spots and advertising exchanges. For example, we and other cable network owners may provide advertising inventory on our networks to cable television or satellite operators and other intermediaries that may compete with our direct sales.
Political, social or technological change may also reduce various sectors’ advertising expenditures. For example, Federal legislators and regulators could impose additional limitations on advertising to children in an effort to combat childhood obesity and unhealthy eating or for other reasons, impose limitations on the marketing of certain movies, or regulate product placement and other program sponsorship arrangements. Any reduction in advertising expenditures could have an adverse effect on our revenues and results of operations.
Global Economic Conditions May Continue to Have an Adverse Effect on Our Businesses
Recent economic conditions have adversely affected aspects of our businesses worldwide, in particular revenues derived from advertising sales and sales of video games, home entertainment and other consumer products. Economic conditions can negatively affect the businesses of our partners who purchase advertising on our networks and reduce their spending on advertising. In addition, increased unemployment and slowing consumer spending can reduce sales of our retail products, including theRock Bandfranchise, DVDs and other home entertainment products, and consumer merchandise. We also depend on the financial markets for access to capital on favorable terms, as do many of our business partners, including cable and satellite operators, retailers, theater operators, games publishers and others. Limited or expensive access to capital could make it more difficult for these partners to do business with us, or to do business generally. The worsening of current global economic conditions would adversely affect our businesses and financial condition.
Our Businesses Operate in Highly Competitive Industries
Companies in the cable networks, motion picture, digital and video game industries depend on audience acceptance of content, appeal to advertisers and solid distribution relationships. Competition for content, audiences, advertising and distribution is intense and comes from broadcast television, other cable networks, online and mobile properties, movie studios and independent film producers and distributors, and video games, among other entertainment outlets. Competition also comes from pirated content.
Our competitors include market participants with interests in multiple media businesses which are often vertically integrated, whereas ourMedia Networks businesses generally rely on distribution relationships with third parties. As more cable and satellite operators, Internet service providers and other content distributors create or acquire their own content, they may prioritize distribution of their content over ours, which could adversely affect our ability to negotiate favorable terms. Our competitors could also have preferential access to important technologies, customer data or other competitive information. Our ability to compete successfully depends on a number of factors, including our ability to create or acquire high quality and popular entertainment content, adapt to new technologies and distribution platforms, and achieve widespread distribution. More content distribution options increases competition for viewers, and competitors targeting programming to narrowly defined, or “fragmented”, audiences may gain an advantage over us for television advertising and affiliate revenues. There can be no assurance that we will be able to compete successfully in the future against existing or potential competitors, or that competition will not have a material adverse effect on our business, financial condition or results of operations.
20
Theft of Our Entertainment Content, Including Digital Copyright Theft and Other Unauthorized Exhibitions of Our Content, May Decrease Revenue Received from Our Programming and Motion Pictures and Adversely Affect Our Business and Profitability
The success of our business depends in part on our ability to maintain our intellectual property rights to our entertainment content. We are fundamentally a content company and theft of our brands, motion pictures and home entertainment product, programming, digital content and other intellectual property has the potential to significantly affect us and the value of our content. Copyright theft is particularly prevalent in many parts of the world that lack effective enforcement of copyright and technical protective measures similar to existing law in the United States. Domestically, the interpretation of copyright, privacy and other laws as applied to our content, and our piracy detection and enforcement efforts, remain in flux. The weakening of laws related to the enforcement of intellectual property rights could make it more difficult for us to adequately protect our intellectual property, negatively affecting its value. Copyright theft and other unauthorized uses of content are made easier by the wide availability of higher bandwidth and reduced storage costs, as well as tools that undermine security features such as encryption and the ability of pirates to cloak their identities online. Copyright theft has an adverse effect on our business because it reduces the revenue that we are able to receive from the legitimate sale and distribution of our content, undermines lawful distribution channels and inhibits our ability to recoup or profit from the expense incurred to create such works. We are actively engaged in enforcement and other activities to protect our intellectual property, and it is likely that we will continue to expend substantial resources in connection with these efforts. These efforts to prevent the unauthorized use of our content may affect our profitability, and may not be successful in adequately limiting unauthorized distribution of our creative works.
We Must Respond to and Capitalize on Rapid Changes in Consumer Behavior Resulting from New Technologies and Distribution Platforms in Order to Remain Competitive and Exploit New Opportunities
Consumers are spending an increasing amount of time on the Internet and mobile devices, and technology in these areas continues to evolve rapidly. We must adapt our businesses to changing consumer behavior driven by new or enhanced offerings such as the direct connection of television to the Internet or gaming consoles, the increased availability of content online, including potential online distribution by our traditional cable and satellite operator partners, and Blu-ray, video-on-demand and other enhanced home entertainment offerings. There is also increased mobility of content and greater demand for short form, user-generated and interactive content.
Technological advancements and changing consumer behavior may impact our traditional distribution methods, for example, by reducing viewership of our cable networks, the demand for DVD product or pay television subscriptions and/or the desire to see motion pictures in theaters. The DVD market continued to be soft in 2009. Particularly in light of developments in the home entertainment arena, it is possible that the DVD market may not recover to historical levels of sales or profitability. To offset this possibility, it is important that we find new and enhanced ways to market and deliver our films securely in the home entertainment marketplace and there can be no assurance that we will be able to do so or achieve historical revenue or margin levels.
In addition, consumers are increasingly viewing content on a time-delayed or on-demand basis from the Internet, on their televisions and on handheld or portable devices. Technological advances can increase fragmentation, creating additional competition for our content. We must continue to adapt our content to these viewership habits. Technologies which enable users to fast-forward or skip advertisements may affect the attractiveness of our offerings to advertisers and could therefore adversely affect our revenues. If we cannot adapt to the changing lifestyles and preferences of our target audiences and capitalize on technological advances with favorable business models, there could be a negative effect on our business and prospects.
21
Increased Costs for Programming, Motion Pictures and Other Content, as Well as Judgments We Make on the Potential Performance of our Content, May Adversely Affect Our Profits and Balance Sheet
In ourMedia Networks segment, we have historically produced a significant amount of original programming and intend to continue to invest in this area. We also acquire programming, such as motion pictures and television series, from other studios and television production companies and pay a license fee in connection with the acquired rights. Our investments in original and acquired programming are significant, and involve complex negotiations with numerous third parties. These costs may not be recouped when the program is broadcast or distributed and may lead to decreased profitability or potential write-downs.
TheFilmed Entertainment segment’s core business involves the production, marketing and distribution of motion pictures, the costs of which have generally been increasing. A film’s underperformance theatrically can significantly affect our revenues and profitability, and negatively affect the revenues we receive from other distribution platforms.
The accounting for the expenses we incur in connection with our programming and motion pictures requires that we make judgments about the potential success and useful life of the program or motion picture. If our estimates prove to be incorrect, we may be forced to accelerate our recognition of the expense and/or write down the value of the asset. For example, we estimate the ultimate revenues of a motion picture before it is released based on a number of factors. Upon a film’s initial domestic theatrical release and performance, we update our estimate of ultimate revenues based on actual results. If it is not received favorably, we may reduce our estimate of ultimate revenues, thereby accelerating the amortization of capitalized film costs. Similarly, if we determine it is no longer advantageous for us to air a program on our networks, we would accelerate our amortization of the program.
An increase in content acquisition costs could also affect our profits. For example, we license various music rights from the major record companies and music publishers, performing rights societies and others. Some of these sources of music are highly consolidated. Music costs are particularly important to our video game and Internet music businesses. There can be no assurance that we will be able to obtain or negotiate favorable terms for license renewals or additional license agreements from these sources.
Our Revenues, Expenses and Operating Results May Vary Based on the Timing, Mix, Number and Availability of Our Motion Pictures and on Seasonal Factors
Our revenues and operating results fluctuate due to the timing, mix, number and availability of our theatrical motion picture and home entertainment releases, as well as license periods for our content. For example, our operating results may increase or decrease during a particular period due to differences in the number and/or mix of films released compared to the corresponding period in the prior year. Our operating results also fluctuate due to the timing of the recognition of production and marketing expenses, which are typically largely incurred prior to the release of motion pictures and home entertainment product, with the recognition of related revenues in later periods.
Our business also has experienced and is expected to continue to experience some seasonality due to, among other things, seasonal advertising patterns and seasonal influences on audiences’ viewing habits and attendance. Typically, our revenue from advertising increases in the fourth calendar quarter due to the holiday season, among other factors, and revenue from motion pictures increases in the summer, around holidays and in the fourth calendar quarter. The effects of these variances make it difficult to estimate future operating results based on the results of any specific quarter.
22
Changes in U.S. or Foreign Communications Laws, Laws Affecting Intellectual Property Rights or Other Regulations May Have an Adverse Effect on Our Business
The multichannel video programming and distribution industries in the United States are highly regulated by U.S. federal laws and regulations issued and administered by various federal agencies, including the FCC. Our program services and online properties are subject to a variety of laws and regulations, including those relating to issues such as content regulation, user privacy and data protection, and consumer protection, among others. For example, various laws and regulations are intended to protect the interests of children, including limits on the amount and content of commercial material that may be shown, restrictions on children’s advertising and measures designed to protect the privacy of minors. Practices for the marketing of certain films to children are also being reviewed.
In addition, the U.S. Congress and the FCC currently have under consideration, and may in the future adopt, new laws, regulations and policies regarding a wide variety of matters that could directly or indirectly affect the operations or ownership of our U.S. media properties. For example, some policymakers support the extension of indecency rules applicable to over-the-air broadcasters to cover cable and satellite programming. Other domestic and international governments and regulators may support additional limitations on food and beverage advertising to children including OFCOM in the United Kingdom, which has restricted certain television advertisements. In addition, certain international restrictions on alcohol advertising and the amount of advertising permitted on commercial networks are under consideration. Our business could be affected, perhaps materially, by any such new laws, regulations and policies in the jurisdictions where we, or our partners, operate. We could incur substantial costs to comply with new laws and regulations or substantial penalties or other liabilities if we fail to comply. We could also be required to change or limit certain of our business practices.
Our Video Game Business Has a Short Operating History and is Subject to Additional Risks
In connection with our 2006 acquisition of Harmonix, we significantly expanded our involvement in video and online games, includingRock Band. The video game industry experienced continuing softness in 2009, which we saw reflected in our sales of these games. Competition from other video games, including music based video games, also affects sales levels. Our games are distributed on several platforms, and for each platform, there are a variety of controllers and packages available. Greater than anticipated returns, increases in manufacturing or distribution costs, and/or mismatches between forecasted and actual sales will have an adverse effect on the profitability of this business and affect our results of operations. Further, the video game business is generally subject to the risk of intellectual property litigation, in particular patent litigation, and there are three patent cases pending against us related to console video games. Although we believe we will prevail in these litigations, litigation is expensive and the outcome of litigation is inherently uncertain. The failure to resolve litigation on satisfactory terms could result in higher costs or the inability to sell one or more products.
Changes to our Business Could Result in Future Costs or Charges
We adjust our business strategy in response to particular events and circumstances, including the business environment, competitive factors and economic conditions. In connection with the implementation of new strategies, we may decide to restructure certain of our operations, businesses or assets. In addition, external events, such as reduced revenues resulting from changes in macro-economic conditions, conditions in our markets or increases in costs, could negatively affect the value of our assets. Such events could result in additional restructuring and other charges, including the impairment of certain assets, and/or the incurrence of additional costs.
23
The Loss of Affiliation Agreements, or Renewal on Less Favorable Terms, Could Cause Our Revenues to Decline in Any Given Period or in Specific Markets
We are dependent upon our affiliation agreements with cable television operators, satellite operators, mobile networks and other distributors for the distribution of our program services. We have agreements in place with the major distributors, all of which are multi-year agreements at inception but expire on a staggered basis over the next several years. There can be no assurance that these affiliation agreements will be renewed in the future on terms, including pricing, acceptable to us. The loss of a significant number of these arrangements or the loss of carriage on the most widely available programming tiers could reduce the distribution of our program services and decrease the potential audience for our programs, which would adversely affect our advertising and affiliate fee revenues.
Furthermore, we recently launched EPIX, our premium pay television and video-on-demand service joint venture, to release our motion pictures in the pay television distribution window. If EPIX is not successful in securing additional affiliate relationships and expanding its subscriber base, it may not be able to continue to pay us for our motion pictures at agreed rates. Our revenues from this distribution window would thus be negatively affected, and we may not be able to secure pay television distribution for our motion pictures on favorable terms with another distributor.
The Loss of Key Talent Could Disrupt Our Business and Adversely Affect Our Revenues
Our business depends upon the continued efforts, abilities and expertise of our corporate and divisional executive teams and entertainment personalities. We employ or contract with several entertainment personalities with loyal audiences and also produce motion pictures with highly regarded directors, actors and other talent. These individuals are important to achieving audience endorsement of our programs, motion pictures and other content. There can be no assurance that these individuals will remain with us or will retain their current appeal, or that the costs associated with returning talent will be reasonable. If we fail to retain these individuals on current terms or if our entertainment personalities lose their current appeal, our revenues and profitability could be adversely affected.
We Could Be Adversely Affected by Strikes and Other Union Activity
We and our suppliers engage the services of writers, directors, actors and other talent, trade employees and others who are subject to collective bargaining agreements. Any labor disputes may disrupt our operations and reduce our revenues, and we may not be able to negotiate favorable terms for a renewal, which could increase our costs.
Political and Economic Risks in the Countries Where We Do Business Could Harm Our Financial Condition
Our businesses operate and have customers worldwide, and we are focused on expanding our international operations in key markets, some of which are emerging markets. Inherent risks of doing business in international markets include, among other risks, changes in the economic environment, export restrictions, currency exchange controls and/or fluctuations, tariffs or other trade barriers, longer payment cycles and, in some markets, increased risk of political instability. In particular, foreign currency fluctuations against the U.S. Dollar affect our results both positively and negatively which may cause results to fluctuate. Furthermore, some foreign markets where we operate may be even more adversely affected by recent economic conditions than the United States. We also may incur substantial expense as a result of changes in the existing economic or political environment in the regions where we do business, including the imposition of new restrictions. Acts of terrorism or other hostilities, or other future financial, political, economic or other uncertainties, could lead to a reduction in revenue or loss of investment, which could adversely affect our business, financial condition or results of operations.
24
The Failure or Destruction of Satellites and Facilities that We Depend Upon to Distribute Our Programming Could Adversely Affect Our Business and Results of Operations
We use satellite systems to transmit our program services to cable television operators and other distributors worldwide. The distribution facilities include uplinks, communications satellites and downlinks. Notwithstanding back-up and redundant systems, transmissions may be disrupted as a result of local disasters that impair on-ground uplinks or downlinks, or as a result of an impairment of a satellite. Currently, there are a limited number of communications satellites available for the transmission of programming. If a disruption occurs, we may not be able to secure alternate distribution facilities in a timely manner. Failure to do so could have a material adverse effect on our business and results of operations.
Our Obligations Related to Guarantees, Litigation and Joint Ventures Could Adversely Impact Our Financial Condition
We have both recorded and potential liabilities and costs related to discontinued operations and former businesses, including, among other things, potential liabilities to landlords if Famous Players Inc. defaults on certain theater leases. We have also made certain investments in joint ventures and have future funding obligations, which may not be recouped until well after our initial investment, if at all. For example, as a joint venture partner in EPIX, developments in the businesses of our joint venture partners may require us to invest additional capital in EPIX above that which we originally anticipated. We are also involved in pending and threatened litigation from time to time, the outcome of which is inherently uncertain and difficult to predict. We cannot assure you that our reserves are sufficient to cover these liabilities in their entirety or any one of these liabilities when it becomes due or at what point any of these or new liabilities may affect us. Therefore, there can be no assurance that these liabilities will not have an adverse effect on our financial condition.
Sales of Additional Shares of Common Stock by National Amusements Could Adversely Affect the Stock Price
National Amusements, Inc. (“NAI”), which is controlled by our Executive Chairman and Founder, Sumner Redstone, has voting control of Viacom through its beneficial ownership of our Class A common stock. In October 2009, NAI and its wholly-owned subsidiary NAIRI, Inc. converted a portion of their Class A voting common stock into Class B non-voting common stock and sold approximately $603 million of Class B common stock in connection with meeting certain requirements under its restructured indebtedness. In 2008, NAI sold approximately $114 million of Class B common stock. Although NAI has advised us that it does not currently intend to sell any additional shares, there can be no assurance that at some future time it will not sell additional shares of our stock, which could adversely affect our share price.
Also as part of a restructuring of NAI’s indebtedness, in May 2009, NAI advised us that it had pledged substantially all of its assets, including the shares of our Class A Common Stock that it owns, to secure those obligations. That pledge remains in place. If NAI defaults on its remaining obligations and the creditors foreclose on the collateral, the creditors or anyone to whom the creditors transfer such shares could convert such shares of our Class A common stock into shares of our Class B common stock and sell such shares, which could adversely affect our share price. Additionally, if the creditors foreclose on the pledged shares of our Class A common stock, NAI will no longer own those shares and will therefore no longer have voting control of us.
Through NAI’s Voting Control of Viacom and CBS Corporation, Certain Members of Management, Directors and Stockholders May Face Actual or Potential Conflicts of Interest, and NAI is in a Position to Control Actions that Require Stockholder Approval
Mr. Redstone, the controlling stockholder, Chairman and Chief Executive Officer of NAI, serves as our Executive Chairman and Founder, and Shari Redstone, the President and a director of NAI, serves as the non-executive Vice Chair of our Board of Directors. In addition, Philippe Dauman, our President and Chief
25
Executive Officer, is a director of NAI, and George Abrams, one of our directors, is a director of NAI. NAI also controls CBS Corporation, with Mr. Redstone serving as its Executive Chairman and Ms. Redstone serving as its non-executive Vice Chair. Frederic Salerno, one of our directors, is also a director of CBS Corporation.
Since the fall of 2008, Mr. Dauman has recused himself from activity as an NAI board member with respect to all matters relating to the restructuring of NAI’s indebtedness. In addition, NAI’s board of directors has created a special committee that does not include Mr. Redstone or Mr. Dauman in order to consider issues that may be perceived to create a conflict between their responsibilities to Viacom and to NAI. Similarly, our Board of Directors has acted by independent directors when appropriate to address such issues.
The NAI ownership structure and the common directors could create, or appear to create, potential conflicts of interest when the management, directors and controlling stockholder of the commonly controlled entities face decisions that could have different implications for each of us. For example, potential conflicts of interest could arise in connection with the resolution of any dispute between us and CBS Corporation. Potential conflicts of interest, or the appearance thereof, could also arise when we and CBS Corporation enter into any commercial arrangements with each other, despite review by our directors not affiliated with CBS Corporation. Our certificate of incorporation and the CBS Corporation certificate of incorporation both contain provisions related to corporate opportunities that may be of interest to us and to CBS Corporation. These provisions create the possibility that a corporate opportunity of one company may be used for the benefit of the other company.
In addition, NAI’s voting control of us puts it in a position to control the outcome of corporate actions that require stockholder approval, including the election of directors and transactions involving a change in control. The interests of NAI may not be the same as yours, and you will be unable to affect the outcome of our corporate actions for so long as NAI retains voting control. You will be reliant on our independent directors to represent your interests.
We, NAI and CBS Corporation, and our Respective Businesses, Are Attributable to Each Other for Certain Regulatory Purposes Which May Limit Business Opportunities or Impose Additional Costs
So long as we, NAI and CBS Corporation are under common control, each company’s businesses, as well as the businesses of any other commonly controlled company may be attributable to the other companies for purposes of U.S. and non-U.S. antitrust rules and regulations, certain rules and regulations of the FCC, and certain rules regarding political campaign contributions in the United States, among others. The businesses of each company may continue to be attributable to the other companies for FCC purposes even after the companies cease to be commonly controlled, if the companies share common officers, directors, or attributable stockholders. As a result, the businesses and conduct of any of these other companies may have the effect of limiting the activities or strategic business alternatives available to us, including limitations to which we contractually agreed in connection with the separation, or may impose additional costs.
Item 1B.Unresolved Staff Comments.
Not applicable.
Item 2.Properties.
In addition to the properties described below, we own and lease office, studio, production and warehouse space, broadcast, antenna and satellite transmission facilities throughout the United States and around the world for our businesses. We consider our properties adequate for our present needs.
26
Viacom
| | • | | Our world headquarters is located at 1515 Broadway, New York, New York, where we rent approximately 1.4 million square feet for executive, administrative and business offices for the Company and certain of our operating divisions. The lease runs through May 2015, with three renewal options based on market rates at the time of renewal for five years each thereafter. |
MTV Networks
| | • | | In addition to occupying space at 1515 Broadway in New York, MTVN occupies the following major office facilities: (a) approximately 400,000 square feet at 345 Hudson Street, New York, New York, through 2022, (b) approximately 227,000 square feet at three facilities in Santa Monica, California, under leases that expire between 2011 and 2016, and (c) approximately 223,000 square feet at 1540 Broadway, New York, New York, through 2021. MTVN’s Network Operation Center is located in Hauppauge, New York, and contains approximately 65,000 square feet of floor space on approximately 9 acres of land. |
| | • | | The Nickelodeon Animation Studio in Burbank, California, contains approximately 118,000 square feet of studio and office space, under leases that expire in 2013. |
| | • | | CMT’s headquarters are located in Nashville, Tennessee, where it occupies approximately 86,000 square feet of space for its executive, administrative and business offices and its studios. |
| | • | | Internationally, MTVN occupies (i) approximately 176,000 square feet of space in Berlin through leases expiring between 2014 and 2017, (ii) approximately 80,000 square feet of space at its owned Hawley Crescent facility in London and (iii) approximately 54,000 square feet of office space leased at 180 Oxford Street in London. |
BET Networks
| | • | | BET Networks’ headquarters at One BET Plaza in Washington, D.C. contains approximately 230,000 square feet of office and studio space, the majority of which is leased through 2013 and the balance of which is owned. |
Paramount
| | • | | Paramount owns the Paramount Pictures Studio situated at 5555 Melrose Avenue, Los Angeles, California, located on approximately 62 acres of land, and containing approximately 1,850,000 square feet of floor space used for executive, administrative and business offices, sound stages, production facilities, theatres, equipment facilities, and other ancillary uses. |
| | • | | Paramount Pictures International’s main offices are located in London, where it leases approximately 51,000 square feet of space used for executive, administrative and business offices and a viewing cinema through 2017. |
Item 3.Legal Proceedings.
Litigation is inherently uncertain and always difficult to predict. However, based on our understanding and evaluation of the relevant facts and circumstances, we believe that the legal matters described below and other litigation to which we are a party are not likely, in the aggregate, to have a material adverse effect on our results of operations, financial position or cash flows.
27
In March 2007, we filed a complaint in the United States District Court for the Southern District of New York against Google Inc. (“Google”) and its wholly-owned subsidiary YouTube, alleging that Google and YouTube violated and continue to violate the Company’s copyrights. We are seeking both damages and injunctive relief.
In September 2007, Brantley, et al. v. NBC Universal, Inc., et al., was filed in the United States District Court for the Central District of California against us and several other program content providers on behalf of a purported nationwide class of cable and satellite subscribers. The plaintiffs also sued several major cable and satellite program distributors. Plaintiffs allege that separate contracts between the program providers and the cable and satellite operator defendants providing for the sale of programming in specific tiers each unreasonably restrain trade in a variety of markets in violation of the Sherman Act. In October 2009, the court dismissed, with prejudice, the plaintiff’s third amended complaint. The plaintiffs appealed the dismissal. We believe the plaintiffs’ position in this litigation is without merit and intend to continue to vigorously defend this lawsuit.
Item 4. Submission of Matters to a Vote of Security Holders.
Not applicable.
28
OUR EXECUTIVE OFFICERS
The following table sets forth the name, age and position of each person who serves as a Viacom executive officer.
| | | | |
Name | | Age | | Position |
Sumner M. Redstone | | 86 | | Executive Chairman of the Board and Founder |
James W. Barge | | 54 | | Executive Vice President, Controller, Tax and Treasury |
Philippe P. Dauman | | 55 | | President and Chief Executive Officer; Director |
Thomas E. Dooley | | 53 | | Senior Executive Vice President, Chief Administrative Officer and Chief Financial Officer; Director |
Carl D. Folta | | 52 | | Executive Vice President, Corporate Communications |
Michael D. Fricklas | | 50 | | Executive Vice President, General Counsel and Secretary |
DeDe Lea | | 45 | | Executive Vice President, Government Relations |
Denise White | | 55 | | Executive Vice President, Human Resources and Administration |
Information about each person who serves as an executive officer of our company is set forth below.
Sumner M. Redstone | Mr. Redstone has been our Executive Chairman of the Board of Directors and Founder since January 1, 2006. He also serves as Executive Chairman of the Board of CBS Corporation. He was Chief Executive Officer of Former Viacom from 1996 to 2005 and Chairman of the Board of Former Viacom since 1987. He has been Chairman of the Board of National Amusements, Inc., our controlling stockholder, since 1986, its Chief Executive Officer since 1967 and also served as its President from 1967 through 1999. Mr. Redstone served as the first Chairman of the Board of the National Association of Theatre Owners and is currently a member of its Executive Committee. He has been a frequent lecturer at universities, including Harvard Law School, Boston University Law School and Brandeis University. Mr. Redstone graduated from Harvard University in 1944 and received an LL.B. from Harvard University School of Law in 1947. Upon graduation, he served as law secretary with the U.S. Court of Appeals and then as a special assistant to the U.S. Attorney General. Mr. Redstone served in the Military Intelligence Division during World War II. While a student at Harvard, he was selected to join a special intelligence group whose mission was to break Japan’s high-level military and diplomatic codes. Mr. Redstone received, among other honors, two commendations from the Military Intelligence Division in recognition of his service, contribution and devotion to duty, and the Army Commendation Award. |
James W. Barge | Mr. Barge has been our Executive Vice President, Tax and Treasury since January 2008 and our Controller since March 2008. Prior to joining the Company, Mr. Barge served as Senior Vice President, Controller and principal accounting officer of Time Warner Inc. since mid-2002. He previously held various financial positions with Time Warner Inc. since first joining the company in 1995. Mr. Barge is a member of the board of directors of Scholastic Corporation. |
Philippe P. Dauman | Mr. Dauman has been our President and Chief Executive Officer since September 2006 and a member of our Board of Directors since January 1, 2006, having previously served as a director of Former Viacom since 1987. Prior to joining Viacom, he was Co-Chairman and Chief Executive Officer of DND Capital Partners, L.L.C., a private equity firm specializing in media and telecommunications investments that he co-founded with Mr. Dooley, from May |
29
| | 2000 until September 2006. Prior to that, Mr. Dauman held several positions at Former Viacom, which he first joined in 1993, including, most recently, Deputy Chairman and member of its Executive Committee. Mr. Dauman is also a director of National Amusements, Inc. and Lafarge S.A. |
Thomas E. Dooley | Mr. Dooley has been our Senior Executive Vice President and Chief Administrative Officer since September 2006, our Chief Financial Officer since January 1, 2007 and a member of our Board of Directors since January 1, 2006. Prior to joining Viacom, he was Co-Chairman and Chief Executive Officer of DND Capital Partners, L.L.C., a private equity firm specializing in media and telecommunications investments that he co-founded with Mr. Dauman, from May 2000 until September 2006. Before that, Mr. Dooley held various corporate and divisional positions at Former Viacom, which he first joined in 1980, including, most recently, Deputy Chairman and member of its Executive Committee. Mr. Dooley is also a director of Sapphire Industrials Corp. |
Carl D. Folta | Mr. Folta has been our Executive Vice President, Corporate Communications since November 2006. Prior to that, he had served as Executive Vice President, Office of the Chairman beginning January 1, 2006. He served in senior communications positions with the Company since April 1994 and was appointed Executive Vice President, Corporate Relations, of Former Viacom in November 2004. Mr. Folta held various communications positions at Paramount Communications Inc., a predecessor, from 1984 to 1994. |
Michael D. Fricklas | Mr. Fricklas has been our Executive Vice President, General Counsel and Secretary since January 1, 2006. Prior to that, he was Executive Vice President, General Counsel and Secretary of Former Viacom since May 2000 and Senior Vice President, General Counsel and Secretary from October 1998 to May 2000. He first joined Former Viacom in July 1993, serving as Vice President and Deputy General Counsel and assuming the title of Senior Vice President in July 1994. |
DeDe Lea | Ms. Lea has been our Executive Vice President, Government Relations since January 1, 2006. Previously, she was Executive Vice President, Government Relations of Former Viacom since September 2005. Prior to that, she served as Vice President of Government Affairs at Belo Corp. from 2004 to 2005 and as Vice President, Government Affairs of Former Viacom from 1997 to 2004. |
Denise White | Ms. White has been our Executive Vice President, Human Resources and Administration since October 2007. Previously, she was General Manager at Microsoft’s Entertainment and Devices Division, having first joined Microsoft in 1990. Prior to Microsoft, Ms. White was a human resources leader with Pan American World Airways and owned a human resources consulting firm. |
30
PART II
Item 5.Market for Viacom Inc.’s Common Equity, Related Stockholder Matters and Issuer Purchases of Equity Securities.
Our voting Class A common stock and non-voting Class B common stock are listed and traded on the New York Stock Exchange under the symbols “VIA” and “VIA.B”, respectively. Our common stock began trading on the NYSE on January 3, 2006 at an opening price of $40.00 for our Class A common stock and $41.12 for our Class B common stock.
The table below shows, for the periods indicated, the high and low daily close prices per share of our Class A and Class B common stock as reported in Thomson Financial markets services.
| | | | | | |
| | | Sales Price |
| | | Low | | High |
Class A common stock - 2009 | | | | | | |
4th Quarter | | $ | 28.62 | | $ | 33.14 |
3rd Quarter | | $ | 21.31 | | $ | 30.99 |
2nd Quarter | | $ | 18.36 | | $ | 25.49 |
1st Quarter | | $ | 14.46 | | $ | 22.37 |
| | |
Class A common stock - 2008 | | | | | | |
4th Quarter | | $ | 13.09 | | $ | 25.06 |
3rd Quarter | | $ | 23.66 | | $ | 31.16 |
2nd Quarter | | $ | 30.18 | | $ | 41.14 |
1st Quarter | | $ | 37.18 | | $ | 42.58 |
| | |
Class B common stock - 2009 | | | | | | |
4th Quarter | | $ | 27.04 | | $ | 31.56 |
3rd Quarter | | $ | 19.95 | | $ | 29.56 |
2nd Quarter | | $ | 17.04 | | $ | 24.18 |
1st Quarter | | $ | 13.25 | | $ | 20.80 |
| | |
Class B common stock - 2008 | | | | | | |
4th Quarter | | $ | 11.96 | | $ | 25.01 |
3rd Quarter | | $ | 23.44 | | $ | 31.11 |
2nd Quarter | | $ | 30.02 | | $ | 41.10 |
1st Quarter | | $ | 36.40 | | $ | 42.57 |
We do not currently anticipate paying dividends on our Class A common stock or Class B common stock. The declaration and payment of dividends to holders of our common stock will be at the discretion of our Board of Directors and will depend upon many factors.
As of January 31, 2010, there were 2,067 record holders of our Class A common stock and 31,948 record holders of our Class B common stock.
Performance Graph
The following graph compares the cumulative total stockholder return of our Class A common stock and our Class B common stock with the cumulative total stockholder return of the companies listed in the Standard & Poor’s 500 Index and a peer group of companies comprised of The Walt Disney Company, News Corporation, Time Warner Inc., CBS Corporation, Discovery Communications, Inc. and Scripps Network Interactive Inc.
31
The performance graph assumes $100 invested on January 1, 2006 in each of our Class A common stock, Class B common stock, the S&P 500 Index and the stock of our peer group companies, including reinvestment of dividends, for each semi-annual period through the calendar year ended December 31, 2009.
Total Cumulative Stockholder Return
for the Semi-Annual Periods Ended December 31, 2009, 2008, 2007 and 2006
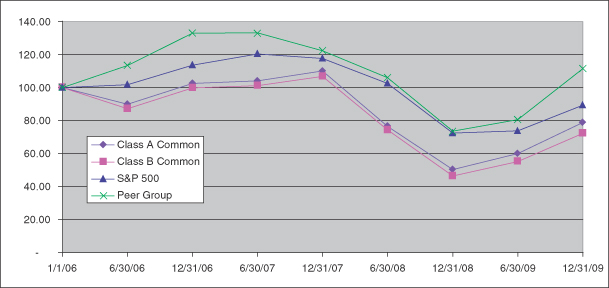
| | | | | | | | | | | | | | | | | | |
| | | 1/1/06 | | 6/30/06 | | 12/31/06 | | 6/30/07 | | 12/31/07 | | 6/30/08 | | 12/31/08 | | 6/30/09 | | 12/31/09 |
| Class A Common | | 100.00 | | 89.88 | | 102.53 | | 104.00 | | 109.95 | | 76.53 | | 50.30 | | 59.95 | | 78.75 |
| Class B Common | | 100.00 | | 87.10 | | 99.71 | | 101.17 | | 106.73 | | 74.22 | | 46.32 | | 55.16 | | 72.25 |
| S&P 500 | | 100.00 | | 101.76 | | 113.62 | | 120.43 | | 117.63 | | 102.54 | | 72.36 | | 73.65 | | 89.33 |
| Peer Group | | 100.00 | | 113.37 | | 132.98 | | 133.09 | | 122.24 | | 106.00 | | 73.53 | | 80.61 | | 111.37 |
Equity Compensation Plan Information
Information required by this item is contained in the Proxy Statement for our 2010 Annual Meeting of Stockholders under the heading “Equity Compensation Plan Information,” which information is incorporated herein by reference.
Item 6.Selected Financial Data.
The selected Consolidated Statement of Earnings data for the three years ended December 31, 2009 and the Consolidated Balance Sheet data as of December 31, 2009 and 2008 should be read in conjunction with the audited financial statements, “Management’s Discussion and Analysis of Results of Operations and Financial Condition” (“MD&A”) and other financial information presented elsewhere in this annual report. The selected Consolidated Statement of Earnings data for the years ended December 31, 2006 and 2005 and the Consolidated Balance Sheet data as of December 31, 2007, 2006 and 2005 have been derived from audited financial statements not included herein and, where applicable, such data was recast for the retrospective application of new accounting guidance for noncontrolling interests in a consolidated subsidiary, including the related adoption of redeemable securities guidance, which we became subject to beginning January 1, 2009.
32
CONSOLIDATED STATEMENT OF EARNINGS DATA
| | | | | | | | | | | | | | | |
| | | Year Ended December 31, * |
| (in millions, except earnings per share amounts) | | 2009 | | 2008 | | 2007 | | 2006 | | 2005** |
|
Revenues | | $ | 13,619 | | $ | 14,625 | | $ | 13,423 | | $ | 11,361 | | $ | 9,520 |
Operating income | | $ | 2,904 | | $ | 2,523 | | $ | 2,936 | | $ | 2,767 | | $ | 2,359 |
Net earnings from continuing operations (Viacom and noncontrolling interests)*** | | $ | 1,568 | | $ | 1,250 | | $ | 1,651 | | $ | 1,581 | | $ | 1,303 |
Net earnings from continuing operations attributable to Viacom | | $ | 1,591 | | $ | 1,233 | | $ | 1,630 | | $ | 1,567 | | $ | 1,300 |
Net earnings from continuing operations per share attributable to Viacom: | | | | | | | | | | | | | | | |
Basic | | $ | 2.62 | | $ | 1.97 | | $ | 2.42 | | $ | 2.19 | | $ | 1.73 |
Diluted | | $ | 2.62 | | $ | 1.97 | | $ | 2.41 | | $ | 2.19 | | $ | 1.73 |
Weighted average number of common shares outstanding: | | | | | | | | | | | | | | | |
Basic | | | 607.1 | | | 624.7 | | | 674.1 | | | 715.2 | | | 751.6 |
Diluted | | | 608.3 | | | 625.4 | | | 675.6 | | | 716.2 | | | 751.6 |
|
CONSOLIDATED BALANCE SHEET DATA
| | | | | | | | | | | | | | | |
| | | December 31, |
| (in millions) | | 2009 | | 2008 | | 2007 | | 2006 | | 2005** |
|
Total assets | | $ | 21,900 | | $ | 22,487 | | $ | 22,904 | | $ | 21,797 | | $ | 19,116 |
Total debt | | $ | 6,773 | | $ | 8,002 | | $ | 8,246 | | $ | 7,648 | | $ | 5,758 |
Total Viacom stockholders’ equity*** | | $ | 8,704 | | $ | 6,909 | | $ | 6,911 | | $ | 6,962 | | $ | 7,788 |
Total equity*** | | $ | 8,677 | | $ | 6,923 | | $ | 6,919 | | $ | 6,967 | | $ | 7,790 |
|
| * | Discontinued operations reflect the impact of businesses previously sold, including our sale of Famous Music in 2007 and Former Viacom’s sale of Famous Players Inc., a Canadian-based theater chain, in 2005, as well as adjustments related to businesses previously sold. Famous Music and Famous Players have been presented as discontinued operations for all periods presented. |
| ** | The selected Consolidated Statement of Earnings data for the year ended December 31, 2005 and the Consolidated Balance Sheet data as of December 31, 2005 are presented on a carve-out basis and reflect the results of operations and financial position of our businesses when they were a part of Former Viacom. The consolidated financial information as of and for the year ended December 31, 2005 may not necessarily reflect what our results of operations and financial position would have been had we been a separate, stand-alone company. For example, the indebtedness of Former Viacom, other than capital lease obligations, was not assumed by us; therefore, debt service cost is not reflected in the Consolidated Statement of Earnings data for 2005. The Consolidated Statement of Earnings data includes allocations of Former Viacom corporate expenses and Paramount corporate overhead including accounting, treasury, tax, legal, human resources, information systems and other services, as well as depreciation and amortization on allocated costs, to reflect the utilization of such shared services and assets by us. Management believes the methodologies used to allocate charges for the services described above are reasonable. The assets and liabilities of Former Viacom assigned to us pursuant to the terms of the separation are accounted for at the historical book values of such assets and liabilities. |
| *** | Amounts have been recast for the application of new accounting guidance for noncontrolling interests. See Note 1 to our Consolidated Financial Statements. |
33
Item 7. Management’s Discussion and Analysis of Results of Operations and Financial Condition.
Management’s discussion and analysis of results of operations and financial condition is provided as a supplement to and should be read in conjunction with the consolidated financial statements and related notes to enhance the understanding of our results of operations, financial condition and cash flows. References in this document to “Viacom,” “Company,” “we,” “us” and “our” mean Viacom Inc. and our consolidated subsidiaries through which our various businesses are conducted, unless the context requires otherwise. Certain amounts have been reclassified to conform to the 2009 presentation.
Significant components of the management’s discussion and analysis of results of operations and financial condition section include:
| | | | |
| | | | | Page |
| • | | Overview. The overview section provides a summary of Viacom and our reportable business segments and the principal factors affecting our results of operations. | | 35 |
| | |
| • | | Results of Operations. The results of operations section provides an analysis of our results on a consolidated basis and our reportable operating segment results for the three years ended December 31, 2009. In addition, we provide a discussion of items affecting the comparability of our financial statements. | | 37 |
| | |
| • | | Liquidity and Capital Resources. The liquidity and capital resources section provides a discussion of our cash flows for the three years ended December 31, 2009 and of our outstanding debt and commitments existing as of December 31, 2009. | | 50 |
| | |
| • | | Market Risk. We are principally exposed to market risk related to foreign currency exchange rates and interest rates. The market risk section discusses how we manage exposure to these and other market risks. | | 56 |
| | |
| • | | Critical Accounting Policies and Estimates. The critical accounting policies section provides detail with respect to accounting policies that are considered by management to require significant judgment and use of estimates and that could have a significant impact on our financial statements. | | 57 |
| | |
| • | | Recent Accounting Pronouncements. The recent pronouncements section provides a discussion of recently issued accounting pronouncements not yet effective, including a discussion of the impact or potential impact of such standards on our financial statements when applicable. | | 63 |
| | |
| • | | Other Matters. The other matters section provides a discussion of legal matters and related party transactions and agreements. | | 64 |
34
Management’s Discussion and Analysis
of Results of Operations and Financial Condition
(continued)
OVERVIEW
Summary
We are a leading global entertainment content company, engaging audiences on television, motion picture, Internet, mobile and video game platforms through many of the world’s best known entertainment brands. In 2009, we generated consolidated revenues of $13.619 billion, operating income of $2.904 billion and diluted earnings per share from continuing operations of $2.62, representing a decline in revenues of 7%, and growth in operating income and diluted earnings per share of 15% and 33%, respectively, over 2008. We manage our operations through two reporting segments:Media Networks andFilmed Entertainment.
Media Networks
OurMedia Networks segment, which includes brands such as MTV: Music Television®, VH1®, Nickelodeon®, COMEDY CENTRAL®,Rock Band® and BET®, provides entertainment content for consumers in key demographics attractive to advertisers, content distributors and retailers. We create and acquire programming, video games and other content for distribution to our audiences how and where they want to view and interact with it: on television, the Internet, mobile devices, game consoles and through a variety of consumer products and themed entertainment.
OurMedia Networks segment generates revenues principally in three categories: (i) the sale of advertising time on our program services and digital properties, (ii) the receipt of affiliate fees from cable television operators, direct-to-home satellite operators, mobile networks and other content distributors and (iii) ancillary revenues, which include the creation and publishing of video games and other interactive products, home entertainment sales of our programming, the licensing of our content to third parties and the licensing of our brands and properties for consumer products.
Our advertising revenues may be affected by the strength of the advertising market and general economic conditions, and may fluctuate depending on the success of our programming at any given time. Our advertising revenues may also fluctuate due to seasonal variations, typically being highest in the fourth quarter of the calendar year.
Revenues from affiliate fees are negotiated with cable and satellite television operators, mobile networks and other distributors, generally resulting in multi-year carriage agreements with set rate increases that provide us with a reasonably stable source of revenues. The amount of the fees we receive is generally a function of the number of subscribers and the rates per subscriber paid by our cable and satellite affiliate partners.
Our ancillary revenues are principally derived from the creation and publishing of video games, such as from sales ofRock Band,Guitar Hero royalties and other interactive products, sales of home entertainment products such as DVDs, content licensing and licensing for consumer products, including licensing of popular characters from our programs. Our ancillary revenues may vary based on consumer spending and acceptance of our products.
Media Networks segment expenses consist of operating expenses, selling, general and administrative (“SG&A”) expenses and depreciation and amortization. Operating expenses comprise costs related to original and acquired programming, including programming amortization, expenses associated with the manufacturing and distribution of video games and home entertainment products, and consumer products licensing and participation fees. SG&A expenses consist primarily of employee compensation, marketing, research and professional service fees and
35
Management’s Discussion and Analysis
of Results of Operations and Financial Condition
(continued)
facility and occupancy costs. Depreciation and amortization expenses reflect depreciation of fixed assets, including transponders financed under capital leases, and amortization of finite-lived intangible assets.
Filmed Entertainment
TheFilmed Entertainment segment produces, finances and distributes motion pictures under the Paramount Pictures, Paramount Vantage, Paramount Classics, MTV Films, and Nickelodeon Movies brands. We also continue to release certain pictures under the DreamWorks brand, acquire films for distribution and have distribution relationships containing various terms with DreamWorks Animation SKG, Inc. and MVL Productions LLC (“Marvel”), a subsidiary of the Walt Disney Company.
In general, motion pictures produced, acquired and/or distributed by theFilmed Entertainment segment are exhibited theatrically in the U.S. and internationally, followed by their release in various windows on DVD and Blu-ray, video-on-demand, pay and basic cable television, broadcast television and syndicated television (the “distribution windows”), digital media outlets, and, in some cases, by other exhibitors such as airlines and hotels. In 2009, theFilmed Entertainment segment theatrically released in domestic and/or international marketsTransformers: Revenge of the Fallen,Star Trek, G.I. Joe: The Rise of Cobra, Paranormal Activity, Hotel for Dogs andUp In the Air, among others. Paramount also distributed DreamWorks Animation’sMonsters vs. Aliens.
The output term of Paramount’s agreement with DreamWorks Animation expires on the later of the delivery of 13 qualified animated motion pictures and December 31, 2012, subject to earlier termination under certain limited circumstances. Paramount has distributed seven DreamWorks Animation films under the DWA Agreement and expects to distribute three more in 2010. In September 2008, Paramount and Marvel extended their distribution relationship under which Paramount distributed Marvel’sIron Man in 2008. Under the new agreement, Paramount will distribute Marvel’s next four to six self-produced qualified feature films on a worldwide basis, including theatrical distribution in most foreign territories previously serviced by Marvel through local distribution entities.
OurFilmed Entertainment segment generates revenues worldwide principally from: (i) the theatrical release and/or distribution of motion pictures, (ii) home entertainment, which includes sales of DVD, Blu-ray and other products relating to the motion pictures we release theatrically and direct-to-DVD, as well as certain other programming, including content we distribute on behalf of third parties and (iii) license fees paid worldwide by third parties for exhibition rights on pay and basic cable television, broadcast television, syndicated television and digital media outlets. TheFilmed Entertainment segment also generates ancillary revenues from providing production services to third parties, primarily at Paramount’s studio lot, consumer products licensing, game distribution and distribution of content on digital platforms.
Revenues from motion picture theatrical releases tend to be cyclical with increases during the summer months, around holidays and in the fourth quarter of the calendar year. In choosing films to produce, we aim to create a carefully balanced film slate that represents a variety of genres, styles, and levels of investment and risk—with the goal of creating entertainment for both niche audiences and worldwide appeal. Paramount is focused on continuing to improve the profitability of its film slate by focusing on key tentpole films mixed with smaller productions or acquisitions. The theatrical success of a motion picture is a significant factor in determining the revenues it is likely to generate in home entertainment sales and licensing fees during the various other distribution windows. Our home entertainment revenues may also be affected by consumer tastes and consumption habits, as well as overall economic conditions.
36
Management’s Discussion and Analysis
of Results of Operations and Financial Condition
(continued)
Filmed Entertainment segment expenses consist of operating expenses, SG&A and depreciation and amortization. Operating expenses principally include the amortization of production costs of our released feature films (including participations accrued under our third-party distribution arrangements), print and advertising expenses and other distribution costs. We incur marketing costs before and throughout the theatrical release of a film and, to a lesser extent, other distribution windows. Such costs are incurred to generate public interest in our films and are expensed as incurred; therefore, we typically incur losses with respect to a particular film prior to and during the film’s theatrical exhibition and profitability may not be realized until well after a film’s theatrical release. Therefore, the results of theFilmed Entertainment segment can be volatile as films work their way through the various distribution windows. SG&A expenses include employee compensation, facility and occupancy costs, professional service fees and other overhead costs. Depreciation and amortization expense includes depreciation of fixed assets and amortization of acquired intangibles.
Change in Fiscal Year
On June 4, 2009, our Board of Directors authorized a change in our fiscal year end to September 30 from December 31, effective September 30, 2010. We plan to report our financial results for the nine-month transition period of January 1, 2010 through September 30, 2010 on an Annual Report on Form 10-K and to thereafter file reports for each twelve month period ended September 30, beginning with the twelve month period ended September 30, 2011. We believe the change in fiscal year will better align our financial reporting period, as well as our annual planning and budgeting process, with our business cycle, particularly the cable broadcast year.
RESULTS OF OPERATIONS
Factors Affecting Comparability
The consolidated financial statements as of and for the years ended December 31, 2009, 2008 and 2007 reflect our results of operations, financial position and cash flows reported in accordance with U.S. generally accepted accounting principles. Results for the aforementioned periods, as further discussed below, have been affected by certain items which affect comparability between periods.
Restructuring and Other Charges
2009
During the second quarter of 2009 we took actions resulting in severance charges of $16 million in theMedia Networkssegment and $17 million in theFilmed Entertainmentsegment included withinSelling, general and administrative expenses in our Consolidated Statement of Earnings. During 2009, approximately $12 million related to these charges was paid out in cash, leaving a remaining liability of $21 million as of December 31, 2009.
In the fourth quarter of 2009, we recorded a $60 million non-cash impairment charge in theMedia Networks segment related to certain broadcast licenses held by a 32%-owned consolidated entity. This charge is included inDepreciation and amortizationin our Consolidated Statement of Earnings. The impact toNet earnings attributable to Viacom was a reduction of $19 million.
2008
In the fourth quarter of 2008, to better align our organization and cost structure with changing economic conditions, we undertook a strategic review of our businesses which resulted in $454 million of restructuring and other charges. In addition to broad adverse economic conditions, the strategic review considered the emergence
37
Management’s Discussion and Analysis
of Results of Operations and Financial Condition
(continued)
of sustained softness in the advertising market and ratings issues at certain channels in theMedia Networks segment, and theFilmed Entertainment segment’s decision to reduce its future film slate. As a result of these initiatives we saved approximately $200 million in 2009. Approximately half of the savings from the restructuring charges were principally comprised of workforce reductions and were realized via lower compensation costs primarily included as a component ofSelling, general and administrative expensesin our Consolidated Statement of Earnings. We expect to continue to experience similar levels of savings from the headcount reductions in future years, subject to the performance of our operations which may require further changes to our headcount, either increases or decreases, to effectively and efficiently manage our operations. In 2009, our cash savings were partially offset by severance payments made pursuant to our restructuring plan. With respect to the other charges, the savings are primarily related to reduced programming amortization attributable to abandoned programming included as a component ofOperating expenses in our Consolidated Statement of Earnings, and will diminish ratably through 2011. Despite these savings, overall programming expenses are likely to grow in the future as we continue to invest in programming in the normal course of business.
The following table presents the components of the 2008 restructuring and other charges by segment:
| | | | | | | | | | | | |
2008 Restructuring and Other Charges (in millions) | | Media Networks | | Filmed
Entertainment | | Corporate | | Total |
|
Severance and lease termination costs | | $ | 71 | | $ | 29 | | $ | 3 | | $ | 103 |
Programming and film inventory | | | 286 | | | 19 | | | - | | | 305 |
Asset impairments and other | | | 32 | | | 14 | | | - | | | 46 |
| | | | | | | | | | | | |
December 31, 2008 | | $ | 389 | | $ | 62 | | $ | 3 | | $ | 454 |
| | | | | | | | | | | | |
|
|
The components of the 2008 restructuring and other charges are included in our Consolidated Statement of Earnings as follows:
| | | | | | | | | | | | |
2008 Restructuring and Other Charges (in millions) | | Operating | | Selling, General and
Administrative | | Depreciation and
Amortization | | Total |
|
Severance and lease termination costs | | $ | - | | $ | 94 | | $ | 9 | | $ | 103 |
Programming and film inventory | | | 305 | | | - | | | - | | | 305 |
Asset impairments and other | | | 14 | | | - | | | 32 | | | 46 |
| | | | | | | | | | | | |
December 31, 2008 | | $ | 319 | | $ | 94 | | $ | 41 | | $ | 454 |
| | | | | | | | | | | | |
| |
2007
During 2007 we recorded $77 million of restructuring charges in theMedia Networks segment that have been included withinSelling, general and administrative expenses in our Consolidated Statement of Earnings.
See Note 13 to our Consolidated Financial Statements for additional information regarding these actions.
Gain on Sale of Equity Investment
In 2007, we sold MTV Networks’ investment in Russia for $191 million and recognized a pre-tax gain on the sale of $151 million.
Extinguishment of Debt
In the third quarter of 2009 we issued a total of $1.4 billion of senior notes with maturities of five, six and ten years. We used the net cash proceeds from these offerings of $1.393 billion to repurchase a substantial portion of our shorter term 5.75% Senior Notes due 2011 in a cash tender offer. Our repurchase of $1.307 billion of principal at a purchase price of $1,061.25 per $1,000 pursuant to the tender offer resulted in a pre-tax extinguishment loss of $84 million ($52 million, net of tax).
38
Management’s Discussion and Analysis
of Results of Operations and Financial Condition
(continued)
Other Items
In 2008 and 2007, we recognized non-cash investment impairment charges of $27 million and $36 million, respectively.
Discrete Tax Benefits
Discrete tax benefits of $124 million, $55 million and $15 million were recognized in 2009, 2008 and 2007, respectively. The discrete taxes in each period were principally due to reserve releases resulting from effectively settled audits. The benefit in 2009 also reflects the recognition of certain previously unrecognized capital losses from international operations.
Discontinued Operations
Discontinued operations in 2007 primarily reflects the $192 million gain on the sale of Famous Music in July 2007 and its net operating results prior to the sale. Other discontinued operations activity in all years presented reflects adjustments related to businesses previously sold.
2009 vs. 2008
Our summary consolidated results of operations are presented below for the years ended December 31, 2009 and 2008.
Consolidated Results of Operations
| | | | | | | | | | | | | | | |
| | | Year Ended December 31, | | | Better/(Worse) | |
| (in millions) | | 2009 | | | 2008 | | | $ | | | % | |
Revenues | | $ | 13,619 | | | $ | 14,625 | | | $ | (1,006 | ) | | (7 | )% |
Expenses: | | | | | | | | | | | | | | | |
Operating | | | 7,587 | | | | 8,787 | | | | 1,200 | | | 14 | |
Selling, general & administrative | | | 2,737 | | | | 2,910 | | | | 173 | | | 6 | |
Depreciation and amortization | | | 391 | | | | 405 | | | | 14 | | | 3 | |
| | | | | | | | | | | | | | | |
Total expenses | | | 10,715 | | | | 12,102 | | | | 1,387 | | | 11 | |
Operating income | | | 2,904 | | | | 2,523 | | | | 381 | | | 15 | |
Interest expense, net | | | (430 | ) | | | (482 | ) | | | 52 | | | 11 | |
Equity in net losses of investee companies | | | (77 | ) | | | (74 | ) | | | (3 | ) | | (4 | ) |
Loss on extinguishment of debt | | | (84 | ) | | | - | | | | (84 | ) | | NM | |
Other items, net | | | (37 | ) | | | (112 | ) | | | 75 | | | 67 | |
| | | | | | | | | | | | | | | |
Earnings from continuing operations before provision for income taxes | | | 2,276 | | | | 1,855 | | | | 421 | | | 23 | |
Provision for income taxes | | | (708 | ) | | | (605 | ) | | | (103 | ) | | (17 | ) |
| | | | | | | | | | | | | | | |
Net earnings from continuing operations | | | 1,568 | | | | 1,250 | | | | 318 | | | 25 | |
Discontinued operations, net of tax | | | 20 | | | | 18 | | | | 2 | | | 11 | |
| | | | | | | | | | | | | | | |
Net earnings (Viacom and noncontrolling interests) | | | 1,588 | | | | 1,268 | | | | 320 | | | 25 | |
Net losses (earnings) attributable to noncontrolling interests | | | 23 | | | | (17 | ) | | | 40 | | | NM | |
| | | | | | | | | | | | | | | |
Net earnings attributable to Viacom | | $ | 1,611 | | | $ | 1,251 | | | $ | 360 | | | 29 | % |
| | | | | | | | | | | | | | | |
Diluted EPS from continuing operations | | $ | 2.62 | | | $ | 1.97 | | | $ | 0.65 | | | 33 | % |
NM - Not Meaningful
Revenues
Worldwide revenues for the year ended December 31, 2009 decreased $1.006 billion, or 7%, to $13.619 billion.Filmed Entertainment contributed $551 million of the decrease primarily driven by declines in theatrical and home entertainment revenues, partially offset by an increase in television and ancillary revenues. The decrease in feature film revenues reflects fewer films released in the current year and the decrease in home entertainment revenues principally results from the number and mix of titles released in 2009 compared to 2008.Media Networkscontributed $468 million of the decrease reflecting declines in ancillary and advertising revenues, partially offset by an increase in affiliate fees. The decrease in ancillary revenues was primarily driven by lowerRock Bandrevenues.
39
Management’s Discussion and Analysis
of Results of Operations and Financial Condition
(continued)
Expenses
Total expenses decreased $1.387 billion, or 11%, to $10.715 billion for the year ended December 31, 2009. Total restructuring and other charges of $93 million and $454 million are included in total expenses in 2009 and 2008, respectively.Filmed Entertainment contributed $744 million of the total expense savings. The decrease principally reflects our reduced film slate and lower costs associated with third party distribution arrangements.Media Networkscontributed $673 million of the total expense savings, including a $313 million decrease in restructuring and other charges, lowerRock Band costs and employee compensation and other cost benefits principally resulting from the actions taken in connection with restructurings and other initiatives. These decreases were partially offset by costs related to our continued investment in programming.
Operating Income
Operating income increased $381 million, or 15%, to $2.904 billion in 2009.Media Networks contributed $205 million of the increase. The positive impact of the $313 million decrease in restructuring and other charges and higher affiliate revenues were partially offset by lower advertising revenues and losses associated withRock Band.Filmed Entertainment contributed $193 million of the increase. The increase principally reflects the success of certain current year releases, includingTransformers: Revenge of the Fallen, Star TrekandParanormal Activityand the positive impact of the $45 million decrease in restructuring and other charges, partially offset by fewer distributed films. Both segments benefited from lower costs in 2009 as a result of restructurings and other cost savings initiatives.
See the section entitled“Segment Results of Operations” for a more in depth discussion of the revenues, expenses and operating income for each of theMedia Networks andFilmed Entertainment segments.
Interest Expense, Net
In 2009, interest expense, net of interest income, decreased $52 million due to lower average debt outstanding.
Equity in Net Losses of Investee Companies
Equity in net losses of investee companies was $77 million in 2009 and $74 million in 2008. Equity losses include our share of the losses associated with our investments in Rhapsody America, EPIX and Viacom 18.
Loss on Extinguishment of Debt
Loss on extinguishment of debt was $84 million resulting from the partial extinguishment of our 5.75% Senior Notes due 2011 in the third quarter of 2009. At December 31, 2009, $193 million aggregate principal amount of the originally issued $1.5 billion remains outstanding on the 5.75% Senior Notes.
Other Items, Net
Other items, net, reflects expenses of $37 million in 2009 compared with $112 million in 2008. The decrease is due to the absence of $27 million of non-cash investment impairment charges taken in 2008, a $23 million reduction in foreign exchange losses and $20 million of lower costs associated with our receivables securitization programs.
Provision for Income Taxes
The provision for income taxes was $708 million in December 31, 2009. The effective income tax rate was 31.1% and 32.6% in 2009 and 2008, respectively. Discrete tax benefits, taken together with the impact of restructuring and other charges and the 2009 loss on extinguishment of debt, contributed 4.6 and 2.8 percentage points of tax benefit in each respective year.
40
Management’s Discussion and Analysis
of Results of Operations and Financial Condition
(continued)
Discontinued Operations, Net of Tax
Discontinued operations, net of tax, in 2009 and 2008 reflect adjustments related to businesses previously sold. In 2009, the amount principally relates to the release of contingent obligations resulting from lease modifications by Blockbuster Inc. (“Blockbuster”) in the third quarter, as discussed in the section entitled“Commitments and Contingencies”.
Net Earnings (Viacom and Noncontrolling Interests)
Net earnings increased $320 million, or 25%, in 2009. The increase in the year was principally due to the increase in operating income.
Net Losses (Earnings) Attributable to Noncontrolling Interests
Net losses attributable to noncontrolling interests of $23 million were recorded in 2009, including $41 million attributable to an impairment charge. Net earnings attributable to noncontrolling interests of $17 million were recorded in 2008.
Net Earnings Attributable to Viacom
Net earnings attributable to Viacom increased $360 million, or 29%, in 2009 consistent with the increase in net earnings described above. Diluted EPS from continuing operations increased $0.65 per diluted share from $1.97 in 2008 to $2.62 in 2009. Net earnings in 2009 included certain items that affected comparability, including a loss related to the extinguishment of debt in the third quarter ($0.09 per diluted share charge), an unfavorable impact of restructuring and other charges ($0.06 per diluted share charge), and a favorable impact of discrete tax benefits ($0.21 per diluted share benefit). These items collectively resulted in a net benefit of $0.06 per diluted share. Net earnings in 2008 included an unfavorable impact of restructuring and other charges ($0.46 per diluted share charge), an unfavorable impact relating to the impairment of an investment ($0.04 per diluted share charge) and a favorable impact of discrete tax benefits ($0.09 per diluted share benefit). These items collectively resulted in a net charge of $0.41 per diluted share.
Segment Results of Operations
Operating income is used as the measurement of segment profit performance. Transactions between reportable segments are accounted for as third-party arrangements for the purpose of presenting segment results of operations. Typical intersegment transactions include the purchase of advertising by theFilmed Entertainment segment onMedia Networks’ properties and the purchase ofFilmed Entertainment’sfeature films exhibition rights byMedia Networks.
Media Networks
| | | | | | | | | | | | | |
| | | Year Ended December 31, | | Better/(Worse) | |
| (in millions) | | 2009 | | 2008 | | $ | | | % | |
| | | | |
Revenues by Component | | | | | | | | | | | | | |
Advertising | | $ | 4,405 | | $ | 4,722 | | $ | (317 | ) | | (7 | )% |
Affiliate fees | | | 2,901 | | | 2,620 | | | 281 | | | 11 | |
Ancillary | | | 982 | | | 1,414 | | | (432 | ) | | (31 | ) |
| | | | | | | | | | | | | |
Total revenues by component | | $ | 8,288 | | $ | 8,756 | | $ | (468 | ) | | (5 | )% |
| | | | | | | | | | | | | |
| | | | |
Expenses | | | | | | | | | | | | | |
Operating | | $ | 3,085 | | $ | 3,576 | | $ | 491 | | | 14 | % |
Selling, general and administrative | | | 1,993 | | | 2,177 | | | 184 | | | 8 | |
Depreciation and amortization | | | 276 | | | 274 | | | (2 | ) | | (1 | ) |
| | | | | | | | | | | | | |
Total expenses | | $ | 5,354 | | $ | 6,027 | | $ | 673 | | | 11 | % |
| | | | | | | | | | | | | |
Operating Income | | $ | 2,934 | | $ | 2,729 | | $ | 205 | | | 8 | % |
| | | | | | | | | | | | | |
| | |
41
Management’s Discussion and Analysis
of Results of Operations and Financial Condition
(continued)
Revenues
Worldwide revenues decreased $468 million, or 5%, to $8.288 billion in 2009. Declines in ancillary and advertising revenues were partially offset by an increase in affiliate fees. Domestic revenues decreased to $7.011 billion, a decline of $281 million, or 4%. International revenues decreased to $1.277 billion, a decline of $187 million, or 13%, including a 5-percentage point negative impact from foreign exchange.
Advertising
Worldwide advertising revenues decreased $317 million, or 7%, to $4.405 billion in 2009. Domestic advertising revenue decreased 6%, while international advertising revenues decreased 14%, with foreign exchange negatively impacting international growth by 5 percentage points. In 2009, global economic conditions had a negative impact on the advertising market and our revenues, although the advertising market strengthened in the second half of 2009.
Affiliate Fees
Worldwide affiliate fees increased $281 million or 11%, to $2.901 billion in 2009. Domestic affiliate fees increased 12% and international affiliate fees increased 3%, principally due to rate and subscriber growth. International affiliate revenues include 8 percentage points of negative impact from foreign exchange.
Ancillary
Worldwide ancillary revenues decreased $432 million, or 31%, to $982 million in 2009. The decrease is primarily driven by lowerRock Band revenues due to a more challenging retail environment and the mix ofRock Band product offerings, partially offset by the favorable impact of settling a licensing fee dispute in the second quarter. Revenues fromThe Beatles: Rock Band, released in September 2009, were more than offset by lower sales ofRock Band andRock Band 2, released in the fourth quarter of 2007 and 2008, respectively. Domestic and international ancillary revenues declined 31% and 28%, respectively, also including lower home entertainment and consumer products revenues. International ancillary revenues also included a 2-percentage point negative impact from foreign exchange.
Expenses
Media Networkssegment expenses decreased $673 million, or 11%, to $5.354 billion in 2009. The reduction in total expenses includes a $313 million decrease in restructuring and other charges, lowerRock Bandcosts and employee compensation and other cost benefits principally resulting from the actions taken in connection with restructurings and other initiatives. These decreases were partially offset by costs related to our continued investment in programming.
Operating
Operating expenses decreased $491 million, or 14%, to $3.085 billion in 2009. Distribution and other expenses decreased $264 million, or 27%, principally driven by lowerRock Band costs. Production and programming costs decreased $227 million, or 9%, primarily reflecting programming write-downs of $286 million taken in 2008 in connection with our restructuring and other charges and $79 million of savings in 2009 attributable to the programming abandonments. These decreases were partially offset by $138 million, or 6%, of increased costs due to our continued investment in programming.
Selling, General and Administrative
SG&A decreased $184 million, or 8%, to $1.993 billion in 2009. Total restructuring and other charges of $16 million and $65 million are included in SG&A in 2009 and 2008, respectively, representing a $49 million decrease in charges, or 2 percentage points of the SG&A decline. The remaining decrease of $135 million is principally due to lower employee compensation costs and other cost savings initiatives, principally resulting from restructurings.
42
Management’s Discussion and Analysis
of Results of Operations and Financial Condition
(continued)
Depreciation and Amortization
Depreciation and amortization increased $2 million, or 1%, to $276 million in 2009. The increase includes a $22 million increase in restructuring and other charges, partially offset by lower capital lease depreciation expense and lower overall capital spending.
Operating Income
Operating income increased $205 million, or 8%, to $2.934 billion in 2009. The positive impact of the $313 million decrease in restructuring and other charges, higher affiliate revenues and the cost savings from restructurings and other initiatives were partially offset by lower advertising revenues and losses associated withRock Band.
Filmed Entertainment
| | | | | | | | | | | | | |
| | | Year Ended December 31, | | Better/(Worse) | |
| (in millions) | | 2009 | | 2008 | | $ | | | % | |
Revenues by Component | | | | | | | | | | | | | |
Theatrical | | $ | 1,321 | | $ | 1,714 | | $ | (393 | ) | | (23 | )% |
Home entertainment | | | 2,501 | | | 2,724 | | | (223 | ) | | (8 | ) |
Television license fees | | | 1,383 | | | 1,333 | | | 50 | | | 4 | |
Ancillary | | | 277 | | | 262 | | | 15 | | | 6 | |
| | | | | | | | | | | | | |
Total revenues by component | | $ | 5,482 | | $ | 6,033 | | $ | (551 | ) | | (9 | )% |
| | | | | | | | | | | | | |
Expenses | | | | | | | | | | | | | |
Operating | | $ | 4,652 | | $ | 5,377 | | $ | 725 | | | 13 | % |
Selling, general & administrative | | | 506 | | | 522 | | | 16 | | | 3 | |
Depreciation & amortization | | | 105 | | | 108 | | | 3 | | | 3 | |
| | | | | | | | | | | | | |
Total expenses | | $ | 5,263 | | $ | 6,007 | | $ | 744 | | | 12 | % |
| | | | | | | | | | | | | |
Operating Income | | $ | 219 | | $ | 26 | | $ | 193 | | | NM | |
| | | | | | | | | | | | | |
NM - Not Meaningful
Revenues
Worldwide revenues decreased $551 million, or 9%, to $5.482 billion in 2009. Declines in theatrical and home entertainment revenues were partially offset by an increase in television and ancillary revenues. Domestic revenues decreased to $2.942 billion, a decline of $300 million, or 9%. International revenues decreased to $2.54 billion, a decline of $251 million, or 9%, including a 5-percentage point negative impact from foreign exchange.
Theatrical
Worldwide theatrical revenues decreased $393 million, or 23%, to $1.321 billion in 2009, principally driven by a smaller slate of films. During 2009, we released 20 films, includingTransformers: Revenge of the Fallen,Star Trek,G.I. Joe: The Rise of Cobra, Paranormal Activity and DreamWorks Animation’sMonsters vs. Aliens compared to 24 films released in 2008, which includedIndiana Jones and the Kingdom of the Crystal Skull, Marvel’sIron Manand DreamWorks Animation’sKung Fu Panda andMadagascar 2: Escape to Africa. Domestic theatrical revenues decreased 8%, and international theatrical revenues decreased 36%. Foreign exchange had a 9-percentage point negative impact on international theatrical revenues.
Home Entertainment
Worldwide home entertainment revenues decreased $223 million, or 8%, to $2.501 billion in 2009. Decreased revenues principally reflect the number and mix of titles released in 2009 versus 2008. Domestic and international home entertainment revenues decreased 12% and 3%, respectively, with a 3-percentage point negative impact from foreign exchange on international revenues. The DVD market continued to be negatively
43
Management’s Discussion and Analysis
of Results of Operations and Financial Condition
(continued)
affected by global economic conditions throughout most of 2009, with strengthening seen in the fourth quarter relative to our major release titles.
Television License Fees
Worldwide television license fees increased $50 million, or 4%, to $1.383 billion in 2009, principally reflecting higher Pay TV fees driven by the number and mix of available titles.
Ancillary
Ancillary revenues increased $15 million, or 6%, to $277 million in 2009 due to higher digital and merchandising revenues.
Expenses
Filmed Entertainmentsegment expenses decreased $744 million, or 12%, to $5.263 billion in 2009. The reduction in total expenses principally reflects our reduced film slate, lower costs associated with third party distribution agreements and a $45 million decrease in restructuring and other charges.
Operating
Operating expenses decreased $725 million, or 13%, to $4.652 billion in 2009. Distribution and other expenses decreased $488 million, or 19%, primarily related to the reduced number of theatrical releases, lower home entertainment expenses and cost savings initiatives. Film costs decreased $237 million, or 8%. The decrease was primarily due to lower participation costs associated with third party distribution arrangements, partially offset by higher amortization of certain film costs.
Selling, General and Administrative
SG&A decreased $16 million, or 3%, to $506 million in 2009. Total restructuring and other charges of $17 million and $29 million are included in SG&A in 2009 and 2008, respectively, representing $12 million of the decrease in SG&A. The benefits from our cost savings initiatives have also contributed to containing SG&A costs.
Depreciation and Amortization
Depreciation and amortization decreased $3 million, or 3%, to $105 million in 2009.
Operating Income
Operating income increased $193 million to $219 million in 2009. The increase principally reflects the success of certain current year releases, includingTransformers: Revenge of the Fallen, Star Trekand Paranormal Activity,the positive impact of the $45 million decrease in restructuring and other charges and cost savings from restructurings and other initiatives, partially offset by fewer distributed films.
44
Management’s Discussion and Analysis
of Results of Operations and Financial Condition
(continued)
2008 vs. 2007
Our summary consolidated results of operations are presented below for the years ended December 31, 2008 and 2007.
Consolidated Results of Operations
| | | | | | | | | | | | | | | |
| | | Year Ended December 31, | | | Better/(Worse) | |
| (in millions) | | 2008 | | | 2007 | | | $ | | | % | |
Revenues | | $ | 14,625 | | | $ | 13,423 | | | $ | 1,202 | | | 9 | % |
Expenses: | | | | | | | | | | | | | | | |
Operating | | | 8,787 | | | | 7,431 | | | | (1,356 | ) | | (18 | ) |
Selling, general and administrative | | | 2,910 | | | | 2,663 | | | | (247 | ) | | (9 | ) |
Depreciation and amortization | | | 405 | | | | 393 | | | | (12 | ) | | (3 | ) |
| | | | | | | | | | | | | | | |
Total expenses | | | 12,102 | | | | 10,487 | | | | (1,615 | ) | | (15 | ) |
Operating income | | | 2,523 | | | | 2,936 | | | | (413 | ) | | (14 | ) |
Interest expense, net | | | (482 | ) | | | (464 | ) | | | (18 | ) | | (4 | ) |
Gain on sale of equity investment | | | - | | | | 151 | | | | (151 | ) | | NM | |
Equity in net losses of investee companies | | | (74 | ) | | | - | | | | (74 | ) | | NM | |
Other items, net | | | (112 | ) | | | (43 | ) | | | (69 | ) | | NM | |
| | | | | | | | | | | | | | | |
Earnings from continuing operations before provision for income taxes | | | 1,855 | | | | 2,580 | | | | (725 | ) | | (28 | ) |
Provision for income taxes | | | (605 | ) | | | (929 | ) | | | 324 | | | 35 | |
| | | | | | | | | | | | | | | |
Net earnings from continuing operations | | | 1,250 | | | | 1,651 | | | | (401 | ) | | (24 | ) |
Discontinued operations, net of tax | | | 18 | | | | 208 | | | | (190 | ) | | (91 | ) |
| | | | | | | | | | | | | | | |
Net earnings (Viacom and noncontrolling interests) | | | 1,268 | | | | 1,859 | | | | (591 | ) | | (32 | ) |
Net earnings attributable to noncontrolling interests | | | (17 | ) | | | (21 | ) | | | 4 | | | 19 | |
| | | | | | | | | | | | | | | |
Net earnings attributable to Viacom | | $ | 1,251 | | | $ | 1,838 | | | $ | (587 | ) | | (32 | )% |
| | | | | | | | | | | | | | | |
Diluted EPS from continuing operations | | $ | 1.97 | | | $ | 2.41 | | | $ | (0.44 | ) | | (18 | )% |
NM - Not Meaningful
Revenues
Revenues for the year ended December 31, 2008 increased $1.202 billion, or 9%, to $14.625 billion.Media Networkscontributed $655 million of the increase primarily due to an increase in ancillary revenues related to a full year of sales of theRock Band video game series and an increase in affiliate revenues due to rate and subscriber increases. Advertising revenue growth, particularly domestically, was affected by softness in the overall advertising market as well as ratings challenges at certain of our channels.Filmed Entertainmentcontributed $557 million of the increase principally driven by an increase in feature film revenues due to the mix of films released in 2008, as well as revenues recognized in connection with third-party distribution arrangements.
Expenses
Total expenses increased $1.615 billion, or 15%, to $12.102 billion for the year ended December 31, 2008.Media Networks contributed $974 million of the increase, including $312 million attributable to the restructuring and other charges described in the section entitled“Factors Affecting Comparability,” higher costs associated withRock Band, amortization of programming costs and selling, general and administrative costs.Filmed Entertainment contributed $634 million of the increase due to higher participation costs, principally related to Marvel’sIron Man, film amortization due to the mix of film releases, print and advertising expenses related to our third-party distribution arrangements, and the impact of the restructuring and other charges. Corporate expenses increased $15 million, or 7%.
45
Management’s Discussion and Analysis
of Results of Operations and Financial Condition
(continued)
Operating Income
Operating income decreased $413 million, or 14%, to $2.523 billion in 2008. In 2008, we recorded $454 million related to the restructuring and other charges. Media Networks recorded $77 million of restructuring costs in 2007. The net impact of these charges was $377 million, or 13-percentage points, on reported operating income. The remaining $36 million decrease reflects modest decreases at theMedia NetworksandFilmed Entertainment segments and a $15 million, or 7%, increase in corporate expenses, including increased litigation-related costs and $3 million related to the restructuring and other charges.
See the section entitled“Segment Results of Operations” for a more in depth discussion of the revenues, expenses and operating income for each of theMedia Networks andFilmed Entertainment segments.
Interest Expense, Net
Interest expense, net includes costs related to our debt, capital lease and other obligations. In 2008, interest expense, net increased $18 million from 2007 due to higher average debt outstanding partially offset by a lower average interest rate on our mix of obligations, which was driven by lower rates on our variable rate debt.
Gain on Sale of Equity Investment
In 2007, we sold MTV Networks’ investment in Russia for $191 million and recognized a pre-tax gain on the sale of $151 million.
Equity in Losses of Investee Companies
Equity in losses of investee companies was $74 million in 2008. The equity losses are primarily due to our share of the losses associated with our investments in Rhapsody America, which was acquired in the third quarter of 2007, and a digital satellite T.V. distributor in the Middle East.
Other Items, Net
Other items, net reflects expenses of $112 million in 2008, compared with $43 million in 2007. The $69 million increase in expenses is principally due to an increase of $92 million in net foreign exchange losses in 2008 due to the strengthening of the U.S. Dollar partially offset by $21 million of lower costs associated with our receivables securitization programs resulting from lower interest rates and a $9 million decrease in non-cash investment impairment charges in 2008.
Provision for Income Taxes
In 2008, the provision for income taxes was $605 million. The effective income tax rate was 32.6%, as compared to 36.0% in 2007. In 2008, the effective tax rate included a 2.8 percentage-point benefit related to the recognition of $55 million in discrete tax benefits as well as the impact of tax benefits on our restructuring and other charges. In 2007, the effective tax rate included a 0.6 percentage-point benefit related to the recognition of $15 million in discrete tax benefits. The discrete tax benefits in both years were principally due to reserve releases resulting from effectively settled audits. The reduction in the effective tax rate in 2008 was also favorably impacted by income tax benefits associated with a greater mix of earnings in international markets where tax rates are lower than the U.S. statutory tax rate.
Discontinued Operations, Net of Tax
In 2008, discontinued operations, net of tax principally reflects settlement adjustments to businesses previously sold. Discontinued operations in 2007 primarily reflects the $192 million gain on the sale of Famous Music in July 2007 and its net operating results prior to the sale.
46
Management’s Discussion and Analysis
of Results of Operations and Financial Condition
(continued)
Net Earnings (Viacom and Noncontrolling Interests)
In 2008, net earnings decreased $591 million, or 32%, principally due to the $401 million decrease in net earnings from continuing operations and the absence of the $192 million gain on the sale of Famous Music in 2007.
Net Earnings Attributable to Noncontrolling Interests
Net earnings attributable to noncontrolling interests, which represents ownership held by third parties of certain consolidated entities, was $17 million and $21 million in 2008 and 2007, respectively.
Net Earnings Attributable to Viacom
Net earnings attributable to Viacom decreased $587 million in 2008 principally due to the $591 million decrease in net earnings described above. Diluted EPS from continuing operations decreased $0.44 per diluted share from $2.41 in 2007 to $1.97 in 2008. Net earnings in 2008 included certain items that affected comparability, including an unfavorable impact of restructuring and other charges ($0.46 per diluted share charge), an unfavorable impact of the impairment of an investment ($0.04 per diluted share charge) and a favorable impact of discrete tax benefits ($0.09 per diluted share benefit). These items collectively resulted in a net benefit of $0.41 per diluted share. Net earnings in 2007 included an unfavorable impact of restructuring and other charges ($0.07 per diluted share charge), an unfavorable impact relating to the impairment of an investment ($0.04 per diluted share charge), a favorable impact of discrete tax benefits ($0.02 per diluted share benefit) and a favorable impact from the gain on sale of an equity investment ($0.14 per diluted share benefit). These items collectively resulted in a net charge of $0.05 per diluted share.
Segment Results of Operations
Media Networks
| | | | | | | | | | | | | |
| | | Year Ended December 31, | | Better/(Worse) | |
| (in millions) | | 2008 | | 2007 | | $ | | | % | |
Revenues by Component | | | | | | | | | | | | | |
Advertising | | $ | 4,722 | | $ | 4,690 | | $ | 32 | | | 1 | % |
Affiliate fees | | | 2,620 | | | 2,339 | | | 281 | | | 12 | |
Ancillary | | | 1,414 | | | 1,072 | | | 342 | | | 32 | |
| | | | | | | | | | | | | |
Total revenues by component | | $ | 8,756 | | $ | 8,101 | | $ | 655 | | | 8 | % |
| | | | | | | | | | | | | |
Expenses | | | | | | | | | | | | | |
Operating | | $ | 3,576 | | $ | 2,763 | | $ | (813 | ) | | (29 | )% |
Selling, general and administrative | | | 2,177 | | | 2,014 | | | (163 | ) | | (8 | ) |
Depreciation and amortization | | | 274 | | | 276 | | | 2 | | | 1 | |
| | | | | | | | | | | | | |
Total expenses | | | 6,027 | | | 5,053 | | | (974 | ) | | (19 | ) |
| | | | | | | | | | | | | |
Operating Income | | $ | 2,729 | | $ | 3,048 | | $ | (319 | ) | | (10 | )% |
| | | | | | | | | | | | | |
Revenues
Worldwide revenues increased $655 million, or 8%, in 2008 to $8.756 billion, primarily due to sales of theRock Bandvideo game series and rate and subscriber increases in affiliate fees. Domestic revenues increased to $7.292 billion in 2008 from $6.852 billion in 2007, an increase of $440 million, or 6%. International revenues increased to $1.464 billion in 2008 from $1.249 billion in 2007, an increase of $215 million, or 17%.
Advertising
In 2008, worldwide advertising revenues increased $32 million, or 1%, to $4.722 billion. Domestic advertising revenues decreased $3 million, essentially flat year-over-year. During 2008, we experienced softness in the overall advertising market, particularly in the second half of the year, as well as ratings challenges at certain
47
Management’s Discussion and Analysis
of Results of Operations and Financial Condition
(continued)
channels. International advertising revenues increased $35 million, or 6%, reflecting growth across Europe. Foreign exchange and the contribution of our India operations to a joint venture negatively impacted reported international growth by 1-percentage point and 3-percentage points, respectively.
Affiliate Fees
Worldwide affiliate fees increased $281 million, or 12%, to $2.62 billion in 2008. Domestic affiliate growth increased 12% principally due to rate and subscriber increases across core channels, an increase in subscribers for digital channels and increased mobile affiliate revenues. International affiliate fees increased 11% principally driven by new contracts and subscriber growth across Europe and Latin America, partially offset by rate and subscriber decreases in the U.K.
Ancillary
Worldwide ancillary revenues increased $342 million, or 32%, to $1.414 billion in 2008. Domestic ancillary revenues were up 26%, primarily driven by a full year of sales ofRock Band,including the domestic release ofRock Band 2, partially offset by revenue declines from home entertainment, consumer products andGuitar Hero royalties. International ancillary revenues increased 50% principally due to international sales ofRock Band and television licensing fees.
Expenses
Media Networkssegment expenses increased $974 million, or 19%, to $6.027 billion in 2008. Included in 2008 expenses is $389 million related to the restructuring and other charges as further described in the section entitled “Factors Affecting Comparability”. Expenses in 2007 included restructuring charges of $77 million. The net impact of restructuring and other charges is a $312 million increase in expenses, or 6 percentage points. The remaining increase of $662 million was primarily due toRock Band’s higher manufacturing costs, software amortization, marketing costs, royalty costs and participations, as well as amortization of programming costs and higher employee compensation expense.
Operating
Operating expenses increased $813 million, or 29%, to $3.576 billion in 2008. Production and programming costs increased $453 million, or 21%, primarily related to acquired and original programming amortization. 2008 production and programming costs included $286 million, or 13 percentage points, attributable to the restructuring and other charges. The remaining $167 million, or 8 percentage points, reflects increased programming investment, principally in acquired programming. Distribution and other expenses increased $360 million, principally for manufacturing costs, software amortization, and royalty and participations costs related toRock Band, including costs associated with the launch ofRock Band 2.
Selling, General and Administrative
SG&A increased $163 million, or 8%, to $2.177 billion in 2008, including $65 million of costs related to the restructuring and other charges. 2007 included $77 million of restructuring costs. The net impact of these charges was a $12 million favorable variance, which was more than offset by higher marketing costs, employee compensation expense, technology costs and research and professional services.
Depreciation and Amortization
Depreciation and amortization decreased $2 million in 2008. 2008 includes $38 million related to the restructuring and other charges, which was more than offset by the lower amortization of intangible assets, as certain subscriber agreements were fully amortized in 2007, and lower capital lease depreciation expense resulting from transponder lease expirations.
48
Management’s Discussion and Analysis
of Results of Operations and Financial Condition
(continued)
Operating Income
Operating income decreased $319 million, or 10%, to $2.729 billion in 2008, principally due to the net $312 million impact of restructuring and other charges. The remaining $7 million decrease reflects operating income from strong affiliate fee growth which was more than offset by the impact of the advertising revenue softness and losses associated withRock Band.
Filmed Entertainment
| | | | | | | | | | | | | |
| | | Year Ended December 31, | | Better/(Worse) | |
| | | 2008 | | 2007 | | $ | | | % | |
Revenues by Component | | | | | | | | | | | | | |
Theatrical | | $ | 1,714 | | $ | 1,466 | | $ | 248 | | | 17 | % |
Home entertainment | | | 2,724 | | | 2,493 | | | 231 | | | 9 | |
Television license fees | | | 1,333 | | | 1,294 | | | 39 | | | 3 | |
Ancillary | | | 262 | | | 223 | | | 39 | | | 17 | |
| | | | | | | | | | | | | |
Total revenues by component | | $ | 6,033 | | $ | 5,476 | | $ | 557 | | | 10 | % |
| | | | | | | | | | | | | |
Expenses | | | | | | | | | | | | | |
Operating | | $ | 5,377 | | $ | 4,826 | | $ | (551 | ) | | (11 | )% |
Selling, general & administrative | | | 522 | | | 448 | | | (74 | ) | | (17 | ) |
Depreciation & amortization | | | 108 | | | 99 | | | (9 | ) | | (9 | ) |
| | | | | | | | | | | | | |
Total expenses | | | 6,007 | | | 5,373 | | | (634 | ) | | (12 | ) |
| | | | | | | | | | | | | |
Operating Income | | $ | 26 | | $ | 103 | | $ | (77 | ) | | (75 | )% |
| | | | | | | | | | | | | |
Revenues
Worldwide revenues increased $557 million, or 10%, to $6.033 billion in 2008. The increase is primarily due to growth in theatrical revenues reflecting the mix of our 2008 film slate and in home entertainment third-party distribution revenues, including our CBS distribution agreement. Domestic revenues increased to $3.242 billion in 2008 from $3.045 billion in 2007, an increase of $197 million, or 6%. International revenues increased to $2.791 billion in 2008 from $2.431 billion in 2007, an increase of $360 million, or 15%.
Theatrical
Worldwide theatrical revenues increased $248 million, or 17%, to $1.714 billion for the year ended December 31, 2008. Domestic theatrical revenues increased $66 million primarily due to the mix of films released in 2008, includingIndiana Jones and the Kingdom of the Crystal Skull,Marvel’s Iron Man, and DreamWorks Animation’sKung Fu Panda andMadagascar 2: Escape to Africa,compared with DreamWorks Animation’sShrek the ThirdandBee Movieand our release ofTransformersin 2007.Iron Man was the first Marvel film that we distributed. International theatrical revenues increased $182 million also driven primarily by the mix of films released in 2008 compared with 2007.
Home Entertainment
Worldwide home entertainment revenues increased $231 million, or 9%, to $2.724 billion in 2008. Domestic home entertainment revenues increased $164 million due to higher third-party distribution revenues, including our CBS distribution agreement for which we recorded gross revenues and expenses beginning in 2008 as principal in the arrangement, and the release ofIron Man,for which there was no comparable title in 2007. These increases were partially offset by a decrease in revenues from other titles relative to 2007. Other titles released in 2008 includedKung Fu Panda andIndiana Jones and the Kingdom of the Crystal Skull, compared withTransformers andShrek the Third released in 2007. International home entertainment revenues increased $67 million, also driven primarily by the increase in third-party distribution revenues, including from the release of
49
Management’s Discussion and Analysis
of Results of Operations and Financial Condition
(continued)
Iron Man, partially offset by a decrease in revenues from other titles relative to 2007. The domestic DVD market softened, particularly in the second half of 2008.
Television License Fees
Worldwide television license fees increased $39 million, or 3%, to $1.333 billion in 2008. The increase was primarily due to an increase in international markets driven by pay television and syndicated television partially offset by decreases in domestic pay and network fees due to the mix of available titles.
Ancillary
Ancillary revenues for the year ended December 31, 2008 increased $39 million principally driven by higher digital revenues and licensing and merchandising revenues, primarily in connection withTransformers.
Expenses
Filmed Entertainment segment expenses increased $634 million, or 12%, to $6.007 billion for the year ended December 31, 2008. The increase in expenses primarily reflects higher feature film participation costs, principally due toIron Man, film amortization due to the mix of film releases, print and advertising expenses related to our third-party distribution arrangements, and the impact of the restructuring and other charges as further described in the section entitled “Factors Affecting Comparability”.
Operating
Year-over-year operating expenses are impacted by the mix of film releases during a particular year. Operating expenses increased $551 million, or 11%, to $5.377 billion in 2008 including $33 million, or 1 percentage point, related to the restructuring and other charges. The remaining increase is attributable to a $409 million, or 17%, increase in feature film costs, principally participations related toIron Man and film amortization, as well as a $109 million, or 4%, increase in distribution and other costs, principally related to third-party distribution arrangements.
Selling, General and Administrative
SG&A increased $74 million, or 17%, to $522 million in 2008 including $29 million, or 6 percentage points, of severance and other costs related to the restructuring and other charges. The remaining increase is principally due to higher employee compensation.
Depreciation and Amortization
Depreciation and amortization increased by $9 million in 2008 due to additional capital expenditures.
Operating Income
Operating income decreased $77 million, or 75%, to $26 million in 2008. This decline was driven by $62 million related to the restructuring and other charges and decreased home entertainment catalog performance.
LIQUIDITY AND CAPITAL RESOURCES
Liquidity
Sources and Uses of Cash
Our primary source of liquidity is cash provided through the operations of our businesses. These cash flows from operations, together with access to capital markets and the anticipated renewal of our existing $3.25 billion revolving credit facility due December 2010, provide us with adequate resources to fund our ongoing operations. Our principal uses of cash include the creation of new programming and film content, acquisitions of third-party
50
Management’s Discussion and Analysis
of Results of Operations and Financial Condition
(continued)
content, ongoing investments in our businesses, capital expenditures, commitments to equity affiliates and acquisitions of businesses. We also use cash for interest and tax payments and discretionary share repurchases. We manage our use of cash with a goal of maintaining total debt levels within rating agency guidelines to maintain an investment grade credit rating.
We have and may continue to access external financing from time to time depending on our cash requirements, assessments of current and anticipated market conditions and after-tax cost of capital. Our access to capital markets can be impacted by factors outside our control, including economic conditions; however, we believe that our strong cash flows and balance sheet, anticipated renewal of our credit facility and our credit rating will provide us with adequate access to funding given our expected cash needs. Any new borrowing cost would be affected by market conditions and short and long-term debt ratings assigned by independent rating agencies.
On October 15, 2009, Moody’s Investor Service upgraded our long-term and short-term ratings to Baa2 and P-2, respectively. The table below summarizes our credit ratings as of December 31, 2009:
| | | | | | |
| Credit Ratings | | Long-term | | Short-term | | Outlook |
|
Moody’s Investors Service | | Baa2 | | P-2 | | Stable |
Standard & Poors | | BBB | | A-2 | | Stable |
Fitch Ratings | | BBB | | F-2 | | Stable |
Cash Flows
Cash and cash equivalents decreased by $494 million for the year ended December 31, 2009, and decreased $128 million for the year ended December 31, 2008. The net change in cash and cash equivalents was attributable to the following:
| | | | | | | | | | | | |
| Cash Flows | | Year Ended December 31, | |
| (in millions) | | 2009 | | | 2008 | | | 2007 | |
Cash provided by operations | | $ | 1,151 | | | $ | 2,036 | | | $ | 1,776 | |
Net cash flow (used in) provided by investing activities | | | (274 | ) | | | (571 | ) | | | 248 | |
Net cash flow used in financing activities | | | (1,388 | ) | | | (1,555 | ) | | | (1,831 | ) |
Effect of exchange rates on cash and cash equivalents | | | 17 | | | | (38 | ) | | | 21 | |
| | | | | | | | | | | | |
Net change in cash and cash equivalents | | $ | (494 | ) | | $ | (128 | ) | | $ | 214 | |
| | | | | | | | | | | | |
Operating Activities
Cash provided by operations was $1.151 billion for the year ended December 31, 2009, a decrease of $885 million compared with 2008. The decrease is primarily due to a $950 million reduction in securitized receivables, increased pension contributions, severance payments and payment of a premium on our third quarter debt extinguishment, partially offset by lower payments for production spending, income taxes and interest.
TheMedia Networks segment consistently generates a significant percentage of our cash flow from operating activities. Advertising time is generally purchased by large media buying agencies and our affiliate fees are principally earned from cable and satellite television operators. TheFilmed Entertainment segment’s operational results and ability to generate cash flow from operations substantially depend on the number and timing of films in development and production, the level and timing of print and advertising costs and the public’s response to our theatrical film and home entertainment releases. Our cash flow from operations tends to fluctuate seasonally as a result of the timing of cash payments and collections, typically being highest in the fourth quarter of the calendar year.
51
Management’s Discussion and Analysis
of Results of Operations and Financial Condition
(continued)
Cash provided by operations was $2.036 billion for the year ended December 31, 2008, an increase of $260 million compared with 2007. The increase is primarily due to increased receivables collections and decreased income tax payments of $85 million, partially offset by higher participation payments associated with our 2008 film slate and higher spending on programming.
Investing Activities
Cash used in investing activities was $274 million for the year ended December 31, 2009, compared with $571 million in 2008. The decrease is primarily due to lower spending on acquisitions and investments in the current year, as well as lower spending on capital expenditures. In 2009, cash used in investing activities included $133 million related to acquisitions and investments and $141 million in capital expenditures. In 2008, cash used in investing activities included $288 million of capital expenditures, principally related to improvements to certain new and existing facilities (including approximately $100 million related to New York real estate facilities), and $296 million related to acquisitions and investments, which includes a $150 million earn-out payment related to our 2006 acquisition of Harmonix.
In general, our segments require relatively low levels of capital expenditures in relation to our annual cash flow from operations which contributes to our ability to generate cash flow for future investment in our content and business operations, which we expect to be able to maintain over time.
Cash used in investing activities was $571 million for the year ended December 31, 2008 compared with cash from investing activities of $248 million in 2007. In 2007, cash from investing activities included $191 million received from the sale of MTV Networks’ investments in Russia and $352 million from the sale of Famous Music, partially offset by $237 million in capital expenditures and $70 million related to acquisitions and investments.
Financing Activities
Cash used in financing activities was $1.388 billion for the year ended December 31, 2009. The net outflow is primarily driven by payments related to the maturity of our $750 million floating rate senior notes which came due in the second quarter of 2009 and a decrease in amounts outstanding under our revolving credit facility. In the third quarter of 2009, we issued a total of $1.4 billion of senior notes and used the proceeds to repurchase $1.307 billion outstanding principal of our 5.75% Senior Notes due 2011. We did not repurchase any shares under our stock repurchase program during 2009.
Cash used in financing activities was $1.555 billion for the year ended December 31, 2008, compared with $1.831 billion in 2007. The cash utilized during 2008 was principally driven by $1.266 billion of share repurchases and net payments of $280 million on the outstanding balances related to our credit facility, commercial paper and other debt obligations.
Capital Resources
Capital Structure and Debt
At December 31, 2009, total debt was $6.773 billion, a decrease of $1.229 billion, or 15%, from $8.002 billion at December 31, 2008. The decrease in debt reflects the cash flow generated by our operations.
| | | | | | |
| Debt | | December 31, |
| (in millions) | | 2009 | | 2008 |
Senior notes and debentures | | $ | 6,319 | | $ | 6,970 |
Credit facility | | | - | | | 650 |
Commercial paper | | | 16 | | | - |
Capital leases and other obligations | | | 438 | | | 382 |
| | | | | | |
Total debt | | $ | 6,773 | | $ | 8,002 |
| | | | | | |
52
Management’s Discussion and Analysis
of Results of Operations and Financial Condition
(continued)
Senior Notes and Debentures
In the third quarter of 2009, we took advantage of a decrease in interest rates available in the capital markets to extend our debt maturities. We issued a total of $1.4 billion of senior notes with maturities of five, six and ten years and used the proceeds to repurchase a substantial portion of our shorter term 5.75% Senior Notes due 2011 as further described below.
In August 2009, we issued $600 million aggregate principal amount of 4.375% Senior Notes due 2014 at a price equal to 99.291% of the principal amount, and $250 million aggregate principal amount of 5.625% Senior Notes due 2019 at a price equal to 99.247% of the principal amount. In September 2009, we issued $250 million aggregate principal amount of 4.250% Senior Notes due 2015 at a price equal to 99.814% of the principal amount, and an additional $300 million aggregate principal amount of our 5.625% Senior Notes due 2019 at a price equal to 101.938% of the principal amount.
We used the net cash proceeds from these offerings of $1.393 billion to conduct a cash tender offer to repurchase any and all of the aggregate principal of our $1.5 billion 5.75% Senior Notes due 2011 at a purchase price of $1,061.25 per $1,000 of principal. Our repurchase of $1.307 billion of principal pursuant to the tender offer resulted in a pre-tax extinguishment loss of $84 million. At December 31, 2009, $193 million of principal remains outstanding on the 5.75% Senior Notes due 2011.
In October 2007, we sold $500 million aggregate principal amount of 6.125% Senior Notes due 2017 at a price equal to 99.286% of the principal amount, and $250 million aggregate principal amount of 6.750% Senior Debentures due 2037 at a price equal to 99.275% of the principal amount. We used the net cash proceeds of $740 million to repay amounts outstanding under our revolving credit facility and our commercial paper program.
Our outstanding senior notes and debentures provide for certain covenant packages typical for an investment grade company. There is one acceleration trigger for certain of the senior notes and debentures in the event of a change in control under certain specified circumstances coupled with ratings downgrades due to the change in control. At December 31, 2009 and 2008, the total unamortized net discount related to the fixed rate senior notes and debentures was $24 million and $30 million, respectively.
Credit Facility
At December 31, 2009 and 2008, we had a single $3.25 billion revolving facility due December 2010, which we intend to renew. There are no amounts outstanding under the credit facility at December 31, 2009. The primary purpose of the facility is to fund short-term liquidity needs and to support commercial paper borrowings. Borrowing rates under the revolving facility are determined at the time of each borrowing and are based generally on LIBOR plus a margin based on our senior unsecured credit rating. A facility fee is paid based on the total amount of the commitments. In addition, we may borrow in certain foreign currencies up to specified limits under the revolving facility. The credit facility contains typical covenants for an investment grade company. The one principal financial covenant requires our interest coverage, calculated as operating income before depreciation and amortization divided by interest expense (both as defined by the credit agreement), for the most recent four consecutive fiscal quarters to be at least 3.0x, which we met at December 31, 2009. As of December 31, 2009, our interest coverage was approximately 8.0x. At December 31, 2009, $3.205 billion was available under the revolving credit facility, after deducting commercial paper borrowings and letters of credit.
Commercial Paper
At December 31, 2009, the outstanding commercial paper of $16 million had a weighted average interest rate of 0.22% and a weighted average maturity of less than 30 days. No amount was outstanding as of December 31, 2008.
53
Management’s Discussion and Analysis
of Results of Operations and Financial Condition
(continued)
Amounts classified in the current portion of debt consist of commercial paper and the portion of capital leases and other obligations payable in the next twelve months.
Our scheduled maturities of debt at face value, excluding capital leases, outstanding at December 31, 2009 were as follows:
| | | | | | | | | | | | | | | | | | |
| Maturities of Debt Excluding Capital Leases | | | | | | | | | | | | 2015 - thereafter |
| (in millions) | | 2010 | | 2011 | | 2012 | | 2013 | | 2014 | |
Debt | | $ | 81 | | $ | 240 | | $ | - | | $ | 81 | | $ | 600 | | $ | 5,550 |
We anticipate that future debt maturities will be funded with cash and cash equivalents, cash flows from operating activities and future access to capital markets, including the anticipated renewal of our existing credit facility maturing in December 2010. There can be no assurance that we will be able to access capital markets on terms and conditions that will be acceptable to us.
Securitization Facilities
We securitize certain receivables because historically the securitization of certain assets has been a source of lower cost funding compared to our other borrowings and diversifies our obligations among different markets and investors. We have been able to realize cost efficiencies under these arrangements since the assets securing the financing are generally held by a legally separate, wholly owned, bankruptcy-remote special purpose entity (“SPE”) that provides investors with direct security in the assets. In the future, the cost of funding under these arrangements may increase due to the adverse conditions in the worldwide financial markets and there is no guarantee that our existing arrangements will be renewed at the existing terms or level of funding.
In general, we sell, on a revolving nonrecourse basis, a percentage ownership interest in certain of our accounts receivable (the “Pooled Receivables”), which are short term in nature, through SPEs to third-party conduits sponsored by financial institutions. As consideration for Pooled Receivables sold through the securitization facilities, we receive cash and retained interests. The retained interests are included inReceivables, net on the accompanying Consolidated Balance Sheets. The retained interests may become uncollectible. In addition, we are the servicer of the receivables on behalf of the SPEs, for which we are paid a fee. The servicing fee has not been material to any period presented. The terms of the revolving securitization arrangements, which are subject to renewal on an annual basis, require that the Pooled Receivables meet certain performance ratios. At December 31, 2009, we were in compliance with the required ratios under the receivable securitization programs.
The level of securitized receivables sold to third parties was $0 and $950 million at December 31, 2009 and December 31, 2008, respectively. The capacity of our receivable securitization programs at December 31, 2009 was $775 million. We plan to use the programs from time to time to supplement working capital requirements as needed.
Film Financing Arrangements
Historically we have entered into film financing arrangements that involve the sale of a partial copyright interest in a film to third-party investors. Since the investors typically have the risks and rewards of ownership proportionate to their ownership in the film, we generally record the amounts received for the sale of copyright interest as a reduction of the cost of the film and related cash flows are reflected in net cash flow from operating activities. We also have agreements with third parties, including other studios, to co-finance certain of our motion pictures.
Stock Repurchase Program
Since December 31, 2008, we have not purchased any shares under our $4.0 billion stock repurchase program, but may resume purchases in the future based on a variety of factors. At December 31, 2009, there is $1.275 billion available to make purchases under the program.
54
Management’s Discussion and Analysis
of Results of Operations and Financial Condition
(continued)
Commitments and Contingencies
Our commitments primarily consist of programming and talent commitments, operating lease arrangements, purchase obligations for goods and services and future funding commitments related to equity investees, including a put option with respect to DW Funding. These arrangements result from our normal course of business and represent obligations that may be payable over several years. Additionally, we are subject to a redeemable put option, payable in a foreign currency, with respect to an international subsidiary which expires in 2011 and is classified asRedeemable noncontrolling interest in the Consolidated Balance Sheets. See Notes 1 and 17 to our Consolidated Financial Statements for additional information related to the redeemable noncontrolling interest.
In the course of our business, we provide and receive the benefit of indemnities that are intended to allocate certain risks associated with business transactions. Similarly, we may remain contingently liable for various obligations of a business that has been divested in the event that a third party does not live up to its obligations under an indemnification agreement. Further, we may from time to time agree to pay additional consideration to the sellers of a business depending on the performance of the business during a period following the closing.
Guarantees
We guarantee debt on certain of our unconsolidated investments, including principal and interest, of approximately $214 million at December 31, 2009 and have accrued a liability of $55 million, with respect to such exposures. Our guarantees principally relate to our investment in DW Funding.
DW Funding
At December 31, 2009, as fully described in Note 3 to our Consolidated Financial Statements, we held a 49% minority equity interest in DW Funding, which owns the DreamWorks live-action library, and had certain rights and obligations to reacquire the library. In February 2010, we acquired the remaining 51% of the equity in DW Funding and now own 100% of the live-action library. The principal impact on our Consolidated Financial Statements is an increase in debt of approximately $400 million and a corresponding increase in other net assets, principally film inventory.
Leases and Other
Under the terms of our separation from the former Viacom Inc. (“Former Viacom”), which is now known as CBS Corporation, we and Blockbuster have agreed to indemnify Former Viacom with respect to any amount paid under certain guarantees related to lease commitments of Blockbuster. Additionally, in connection with the separation, we have agreed to indemnify Former Viacom with respect to certain theater lease obligations associated with Famous Players, which Former Viacom sold in 2005.
As a result of lease modifications by Blockbuster in the third quarter of 2009, our indemnification obligation related to Blockbuster was substantially reduced, resulting in the release of $32 million ($20 million, net of tax) of accrued contingent liability. At December 31, 2009, our aggregate guarantee related to lease commitments of divested businesses, primarily Famous Players, was $813 million with a recorded liability of $217 million, reflecting the estimated fair value of the guarantees at their inception. Based on our consideration of financial information available to us, the lessees’ performance in meeting their lease obligations and the underlying economic factors impacting the lessees’ business models, we believe our accrual is sufficient to meet any future obligations.
Finally, we have indemnification obligations with respect to letters of credit and surety bonds primarily used as security against non-performance in the normal course of business. The outstanding letters of credit and surety bonds at December 31, 2009 were $77 million and are not recorded on the balance sheet.
55
Management’s Discussion and Analysis
of Results of Operations and Financial Condition
(continued)
Contingent Consideration on Acquisitions
The Harmonix acquisition agreement provided that to the extent financial results exceeded specific contractual targets against a defined gross profit metric for the calendar years 2007 and 2008, former Harmonix shareholders are eligible for incremental earn-out payments. In 2008, we paid $150 million, subject to adjustment, under this earn-out agreement related to 2007 performance. At December 31, 2009, we believe that we are entitled to a refund of a substantial portion of amounts previously paid, but the final amount of the earn-out has not yet been determined.
Legal Matters
See the section entitled“Other Matters.”
Contractual Obligations
Our contractual obligations include amounts reflected on our balance sheet, as well as off-balance sheet arrangements. At December 31, 2009, our significant contractual obligations, including payments due by period, were as follows:
| | | | | | | | | | | | | | | | | | | | | |
| Contractual Obligations | | | | | | | | | | | | | | 2015 - thereafter |
| (in millions) | | Total | | 2010 | | 2011 | | 2012 | | 2013 | | 2014 | |
Off-balance Sheet Arrangements | | | | | | | | | | | | | | | | | | | | | |
Programming and talent commitments (1) | | $ | 1,567 | | $ | 350 | | $ | 345 | | $ | 242 | | $ | 221 | | $ | 199 | | $ | 210 |
Operating leases (2) | | $ | 1,094 | | $ | 190 | | $ | 157 | | $ | 146 | | $ | 138 | | $ | 127 | | $ | 336 |
Purchase obligations (3) | | $ | 584 | | $ | 372 | | $ | 134 | | $ | 36 | | $ | 25 | | $ | 13 | | $ | 4 |
| | | | | | | |
On-Balance Sheet Arrangements | | | | | | | | | | | | | | | | | | | | | |
Capital lease obligations (4) | | $ | 325 | | $ | 55 | | $ | 46 | | $ | 34 | | $ | 29 | | $ | 27 | | $ | 134 |
Debt | | $ | 6,552 | | $ | 81 | | $ | 240 | | $ | - | | $ | 81 | | $ | 600 | | $ | 5,550 |
Interest payments | | $ | 7,278 | | $ | 437 | | $ | 394 | | $ | 351 | | $ | 351 | | $ | 351 | | $ | 5,394 |
Other long-term obligations (5) | | $ | 2,819 | | $ | 1,511 | | $ | 540 | | $ | 403 | | $ | 281 | | $ | 84 | | $ | - |
| (1) | Programming and talent commitments include $1.287 billion relating to media networks programming and $280 million for talent contracts. |
| (2) | Includes long-term non-cancelable operating lease commitments for office space, equipment, transponders, studio facilities and vehicles. |
| (3) | Purchase obligations include agreements to purchase goods or services that are enforceable and legally binding and that specify all significant terms, including open purchase orders. |
| (4) | Includes capital leases for satellite transponders. |
| (5) | Other long-term obligations principally consist of participations, residuals and programming obligations for content that is available for airing. |
| | Note: Not included in the amounts above are payments which may result from our unfunded defined benefit pension and other postretirement benefits of $257 million, unrecognized tax benefits of $378 million, including interest and penalties, $177 million of funding commitments to joint ventures, interest payments to be made under our credit facility, which expires in 2010, debt guarantees of $214 million, $168 million of redeemable noncontrolling interest and lease guarantees of $813 million. The amount and timing of payments with respect to these items are subject to a number of uncertainties such that we are unable to make sufficiently reliable estimations of future payments. We do expect to make contributions of approximately $25 million in 2010 to our pension plans. |
MARKET RISK
We are exposed to market risk related to foreign currency exchange rates and interest rates. We use or expect to use derivative financial instruments to modify exposure to risks from fluctuations in foreign currency exchange rates and interest rates. In accordance with our policy, we do not use derivative instruments unless there is an underlying exposure, and we do not hold or enter into financial instruments for speculative trading purposes.
Foreign Exchange Risk
We conduct business in various countries outside the United States, resulting in exposure to movements in foreign exchange rates when translating from the foreign local currency to the U.S. Dollar. In 2009 we recognized a foreign exchange loss of $27 million compared to a foreign exchange loss of $50 million in 2008. The decrease in foreign exchange losses in 2009 is primarily due to the weakening of the U.S. Dollar against foreign currencies we operate in. In 2007, we incurred a foreign exchange gain of $42 million.
56
Management’s Discussion and Analysis
of Results of Operations and Financial Condition
(continued)
In order to economically hedge anticipated cash flows and foreign currency balances in such currencies as the British Pound, the Australian Dollar, the Euro, the Japanese Yen, and the Canadian Dollar, foreign currency forward contracts are used. The change in fair value of non-designated contracts is included in current period earnings as part ofOther items, net. Additionally, from time to time we enter into forward contracts to hedge future production costs or programming obligations or hedge the foreign currency exposure of a net investment in a foreign operation. We manage the use of foreign exchange derivatives centrally.
The notional value of all foreign exchange contracts was $300 million and $3 million at December 31, 2009 and 2008, respectively. In 2009, $233 million related to net investments in foreign operations, $51 million related to expected foreign currency net cash flows and $16 million related to programming obligations. In 2008, these contracts related to the hedging of future production costs.
Interest Rate Risk
A portion of our interest expense is exposed to movements in short-term rates. Interest rate hedges may be used to modify this exposure. As of December 31, 2009 and 2008, there were no interest rate hedges outstanding. Since the majority of our debt is fixed rate, we do not expect that a 1% increase or decrease in the level of interest rates would have a material impact on our Consolidated Financial Statements.
Viacom has issued senior notes and debentures that, at December 31, 2009, had an outstanding balance of $6.319 billion and an estimated fair value of $6.654 billion. A 1% increase or decrease in the level of interest rates, respectively, would decrease or increase the fair value of the senior notes and debentures by approximately $524 million and $613 million.
Credit Risk
We continually monitor our positions with, and credit quality of, our customers and the financial institutions which are counterparties to our financial instrument agreements. We are exposed to credit loss in the event of nonpayment by our customers and nonperformance by the counterparties to our financial instrument agreements. However, we do not anticipate nonperformance by the counterparties to our financial instrument agreements and we believe our allowance for doubtful accounts is sufficient to cover any anticipated nonpayment by our customers.
CRITICAL ACCOUNTING POLICIES AND ESTIMATES
The preparation of our financial statements in conformity with accounting principles generally accepted in the United States requires management to make estimates, judgments and assumptions that affect the amounts reported in the consolidated financial statements and accompanying notes. On an ongoing basis, we evaluate our estimates, which are based on historical experience and on various other assumptions that we believe are reasonable under the circumstances. The result of these evaluations forms the basis for making judgments about the carrying values of assets and liabilities and the reported amount of expenses that are not readily apparent from other sources. Actual results may differ from these estimates under different assumptions. An appreciation of our critical accounting policies, those that are considered by management to require significant judgment and use of estimates and that could have a significant impact on our financial statements, is necessary to understand our financial results. Unless otherwise noted, we applied our critical accounting policies and estimation methods consistently in all material respects and for all periods presented, and have discussed such policies with our Audit Committee.
57
Management’s Discussion and Analysis
of Results of Operations and Financial Condition
(continued)
Film Accounting
Revenue Recognition
Revenue we earn in connection with the exhibition of feature films by ourFilmed Entertainment segment is recognized in accordance with the accounting guidance for producers or distributors of films. OurFilmed Entertainment segment principally earns revenue from the exhibition of feature film content based upon theatrical exhibition, home entertainment and various television markets (e.g., network, pay, syndication, basic cable). We recognize revenue from theatrical distribution of motion pictures upon exhibition. We recognize revenue from home entertainment product sales, net of anticipated returns, including rebates and other incentives, upon the later of delivery or the date that these products are made widely available for sale by retailers. We recognize revenue from the licensing of feature films and original programming for exhibition in television markets upon availability for airing by the licensee. We recognize revenue for video-on-demand and similar pay-per-view arrangements as the feature films are exhibited based on end-customer purchases as reported by the distributor.
Original Production and Film Costs
We capitalize original production, including original programming and feature film costs, on a title-specific basis, asInventory, net in the Consolidated Balance Sheets. We use an individual-forecast-computation method to amortize the costs over the applicable title’s life cycle based upon the ratio of current period to estimated remaining total gross revenues (“ultimate revenues”) for each title. We expense advertising costs as they are incurred and expense manufacturing costs, such as DVD manufacturing costs, on a unit-specific basis when we recognize the related revenue.
Our estimate of ultimate revenues for feature films includes revenues from all sources that are estimated to be earned within ten years from the date of a film’s initial theatrical release. For acquired film libraries, our estimate of ultimate revenues is for a period within 20 years from the date of acquisition. Prior to the release of a feature film and throughout its life, we estimate the ultimate revenues based on the historical performance of similar content, as well as incorporating factors of the content itself, including, but not limited to, the expected number of theaters and markets in which the original content will be released, the genre of the original content and the past box office performance of the lead actors and actresses. We believe the most sensitive factor affecting our estimate of ultimate revenues for films intended for theatrical release is domestic theatrical exhibition, as subsequent markets have historically exhibited a high correlation to domestic theatrical performance. Upon a film’s release and determination of domestic theatrical performance, our estimates of revenues from succeeding windows and markets are revised based on historical relationships and an analysis of current market trends. The most sensitive factor affecting our estimates for films subsequent to their initial release is the extent of home entertainment sales achieved. In addition to theatrical performance, home entertainment sales vary based on a variety of factors including demand for our titles, the volume and quality of competing home entertainment products, marketing and promotional strategies, as well as economic conditions.
For original programming, capitalized program costs are amortized over the projected useful life of the programming, depending on genre and historical experience, beginning with the month of initial exhibition. The most sensitive factor affecting ultimate revenues is the program’s rating. Program ratings, which are an indication of audience acceptance, directly impact the level of advertising revenues we will be able to generate during the airing of the programming. Poor ratings may result in abandonment of a program, which would require the immediate write-off of any unamortized production costs.
The estimate of ultimate revenues impacts the timing of original production cost amortization. Upon a film’s initial release we update our estimate of ultimate revenues based on expected future and actual results. We also review and revise estimates of ultimate revenue and participation costs as of each reporting date to reflect the
58
Management’s Discussion and Analysis
of Results of Operations and Financial Condition
(continued)
most current available information. If estimates for a film are revised, the difference between amortization expense determined using the new estimate and any amounts previously expensed during that fiscal year are charged or credited to our Consolidated Statements of Earnings in the quarter in which the estimates are revised.
If we believe that the release of our content will not or has not been favorably received, then we would assess whether the fair value of such content is less than the unamortized portion of its capitalized costs and, if need be, recognize an impairment charge for the amount by which the unamortized capitalized costs exceed the fair value. We utilize the individual-film-forecast-computation method (adjusted to incorporate revenue and related costs, including future exploitation costs, if any, expected to occur in periods beyond 10 years from the date of the film’s initial release) to develop the cash flows which are subsequently discounted to compute the fair value of a film at each reporting period. The discount rate utilized takes into account the time value of money as well as a risk premium. The risk premium reflects the uncertainties of realizing the expected cash flows of a film title which is impacted by a film title’s position within its product life cycle.
Acquired Programming Rights
We report an asset and liability for the rights acquired and obligations incurred at the commencement of the licensing period when the cost of the programming is known or reasonably determinable, the program material has been accepted and the programming is available for airing. We record the transaction using the gross liability provision. The asset is amortized to operating expenses over the license period or projected useful life of the programming, if shorter, commencing upon availability. Determining factors used in estimating the useful life of programming includes the expected number of future airings, which may differ from the contracted number of airings, the length of the license period and expected future revenues to be generated from the programming. The cost basis of acquired programming is the capitalized cost of each program and is equal to the cost of the programming pursuant to the license agreement less the cumulative amortization recorded for the program. Capitalized costs of rights to program materials are reported in our Consolidated Balance Sheets at the lower of unamortized cost or estimated net realizable value. We evaluate net realizable value of acquired rights programming quarterly on a daypart basis. A daypart is defined as an aggregation of programs broadcast during a particular time of day or an aggregation of programs of a similar type. We aggregate similar programming based on the specific demographic targeted by each respective program service. Net realizable value is determined by estimating advertising revenues to be derived from the future airing of the programming within the daypart as well as an allocation of affiliate fee revenue to programming. An impairment charge may be necessary if our estimates of future cash flows of similar programming are insufficient or if programming is abandoned.
Revenue Recognition
Gross versus Net Revenue Recognition
We earn and recognize revenues where we act as distributor on behalf of third parties. In such cases, determining whether revenue should be reported on a gross or net basis is based on management’s assessment of whether we act as the principal or agent in the transaction. To the extent we act as the principal in a transaction, we report revenues on a gross basis. Determining whether we act as principal or agent in a transaction involves judgment and is based on an evaluation of whether we have the substantial risks and rewards of ownership under the terms of an arrangement.
Our most significant arrangements are in connection with certain exclusive distribution rights to and home video fulfillment services for the animated feature films produced by DreamWorks Animation SKG, Inc. and the distribution agreements with MVL Productions LLC, DW Funding LLC and CBS Corporation. Under the terms of these agreements, we generally are responsible for all out-of-pocket costs, primarily comprised of distribution and marketing costs. For the provision of distribution services, we generally retain a fee based upon a percentage of gross receipts and recover expended distribution and marketing costs on a title-by-title basis prior to any
59
Management’s Discussion and Analysis
of Results of Operations and Financial Condition
(continued)
participation payments to the contracting parties of the films, except as pertains to certain contractually agreed upon advance payments. As primary obligor, revenue and related distribution and marketing costs for these arrangements are presented on a gross basis. Prior to January 1, 2008, we were not primary obligor under the distribution agreement with CBS Corporation then in effect, and therefore revenues were accounted for on a net basis.
Multiple Element Arrangements
The accounting for multiple element arrangements related to our video game products that include hardware, software and service components requires significant judgment. Where a video game provides limited online features at no additional cost to the consumer, we generally consider such features to be incidental to the overall product offering and an inconsequential deliverable. Accordingly, we do not defer any revenue related to products containing these limited online features. In instances where online features or additional functionality is considered a substantive deliverable in addition to the software product, we recognize revenue ratably over an estimated service period. This evaluation is performed for each software product that is released.
The accounting for other multiple element arrangements, such as bundled advertising services, requires significant judgment. We consider revenue realized or realizable and earned when it has persuasive evidence of an arrangement, delivery has occurred, the sales price is fixed and determinable, and collectibility is reasonably assured. Determining whether some or all of these criteria have been met involves assumptions and judgments that can have a significant impact on the timing and amount of revenue we report.
Sales Returns, Allowances and Uncollectible Accounts
Revenue allowances are recorded to adjust amounts originally invoiced to the estimated net realizable value in accordance with the accounting guidance related to revenue recognition when right of return exists. Upon the sale of home entertainment, video game and other products to wholesalers and retailers, we record a reduction of revenue for the impact of estimated future returns, rebates and other incentives (“estimated returns”). In determining estimated returns, we consider numerous sources of qualitative and quantitative evidence including forecasted sales data, customers’ rights of return, units shipped and units remaining at retail, historical return rates for similar product, current economic trends, competitive environment, promotions and sales strategies.
Forecasted sales data is determined by comparing a particular release to product that has similar characteristics where applicable, such as franchise, genre, box office levels and release patterns, using regression analysis, decay rates and other tools. Based on the results of this analysis and the sales strategies to be used for the release, we reserve an appropriate percentage of each dollar of product revenue on a title taking into consideration the qualitative and quantitative factors described above. Forecasted sales data is reviewed and updated throughout each quarter, and, with respect to home entertainment product, is consistent with the projections of ultimate revenues used in applying the individual-forecast-computation method to amortize our film costs. Actual sell-through data is reviewed as it becomes available against the forecasted sales data to ensure that estimates continue to be consistent with actual sales performance.
Our estimate of future returns affects reported revenue and operating income. If we underestimate the impact of future returns in a particular period, then we may record less revenue in later periods when returns exceed the estimated amounts. If we overestimate the impact of future returns in a particular period, then we may record additional revenue in later periods when returns are less than estimated. An incremental change of 1% in our estimated sales returns rate (i.e., provisions for returns divided by gross sales of related product) for home entertainment and video game products would have a $38 million impact on our total revenue in 2009. In computing our sales returns rate, gross sales include home entertainment revenues of ourFilmed Entertainment segment as well as home entertainment and video game revenues of ourMedia Networks segment. Home
60
Management’s Discussion and Analysis
of Results of Operations and Financial Condition
(continued)
entertainment and video game revenues of ourMedia Networks segment are included withinMedia Networks’ ancillary revenues.
We also continually evaluate accounts receivable and establish judgments as to their ultimate collectibility. Judgments and estimates involved include an analysis of specific risks on a customer-by-customer basis for larger accounts and an analysis of actual historical write-off experience in conjunction with the length of time the receivables are past due. Using this information, management reserves an amount that is estimated to be uncollectible. An incremental change of 1% in our allowance for uncollectible accounts for trade accounts receivables would have a $30 million impact on our operating results for the year ended December 31, 2009.
Provision for Income Taxes
On January 1, 2007, we adopted the revised guidance for accounting for uncertainty in income taxes. See Notes 1 and 14 to our 2009 Consolidated Financial Statements.
As a global entertainment content company, we are subject to income taxes in the United States and foreign jurisdictions where we have operations. Significant judgment is required in determining our annual provision for income taxes and evaluating our income tax positions. Our tax rates are affected by many factors, including our global mix of earnings, legislation, acquisitions and dispositions, as well as the tax characteristics of our income. In determining our income tax provisions on a jurisdiction basis, we are required to make judgments on the need to record deferred tax assets and liabilities, including the realizability of deferred tax assets. A valuation allowance for deferred tax assets is established if it is more likely than not that a deferred tax asset will not be realized. In evaluating uncertain tax positions, we make determinations of the application of complex tax rules, regulations and practices. We evaluate our uncertain tax positions quarterly based on many factors including, but not limited to, new facts, changes in tax law and information received from regulators. A change in any one of these factors could change our evaluation of an existing uncertain tax position, resulting in the recognition of an additional charge or benefit to our income tax provision in the period. As such, going forward, our effective tax rate may fluctuate. Additionally, our income tax returns are routinely audited and settlements of issues raised in these audits sometimes affect our tax provisions. The resolution of audit issues and income tax positions taken may take extended periods of time due to the length of examinations by tax authorities and the possible extension of statutes of limitations.
During the year ended December 31, 2009, we recognized net discrete tax benefits of $124 million. The net discrete tax benefits reflect both the release of tax reserves in respect of certain effectively settled tax positions as well as the recognition of certain previously unrecognized capital losses from international operations. A 1% change in our effective rate, excluding discrete items, would result in additional income tax expense of approximately $23 million for the year ended December 31, 2009.
Undistributed earnings of our foreign subsidiaries are permanently reinvested outside the United States and, therefore, no U.S. taxes have been provided thereon.
Fair Value Measurements
The performance of fair value measurements is an integral part of the preparation of financial statements in accordance with generally accepted accounting principles. Fair value is defined as the price that would be received to sell the asset or paid to transfer the liability in an orderly transaction between market participants. Selection of the appropriate valuation technique, as well as determination of assumptions, risks and estimates used by market participants in pricing the asset or liability requires significant judgment. Although we believe that the inputs used in our valuation techniques are reasonable, a change in one or more of the inputs could result
61
Management’s Discussion and Analysis
of Results of Operations and Financial Condition
(continued)
in an increase or decrease in the fair value of certain assets and certain liabilities. Either instance would have an impact on both our Consolidated Balance Sheet and Consolidated Statement of Earnings.
Provided below are those instances where the determination of fair value could have the most significant impact on our financial condition or results of operations:
Goodwill. Goodwill at December 31, 2009 relates to our significant reporting units MTVN ($7.034 billion), BETN ($2.742 billion) and Paramount ($1.625 billion). On an annual basis, the test for goodwill impairment is performed using a two-step process, unless there is a triggering event, in which case a test would be performed sooner. The first step is to identify a potential impairment by comparing the fair value of a reporting unit with its carrying amount. If necessary, the second step of the goodwill impairment test compares the implied fair value of the reporting unit’s goodwill with the carrying amount of that goodwill. The implied fair value of goodwill is determined in the same manner as the amount of goodwill recognized in a business combination. For all periods presented, our reporting units are consistent with our operating segments, in all material respects.
The estimates of fair value of a reporting unit are determined based on a discounted cash flow analysis. A discounted cash flow analysis requires us to make various judgmental assumptions, including assumptions about the timing and amount of future cash flows, growth rates and discount rates. Given the inherent uncertainty in determining these assumptions, actual results may differ from those used in our valuations. To facilitate a better understanding of how these valuations are determined, a discussion of our significant assumptions, including a sensitivity analysis with respect to their impact on the estimated value of our reporting units, is provided below.
The assumptions about future cash flows and growth rates are based on the budget and long-term business plans of each operating segment. Such assumptions take into account numerous factors including historical experience, anticipated economic conditions, advertising sales and ratings trends, terms of affiliate license arrangements and anticipated terms of renewals, projected costs for production and programming, number and expected financial performance of films expected to be produced and distributed each year and changes in the reporting unit cost structures.
Discount rate assumptions for each reporting unit take into account our assessment of the risks inherent in the future cash flows of the respective reporting unit and our weighted-average cost of capital. We also review marketplace data to assess the reasonableness of our computation of Viacom’s overall weighted average cost of capital and, when available, the discount rates utilized for each of our reporting units.
In determining the fair value of our reporting units, we used the following assumptions:
| • | | Expected cash flows underlying our business plans for the periods 2010 through 2014. Our growth rate assumptions for each of our reporting units were generally lower than those utilized in the prior year forecast period and experienced in 2009, except in certain instances where operational strategies support otherwise. The lower growth rates are principally driven by the benefits from restructurings and other cost savings initiatives that are already reflected in our 2009 results. |
| • | | Cash flows beyond 2014 are projected to grow at a perpetual growth rate, which we estimated at 3.5%. |
| • | | In order to risk adjust the cash flow projections in determining fair value, we utilized a discount rate of 9% to 12% for each of our reporting units. |
Based on our annual assessment using the assumptions described above, a hypothetical 20% reduction in the estimated fair value in each of our reporting units would not result in an impairment condition.
62
Management’s Discussion and Analysis
of Results of Operations and Financial Condition
(continued)
We have performed sensitivity analyses to illustrate the impact of changes in assumptions underlying the first step of the impairment test. Based on our annual assessment:
| • | | a one percentage point decrease in the five year compound average growth rate of cash flow over the periods 2010 through 2014 would reduce the indicated fair value of our reporting units by a range of approximately 4% to 5% and would not result in an impairment of any reporting unit. |
| • | | a one percentage point decrease in the perpetual growth rate would reduce the indicated fair value of each of our reporting units by a range of approximately 8% to 12% and would not result in an impairment of any reporting unit. |
| • | | a one percentage point increase in the discount rate would reduce the indicated fair value of each of our reporting units by a range of approximately 15% to 19% and would not result in an impairment of any reporting unit. |
Finite-Lived Intangible Assets.In determining whether finite-lived intangible assets (e.g., customer lists, film libraries) are impaired, the accounting rules do not provide for an annual impairment test. Instead, they require that a triggering event occur before testing an asset for impairment. Once a triggering event has occurred, the impairment test employed is based on whether the intent is to hold the asset for continued use or to hold the asset for sale. If the intent is to hold the asset for continued use, first a comparison of undiscounted future cash flows against the carrying value of the asset is performed. If the carrying value exceeds the undiscounted cash flows, the asset would be written down to the discounted fair value. If the intent is to hold the asset for sale, to the extent the carrying value is greater than the asset’s value, an impairment loss is recognized for the difference.
Significant judgments in this area involve determining whether a triggering event has occurred, the determination of the cash flows for the assets involved and the discount rate to be applied in determining fair value.
RECENT ACCOUNTING PRONOUNCEMENTS
Accounting for Transfers of Financial Assets
In June 2009, the Financial Accounting Standards Board (“FASB”) issued new guidance related to the transfer of financial assets that amends the existing guidance related to the criteria for a transfer of a financial asset to be accounted for as a sale, redefines a participating interest for transfers of portions of financial assets, eliminates the qualifying special-purpose entity concept and provides for new disclosures. The new guidance is effective for us beginning in 2010. As our accounts receivable securitization programs do not currently qualify for sale treatment under the revised rules, securitization transactions entered into on or after January 1, 2010 will be classified as debt and the related cash flows reflected as a financing activity. The level of securitized receivables sold to third parties was $0 at December 31, 2009.
Consolidation of Variable Interest Entities
In June 2009, the FASB issued new guidance that amended the existing criteria for consolidating variable interest entities (“VIEs”). The new consolidation criteria will require an ongoing qualitative assessment of which entity has the power to direct matters that most significantly impact the activities of a VIE and has the obligation to absorb losses or benefits that could be potentially significant to the VIE. The new guidance is effective for us beginning in 2010. We do not expect the impact of implementing the new guidance to be material to our Consolidated Financial Statements.
63
Management’s Discussion and Analysis
of Results of Operations and Financial Condition
(continued)
OTHER MATTERS
Legal Matters
Litigation is inherently uncertain and always difficult to predict. However, based on our understanding and evaluation of the relevant facts and circumstances, we believe that the legal matters described below and other litigation to which we are a party are not likely, in the aggregate, to have a material adverse effect on our results of operations, financial position or cash flows.
In March 2007, we filed a complaint in the United States District Court for the Southern District of New York against Google Inc. (“Google”) and its wholly-owned subsidiary YouTube, alleging that Google and YouTube violated and continue to violate our copyrights. We are seeking both damages and injunctive relief.
In September 2007, Brantley, et al. v. NBC Universal, Inc., et al., was filed in the United States District Court for the Central District of California against us and several other program content providers on behalf of a purported nationwide class of cable and satellite subscribers. The plaintiffs also sued several major cable and satellite program distributors. Plaintiffs allege that separate contracts between the program providers and the cable and satellite operator defendants providing for the sale of programming in specific tiers each unreasonably restrain trade in a variety of markets in violation of the Sherman Act. In October 2009, the court dismissed, with prejudice, the plaintiff’s third amended complaint. The plaintiffs appealed the dismissal. We believe the plaintiffs’ position in this litigation is without merit and intend to continue to vigorously defend this lawsuit.
Related Parties
National Amusements Inc. (“NAI”) through NAIRI, Inc., is the controlling stockholder of both Viacom and CBS Corporation. NAI also held a controlling interest in Midway Games, Inc. (“Midway”) until November 28, 2008. Sumner M. Redstone, the Chairman, Chief Executive Officer and controlling shareholder of NAI, is the Executive Chairman of the Board and Founder of both Viacom and CBS Corporation. In addition, Shari Redstone, who is Sumner Redstone’s daughter, is the President of NAI, and the Vice Chair of the Board of both Viacom and CBS Corporation. George Abrams, one of our directors, serves on the boards of both NAI and Viacom, and Frederic Salerno, another of our directors, serves on the boards of both Viacom and CBS Corporation. Philippe Dauman, our President and Chief Executive Officer, also serves on the boards of both NAI and Viacom.
Since the fall of 2008, Mr. Dauman has recused himself from activity as an NAI board member with respect to all matters relating to the restructuring of NAI’s indebtedness. In addition, NAI’s board of directors has created a special committee that does not include Mr. Redstone or Mr. Dauman in order to consider issues that may be perceived to create a conflict between their responsibility to Viacom and to NAI. Similarly, our independent directors act on behalf of the Board of Directors when appropriate to address such issues. See the“Risk Factors” section for additional information on our relationship with NAI. Transactions between Viacom and related parties are typically overseen by our Governance and Nominating Committee.
NAI licenses films in the ordinary course of business for its motion picture theaters from all major studios, including Paramount. During the years ended December 31, 2009, 2008 and 2007, Paramount earned revenues from NAI in connection with these licenses in the aggregate amounts of approximately $34 million, $36 million and $36 million, respectively.
In connection with our stock repurchase programs, in 2008 and 2007 we repurchased 3.6 million and 6.0 million shares, respectively, of Class B common stock from NAIRI for an aggregate purchase price of $124 million and
64
Management’s Discussion and Analysis
of Results of Operations and Financial Condition
(continued)
$246 million, respectively. These purchases were made pursuant to an agreement with NAI and NAIRI under which we agreed to buy from them, and they agreed to sell to us, a number of shares of our Class B common stock each month such that their ownership percentage of our Class A common stock and Class B common stock (considered as a single class) would not increase as a result of our purchase of shares under our stock repurchase program. This agreement was terminated in October 2008.
Viacom and CBS Corporation Related Party Transactions
In the normal course of business, we are involved in transactions with CBS Corporation and its various businesses (“CBS”) that result in the recognition of revenues and expenses by Viacom. Transactions with CBS, through the normal course of business, are settled in cash.
Paramount earns revenues and recognizes expenses associated with the distribution of certain television products into the home entertainment market on behalf of CBS. Effective January 1, 2008, we entered into a new distribution agreement with CBS under which revenue and expenses are recorded on a gross basis. Under the terms of the agreement, Paramount is entitled to retain a fee based on a percentage of gross receipts and is generally responsible for all out-of-pocket costs which are recoupable, together with the annual advance due to CBS, prior to any participation payments to CBS. In connection with this agreement, Paramount made initial payments of $100 million to CBS during each of the first quarters of 2010, 2009 and 2008. Paramount also earns revenues associated with the leasing of studio space to CBS and licensing of motion picture products released before January 1, 2008 to CBS. Additionally, theMedia Networks segment recognizes advertising revenues from CBS.
TheMedia Networks segment purchases television programming from CBS. The cost of such purchases is initially recorded as acquired program rights inventory and amortized over the estimated period that revenues will be generated. Both of our segments recognize advertising expenses related to the placement of advertisements with CBS.
The following table summarizes the transactions with CBS as included in our consolidated financial statements.
| | | | | | | | | | |
| CBS Related Party Transactions | | Year Ended December 31, | |
| (in millions) | | 2009 | | 2008 | | 2007 | |
Consolidated Statements of Earnings | | | | | | | | | | |
Revenues | | $ | 406 | | $ | 506 | | $ | 244 | |
Operating expenses | | $ | 504 | | $ | 561 | | $ | 185 | |
Discontinued operations | | $ | - | | $ | - | | $ | (5 | ) |
| | |
| | | December 31, | | | |
| | | 2009 | | 2008 | | | |
Consolidated Balance Sheets | | | | | | | | | | |
Accounts receivable | | $ | 25 | | $ | 61 | | | | |
Other assets | | | 1 | | | 16 | | | | |
| | | | | | | | | | |
Total due from CBS | | $ | 26 | | $ | 77 | | | | |
| | | | | | | | | | |
Accounts payable | | $ | 3 | | $ | 6 | | | | |
Participants’ share, residuals and royalties payable | | | 178 | | | 160 | | | | |
Programming rights, current | | | 132 | | | 156 | | | | |
Programming rights, noncurrent | | | 185 | | | 242 | | | | |
Other liabilities | | | 13 | | | 13 | | | | |
| | | | | | | | | | |
Total due to CBS | | $ | 511 | | $ | 577 | | | | |
| | | | | | | | | | |
65
Management’s Discussion and Analysis
of Results of Operations and Financial Condition
(continued)
In 2007, we also made a final special dividend payment of $170 million to CBS Corporation in connection with our separation from Former Viacom.
401(k) Plan Transactions
Following the separation, some participants in the Viacom 401(k) Plan continued to be invested in CBS Corporation Class A and Class B common stock. In 2007, CBS Corporation purchased the shares of CBS Corporation Class A and Class B common stock from the Viacom 401(k) Plan for total proceeds of $30 million.
Similarly, some participants in the 401(k) plans sponsored by CBS Corporation continued to be invested in Viacom Class A and Class B common stock following the separation. In 2007, we purchased the shares of Viacom Class A and Class B common stock from the CBS-sponsored 401(k) plans for an aggregate amount of $120 million.
Agreements with CBS Corporation
In connection with the separation, we and CBS Corporation entered into a Separation Agreement, a Transition Services Agreement and a Tax Matters Agreement, as well as certain other agreements to govern the terms of the separation and certain of the ongoing relationships between CBS Corporation and us after the separation. These related party arrangements are more fully described below.
Indemnification Obligations. Pursuant to the Separation Agreement, each company indemnified the other company and the other company’s officers, directors and employees for any losses arising out of its failure to perform or discharge any of the liabilities it assumed pursuant to the Separation Agreement, including with respect to certain legal matters, its businesses as conducted as of the date of the separation and its breaches of shared contracts.
Limitations on Certain Acquisitions. Subject to limited exceptions, the Separation Agreement provides that none of Viacom, any subsidiary of Viacom or any person that is controlled by Viacom after the separation will own or acquire an interest in a radio or television broadcast station, television broadcast network or daily newspaper, if such ownership or acquisition would (i) cause CBS Corporation, any subsidiary of CBS Corporation or any entity controlled by CBS Corporation after the date of the separation to be in violation of U.S. federal laws limiting the ownership or control of radio broadcast stations, television broadcast stations, television broadcast networks or (ii) limit in any manner at any time under such laws CBS Corporation’s ability to acquire additional interests in a radio or television broadcast station and/or television broadcast network. These restrictions will terminate when none of Mr. Redstone, NAI, NAIRI or any of their successors, assigns or transferees are deemed to have interests in both CBS Corporation and Viacom that are attributable under applicable U.S. federal laws.
The Separation Agreement also provides that neither Viacom, any subsidiary of Viacom or any person controlled by Viacom nor CBS Corporation, any subsidiary of CBS Corporation or any person controlled by CBS Corporation will acquire any asset, enter into any agreement or accept or agree to any condition that purports to bind, or subjects to a legal order, the other company, its subsidiaries or any person it controls without such other party’s written consent.
Tax Matters Agreement
The Tax Matters Agreement sets forth Viacom’s responsibilities with respect to, among other things, liabilities for federal, state, local and foreign income taxes for periods before and including the merger, the preparation and filing of income tax returns for such periods, disputes with taxing authorities regarding income taxes for such periods and indemnification for income taxes that would become due if the merger were taxable. Viacom is generally responsible for federal, state and local, and foreign income taxes for periods before the merger relating
66
Management’s Discussion and Analysis
of Results of Operations and Financial Condition
(continued)
to Viacom’s respective businesses. Income tax liabilities relating to discontinued operations and previously disposed businesses have been allocated in accordance with the principles applicable under the Separation Agreement for liabilities relating to those operations and businesses. Other income tax liabilities, including items that do not specifically relate to either business, will be shared equally. Viacom and CBS Corporation will generally be jointly responsible for managing any dispute relating to income taxes for which both parties may be responsible. The Tax Matters Agreement also provides that, depending on the event, Viacom may have to indemnify CBS Corporation, or CBS Corporation may have to indemnify Viacom, for some or all of the taxes resulting from the transactions related to the merger and the distribution of Viacom common stock if the merger and distribution do not qualify as tax-free under Sections 355 and 368 of the Code.
Other Related Party Transactions
In the normal course of business, we are involved in related party transactions with equity investees, principally related to investments in unconsolidated VIEs as more fully described in Note 3 to our Consolidated Financial Statements. These related party transactions principally relate to the provision of advertising services, licensing of film and programming content and the distribution of films for which the impact on our Consolidated Financial Statements is as follows:
| | | | | | | | | |
| Other Related Party Transactions | | Year Ended December 31, |
| (in millions) | | 2009 | | 2008 | | 2007 |
Consolidated Statements of Earnings | | | | | | | | | |
Revenues | | $ | 375 | | $ | 408 | | $ | 484 |
Operating expenses | | $ | 207 | | $ | 249 | | $ | 393 |
| | |
| | | December 31, | | |
| | | 2009 | | 2008 | | |
Consolidated Balance Sheets | | | | | | | | | |
Accounts receivable | | $ | 112 | | $ | 88 | | | |
| | | |
Accounts payable | | $ | 39 | | $ | 25 | | | |
Participants’ share, residuals and royalties payable | | | 47 | | | 58 | | | |
Other liabilities | | | 55 | | | 55 | | | |
Current portion of debt | | | 65 | | | 65 | | | |
Noncurrent portion of debt | | | 33 | | | 71 | | | |
| | | | | | | | | |
Total due to other related parties | | $ | 239 | | $ | 274 | | | |
| | | | | | | | | |
All other related party transactions are not material in the periods presented.
67
Item 7A.Quantitative and Qualitative Disclosures about Market Risk.
Disclosures on our market risk are included in “Management’s Discussion and Analysis of Results of Operations and Financial Condition—Market Risk.”
68
Item 8.Financial Statements and Supplementary Data.
69
MANAGEMENT’S REPORT ON INTERNAL CONTROL OVER FINANCIAL REPORTING
Management has prepared and is responsible for our consolidated financial statements and related notes. Management is also responsible for establishing and maintaining adequate internal control over financial reporting as defined in Rules 13a-15(f) and 15d-15(f) under the Securities Exchange Act of 1934, as amended. The Company’s internal control over financial reporting includes those policies and procedures that (i) pertain to the maintenance of records that, in reasonable detail, accurately and fairly reflect the transactions and dispositions of the assets of the Company; (ii) provide reasonable assurance that transactions are recorded as necessary to permit preparation of financial statements in accordance with generally accepted accounting principles, and that receipts and expenditures of the Company are being made only in accordance with the authorizations of management and directors of the Company; and (iii) provide reasonable assurance regarding prevention or timely detection of unauthorized acquisition, use, or disposition of the Company’s assets that could have a material effect on the financial statements.
Internal control over financial reporting is designed to provide reasonable assurance regarding the reliability of financial reporting and the preparation of financial statements prepared for external purposes in accordance with generally accepted accounting principles. Because of its inherent limitations, internal control over financial reporting may not prevent or detect misstatements. Also, projections of any evaluation of effectiveness to future periods are subject to the risks that controls may become inadequate because of changes in conditions, or that the degree of compliance with the policies or procedures may deteriorate.
Under the supervision and with the participation of management, including our personal participation, we conducted an assessment of the effectiveness of internal control over financial reporting based on the framework inInternal Control – Integrated Framework as issued by the Committee of Sponsoring Organizations of the Treadway Commission. Based on this assessment, management determined that as of December 31, 2009, Viacom maintained effective internal control over financial reporting.
The assessment of the effectiveness of our internal control over financial reporting as of December 31, 2009 has been audited by PricewaterhouseCoopers LLP, an independent registered public accounting firm, as stated in their report included herein.
| | |
| VIACOM INC. |
| | |
| |
| By: | | /S/ PHILIPPE P. DAUMAN |
| | Philippe P. Dauman |
| | President and Chief Executive Officer |
| |
| By: | | /S/ THOMAS E. DOOLEY |
| | Thomas E. Dooley |
| | Senior Executive Vice President, Chief Administrative Officer and Chief Financial Officer |
| |
| By: | | /S/ JAMES W. BARGE |
| | James W. Barge |
| | Executive Vice President, Controller, Tax & Treasury (Chief Accounting Officer) |
70
REPORT OF INDEPENDENT REGISTERED PUBLIC ACCOUNTING FIRM
To the Board of Directors and Stockholders of Viacom Inc.
In our opinion, the consolidated financial statements listed in the index appearing under Item 8 present fairly, in all material respects, the financial position of Viacom Inc. and its subsidiaries (the “Company”) at December 31, 2009 and 2008, and the results of their operations and their cash flows for each of the three years in the period ended December 31, 2009 in conformity with accounting principles generally accepted in the United States of America. In addition, in our opinion, the financial statement schedule listed in the index appearing under Item 8 presents fairly, in all material respects, the information set forth therein when read in conjunction with the related consolidated financial statements. Also in our opinion, the Company maintained, in all material respects, effective internal control over financial reporting as of December 31, 2009, based on criteria established inInternal Control—Integrated Framework issued by the Committee of Sponsoring Organizations of the Treadway Commission (COSO). The Company’s management is responsible for these financial statements and financial statement schedule, for maintaining effective internal control over financial reporting and for its assessment of the effectiveness of internal control over financial reporting, included in Management’s Report on Internal Control over Financial Reporting appearing under Item 8. Our responsibility is to express opinions on these financial statements, on the financial statement schedule, and on the Company’s internal control over financial reporting based on our integrated audits. We conducted our audits in accordance with the standards of the Public Company Accounting Oversight Board (United States). Those standards require that we plan and perform the audits to obtain reasonable assurance about whether the financial statements are free of material misstatement and whether effective internal control over financial reporting was maintained in all material respects. Our audits of the financial statements included examining, on a test basis, evidence supporting the amounts and disclosures in the financial statements, assessing the accounting principles used and significant estimates made by management, and evaluating the overall financial statement presentation. Our audit of internal control over financial reporting included obtaining an understanding of internal control over financial reporting, assessing the risk that a material weakness exists, and testing and evaluating the design and operating effectiveness of internal control based on the assessed risk. Our audits also included performing such other procedures as we considered necessary in the circumstances. We believe that our audits provide a reasonable basis for our opinions.
As discussed in Note 1 to the consolidated financial statements, the Company changed the manner in which it accounts for noncontrolling interests in 2009.
A company’s internal control over financial reporting is a process designed to provide reasonable assurance regarding the reliability of financial reporting and the preparation of financial statements for external purposes in accordance with generally accepted accounting principles. A company’s internal control over financial reporting includes those policies and procedures that (i) pertain to the maintenance of records that, in reasonable detail, accurately and fairly reflect the transactions and dispositions of the assets of the company; (ii) provide reasonable assurance that transactions are recorded as necessary to permit preparation of financial statements in accordance with generally accepted accounting principles, and that receipts and expenditures of the company are being made only in accordance with authorizations of management and directors of the company; and (iii) provide reasonable assurance regarding prevention or timely detection of unauthorized acquisition, use, or disposition of the company’s assets that could have a material effect on the financial statements.
Because of its inherent limitations, internal control over financial reporting may not prevent or detect misstatements. Also, projections of any evaluation of effectiveness to future periods are subject to the risk that controls may become inadequate because of changes in conditions, or that the degree of compliance with the policies or procedures may deteriorate.
/s/ PricewaterhouseCoopers LLP
New York, New York
February 11, 2010
71
VIACOM INC.
CONSOLIDATED STATEMENTS OF EARNINGS
| | | | | | | | | | | | |
| | | Year Ended December 31, | |
| (in millions, except earnings per share amounts) | | 2009 | | | 2008 | | | 2007 | |
Revenues | | $ | 13,619 | | | $ | 14,625 | | | $ | 13,423 | |
Expenses: | | | | | | | | | | | | |
Operating | | | 7,587 | | | | 8,787 | | | | 7,431 | |
Selling, general and administrative | | | 2,737 | | | | 2,910 | | | | 2,663 | |
Depreciation and amortization | | | 391 | | | | 405 | | | | 393 | |
| | | | | | | | | | | | |
Total expenses | | | 10,715 | | | | 12,102 | | | | 10,487 | |
| | | |
Operating income | | | 2,904 | | | | 2,523 | | | | 2,936 | |
Interest expense, net | | | (430 | ) | | | (482 | ) | | | (464 | ) |
Gain on sale of equity investment | | | - | | | | - | | | | 151 | |
Equity in net losses of investee companies | | | (77 | ) | | | (74 | ) | | | - | |
Loss on extinguishment of debt | | | (84 | ) | | | - | | | | - | |
Other items, net | | | (37 | ) | | | (112 | ) | | | (43 | ) |
| | | | | | | | | | | | |
Earnings from continuing operations before provision for income taxes | | | 2,276 | | | | 1,855 | | | | 2,580 | |
Provision for income taxes | | | (708 | ) | | | (605 | ) | | | (929 | ) |
| | | | | | | | | | | | |
Net earnings from continuing operations | | | 1,568 | | | | 1,250 | | | | 1,651 | |
Discontinued operations, net of tax | | | 20 | | | | 18 | | | | 208 | |
| | | | | | | | | | | | |
Net earnings (Viacom and noncontrolling interests) | | | 1,588 | | | | 1,268 | | | | 1,859 | |
Net losses (earnings) attributable to noncontrolling interests | | | 23 | | | | (17 | ) | | | (21 | ) |
| | | | | | | | | | | | |
Net earnings attributable to Viacom | | $ | 1,611 | | | $ | 1,251 | | | $ | 1,838 | |
| | | | | | | | | | | | |
Amounts attributable to Viacom: | | | | | | | | | | | | |
Net earnings from continuing operations | | $ | 1,591 | | | $ | 1,233 | | | $ | 1,630 | |
Discontinued operations, net of tax | | | 20 | | | | 18 | | | | 208 | |
| | | | | | | | | | | | |
Net earnings attributable to Viacom | | $ | 1,611 | | | $ | 1,251 | | | $ | 1,838 | |
| | | | | | | | | | | | |
Basic earnings per share attributable to Viacom: | | | | | | | | | | | | |
Continuing operations | | $ | 2.62 | | | $ | 1.97 | | | $ | 2.42 | |
Discontinued operations | | $ | 0.03 | | | $ | 0.03 | | | $ | 0.31 | |
Net earnings per share of Viacom | | $ | 2.65 | | | $ | 2.00 | | | $ | 2.73 | |
| | | |
Diluted earnings per share attributable to Viacom: | | | | | | | | | | | | |
Continuing operations | | $ | 2.62 | | | $ | 1.97 | | | $ | 2.41 | |
Discontinued operations | | $ | 0.03 | | | $ | 0.03 | | | $ | 0.31 | |
Net earnings per share of Viacom | | $ | 2.65 | | | $ | 2.00 | | | $ | 2.72 | |
| | | |
Weighted average number of common shares outstanding: | | | | | | | | | | | | |
Basic | | | 607.1 | | | | 624.7 | | | | 674.1 | |
Diluted | | | 608.3 | | | | 625.4 | | | | 675.6 | |
| |
See accompanying notes to Consolidated Financial Statements
72
VIACOM INC.
CONSOLIDATED BALANCE SHEETS
| | | | | | | | |
| | | December 31, | |
| (in millions, except par value) | | 2009 | | | 2008 | |
ASSETS | | | | | | | | |
Current assets: | | | | | | | | |
Cash and cash equivalents | | $ | 298 | | | $ | 792 | |
Receivables, net (including retained interests in securitizations - see Note 8) | | | 2,881 | | | | 2,271 | |
Inventory, net | | | 779 | | | | 881 | |
Deferred tax assets, net | | | 147 | | | | 203 | |
Prepaid and other assets | | | 325 | | | | 355 | |
| | | | | | | | |
Total current assets | | | 4,430 | | | | 4,502 | |
Property and equipment, net | | | 1,179 | | | | 1,145 | |
Inventory, net | | | 3,731 | | | | 4,133 | |
Goodwill | | | 11,401 | | | | 11,470 | |
Intangibles, net | | | 570 | | | | 674 | |
Other assets | | | 589 | | | | 563 | |
| | | | | | | | |
Total assets | | $ | 21,900 | | | $ | 22,487 | |
| | | | | | | | |
LIABILITIES AND EQUITY | | | | | | | | |
| | |
Current liabilities: | | | | | | | | |
Accounts payable | | $ | 248 | | | $ | 574 | |
Accrued expenses | | | 1,169 | | | | 1,304 | |
Participants’ share and residuals | | | 1,090 | | | | 1,537 | |
Program rights obligations | | | 404 | | | | 384 | |
Deferred revenue | | | 323 | | | | 442 | |
Current portion of debt | | | 123 | | | | 105 | |
Other liabilities | | | 394 | | | | 496 | |
| | | | | | | | |
Total current liabilities | | | 3,751 | | | | 4,842 | |
Noncurrent portion of debt | | | 6,650 | | | | 7,897 | |
Participants’ share and residuals | | | 739 | | | | 488 | |
Program rights obligations | | | 523 | | | | 621 | |
Deferred tax liabilities, net | | | 89 | | | | 12 | |
Other liabilities | | | 1,303 | | | | 1,556 | |
Redeemable noncontrolling interest | | | 168 | | | | 148 | |
| | |
Commitments and contingencies (Note 16) | | | | | | | | |
| | |
Viacom stockholders’ equity: | | | | | | | | |
Class A Common stock, par value $0.001, 375.0 authorized; 52.4 and 57.4 outstanding, respectively | | | - | | | | - | |
Class B Common stock, par value $0.001, 5,000.0 authorized; 555.0 and 549.4 outstanding, respectively | | | 1 | | | | 1 | |
Additional paid-in capital | | | 8,287 | | | | 8,186 | |
Treasury stock, 151.5 common shares held in treasury | | | (5,725 | ) | | | (5,725 | ) |
Retained earnings | | | 6,106 | | | | 4,496 | |
Accumulated other comprehensive income (loss) | | | 35 | | | | (49 | ) |
| | | | | | | | |
Total Viacom stockholders’ equity | | | 8,704 | | | | 6,909 | |
Noncontrolling interests | | | (27 | ) | | | 14 | |
| | | | | | | | |
Total equity | | | 8,677 | | | | 6,923 | |
| | | | | | | | |
Total liabilities and equity | | $ | 21,900 | | | $ | 22,487 | |
| | | | | | | | |
| |
See accompanying notes to Consolidated Financial Statements
73
VIACOM INC.
CONSOLIDATED STATEMENTS OF CASH FLOWS
| | | | | | | | | | | | |
| |
| | | Year Ended December 31, | |
| (in millions) | | 2009 | | | 2008 | | | 2007 | |
OPERATING ACTIVITIES | | | | | | | | | | | | |
Net earnings (Viacom and noncontrolling interests) | | $ | 1,588 | | | $ | 1,268 | | | $ | 1,859 | |
Discontinued operations, net of tax | | | (20 | ) | | | (18 | ) | | | (208 | ) |
| | | | | | | | | | | | |
Net earnings from continuing operations | | | 1,568 | | | | 1,250 | | | | 1,651 | |
Reconciling items: | | | | | | | | | | | | |
Depreciation and amortization | | | 391 | | | | 405 | | | | 393 | |
Feature film and program amortization | | | 4,346 | | | | 4,808 | | | | 3,747 | |
Stock-based compensation | | | 102 | | | | 99 | | | | 86 | |
Gain on sale of equity investment | | | - | | | | - | | | | (151 | ) |
Equity in investee companies, net of distributions | | | 86 | | | | 103 | | | | 26 | |
Provision for deferred taxes | | | 87 | | | | 14 | | | | 33 | |
Decrease in securitized receivables | | | (950 | ) | | | - | | | | - | |
Operating assets and liabilities, net of acquisitions: | | | | | | | | | | | | |
Receivables | | | 208 | | | | 279 | | | | (329 | ) |
Inventory, program rights and participations | | | (4,048 | ) | | | (4,731 | ) | | | (3,809 | ) |
Accounts payable and other current liabilities | | | (520 | ) | | | (278 | ) | | | (36 | ) |
Other, net | | | (119 | ) | | | 74 | | | | 156 | |
Discontinued operations, net | | | - | | | | 13 | | | | 9 | |
| | | | | | | | | | | | |
Cash provided by operations | | | 1,151 | | | | 2,036 | | | | 1,776 | |
| | | | | | | | | | | | |
INVESTING ACTIVITIES | | | | | | | | | | | | |
Acquisitions and investments, net | | | (133 | ) | | | (296 | ) | | | (70 | ) |
Business dispositions | | | - | | | | - | | | | 194 | |
Capital expenditures | | | (141 | ) | | | (288 | ) | | | (237 | ) |
Discontinued operations, net | | | - | | | | 13 | | | | 361 | |
| | | | | | | | | | | | |
Net cash flow (used in) provided by investing activities | | | (274 | ) | | | (571 | ) | | | 248 | |
| | | | | | | | | | | | |
FINANCING ACTIVITIES | | | | | | | | | | | | |
Borrowings from banks | | | 4,075 | | | | 2,845 | | | | 750 | |
Repayments to banks | | | (4,725 | ) | | | (2,945 | ) | | | - | |
Issuance of senior notes and debentures, net of discount | | | 1,387 | | | | - | | | | 745 | |
Repayment of senior notes | | | (2,056 | ) | | | - | | | | - | |
Commercial paper | | | 16 | | | | (56 | ) | | | (1,038 | ) |
Payment of other financing obligations | | | (65 | ) | | | (124 | ) | | | (81 | ) |
Special dividend to Former Viacom | | | - | | | | - | | | | (170 | ) |
Purchase of treasury stock | | | (8 | ) | | | (1,266 | ) | | | (2,134 | ) |
Distributions to noncontrolling interests | | | (13 | ) | | | (13 | ) | | | (16 | ) |
Exercise of stock options and other, net | | | 1 | | | | 4 | | | | 113 | |
| | | | | | | | | | | | |
Net cash flow used in financing activities | | | (1,388 | ) | | | (1,555 | ) | | | (1,831 | ) |
| | | | | | | | | | | | |
Effect of exchange rate changes on cash and cash equivalents | | | 17 | | | | (38 | ) | | | 21 | |
| | | | | | | | | | | | |
Net change in cash and cash equivalents | | | (494 | ) | | | (128 | ) | | | 214 | |
Cash and cash equivalents at beginning of period | | | 792 | | | | 920 | | | | 706 | |
| | | | | | | | | | | | |
Cash and cash equivalents at end of period | | $ | 298 | | | $ | 792 | | | $ | 920 | |
| | | | | | | | | | | | |
See accompanying notes to Consolidated Financial Statements
74
VIACOM INC.
CONSOLIDATED STATEMENTS OF STOCKHOLDERS’ EQUITY
AND COMPREHENSIVE INCOME
| | | | | | | | | | | | | | | | | | | | | | | | | | | | | | | |
| | | | | | | | |
| (in millions) | | Common
Stock
Outstanding
(shares) | | | Common
Stock/
APIC | | | Treasury
Stock | | | Retained
Earnings | | | Accumulated
Other
Comprehensive
Income (Loss) | | | Total Viacom
Stockholders’
Equity | | | Noncontrolling
Interests | | | Total
Equity | |
December 31, 2006 (as previously reported) | | 693.2 | | | $ | 7,873 | | | $ | (2,345 | ) | | $ | 1,592 | | | $ | 46 | | | $ | 7,166 | | | $ | - | | | $ | 7,166 | |
Adoption of accounting for non controlling interests and redeemable securities | | | | | | | | | | | | | | (194 | ) | | | (10 | ) | | | (204 | ) | | | 5 | | | | (199 | ) |
| | | | | | | | | | | | | | | | | | | | | | | | | | | | | | | |
December 31, 2006 (as adjusted) | | 693.2 | | | $ | 7,873 | | | $ | (2,345 | ) | | $ | 1,398 | | | $ | 36 | | | $ | 6,962 | | | $ | 5 | | | $ | 6,967 | |
Net earnings | | | | | | | | | | | | | | 1,838 | | | | | | | | 1,838 | | | | 21 | | | | 1,859 | |
Translation adjustments | | | | | | | | | | | | | | | | | | 67 | | | | 67 | | | | 2 | | | | 69 | |
Unrealized loss on securities | | | | | | | | | | | | | | | | | | (3 | ) | | | (3 | ) | | | | | | | (3 | ) |
Cash flow hedges | | | | | | | | | | | | | | | | | | (2 | ) | | | (2 | ) | | | | | | | (2 | ) |
Defined benefit pension plans | | | | | | | | | | | | | | | | | | 16 | | | | 16 | | | | | | | | 16 | |
| | | | | | | | | | | | | | | | | | | | | | | | | | | | | | | |
Comprehensive income | | | | | | | | | | | | | | | | | | | | | | 1,916 | | | | 23 | | | | 1,939 | |
Reclassifications to redeemable noncontrolling interest | | | | | | | | | | | | | | | | | | | | | | - | | | | (14 | ) | | | (14 | ) |
Change in redemption value of put option | | | | | | | | | | | | | | 6 | | | | - | | | | 6 | | | | | | | | 6 | |
Acquisition of additional shares in noncontrolling interest | | | | | | | | | | | | | | | | | | | | | | - | | | | (1 | ) | | | (1 | ) |
Dividends to noncontrolling interests | | | | | | | | | | | | | | | | | | | | | | - | | | | (5 | ) | | | (5 | ) |
Share based compensation | | | | | | 97 | | | | | | | | | | | | | | | | 97 | | | | | | | | 97 | |
Exercise of stock options and other | | 4.1 | | | | 110 | | | | | | | | | | | | | | | | 110 | | | | | | | | 110 | |
Purchase of treasury stock | | (52.5 | ) | | | | | | | (2,157 | ) | | | | | | | | | | | (2,157 | ) | | | | | | | (2,157 | ) |
Adoption of accounting for uncertainty in income taxes | | | | | | | | | | | | | | (23 | ) | | | | | | | (23 | ) | | | | | | | (23 | ) |
| | | | | | | | | | | | | | | | | | | | | | | | | | | | | | | |
December 31, 2007 | | 644.8 | | | | 8,080 | | | | (4,502 | ) | | | 3,219 | | | | 114 | | | | 6,911 | | | | 8 | | | | 6,919 | |
Net earnings | | | | | | | | | | | | | | 1,251 | | | | | | | | 1,251 | | | | 17 | | | | 1,268 | |
Translation adjustments | | | | | | | | | | | | | | | | | | (40 | ) | | | (40 | ) | | | (14 | ) | | | (54 | ) |
Unrealized gain on securities | | | | | | | | | | | | | | | | | | - | | | | - | | | | | | | | - | |
Cash flow hedges | | | | | | | | | | | | | | | | | | (4 | ) | | | (4 | ) | | | | | | | (4 | ) |
Defined benefit pension plans | | | | | | | | | | | | | | | | | | (119 | ) | | | (119 | ) | | | | | | | (119 | ) |
| | | | | | | | | | | | | | | | | | | | | | | | | | | | | | | |
Comprehensive income | | | | | | | | | | | | | | | | | | | | | | 1,088 | | | | 3 | | | | 1,091 | |
Reclassifications to redeemable noncontrolling interest | | | | | | | | | | | | | | | | | | | | | | - | | | | (3 | ) | | | (3 | ) |
Change in redemption value of put option | | | | | | | | | | | | | | 26 | | | | - | | | | 26 | | | | - | | | | 26 | |
Acquisition of additional shares in noncontrolling interest | | | | | | | | | | | | | | | | | | | | | | - | | | | 11 | | | | 11 | |
Dividends to noncontrolling interests | | | | | | | | | | | | | | | | | | | | | | - | | | | (5 | ) | | | (5 | ) |
Share based compensation | | | | | | 113 | | | | | | | | | | | | | | | | 113 | | | | - | | | | 113 | |
Exercise of stock options and other | | 0.7 | | | | (6 | ) | | | | | | | | | | | | | | | (6 | ) | | | - | | | | (6 | ) |
Purchase of treasury stock | | (38.7 | ) | | | | | | | (1,223 | ) | | | | | | | | | | | (1,223 | ) | | | - | | | | (1,223 | ) |
| | | | | | | | | | | | | | | | | | | | | | | | | | | | | | | |
December 31, 2008 | | 606.8 | | | | 8,187 | | | | (5,725 | ) | | | 4,496 | | | | (49 | ) | | | 6,909 | | | | 14 | | | | 6,923 | |
Net earnings | | | | | | | | | | | | | | 1,611 | | | | | | | | 1,611 | | | | (23 | ) | | | 1,588 | |
Translation adjustments | | | | | | | | | | | | | | | | | | 32 | | | | 32 | | | | (1 | ) | | | 31 | |
Unrealized gain on securities | | | | | | | | | | | | | | | | | | 5 | | | | 5 | | | | | | | | 5 | |
Cash flow hedges | | | | | | | | | | | | | | | | | | (5 | ) | | | (5 | ) | | | | | | | (5 | ) |
Defined benefit pension plans | | | | | | | | | | | | | | | | | | 52 | | | | 52 | | | | | | | | 52 | |
| | | | | | | | | | | | | | | | | | | | | | | | | | | | | | | |
Comprehensive income | | | | | | | | | | | | | | | | | | | | | | 1,695 | | | | (24 | ) | | | 1,671 | |
Reclassifications to redeemable noncontrolling interest | | | | | | | | | | | | | | | | | | | | | | - | | | | (13 | ) | | | (13 | ) |
Change in redemption value of put option | | | | | | | | | | | | | | (1 | ) | | | | | | | (1 | ) | | | | | | | (1 | ) |
Dividends to noncontrolling interests | | | | | | | | | | | | | | | | | | | | | | - | | | | (4 | ) | | | (4 | ) |
Share based compensation | | | | | | 113 | | | | | | | | | | | | | | | | 113 | | | | | | | | 113 | |
Exercise of stock options and other | | 0.6 | | | | (12 | ) | | | | | | | | | | | | | | | (12 | ) | | | | | | | (12 | ) |
| | | | | | | | | | | | | | | | | | | | | | | | | | | | | | | |
December 31, 2009 | | 607.4 | | | $ | 8,288 | | | $ | (5,725 | ) | | $ | 6,106 | | | $ | 35 | | | $ | 8,704 | | | $ | (27 | ) | | $ | 8,677 | |
| | | | | | | | | | | | | | | | | | | | | | | | | | | | | | | |
See accompanying notes to Consolidated Financial Statements
75
VIACOM INC.
NOTES TO CONSOLIDATED FINANCIAL STATEMENTS
NOTE 1. DESCRIPTION OF BUSINESS AND BASIS OF PRESENTATION
Description of Business
Viacom Inc. including its consolidated subsidiaries (“Viacom” or the “Company”) is a leading global entertainment content company, engaging audiences on television, motion picture, Internet, mobile and video game platforms through many of the world’s best known entertainment brands. Viacom operates through two reporting segments:Media Networks, which includes MTV Networks (“MTVN”) and BET Networks (“BETN”); andFilmed Entertainment. TheMedia Networks segment provides entertainment content for consumers in key demographics attractive to advertisers, content distributors and retailers. TheFilmed Entertainment segment produces, finances and distributes motion pictures and other entertainment content under the Paramount Pictures, Paramount Vantage, Paramount Classics, MTV Films and Nickelodeon Movies brands. TheFilmed Entertainment segment also continues to release certain pictures under the DreamWorks brand. It also acquires films for distribution and has distribution relationships with third parties.
Basis of Presentation
Accounting Changes
Noncontrolling Interests
In December 2007, the Financial Accounting Standards Board (the “FASB”) issued new guidance which establishes and provides accounting and reporting standards for the noncontrolling interest in a consolidated subsidiary and for the deconsolidation of a subsidiary. The Company has adopted the provisions under this guidance beginning January 1, 2009, via retrospective application of the presentation and disclosure requirements. The retrospective impact of applying this guidance was the reclassification of $5 million from mezzanine equity to noncontrolling interests as of December 31, 2006.
In conjunction with its adoption of the new guidance for noncontrolling interests, the Company adopted the guidance for redeemable securities. The redeemable security guidance is applicable to all noncontrolling interests where the Company is subject to a put option under which it may be required to repurchase an interest in a consolidated subsidiary from the noncontrolling interest holder. The Company is currently subject to a redeemable put option for an international subsidiary payable in a foreign currency which expires in 2011. At December 31, 2009 and 2008, the redemption value of the put was approximately $168 million and $148 million, respectively, and is reflected in the Consolidated Balance Sheets asRedeemable noncontrolling interest. The retrospective impact of applying this guidance was a reduction to openingRetained earnings of $194 million and a reduction toAccumulated other comprehensive income (loss)in the Consolidated Balance Sheet of $10 million as of December 31, 2006. See Note 17 for additional information on the activity related to the redeemable noncontrolling interest.
Accounting for Uncertainty in Income Taxes
In July 2006, the FASB issued additional guidance which clarifies the accounting for uncertainty in income taxes recognized in the Company’s financial statements. The revised guidance also prescribes a recognition threshold and measurement model for the financial statement recognition and measurement of a tax position taken, or expected to be taken, in a tax return and provides guidance on derecognition, classification, interest and penalties, accounting in interim periods, disclosure and transition.
The Company adopted the provisions under this guidance on January 1, 2007. As a result of the implementation, the Company recognized a $9 million increase in unrecognized income tax benefits, primarily related to state income tax matters, along with $14 million of related potential interest and penalties. The items were recorded asOther liabilities—noncurrent with a corresponding reduction toRetained earningsin the Consolidated Balance Sheet as of January 1, 2007.
76
VIACOM INC.
NOTES TO CONSOLIDATED FINANCIAL STATEMENTS
(Continued)
Subsequent Events
The Company has performed an evaluation of subsequent events through February 11, 2010, which is the date the financial statements were issued.
Reclassification
Certain amounts have been reclassified to conform to the 2009 presentation.
NOTE 2. SUMMARY OF SIGNIFICANT ACCOUNTING POLICIES
Principles of Consolidation
The consolidated financial statements of the Company include the accounts of Viacom Inc., its subsidiaries and variable interest entities (VIEs) where the Company is considered the primary beneficiary, after elimination of intercompany accounts and transactions. Disclosure regarding the Company’s participation in VIEs is included in Note 3. Investments in business entities in which the Company lacks control but does have the ability to exercise significant influence over operating and financial policies are accounted for using the equity method. The Company’s proportionate share of net income or loss of the entity is recorded inEquity in net losses of investee companies in the Consolidated Statements of Earnings. Related party transactions between the Company and CBS Corporation, National Amusements Inc. (“NAI”) and Midway Games, Inc. (“Midway”) have not been eliminated.
Revenue Recognition
The Company recognizes revenue when it is realized or realizable and earned. The Company considers revenue realized or realizable and earned when it has persuasive evidence of an arrangement, delivery has occurred, the sales price is fixed and determinable, and collectibility is reasonably assured. Determining whether some or all of these criteria have been met involves assumptions and judgments, including the evaluation of multiple element arrangements, that can have a significant impact on the timing and amount of revenue the Company reports.
Advertising Revenues
Advertising revenue earned by theMedia Networks segment is recognized, net of agency commissions, when the advertisement is aired and the contracted audience rating is met. Should the advertisement fail to meet the contracted audience rating, the Company establishes a liability referred to as an audience deficiency unit liability. The liability is typically relieved when the audience rating is met through the provision of additional air time for the advertiser.
Feature Film Revenues
Revenue is recognized from theatrical distribution of motion pictures upon exhibition. For home entertainment product revenue, including sales to wholesalers and retailers, revenue is recognized upon the later of delivery or the date that those products are made widely available for sale by retailers. Revenue from the licensing of feature films and original programming for exhibition in television markets is recognized upon availability for airing by the licensee. Revenue for video-on-demand and similar pay-per-view arrangements are recognized as the feature films are exhibited based on end-customer purchases as reported by the distributor.
Affiliate Fees
Affiliate fees are recognized by theMedia Networks segment as the service is provided to cable television operators, direct-to-home satellite operators and other distributors.
Ancillary Revenues
Video game product revenues are evaluated under software revenue recognition guidance. Where a video game provides limited online features at no additional cost to the consumer, the Company generally considers such
77
VIACOM INC.
NOTES TO CONSOLIDATED FINANCIAL STATEMENTS
(Continued)
features to be incidental to the overall product offering and an inconsequential deliverable. Accordingly, the Company does not defer any revenue related to products containing these limited online features. In instances where online features or additional functionality is considered a substantive deliverable in addition to the software product, the Company recognizes revenue ratably over an estimated service period. This evaluation is performed for each software product that is released.
Licensing associated with consumer products is typically recognized utilizing contractual royalty rates applied to sales amounts reported by licensees. Revenue for online transactions, such as electronic downloads of films, programming or product add-ons is recognized when the fee is paid by the online customer to purchase the content, the Company is notified by the online retailer that the product has been downloaded and all other revenue recognition criteria are met. Ancillary online subscription revenues are generally recognized on a straight-line basis over the service period.
Gross versus Net Revenue
The Company earns and recognizes revenues as a distributor on behalf of third parties. In such cases, determining whether revenue should be reported on a gross or net basis is based on management’s assessment of whether the Company acts as the principal or agent in the transaction. To the extent the Company acts as the principal in a transaction, revenues are reported on a gross basis. Determining whether the Company acts as principal or agent in a transaction involves judgment and is based on an evaluation of whether the Company has the substantial risks and rewards of ownership under the terms of an arrangement.
The Company’s most significant arrangements are in connection with certain exclusive distribution rights to and home video fulfillment services for the animated feature films produced by DreamWorks Animation SKG, Inc. and the distribution agreements with MVL Productions LLC (“Marvel”), DW Funding LLC (“DW Funding”) and CBS Corporation. Under the terms of these agreements, the Company is generally responsible for all out-of-pocket costs, primarily comprised of distribution and marketing costs. For the provision of distribution services, the Company generally retains a fee based upon a percentage of gross receipts and recovers expended distribution and marketing costs on a title-by-title basis prior to any participation payments to the contracting parties of the films, except as pertains to certain contractually agreed upon advance payments. As primary obligor, revenue and related distribution and marketing costs for these arrangements are presented on a gross basis.
Sales Returns, Allowances & Uncollectible Accounts
The Company records a provision for sales returns and allowances, including price protection incentives, at the time of sale based upon an estimate of future returns, rebates and other incentives (“estimated returns”). In determining estimated returns, the Company considers numerous sources of qualitative and quantitative evidence including forecasted sales data, customers’ rights of return, units shipped and units remaining at retail, historical return rates for similar product, current economic trends, competitive environment, promotions and sales strategies. Reserves for accounts receivable are based on amounts estimated to be uncollectible.
Inventory
Inventories related to theatrical and original media network programming content (which include direct production costs, production overhead, acquisition costs and development costs) are stated at the lower of amortized cost or fair value.
Film inventories, which are included as a component ofInventory, net, in the Consolidated Balance Sheets, are amortized and estimated liabilities for residuals and participations are accrued using an individual-film-forecast-computation method based on the ratio of current period to estimated remaining total gross revenues (“ultimate
78
VIACOM INC.
NOTES TO CONSOLIDATED FINANCIAL STATEMENTS
(Continued)
revenues”). Ultimate revenues for feature films include revenues from all sources that are estimated to be earned within ten years from the date of a film’s initial theatrical release. For acquired film libraries, the Company’s estimate of ultimate revenues is for a period within 20 years from the date of acquisition. These estimates are periodically reviewed and adjustments, if any, will result in changes to inventory amortization rates, estimated accruals for residuals and participations or possibly the recognition of an impairment charge to operating income. The Company has entered into film financing arrangements that involve the sale of a partial copyright interest in a film. Amounts received under these arrangements are deducted from the film’s cost.
The cost of theatrical development projects is amortized over a three-year period unless they are abandoned earlier, in which case these projects are written down to their estimated net realizable value in the period the decision to abandon the project is determined. The Company has a rigorous greenlight process designed to manage the risk of loss or abandonment.
The Company acquires rights to programming and produces original programming to exhibit on its media networks which is also included as a component ofInventory, net,in the Consolidated Balance Sheets. The costs incurred in acquiring and producing programs are capitalized and amortized over the license period or projected useful life of the programming if shorter. Original programming development costs are expensed unless a project is greenlit for production. An impairment charge is recorded when the fair value of the original programming is less than the unamortized production cost or the programming is abandoned.
Acquired program rights and obligations are recorded based on the gross amount of the liability when the license period has begun, and when the program is accepted and available for airing. Acquired programming is stated at the lower of unamortized cost or net realizable value. Net realizable value of acquired rights programming is evaluated quarterly by the Company on a daypart basis, which is defined as an aggregation of programs broadcast during a particular time of day or an aggregation of programs of a similar type. The Company aggregates similar programming based on the specific demographic targeted by each respective program service. Net realizable value is determined by estimating advertising revenues to be derived from the future airing of the programming within the daypart as well as an allocation of affiliate fee revenue to the programming. An impairment charge may be necessary if the Company’s estimates of future cash flows of similar programming are insufficient or if programming is abandoned.
Merchandising and other inventories are valued at the lower of cost or net realizable value. Cost is determined using the average cost method. Obsolescence reserves are based on estimates of future product demand.
Advertising Expense
The Company expenses advertising costs as they are incurred. The Company incurred total advertising expenses of $1.295 billion, $1.662 billion and $1.628 billion in 2009, 2008 and 2007, respectively.
Business Combinations and Intangible Assets Including Goodwill
The Company accounts for business combinations using the acquisition method of accounting. Under the acquisition method, once control is obtained of a business, 100% of the assets, liabilities and certain contingent liabilities acquired, including amounts attributed to noncontrolling interests, are recorded at fair value. Goodwill represents the residual difference between the fair value of consideration paid and the net assets acquired, and transaction costs are expensed as incurred. Prior to 2009, the Company accounted for business combinations using the purchase method of accounting, which allocated the consideration to the fair value of the net assets acquired, including intangible assets, with the residual allocated to goodwill.
79
VIACOM INC.
NOTES TO CONSOLIDATED FINANCIAL STATEMENTS
(Continued)
Identifiable intangible assets with finite lives are amortized over their estimated useful lives, which range from 3 to 15 years. Goodwill and identifiable intangible assets with indefinite lives are not amortized, but rather are tested annually for impairment, or sooner when circumstances indicate impairment may exist.
Impairment
Amortizable intangible assets and other long-lived assets are tested for impairment utilizing an income approach based on undiscounted cash flows upon the occurrence of certain triggering events and, if impaired, written down to fair value. Goodwill and indefinite-lived intangible assets are tested for impairment using a fair value approach at the reporting unit level for goodwill. A reporting unit is the operating segment, or a business which is one level below that operating segment. For all periods presented, the Company’s reporting units are consistent with its operating segments in all material respects.
Comprehensive Income
Comprehensive income includes net earnings, foreign currency translation adjustments, amortization of amounts related to defined benefit plans, unrealized gains or losses on certain derivative financial instruments, and unrealized gains and losses on investments in equity securities which are publicly traded.
Earnings per Common Share
Basic earnings per common share excludes potentially dilutive securities and is computed by dividingNet earnings attributable to Viacom by the weighted average number of common shares outstanding during the period. The determination of diluted earnings per common share includes the potential dilutive effect of stock options, restricted share units (RSUs) and performance share units (PSUs) based upon the application of the treasury stock method. Anti-dilutive common shares were excluded from the calculation of diluted earnings per common share.
The following table sets forth the computation of the common shares outstanding utilized in determining basic and diluted earnings per common share and anti-dilutive shares:
| | | | | | |
| Common Shares Outstanding and Anti-Dilutive Common Shares | | Year Ended December 31, |
| (in millions) | | 2009 | | 2008 | | 2007 |
|
Weighted average common shares outstanding, basic | | 607.1 | | 624.7 | | 674.1 |
Dilutive effect of stock options | | - | | 0.2 | | 1.0 |
Dilutive effect of RSUs and PSUs | | 1.2 | | 0.5 | | 0.5 |
| | | | | | |
Weighted average common shares outstanding, diluted | | 608.3 | | 625.4 | | 675.6 |
| | | | | | |
Anti-dilutive common shares | | 41.1 | | 43.9 | | 39.1 |
Provision for Income Taxes
The Company’s provision for income taxes includes the current tax owed on the current period earnings, as well as a deferred provision which reflects the future tax consequences attributable to differences between the financial statement carrying amounts of existing assets and liabilities and their respective income tax bases. Deferred tax assets and liabilities are measured using enacted tax rates expected to apply to taxable income in the years in which those temporary differences are expected to be recovered or settled.
Uncertain tax positions are recorded based on a cumulative probability assessment if it is more likely than not – a more than 50 percent chance – that the tax position will be sustained upon examination by the appropriate tax authority with full knowledge of all relevant information. Amounts recorded for uncertain tax positions are periodically assessed, including the evaluation of new facts and circumstances, to ensure sustainability of the position. Interest and penalties related to uncertain tax positions are included in theProvision for income taxesin
80
VIACOM INC.
NOTES TO CONSOLIDATED FINANCIAL STATEMENTS
(Continued)
the Consolidated Statements of Earnings. Liabilities for uncertain tax positions are classified as Other liabilities – current ornoncurrent in the Consolidated Balance Sheets based on when they are expected to be paid.
Pension and Other Postretirement Benefits
The Company’s defined benefit pension plans principally consist of both funded and unfunded noncontributory plans covering the majority of domestic employees and retirees. Pension and other postretirement benefits are
based on formulas that reflect the employees’ years of service and compensation during their employment period and participation in the plans. The unfunded plans are currently frozen to future benefit accruals. The expense recognized by the Company is determined using certain assumptions, including the expected long-term rate of return, discount rate and rate of compensation increases, among others. The Company recognizes the funded status of its defined benefit and other postretirement plans (other than a multiemployer plan) as an asset or liability in the Consolidated Balance Sheets and recognizes changes in the funded status in the year in which the changes occur throughAccumulated other comprehensive income (loss)in the Consolidated Balance Sheets.
Property and Equipment
Property and equipment is stated at cost. Depreciation is calculated using the straight-line method. Leasehold improvements are amortized using the straight-line method over the shorter of their useful lives or the life of the lease. Costs associated with repairs and maintenance of property and equipment are expensed as incurred.
Software Development Costs
The Company capitalizes qualifying software development costs, principally in connection with its video game products, incurred after technological feasibility is established. Costs are not capitalized until the underlying product development is substantially complete, which generally includes the development of a working model.
Stock-Based Compensation
The Company measures the cost of employee services received in exchange for an award of equity instruments based on the grant-date fair value of the award. The fair value received is recognized in earnings over the period during which an employee is required to provide service. The Company elected the modified prospective application method in adopting the fair value accounting model in 2006, which required the Company to recognize the unvested portion of the grant date fair value of awards issued prior to January 1, 2006 over the remaining vesting period. The Company utilizes the long-form method for calculating the historical pool of windfall tax benefits and excludes the impact of pro-forma deferred tax assets on partially and fully vested awards at adoption date for purposes of calculating assumed proceeds under the treasury stock method for diluted earnings per share.
Securitizations
The Company sells to investors on a revolving non-recourse basis a percentage ownership interest in certain accounts receivable through wholly-owned special purpose entities. The receivable securitization programs are accounted for as sales. The Company retains interests in the trade accounts receivable that have not been sold to investors, and these retained interests are included in the Consolidated Balance Sheets under the captionReceivables, net. The retained interests in the receivables are shown at amounts expected to be collected by the Company, and such carrying value approximates the fair value of the Company’s retained interests. Under the securitization arrangements, the Company absorbs credit risk on the entire pool of accounts receivable which underlie the securitization up to the level of its retained interest. The Company’s historical level of charges for credit risk related to receivables has not been material to the Company’s financial position or results of operations.
Viacom is compensated for its services in the collection and administration of the securitized receivables. No servicing asset or liability has been recorded because the fees received for servicing the receivables approximates
81
VIACOM INC.
NOTES TO CONSOLIDATED FINANCIAL STATEMENTS
(Continued)
the related costs. Losses on the sale of receivables represent the financial cost of funding under the securitization programs and are included inOther items, net in the Consolidated Statements of Earnings.
Investments
The Company’s investments primarily consist of investments in affiliates and other investments. Investments in affiliates, over which the Company has a significant influence, but not a controlling interest, are accounted for using the equity method. Other investments are carried at fair value, to the extent publicly traded, with unrealized gains and losses recorded in other comprehensive income, or at cost. The Company monitors its investments for impairment at least annually and makes appropriate reductions in carrying values if the Company determines that an impairment charge is required based on qualitative and quantitative information. The Company’s investments are included inOther assets—noncurrent in the Consolidated Balance Sheets.
Guarantees
At the inception of a guarantee, the Company recognizes a liability for the fair value of an obligation assumed by issuing the guarantee. For guarantees which qualify as financial instruments, the liability is subsequently remeasured at fair value on a recurring basis and the change in fair value is reported as a component ofOther items, netin the Consolidated Statements of Earnings. For guarantees which do not qualify as financial instruments, the liability is subsequently reduced as utilized or extinguished and increased if there is a probable loss associated with the guarantee which exceeds the value of the recorded liability.
Restructuring Costs
Restructuring costs associated with exit or disposal activities are recorded at fair value and recognized when the costs are incurred.
Derivative Financial Instruments
Derivative financial instruments are recorded on the Consolidated Balance Sheets as assets or liabilities and measured at fair value. For derivatives designated as hedges of the fair value of assets or liabilities, the changes in fair value of both the derivatives and the hedged items are recorded in current earnings as part ofOther items, netin the Consolidated Statements of Earnings. For derivatives designated as cash flow hedges, the effective portion of the changes in fair value of the derivatives is recorded inAccumulated other comprehensive income (loss) in the Consolidated Balance Sheets and subsequently recognized in earnings when the hedged items impact income. Changes in the fair value of derivatives not designated as hedges and the ineffective portion of cash flow hedges are recorded in earnings. The Company does not hold or enter into financial instruments for speculative trading purposes.
Foreign Currency Translation
Assets and liabilities of subsidiaries with a functional currency other than U.S. dollar are translated into U.S. dollars using period-end exchange rates, while results of operations are translated at average exchange rates during the period. Foreign currency translation gains and losses are included as a component ofAccumulated other comprehensive income (loss)in the Consolidated Balance Sheets. Foreign subsidiaries using the United States (“U.S.”) Dollar as the functional currency include remeasurement adjustments in earnings.
Prior to January 1, 2009 the foreign operations of theFilmed Entertainmentsegment were consolidated using the United States (“U.S.”) Dollar as the functional currency as the majority of the cash inflows and outflows of these subsidiaries were denominated in U.S. Dollars. Due to changes in the terms and conditions of significant operating arrangements at theFilmed Entertainment segment, effective January 1, 2009 the majority of the cash inflows and outflows of these foreign operations are now denominated in local currency. Accordingly, substantially all of the Company’s foreign operations are consolidated using the local currency as the functional currency.
82
VIACOM INC.
NOTES TO CONSOLIDATED FINANCIAL STATEMENTS
(Continued)
Fair Value Measurements
Fair value is defined as the price that would be received to sell an asset or paid to transfer a liability in an orderly transaction between market participants. This clarified definition of fair value was adopted prospectively for all recurring measurements of fair value beginning on January 1, 2008, and for all nonrecurring measurements of fair value beginning on January 1, 2009. The framework for measuring fair value provides a hierarchy that prioritizes the inputs to valuation techniques used in measuring fair value. The hierarchy gives the highest priority to unadjusted quoted prices in active markets for identical assets or liabilities (Level 1 measurement) and the lowest priority to unobservable inputs (Level 3 measurement). The three levels of the fair value hierarchy are as follows:
Level 1 – Inputs to the valuation methodology are unadjusted quoted prices for identical assets or liabilities in active markets.
Level 2 – Inputs to the valuation methodology include: quoted prices for similar assets or liabilities in active markets; quoted prices for identical or similar assets or liabilities in inactive markets; inputs other than quoted prices that are observable for the asset or liability; inputs that are derived principally from or corroborated by observable market data by correlation or other means.
Level 3 – Inputs to the valuation methodology are unobservable and significant to the fair value measurement.
The Company’s recurring fair value measures relate to marketable securities and derivative instruments, including a financial guarantee. The Company’s non-financial assets and non-financial liabilities subject to non-recurring measures include goodwill and intangibles.
Treasury Stock
Treasury stock is accounted for using the cost method.
Cash and Cash Equivalents
All highly liquid investments with maturities of three months or less at the date of purchase are considered to be cash equivalents.
Use of Estimates
Preparing financial statements in conformity with generally accepted accounting principles (“GAAP”) requires management to make estimates, judgments and assumptions that affect the reported amounts of assets and liabilities as of the dates presented and the reported amounts of revenues and expenses during the reporting periods presented. Significant estimates inherent in the preparation of the accompanying Consolidated Financial Statements include estimates of film ultimate revenues, product returns, amount of receivables expected to be collected, potential outcome of uncertain tax positions, determination of fair value of acquired assets and liabilities, determination of fair value of stock based compensation and determination of pension benefit assumptions. Estimates are based on past experience and other considerations reasonable under the circumstances. Actual results may differ from these estimates.
NOTE 3. ACQUISITIONS & INVESTMENTS
In 2009, 2008 and 2007, the Company invested $133 million, $296 million and $70 million, respectively, in acquisitions and investments. In October 2009, the Company acquired the global rights to the Teenage Mutant Ninja Turtles for $64 million. Included in the 2008 amount is $150 million for an earn-out payment, subject to adjustment, related to the Company’s acquisition of Harmonix Music Systems Inc. (“Harmonix”). The
83
VIACOM INC.
NOTES TO CONSOLIDATED FINANCIAL STATEMENTS
(Continued)
acquisition agreement provided that to the extent financial results exceeded specific contractual targets against a defined gross profit metric through 2008, former Harmonix shareholders are eligible for incremental earn-out payments with respect to the years ended December 31, 2007 and December 31, 2008. See Note 16 for additional information.
The pro forma impact of business combinations completed during each of the years ended December 31, 2009, 2008 and 2007, either individually or in the aggregate, were not material to the Company.
At December 31, 2009 and 2008, the Company had equity method investments totaling $186 million and $238 million, respectively. The Company holds an equity interest in EPIX, a joint venture formed with Lionsgate and Metro-Goldwyn Mayer in April 2008 to exhibit certain motion pictures on behalf of the equity partners’ movie studios through a new premium pay television channel, video-on-demand service and Internet site, of approximately 50%. In November 2007, the Company established a joint venture (“Viacom 18”) with Network18 Fincap Limited (“Network18”), a leading entertainment and media company in India, through the Company’s contribution of its existing MTV Networks’ India operations, with cash and other consideration contributed to the venture by Network18. In August 2007, the Company contributed a $230 million non-interest bearing note payable and certain assets related to MTV’s URGE digital music service for a 49% stake in Rhapsody America LLC (“Rhapsody”), a newly formed venture with RealNetworks, Inc.
During 2007, the Company sold its non-controlling investment in MTV Russia, an international equity affiliate, for $191 million and recognized a pre-tax gain on the sale of $151 million.
Variable Interest Entities
In the normal course of business, the Company enters into joint ventures or makes investments with business partners that support its underlying business strategy and provide it the ability to enter new markets to expand the reach of its brands, develop new programming and/or distribute its existing content. In certain instances, an entity in which the Company makes an investment may qualify as a variable interest entity. In determining whether the Company is the primary beneficiary of those VIEs, it considers quantitative and qualitative factors as further described below.
Unconsolidated Variable Interest Entities
The Company has a number of unconsolidated investments in which it holds a non-controlling ownership interest, including but not limited to Rhapsody, EPIX and Viacom 18. These arrangements are typically entered into with strategic partners and generally contain the following governance provisions: (i) the funding of the venture is provided by the equity holders pro rata based on their ownership interest; (ii) the investments are initially funded to meet short-term working capital requirements with funding commitments provided by the partners to fund future operating needs; (iii) commercial arrangements between the Company, the venture and other related parties are negotiated between the parties and are believed to be at market rates; and (iv) voting rights are consistent with the equity holders’ rights and obligations to share in the profits and losses of the variable interest entity. In connection with these investment arrangements the Company does not hold a majority of the equity interest, nor does it absorb a majority of the expected losses or residual returns, and therefore does not qualify as the primary beneficiary. Accordingly, these investments are accounted for under the equity method of accounting and are included inOther assets-noncurrent in the Consolidated Balance Sheets. In these arrangements, the Company’s risk of loss is typically limited to its carrying value and future funding commitments.
The Company acquired 100% of DreamWorks on January 31, 2006, which included a live-action film library that was legally owned by DW Funding, a wholly owned subsidiary of DreamWorks. In May 2006, the Company
84
VIACOM INC.
NOTES TO CONSOLIDATED FINANCIAL STATEMENTS
(Continued)
sold a 51% controlling interest in DW Funding to Soros Strategic Partners LP (“Soros”) and Dune Entertainment II LLC (“Dune”) and retained a 49% interest. The Company acquired DreamWorks with the intention of selling the live-action film library close to or concurrently with the closing of the acquisition, but ultimately, the buyers sought terms which called for the Company to retain an interest in the film library. No gain or loss was recognized on the sale. The Company has certain rights and obligations to reacquire the library in 2011. Specifically, the Company is subject to a put option where it can be required to repurchase the 51% interest in DW Funding it does not own at fair market value. The Company also has a corresponding fair market value call option. In connection with the sale, DW Funding entered into senior borrowings with a third party and mezzanine financings with Soros and Dune, the proceeds of which were utilized to fund the cash paid to the Company for the sale of its controlling interest in DW Funding. The Company has guaranteed $204 million of certain unsecured mezzanine financing of DW Funding provided by Soros and Dune. At December 31, 2009 and 2008, the Company had $54 million and $53 million recorded for its guarantee related to DW Funding. See Note 7 for additional information. Additionally, in connection with the sale Paramount and its international affiliates retained the exclusive distribution rights to the live-action film library for a five-year period, renewable under certain circumstances, for which Paramount receives distribution fees.
Based upon the level of equity investment at risk, the Company determined that DW Funding was a VIE. In order to assess whether the Company would absorb the majority of expected losses, the Company quantitatively computed the expected losses to be absorbed by each of the variable interest holders and determined that the variable interest which it held, including the debt guaranteed, would not result in the Company absorbing the majority of expected losses of DW Funding. Based on the quantitative analysis and after considering qualitative factors including the nature and purpose of the transaction, the Company determined it was not the primary beneficiary of DW Funding. As a result, the Company accounts for its investment under the equity method of accounting.
At December 31, 2009 and 2008, the Company’s aggregate investment carrying value in VIEs was $144 million and $180 million, respectively, it has future contractual funding commitments of $177 million at December 31, 2009. The impact of the Company’s unconsolidated VIEs on its Consolidated Financial Statements, including related party transactions, is further described in Note 15.
Consolidated Variable Interest Entities
In April 2008, MTV Networks’ Hispanic-oriented cable network MTV Tr3s acquired an interest in a television broadcaster to expand its reach to Hispanic audiences in the Los Angeles and other southwest markets where the target company held broadcast licenses. The Company acquired a non-voting equity interest in the broadcaster of approximately 32% and has certain rights and funding obligations related to its investment, including the guarantee of third-party bank debt. The Company has determined that it is the primary beneficiary as it will absorb the majority of losses through its equity interest and via its guarantee of third-party bank debt. Accordingly, the Company consolidates the entity. As of December 31, 2009 and 2008, there are $43 million and $103 million of assets and $85 million and $78 million of liabilities, respectively, in respect of this entity included within the Company’s Consolidated Balance Sheets. The operating results of this consolidated VIE in 2009 included a $60 million non-cash impairment charge related to certain broadcast licenses held by the entity. The impact toNet earnings attributable to Viacom was a reduction of $19 million, with the remaining $41 million allocated to the noncontrolling interest. Except for the 2009 impairment charge, the revenues, expenses and operating income for 2009 and 2008 were not significant to the Company.
85
VIACOM INC.
NOTES TO CONSOLIDATED FINANCIAL STATEMENTS
(Continued)
NOTE 4. GOODWILL AND INTANGIBLES
Goodwill
For the years ended December 31, 2009 and 2008, the changes in the book value of goodwill by segment were as follows:
| | | | | | | | | | | |
| Goodwill | | Media Networks | | | Filmed Entertainment | | | |
| (in millions) | | | | Total | |
Balance at December 31, 2007 | | $ | 9,781 | | | $ | 1,594 | | $ | 11,375 | |
Additions | | | 21 | | | | 31 | | | 52 | |
Purchase price adjustments | | | 40 | | | | - | | | 40 | |
Foreign currency translation | | | 3 | | | | - | | | 3 | |
| | | | | | | | | | | |
Balance at December 31, 2008 | | | 9,845 | | | | 1,625 | | | 11,470 | |
Additions | | | - | | | | - | | | - | |
Purchase price adjustments | | | (87 | ) | | | - | | | (87 | ) |
Foreign currency translation | | | 18 | | | | - | | | 18 | |
| | | | | | | | | | | |
Balance at December 31, 2009 | | $ | 9,776 | | | $ | 1,625 | | $ | 11,401 | |
| | | �� | | | | | | | | |
Intangibles
The following table details the Company’s intangible asset balances by major asset classes:
| | | | | | | | |
| Intangibles | | December 31, | |
| (in millions) | | 2009 | | | 2008 | |
Finite lived intangible assets: | | | | | | | | |
Subscriber agreements | | $ | 61 | | | $ | 61 | |
Film distribution and fulfillment services | | | 344 | | | | 344 | |
Other intangible assets | | | 411 | | | | 359 | |
| | | | | | | | |
Total finite lived intangible assets | | | 816 | | | | 764 | |
Accumulated amortization on finite lived intangible assets : | | | | | | | | |
Subscriber agreements | | | (20 | ) | | | (16 | ) |
Film distribution and fulfillment services | | | (184 | ) | | | (136 | ) |
Other intangible assets | | | (199 | ) | | | (151 | ) |
| | | | | | | | |
Total accumulated amortization on finite lived intangible assets : | | | (403 | ) | | | (303 | ) |
| | | | | | | | |
Finite lived intangible assets, net | | $ | 413 | | | $ | 461 | |
| | | | | | | | |
Trademarks and other, indefinite lived | | | 157 | | | | 213 | |
| | | | | | | | |
Total intangibles, net | | $ | 570 | | | $ | 674 | |
| | | | | | | | |
Amortization expense relating to intangible assets was $165 million, $141 million and $143 million in 2009, 2008 and 2007, respectively. The Company expects its aggregate annual amortization expense for existing intangible assets subject to amortization at December 31, 2009 to be as follows for each of the next five years:
| | | | | | | | | | | | | | | |
| Amortization of Intangibles | | | | | | | | | | |
| (in millions) | | 2010 | | 2011 | | 2012 | | 2013 | | 2014 |
Amortization expense | | $ | 102 | | $ | 84 | | $ | 59 | | $ | 53 | | $ | 18 |
86
VIACOM INC.
NOTES TO CONSOLIDATED FINANCIAL STATEMENTS
(Continued)
NOTE 5. INVENTORY
| | | | | | | | |
| Inventory | | December 31, | |
| (in millions) | | 2009 | | | 2008 | |
Film inventory: | | | | | | | | |
Released, net of amortization | | $ | 770 | | | $ | 840 | |
Completed, not yet released | | | 173 | | | | 263 | |
In process and other | | | 467 | | | | 826 | |
| | | | | | | | |
Total film inventory, net of amortization | | | 1,410 | | | | 1,929 | |
Original programming: | | | | | | | | |
Released, net of amortization | | | 956 | | | | 844 | |
Completed, not yet released | | | 6 | | | | - | |
In process and other | | | 451 | | | | 409 | |
| | | | | | | | |
Total original programming, net of amortization | | | 1,413 | | | | 1,253 | |
Acquired program rights, net of amortization | | | 1,504 | | | | 1,474 | |
Merchandise and other inventory, net of allowance of $108 and $119 | | | 183 | | | | 358 | |
| | | | | | | | |
Total inventory, net | | | 4,510 | | | | 5,014 | |
Less current portion of inventory, net | | | (779 | ) | | | (881 | ) |
| | | | | | | | |
Total inventory-noncurrent, net | | $ | 3,731 | | | $ | 4,133 | |
| | | | | | | | |
The Company expects to amortize approximately $868 million of original programming and film inventory, including released and completed, not yet released during the year ending December 31, 2010 using the individual-film-forecast-computation method. In addition, the Company expects to amortize 80% of unamortized released original programming and film inventory, excluding acquired film libraries, at December 31, 2009 within the next three years. As of December 31, 2009, unamortized film libraries of approximately $57 million remain to be amortized on a straight-line basis over an average remaining life of four years.
NOTE 6. DEBT
Total debt of the Company consists of the following:
| | | | | | | | |
| Debt | | December 31, | |
| (in millions) | | 2009 | | | 2008 | |
Senior Notes and Debentures: | | | | | | | | |
Senior notes due 2009 | | $ | - | | | $ | 750 | |
Senior notes due 2011, 5.750% | | | 193 | | | | 1,496 | |
Senior notes due 2014, 4.375% | | | 596 | | | | - | |
Senior notes due 2015, 4.250% | | | 250 | | | | - | |
Senior notes due 2016, 6.250% | | | 1,496 | | | | 1,495 | |
Senior notes due 2017, 6.125% | | | 497 | | | | 497 | |
Senior notes due 2019, 5.625% | | | 554 | | | | - | |
Senior debentures due 2036, 6.875% | | | 1,735 | | | | 1,734 | |
Senior debentures due 2037, 6.750% | | | 248 | | | | 248 | |
Senior notes due 2055, 6.850% | | | 750 | | | | 750 | |
Commercial paper | | | 16 | | | | - | |
Credit facility | | | - | | | | 650 | |
Capital lease and other obligations | | | 438 | | | | 382 | |
| | | | | | | | |
Total debt | | | 6,773 | | | | 8,002 | |
Less current portion | | | (123 | ) | | | (105 | ) |
| | | | | | | | |
Total non-current portion | | $ | 6,650 | | | $ | 7,897 | |
| | | | | | | | |
87
VIACOM INC.
NOTES TO CONSOLIDATED FINANCIAL STATEMENTS
(Continued)
Senior Notes and Debentures
In the third quarter of 2009 the Company issued a total of $1.4 billion of senior notes with maturities of five, six and ten years and used the proceeds to repurchase a substantial portion of its shorter term 5.75% Senior Notes due 2011 as further described below.
In August 2009, the Company issued $600 million aggregate principal amount of 4.375% Senior Notes due 2014 at a price equal to 99.291% of the principal amount, and $250 million aggregate principal amount of 5.625% Senior Notes due 2019 at a price equal to 99.247% of the principal amount. In September 2009, the Company issued $250 million aggregate principal amount of 4.250% Senior Notes due 2015 at a price equal to 99.814% of the principal amount, and an additional $300 million aggregate principal amount of its 5.625% Senior Notes due 2019 at a price equal to 101.938% of the principal amount.
The Company used the net cash proceeds from these offerings of $1.393 billion to conduct a cash tender offer to repurchase any and all of the aggregate principal of its $1.5 billion 5.75% Senior Notes due 2011 at a purchase price of $1,061.25 per $1,000 of principal. The Company’s repurchase of $1.307 billion of principal pursuant to the tender offer resulted in a pre-tax extinguishment loss of $84 million. At December 31, 2009, $193 million of principal remains outstanding on the 5.75% Senior Notes due 2011.
In 2009, the Company also repurchased in the open market or paid off at maturity its $750 million of Senior Notes due June 16, 2009.
In October 2007, the Company sold $500 million aggregate principal amount of 6.125% Senior Notes due 2017 at a price equal to 99.286% of the principal amount, and $250 million aggregate principal amount of 6.750% Senior Debentures due 2037 at a price equal to 99.275% of the principal amount. The Company used the net cash proceeds of $740 million to repay amounts outstanding under its revolving credit facility and its commercial paper program.
The Company’s outstanding senior notes and debentures provide for certain covenant packages typical for an investment grade company. There is one acceleration trigger for certain of the senior notes and debentures in the event of a change in control under certain specified circumstances coupled with ratings downgrades due to the change in control. At December 31, 2009 and 2008, the total unamortized net discount related to the fixed rate senior notes and debentures was $24 million and $30 million, respectively.
Credit Facility
At December 31, 2009 and 2008, the Company had a single $3.25 billion revolving facility due December 2010. There are no amounts outstanding under the credit facility at December 31, 2009. The primary purpose of the facility is to fund short-term liquidity needs and to support commercial paper borrowings. Borrowing rates under the revolving facility are determined at the time of each borrowing and are based generally on the LIBOR plus a margin based on the senior unsecured credit rating of the Company. A facility fee is paid based on the total amount of the commitments. In addition, the Company may borrow in certain foreign currencies up to specified limits under the revolving facility. The credit facility contains typical covenants for an investment grade company. The one principal financial covenant requires the Company’s interest coverage for the most recent four consecutive fiscal quarters to be at least 3.0x, which it met at December 31, 2009. As of December 31, 2009, it was approximately 8.0x. At December 31, 2009, $3.205 billion was available under the revolving credit facility, after deducting commercial paper borrowings and letters of credit.
Commercial Paper
At December 31, 2009, the outstanding commercial paper of $16 million had a weighted average interest rate of 0.22% and a weighted average maturity of less than 30 days. No amount was outstanding as of December 31, 2008.
88
VIACOM INC.
NOTES TO CONSOLIDATED FINANCIAL STATEMENTS
(Continued)
Amounts classified in the current portion of debt consist of commercial paper and the portion of capital leases and other obligations payable in the next twelve months.
The Company’s scheduled maturities of debt at face value, excluding capital leases, outstanding at December 31, 2009 were as follows:
| | | | | | | | | | | | | | | | | | |
| Maturities of Debt Excluding Capital Leases | | | | | | | | | | | | 2015 - Thereafter |
| (in millions) | | 2010 | | 2011 | | 2012 | | 2013 | | 2014 | |
|
Debt | | $ | 81 | | $ | 240 | | $ | - | | $ | 81 | | $ | 600 | | $ | 5,550 |
The fair value of the Company’s senior notes and debentures exceeded the carrying value by $335 million as of December 31, 2009. The carrying value of the Company’s senior notes and debentures exceeded the fair value by $1.07 billion as of December 31, 2008. Fair value of the commercial paper approximates book value due to its short term maturity.
The valuation of the Company’s publicly traded debt is based on a market approach and fair value is determined utilizing Level 1 inputs.
NOTE 7. FINANCIAL INSTRUMENTS
The Company uses derivative financial instruments to modify its exposure to market risks from changes in foreign exchange rates and interest rates. The Company conducts business in various countries outside the United States, resulting in exposure to movements in foreign exchange rates when translating from the foreign local currency to the U.S. Dollar. Foreign currency forward contracts are used to economically hedge anticipated cash flows and foreign currency balances in such currencies as the British Pound, the Australian Dollar, the Euro, the Japanese Yen and the Canadian Dollar. From time to time the Company enters into forward contracts to hedge future production costs or programming obligations or a hedge of the foreign currency exposure of a net investment in a foreign operation. The change in fair value of non-designated foreign exchange contracts is included in current period earnings as part ofOther items, net in the Consolidated Statements of Earnings. The Company manages the use of foreign exchange derivatives centrally.
At December 31, 2009 and 2008, the notional value of all foreign exchange contracts was $300 million and $3 million, respectively. In 2009, $233 million related to net investments in foreign operations, $51 million related to expected foreign currency net cash flows and $16 million related to programming obligations. In 2008, these contracts related to the hedging of future production costs. The net fair value of the Company’s foreign exchange contracts was a $3 million liability as of December 31, 2009.
A portion of the Company’s interest expense is exposed to movements in short-term rates. Interest rate hedges may be used to modify this exposure at the discretion of the Company. As of December 31, 2009 and 2008, there were no interest rate hedges outstanding, however the Company had unrecognized gains related to terminated interest rate swaps of $39 million and $44 million, respectively, which are included inAccumulated other comprehensive income (loss)in the Consolidated Balance Sheets. Such balances are being recognized as a reduction of Interest expense, net in the Consolidated Statements of Earnings over the life of the related senior notes and debentures.
89
VIACOM INC.
NOTES TO CONSOLIDATED FINANCIAL STATEMENTS
(Continued)
The following table summarizes the valuation of the Company’s financial assets and liabilities as of December 31, 2009 and 2008:
| | | | | | | | | | | | | | | |
Financial Asset (Liability) (in millions) | | Total | | | Quoted Prices In
Active Markets for
Identical Assets Level 1 | | Significant Other
Observable Inputs Level 2 | | | Significant
Unobservable Inputs Level 3 | |
December 31, 2009 | | | | | | | | | | | | | | | |
Marketable securities | | $ | 79 | | | $ | 79 | | $ | - | | | $ | - | |
Other financial instruments | | | (57 | ) | | | - | | | (3 | ) | | | (54 | ) |
| | | | | | | | | | | | | | | |
Total | | $ | 22 | | | $ | 79 | | $ | (3 | ) | | $ | (54 | ) |
| | | | | | | | | | | | | | | |
December 31, 2008 | | | | | | | | | | | | | | | |
Marketable securities | | $ | 56 | | | $ | 56 | | $ | - | | | $ | - | |
Other financial instruments | | | (53 | ) | | | - | | | - | | | | (53 | ) |
| | | | | | | | | | | | | | | |
Total | | $ | 3 | | | $ | 56 | | $ | - | | | $ | (53 | ) |
| | | | | | | | | | | | | | | |
The $54 million and $53 million of other financial instruments measured using significant unobservable inputs as of December 31, 2009 and 2008, respectively, relate to the Company’s guarantee of certain debt of DW Funding as more fully described in Note 3. The change in fair value during the reporting periods is reflected as a component ofOther items, net in the Company’s Consolidated Statements of Earnings. During 2009 and 2008, the change in fair value had a de minimis impact on the Consolidated Statements of Earnings. The fair value of the guarantee is determined utilizing a discounted cash flow model. The significant assumptions utilized are the risk-adjusted projected net cash flows of the library and the discount rate. The discount rate was approximately 9% at December 31, 2009.
NOTE 8. RECEIVABLES
At December 31, 2009 and 2008Receivables, net (including retained interests in securitizations) were as follows:
| | | | | | | | |
| Receivables, net (including retained interests in securitizations) | | December 31, | |
| (in millions) | | 2009 | | | 2008 | |
Securitized pools of trade receivables | | $ | 1,931 | | | $ | 2,348 | |
Interests in securitizations sold to third parties | | | - | | | | (950 | ) |
| | | | | | | | |
Retained interests in securitizations | | | 1,931 | | | | 1,398 | |
Receivables not subject to securitizations | | | 1,044 | | | | 972 | |
| | | | | | | | |
Receivables, including retained interests in securitizations | | | 2,975 | | | | 2,370 | |
Less allowance for doubtful accounts | | | (94 | ) | | | (99 | ) |
| | | | | | | | |
Total receivables, net | | $ | 2,881 | | | $ | 2,271 | |
| | | | | | | | |
The level of securitized receivables sold to third parties was $0 and $950 million at December 31, 2009 and December 31, 2008, respectively. The capacity of the Company’s receivable securitization programs at December 31, 2009 was $775 million. The Company plans to use the programs from time to time to supplement working capital requirements as needed. The terms of the revolving securitization arrangements require that the receivable pools meet certain performance ratios. At December 31, 2009, the Company was in compliance with the required ratios under the receivable securitization programs. The financial cost of funding and the cash flow impact of the securitization programs to the Company’s operating cash flows are included in Note 17.
The Company does not believe its receivables represent significant concentrations of credit risk at December 31, 2009, due to the wide variety of customers, markets and geographic areas from which the Company derives its revenue. While the Company is exposed to credit loss in the event of nonpayment by its customers, the Company believes its allowance for doubtful accounts is sufficient to cover any anticipated nonpayment by customers.
90
VIACOM INC.
NOTES TO CONSOLIDATED FINANCIAL STATEMENTS
(Continued)
NOTE 9. STOCKHOLDERS’ EQUITY
Common Stock
The Viacom Board of Directors has the power to issue shares of authorized but unissued Class A common stock and Class B common stock without further stockholder action, subject to the requirements of applicable law and stock exchanges. Viacom’s certificate of incorporation authorizes 375 million shares of Class A common stock and 5 billion shares of Class B common stock. The number of authorized shares of Class A common stock and Class B common stock could be increased with the approval of the stockholders of a majority of the outstanding shares of Class A common stock and without any action by the holders of shares of Class B common stock.
The following is a description of the material terms of Viacom’s capital stock. The following description is not meant to be complete and is qualified by reference to Viacom’s certificate of incorporation and bylaws and Delaware General Corporation Law.
Voting Rights
Holders of Class A common stock are entitled to one vote per share. Holders of Class B common stock do not have any voting rights, except as required by Delaware law. Generally, all matters to be voted on by Viacom stockholders must be approved by a majority of the aggregate voting power of the shares of Class A common stock present in person or represented by proxy, except as required by Delaware law.
Dividends
Stockholders of Class A common stock and Class B common stock will share ratably in any cash dividend declared by the Board of Directors, subject to any preferential rights of any outstanding preferred stock. Viacom does not currently pay a cash dividend, and any decision to pay a cash dividend in the future will be at the discretion of the Board of Directors and will depend on many factors.
Conversion
So long as there are 5,000 shares of Class A common stock outstanding, each share of Class A common stock will be convertible at the option of the holder of such share into one share of Class B common stock.
Liquidation Rights
In the event of liquidation, dissolution or winding-up of Viacom, all stockholders of common stock, regardless of class, will be entitled to share ratably in any assets available for distributions to stockholders of shares of Viacom common stock subject to the preferential rights of any outstanding preferred stock.
Split, Subdivisions or Combination
In the event of a split, subdivision or combination of the outstanding shares of Class A common stock or Class B common stock, the outstanding shares of the other class of common stock will be divided proportionally.
Preemptive Rights
Shares of Class A common stock and Class B common stock do not entitle a stockholder to any preemptive rights enabling a stockholder to subscribe for or receive shares of stock of any class or any other securities convertible into shares of stock of any class of Viacom.
Preferred Stock
The Company’s capital stock includes 25 million authorized shares of preferred stock with a par value of $0.001 per share. At December 31, 2009 and 2008, none of the 25 million authorized shares of the preferred stock were issued and outstanding.
91
VIACOM INC.
NOTES TO CONSOLIDATED FINANCIAL STATEMENTS
(Continued)
Other Comprehensive Income (Loss)
Total changes in stockholders’ equity are included in the Consolidated Statements of Stockholders’ Equity and Comprehensive Income. The pre-tax and after-tax components ofOther comprehensive income (loss) are as follows:
| | | | | | | | | | | | |
Other Comprehensive Income (Loss) (in millions) | | Pre-Tax | | | Tax | | | After-Tax | |
Year ended December 31, 2007 | | | | | | | | | | | | |
Translation adjustments | | $ | 69 | | | $ | - | | | $ | 69 | |
Unrealized loss on securities | | | (5 | ) | | | 2 | | | | (3 | ) |
Cash flow hedges | | | (3 | ) | | | 1 | | | | (2 | ) |
Defined benefit pension plans | | | 29 | | | | (13 | ) | | | 16 | |
| | | | | | | | | | | | |
| | $ | 90 | | | $ | (10 | ) | | $ | 80 | |
| | | | | | | | | | | | |
Year ended December 31, 2008 | | | | | | | | | | | | |
Translation adjustments | | $ | (54 | ) | | $ | - | | | $ | (54 | ) |
Unrealized loss on securities | | | (1 | ) | | | 1 | | | | - | |
Cash flow hedges | | | (6 | ) | | | 2 | | | | (4 | ) |
Defined benefit pension plans | | | (194 | ) | | | 75 | | | | (119 | ) |
| | | | | | | | | | | | |
| | $ | (255 | ) | | $ | 78 | | | $ | (177 | ) |
| | | | | | | | | | | | |
Year ended December 31, 2009 | | | | | | | | | | | | |
Translation adjustments | | $ | 31 | | | $ | - | | | $ | 31 | |
Unrealized gain on securities | | | 7 | | | | (2 | ) | | | 5 | |
Cash flow hedges | | | (12 | ) | | | 7 | | | | (5 | ) |
Defined benefit pension plans | | | 87 | | | | (35 | ) | | | 52 | |
| | | | | | | | | | | | |
| | $ | 113 | | | $ | (30 | ) | | $ | 83 | |
| | | | | | | | | | | | |
The components ofAccumulated other comprehensive income (loss) are as follows:
| | | | | | | | | | | | |
| Accumulated Other Comprehensive Income (Loss) | | December 31, | |
| (in millions) | | 2009 | | | 2008 | | | 2007 | |
Translation adjustments* | | $ | 94 | | | $ | 62 | | | $ | 102 | |
Unrealized (loss) gain on securities | | | 3 | | | | (2 | ) | | | (2 | ) |
Cash flow hedges | | | 39 | | | | 44 | | | | 48 | |
Pension and post retirement related amounts | | | (101 | ) | | | (153 | ) | | | (34 | ) |
| | | | | | | | | | | | |
| | $ | 35 | | | $ | (49 | ) | | $ | 114 | |
| | | | | | | | | | | | |
| * | $1 million, $14 million and $(2) million relate to translation adjustments of noncontrolling interests and redeemable noncontrolling interest for 2009, 2008 and 2007, respectively. |
NOTE 10. STOCK REPURCHASE PROGRAM
Since December 31, 2008, the Company has not purchased any shares under its stock repurchase program but may resume purchases in the future based on a variety of factors. At December 31, 2009, there is $1.275 billion available to make purchases under the program. From June 23, 2007 to December 31, 2008, the Company repurchased shares of its Class B common stock under a $4.0 billion stock repurchase program. Prior to June 23, 2007 the Company repurchased shares of its Class B common stock under a $3.0 billion stock repurchase program.
For the year ended December 31, 2008, 35.1 million shares were repurchased in the open market under the $4.0 billion program for an aggregate purchase price of $1.099 billion and an additional 3.6 million shares were purchased under the NAIRI Agreement with NAI for an aggregate purchase price of $124 million. The NAIRI Agreement was terminated October 10, 2008.
92
VIACOM INC.
NOTES TO CONSOLIDATED FINANCIAL STATEMENTS
(Continued)
NOTE 11. STOCK BASED COMPENSATION
The Company’s 2006 Long-Term Management Incentive Plan (the “LTMIP”) provides for various types of equity awards, including stock options, stock appreciation rights, restricted shares, restricted share units (“RSUs”), unrestricted shares of Class B common stock, phantom shares, dividend equivalents, performance awards (including performance share units (“PSUs”)) and other awards, or a combination of any of the above. In addition, the Company’s director equity plans provide for automatic grants of stock options and RSUs to outside directors each year.
The Company has primarily granted stock options and RSUs to employees. Certain senior executives have also received PSUs. Stock options generally vest ratably over a four-year period from the date of grant and expire eight to ten years after the date of grant. RSUs typically vest ratably over a four-year period from the date of the grant. The Company grants PSUs with the target number of PSUs granted to each executive representing the right to receive one share of Class B common stock, subject to adjustment depending on the total shareholder return (“TSR”) of the Company’s Class B common stock measured against the TSR of the common stock of the companies comprising the S&P 500 Index at the start of the measurement period. The measurement period is at least three years. The number of shares of Class B common stock an executive is entitled to receive at the end of the applicable measurement period ranges from 0% to 200/300% of the target PSU award. If Viacom’s percentile rank of TSR relative to the TSR for the companies in the S&P 500 Index is less than the 25th percentile, the target grant is forfeited unless the Company has achieved a specified level of earnings per share set for the measurement period, in which case the executive would receive a percentage of the target award.
Upon the exercise of a stock option award or the vesting of RSUs, shares of Class B common stock are issued from authorized but unissued shares or from treasury stock. At December 31, 2009, the Company had 151.5 million shares in treasury. The aggregate number of equity awards authorized and available under the LTMIP for future grants as of December 31, 2009 and December 31, 2008 approximated 44.7 million and 40.9 million, respectively, assuming that outstanding PSU awards are paid at target except for those awards for which the measurement period has been completed.
Presented below is a summary of the compensation cost recognized in the accompanying Consolidated Statements of Earnings:
| | | | | | | | | |
| Stock Based Compensation Expense | | Year Ended December 31, |
| (in millions) | | 2009 | | 2008 | | 2007 |
Recognized in earnings: | | | | | | | | | |
Stock options | | $ | 34 | | $ | 42 | | $ | 46 |
Restricted share units | | | 34 | | | 34 | | | 29 |
Performance share units | | | 34 | | | 23 | | | 11 |
| | | | | | | | | |
Total compensation cost in earnings | | $ | 102 | | $ | 99 | | $ | 86 |
| | | | | | | | | |
Tax benefit recognized | | $ | 38 | | $ | 37 | | $ | 33 |
Capitalized stock based compensation expense | | $ | 11 | | $ | 14 | | $ | 11 |
Stock Options
The fair value of each option grant is estimated on the date of grant using the Black-Scholes option-pricing model. The determination of volatility is principally based upon implied volatilities from traded options. The expected term, representing the period of time that options granted are expected to be outstanding, is estimated using a lattice-based model incorporating historical post vest exercise and employee termination behavior. The risk-free rate assumed in valuing the options is based on the U.S. Treasury Yield curve in effect applied against the expected term
93
VIACOM INC.
NOTES TO CONSOLIDATED FINANCIAL STATEMENTS
(Continued)
of the option at the time of the grant. Below are the weighted average fair value of awards granted in the periods presented and the weighted average of the applicable assumptions used to value stock options at grant date:
| | | | | | | | | |
| | | Year Ended December 31, |
| Key Assumptions | | 2009 | | 2008 | | 2007 |
Weighted average fair value of grants | | $ | 13.06 | | $ | 11.50 | | $ | 12.20 |
Weighted average assumptions: | | | | | | | | | |
Expected stock price volatility | | | 63.5% | | | 30.3% | | | 20.9% |
Expected term of options (in years) | | | 5.5 | | | 5.0 | | | 4.7 |
Risk-free interest rate | | | 2.7% | | | 3.3% | | | 4.8% |
Expected dividend yield | | | - | | | - | | | - |
The following table summarizes information about the Company’s stock option transactions:
| | | | | | | | | | | | | | | | | | |
| | | 2009 | | 2008 | | 2007 |
Stock Options (number of options in thousands) | | Options | | | Weighted
average
exercise
price | | Options | | | Weighted
average
exercise
price | | Options | | | Weighted
average
exercise
price |
Outstanding at the beginning of the year | | 42,018.8 | | | $ | 48.15 | | 43,741.5 | | | $ | 49.69 | | 48,316.8 | | | $ | 48.77 |
Granted | | 2,960.4 | | | | 22.63 | | 4,748.0 | | | | 35.28 | | 4,269.6 | | | | 43.85 |
Exercised | | (30.5 | ) | | | 22.70 | | (115.0 | ) | | | 23.83 | | (3,698.6 | ) | | | 28.17 |
Forfeited or expired | | (8,936.1 | ) | | | 49.38 | | (6,355.7 | ) | | | 49.54 | | (5,146.3 | ) | | | 51.67 |
| | | | | | | | | | | | | | | | | | |
Outstanding at the end of the year | | 36,012.6 | | | $ | 45.77 | | 42,018.8 | | | $ | 48.15 | | 43,741.5 | | | $ | 49.69 |
| | | | | | | | | | | | | | | | | | |
Exercisable at the end of the year | | 27,208.1 | | | $ | 49.88 | | 31,144.6 | | | $ | 51.44 | | 33,435.5 | | | $ | 52.24 |
The weighted average remaining contractual life of stock options outstanding and exercisable, respectively, at December 31, 2009 is 4 years and 3 years. The aggregate intrinsic value of stock options outstanding and exercisable, respectively, at December 31, 2009 is $20 million and $0.
The following table summarizes information relating to stock option exercises during the periods presented:
| | | | | | | | | |
| Stock Option Exercises | | Year Ended December 31, |
| (in millions) | | 2009 | | 2008 | | 2007 |
Proceeds from stock option exercises | | $ | 1 | | $ | 3 | | $ | 104 |
Intrinsic value | | $ | - | | $ | 2 | | $ | 51 |
Tax benefit | | $ | - | | $ | 1 | | $ | 17 |
Total unrecognized compensation cost related to unvested stock option awards at December 31, 2009 is approximately $78 million and is expected to be recognized on a straight-line basis over a weighted-average period of 2 years.
Restricted Share Units
The following table summarizes activity relating to the Company’s RSUs:
| | | | | | | | | | | | | | | | | | |
| | | 2009 | | 2008 | | 2007 |
Restricted Share Units (number of options in thousands) | | Number of Shares | | | Weighted
average
grant date fair
value | | Number of Shares | | | Weighted
average
grant date fair
value | | Number of Shares | | | Weighted
average
grant date fair
value |
Unvested at the beginning of the year | | 2,879.8 | | | $ | 37.95 | | 2,582.2 | | | $ | 40.46 | | 2,393.4 | | | $ | 38.75 |
Granted | | 2,679.8 | | | | 22.61 | | 1,410.7 | | | | 35.31 | | 1,112.1 | | | | 43.52 |
Vested | | (1,005.6 | ) | | | 38.90 | | (846.0 | ) | | | 40.72 | | (620.9 | ) | | | 39.86 |
Forfeited | | (456.6 | ) | | | 33.75 | | (267.1 | ) | | | 39.42 | | (302.4 | ) | | | 40.54 |
| | | | | | | | | | | | | | | | | | |
Unvested at the end of the year | | 4,097.4 | | | $ | 28.15 | | 2,879.8 | | | $ | 37.95 | | 2,582.2 | | | $ | 40.46 |
| | | | | | | | | | | | | | | | | | |
94
VIACOM INC.
NOTES TO CONSOLIDATED FINANCIAL STATEMENTS
(Continued)
The total weighted average remaining contractual life and aggregate intrinsic value of unvested RSUs at December 31, 2009 is 2 years and $122 million, respectively. At December 31, 2009, 16,480 RSUs were vested and deferred with a weighted average grant date fair value of $41.21 and an aggregate intrinsic value of $1 million.
The fair value of RSUs vested during the years ended December 31, 2009, 2008 and 2007 was $23 million, $29 million and $29 million, respectively. Total unrecognized compensation cost related to RSUs at December 31, 2009 is approximately $88 million and is expected to be recognized over a weighted-average period of 2 years.
Performance Share Units
The grant date fair value for the PSUs subject to the market and performance condition indicated earlier in this note is computed using a Monte Carlo model to estimate the total return ranking of Viacom among the S&P 500 Index companies on the date of grant over the measurement periods. Compensation cost assumes all performance goals will be met and is being recognized as the requisite service period is fulfilled.
The following table summarizes activity relating to the Company’s PSUs:
| | | | | | | | | | | | | | | | | | |
| | | 2009 | | 2008 | | 2007 |
Performance Share Units (number of shares in thousands) | | Number of shares | | | Weighted
average
grant date fair
value | | Number of shares | | | Weighted
average
grant date fair
value | | Number of shares | | | Weighted
average
grant date fair
value |
Unvested at the beginning of the year | | 1,318.4 | | | $ | 61.56 | | 635.5 | | | $ | 65.19 | | - | | | $ | - |
Granted | | 780.5 | | | | 37.39 | | 704.6 | | | | 57.82 | | 638.5 | | | | 65.13 |
Vested | | (5.3 | ) | | | 46.59 | | (2.5 | ) | | | 51.59 | | (0.2 | ) | | | 51.59 |
Forfeited | | (51.8 | ) | | | 51.40 | | (19.2 | ) | | | 46.21 | | (2.8 | ) | | | 51.59 |
| | | | | | | | | | | | | | | | | | |
Unvested at the end of the year | | 2,041.8 | | | $ | 52.61 | | 1,318.4 | | | $ | 61.56 | | 635.5 | | | $ | 65.19 |
| | | | | | | | | | | | | | | | | | |
The total weighted average contractual life and aggregate intrinsic value of unvested PSUs at December 31, 2009 is 1 year and $61 million, respectively. The fair value of PSUs vested during the years ended December 31, 2009, 2008 and 2007 was not material. Total unrecognized compensation cost related to PSUs at December 31, 2009 is approximately $33 million and is expected to be recognized on a straight-line basis over a weighted-average period of 2 years.
NOTE 12. PENSION AND OTHER POSTRETIREMENT BENEFITS
The Company’s defined benefit pension plans principally consist of both funded and unfunded noncontributory plans covering the majority of domestic employees and retirees. The funded plan provides a defined benefit based on a percentage of eligible compensation for periods of service. The unfunded pension plans are currently frozen to future benefit accruals. In addition, eligible employees participate in Viacom-sponsored health and welfare plans that provide certain postretirement health care and life insurance benefits to retired employees and their covered dependents. Most of the health and welfare plans are contributory and contain cost-sharing features such as deductibles and coinsurance which are adjusted annually. Claims are paid either through certain trusts funded by Viacom or by the Company’s own funds.
95
VIACOM INC.
NOTES TO CONSOLIDATED FINANCIAL STATEMENTS
(Continued)
A December 31st measurement date is used for all pension and other postretirement benefit plans. The following tables summarize changes in the benefit obligation, the plan assets and the funded status of the Company’s pension and postretirement benefit plans:
| | | | | | | | | | | | | | | | |
| | | Year Ended December 31, | |
| Change in Benefit Obligation | | 2009 | | | 2008 | | | 2009 | | | 2008 | |
| (in millions) | | Pension Benefits | | | Postretirement Benefits | |
Benefit obligation, beginning of period | | $ | 648 | | | $ | 535 | | | $ | 12 | | | $ | 10 | |
Service cost | | | 27 | | | | 35 | | | | 1 | | | | 1 | |
Interest cost | | | 38 | | | | 34 | | | | 1 | | | | 1 | |
Amendments | | | 1 | | | | - | | | | - | | | | - | |
Actuarial (gain) / loss | | | (25 | ) | | | 55 | | | | (1 | ) | | | 1 | |
Curtailments | | | (12 | ) | | | - | | | | - | | | | - | |
Benefits paid | | | (18 | ) | | | (10 | ) | | | (1 | ) | | | (1 | ) |
Cumulative translation adjustments | | | - | | | | (1 | ) | | | - | | | | - | |
| | | | | | | | | | | | | | | | |
Benefit obligation, end of period | | $ | 659 | | | $ | 648 | | | $ | 12 | | | $ | 12 | |
| | | | | | | | | | | | | | | | |
| | | | | | | | | | | | | | | | | |
| |
| | | Year Ended December 31, | |
| Change in Plan Assets | | 2009 | | | 2008 | | | 2009 | | | 2008 | |
| (in millions) | | Pension Benefits | | | Postretirement Benefits | |
Fair value of plan assets, beginning of period | | $ | 231 | | | $ | 312 | | | $ | - | | | $ | - | |
Actual return on plan assets | | | 82 | | | | (114 | ) | | | - | | | | - | |
Employer contributions | | | 119 | | | | 44 | | | | 1 | | | | 1 | |
Benefits paid | | | (18 | ) | | | (10 | ) | | | (1 | ) | | | (1 | ) |
Cumulative translation adjustments | | | - | | | | (1 | ) | | | - | | | | - | |
| | | | | | | | | | | | | | | | |
Fair value of plan assets, end of period | | $ | 414 | | | $ | 231 | | | $ | - | | | $ | - | |
| | | | | | | | | | | | | | | | |
| | | | | | | | | | | | | | | | | |
| |
| | | December 31, | |
| Funded status | | 2009 | | | 2008 | | | 2009 | | | 2008 | |
| (in millions) | | Pension Benefits | | | Postretirement Benefits | |
Funded status* | | $ | (245 | ) | | $ | (417 | ) | | $ | (12 | ) | | $ | (12 | ) |
* These unfunded amounts are included inOther liabilities – noncurrentin the Consolidated Balance Sheets.
Accumulated Benefit Obligation
The accumulated benefit obligation differs from the projected benefit obligation in that it includes no assumption about future compensation levels. Since the Company’s unfunded plans are frozen as of December 31, 2009, the projected benefit obligation equals the accumulated benefit obligation. Included in the change in benefit obligation table above are the following funded and unfunded plans with an accumulated benefit obligation equal to or in excess of plan assets at the end of the year.
| | | | | | | | | | | | | | | | | | | | | | | | |
| | | Funded Plans | | | Unfunded Plans | | | Total Plans | |
| Accumulated Benefit Obligation | | December 31, | | | December 31, | | | December 31, | |
| (in millions) | | 2009 | | | 2008 | | | 2009 | | | 2008 | | | 2009 | | | 2008 | |
Projected benefit obligation | | $ | 493 | | | $ | 459 | | | $ | 166 | | | $ | 189 | | | $ | 659 | | | $ | 648 | |
Accumulated benefit obligation | | $ | 443 | | | $ | 385 | | | $ | 166 | | | $ | 168 | | | $ | 609 | | | $ | 553 | |
Fair value of plan assets | | $ | 414 | | | $ | 231 | | | $ | - | | | $ | - | | | $ | 414 | | | $ | 231 | |
Funded Status | | $ | (79 | ) | | $ | (228 | ) | | $ | (166 | ) | | $ | (189 | ) | | $ | (245 | ) | | $ | (417 | ) |
96
VIACOM INC.
NOTES TO CONSOLIDATED FINANCIAL STATEMENTS
(Continued)
Net Periodic Benefit Costs
Net periodic benefit cost for the Company under Viacom’s pension and postretirement benefit plans consists of the following:
| | | | | | | | | | | | | | | | | | | | | |
| | | Year Ended December 31, |
| Net Periodic Benefit Costs | | 2009 | | | 2008 | | | 2007 | | | 2009 | | 2008 | | 2007 |
| (in millions) | | Pension Benefits | | | Postretirement Benefits |
|
Service cost | | $ | 27 | | | $ | 35 | | | $ | 34 | | | $ | 1 | | $ | 1 | | $ | 1 |
Interest cost | | | 38 | | | | 34 | | | | 30 | | | | 1 | | | 1 | | | 1 |
Expected return on plan assets | | | (23 | ) | | | (27 | ) | | | (21 | ) | | | - | | | - | | | - |
Amortization of unrecognized prior service cost | | | 1 | | | | - | | | | - | | | | - | | | - | | | - |
Recognized actuarial loss | | | 9 | | | | 3 | | | | 3 | | | | - | | | - | | | - |
Net actuarial gain due to curtailment/settlement | | | (10 | ) | | | - | | | | - | | | | - | | | - | | | - |
| | | | | | | | | | | | | | | | | | | | | |
Net periodic benefit costs | | $ | 42 | | | $ | 45 | | | $ | 46 | | | $ | 2 | | $ | 2 | | $ | 2 |
| | | | | | | | | | | | | | | | | | | | | |
| | | | | | | | | | | | | | | | | | | | | | |
In 2009, the Company amended certain defined benefit pension plans, including freezing future benefits under its unfunded excess pension plan, which resulted in a net curtailment gain.
The items not yet recognized as a component of net periodic pension cost are:
| | | | | | | | | | | | | |
| | | Year Ended December 31, |
| Unrecognized Pension Cost (Income) | | 2009 | | 2008 | | 2009 | | | 2008 |
| (in millions) | | Pension Benefits | | Postretirement Benefits |
|
Unrecognized prior service cost | | $ | 2 | | $ | 1 | | $ | - | | | $ | - |
Unrecognized actuarial loss / (gain) | | | 149 | | | 246 | | | (1 | ) | | | 1 |
| | | | | | | | | | | | | |
Total | | $ | 151 | | $ | 247 | | $ | (1 | ) | | $ | 1 |
| | | | | | | | | | | | | |
| | | | | | | | | | | | | | |
The amounts recognized in other comprehensive income during the year are:
| | | | | | | |
| | | Year Ended December 31, |
| Other Comprehensive Income | | 2009 | | | 2009 |
| (in millions) | | Pension Benefits | | | Postretirement Benefits |
|
Net actuarial gain | | $ | 88 | | | $ | 2 |
Recognized actuarial loss | | | 9 | | | | - |
Prior service cost | | | (1 | ) | | | - |
| | | | | | | |
Total pretax gain | | $ | 96 | | | $ | 2 |
| | | | | | | |
| | | | | | | | |
The amounts in Accumulated other comprehensive income (loss)in the Consolidated Balance Sheets that are expected to be recognized as components of net periodic benefit cost during 2010 are as follows:
| | | | | | | | | |
| (in millions) | | Pension | | Postretirement | | Total |
|
Actuarial loss | | $ | 7 | | $ | - | | $ | 7 |
Prior service cost | | $ | 1 | | $ | - | | $ | 1 |
| | | | | | | | | | |
97
VIACOM INC.
NOTES TO CONSOLIDATED FINANCIAL STATEMENTS
(Continued)
| | | | | | | | | | | | |
| | | Year Ended December 31, | |
| | | 2009 | | | 2008 | | | 2009 | | | 2008 | |
| Key Assumptions | | Pension Benefits | | | Postretirement Benefits | |
Weighted-average assumptions - benefit obligations | | | | | | | | | | | | |
Discount rate | | 6.30 | % | | 6.00 | % | | 6.25 | % | | 6.00 | % |
Rate of compensation increase | | 4.00 | % | | 4.00 | % | | N/A | % | | N/A | |
Weighted-average assumptions - net periodic costs | | | | | | | | | | | | |
Discount rate | | 7.00 | % | | 6.25 | % | | 6.00 | % | | 6.25 | % |
Expected long-term return on plan assets | | 8.00 | % | | 8.00 | % | | N/A | % | | N/A | |
Rate of compensation increase | | 4.00 | % | | 4.00 | % | | N/A | % | | N/A | |
| | | | | | | | | | | | | |
Two key assumptions used in accounting for pension liabilities and expenses are the discount rate and expected rate of return on plan assets. The discount rate reflects the estimated rate at which the pension benefit obligations could effectively be settled. The Company used investment grade corporate bond yields to support its discount rate assumption. The expected long-term returns on plan assets were based upon the target asset allocation and return estimates for equity and debt securities. The expected rate of return for equities was based upon the risk-free rate plus a premium for equity securities. The expected return on debt securities was based upon an analysis of current and historical yields on portfolios of similar quality and duration. A decrease in the discount rate or a decrease in the expected rate of return on plan assets would increase pension expense. The estimated impact of a 25 basis point change in the discount rate would be a change of approximately $3 million on 2009 pension expense and would change the projected benefit obligation by approximately $22 million. The estimated impact of a 25 basis point change in the expected rate of return on plan assets is a change of approximately $1 million on pension expense.
The following assumptions were also used in accounting for postretirement benefits:
| | | | | | |
| Key Assumptions for Postretirement Benefits | | 2009 | | | 2008 | |
Projected health care cost trend rate for participants age 65 and below | | 8.50 | % | | 9.00 | % |
Projected health care cost trend rate for participants above age 65 | | 9.50 | % | | 10.00 | % |
Ultimate trend rate | | 5.00 | % | | 5.00 | % |
Year ultimate trend rate is achieved for participants age 65 and below | | 2019 | | | 2017 | |
Year ultimate trend rate is achieved for participants above age 65 | | 2019 | | | 2019 | |
| | | | | | | |
Although not expected to be significant to the Company’s Consolidated Financial Statements, the assumed health care cost trend rates could have a significant effect on the specific amounts reported for the postretirement health care plan. A one percentage point change in assumed health care cost trend rates would not have any significant impact on the Company’s total service and interest cost and accumulated postretirement benefit obligation.
Investment Policies and Strategies
The Viacom Investments Committee is responsible for managing the investment of assets under the funded pension plan in a prudent manner with regard to preserving principal while providing reasonable returns. The Investments Committee has established investment policies through careful study of the returns and risks associated with alternative investment strategies in relation to the current and projected liabilities of the plan, after consulting with an outside investment manager as it deems appropriate. The investment manager’s role is to provide guidance to the Investments Committee on matters pertaining to the investment of plan assets including investment policy, investment selection, monitoring the plan’s performance and compliance with the plan’s investment policies.
The investment policy establishes target asset allocations based upon an analysis of the timing and amount of projected benefit payments, the expected returns and risk of the asset classes and the correlation of those returns.
98
VIACOM INC.
NOTES TO CONSOLIDATED FINANCIAL STATEMENTS
(Continued)
The Company’s practice is to review asset allocations regularly with its investment managers and rebalance as necessary. The range of target asset allocations under the Company’s investment policy are 55-75% equity securities, 25-40% debt securities and 0-10% in cash and other instruments.
The investment manager implements the investment policy through investments in mutual funds and other pooled asset portfolios. Investments will be diversified within asset classes with the intent to minimize the risk of large losses to the plan. The portfolio includes mutual funds that are managed in accordance with the diversification and industry concentration restrictions set forth in the Investment Company Act of 1940.
The percentage of asset allocations of the Company’s funded pension plan at December 31, 2009 and 2008, by asset category were as follows:
| | | | | | |
| | | December 31, | |
| Asset Allocations of Funded Pension Plan | | 2009 | | | 2008 | |
Equity securities | | 69 | % | | 61 | % |
Debt securities | | 31 | | | 39 | |
Cash and other | | - | | | - | |
| | | | | | |
Total | | 100 | % | | 100 | % |
| | | | | | |
| | | | | | | |
Viacom Class B common stock represents approximately 1.9% and 2.2% of the plan assets fair values at December 31, 2009 and 2008, respectively.
Fair Value Measurement of Plan Assets
Corporate common stocks are reported at fair value based on quoted market prices on national securities exchanges. Investments in registered investment companies (mutual funds) are stated at the respective funds’ net asset value, which is determined based on market values at the closing price on the last business day of the year.
The following table sets forth the plan’s assets at fair value as of December 31, 2009. The fair value of all of the plan’s assets are measured using the quoted prices in the active markets for identical assets, which represents Level 1 within the hierarchy set forth in the accounting guidance for fair value measurements.
| | | |
Fair Value of Plan Assets at December 31, 2009 (in millions) | | |
|
Equity Securities | | | |
Viacom B common stock | | $ | 8 |
U.S. large cap | | $ | 135 |
U.S. small / mid cap | | $ | 50 |
World ex-U.S. | | $ | 93 |
| |
Debt Securities | | | |
Emerging markets | | $ | 20 |
High yield | | $ | 39 |
Long duration | | $ | 69 |
| | | |
Total | | $ | 414 |
| | | |
| | | | |
Future Benefit Payments and Contributions
The estimated future benefit payments are as follows:
| | | | | | | | | | | | | | | | | | |
| Future Benefit Payments | | | | | | | | | | | | |
| (in millions) | | 2010 | | 2011 | | 2012 | | 2013 | | 2014 | | 2015-2019 |
Pension benefits | | $ | 36 | | $ | 32 | | $ | 38 | | $ | 39 | | $ | 43 | | $ | 256 |
Postretirement benefits | | $ | 1 | | $ | 1 | | $ | 1 | | $ | 1 | | $ | 1 | | $ | 6 |
99
VIACOM INC.
NOTES TO CONSOLIDATED FINANCIAL STATEMENTS
(Continued)
The Company expects to contribute approximately $25 million to the funded pension plan in 2010.
Other Retirement Plans
Certain employees of the Company under collective bargaining agreements participate in union-sponsored multi-employer plans to which Viacom is obligated to contribute. These plans provide pension and health and welfare benefits. The contributions to these plans were $5 million, $3 million and $5 million in 2009, 2008 and 2007, respectively. In addition, Viacom has defined contribution (401(k)) plans for the benefit of substantially all the Company’s employees meeting certain eligibility requirements. The Company’s matching contributions to such plans were $17 million, $18 million and $17 million for the years ended December 31, 2009, 2008 and 2007, respectively.
NOTE 13. RESTRUCTURING AND OTHER CHARGES
During the second quarter of 2009 the Company incurred $33 million of severance charges included withinSelling, general and administrative expenses in the Company’s Consolidated Statement of Earnings. During 2009, approximately $12 million related to these charges was paid out in cash, leaving a remaining liability of $21 million as of December 31, 2009.
In the fourth quarter of 2009, the Company recorded a $60 million non-cash impairment charge in theMedia Networkssegment related to certain broadcast licenses held by a 32%-owned consolidated entity. This charge is included withinDepreciation and amortization in the Consolidated Statement of Earnings. The impact toNet earnings attributable to Viacom was a reduction of $19 million. The impairment results from a planned change in strategy of distribution in the affected markets as well as a sustained deterioration in the advertising markets that supported the broadcast licenses. The fair value of the broadcast licenses was determined under an income approach utilizing the projected net cash flows of the licenses, a Level 3 input within the hierarchy set forth in the accounting guidance for fair value measurements.
In the fourth quarter of 2008, to better align the Company’s organization and cost structure with changing economic conditions, the Company undertook a strategic review of its businesses which resulted in an aggregate of $454 million of restructuring and other charges. In addition to broad adverse economic conditions, the strategic review considered the emergence of sustained softness in the advertising market and ratings issues at certain channels in theMedia Networks segment, and theFilmed Entertainment segment’s decision to reduce its future film slate. The restructuring plan included workforce reductions of 890 positions across its domestic and international operations and resulted in an associated restructuring charge of $103 million. The charge includes $80 million for severance, principally consisting of one-time benefits for terminated employees and $23 million related to lease termination costs. The plan was substantially completed in 2008 and is expected to involve cash payments of approximately $88 million, of which $7 million was paid in 2008 and $63 million was paid in 2009. There have been no significant changes to the restructuring plan. At December 31, 2009 the remaining liability is $18 million.
In conjunction with the strategic review, the Company also assessed the effectiveness of its programming and motion pictures not yet released. As a result of the assessment, theMedia Networks segment recorded a charge of $286 million principally related to management’s decision to cease use of certain acquired and original programming which was no longer achieving desired audience levels and/or branding objectives. The charge reflects the acceleration of amortization of such programming into the fourth quarter of 2008, consistent with the decision to discontinue airing of the respective programs subsequent to the fourth quarter of 2008. TheFilmed Entertainment segment recorded a charge of $19 million primarily related to pre-release write downs related to certain completed but not yet released films produced under the Paramount Vantage label. As a result of the restructuring, management changed its release strategy for these films, resulting in future revenue estimates falling below their cost.
100
VIACOM INC.
NOTES TO CONSOLIDATED FINANCIAL STATEMENTS
(Continued)
In addition to the above, $32 million of non-cash impairment charges were taken related primarily to broadcast licenses in theMedia Networks segment. One of the licenses was abandoned due to a change in strategy of distribution in a foreign territory and others became impaired due to a sustained deterioration in the advertising markets that supported the broadcast licenses. The fair value of these licenses was determined utilizing a discounted cash flow income approach model. TheFilmed Entertainment segment also incurred $14 million of charges principally related to the abandonment of certain film development rights.
The components of the 2008 restructuring and other charges by segment are as follows:
| | | | | | | | | | | | |
2008 Restructuring and Other Charges (in millions) | | Media Networks | | Filmed
Entertainment | | Corporate | | Total |
|
Severance and lease termination costs | | $ | 71 | | $ | 29 | | $ | 3 | | $ | 103 |
Programming and film inventory | | | 286 | | | 19 | | | - | | | 305 |
Asset impairments and other | | | 32 | | | 14 | | | - | | | 46 |
| | | | | | | | | | | | |
December 31, 2008 | | $ | 389 | | $ | 62 | | $ | 3 | | $ | 454 |
| | | | | | | | | | | | |
The components of the 2008 restructuring and other charges are included in the Consolidated Statement of Earnings as follows:
| | | | | | | | | | | | |
2008 Restructuring and Other Charges (in millions) | | Operating | | Selling, General and
Administrative | | Depreciation and
Amortization | | Total |
|
Severance and lease termination costs | | $ | - | | $ | 94 | | $ | 9 | | $ | 103 |
Programming and film inventory | | | 305 | | | - | | | - | | | 305 |
Asset impairments and other | | | 14 | | | - | | | 32 | | | 46 |
| | | | | | | | | | | | |
December 31, 2008 | | $ | 319 | | $ | 94 | | $ | 41 | | $ | 454 |
| | | | | | | | | | | | |
During 2007 the Company recorded $77 million of restructuring charges in theMedia Networks segment that have been included withinSelling, general and administrative expensesin the Company’s Consolidated Statement of Earnings. During 2009, the plan was completed. Payments of $3 million and $18 million were made in 2009 and 2008, respectively.
Payments of $12 million and $20 million were made in 2009 and 2008, respectively, related to restructuring plans initiated prior to 2007, which were substantially completed as of December 31, 2009.
The restructuring charges gave rise to certain future liabilities, the components of which are detailed below for the three years ended December 31, 2009:
| | | | | | | | | | | | | | | | |
Restructuring Liability (in millions) | | Media Networks | | | Filmed
Entertainment | | | Corporate | | | Total | |
| |
December 31, 2006 | | $ | 29 | | | $ | - | | | $ | 80 | | | $ | 109 | |
Additions | | | 77 | | | | - | | | | - | | | | 77 | |
Severance payments | | | (59 | ) | | | - | | | | (47 | ) | | | (106 | ) |
Lease payments | | | (3 | ) | | | - | | | | - | | | | (3 | ) |
Other payments | | | (7 | ) | | | - | | | | (9 | ) | | | (16 | ) |
| | | | | | | | | | | | | | | | |
December 31, 2007 | | | 37 | | | | - | | | | 24 | | | | 61 | |
Additions | | | 65 | | | | 27 | | | | - | | | | 92 | |
Severance payments | | | (28 | ) | | | (4 | ) | | | (13 | ) | | | (45 | ) |
Revisions to initial estimates | | | (3 | ) | | | - | | | | - | | | | (3 | ) |
| | | | | | | | | | | | | | | | |
December 31, 2008 | | | 71 | | | | 23 | | | | 11 | | | | 105 | |
Additions | | | 16 | | | | 17 | | | | - | | | | 33 | |
Severance payments | | | (52 | ) | | | (18 | ) | | | (8 | ) | | | (78 | ) |
Lease payments | | | (12 | ) | | | - | | | | - | | | | (12 | ) |
Revisions to initial estimates | | | (1 | ) | | | (4 | ) | | | - | | | | (5 | ) |
| | | | | | | | | | | | | | | | |
December 31, 2009 | | $ | 22 | | | $ | 18 | | | $ | 3 | | | $ | 43 | |
| | | | | | | | | | | | | | | | |
101
VIACOM INC.
NOTES TO CONSOLIDATED FINANCIAL STATEMENTS
(Continued)
NOTE 14. INCOME TAXES
Earnings from continuing operations before provision for income taxes consists of the following:
| | | | | | | | | | | | |
| Pre-tax Earnings from Continuing Operations | | Year Ended December 31, | |
| (in millions) | | 2009 | | | 2008 | | | 2007 | |
| |
United States | | $ | 1,841 | | | $ | 1,451 | | | $ | 2,143 | |
International | | | 435 | | | | 404 | | | | 437 | |
| | | | | | | | | | | | |
Pre-tax earnings from continuing operations | | $ | 2,276 | | | $ | 1,855 | | | $ | 2,580 | |
| | | | | | | | | | | | |
| | | | | | | | | | | | | |
The provision for income taxes from continuing operations consists of the following: | |
| Provision for Income Taxes from Continuing Operations | | Year Ended December 31, | |
| (in millions) | | 2009 | | | 2008 | | | 2007 | |
| |
Current Provision for Taxes on Income: | | | | | | | | | | | | |
Federal | | $ | 408 | | | $ | 328 | | | $ | 621 | |
State and local | | | 34 | | | | 96 | | | | 129 | |
International | | | 179 | | | | 167 | | | | 146 | |
| | | | | | | | | | | | |
Total current provision for income taxes | | | 621 | | | | 591 | | | | 896 | |
Deferred provision for income taxes | | | 87 | | | | 14 | | | | 33 | |
| | | | | | | | | | | | |
Provision for income taxes | | $ | 708 | | | $ | 605 | | | $ | 929 | |
| | | | | | | | | | | | |
| | | | | | | | | | | | | |
A reconciliation of the effective income tax rate on continuing operations to the U.S. federal statutory income tax rate is as follows: | |
| | | Year Ended December 31, | |
| Effective Tax Rate | | 2009 | | | 2008 | | | 2007 | |
| | |
U.S. federal statutory income tax rate | | | 35.0 | % | | | 35.0 | % | | | 35.0 | % |
State and local taxes, net of federal benefit | | | 3.2 | | | | 3.4 | | | | 3.5 | |
Effect of international operations | | | (3.9 | ) | | | (3.8 | ) | | | (1.6 | ) |
Audit settlements | | | (4.6 | ) | | | (2.4 | ) | | | (0.6 | ) |
Qualified production activities deduction | | | (1.9 | ) | | | (1.9 | ) | | | (1.6 | ) |
All other, net | | | 3.3 | | | | 2.3 | | | | 1.3 | |
| | | | | | | | | | | | |
Effective tax rate, continuing operations | | | 31.1 | % | | | 32.6 | % | | | 36.0 | % |
| | | | | | | | | | | | |
During 2009, 2008 and 2007, the Company recognized net discrete tax benefits of $124 million, $55 million and $15 million, respectively, which served to reduce the provision for income taxes for those years. The net discrete tax benefits for all years relate principally to the release of tax reserves in respect of certain effectively settled tax positions. The 2009 net discrete tax benefit also reflects the recognition of certain previously unrecognized capital losses from international operations.
102
VIACOM INC.
NOTES TO CONSOLIDATED FINANCIAL STATEMENTS
(Continued)
The tax effects of the items recorded as deferred tax assets and liabilities are:
| | | | | | | | |
| Deferred Taxes | | December 31, | |
| (in millions) | | 2009 | | | 2008 | |
Deferred Tax Assets: | | | | | | | | |
Provision for expense and losses | | $ | 403 | | | $ | 458 | |
Postretirement and other employee benefits | | | 243 | | | | 238 | |
Tax credit and loss carryforwards | | | 148 | | | | 133 | |
All other | | | 157 | | | | 198 | |
| | | | | | | | |
Total deferred tax assets | | | 951 | | | | 1,027 | |
Valuation allowance | | | (144 | ) | | | (108 | ) |
| | | | | | | | |
Total deferred tax assets, net | | $ | 807 | | | $ | 919 | |
| | | | | | | | |
Deferred Tax Liabilities: | | | | | | | | |
Property, equipment and intangible assets | | $ | (667 | ) | | $ | (626 | ) |
All other | | | (82 | ) | | | (102 | ) |
| | | | | | | | |
Total deferred tax liabilities | | | (749 | ) | | | (728 | ) |
| | | | | | | | |
Deferred taxes, net | | $ | 58 | | | $ | 191 | |
| | | | | | | | |
The Company has recorded valuation allowances for certain deferred tax assets, which are primarily related to foreign jurisdictions, as sufficient uncertainty exists regarding the future realization of these assets. During 2009, valuation allowances increased $36 million principally as a result of the impairment of broadcast licenses held by a 32%-owned consolidated entity and net increases of loss carryforwards. During 2008, the Company reduced $18 million of valuation allowances primarily attributable to loss carryforwards resulting from utilizations and certain other adjustments.
At December 31, 2009 and 2008, respectively, theDeferred tax assets,net andDeferred tax liabilities, net included as a component of the Company’s Consolidated Balance Sheets were as follows:
| | | | | | | | |
| Deferred Tax Assets | | December 31, | |
| (in millions) | | 2009 | | | 2008 | |
Current deferred tax assets, net | | $ | 147 | | | $ | 203 | |
Noncurrent deferred tax liabilities, net | | | (89 | ) | | | (12 | ) |
| | | | | | | | |
Deferred tax assets, net | | $ | 58 | | | $ | 191 | |
| | | | | | | | |
U.S. federal tax attribute carryforwards at December 31, 2009, consist primarily of approximately $75 million of acquired tax loss carryforwards. The utilization of the U.S. federal carryforwards as an available offset to future taxable income is subject to limitations under U.S. federal income tax laws. These carryforwards begin to expire in 2020. In addition, the Company has approximately $205 million of tax losses in various foreign jurisdictions that are primarily from countries with unlimited carry forward periods and $168 million of tax losses that expire in the years 2010 through 2027.
As of December 31, 2009, the Company has not made any provision for income taxes on approximately $1.172 billion of unremitted earnings of the Company’s international subsidiaries. These earnings are intended to be permanently reinvested outside the U.S.
103
VIACOM INC.
NOTES TO CONSOLIDATED FINANCIAL STATEMENTS
(Continued)
A reconciliation of the beginning and ending amounts of unrecognized tax benefits, excluding interest and penalties, is as follows:
| | | | | | | | | | | | |
| Unrecognized Tax Benefits | | Year Ended December 31, | |
| (in millions) | | 2009 | | | 2008 | | | 2007 | |
Balance at beginning of the period | | $ | 351 | | | $ | 342 | | | $ | 314 | |
Gross additions based on tax positions related to the current year | | | 21 | | | | 57 | | | | 31 | |
Gross additions for tax positions of prior years | | | 56 | | | | 22 | | | | 61 | |
Gross reductions for tax positions of prior years | | | (77 | ) | | | (70 | ) | | | (53 | ) |
Expiration of the statute of limitation | | | (51 | ) | | | - | | | | (11 | ) |
| | | | | | | | | | | | |
Balance at end of the period | | $ | 300 | | | $ | 351 | | | $ | 342 | |
| | | | | | | | | | | | |
As enumerated in the table above, the Company had $300 million, $351 million and $342 million of unrecognized tax benefits for the years ended December 31, 2009 and 2008 and 2007, respectively. The total amount of unrecognized tax benefits at December 31, 2009, that if recognized would favorably affect the effective tax rate is approximately $284 million.
As discussed in Note 2, the Company recognizes interest and penalties accrued related to unrecognized tax benefits as a component of the Provision for income taxesin the Consolidated Statements of Earnings. The Company recognized $33 million, $17 million and $7 million of interest and penalties as a component of theProvision for income taxes in the Consolidated Statements of Earnings for the years ended December 31, 2009, 2008 and 2007, respectively. The Company had accruals of $78 million and $111 million related to interest and penalties recorded as a component ofOther liabilities-currentand noncurrentin the Consolidated Balance Sheets for the years ended December 31, 2009 and 2008, respectively.
The Company and its subsidiaries file income tax returns with the Internal Revenue Service (“IRS”) and various state and international jurisdictions. For jurisdictions in which tax filings are prepared, with few exceptions, the Company is no longer subject to income tax examinations by state, local or international tax authorities for years through 2000, and by the IRS for years through 2005. For years ending on or prior to December 31, 2005, the Company filed consolidated and combined tax returns with CBS Corporation. The IRS and New York State concluded their examinations of the Viacom and CBS Corporation U.S. consolidated and state combined income tax returns through 2005 in the third and fourth quarters of 2009. In connection with the separation and pursuant to the terms of the Tax Matters Agreement, Viacom and CBS Corporation agreed to each be financially responsible for 50% of any potential income tax liabilities that arose in 2005 or earlier, to the extent such potential income tax liabilities were not directly attributable to their respective business operations. Currently, there are no material potential income tax liabilities still in dispute. The IRS began its examination of the Company’s 2006 and 2007 U.S. consolidated federal income tax returns in the first quarter of 2009. Tax authorities are also conducting examinations of Viacom subsidiaries in various international jurisdictions, such as the United Kingdom and various states, including New York. Due to potential resolution of unrecognized tax positions involving multiple tax periods and jurisdictions, it is reasonably possible that a reduction of up to $70 million of unrecognized income tax benefits may occur within 12 months, some of which, depending on the nature of the settlement may affect the Company’s income tax provision and therefore benefit the resulting effective tax rate. The majority of these uncertain tax positions, when recognized in the financial statements, would be recorded in the Consolidated Statements of Earnings as part of theProvision for income taxes. The actual amount could vary significantly depending on the ultimate timing and nature of any settlements.
104
VIACOM INC.
NOTES TO CONSOLIDATED FINANCIAL STATEMENTS
(Continued)
NOTE 15. RELATED PARTY TRANSACTIONS
NAI, through NAIRI, Inc., is the controlling stockholder of both Viacom and CBS Corporation. NAI also held a controlling interest in Midway until November 28, 2008. Sumner M. Redstone, the Chairman, Chief Executive Officer and controlling shareholder of NAI, is the Executive Chairman of the Board and Founder of both Viacom and CBS Corporation. In addition, Shari Redstone, who is Sumner Redstone’s daughter, is the President of NAI, and the Vice Chair of the Board of both Viacom and CBS Corporation. George Abrams, one of the Company’s directors, serves on the boards of both NAI and Viacom, and Frederic Salerno, another of the Company’s directors, serves on the boards of both Viacom and CBS Corporation. Philippe Dauman, the Company’s President and Chief Executive Officer, also serves on the boards of both NAI and Viacom.
Since the fall of 2008, Mr. Dauman has recused himself from activity as an NAI board member with respect to all matters relating to the restructuring of NAI’s indebtedness. In addition, NAI’s board of directors has created a special committee that does not include Mr. Redstone or Mr. Dauman in order to consider issues that may be perceived to create a conflict between their responsibility to Viacom and to NAI. Similarly, the Company’s independent directors act on behalf of the Board of Directors when appropriate to address such issues. Transactions between Viacom and related parties are typically overseen by the Company’s Governance and Nominating Committee.
NAI licenses films in the ordinary course of business for its motion picture theaters from all major studios, including Paramount. During the years ended December 31, 2009, 2008 and 2007, Paramount earned revenues from NAI in connection with these licenses in the aggregate amounts of approximately $34 million, $36 million and $36 million, respectively.
In connection with the Company’s stock repurchase programs, the Company entered into an agreement with NAIRI Inc. (“NAIRI”), a wholly-owned subsidiary of NAI, and NAI under which the Company agreed to buy from them, and they agreed to sell to the Company, a number of shares of Viacom Class B common stock each month such that their ownership percentage of Viacom Class A common stock and Class B common stock (considered as a single class) would not increase as a result of the Company’s repurchase of shares under its stock repurchase program. In 2008 and 2007, the Company repurchased 3.6 million and 6.0 million shares, respectively, of Class B common stock from NAIRI for an aggregate purchase price of $124 million and $246 million, respectively. The NAIRI Agreement was terminated in October 2008.
Viacom and CBS Corporation Related Party Transactions
In the normal course of business, the Company is involved in transactions with CBS Corporation and its various businesses (“CBS”) that result in the recognition of revenues and expenses by Viacom. Transactions with CBS, through the normal course of business, are settled in cash.
Paramount earns revenues and recognizes expenses associated with the distribution of certain television products into the home entertainment market on behalf of CBS. Effective January 1, 2008, Viacom entered into a new distribution agreement with CBS under which revenue and expenses are recorded on a gross basis. Under the terms of the agreement, Paramount is entitled to retain a fee based on a percentage of gross receipts and is generally responsible for all out-of-pocket costs which are recoupable, together with the annual advance due to CBS, prior to any participation payments to CBS. In connection with this agreement, Paramount made initial payments of $100 million to CBS during each of the first quarters of 2010, 2009 and 2008. Paramount also earns revenues associated with the leasing of studio space to CBS and licensing of motion picture products released before January 1, 2008 to CBS. Additionally, theMedia Networks segment recognizes advertising revenues from CBS.
105
VIACOM INC.
NOTES TO CONSOLIDATED FINANCIAL STATEMENTS
(Continued)
TheMedia Networks segment purchases television programming from CBS. The cost of such purchases is initially recorded as acquired program rights inventory and amortized over the estimated period that revenues will be generated. Both of the Company’s segments recognize advertising expenses related to the placement of advertisements with CBS.
The following table summarizes the transactions with CBS as included in the Company’s Consolidated Financial Statements:
| | | | | | | | | | |
| CBS Related Party Transactions | | Year Ended December 31, | |
| (in millions) | | 2009 | | 2008 | | 2007 | |
Consolidated Statements of Earnings | | | | | | | | | | |
Revenues | | $ | 406 | | $ | 506 | | $ | 244 | |
Operating expenses | | $ | 504 | | $ | 561 | | $ | 185 | |
Discontinued operations, net of tax | | $ | - | | $ | - | | $ | (5 | ) |
| | |
| | | December 31, | | | |
| | | 2009 | | 2008 | | | |
Consolidated Balance Sheets | | | | | | | | | | |
Accounts receivable | | $ | 25 | | $ | 61 | | | | |
Other assets | | | 1 | | | 16 | | | | |
| | | | | | | | | | |
Total due from CBS | | $ | 26 | | $ | 77 | | | | |
| | | | | | | | | | |
Accounts payable | | $ | 3 | | $ | 6 | | | | |
Participants’ share, residuals and royalties payable | | | 178 | | | 160 | | | | |
Programming rights, current | | | 132 | | | 156 | | | | |
Programming rights, noncurrent | | | 185 | | | 242 | | | | |
Other liabilities | | | 13 | | | 13 | | | | |
| | | | | | | | | | |
Total due to CBS | | $ | 511 | | $ | 577 | | | | |
| | | | | | | | | | |
In 2007, the Company also made a final special dividend payment of $170 million to CBS Corporation in connection with its separation from Former Viacom.
401(k) Plan Transactions
Following the separation, some participants in the Viacom 401(k) Plan continued to be invested in CBS Corporation Class A and Class B common stock. In 2007, CBS Corporation purchased the shares of CBS Corporation Class A and Class B common stock from the Viacom 401(k) Plan for total proceeds of $30 million.
Similarly, some participants in the 401(k) plans sponsored by CBS Corporation continued to be invested in Viacom Class A and Class B common stock following the separation. In 2007, the Company purchased the shares of Viacom Class A and Class B common stock from the CBS-sponsored 401(k) plans for an aggregate amount of $120 million.
106
VIACOM INC.
NOTES TO CONSOLIDATED FINANCIAL STATEMENTS
(Continued)
Other Related Party Transactions
In the normal course of business, the Company is involved in related party transactions with equity investees, principally related to investments in unconsolidated VIEs as more fully described in Note 3. These related party transactions primarily relate to the provision of advertising services, licensing of film and programming content and the distribution of films for which the impact on the Company’s Consolidated Financial Statements is as follows:
| | | | | | | | | |
| Other Related Party Transactions | | Year Ended December 31, |
| (in millions) | | 2009 | | 2008 | | 2007 |
|
Consolidated Statements of Earnings | | | | | | | | | |
Revenues | | $ | 375 | | $ | 408 | | $ | 484 |
Operating expenses | | $ | 207 | | $ | 249 | | $ | 393 |
| | |
| | | December 31, | | |
| | | 2009 | | 2008 | | |
Consolidated Balance Sheets | | | | | | | | | |
Accounts receivable | | $ | 112 | | $ | 88 | | | |
| | | |
Accounts payable | | $ | 39 | | $ | 25 | | | |
Participants’ share, residuals and royalties payable | | | 47 | | | 58 | | | |
Other liabilities | | | 55 | | | 55 | | | |
Debt, current | | | 65 | | | 65 | | | |
Debt, noncurrent | | | 33 | | | 71 | | | |
| | | | | | | | | |
Total due to other related parties | | $ | 239 | | $ | 274 | | | |
| | | | | | | | | |
All other related party transactions are not material in the periods presented.
NOTE 16. COMMITMENTS AND CONTINGENCIES
Commitments
The Company’s commitments primarily consist of programming and talent commitments, operating lease arrangements, purchase obligations for goods and services and future funding commitments related to equity investees, including a put option with respect to DW Funding. See Note 3 for additional information relating to the Company’s future funding commitments. These arrangements result from the Company’s normal course of business and represent obligations that may be payable over several years. Additionally, the Company is subject to a redeemable put option, payable in a foreign currency, with respect to an international subsidiary which expires in 2011 and is classified asRedeemable noncontrolling interest in the Consolidated Balance Sheets. See Notes 1 and 17 to the Company’s Consolidated Financial Statements for additional information related to the redeemable noncontrolling interest.
Programming and talent commitments of the Company not recorded on the balance sheet, which aggregate approximately $1.567 billion as of December 31, 2009, included $1.287 billion relating to media networks programming and $280 million for talent contracts. At December 31, 2009, the Company had recorded, on the balance sheet, programming commitments of $927 million. Amounts expected to be paid over the next five years are as follows: $405 million, $243 million, $168 million, $106 million and $5 million.
107
VIACOM INC.
NOTES TO CONSOLIDATED FINANCIAL STATEMENTS
(Continued)
The Company has long-term noncancelable operating and capital lease commitments for office space, equipment, transponders, studio facilities and vehicles. At December 31, 2009, minimum rental payments under noncancelable leases are as follows:
| | | | | | | |
| Noncancelable Lease Commitments | | | | | |
| (in millions) | | Capital | | | Operating |
|
2010 | | $ | 55 | | | $ | 190 |
2011 | | | 46 | | | | 157 |
2012 | | | 34 | | | | 146 |
2013 | | | 29 | | | | 138 |
2014 | | | 27 | | | | 127 |
2015 and thereafter | | | 134 | | | | 336 |
| | | | | | | |
Total minimum payments | | $ | 325 | | | $ | 1,094 |
| | | | | | | |
Amounts representing interest | | | (65 | ) | | | |
| | | | | | | |
Total | | $ | 260 | | | | |
| | | | | | | |
Future minimum operating lease payments have been reduced by future minimum sublease income of $17 million. Rent expense amounted to $160 million, $152 million and $162 million in 2009, 2008 and 2007, respectively.
The Company also has purchase obligations which include agreements to purchase goods or services in the future that totaled $584 million as of December 31, 2009.
The Harmonix acquisition agreement provided that to the extent financial results exceeded specific contractual targets against a defined gross profit metric for the calendar years 2007 and 2008, former Harmonix shareholders are eligible for incremental earn-out payments. In 2008, the Company paid $150 million, subject to adjustment, under this earn-out agreement related to 2007 performance. At December 31, 2009, the Company believes that it is entitled to a refund of a substantial portion of amounts previously paid, but the final amount of the earn-out has not yet been determined.
Guarantees
In the course of its business, the Company both provides and receives the benefit of indemnities that are intended to allocate certain risks associated with business transactions. The Company guarantees debt on certain of its unconsolidated investments, including principal and interest, of approximately $214 million (including $204 million relating to certain unsecured debt of DW Funding, as further described in Note 3) at December 31, 2009 and has accrued a liability of $55 million, with respect to such exposures, which is reflected as a component ofOther liabilities – noncurrentin the Consolidated Balance Sheet.
Under the terms of the Company’s separation from Former Viacom, which is now known as CBS Corporation, the Company and Blockbuster Inc. (“Blockbuster”) have agreed to indemnify Former Viacom with respect to any amount paid under certain guarantees related to lease commitments of Blockbuster. Additionally, in connection with the separation, the Company agreed to indemnify Former Viacom with respect to certain theater lease obligations associated with Famous Players, which Former Viacom sold in 2005.
As a result of lease modifications by Blockbuster in the third quarter of 2009, the Company’s indemnification obligation related to Blockbuster was substantially reduced, resulting in the release of $32 million ($20 million, net of tax) of accrued contingent liability. At December 31, 2009, the Company’s aggregate guarantee related to lease commitments of divested businesses, primarily Famous Players, was $813 million with a recorded liability of $217 million, reflecting the estimated fair value of the guarantees at their inception. Based on the Company’s consideration of financial information available to it, the lessees’ performance in meeting their lease obligations and the underlying economic factors impacting the lessees’ business models, the Company believes its accrual is sufficient to meet any future obligations.
108
VIACOM INC.
NOTES TO CONSOLIDATED FINANCIAL STATEMENTS
(Continued)
Finally, the Company has indemnification obligations with respect to letters of credit and surety bonds primarily used as security against non-performance in the normal course of business. The outstanding letters of credit and surety bonds at December 31, 2009 were $77 million and are not recorded on the balance sheet.
Legal Matters
Litigation is inherently uncertain and always difficult to predict. However, based on the Company’s understanding and evaluation of the relevant facts and circumstances, the Company believes that the legal matters described below and other litigation to which the Company is a party are not likely, in the aggregate, to have a material adverse effect on its results of operations, financial position or cash flows.
In March 2007, the Company filed a complaint in the United States District Court for the Southern District of New York against Google Inc. (“Google”) and its wholly-owned subsidiary YouTube, alleging that Google and YouTube violated and continue to violate the Company’s copyrights. The Company is seeking both damages and injunctive relief.
In September 2007, Brantley, et al. v. NBC Universal, Inc., et al., was filed in the United States District Court for the Central District of California against the Company and several other program content providers on behalf of a purported nationwide class of cable and satellite subscribers. The plaintiffs also sued several major cable and satellite program distributors. Plaintiffs allege that separate contracts between the program providers and the cable and satellite operator defendants providing for the sale of programming in specific tiers each unreasonably restrain trade in a variety of markets in violation of the Sherman Act. In October 2009, the court dismissed, with prejudice, the plaintiff’s third amended complaint. The plaintiffs appealed the dismissal. The Company believes the plaintiffs’ position in this litigation is without merit and intend to continue to vigorously defend this lawsuit.
NOTE 17. SUPPLEMENTAL CASH FLOW AND OTHER INFORMATION
| | | | | | | | | | | | |
| Supplemental Cash Flow Information | | Year Ended December 31, | |
| (in millions) | | 2009 | | | 2008 | | | 2007 | |
Cash paid for interest | | $ | 425 | | | $ | 495 | | | $ | 469 | |
Cash paid for income taxes* | | $ | 603 | | | $ | 741 | | | $ | 826 | |
Non-cash Investing and Financing Activities: | | | | | | | | | | | | |
Equipment acquired under capitalized leases | | $ | 134 | | | $ | 10 | | | $ | - | |
Investments with joint ventures, including note payable, net of discount | | $ | - | | | $ | 4 | | | $ | 190 | |
Acquisitions: | | | | | | | | | | | | |
Fair value of assets | | $ | 66 | | | $ | 176 | | | $ | 15 | |
Fair value of liabilities | | | (2 | ) | | | (90 | ) | | | - | |
Noncontrolling interest | | | - | | | | (11 | ) | | | - | |
| | | | | | | | | | | | |
Cash paid, net of cash acquired** | | $ | 64 | | | $ | 75 | | | $ | 15 | |
Receivable Securitization Arrangements: | | | | | | | | | | | | |
Receivable interests sold to investors at beginning of the period | | $ | 950 | | | $ | 950 | | | $ | 950 | |
Proceeds from the sale of receivables | | | 3,315 | | | | 3,946 | | | | 3,841 | |
Cash interest paid | | | 22 | | | | 36 | | | | 55 | |
Cash remitted | | | (4,112 | ) | | | (3,982 | ) | | | (3,896 | ) |
Cash remitted related to reduction in sponsor participation | | | (175 | ) | | | - | | | | - | |
| | | | | | | | | | | | |
Receivable interests sold to investors at end of the period | | $ | - | | | $ | 950 | | | $ | 950 | |
| | | | | | | | | | | | |
| * | Includes cash payments for discontinued operations in 2007. |
| ** | Excludes a $150 million earn-out payment in 2008. See Note 3 for additional information. |
109
VIACOM INC.
NOTES TO CONSOLIDATED FINANCIAL STATEMENTS
(Continued)
| | | | | | | | | | | | |
| Interest Expense, net | | Year Ended December 31, | |
| (in millions) | | 2009 | | | 2008 | | | 2007 | |
Interest expense | | $ | (440 | ) | | $ | (514 | ) | | $ | (487 | ) |
Interest income | | | 10 | | | | 32 | | | | 23 | |
| | | | | | | | | | | | |
Interest expense, net | | $ | (430 | ) | | $ | (482 | ) | | $ | (464 | ) |
| | | | | | | | | | | | |
| | | | | | | | | | | | |
| Other Items, net | | Year Ended December 31, | |
| (in millions) | | 2009 | | | 2008 | | | 2007 | |
Loss on securitization programs | | $ | (14 | ) | | $ | (34 | ) | | $ | (55 | ) |
Foreign exchange (loss) gain | | | (27 | ) | | | (50 | ) | | | 42 | |
Impairment of minority investment | | | - | | | | (27 | ) | | | (36 | ) |
Other gains/(losses) | | | 4 | | | | (1 | ) | | | 6 | |
| | | | | | | | | | | | |
Other items, net | | $ | (37 | ) | | $ | (112 | ) | | $ | (43 | ) |
| | | | | | | | | | | | |
| | | | | | | | | | | | |
| Redeemable Noncontrolling Interest | | Year Ended December 31, | |
| (in millions) | | 2009 | | | 2008 | | | 2007 | |
Beginning balance | | $ | 148 | | | $ | 229 | | | $ | 226 | |
Net earnings | | | 11 | | | | 13 | | | | 13 | |
Distributions | | | (8 | ) | | | (8 | ) | | | (11 | ) |
Translation adjustment | | | 16 | | | | (60 | ) | | | 7 | |
Redemption value adjustment | | | 1 | | | | (26 | ) | | | (6 | ) |
| | | | | | | | | | | | |
Ending balance | | $ | 168 | | | $ | 148 | | | $ | 229 | |
| | | | | | | | | | | | |
NOTE 18. REPORTING SEGMENTS
The following tables set forth the Company’s financial performance by reporting segment. The Company’s reporting segments have been determined in accordance with the Company’s internal management structure. The Company manages its operations through two reporting segments: (i) Media Networks and (ii) Filmed Entertainment. Typical intersegment transactions include the purchase of advertising by theFilmed Entertainment segment onMedia Networks’ properties and the purchase ofFilmed Entertainment’s feature films exhibition rights byMedia Networks. The elimination of such intercompany transactions in the consolidated financial statements is included within eliminations in the table below. Operating income is used as the measure of segment profit performance.
| | | | | | | | | | | | |
| Revenues by Segment | | Year Ended December 31, | |
| (in millions) | | 2009 | | | 2008 | | | 2007 | |
Media Networks | | $ | 8,288 | | | $ | 8,756 | | | $ | 8,101 | |
Filmed Entertainment | | | 5,482 | | | | 6,033 | | | | 5,476 | |
Eliminations | | | (151 | ) | | | (164 | ) | | | (154 | ) |
| | | | | | | | | | | | |
Total revenues | | $ | 13,619 | | | $ | 14,625 | | | $ | 13,423 | |
| | | | | | | | | | | | |
| | | | | | | | | | | | |
| Segment Operating Income | | Year Ended December 31, | |
| (in millions) | | 2009 | | | 2008 | | | 2007 | |
Media Networks | | $ | 2,934 | | | $ | 2,729 | | | $ | 3,048 | |
Filmed Entertainment | | | 219 | | | | 26 | | | | 103 | |
| | | | | | | | | | | | |
Total segment operating income | | | 3,153 | | | | 2,755 | | | | 3,151 | |
Corporate expenses | | | (248 | ) | | | (234 | ) | | | (219 | ) |
Eliminations | | | (1 | ) | | | 2 | | | | 4 | |
| | | | | | | | | | | | |
Total operating income | | | 2,904 | | | | 2,523 | | | | 2,936 | |
Interest expense, net | | | (430 | ) | | | (482 | ) | | | (464 | ) |
Gain on sale of equity investment | | | - | | | | - | | | | 151 | |
Equity in net losses of investee companies | | | (77 | ) | | | (74 | ) | | | - | |
Loss on extinguishment of debt | | | (84 | ) | | | - | | | | - | |
Other items, net | | | (37 | ) | | | (112 | ) | | | (43 | ) |
| | | | | | | | | | | | |
Earnings from continuing operations before provision for income taxes | | $ | 2,276 | | | $ | 1,855 | | | $ | 2,580 | |
| | | | | | | | | | | | |
110
VIACOM INC.
NOTES TO CONSOLIDATED FINANCIAL STATEMENTS
(Continued)
| | | | | | | | | | | | | | | |
| | | Depreciation and Amortization | | Total Assets |
| Depreciation and Amortization and Total Assets | | Year Ended December 31, | | December 31, |
| (in millions) | | 2009 | | 2008 | | 2007 | | 2009 | | 2008 |
Media Networks | | $ | 276 | | $ | 274 | | $ | 276 | | $ | 16,189 | | $ | 15,784 |
Filmed Entertainment | | | 105 | | | 108 | | | 99 | | | 5,549 | | | 6,001 |
Corporate/Eliminations | | | 10 | | | 23 | | | 18 | | | 162 | | | 702 |
| | | | | | | | | | | | | | | |
Total | | $ | 391 | | $ | 405 | | $ | 393 | | $ | 21,900 | | $ | 22,487 |
| | | | | | | | | | | | | | | |
|
|
| | | | | | | | | |
| Capital Expenditures | | Year Ended December 31, |
| (in millions) | | 2009 | | 2008 | | 2007 |
|
Media Networks | | $ | 73 | | $ | 208 | | $ | 132 |
Filmed Entertainment | | | 66 | | | 78 | | | 82 |
Corporate | | | 2 | | | 2 | | | 23 |
| | | | | | | | | |
Total capital expenditures | | $ | 141 | | $ | 288 | | $ | 237 |
| | | | | | | | | |
|
|
| | | | | | | | | | | | |
| Revenues by Component | | Year Ended December 31, | |
| (in millions) | | 2009 | | | 2008 | | | 2007 | |
Advertising | | $ | 4,405 | | | $ | 4,722 | | | $ | 4,690 | |
Feature film | | | 5,205 | | | | 5,771 | | | | 5,253 | |
Affiliate fees | | | 2,901 | | | | 2,620 | | | | 2,339 | |
Ancillary | | | 1,259 | | | | 1,676 | | | | 1,295 | |
Eliminations | | | (151 | ) | | | (164 | ) | | | (154 | ) |
| | | | | | | | | | | | |
Total revenues | | $ | 13,619 | | | $ | 14,625 | | | $ | 13,423 | |
| | | | | | | | | | | | |
|
| |
The Company generated 28% of its total consolidated revenues from international markets in 2009 as compared to 29% and 27% in 2008 and 2007, respectively. The Company’s principal international businesses are in Europe, of which the United Kingdom and Germany together accounted for approximately 48%, 48% and 49% of total European revenues for the years ended December 31, 2009, 2008 and 2007, respectively.
| | | | | | | | | | | | | | | |
| | | Revenues* | | Long-lived Assets** |
| Geographic Information | | Year Ended December 31, | | December 31, |
| (in millions) | | 2009 | | 2008 | | 2007 | | 2009 | | 2008 |
|
United States | | $ | 9,802 | | $ | 10,371 | | $ | 9,743 | | $ | 4,732 | | $ | 5,089 |
Europe | | | 2,413 | | | 2,728 | | | 2,319 | | | 337 | | | 239 |
All other | | | 1,404 | | | 1,526 | | | 1,361 | | | 215 | | | 255 |
| | | | | | | | | | | | | | | |
Total | | $ | 13,619 | | $ | 14,625 | | $ | 13,423 | | $ | 5,284 | | $ | 5,583 |
| | | | | | | | | | | | | | | |
|
|
| * | Revenue classifications are based on customers’ locations. Transactions within the Company between geographic areas are not significant. |
| ** | Reflects total assets less current assets, deferred tax assets, goodwill, intangibles and investments. |
111
VIACOM INC.
NOTES TO CONSOLIDATED FINANCIAL STATEMENTS
(Continued)
NOTE 19. DISCONTINUED OPERATIONS
In July 2007, the Company completed the sale of Famous Music for $355 million, which was previously included in theFilmed Entertainmentreporting segment. Following the sale, the Company’s continuing involvement with Famous Music is limited to certain license and distribution agreements that are not considered significant. Other discontinued operations activity in all years reflects adjustments related to businesses previously sold. The following table sets forth the Company’s net gain attributable to Famous Music and adjustments to previously disposed businesses, including Famous Players and Blockbuster (see Note 16 for additional information), which are presented as discontinued operations in the consolidated financial statements for all periods presented:
| | | | | | | | | | | | |
| Discontinued Operations | | | | | | | | | |
| (in millions) | | Famous Music | | | All Other | | | Total | |
Year-ended December 31, 2009 | | | | | | | | | | | | |
Pre-tax earnings from discontinued operations | | $ | - | | | $ | 32 | | | $ | 32 | |
Income tax provision | | | - | | | | (12 | ) | | | (12 | ) |
| | | | | | | | | | | | |
Net earnings from discontinued operations | | $ | - | | | $ | 20 | | | $ | 20 | |
| | | | | | | | | | | | |
| | | |
Year-ended December 31, 2008 | | | | | | | | | | | | |
Pre-tax gain on discontinued operations | | $ | 3 | | | $ | 20 | | | $ | 23 | |
Income tax provision | | | (1 | ) | | | (4 | ) | | | (5 | ) |
| | | | | | | | | | | | |
Net earnings from discontinued operations | | $ | 2 | | | $ | 16 | | | $ | 18 | |
| | | | | | | | | | | | |
| | | |
Year-ended December 31, 2007 | | | | | | | | | | | | |
Revenues from discontinued operations | | $ | 72 | | | $ | - | | | $ | 72 | |
Pre-tax earnings from discontinued operations | | $ | 3 | | | $ | - | | | $ | 3 | |
Gain on disposal of discontinued operations | | | 320 | | | | 22 | | | | 342 | |
| | | | | | | | | | | | |
Earnings from discontinued operations (before taxes) | | | 323 | | | | 22 | | | | 345 | |
Income tax provision | | | (125 | ) | | | (12 | ) | | | (137 | ) |
| | | | | | | | | | | | |
Net earnings from discontinued operations | | $ | 198 | | | $ | 10 | | | $ | 208 | |
| | | | | | | | | | | | |
NOTE 20. PROPERTY AND EQUIPMENT
| | | | | | | | | | |
| Property and Equipment, Net | | December 31, | | | Estimated
Life
(in years) |
| (in millions) | | 2009 | | | 2008 | | |
Land | | $ | 246 | | | $ | 245 | | | - |
Buildings | | | 328 | | | | 313 | | | 20 to 40 |
Capital leases | | | 394 | | | | 362 | | | 3 to 15 |
Equipment and other | | | 1,661 | | | | 1,635 | | | 3 to 15 |
| | | | | | | | | | |
Property and equipment | | | 2,629 | | | | 2,555 | | | |
Less: Accumulated depreciation | | | (1,450 | ) | | | (1,410 | ) | | |
| | | | | | | | | | |
Property and equipment, net | | $ | 1,179 | | | $ | 1,145 | | | |
| | | | | | | | | | |
Depreciation expense, including capitalized lease amortization, was $226 million, $264 million and $250 million in 2009, 2008 and 2007, respectively. Amortization expense related to capital leases was $35 million, $48 million and $64 million in 2009, 2008 and 2007, respectively. Accumulated amortization of capital leases was $162 million and $222 million at December 31, 2009 and 2008, respectively.
112
VIACOM INC.
NOTES TO CONSOLIDATED FINANCIAL STATEMENTS
(Continued)
NOTE 21. QUARTERLY FINANCIAL DATA (unaudited):
| | | | | | | | | | | | | | | |
2009 (in millions, except per share information) | | First | | Second | | Third | | Fourth | | Full Year |
Revenues | | $ | 2,905 | | $ | 3,299 | | $ | 3,317 | | $ | 4,098 | | $ | 13,619 |
Operating income | | $ | 442 | | $ | 586 | | $ | 784 | | $ | 1,092 | | $ | 2,904 |
Net earnings from continuing operations (Viacom and noncontrolling interests) | | $ | 180 | | $ | 281 | | $ | 446 | | $ | 661 | | $ | 1,568 |
Net earnings (Viacom and noncontrolling interests) | | $ | 180 | | $ | 281 | | $ | 466 | | $ | 661 | | $ | 1,588 |
Net earnings from continuing operations attributable to Viacom | | $ | 177 | | $ | 277 | | $ | 443 | | $ | 694 | | $ | 1,591 |
Net earnings attributable to Viacom | | $ | 177 | | $ | 277 | | $ | 463 | | $ | 694 | | $ | 1,611 |
Basic net earnings per share, continuing operations of Viacom | | $ | 0.29 | | $ | 0.46 | | $ | 0.73 | | $ | 1.14 | | $ | 2.62 |
Basic net earnings per share of Viacom | | $ | 0.29 | | $ | 0.46 | | $ | 0.76 | | $ | 1.14 | | $ | 2.65 |
Diluted net earnings per share, continuing operations of Viacom | | $ | 0.29 | | $ | 0.46 | | $ | 0.73 | | $ | 1.14 | | $ | 2.62 |
Diluted net earnings per share of Viacom | | $ | 0.29 | | $ | 0.46 | | $ | 0.76 | | $ | 1.14 | | $ | 2.65 |
| | | | | | | | | | | | | | | |
2008* (in millions, except per share information) | | First | | Second | | Third | | Fourth | | Full Year |
Revenues | | $ | 3,117 | | $ | 3,857 | | $ | 3,408 | | $ | 4,243 | | $ | 14,625 |
Operating income | | $ | 567 | | $ | 792 | | $ | 689 | | $ | 475 | | $ | 2,523 |
Net earnings from continuing operations (Viacom and noncontrolling interests) | | $ | 274 | | $ | 410 | | $ | 389 | | $ | 177 | | $ | 1,250 |
Net earnings (Viacom and noncontrolling interests) | | $ | 274 | | $ | 411 | | $ | 405 | | $ | 178 | | $ | 1,268 |
Net earnings from continuing operations attributable to Viacom | | $ | 270 | | $ | 406 | | $ | 385 | | $ | 172 | | $ | 1,233 |
Net earnings attributable to Viacom | | $ | 270 | | $ | 407 | | $ | 401 | | $ | 173 | | $ | 1,251 |
Basic net earnings per share, continuing operations attributable to Viacom | | $ | 0.42 | | $ | 0.65 | | $ | 0.62 | | $ | 0.28 | | $ | 1.97 |
Basic net earnings per attributable to Viacom | | $ | 0.42 | | $ | 0.65 | | $ | 0.65 | | $ | 0.28 | | $ | 2.00 |
Diluted net earnings per share, continuing operations attributable to Viacom | | $ | 0.42 | | $ | 0.64 | | $ | 0.62 | | $ | 0.28 | | $ | 1.97 |
Diluted net earnings per share attributable to Viacom | | $ | 0.42 | | $ | 0.65 | | $ | 0.65 | | $ | 0.28 | | $ | 2.00 |
| * | Amounts for all periods have been recast for the adoption of the revised accounting guidance for noncontrolling interests. |
113
Item 9.Changes in and Disagreements with Accountants on Accounting and Financial Disclosure.
None.
Item 9A.Controls and Procedures.
Evaluation of Disclosure Controls and Procedures
We maintain “disclosure controls and procedures,” as such term is defined in Rules 13a-15(e) and 15d-15(e) under the Securities Exchange Act of 1934 (the “Exchange Act”), that are designed to ensure that information required to be disclosed by us in reports that we file or submit under the Exchange Act is recorded, processed, summarized, and reported within the time periods specified in SEC rules and forms, and that such information is accumulated and communicated to our management, including our Chief Executive Officer and Chief Financial Officer, as appropriate, to allow timely decisions regarding required disclosure. In designing and evaluating our disclosure controls and procedures, management recognized that disclosure controls and procedures, no matter how well conceived and operated, can provide only reasonable, not absolute, assurance that the objectives of the disclosure controls and procedures are met. Additionally, in designing disclosure controls and procedures, our management necessarily was required to apply its judgment in evaluating the cost-benefit relationship of possible disclosure controls and procedures. The design of any disclosure controls and procedures also is based in part upon certain assumptions about the likelihood of future events, and there can be no assurance that any design will succeed in achieving its stated goals under all potential future conditions.
Our management, with the participation of our Chief Executive Officer and Chief Financial Officer, has evaluated the effectiveness of the design and operation of our disclosure controls and procedures as of December 31, 2009. Based on that evaluation, management has concluded that, as of such date, our disclosure controls and procedures were effective.
Management’s Report on Internal Control over Financial Reporting
Management’s Report on Internal Control over Financial Reporting is set forth on page 70.
The effectiveness of the Company’s internal control over financial reporting has been audited by PricewaterhouseCoopers, LLP an independent registered public accounting firm, as stated in their report, which is included herein on page 71.
Changes in Internal Control Over Financial Reporting
There were no changes in our internal control over financial reporting during the fiscal quarter ended December 31, 2009 that have materially affected, or are reasonably likely to materially affect, our internal control over financial reporting.
Item 9B.Other Information.
None.
114
PART III
Item 10.Directors, Executive Officers and Corporate Governance.
The information required by this item with respect to our directors and certain corporate governance practices is contained in our Proxy Statement for our 2010 Annual Meeting of Stockholders (the “Proxy Statement”) under the headings “Corporate Governance,” “Our Board of Directors,” “Item 1—Election of Directors” and “Section 16(a) Beneficial Ownership Reporting Compliance,” which information is incorporated herein by reference. The information required by this item with respect to our executive officers is (i) contained in the Proxy Statement under the headings “Corporate Governance” and “Section 16(a) Beneficial Ownership Reporting Compliance” and (ii) included in Part I of this Form 10-K under the caption “Our Executive Officers,” which information is incorporated herein by reference.
Item 11. Executive Compensation.
The information required by this item is contained in the Proxy Statement under the headings “Executive Compensation,” “Compensation Committee Interlocks and Insider Participation” and “Compensation Committee Report,” which information is incorporated herein by reference.
Item 12. Security Ownership of Certain Beneficial Owners and Management and Related Stockholder Matters.
The information required by this item is contained in the Proxy Statement under the headings “Equity Compensation Plan Information” and “Security Ownership of Certain Beneficial Owners and Management,” which information is incorporated herein by reference.
Item 13. Certain Relationships and Related Transactions, and Director Independence.
The information required by this item is contained in the Proxy Statement under the headings “Related Person Transactions” and “Our Board of Directors,” which information is incorporated herein by reference.
Item 14. Principal Accounting Fees and Services.
The information required by this item is contained in the Proxy Statement under the heading “Services Provided by the Independent Auditor and Fees Paid,” which information is incorporated herein by reference.
115
PART IV
Item 15. Exhibits, Financial Statement Schedules.
| (a) | 1.Financial Statements. |
Management’s Report on Internal Control over Financial Reporting
Report of Independent Registered Public Accounting Firm
Consolidated Statements of Earnings for the years ended December 31, 2009, 2008 and 2007
Consolidated Balance Sheets as of December 31, 2009 and 2008
Consolidated Statements of Cash Flows for the years ended December 31, 2009, 2008 and 2007
Consolidated Statements of Stockholders’ Equity and Comprehensive Income for the years ended December 31, 2009, 2008 and 2007
Notes to Consolidated Financial Statements
2.Financial Statement Schedules.
Schedule II. Valuation and Qualifying Accounts
All other Schedules are omitted since the required information is not present or is not present in amounts sufficient to require submission of the schedule.
3.Exhibits.
The exhibits listed in Item 15(b) of this Part IV are filed or incorporated by reference as part of this Form 10-K. The Index to Exhibits is on page 120.
The exhibits listed in Item 15(b) of this Part IV are filed or incorporated by reference as part of this Form 10-K. The Index to Exhibits is on page 120.
116
SIGNATURES
Pursuant to the requirements of Section 13 or 15(d) of the Securities Exchange Act of 1934, the registrant has duly caused this report to be signed on its behalf by the undersigned, thereunto duly authorized.
| | |
| VIACOM INC. |
| |
By: | | /s/ Philippe P. Dauman |
| | Philippe P. Dauman |
| | President and Chief Executive Officer |
Date: February 11, 2010
Pursuant to the requirements of the Securities Exchange Act of 1934, this report has been signed by the following persons on behalf of Viacom Inc. and in the capacities and on the dates indicated:
| | | | |
Signature | | Title | | Date |
| | |
/s/ Philippe P. Dauman Philippe P. Dauman | | President and Chief Executive Officer; Director | | February 11, 2010 |
| | |
/s/ Thomas E. Dooley Thomas E. Dooley | | Senior Executive Vice President, Chief Administrative Officer and Chief Financial Officer; Director | | February 11, 2010 |
| | |
/s/ James W. Barge James W. Barge | | Executive Vice President, Controller, Tax & Treasury (Chief Accounting Officer) | | February 11, 2010 |
| | |
/s/ Sumner M. Redstone Sumner M. Redstone | | Executive Chairman of the Board and Founder | | February 11, 2010 |
| | |
/s/ Shari Redstone Shari Redstone | | Vice Chair of the Board | | February 11, 2010 |
| | |
/s/ George S. Abrams George S. Abrams | | Director | | February 11, 2010 |
| | |
/s/ Alan C. Greenberg Alan C. Greenberg | | Director | | February 11, 2010 |
| | |
Robert K. Kraft | | Director | | February 11, 2010 |
117
| | | | |
Signature | | Title | | Date |
| | |
/s/ Blythe J. McGarvie Blythe J. McGarvie | | Director | | February 11, 2010 |
| | |
/s/ Charles E. Phillips, Jr. Charles E. Phillips, Jr. | | Director | | February 11, 2010 |
| | |
/s/ Frederic V. Salerno Frederic V. Salerno | | Director | | February 11, 2010 |
| | |
/s/ William Schwartz William Schwartz | | Director | | February 11, 2010 |
118
Item 15(a).
VIACOM INC.
SCHEDULE II—VALUATION AND QUALIFYING ACCOUNTS
| | | | | | | | | | | | | | | | |
(in millions) | | Beginning of
period | | Acquired | | Additional-expense
and other | | Deductions | | | End of
period |
Year ended December 31, 2009: | | | | | | | | | | | | | | | | |
Allowance for doubtful accounts | | $ | 99 | | $ | — | | $ | 31 | | $ | (36 | ) | | $ | 94 |
Sales returns and allowances | | $ | 829 | | $ | — | | $ | 625 | | $ | (988 | ) | | $ | 466 |
Inventory obsolescence reserves | | $ | 119 | | $ | — | | $ | 26 | | $ | (37 | ) | | $ | 108 |
Deferred tax valuation allowance | | $ | 108 | | $ | — | | $ | 43 | | $ | (7 | ) | | $ | 144 |
| | | | | |
Year ended December 31, 2008: | | | | | | | | | | | | | | | | |
Allowance for doubtful accounts | | $ | 102 | | $ | — | | $ | 33 | | $ | (36 | ) | | $ | 99 |
Sales returns and allowances | | $ | 706 | | $ | — | | $ | 1,451 | | $ | (1,328 | ) | | $ | 829 |
Inventory obsolescence reserves | | $ | 107 | | $ | — | | $ | 40 | | $ | (28 | ) | | $ | 119 |
Deferred tax valuation allowance | | $ | 126 | | $ | — | | $ | 29 | | $ | (47 | ) | | $ | 108 |
| | | | | |
Year ended December 31, 2007: | | | | | | | | | | | | | | | | |
Allowance for doubtful accounts | | $ | 143 | | $ | — | | $ | 13 | | $ | (54 | ) | | $ | 102 |
Sales returns and allowances | | $ | 563 | | $ | — | | $ | 1,210 | | $ | (1,067 | ) | | $ | 706 |
Inventory obsolescence reserves | | $ | 106 | | $ | — | | $ | 13 | | $ | (12 | ) | | $ | 107 |
Deferred tax valuation allowance | | $ | 88 | | $ | — | | $ | 52 | | $ | (14 | ) | | $ | 126 |
119
Item 15(b).
INDEX TO EXHIBITS
| | |
| Exhibit No. | | Description of Exhibit |
| |
| 3.1 | | Amended and Restated Certificate of Incorporation of Viacom Inc. effective December 31, 2005 (incorporated by reference to Exhibit 3.1 to the Annual Report on Form 10-K of Viacom Inc. filed March 16, 2006) (File No. 001-32686). |
| |
| 3.2 | | Amended and Restated Bylaws of Viacom Inc. effective December 8, 2009 (incorporated by reference to Exhibit 3.1 to the Current Report on Form 8-K of Viacom Inc. filed December 14, 2009) (File No. 001-32686). |
| |
| 4.1 | | Indenture, dated as of April 12, 2006, between Viacom Inc. and The Bank of New York (incorporated by reference to Exhibit 4.1 to the Current Report on Form 8-K of Viacom Inc. filed April 17, 2006) (File No. 001-32686). |
| |
| 4.2 | | First Supplemental Indenture, dated as of April 12, 2006, between Viacom Inc. and The Bank of New York, including Form of 5.75% Senior Note due 2011, Form of 6.25% Senior Note due 2016 and Form of 6.875% Senior Debenture due 2036 (incorporated by reference to Exhibit 4.2 to the Current Report on Form 8-K of Viacom Inc. filed April 17, 2006) (File No. 001-32686). |
| |
| 4.3 | | Second Supplemental Indenture, dated as of June 16, 2006, between Viacom Inc. and The Bank of New York, including Form of Floating Rate Senior Note due 2009 (incorporated by reference to Exhibit 4.4 to the Registration Statement on Form S-4 of Viacom Inc. filed August 21, 2006) (File No. 333-136756). |
| |
| 4.4 | | Third Supplemental Indenture, dated as of December 13, 2006, between Viacom Inc. and The Bank of New York, as trustee (including forms of Senior Notes) (incorporated by reference to Exhibit 4.1 to the Current Report on Form 8-K of Viacom Inc. filed December 19, 2006) (File No . 001-32686). |
| |
| 4.5 | | Fourth Supplemental Indenture, dated as of October 5, 2007, between Viacom Inc. and The Bank of New York, as trustee (including forms of Senior Notes and Senior Debentures) (incorporated by reference to Exhibit 4.1 to the Current Report on Form 8-K of Viacom Inc. filed October 9, 2007) (File No. 001-32686). |
| |
| 4.6 | | Fifth Supplemental Indenture, dated as of August 26, 2009, between Viacom Inc. and The Bank of New York Mellon, as trustee (including forms of Senior Notes) (incorporated by reference to Exhibit 4.1 to the Current Report on Form 8-K of Viacom Inc. filed August 26, 2009) (File No. 001-32686). |
| |
| 4.7 | | Sixth Supplemental Indenture, dated as of September 29, 2009, between Viacom Inc. and The Bank of New York Mellon, as trustee (including forms of Senior Notes) (incorporated by reference to Exhibit 4.1 to the Current Report on Form 8-K of Viacom Inc. filed September 30, 2009) (File No. 001-32686). |
| |
| 10.1 | | $3.25 Billion Five-Year Credit Agreement, dated as of December 8, 2005, among New Viacom Corp., the Lenders named therein, JPMorgan Chase Bank, N.A., as Administrative Agent, Citibank, N.A., as Syndication Agent, and Bank of America, N.A., Deutsche Bank Securities Inc. and The Bank of Tokyo-Mitsubishi, Ltd., New York Branch, as Co-Documentation Agents (incorporated by reference to Exhibit 10.2 to the Current Report on Form 8-K of New Viacom Corp. filed December 14, 2005) (File No. 001-32686). |
| |
| 10.2* | | First Amendment to $3.25 Billion Five-Year Credit Agreement, dated as of December 11, 2009, among Viacom Inc. (previously, New Viacom Corp.), the Lenders named therein, JPMorgan Chase Bank, N.A., as Administrative Agent, Citibank, N.A., as Syndication Agent, and Bank of America, N.A., Deutsche Bank Securities Inc. and The Bank of Tokyo-Mitsubishi, Ltd., New York Branch, as Co-Documentation Agents. |
120
| | |
| Exhibit No. | | Description of Exhibit |
| |
| 10.3 | | Termination Agreement, effective as of October 10, 2008, among Viacom Inc., NAIRI, Inc. and National Amusements, Inc., terminating the Agreement dated as of December 21, 2005 between New Viacom Corp., National Amusements, Inc. and NAIRI, Inc. (incorporated by reference to Exhibit 10.1 to the Current Report on Form 8-K of New Viacom Corp. filed December 23, 2005), as amended by First Amendment dated as of June 20, 2007 among Viacom Inc. (formerly known as New Viacom Corp.), NAIRI, Inc. and National Amusements, Inc. (incorporated by reference to Exhibit 10 to the Current Report on Form 8-K of Viacom Inc. filed June 26, 2007) (Commission File No. 001-32686). |
| |
| 10.4 | | Summary of Viacom Inc. Compensation for Outside Directors (incorporated by reference to Exhibit 10.7 to the Annual Report on Form 10-K of Viacom Inc. filed March 16, 2006) (File No. 001-32686).** |
| |
| 10.5 | | Amended Compensation Arrangement for Non-Executive Vice Chair (incorporated by reference to Exhibit 10.5 to the Quarterly Report on Form 10-Q of Viacom Inc. filed November 9, 2006) (File No. 001-32686).** |
| |
| 10.6 | | Viacom Inc. 2006 Stock Option Plan for Outside Directors (incorporated by reference to Exhibit 10.8 to the Annual Report on Form 10-K of Viacom Inc. filed March 16, 2006) (File No. 001-32686).** |
| |
| 10.7 | | Viacom Inc. 2006 RSU Plan for Outside Directors (incorporated by reference to Exhibit 10.9 to the Annual Report on Form 10-K of Viacom Inc. filed March 16, 2006) (File No. 001-32686).** |
| |
| 10.8 | | Viacom Inc. Deferred Compensation Plan for Outside Directors (incorporated by reference to Exhibit 10.11 to the Annual Report on Form 10-K of Viacom Inc. filed March 16, 2006) (File No. 001-32686).** |
| |
| 10.9 | | Viacom Inc. Senior Executive Short-Term Incentive Plan, as amended and restated December 2, 2008 (incorporated by reference to Exhibit 10.11 to the Annual Report on Form 10-K of Viacom Inc. filed February 12, 2009) (File No. 001-32686).** |
| |
| 10.10 | | Viacom Inc. 2006 Long-Term Management Incentive Plan, as amended and restated December 2, 2008 (incorporated by reference to Exhibit 10.12 to the Annual Report on Form 10-K of Viacom Inc. filed February 12, 2009) (File No. 001-32686).** |
| |
| 10.10.1 | | Form of LTMIP Award Certificate (incorporated by reference to Exhibit 10.1 to the Current Report on Form 8-K of Viacom Inc. filed May 29, 2007) (File No. 001-32686).** |
| |
| 10.10.2 | | Form of Terms and Conditions to the Stock Option Certificate (incorporated by reference to Exhibit 10.2 to the Current Report on Form 8-K of Viacom Inc. filed May 29, 2007) (File No. 001-32686).** |
| |
| 10.10.3 | | Form of Terms and Conditions to the Restricted Share Units Certificate (incorporated by reference to Exhibit 10.3 to the Current Report on Form 8-K of Viacom Inc. filed May 29, 2007) (File No. 001-32686).** |
| |
| 10.10.4 | | Form of Terms and Conditions to the Performance Share Units Certificate (incorporated by reference to Exhibit 10.4 to the Current Report on Form 8-K of Viacom Inc. filed May 29, 2007) (File No. 001-32686).** |
| |
| 10.11 | | Viacom Excess Pension Plan, as amended and restated January 1, 2009 (incorporated by reference to Exhibit 10.13 to the Annual Report on Form 10-K of Viacom Inc. filed February 12, 2009) (File No. 001-32686).** |
| |
| 10.12 | | Viacom Excess 401(k) Plan for Designated Senior Executives, as amended and restated January 1, 2009 (incorporated by reference to Exhibit 10.14 to the Annual Report on Form 10-K of Viacom Inc. filed February 12, 2009) (File No. 001-32686).** |
| |
| 10.13 | | Viacom Bonus Deferral Plan for Designated Senior Executives, as amended and restated January 1, 2009 (incorporated by reference to Exhibit 10.15 to the Annual Report on Form 10-K of Viacom Inc. filed February 12, 2009) (File No. 001-32686).** |
121
| | |
| Exhibit No. | | Description of Exhibit |
| |
| 10.14 | | Employment Agreement with Sumner M. Redstone, dated September 25, 2006 (incorporated by reference to Exhibit 10.1 to the Current Report on Form 8-K of Viacom Inc. filed September 26, 2006) (File No. 001-32686).** |
| |
| 10.15 | | Employment Agreement between Viacom Inc. and Philippe P. Dauman, dated September 5, 2006 (incorporated by reference to Exhibit 10.1 to the Current Report on Form 8-K of Viacom Inc. filed September 7, 2006) (File No. 001-32686).** |
| |
| 10.16 | | Employment Agreement between Viacom Inc. and Thomas E. Dooley, dated September 5, 2006 (incorporated by reference to Exhibit 10.2 to the Current Report on Form 8-K of Viacom Inc. filed September 7, 2006) (File No. 001-32686).** |
| |
| 10.17* | | Employment Agreement between Viacom Inc. and Michael D. Fricklas, dated as of October 2, 2009.** |
| |
| 10.18 | | Employment Agreement between Viacom Inc. and Denise White, dated as of September 24, 2007 (incorporated by reference to Exhibit 10.20 to the Annual Report on Form 10-K of Viacom Inc. filed February 12, 2009) (File No. 001-32686).** |
| |
| 10.19 | | Service Agreement, dated as of March 1, 1994, between George S. Abrams and Former Viacom (incorporated by reference to Exhibit 10(q) to the Annual Report on Form 10-K of Former Viacom filed on March 31, 1995) (File No. 001-09553), assigned to Viacom Inc.** |
| |
| 10.20 | | Separation Agreement dated as of December 19, 2005 by and between Former Viacom and New Viacom Corp. (incorporated by reference to Exhibit 10.1 to the Current Report on Form 8-K of New Viacom Corp. filed December 21, 2005) (File No. 001-32686). |
| |
| 10.21 | | Tax Matters Agreement dated as of December 30, 2005 by and between Former Viacom and New Viacom Corp. (incorporated by reference to Exhibit 10.1 to the Current Report on Form 8-K of Viacom Inc. filed January 5, 2006) (File No. 001-32686). |
| |
| 21.1* | | Subsidiaries of Viacom Inc. |
| |
| 23.1* | | Consent of PricewaterhouseCoopers LLP, independent registered public accounting firm for Viacom Inc. |
| |
| 31.1* | | Certification of the Chief Executive Officer of Viacom Inc. pursuant to Rule 13a-14(a) or 15d-14(a), as adopted pursuant to Section 302 of the Sarbanes-Oxley Act of 2002. |
| |
| 31.2* | | Certification of the Chief Financial Officer of Viacom Inc. pursuant to Rule 13a-14(a) or 15d-14(a), as adopted pursuant to Section 302 of the Sarbanes-Oxley Act of 2002. |
| |
| 32.1* | | Certification of the Chief Executive Officer of Viacom Inc. furnished pursuant to 18 U.S.C. Section 1350, as adopted pursuant to Section 906 of the Sarbanes-Oxley Act of 2002. |
| |
| 32.2* | | Certification of the Chief Financial Officer of Viacom Inc. furnished pursuant to 18 U.S.C. Section 1350, as adopted pursuant to Section 906 of the Sarbanes-Oxley Act of 2002. |
| |
| 101.INS*** | | XBRL Instance Document. |
| |
| 101.SCH*** | | XBRL Taxonomy Extension Schema. |
| |
| 101.CAL*** | | XBRL Taxonomy Extension Calculation Linkbase. |
| |
| 101.DEF*** | | XBRL Taxonomy Extension Definition Linkbase. |
| |
| 101.LAB*** | | XBRL Taxonomy Extension Label Linkbase. |
| |
| 101.PRE*** | | XBRL Taxonomy Extension Presentation Linkbase. |
| ** | Represents a management contract or compensatory plan or arrangement required to be filed as an exhibit. |
122