Exhibit 99.1
Half-Year Report
January – June 2020


| | | | |
| 2 | | Group Interim Statement | | |
Contents
MorphoSys Group:
Half-Year Report January – June 2020
| | | | |
| Group Interim Statement | |  | | 3 |
Summary of the Second Quarter of 2020
STATEMENT ON THE IMPACT OF THE GLOBAL COVID-19 PANDEMIC
| · | | MorphoSys recognizes the impact of the global COVID-19 pandemic on healthcare systems and society worldwide, as well as the resulting potential impact on preclinical and clinical programs, especially clinical trials. In addition to the steps already communicated to mitigate the impact of the pandemic on MorphoSys’ employees, patients and the broader community, further measures may need to be implemented in the future. MorphoSys will take various factors into consideration, including potential adaptation of clinical trials due to restrictions on visits to healthcare facilities, increased demands on healthcare services and changes in the availability of study personnel. MorphoSys continuously monitors the situation and takes appropriate decisions on a case-by-case basis to ensure the safety of patients, study personnel and other stakeholders as well as to safeguard data integrity. |
| · | | Despite the uncertainty caused by the COVID-19 pandemic in the United States, all of the preparations for the market launch of tafasitamab continue, which includes the planned use of digital channels. MorphoSys and Incyte are preparing for the successful commercial launch of tafasitamab. |
| · | | Patient enrollment for all ongoing tafasitamab studies continues as planned. However, a delay cannot be excluded due to the factors mentioned above. |
| · | | Recruitment of patients for the M-PLACE study with MOR202 (which now has the International Nonproprietary Name (INN) felzartamab to which MorphoSys will refer to going forward), which has been temporarily paused due to the COVID-19 pandemic, has been resumed. The first patient was dosed on July 27, 2020. |
FINANCIAL RESULTS FOR THE FIRST HALF OF 2020
| · | | Group revenue in the first half of 2020 totaled € 269.7 million (H1 2019: € 48.2 million), and EBIT amounted to € 163.5 million (H1 2019: € -29.3 million). |
| · | | Liquidity equaled € 1,061.8 million on June 30, 2020 (December 31, 2019: € 357.4 million). |
| · | | 2020 financial guidance remains unchanged for revenue in the range of € 280 million to € 290 million, EBIT between € -15 million to € 5 million and R&D expenses within € 130 million to € 140 million. |
OPERATING HIGHLIGHTS FOR THE SECOND QUARTER OF 2020
PROPRIETARY DEVELOPMENT
| · | | On April 27, 2020, MorphoSys and I-Mab announced the dosing of the first patient in an ongoing phase 3 clinical study in mainland China to evaluate MorphoSys’ human CD38 antibody felzartamab (MOR202/TJ202) in combination with lenalidomide plus dexamethasone in patients with relapsed (recurrent) or refractory (treatment-resistant) multiple myeloma (r/r MM). Under a license agreement with MorphoSys, I-Mab has exclusive rights to develop and commercialize felzartamab (MOR202/TJ202) in China, Taiwan, Hong Kong and Macao. |
| | | | |
| 4 | | Group Interim Statement | | |
| · | | On May 14, 2020, MorphoSys and Incyte announced long-term follow-up results from the ongoing phase 2 L-MIND study investigating tafasitamab in combination with lenalidomide for the treatment of patients with relapsed/refractory diffuse large B cell lymphoma (r/r DLBCL). The data (based on a November 30, 2019 cut-off date) confirmed the previously reported results of the primary analysis. |
| · | | On May 20, 2020, MorphoSys and Incyte announced the validation of the European Marketing Authorization Application (MAA) for tafasitamab. The MAA seeks approval of tafasitamab in combination with lenalidomide, followed by tafasitamab monotherapy, for the treatment of adult patients with r/r DLBCL, including DLBCL arising from low-grade lymphoma, who are ineligible for autologous stem cell transplantation (ASCT). The validation of the Marketing Authorization Application by the European Medicines Agency (EMA) confirms that the formal review process can begin. Incyte has exclusive commercialization rights to tafasitamab outside of the U.S. |
| · | | Tafasitamab data were presented at the annual meetings of the American Society of Clinical Oncology (ASCO) and European Hematology Association (EHA), which were held as virtual conferences on May 29-31, 2020 and June 11-14, 2020, respectively. |
| · | | GSK started a clinical trial (OSCAR) to evaluate the efficacy and safety of otilimab in patients with severe pulmonary COVID 19-associated disease. |
PARTNERED DISCOVERY
| · | | In June 2020, the 15th antibody from the long-term collaboration between MorphoSys and Novartis entered clinical development. This triggered a milestone payment to MorphoSys. |
CORPORATE DEVELOPMENTS
| · | | On April 21, 2020, MorphoSys announced the appointment of Roland Wandeler, Ph.D., to the MorphoSys AG’s Management Board effective May 5, 2020. As today’s Chief Operating Officer, Mr. Wandeler leads the global commercial operations and oversees the Company’s U.S. operations. |
| · | | On May 27, 2020, the Annual General Meeting of MorphoSys AG re-elected Wendy Johnson, Dr. George Golumbeski and Michael Brosnan to the Company’s Supervisory Board. Due to the restrictions imposed by the COVID-19 pandemic, the 2020 Annual General Meeting was held as a virtual meeting without the physical presence of shareholders or their proxies and was broadcast live to registered shareholders over the Internet. |
| · | | At the end of the second quarter of 2020, MorphoSys’ pipeline comprised a total of 115 drug candidates, 27 of which were in clinical development. |
SIGNIFICANT EVENTS AFTER THE END OF THE SECOND QUARTER OF 2020
| · | | On July 14, 2020, MorphoSys announced that its licensee Janssen announced the FDA approval of Tremfya® (guselkumab) as a treatment for adult patients living with active psoriatic arthritis (PsA). |
| · | | On July 27, 2020, the first autoimmune membranous nephropathy (aMN) patient was dosed with felzartamab (MOR202) in the M-PLACE study. |
| · | | On August 1, 2020, MorphoSys and Incyte announced that the FDA has approved Monjuvi® (tafasitamab-cxix) in combination with lenalidomide for the treatment of adult patients with relapsed or refractory diffuse large |
| | | | |
| Group Interim Statement | | | | 5 |
| | | B-cell lymphoma (DLBCL) not otherwise specified, including DLBCL arising from low grade lymphoma, and who are not eligible for autologous stem cell transplant (ASCT). |
| | | | |
| 6 | | Group Interim Statement | | |
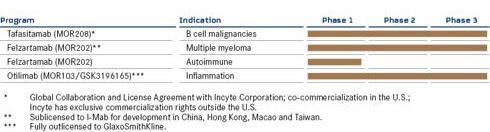
MORPHOSYS PRODUCT PIPELINE AS OF JUNE 30, 2020
CLINICAL PIPELINE – PROPRIETARY DEVELOPMENT PROGRAMS
Most advanced development stage
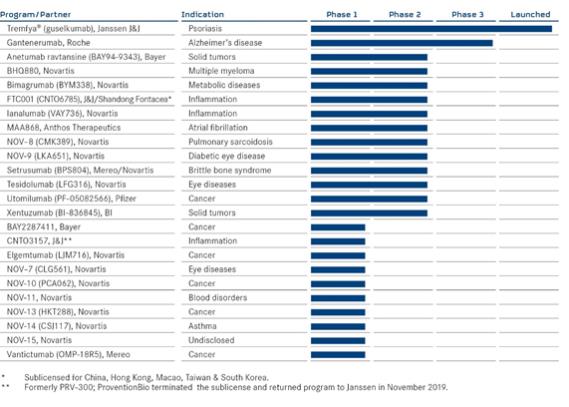
CLINICAL PIPELINE – PARTNERED DISCOVERY PROGRAMS
Most advanced development stage
| | | | |
| Group Interim Statement | | | | 7 |
Interim Group Management Report: January 1 – June 30, 2020
Business Environment and Activities
ECONOMIC DEVELOPMENT
The International Monetary Fund (IMF) is anticipating a sharp decline in global economic development in 2020 as a result of the global COVID-19 pandemic. It is currently forecasting a contraction in global economic output of 4.9% in 2020. The economic recovery is likely to be slower than what estimates had indicated at the beginning of the pandemic. Economic output this year in Germany is forecast to decline by 7.8%, and in the Eurozone by even 10.2%. The United States are expected to see a decline in economic output of 8.0%.
The COVID-19 pandemic has also had a tremendous impact on stock markets worldwide. After an optimistic start to 2020, stock indices plunged in the second half of February and subsequently settled at a lower level. At the end of the first half-year, the German DAX index closed 7.1% lower, the MDAX index for medium-sized companies ended with a decline of 8.7% and the technology stocks index TecDAX had dropped 2.0%. Biotechnology stocks, on the other hand, benefited from the efforts to develop vaccines and drugs against the SARS-CoV-2 virus, as demonstrated by the performance of the Nasdaq Biotech Index, which closed the first half-year with an increase of 13.5%.
IMPLICATIONS FOR MORPHOSYS
Shares of MorphoSys AG could not avoid the impact of the economic developments described above. After starting the year in an uptrend, the shares reached an interim high of € 136.20 on January 10 followed by a low of € 70.20 several weeks later on March 18. The shares recovered quickly from this slump and, after some volatility, closed the first half of 2020 on June 30 at € 112.45.
SECTOR OVERVIEW
The first half of 2020 was marked by medical conferences featuring the presentation of research results by companies in the sector. Travel and meeting restrictions in the wake of the COVID-19 pandemic, however, meant that these conferences had to be held virtually. Among other events, the annual meeting of the American Society of Clinical Oncology (ASCO), which is the world’s largest oncology conference, was held as a virtual conference on May 29-31, 2020. On June 11-14, 2020, the 25th Annual Meeting of the European Hematology Association (EHA), the leading European conference in the field of hematology, was also held as a virtual conference. The Management presented the Company at several investor conferences which were also held as virtual events in June 2020. Clinical results of tafasitamab were presented at all conferences.
| | | | |
| 8 | | Group Interim Statement | | |
BUSINESS PERFORMANCE
MorphoSys is very satisfied with the Company’s business performance in the first half of 2020, both with respect to its research activities concerning the Company’s proprietary programs and partnered compounds, as well as with the Group’s development.
In the second quarter, MorphoSys and Incyte announced long-term follow-up results from the ongoing phase 2 L-MIND study evaluating tafasitamab in combination with lenalidomide for the treatment of patients with r/r DLBCL. New two-year follow-up data of the L-MIND study (November 30, 2019 cut-off date) confirmed earlier reported results from the primary analysis. The Biologics License Application (BLA) for tafasitamab submitted by MorphoSys to the U.S. Food and Drug Administration (FDA) in December 2019 was also accepted by the FDA for Priority Review. In addition, MorphoSys and I-Mab jointly announced that the first patient had been dosed in an ongoing phase 3 clinical trial in mainland China to evaluate MorphoSys’ human CD38 antibody felzartamab (MOR202/TJ202) in combination with lenalidomide plus dexamethasone in patients with r/r MM. After announcing the initiation of a phase 3 clinical development program for the antibody otilimab (formerly MOR103/GSK3196165) in rheumatoid arthritis in mid-2019, GSK has also started a clinical trial (OSCAR) to evaluate the efficacy and safety of otilimab in patients with severe pulmonary COVID-19-associated disease.
The ongoing collaborations in the Partnered Discovery segment continued successfully during the first half of 2020. With the start of clinical development of the 15th antibody from the long-term collaboration with Novartis, the number of clinical candidates increased during the reporting period.
At the end of the second quarter of 2020, MorphoSys’ product pipeline comprised 115 partnered and proprietary programs in research and development, of which 27 were clinical programs.
In the opinion of the Management Board, at the time of publishing this half-year report, MorphoSys was well on track to achieve its full-year business and financial targets.
STRATEGY AND GROUP MANAGEMENT
MorphoSys did not make any changes to its strategy or management of the Group during the first six months of 2020. A full description of the strategy and Group management can be found from page 47 ff. of the 2019 Annual Report.
Research and Development and Operating Business Performance
PROPRIETARY DEVELOPMENT
MorphoSys’ development activities in this segment are currently focused on the following clinical candidates:
| | | | |
| Group Interim Statement | | | | 9 |
| · | | Tafasitamab – an antibody for the treatment of blood cancers and the most advanced proprietary product candidate in the Proprietary Development segment. |
| · | | Felzartamab (MOR202) – an antibody for which MorphoSys signed a regional license agreement with I-Mab Biopharma (I-Mab) in November 2017 for development in multiple myeloma in Greater China, and whose therapeutic potential in autoimmune diseases is currently being evaluated by MorphoSys. |
| · | | Otilimab – an antibody in which GlaxoSmithKline [GSK] is currently conducting clinical trials for the treatment of rheumatoid arthritis. This program was originally a MorphoSys proprietary program and was fully out-licensed to GSK in 2013. |
In addition to the programs listed above, several proprietary programs are in earlier-stage research and development, including MOR210, a preclinical antibody that was out-licensed to I-Mab in November 2018 for China and certain other territories in Asia. The lanthipeptide MOR107 (LP 2-3), which is in development at Dutch Lanthio Group, was subject to an event-related impairment test at the end of the second quarter. Since the program is not expected to progress towards clinical development, a full impairment was recognized and the development has been terminated.
Tafasitamab (MOR208) is a humanized monoclonal antibody directed against the CD19 antigen. CD19 is selectively expressed on the surface of B cells, which belong to a group of white blood cells. CD19 enhances B cell receptor signaling, which is an important factor in B cell survival and growth, making CD19 a potential target in the treatment of B cell malignancies.
On January 13, 2020, MorphoSys and Incyte announced the signing of a collaboration and license agreement for the further global development and commercialization of MorphoSys’ proprietary anti-CD19 antibody tafasitamab. Under this agreement, MorphoSys and Incyte will co-develop tafasitamab broadly in r/r DLBCL, first-line DLBCL and other indications beyond DLBCL, such as follicular lymphoma (FL), marginal zone lymphoma (MZL) and chronic lymphocytic leukemia (CLL). Incyte will be responsible for initiating a combination study of its PI3K delta inhibitor parsaclisib with tafasitamab in relapsed/refractory malignant B cell disease, in addition to leading any potential pivotal studies in CLL, and for a phase 3 trial in r/r FL/MZL. MorphoSys will continue to be responsible for its ongoing clinical studies with tafasitamab in non-Hodgkin’s lymphoma (NHL), CLL, r/r DLBCL and first-line DLBCL. MorphoSys and Incyte will share responsibility for initiating further global clinical trials. Incyte intends to pursue development in additional territories, including Japan and China.
The current focus of the clinical development of tafasitamab is DLBCL. Both the L-MIND and B-MIND studies target patients suffering from r/r DLBCL who are ineligible for high-dose chemotherapy (HDC) or ASCT. For this group of patients, the currently available treatment options are limited and not yet sufficiently effective, which is why MorphoSys and Incyte see a high unmet medical need for the development of alternative treatment options. The First-MIND study is being conducted in patients with newly diagnosed DLBCL and is expected to pave the way
| | | | |
| 10 | | Group Interim Statement | | |
for a pivotal phase 3 trial in first-line patients.
The phase 2 study L-MIND (Lenalidomide-MOR208 IN DLBCL), initiated in April 2016, was designed as a single-arm, open-label study with the primary endpoint of overall response rate (ORR) and several secondary endpoints including progression-free survival (PFS), overall survival (OS) and time to progression (TTP). In October 2017, based on the study’s interim data, the FDA granted Breakthrough Therapy Designation for tafasitamab in combination with lenalidomide. Patient recruitment was completed in November 2017.
On May 14, 2020, MorphoSys and Incyte announced updates on the ongoing phase 2 L-MIND study evaluating tafasitamab in combination with lenalidomide for the treatment of patients with r/r DLBCL. The data (November 30, 2019 data cut-off date) confirm the previously reported results of the primary analysis. In this long-term analysis of the L-MIND data, 80 study patients treated with tafasitamab plus lenalidomide were included in the efficacy analysis. After a minimum two-year follow-up, outcomes from the L-MIND study were consistent with the primary analysis and confirmed the duration of response (DoR) and overall survival (OS) after treatment with tafasitamab plus lenalidomide, followed by tafasitamab monotherapy in patients with r/r DLBCL who are ineligible for ASCT. At the data cut-off date, an assessment by an independent review committee (IRC) showed an objective response rate (ORR) of 58.8% (47 out of 80 patients) and a complete response rate (CR) of 41.3% (33 out of 80 patients). The median duration of response (mDOR) was 34.6 months, the median overall survival (mOS) was 31.6 months, and the median progression-free survival (mPFS) was 16.2 months. The safety profile was consistent with that observed in earlier reported studies with tafasitamab plus lenalidomide. The complete results were presented at the 25th EHA Annual Congress, which was held virtually on June 11-14, 2020.
At the annual meeting of the American Society of Clinical Oncology (ASCO), which was held as a virtual conference on May 29-31, 2020, detailed primary analysis data from the retrospective observational matched control cohort (Re-MIND) were presented. Topline data of the Re-MIND study were first published in October 2019. The efficacy of the lenalidomide monotherapy was compared to the efficacy data of tafasitamab combined with lenalidomide, as investigated in our L-MIND study, based on real-world patient data. For this purpose, Re-MIND collected real-world efficacy data from 490 patients with r/r DLBCL who were ineligible for HDC and ASCT and had already received lenalidomide monotherapy in the U.S. or EU. For the best possible comparison with the patients from the L-MIND study, qualification criteria for matching patients from both studies were pre-specified. As a result, 76 eligible Re-MIND patients were identified and matched one to one to 76 of the 80 L-MIND patients based on important baseline characteristics (matching). The objective response rates (ORR) were determined for both Re-MIND and L-MIND based on this subset of 76 patients.
The primary endpoint of Re-MIND was met and showed a statistically significant superior best objective response rate (ORR) of the tafasitamab/lenalidomide combination compared to lenalidomide monotherapy. The ORR was
| | | | |
| Group Interim Statement | | | | 11 |
67.1% for the tafasitamab/lenalidomide combination compared to 34.2% for lenalidomide monotherapy. Superiority was consistently observed across all secondary endpoints, including complete response (CR) rate (tafasitamab/lenalidomide combination 39.5%; versus lenalidomide monotherapy at 11.8%, as well as in pre-specified statistical sensitivity analyses). In addition, there was a significant difference observed for median overall survival (OS), which had not yet been reached in the tafasitamab/lenalidomide combination as compared to 9.3 months in lenalidomide monotherapy (hazard ratio 0.47).
Based on the data from the primary analysis of both studies and the results of the tafasitamab monotherapy study in NHL, MorphoSys submitted a BLA to the FDA for tafasitamab in combination with lenalidomide for the treatment of r/r DLBCL in late December 2019. In early March 2020, MorphoSys announced that the FDA formally accepted the application and granted a Priority Review. The FDA has set August 30, 2020 as the target date for the decision on a potential approval under the PDUFA. On August 1, 2020, MorphoSys and Incyte announced that the FDA has approved Monjuvi® (tafasitamab-cxix) in combination with lenalidomide for the treatment of adult patients with relapsed or refractory diffuse large B-cell lymphoma (DLBCL) not otherwise specified, including DLBCL arising from low grade lymphoma, and who are not eligible for autologous stem cell transplant (ASCT).
On May 20, 2020, MorphoSys and Incyte announced the validation of the European Marketing Authorization Application (MAA) for tafasitamab. The application seeks the approval of tafasitamab in combination with lenalidomide, followed by tafasitamab monotherapy, for the treatment of adult patients with r/r DLBCL, including DLBCL arising from low-grade lymphoma, who are ineligible for ASCT. The validation of the Marketing Authorization Application by the European Medicines Agency (EMA) confirms that the formal review process can begin. MorphoSys’ application for approval is based on data from the L-MIND study evaluating tafasitamab in combination with lenalidomide for the treatment of patients suffering from r/r DLBCL. The application is supported by the Re-MIND study, an observational retrospective study in r/r DLBCL. If approved, Incyte will hold the marketing authorization giving it exclusive commercialization rights for tafasitamab in Europe.
The phase 2/3 trial by the name of B-MIND (Bendamustine-MOR208 IN DLBCL), initiated in September 2016, is evaluating the safety and efficacy of the administration of tafasitamab in combination with the chemotherapeutic agent bendamustine in comparison to the administration of the cancer drug rituximab plus bendamustine in patients with r/r DLBCL who are ineligible for high-dose chemotherapy and autologous stem cell transplantation. The study has been in phase 3 since mid-2017. In 2019, in consultation with the FDA, MorphoSys expanded the study to include a biomarker-based co-primary endpoint. This biomarker is defined as a low baseline peripheral blood natural killer (NK low) cell count. In November 2019, the B-MIND study successfully passed the pre-planned, event-driven interim analysis for futility. Within the scope of this analysis, the data were reviewed by an
| | | | |
| 12 | | Group Interim Statement | | |
independent monitoring committee (IDMC) to determine the likelihood of a futile outcome of the study at the time of study completion. The IDMC evaluated efficacy data in the entire patient population, as well as in the biomarker-positive patient subpopulation, and recommended increasing the number of patients from 330 to 450. MorphoSys expects the study’s topline results to become available in 2022.
In addition to the aforementioned clinical development in r/r DLBCL, at the end of 2019, MorphoSys initiated a phase 1b clinical trial of tafasitamab as a first-line therapy in DLBCL (First-MIND). The study evaluates tafasitamab or tafasitamab plus lenalidomide in addition to R-CHOP (the current standard therapy) in patients with newly diagnosed DLBCL. The primary endpoint of the study is the incidence and severity of treatment-emergent adverse events (AEs). The secondary endpoints are the objective response rate (ORR) and complete response (CR) rate at the end of treatment, the incidence and severity of AEs in the 18-month follow-up period, the best ORR and CR by the end of the study (approximately 24 months), progression-free survival (PFS), event-free survival (ES) and overall survival (OS) at 12 and 24 months. This study is expected to pave the way for a pivotal phase 3 trial of tafasitamab as a first-line therapy in DLBCL.
In addition to these combination studies in DLBCL, MorphoSys has been evaluating tafasitamab in a phase 2 combination study in chronic lymphocytic leukemia (CLL) or small cell B cell lymphoma (SLL) since December 2016. The study named COSMOS (CLL patients assessed for ORR & Safety in MOR208 Study) is investigating the safety of tafasitamab in combination with the cancer drugs idelalisib (cohort A) or venetoclax (cohort B). The study will include patients for whom previous therapy with a Bruton tyrosine kinase inhibitor was either not tolerated or no longer effective. Data from the primary analysis of both cohorts were presented at the ASH conference in Orlando in December 2019. Cohort A included eleven patients receiving tafasitamab plus idelalisib. Patients were in the study for a median of 7.4 months. The overall response rate was 91%, and one patient achieved complete remission. Eight patients were tested for minimal residual disease (MRD), two of these eight patients achieved MRD negativity in blood, and one of three patients also achieved MRD negativity in bone marrow. A total of 13 patients were enrolled in cohort B and treated with tafasitamab plus venetoclax. The median time in the study was 15.6 months. In the intent-to-treat population, the best overall response was 76.9%; 46.2% of patients achieved complete remission. Seven patients were tested for the presence of minimal residual disease. Six of these seven patients achieved MRD negativity in blood, and two of four patients achieved MRD negativity in bone marrow. The COSMOS study showed that combinations of tafasitamab with idelalisib or venetoclax were generally well-tolerated.
R/r DLBCL and r/r CLL are life threatening diseases. Therefore, we currently continue the inclusion and treatment of patients in all ongoing studies with tafasitamab despite the COVID-19 pandemic.
| | | | |
| Group Interim Statement | | | | 13 |
MorphoSys continues to work diligently on establishing its commercial presence in the U.S. in anticipation of tafasitamab’s approval by the FDA and in preparation for the successful market launch of tafasitamab with partner Incyte. A key position has been created with the appointment of Dr. Roland Wandeler to the Management Board. As today’s Chief Operating Officer, Mr. Wandeler is responsible for the global commercial operations and oversees the Company’s U.S. operations. The necessary commercial infrastructure has also been set up, and recruitment for important positions at the Company’s U.S. headquarters in Boston (Massachusetts) has been completed.
Felzartamab (MOR202) is directed against CD38, an antigen expressed on the surface of plasma cells.
In November 2017, MorphoSys and I-Mab signed a regional license agreement for felzartamab (MOR202) granting I-Mab Biopharma exclusive development and commercialization rights in China, Hong Kong, Taiwan and Macao.
On April 27, 2020, MorphoSys and I-Mab announced the dosing of the first patient in a phase 3 clinical study in mainland China to evaluate felzartamab (MOR202/TJ202) in combination with lenalidomide plus dexamethasone in patients with r/r MM. This clinical trial (NCT03952091) is a randomized, open-label, controlled, multi-center study to evaluate the efficacy and safety of the combination of felzartamab (MOR202/TJ202), lenalidomide and dexamethasone versus the combination of lenalidomide and dexamethasone in patients with r/r MM who received at least one prior line of treatment. This multi-center study had already started at locations in Taiwan in April 2019 and has now officially started in mainland China as part of a coordinated effort to accelerate the study. In addition, I-Mab is investigating felzartamab (MOR202/TJ202) in a phase 2 trial which started in March 2019 as a third-line treatment for r/r MM. Both studies are considered relevant for approval in the region.
In October 2019, MorphoSys initiated a phase 1/2 trial in anti-PLA2R-positive membranous nephropathy, an autoimmune disease affecting the kidneys. The proof-of-concept study, called M-PLACE, is an open-label, multi-center study and primarily evaluates the safety and tolerability of felzartamab (MOR202). Secondary endpoints are the effect of felzartamab (MOR202) on serum antibodies against PLA2R and the evaluation of the immunogenicity and pharmacokinetics of felzartamab (MOR202). An exploratory goal is to determine clinical efficacy.
In response to the COVID-19 pandemic, several hospitals conducting clinical trials have restricted visits to their premises and patients to protect both staff and patients from possible COVID-19 exposure. In order to ensure patient and physician safety and correct data collection, MorphoSys temporarily paused the patient screening and enrollment for the M-PLACE study of felzartamab (MOR202). Now, MorphoSys has resumed patient recruitment. The first patient was dosed in the U.S. end of July 2020.
| | | | |
| 14 | | Group Interim Statement | | |
MOR106, a human monoclonal antibody against IL-17, became part of an exclusive development and commercialization agreement with Novartis in July 2018. In October 2019, the three parties to this agreement – Galapagos, MorphoSys and Novartis – announced that the clinical development of MOR106 in atopic dermatitis (AtD) was terminated for all studies based on the results of interim analysis for futility. Novartis terminated the development and commercialization agreement within the notice period. All ongoing activities related to the terminated studies will be completed jointly by the three parties.
Otilimab (MOR103/GSK3196165), a fully human antibody directed against GM-CSF, was fully out-licensed to GSK in 2013. In mid-2019, GSK announced the start of a phase 3 program in rheumatoid arthritis (RA) called ContRAst. It comprises three pivotal studies and a long-term extension study and evaluates the antibody in patients with moderate to severe RA. GSK has also started a clinical trial (OSCAR) to evaluate the efficacy and safety of otilimab in patients with severe pulmonary COVID-19-associated disease. According to information on www.clinicaltrials.gov, up to 800 patients are expected to be enrolled in the study and data are expected in 1H 2021.
Other programs: In addition to the programs listed above, MorphoSys is pursuing several proprietary programs in earlier phases of research and development.
On June 30, 2020, the number of therapeutic programs in the Proprietary Development segment totaled 11, four of which were out-licensed (December 31, 2019: 12 programs, four of which were out-licensed). Three of these programs are in clinical development, one is in preclinical development, and six are in the discovery stage. The clinical development of MOR106 is currently stopped.
PARTNERED DISCOVERY
The Partnered Discovery segment comprises the activities and programs in which MorphoSys is contracted by its partners to use its proprietary technology to discover new antibodies. Partners are then responsible for the products’ clinical development and subsequent commercialization with MorphoSys participating in the later development and commercialization success according to predefined milestone payments and royalties.
In June 2020, the 15th antibody from the long-term collaboration (active from 2004 to 2017) between MorphoSys and Novartis entered clinical development. The antibody is being tested by Novartis in a phase 1 clinical trial. The start of clinical development triggered a milestone payment to MorphoSys.
During the first six months of 2020, the number of therapeutic programs in the Partnered Discovery segment remained stable at 104 (December 31, 2019: 104). As of June 30, 2020, 24 of these programs were in clinical development, 23 were in preclinical development, and 56 were in the discovery stage. Our Tremfya® Partnered Discovery program is already available on the market.
| | | | |
| Group Interim Statement | | | | 15 |
CORPORATE DEVELOPMENTS
On April 6, 2020, MorphoSys provided an update on its operations and the measures it is taking to mitigate the impact of the rapidly evolving COVID-19 global pandemic on its employees, patients and the wider community.
MorphoSys is currently operating in accordance with its business continuity plan to minimize disruptions to operations and to implement the measures necessary to protect employees. MorphoSys is currently conducting a number of clinical trials of investigational drugs and closely monitoring each program individually in addition to the overall situation. MorphoSys is making adjustments, where necessary, to comply with regulatory, institutional and governmental requirements and guidelines related to COVID-19. The highest priority is to ensure the safety of all clinical program participants and the proper execution of the trials in which they are participating in accordance with the study protocols. In response to the COVID-19 pandemic, several clinics conducting clinical trials have restricted visits to their premises and patients to protect both staff and patients from possible COVID-19 exposure. As a result, MorphoSys monitored the situation and decided on the necessary procedures to ensure patient safety and correct data collection on a case-by-case basis, depending on the study and country. Despite the rapidly changing conditions worldwide and the potential impact on clinical trials, MorphoSys continues to work diligently to maintain its drug development plans.
Roland Wandeler, Ph.D., was appointed to the MorphoSys AG’s Management Board effective May 5, 2020. In his today’s position as Chief Operating Officer, Mr. Wandeler leads the global commercial operations and oversees the Company’s U.S. operations.
On May 27, 2020, the Annual General Meeting of MorphoSys AG re-elected Wendy Johnson, Dr. George Golumbeski and Michael Brosnan to the Company’s Supervisory Board. The shareholders also approved all items on the agenda, which were put to vote by the management. Due to the restrictions imposed by the COVID-19 pandemic, the 2020 Annual General Meeting was held as a virtual annual general meeting without the physical presence of shareholders or their proxies and was visually and was broadcast live to the Company’s registered shareholders via the Internet.
Intellectual Property
In the first six months of 2020, MorphoSys continued to consolidate and expand the patents protecting its development programs and growing technology portfolio, which represent the Company’s key value drivers.
Currently, the Company possesses more than 60 different proprietary patent families worldwide in addition to the numerous patent families it pursues in cooperation with its partners.
| | | | |
| 16 | | Group Interim Statement | | |
Human Resources
On June 30, 2020, the MorphoSys Group had 572 employees (December 31, 2019: 426). During the first six months of 2020, the number of employees at the MorphoSys Group averaged 518 (H1 2019: 353).
Financial Analysis
Due to the business model, the Covid-19 pandemic has had little impact on MorphoSys’ net assets, financial position and results of operations in the first six months of 2020. There were no significant asset impairments related to Covid-19.
Revenues
Group revenues in the first half of 2020 increased to € 269.7 million (H1 2019: € 48.2 million). This rise resulted primarily from the collaboration and license agreement with Incyte for the out-licensing of tafasitamab outside the United States.
Success-based payments, including royalties, comprised 9%, or € 23.1 million (H1 2019: 90% and € 43.4 million), of total revenues. From a geographical standpoint, MorphoSys generated 99%, or € 266.0 million, of its commercial revenues with biotechnology and pharmaceutical companies and non-profit organizations headquartered in North America and 1%, or € 3.7 million, with partners primarily located in Europe and Asia. In the comparable period of the previous year, these figures were 28% and 72%, respectively. 99% of the Group’s revenues were generated with partners Incyte, Janssen and I-Mab (H1 2019: 90% with GlaxoSmithKline, Janssen and I-Mab).
PROPRIETARY DEVELOPMENT SEGMENT
In the first half of 2020, the Proprietary Development segment generated revenue of € 245.4 million (H1 2019: € 31.7 million). These revenues do not contain milestone payments (H1 2019: € 29.1 million) but service fees of € 9.4 million (H1 2019: € 2.6 million).
PARTNERED DISCOVERY SEGMENT
The revenue from the Partnered Discovery segment included € 1.2 million in service and licensing fees (H1 2019: € 2.2 million) and € 23.1 million in milestone payments and royalties (H1 2019: € 14.3 million).
| | | | |
| Group Interim Statement | | | | 17 |
Operating Expenses
COST OF SALES
Cost of sales in the first six months of 2020 amounted to € -4.0 million (H1 2019: € 9.9 million) and included expenses related to services provided in the transfer of projects to customers. Furthermore, the impairments to a net realizable value of zero recognized on the antibody material resulting from fermentation runs (tafasitamab) have been reversed due to the market approval of tafasitamab. This can now be used for commercialization purposes and therefore qualifies as inventory. This resulted in income in the amount of € 11.0 million, of which € 9.9 million have to be attributed to fiscal year 2019. This reversal of impairment was included in cost of sales and overcompensated expenses incurred in the first six months of fiscal year 2020. Therefore, the cost of sales line item in total presented an income.
RESEARCH AND DEVELOPMENT EXPENSES
In the first six months of 2020, research and development expenses amounted to € 52.4 million (H1 2019: € 49.3 million). Expenses in this area were largely driven by expenses for intangible assets of € 16.2 million (H1 2019: € 2.0 million), personnel expenses in the amount of € 14.4 million (H1 2019: € 13.8 million) as well as expenses for external laboratory services in the amount of € 13.1 million (H1 2019: € 25.0 million). Expenses for intangible assets were mainly influenced by impairment charges of € 13.7 million related to an impairment of the in-process-R&D program MOR107 as well as a license. Furthermore, the reversal of impairments of inventories on the pre-manufactured antibody material (tafasitamab), which is designated to further clinical trials, had a relieving effect of € 4.1 million. The reversal of impairments for previously devalued stock amounted to a total of € 3.3 million.
SELLING EXPENSES
Selling expenses in the first six months of 2020 amounted to € 42.1 million (H1 2019: € 4.9 million). This line item included mainly personnel expenses in the amount of € 20.6 million (H1 2019: € 2.3 million) and expenses for external services of € 19.8 million (H1 2019: € 2.1 million). It also comprised expenses for services rendered by Incyte in connection with the joint US activities.
GENERAL AND ADMINISTRATIVE EXPENSES
In comparison to the same period of the previous year, general and administrative expenses increased to € 23.9 million (H1 2019: € 13.4 million). This line item comprised mainly personnel expenses amounting to € 14.4 million (H1 2019: € 9.7 million) and expenses for external services of € 6.4 million (H1 2019: € 2.0 million).
| | | | |
| 18 | | Group Interim Statement | | |
Other Income / Finance Income / Finance Expenses
Other income amounted to € 10.0 million in the first six months of 2020 (H1 2019: € 0.3 million) and resulted primarily from currency gains from operating activities of € 9.7 million (H1 2019: € 0.1 million).
Finance income amounted to € 28.1 million (H1 2019: € 1.1 million) and resulted from effects from the financial assets and financial liabilities from collaborations of € 22.3 million (H1 2019: € 0), comprising currency translation effects, effects in changes in fair value and deviations in planning assumptions, as well as from investments of liquid funds and their foreign currency gains of € 5.8 million (H1 2019: € 0.6 million).
Finance expense increased to € 34.4 million (H1 2019; € 0.7 million) mainly driven by the effects from the financial assets and financial liabilities from collaborations of € 17.6 million (H1 2019: € 0), comprising effects from deviations in planning assumptions, application of the effective interest rate method and effects relating to foreign currency translation, from investments of liquid funds and their foreign currency losses of € 9.0 million (H1 2019: € 0.2 million) and from financial derivatives of € 7.0 million (H1 2019: gain of € 0.4 million).
Income Taxes
The Group recognized a total tax benefit of € 23.3 million in the first six months of 2020, which was primarily impacted by the tax assessment of the collaboration and license agreement with Incyte. This included current tax expenses of € 108.8 million and deferred tax expense from temporary differences of € 13.0 million, which were more than offset by deferred tax benefit from temporary differences of € 145.1 million.
Financial Position
LIQUIDITY
On June 30, 2020, the Group’s liquidity amounted to € 1,061.8 million, compared to € 357.4 million on December 31, 2019.
Liquidity is presented in the balance sheet items “cash and cash equivalents”, “financial assets at fair value through profit or loss” and current and non-current “other financial assets at amortized cost”.
The increase in liquidity resulted primarily from payments received upon signing the collaboration and license agreement with Incyte for the further development and commercialization of tafasitamab. This increase was offset by the use of cash for operating activities in the first six months of 2020.
| | | | |
| Group Interim Statement | | | | 19 |
Balance Sheet
ASSETS
At € 1,424.1 million, total assets as of June 30, 2020 were € 927.7 million higher than their level on December 31, 2019 (€ 496.4 million). The rise in current assets primarily resulted from the increase of € 373.5 million in “Financial Assets at Fair Value through Profit or Loss” and € 179.7 million increase in “Other Financial Assets at Amortized Cost”, which stemmed mainly from the investment of funds received under the collaboration and license agreement with Incyte. In addition, the balance sheet item “Financial Assets from Collaborations”, which amounted to € 45.3 million as of June 30, 2020, was recognized for the first time in 2020 due to the collaboration and license agreement with Incyte. Furthermore, inventories increased by € 15.0 million, as the impairments to the net realizable value of zero of inventories had to be reversed due to the market approval of tafasitamab.
Non-current assets increased by € 303.4 million in comparison to December 31, 2019, to a total of € 496.2 million. This increase was primarily due to the increase in “Other Financial Assets at Amortized Cost, Net of Current Portion” by € 162.1 million resulting from the long-term investment of funds received from Incyte. Additionally, “Deferred Tax Assets” of € 145.1 million were recognized mainly due to the contract with Incyte. This increase was partly offset by a decline in „Shares at Fair Value through Other Comprehensive Income” in the amount of € 4.7 million.
LIABILITIES
Current liabilities increased from € 61.6 million as of December 31, 2019 to € 171.6 million as of June 30, 2020. This increase was primarily the result of an increase in the item “Tax Liabilities” of € 108.7 million and an increase in “Current Portion of Contract Liability” by 3.4 million. This increase was partly offset by a decline in „ Accounts Payable and Accruals” in the amount of € 2.9 million.
Non-current liabilities increased by € 555.8 million compared to their level on the December 31, 2019 reporting date. This increase was largely a result of the first-time recognition of the item “financial liabilities from collaborations” in 2020 resulting from the collaboration and licensing agreement with Incyte amounting to € 538.2 million as of June 30, 2020 and deferred tax liabilities of € 13.0 million resulting from this agreement.
STOCKHOLDERS´ EQUITY
On June 30, 2020, the Company’s common stock, including treasury shares totaled € 32,890,046 (December 31, 2019: € 31,957,958). Common stock was higher primarily as a result of the purchase of 3,692,754 American Depositary Shares (“ADS”), which is equivalent to 907,441 shares, by Incyte. These shares were issued through a capital increase from Authorized Capital 2017-I. Common stock also increased by € 24,647 due to the exercise of 24,647 convertible bonds granted to the Management Board and to former employees. The weighted-average exercise price of the convertible bonds was € 31.88.
| | | | |
| 20 | | Group Interim Statement | | |
The value of treasury shares declined from € 8,357,250 on December 31, 2019 to € 6,383,882 on June 30, 2020. The reason for this decline was the transfer of 52,322 treasury shares in the amount of € 1,933,821 from the performance-based 2016 Long-Term Incentive Plan (LTI Plan) to the Management Board and the Senior Management Group. The vesting period for this LTI program expired on April 1, 2020 and provided beneficiaries with a six-month option until October 20, 2020 to receive a total of 91,037 shares. In addition, 1,070 treasury shares valued at € 39,547 were transferred to selected employees of MorphoSys US Inc. from the Long-Term Incentive Plan (LTI Plan) 2019. As a result, as of June 30, 2020, the Company held 172,408 MorphoSys shares (December 31, 2019: 225,800 shares).
On June 30, 2020, additional paid-in capital amounted to € 710,306,493 (December 31, 2019: € 628,176,568). The increase of € 82,129,925 resulted mainly from the capital increase with Incyte in the amount of € 79,590,657 net of transaction costs of € 100,370, the allocation of personnel expenses from share-based payments in the amount of € 3,751,660 and the exercise of convertible bonds in the amount of € 760,976. Part of the increase was offset by a decline that resulted from the reclassification of treasury shares related to share allocations from the 2016 Long-Term Incentive Plan in the amount of €1,933,821 as well as from the allocation of treasury shares from the 2019 LTI Plan of MorphoSys US Inc. to selected employees of MorphoSys US Inc. in the amount of € 39,547.
Risk and Opportunity Report
The risks and opportunities and their assessment remain unchanged from the situation described on pages 81-88 in the 2019 Annual Report.
Outlook
FINANCIAL GUIDANCE
MorphoSys’ current financial guidance for the 2020 financial year was published on March 18, 2020 and remains unchanged. The Group expects to achieve revenues in the range of € 280 million to € 290 million in the 2020 financial year. R&D expenses are expected to be between € 130 million and € 140 million. The Group expects EBIT to be in the range of approximately € -15 million to € 5 million. This guidance is based on constant currency exchange rates and does not include any contributions from tafasitamab revenues. This guidance does not include any effects of potential in-licensing or co-development deals for the development of new candidates.
The guidance might potentially be impacted by the ongoing global COVID-19 crisis on MorphoSys’ business operations including but not limited to the Company’s supply chain, clinical trial conduct, as well as timelines for regulatory and commercial execution. While MorphoSys is maintaining its previously communicated guidance on its clinical trials, these could potentially be affected in terms of patient enrollment and data collection timelines, among other factors.
| | | | |
| Group Interim Statement | | | | 21 |
The statements in the 2019 Annual Report on pages 77-80 concerning the strategic outlook, the expected business and human resources developments, future research and development and the dividend policy continue to apply.
| | | | |
| 22 | | Group Interim Statement | | |
Consolidated Statement of Profit or Loss (IFRS) – (unaudited)
| | | | | | | | | | | | | | | | | | | | | | | | | | | | | | |
| in € | | | | Note | | | | | Q2 2020 | | | | | Q2 2019 | | | | | H1 2020 | | | | | H1 2019 | |
| | | | | | | | | | | | | | | | | | | | | | | | | | | | | | | |
| | | | | | | | | | | |
Revenues | | | | | 2, 3 | | | | | | 18,434,036 | | | | | | 34,656,185 | | | | | | 269,656,727 | | | | | | 48,204,456 | |
Operating Expenses | | | | | | | | | | | | | | | | | | | | | | | | | | | | | | |
Cost of Sales | | | | | 16 | | | | | | 7,227,804 | | | | | | (4,921,410 | ) | | | | | 3,968,326 | | | | | | (9,891,210 | ) |
Research and Development | | | | | | | | | | | (30,932,839 | ) | | | | | (24,652,089 | ) | | | | | (52,428,972 | ) | | | | | (49,344,574 | ) |
Selling | | | | | | | | | | | (29,278,842 | ) | | | | | (3,225,981 | ) | | | | | (42,106,431 | ) | | | | | (4,900,824 | ) |
General and Administrative | | | | | | | | | | | (13,816,895 | ) | | | | | (7,458,856 | ) | | | | | (23,940,517 | ) | | | | | (13,377,392 | ) |
Total Operating Expenses | | | | | 2 | | | | | | (66,800,772 | ) | | | | | (40,258,336 | ) | | | | | (114,507,594 | ) | | | | | (77,514,000 | ) |
Other Income | | | | | | | | | | | (360,300 | ) | | | | | 165,897 | | | | | | 9,969,474 | | | | | | 320,310 | |
Other Expenses | | | | | | | | | | | (1,344,435 | ) | | | | | (295,790 | ) | | | | | (1,629,971 | ) | | | | | (330,527 | ) |
Earnings before Interest and Taxes (EBIT) | | | | | | | | | | | (50,071,471 | ) | | | | | (5,732,044 | ) | | | | | 163,488,636 | | | | | | (29,319,761 | ) |
Finance Income | | | | | | | | | | | 17,470,786 | | | | | | 113,260 | | | | | | 28,071,456 | | | | | | 1,055,110 | |
Finance Expenses | | | | | | | | | | | (25,076,101 | ) | | | | | (440,492 | ) | | | | | (34,363,514 | ) | | | | | (690,113 | ) |
Income from Reversals of Impairment Losses / (Impairment Losses) on Financial Assets | | | | | | | | | | | (311,000 | ) | | | | | 291,000 | | | | | | (772,000 | ) | | | | | 859,000 | |
Income Tax Benefit / (Expenses) 1 | | | | | 4 | | | | | | 4,899,051 | | | | | | (91,028 | ) | | | | | 23,336,280 | | | | | | (433,031 | ) |
Consolidated Net Profit / (Loss) | | | | | | | | | | | (53,088,735 | ) | | | | | (5,859,304 | ) | | | | | 179,760,858 | | | | | | (28,528,795 | ) |
Earnings per Share, basic and diluted | | | | | | | | | | | (1.62 | ) | | | | | (0.19 | ) | | | | | - | | | | | | (0.90 | ) |
Earnings per Share, basic | | | | | | | | | | | - | | | | | | - | | | | | | 5.56 | | | | | | - | |
Earnings per Share, diluted | | | | | | | | | | | - | | | | | | - | | | | | | 5.54 | | | | | | - | |
Shares Used in Computing Earnings per Share, basic and diluted | | | | | | | | | | | 32,696,980 | | | | | | 31,576,812 | | | | | | - | | | | | | 31,567,074 | |
Shares Used in Computing Earnings per Share, basic | | | | | | | | | | | - | | | | | | - | | | | | | 32,309,894 | | | | | | - | |
Shares Used in Computing Earnings per Share, diluted | | | | | | | | | | | - | | | | | | - | | | | | | 32,437,297 | | | | | | - | |
1 Of the € 23.3 million for the first six months of 2020, € 18.4 million are attributable to the first quarter of 2020.
| | | | |
| Group Interim Statement | | | | 23 |
Consolidated Statement of Comprehensive Income (IFRS) – (unaudited)
| | | | | | | | | | | | | | | | | | | | | | | | |
| in € | | | | Q2 2020 | | | | | Q2 2019 | | | | | H1 2020 | | | | | H1 2019 | |
| | | | | | | | | | | | | | | | | | | | | | | | | |
| | | | | | | | | |
Consolidated Net Profit / (Loss) | | | | | (53,088,735 | ) | | | | | (5,859,304 | ) | | | | | 179,760,858 | | | | | | (28,528,795 | ) |
Items that will not be reclassified to Profit or Loss | | | | | | | | | | | | | | | | | | | | | | | | |
Change in Fair Value of Shares through Other Comprehensive Income | | | | | (303,371 | ) | | | | | 106,000 | | | | | | (3,565,402 | ) | | | | | 106,000 | |
Items that may be reclassified to Profit or Loss | | | | | | | | | | | | | | | | | | | | | | | | |
Foreign Currency Translation Differences from Consolidation | | | | | 1,329,973 | | | | | | 45,835 | | | | | | 580,257 | | | | | | 31,574 | |
Other Comprehensive Income | | | | | 1,026,602 | | | | | | 151,835 | | | | | | (2,985,145 | ) | | | | | 137,574 | |
Total Comprehensive Income | | | | | (52,062,133 | ) | | | | | (5,707,469 | ) | | | | | 176,775,713 | | | | | | (28,391,221 | ) |
| | | | |
| 24 | | Group Interim Statement | | |
Consolidated Balance Sheet (IFRS)
| | | | | | | | | | | | | | | | | | |
| in € | | | | Note | | | | | 06/30/2020 | | | | | 12/31/2019 | |
| | | | | | | | | | | | | | | | | | |
| | | | | | | |
ASSETS | | | | | | | | | | | | | | | | | | |
Current Assets | | | | | | | | | | | | | | | | | | |
Cash and Cash Equivalents | | | | | 6 | | | | | | 33,404,351 | | | | | | 44,314,050 | |
Financial Assets at Fair Value through Profit or Loss | | | | | 6 | | | | | | 393,938,454 | | | | | | 20,454,949 | |
Other Financial Assets at Amortized Cost | | | | | 6 | | | | | | 387,451,191 | | | | | | 207,735,195 | |
Accounts Receivable and Contract Assets | | | | | 6 | | | | | | 33,103,019 | | | | | | 15,081,702 | |
Financial Assets from Collaborations | | | | | 3,6 | | | | | | 45,332,222 | | | | | | 0 | |
Income Tax Receivables | | | | | | | | | | | 166,071 | | | | | | 145,817 | |
Other Receivables | | | | | | | | | | | 3,389,076 | | | | | | 1,613,254 | |
Inventories, Net | | | | | 16 | | | | | | 15,330,267 | | | | | | 288,212 | |
Prepaid Expenses and Other Current Assets | | | | | | | | | | | 15,812,721 | | | | | | 14,059,627 | |
Total Current Assets | | | | | | | | | | | 927,927,372 | | | | | | 303,692,806 | |
Non-current Assets | | | | | | | | | | | | | | | | | | |
Property, Plant and Equipment, Net | | | | | | | | | | | 4,914,561 | | | | | | 4,652,838 | |
Right-of-Use Assets, Net | | | | | | | | | | | 46,654,982 | | | | | | 43,160,253 | |
Patents, Net | | | | | | | | | | | 2,489,305 | | | | | | 2,981,282 | |
Licenses, Net | | | | | | | | | | | 325,003 | | | | | | 2,350,002 | |
In-process R&D Programs | | | | | | | | | | | 35,348,576 | | | | | | 35,683,709 | |
Software, Net | | | | | | | | | | | 92,690 | | | | | | 107,137 | |
Goodwill | | | | | | | | | | | 3,676,233 | | | | | | 3,676,233 | |
Other Financial Assets at Amortized Cost, Net of Current Portion | | | | | 6 | | | | | | 247,052,089 | | | | | | 84,922,176 | |
Shares at Fair Value through Other Comprehensive Income | | | | | 6 | | | | | | 9,408,000 | | | | | | 14,076,836 | |
Deferred Tax Asset | | | | | 4 | | | | | | 145,109,528 | | | | | | 0 | |
Prepaid Expenses and Other Assets, Net of Current Portion | | | | | 6 | | | | | | 1,107,129 | | | | | | 1,136,030 | |
Total Non-current Assets | | | | | | | | | | | 496,178,096 | | | | | | 192,746,496 | |
Total Assets | | | | | | | | | | | 1,424,105,468 | | | | | | 496,439,302 | |
| | | | |
| Group Interim Statement | | | | 25 |
| | | | | | | | | | | | | | | | | | |
| in € | | | | Note | | | | | 06/30/2020 | | | | | 12/31/2019 | |
| | | | | | | | | | | | | | | | | | |
| | | | | | | |
LIABILITIES AND STOCKHOLDERS’ EQUITY | | | | | | | | | | | | | | | | | | |
Current Liabilities | | | | | | | | | | | | | | | | | | |
Accounts Payable and Accruals | | | | | 6 | | | | | | 54,138,646 | | | | | | 57,041,902 | |
Current Portion of Lease Liabilities | | | | | 6 | | | | | | 3,119,799 | | | | | | 2,515,097 | |
Tax Liabilities | | | | | 4 | | | | | | 108,819,595 | | | | | | 94,732 | |
Other Provisions | | | | | | | | | | | 546,730 | | | | | | 323,000 | |
Current Portion of Contract Liability | | | | | | | | | | | 4,994,506 | | | | | | 1,570,801 | |
Convertible Bonds due to Related Parties | | | | | | | | | | | 0 | | | | | | 12,324 | |
Total Current Liabilities | | | | | | | | | | | 171,619,276 | | | | | | 61,557,856 | |
Non-current Liabilities | | | | | | | | | | | | | | | | | | |
Lease Liabilities, Net of Current Portion | | | | | 6 | | | | | | 43,991,310 | | | | | | 40,041,581 | |
Other Provisions, Net of Current Portion | | | | | | | | | | | 665,559 | | | | | | 23,166 | |
Contract Liability, Net of Current Portion | | | | | | | | | | | 93,378 | | | | | | 114,927 | |
Deferred Tax Liability | | | | | 4 | | | | | | 13,023,509 | | | | | | 0 | |
Financial Liabilities from Collaborations | | | | | 3, 6 | | | | | | 538,199,570 | | | | | | 0 | |
Total Non-current Liabilities | | | | | | | | | | | 595,973,326 | | | | | | 40,179,674 | |
Total Liabilities | | | | | | | | | | | 767,592,602 | | | | | | 101,737,530 | |
| | | | | | | | | | | | | | | | | | | |
Stockholders’ Equity | | | | | | | | | | | | | | | | | | |
Common Stock | | | | | 7 | | | | | | 32,890,046 | | | | | | 31,957,958 | |
Ordinary Shares Issued (32,890,046 and 31,957,958 for 2020 and 2019, respectively) | | | | | | | | | | | | | | | | | | |
Ordinary Shares Outstanding (32,717,638 and 31,732,158 for 2020 and 2019, respectively) | | | | | | | | | | | | | | | | | | |
Treasury Stock (172,408 and 225,800 shares for 2020 and 2019, respectively), at Cost | | | | | 7 | | | | | | (6,383,882 | ) | | | | | (8,357,250 | ) |
Additional Paid-in Capital | | | | | 7 | | | | | | 710,306,493 | | | | | | 628,176,568 | |
Other Comprehensive Income Reserve | | | | | 7 | | | | | | (4,280,863 | ) | | | | | (1,295,718 | ) |
Accumulated Deficit | | | | | | | | | | | (76,018,928 | ) | | | | | (255,779,786 | ) |
Total Stockholders’ Equity | | | | | | | | | | | 656,512,866 | | | | | | 394,701,772 | |
TOTAL LIABILITIES AND STOCKHOLDERS’ EQUITY | | | | | | | | | | | 1,424,105,468 | | | | | | 496,439,302 | |
| | | | |
| 26 | | Group Interim Statement | | |
Consolidated Statement of Changes in Stockholders’ Equity (IFRS) – (unaudited)
| | | | | | | | | | | | | | | | | | | | | | | | |
| | | | | | | | | | Common Stock | | | | | | |
| | | | | Note | | | | | Shares | | | | | € | | | | | | |
| | | | | | | | | | | | | | | | | | | | | | | | | |
| | | | | | | | |
Balance as of January 1, 2019 | | | | | | | | | | | 31,839,572 | | | | | | 31,839,572 | | | | | | | |
Compensation Related to the Grant of Stock Options and Performance Shares | | | | | | | | | | | 0 | | | | | | 0 | | | | | | | |
Transfer of Treasury Stock for Long-Term Incentive Programs | | | | | | | | | | | 0 | | | | | | 0 | | | | | | | |
Transfer of Treasury Stock to Related Parties | | | | | | | | | | | 0 | | | | | | 0 | | | | | | | |
Reserves: | | | | | | | | | | | | | | | | | | | | | | | | |
Change in Fair Value of Shares through Other Comprehensive Income | | | | | | | | | | | 0 | | | | | | 0 | | | | | | | |
Foreign Currency Translation Differences from Consolidation | | | | | | | | | | | 0 | | | | | | 0 | | | | | | | |
Consolidated Net Loss | | | | | | | | | | | 0 | | | | | | 0 | | | | | | | |
Total Comprehensive Income | | | | | | | | | | | 0 | | | | | | 0 | | | | | | | |
Balance as of June 30, 2019 | | | | | | | | | | | 31,839,572 | | | | | | 31,839,572 | | | | | | | |
Balance as of January 1, 2020 | | | | | | | | | | | 31,957,958 | | | | | | 31,957,958 | | | | | | | |
Capital Increase, Net of Issuance Cost of € 100,370 | | | | | 7 | | | | | | 907,441 | | | | | | 907,441 | | | | | | | |
Compensation Related to the Grant of Stock Options and Performance Shares | | | | | 7, 11 | | | | | | 0 | | | | | | 0 | | | | | | | |
Exercise of Convertible Bonds Issued | | | | | 7, 8 | | | | | | 24,647 | | | | | | 24,647 | | | | | | | |
Transfer of Treasury Stock for Long-Term Incentive Programs | | | | | 7, 8 | | | | | | 0 | | | | | | 0 | | | | | | | |
Reserves: | | | | | | | | | | | | | | | | | | | | | | | | |
Change in Fair Value of Shares through Other Comprehensive Income | | | | | | | | | | | 0 | | | | | | 0 | | | | | | | |
Foreign Currency Translation Differences from Consolidation | | | | | | | | | | | 0 | | | | | | 0 | | | | | | | |
Consolidated Net Profit | | | | | | | | | | | 0 | | | | | | 0 | | | | | | | |
Total Comprehensive Income | | | | | | | | | | | 0 | | | | | | 0 | | | | | | | |
Balance as of June 30, 2020 | | | | | | | | | | | 32,890,046 | | | | | | 32,890,046 | | | | | | | |
| | | | |
| Group Interim Statement | | | | 27 |
| | | | | | | | | | | | | | | | | | | | | | | | | | | | | | | | | | | | |
| | | | | Treasury Stock | | | | | Additional Paid-in
Capital | | | | | Other
Comprehensive
Income Reserve | | | | | Accumulated
Deficit | | | | | Total
Stockholders’ Equity | |
| | | | | Shares | | | | | € | | | | | € | | | | | € | | | | | € | | | | | € | |
| | | | | | | | | | | | | | | | | | | | | | | | | | | | | | | | | | | | | |
| | | | | | | | | | | | |
| | | | | 281,036 | | | | | | (10,398,773 | ) | | | | | 619,908,453 | | | | | | (210,890 | ) | | | | | (152,765,728 | ) | | | | | 488,372,634 | |
| | | | | | 0 | | | | | | 0 | | | | | | 3,060,776 | | | | | | 0 | | | | | | 0 | | | | | | 3,060,776 | |
| | | | | | | | | | | | |
| | | | | | (23,738 | ) | | | | | 877,356 | | | | | | (877,356 | ) | | | | | 0 | | | | | | 0 | | | | | | 0 | |
| | | | | | (2,134 | ) | | | | | 78,873 | | | | | | (78,873 | ) | | | | | 0 | | | | | | 0 | | | | | | 0 | |
| | | | | | | | | | | | | | | | | | | | | | | | | | | | | | | | | | | | | |
| | | | | | | | | | | | |
| | | | | | 0 | | | | | | 0 | | | | | | 0 | | | | | | 106,000 | | | | | | 0 | | | | | | 106,000 | |
| | | | | | 0 | | | | | | 0 | | | | | | 0 | | | | | | 31,574 | | | | | | 0 | | | | | | 31,574 | |
| | | | | | 0 | | | | | | 0 | | | | | | 0 | | | | | | 0 | | | | | | (28,528,795 | ) | | | | | (28,528,795 | ) |
| | | | | | 0 | | | | | | 0 | | | | | | 0 | | | | | | 137,574 | | | | | | (28,528,795 | ) | | | | | (28,391,221 | ) |
| | | | | | 255,164 | | | | | | (9,442,544 | ) | | | | | 622,013,000 | | | | | | (73,316 | ) | | | | | (181,294,523 | ) | | | | | 463,042,189 | |
| | | | | | 225,800 | | | | | | (8,357,250 | ) | | | | | 628,176,568 | | | | | | (1,295,718 | ) | | | | | (255,779,786 | ) | | | | | 394,701,772 | |
| | | | | | 0 | | | | | | 0 | | | | | | 79,590,657 | | | | | | 0 | | | | | | 0 | | | | | | 80,498,098 | |
| | | | | | | | | | | | |
| | | | | | 0 | | | | | | 0 | | | | | | 3,751,660 | | | | | | 0 | | | | | | 0 | | | | | | 3,751,660 | |
| | | | | | 0 | | | | | | 0 | | | | | | 760,976 | | | | | | 0 | | | | | | 0 | | | | | | 785,623 | |
| | | | | | (53,392 | ) | | | | | 1,973,368 | | | | | | (1,973,368 | ) | | | | | 0 | | | | | | 0 | | | | | | 0 | |
| | | | | | | | | | | | | | | | | | | | | | | | | | | | | | | | | | | | | |
| | | | | | | | | | | | |
| | | | | | 0 | | | | | | 0 | | | | | | 0 | | | | | | (3,565,402 | ) | | | | | 0 | | | | | | (3,565,402 | ) |
| | | | | | 0 | | | | | | 0 | | | | | | 0 | | | | | | 580,257 | | | | | | 0 | | | | | | 580,257 | |
| | | | | | 0 | | | | | | 0 | | | | | | 0 | | | | | | 0 | | | | | | 179,760,858 | | | | | | 179,760,858 | |
| | | | | | 0 | | | | | | 0 | | | | | | 0 | | | | | | (2,985,145 | ) | | | | | 179,760,858 | | | | | | 176,775,713 | |
| | | | | | 172,408 | | | | | | (6,383,882 | ) | | | | | 710,306,493 | | | | | | (4,280,863 | ) | | | | | (76,018,928 | ) | | | | | 656,512,866 | |
| | | | |
| 28 | | Group Interim Statement | | |
Consolidated Statement of Cash Flows (IFRS) – (unaudited)
| | | | | | | | | | | | | | | | | | |
| H1 (in € ) | | | | Note | | | | | 2020 | | | | | 2019 | |
| | | | | | | | | | | | | | | | |
Operating Activities: | | | | | | | | | | | | | | | | | | |
Consolidated Net Profit / (Loss) | | | | | | | | | | | 179,760,858 | | | | | | (28,528,795 | ) |
Adjustments to Reconcile Consolidated Net Profit / (Loss) to Net Cash
Provided by / (Used in) Operating Activities: | | | | | | | | | | | | | | | | | | |
Impairments of Assets | | | | | | | | | | | 14,305,306 | | | | | | 0 | |
Depreciation and Amortization of Tangible and Intangible Assets and of Right-of-Use Assets | | | | | | | | | | | 3,696,928 | | | | | | 3,061,535 | |
Net (Gain) / Loss of Financial Assets at Fair Value through Profit or Loss | | | | | | | | | | | 1,226,920 | | | | | | (427,522 | ) |
Net (Gain) / Loss of Financial Assets at Amortized Cost | | | | | | | | | | | 2,751,558 | | | | | | 0 | |
(Income) from Reversals of Impairments / Impairments on Financial Assets | | | | | | | | | | | 772,000 | | | | | | (859,000 | ) |
Net (Gain) / Loss on Derivative Financial Instruments | | | | | | | | | | | 6,991,506 | | | | | | (440,866 | ) |
Non Cash Effective Net Change in Financial Assets / Liabilities from Collaborations | | | | | 3 | | | | | | (4,642,257 | ) | | | | | 0 | |
(Income) from Reversals of Impairments on Inventories | | | | | 16 | | | | | | (15,509,559 | ) | | | | | 0 | |
Net (Gain) / Loss on Sale of Property, Plant and Equipment | | | | | | | | | | | 0 | | | | | | 961 | |
Recognition of Contract Liability | | | | | | | | | | | (7,987,408 | ) | | | | | (2,234,458 | ) |
Share-based Payment | | | | | 11 | | | | | | 4,395,357 | | | | | | 3,060,776 | |
Income Tax (Benefit) / Expenses | | | | | 4 | | | | | | (23,336,280 | ) | | | | | 433,031 | |
Changes in Operating Assets and Liabilities: | | | | | | | | | | | | | | | | | | |
Accounts Receivable and Contract Assets | | | | | | | | | | | (18,021,317 | ) | | | | | (23,688,844 | ) |
Prepaid Expenses and Other Assets, Tax Receivables and Other Receivables | | | | | | | | | | | (3,980,369 | ) | | | | | (1,252,323 | ) |
Accounts Payable and Accruals, Lease Liabilities, Tax Provisions and Other Provisions | | | | | | | | | | | (2,124,194 | ) | | | | | 4,280,321 | |
Other Liabilities | | | | | | | | | | | 118,489 | | | | | | 230,098 | |
Contract Liability | | | | | | | | | | | 11,389,563 | | | | | | 2,112,976 | |
Income Taxes Paid | | | | | | | | | | | (45,156 | ) | | | | | (13,712 | ) |
Net Cash Provided by / (Used in) Operating Activities | | | | | | | | | | | 149,761,945 | | | | | | (44,265,822 | ) |
| | | | |
| Group Interim Statement | | | | 29 |
| | | | | | | | | | | | | | | | | | |
| H1 (in €) | | | | Note | | | | | 2020 | | | | | 2019 | |
| | | | | | | | | | | | | | | | | | | |
| | | | | | | |
Investing Activities: | | | | | | | | | | | | | | | | | | |
Cash Payments to Acquire Financial Assets at Fair Value through Profit or Loss | | | | | | | | | | | (416,449,668 | ) | | | | | (13,326,710 | ) |
Cash Receipts from Sales of Financial Assets at Fair Value through Profit or Loss | | | | | | | | | | | 41,521,507 | | | | | | 7,356,761 | |
Cash Payments to Acquire Other Financial Assets at Amortized Cost | | | | | | | | | | | (476,140,326 | ) | | | | | (41,000,000 | ) |
Cash Receipts from Sales of Other Financial Assets at Amortized Cost | | | | | | | | | | | 131,190,000 | | | | | | 103,000,000 | |
Cash Receipts from (+) / Cash Payments for (-) Derivative Financial Instruments | | | | | | | | | | | (6,595,240 | ) | | | | | 294,877 | |
Cash Payments to Acquire Property, Plant and Equipment | | | | | | | | | | | (1,504,428 | ) | | | | | (1,123,055 | ) |
Cash Payments to Acquire Intangible Assets | | | | | | | | | | | (11,544,656 | ) | | | | | (211,988 | ) |
Cash Receipts from Sales of Shares at Fair Value through Other Comprehensive Income | | | | | | | | | | | 1,103,433 | | | | | | 0 | |
Interest Received | | | | | | | | | | | 166,591 | | | | | | 50,517 | |
Net Cash Provided by / (Used in) Investing Activities | | | | | | | | | | | (738,252,787 | ) | | | | | 55,040,402 | |
| | | | | | | | | | | | | | | | | | | |
Financing Activities: | | | | | | | | | | | | | | | | | | |
Cash Proceeds from Issuing Shares | | | | | 7 | | | | | | 80,598,468 | | | | | | 0 | |
Cash Payments for Costs from Issuing Shares | | | | | 7 | | | | | | (100,370 | ) | | | | | 0 | |
Cash Proceeds in Connection with Convertible Bonds Granted to Related Parties | | | | | 7 | | | | | | 773,300 | | | | | | 0 | |
Cash Receipts from Financing from Collaborations | | | | | 3 | | | | | | 497,509,605 | | | | | | 0 | |
Cash Payments for Principal Elements of Lease Payments | | | | | | | | | | | (1,233,706 | ) | | | | | (1,140,958 | ) |
Interest Paid | | | | | | | | | | | (683,835 | ) | | | | | (459,296 | ) |
Net Cash Provided by / (Used in) Financing Activities | | | | | | | | | | | 576,863,462 | | | | | | (1,600,254 | ) |
Effect of Exchange Rate Differences on Cash | | | | | | | | | | | 717,681 | | | | | | 70,487 | |
Increase / (Decrease) in Cash and Cash Equivalents | | | | | | | | | | | (10,909,699 | ) | | | | | 9,244,813 | |
Cash and Cash Equivalents at the Beginning of the Period | | | | | | | | | | | 44,314,050 | | | | | | 45,459,836 | |
Cash and Cash Equivalents at the End of the Period | | | | | | | | | | | 33,404,351 | | | | | | 54,704,649 | |
| | | | |
| 30 | | Group Interim Statement | | |
Notes (Unaudited)
MorphoSys AG (“the Company” or “MorphoSys”) develops and applies technologies for generating therapeutic antibodies. MorphoSys possesses a broad portfolio of proprietary compounds and an extensive pipeline of compounds jointly developed with partners from the pharmaceutical and biotechnology industry. MorphoSys was founded in July 1992 as a German limited liability company and became a German stock corporation in June 1998. In March 1999, the Company completed its initial public offering on Germany’s “Neuer Markt,” the former segment of the Deutsche Börse designated for high-growth companies. On January 15, 2003, MorphoSys AG was admitted to the Prime Standard segment of the Frankfurt Stock Exchange. On April 18, 2018, the Company completed its initial public listing on the Nasdaq Global Market with the placement of American Depositary Shares (ADS). Each ADS represents 1/4 of a MorphoSys ordinary share. MorphoSys AG’s registered head office is located in Planegg (district of Munich), and the registered business address is Semmelweisstraße 7, 82152 Planegg, Germany. The Company is registered in the Commercial Register of the District Court of Munich, Section B, under HRB 121023.
These interim consolidated financial statements were prepared in accordance with the International Financial Reporting Standards (IFRS) of the International Accounting Standards Board (IASB) taking into account the recommendations of the International Financial Reporting Standards Interpretations Committee (IFRS IC) as applicable in the European Union (EU). These interim consolidated financial statements comply with IAS 34 “Interim Financial Reporting.”
The condensed interim consolidated financial statements do not contain all of the information and disclosures required for the financial year-end consolidated financial statements and, therefore, should be read in conjunction with the consolidated financial statements dated December 31, 2019.
The condensed interim consolidated financial statements were approved for publication on August 5, 2020.
The consolidated financial statements as of June 30, 2020, include MorphoSys AG, MorphoSys US Inc. (Boston, Massachusetts, USA), Lanthio Pharma B.V. (Groningen, the Netherlands) and LanthioPep B.V. (Groningen, the Netherlands), which are collectively known as the “Group.”
| |  | Accounting Policies |
Except for the principles described below, the accounting and valuation principles applied to the consolidated financial statements for the financial year ending December 31, 2019, were the same as those applied to the first six months of 2020. The consolidated financial statements as of December 31, 2019 are available on the Company’s website at www.morphosys.com/financial-reports.
| | | | |
| Group Interim Statement | | | | 31 |
Further details to newly adopted accounting policies for financial assets from collaborations and financial liabilities from collaborations can be found in Note 3.
A contract asset from milestone payments and corresponding revenues are recognized when it is highly probable that the milestone will be achieved. If it is achieved, the contract asset is reclassified to accounts receivable, as the right has become unconditional.
The effective tax rate for the six-month period as of June 30, 2020, was -14.9% (H1 2019: -1.5%). This reflected both the net income from the capitalization of deferred tax assets and liabilities in connection with the collaboration and license agreement with Incyte and the current tax expense, which affected the tax liability due to the use of tax loss carryforwards from previous years and the minimum taxation regulation.
NEW AND REVISED STANDARDS APPLIED FOR THE FIRST TIME IN THE FINANCIAL YEAR
| | | | | | | | | | | | | | | | | | | | | | |
Standard/Interpretation | | | | Mandatory
Application for
financial years
starting on | | | | | Adopted by the
European Union | | | | | Possible
Impact on
MorphoSys | |
| | | | | | | | | | | | | | | | | | | | | | | |
IFRS 3 (A) | | | | Business Combinations | | | | | 01/01/2020 | | | | | | yes | | | | | | none | |
IFRS 9, IAS 39 and IFRS 7 | | | | Interest Rate Benchmark Reform | | | | | 01/01/2020 | | | | | | yes | | | | | | none | |
IAS 1 and IAS 8 (A) | | | | Definition of Material | | | | | 01/01/2020 | | | | | | yes | | | | | | yes | |
| | | | | | | | | | | | | | | | | | | | | | | |
| | | | | Amendments to References to the Conceptual Framework in IFRS Standards | | | | | 01/01/2020 | | | | | | yes | | | | | | none | |
| | | | | | | | | | | | | | | | | | | | | | | |
(A) Amendments | | | | | | | | | | | | | | | | | | | | | | |
The impact on the consolidated financial statements from the amendments to IAS 1 and IAS 8 is not considered to be material and are therefore not explained separately.
NEW AND REVISED STANDARDS NOT YET MANDATORY
The following new and revised standards that were not yet mandatory in the reporting period or not yet adopted by the European Union were not applied in advance. Standards with the remark “yes” are likely to have an impact on the consolidated financial statements and are currently being assessed by the Group. The following discussion focuses only on those changes that have a material impact. The impact on the consolidated financial statements from the amendments to IFRS 16 and IAS 1 are not
| | | | |
| 32 | | Group Interim Statement | | |
considered to be material and are therefore not explained separately. Standards with the remark “none” are not expected to have a material impact on the consolidated financial statements.
| | | | | | | | | | | | | | | | | | | | | | |
Standard/Interpretation | | | | Mandatory
Application for
financial years
starting on | | | | | Adopted by the
European Union | | | | | Possible
Impact on
MorphoSys | |
| | | | | | | | | | | | | | | | | | | | | | | |
IFRS 3 (A) | | | | Reference to the Conceptual Framework (Amendments to IFRS 3) | | | | | 01/01/2022 | | | | | | no | | | | | | none | |
IFRS 4 (A) | | | | Extension of the Temporary Exemption from Applying IFRS 9 (Amendments to IFRS 4) | | | | | 01/01/2021 | | | | | | no | | | | | | none | |
IFRS 17 | | | | Insurance Contracts and Amendments to IFRS 17 | | | | | 01/01/2023 | | | | | | no | | | | | | none | |
IFRS 16 (A) | | | | Covid-19-Related Rent Concessions (Amendment to IFRS 16) | | | | | 01/06/2020 | | | | | | no | | | | | | yes | |
IAS 1 (A) | | | | Classification of Liabilities as Current or Non-current (Amendments to IAS 1) | | | | | 01/01/2023 | | | | | | no | | | | | | yes | |
IAS 16 (A) | | | | Property, Plant and Equipment — Proceeds before Intended Use (Amendments to IAS 16) | | | | | 01/01/2022 | | | | | | no | | | | | | none | |
IAS 37 (A) | | | | Amended by Onerous Contracts — Cost of Fulfilling a Contract (Amendments to IAS 37) | | | | | 01/01/2022 | | | | | | no | | | | | | none | |
| | | | | | | | | | | | | | | | | | | | | | | |
| | | | | Annual Improvements to International Financial Reporting Standards, 2018 - 2020 | | | | | 01/01/2022 | | | | | | no | | | | | | none | |
(A) Amendments | | | | | | | | | | | | | | | | | | | | | | |
| | | | | | | | | | | | | | | | | | | | | | |
| |  | Segment Reporting |
The Group applies IFRS 8 “Segment Reporting”. An operating segment is defined as a unit of an entity whose business activities can generate revenues and expenses, whose operating results are regularly reviewed by the entity’s chief operating decision-maker (the Management Board), and for which discrete financial information is available.
Segment information is provided based on the Group’s business segments. The business segments are aligned to the Group’s management organization and the structure of its internal reporting. The segment results and segment assets contain components that are either directly attributable to the individual segments or can be reasonably allocated to the segments.
The Management Board assesses the economic success of the segments based on key indicators that are selected to reflect the recognition of all relevant income and expenses. EBIT, which the Company defines as operating income
| | | | |
| Group Interim Statement | | | | 33 |
before finance income, finance expenses, income from reversals of impairment losses/expenses from impairment losses on financial assets and income taxes, is the central benchmark for assessing and evaluating operating income. Revenues, operating expenses, segment results and the liquidity position are also considered key performance indicators in internal reporting.
The Group consists of the operating segments described below.
PROPRIETARY DEVELOPMENT
The segment comprises all activities related to the proprietary development of therapeutic antibodies and peptides. Currently, this segment’s activities comprise a total of eleven antibodies and peptide programs, with tafasitamab representing the Company’s most advanced proprietary clinical program. Also included are the antibody felzartamab (MOR202), which was partially out-licensed to I-Mab and the Company’s otilimab program, which was out-licensed to GlaxoSmithKline (GSK) in 2013. The partially or completely out-licensed programs have been part of the Proprietary Development segment since the beginning of their development and will therefore continue to be reported in this segment. MorphoSys is also pursuing other early-stage proprietary development and co-development programs. One other program is in preclinical development, and six other programs are in drug discovery. The Proprietary Development segment also manages the development of proprietary technologies.
PARTNERED DISCOVERY
MorphoSys possesses one of the leading technologies for generating therapeutics based on human antibodies. The Group markets this technology commercially through its partnerships with numerous pharmaceutical and biotechnology companies. The Partnered Discovery segment encompasses all operating activities relating to these commercial agreements.
| | | | |
| 34 | | Group Interim Statement | | |
| | | | | | | | | | | | | | | | | | | | | | | | | | | | | | | | | | | | | | | | | | | | | | | | |
| H1 | | | | Proprietary Development | | | | | Partnered Discovery | | | | | Unallocated | | | | | Group | |
| (in 000’ €) 1 | | | | 2020 | | | | | 2019 | | | | | 2020 | | | | | 2019 | | | | | 2020 | | | | | 2019 | | | | | 2020 | | | | | 2019 | |
| | | | | | | | | | | | | | | | | | | | | | | | | | | | | | | | | | | | | | | | | |
| | | | | | | | | | | | | | | | | |
External Revenues | | | | | 245,420 | | | | | | 31,665 | | | | | | 24,237 | | | | | | 16,539 | | | | | | 0 | | | | | | 0 | | | | | | 269,657 | | | | | | 48,204 | |
Operating Expenses | | | | | (95,291 | ) | | | | | (63,698 | ) | | | | | (4,676 | ) | | | | | (4,791 | ) | | | | | (14,541 | ) | | | | | (9,025 | ) | | | | | (114,508 | ) | | | | | (77,514 | ) |
Segment Result | | | | | 150,129 | | | | | | (32,033 | ) | | | | | 19,561 | | | | | | 11,748 | | | | | | (14,541 | ) | | | | | (9,025 | ) | | | | | 155,149 | | | | | | (29,310 | ) |
Other Income | | | | | 9,391 | | | | | | 46 | | | | | | 0 | | | | | | 0 | | | | | | 578 | | | | | | 274 | | | | | | 9,969 | | | | | | 320 | |
Other Expenses | | | | | 0 | | | | | | 0 | | | | | | 0 | | | | | | 0 | | | | | | (1,630 | ) | | | | | (331 | ) | | | | | (1,630 | ) | | | | | (331 | ) |
Segment EBIT | | | | | 159,520 | | | | | | (31,987 | ) | | | | | 19,561 | | | | | | 11,748 | | | | | | (15,593 | ) | | | | | (9,082 | ) | | | | | 163,488 | | | | | | (29,321 | ) |
Finance Income | | | | | | | | | | | | | | | | | | | | | | | | | | | | | | | | | | | | | | | | | 28,071 | | | | | | 1,055 | |
Finance Expenses | | | | | | | | | | | | | | | | | | | | | | | | | | | | | | | | | | | | | | | | | (34,364 | ) | | | | | (690 | ) |
| Income from Reversals of Impairment Losses / (Impairment Losses) on Financial Assets | | | | | | | | | | | | | | | | | | | | | | | | | | | | | | | | | | | | | | | | | (772 | ) | | | | | 859 | |
Earnings before Taxes | | | | | | | | | | | | | | | | | | | | | | | | | | | | | | | | | | | | | | | | | 156,423 | | | | | | (28,097 | ) |
Income Tax Benefit / (Expenses) 2 | | | | | | | | | | | | | | | | | | | | | | | | | | | | | | | | | | | | | | | | | 23,336 | | | | | | (433 | ) |
Consolidated Net Profit / (Loss) | | | | | | | | | | | | | | | | | | | | | | | | | | | | | | | | | | | | | | | | | 179,759 | | | | | | (28,530 | ) |
| | | | | | | | | | | | | | | | | | | | | | | | | | | | | | | | | | | | | | | | | | | | | | | | |
| Q2 | | | | Proprietary Development | | | | | Partnered Discovery | | | | | Unallocated | | | | | Group | |
| (in 000’ € ) | | | | 2020 | | | | | 2019 | | | | | 2020 | | | | | 2019 | | | | | 2020 | | | | | 2019 | | | | | 2020 | | | | | 2019 | |
| | | | | | | | | | | | | | | | | | | | | | | | | | | | | | | | | | | | | | | | | |
| | | | | | | | | | | | | | | | | |
External Revenues | | | | | 5,000 | | | | | | 25,909 | | | | | | 13,434 | | | | | | 8,747 | | | | | | 0 | | | | | | 0 | | | | | | 18,434 | | | | | | 34,656 | |
Operating Expenses | | | | | (56,326 | ) | | | | | (32,933 | ) | | | | | (2,345 | ) | | | | | (2,480 | ) | | | | | (8,130 | ) | | | | | (4,845 | ) | | | | | (66,801 | ) | | | | | (40,258 | ) |
Segment Result | | | | | (51,326 | ) | | | | | (7,024 | ) | | | | | 11,089 | | | | | | 6,267 | | | | | | (8,130 | ) | | | | | (4,845 | ) | | | | | (48,367 | ) | | | | | (5,602 | ) |
Other Income | | | | | 34 | | | | | | (5 | ) | | | | | 0 | | | | | | 0 | | | | | | (395 | ) | | | | | 171 | | | | | | (360 | ) | | | | | 166 | |
Other Expenses | | | | | 0 | | | | | | 0 | | | | | | 0 | | | | | | 0 | | | | | | (1,344 | ) | | | | | (296 | ) | | | | | (1,344 | ) | | | | | (296 | ) |
Segment EBIT | | | | | (51,292 | ) | | | | | (7,029 | ) | | | | | 11,089 | | | | | | 6,267 | | | | | | (9,869 | ) | | | | | (4,970 | ) | | | | | (50,072 | ) | | | | | (5,732 | ) |
Finance Income | | | | | | | | | | | | | | | | | | | | | | | | | | | | | | | | | | | | | | | | | 17,471 | | | | | | 113 | |
Finance Expenses | | | | | | | | | | | | | | | | | | | | | | | | | | | | | | | | | | | | | | | | | (25,076 | ) | | | | | (440 | ) |
| Income from Reversals of Impairment Losses / (Impairment Losses) on Financial Assets | | | | | | | | | | | | | | | | | | | | | | | | | | | | | | | | | | | | | | | | | (311 | ) | | | | | 291 | |
Earnings before Taxes | | | | | | | | | | | | | | | | | | | | | | | | | | | | | | | | | | | | | | | | | (57,988 | ) | | | | | (5,768 | ) |
Income Tax Benefit / (Expenses) 2 | | | | | | | | | | | | | | | | | | | | | | | | | | | | | | | | | | | | | | | | | 4,900 | | | | | | (91 | ) |
Consolidated Net Loss | | | | | | | | | | | | | | | | | | | | | | | | | | | | | | | | | | | | | | | | | (53,088 | ) | | | | | (5,860 | ) |
1 Differences due to rounding.
2 Further details can be found in Note 4.
The table below provides an overview of the geographic distribution of Group revenues based on the location of our partners’ headquarters.
| | | | |
| Group Interim Statement | | | | 35 |
| | | | | | | | | | | | |
in 000’ € | | | | | 2020 | | | | | | 2019 | |
| | | | | | | | | | | | | |
| Germany | | | | | 0 | | | | | | 145 | |
| Europe and Asia | | | | | 3,675 | | | | | | 34,378 | |
| USA and Canada | | | | | 265,982 | | | | | | 13,681 | |
| Total | | | | | 269,657 | | | | | | 48,204 | |
Group revenue included milestone payments in the amount of € 2.9 million (H1 2019: € 29.7 million) as well as royalties totaling € 20.1 million (H1 2019: € 13.7 million). Group revenues in the amount € 243.6 million were generated from one customer in the proprietary development segment (H1 2019: three customers in both segments amounting to € 43.6 million), which accounted for more than 10% of the total revenues. The following overview shows the point in time the performance obligations were met.
| | | | | | | | | | | | | | | | | | | | | | | | |
| H1 | | | | Proprietary Development | | | | | Partnered Discovery | |
| in 000’ € | | | | 2020 | | | | | 2019 | | | | | 2020 | | | | | 2019 | |
| | | | | | | | | | | | | | | | | | | | | | | | | |
At a Point in Time thereof performance obligations fulfilled in previous periods: in Proprietary Development € 0.0 million in 2020 and € 29.1 in 2019 and in Partnered Discovery € 21.2 million in 2020 and € 13.7 million in 2019 | | | | | 245,420 | | | | | | 31,665 | | | | | | 24,070 | | | | | | 16,271 | |
Over Time | | | | | 0 | | | | | | 0 | | | | | | 167 | | | | | | 268 | |
Total | | | | | 245,420 | | | | | | 31,665 | | | | | | 24,237 | | | | | | 16,539 | |
Accounts receivable and contract assets included accounts receivable in the amount of € 31.7 million (December 31, 2019: € 15.1 million) and contract assets in the amount of € 1.4 million (December 31, 2019: € 0). The contract assets resulted from a milestone from Janssen for Tremfya® in July 2020.
| |  | Collaboration and License Agreement with Incyte |
On January 13, 2020, MorphoSys AG and Incyte Corporation announced that both companies had signed a collaboration and license agreement for the global further development and commercialization of MorphoSys’ proprietary anti-CD19 antibody tafasitamab. The agreement became effective on March 3, 2020, following the receipt of antitrust clearance. Under the terms of the agreement, MorphoSys received an upfront payment of US$ 750.0 million (€ 691.7 million). In addition, Incyte invested US$ 150.0 million (€ 130.9 million) in new ADS of MorphoSys. MorphoSys increased its common stock by issuing 907,441 new ordinary shares from Authorized Capital 2017-I, excluding the preemptive rights of existing shareholders, to facilitate Incyte’s purchase of 3,629,764 ADSs. Each ADS represents 1⁄4 of one MorphoSys ordinary share. The new ordinary shares underlying the
| | | | |
| 36 | | Group Interim Statement | | |
ADSs represented 2.84% of the registered common stock of MorphoSys prior to the capital increase. Incyte purchased the 3,629,764 new ADSs at a price of US$ 41.32 per ADS, including a premium of 20% on the volume-weighted average ADS price 30 days prior to the signing of the collaboration and license agreement. Incyte has agreed, subject to limited exceptions, not to sell or otherwise transfer any of the new ADSs for an 18-month period. The new ADSs represent 2.76% of the registered common stock of MorphoSys following the capital increase.
Depending on the achievement of certain developmental, regulatory, and commercial milestones, MorphoSys is eligible to receive milestone payments amounting to up to US$ 1.1 billion. MorphoSys will also receive tiered royalties in a mid-teen to mid-twenties percentage of net sales of tafasitamab outside the U.S. In the U.S., MorphoSys and Incyte will co-commercialize tafasitamab, with MorphoSys being responsible for the commercial relationship with the end customer, which also comprises the deliveries of the drug and the collection of the related cash inflows. The revenues from product sales of tafasitamab will therefore be recorded by MorphoSys, as it is the principal of the transaction. Incyte and MorphoSys are jointly responsible for the commercialization activities in the U.S. and will equally share any profits and losses (50/50 basis). Outside the U.S., Incyte will receive exclusive commercialization rights, determine the commercialization strategy and be responsible for the commercial relationship with the end customer, including the deliveries of the drug and the collection of the related cash inflows. Therefore, Incyte will recognize all revenues generated from sales of tafasitamab outside the U.S and will furthermore pay royalties to MorphoSys on these sales.
MorphoSys received a total of US$ 900.0 million (€ 822.6 million) from Incyte upon signing the agreement. A total of US$ 268.9 million (€ 236.1 million) was recognized as revenues according to IFRS 15, as this is the amount recognized as consideration for the marketing license for tafasitamab outside the U.S. As part of Incyte’s participation in the equity of MorphoSys AG through a capital increase, the equivalent of US$1.0 million (€ 0.9 million; equivalent to the nominal value of € 1 per ordinary share) was recognized in common stock and US$ 90.7 million (€ 79.7 million) in additional paid-in capital. The remaining amount of US$ 539.4 million (€ 497.5 million) cannot be attributed to Incyte as a customer. At the time of its initial recognition, a current financial asset in the amount of US$ 48.9 million (€ 45.1 million) and a non-current financial liability in the amount of US$ 588.3 million (€ 542.6 million) were recognized and recorded in the balance sheet items “Financial Assets from Collaborations” and “Financial Liabilities from Collaborations”. The financial asset represents MorphoSys’s current reimbursement claim against Incyte from the expected future losses (as Incyte has agreed to compensate MorphoSys for 50% of said losses) measured at fair value. The non-current financial liability, measured at fair value, represents Incyte’s prepaid entitlement to future profit sharing on sales of Tafasitamab in the U.S. (as MorphoSys will share 50% of these profits with Incyte). Incyte has already acquired this right with the payments made in March 2020, therefore a liability had to be recognized at that time. Basis for the initial valuation at fair value is the corporate planning and its shared profits and losses thereof in connection with the commercialization
| | | | |
| Group Interim Statement | | | | 37 |
activities of MorphoSys and Incyte in the United States for the years ahead.
The financial asset is subsequently recognized at fair value through profit or loss and the financial liability at amortized cost using the effective interest method in accordance with IFRS 9. Resulting effective interest is recognized in the finance result. Cash flows from the profits and losses shared equally between the two parties are generally recognized directly against the financial asset or financial liability. Differences between the planned and actual cash flows from the financial asset or financial liability are recorded in the finance result. Effects resulting from changes in planning estimates regarding the expected net cash flows from financial assets and financial liabilities are recognized in the finance result as well. For the subsequent valuation of the financial liabilities the initial interest rate is still applied, whereas for the financial assets the actual interest yield is used. Foreign currency translation effects from the financial asset or financial liability are also recognized in the finance result.
As of June 30, 2020, an amount of US$ 602.7 million (€ 538.2 million) was recorded as a financial liability and US$ 50.8 million (€ 45.3 million) as a financial asset as a result of the collaboration with Incyte.
MorphoSys and Incyte will also share the development costs for the worldwide and U.S.-specific clinical trials at a ratio of 55% (Incyte) to 45% (MorphoSys). This 45% share of development costs is included in research and development costs. If MorphoSys provides services in excess of this 45% share, MorphoSys will be entitled to a compensation claim against Incyte, which will qualify as revenue in accordance with IFRS 15. Associated expenses for the provision of the service are recognized as cost of sales. Conversely, MorphoSys has to bear additional research and development expenses if Incyte performs more than 55% of the total clinical trial services. In addition, Incyte will assume 100% of future development costs for clinical trials in countries outside the United States. Incyte has the option to obtain development services from MorphoSys for this purpose. If this option is exercised, the related income will be recognized as revenue.
| |  | Income Taxes |
The tax assessment of the collaboration and license agreement with Incyte and other profit contributions resulted in a current tax expense and a corresponding tax liability of € 108.7 million in the first six months of 2020. This included the settlement of taxable profits with tax loss carryforwards from prior periods totaling € 249.8 million, which were entirely attributable to the first quarter of 2020. In addition, in the first six months of 2020 the Group recognized deferred tax assets in the amount of € 145.1 million as well as deferred tax liabilities of € 13.0 million, related to the collaboration and license agreement with Incyte as neither the financial assets from collaborations nor the financial liabilities from collaborations will be recorded for tax balance sheet purposes. As of December 2019, neither deferred tax assets nor deferred tax liabilities had to be accounted for due to the company’s historical loss
| | | | |
| 38 | | Group Interim Statement | | |
position. The aforementioned effects resulted in a total tax benefit of € 23.3 million in the first six months of 2020 (H1 2019: tax expenses of € 0.4 million).
| |  | Financial Instruments |
MorphoSys regularly employs forward rate contracts to hedge its foreign exchange risk. On June 30, 2020, there were no unsettled forward rate agreements (December 31, 2019: one forward rate agreement with remaining maturity of one month). On December 31, 2019 a gross unrealized gain of € 0.4 million was recorded in the finance result.
| |  | Fair Value Measurement |
MorphoSys uses the hierarchy below for determining and disclosing the fair value of financial instruments.
| | |
| Level 1: | | Quoted (unadjusted) prices in active markets for identical assets or liabilities to which the Company has access. |
| |
| Level 2: | | Inputs other than quoted prices included within Level 1 that are observable for the asset or liability, either directly (as prices) or indirectly (derived from prices). |
| |
| Level 3: | | Inputs for the asset or liability that are not based on observable market data (i.e., unobservable inputs). |
The carrying amounts of certain financial assets and liabilities, such as other financial assets at amortized cost, as well as accounts payable and receivable, approximate their fair values due to their short-term maturities.
Hierarchy Level 2 contains forward exchange contracts to hedge exchange rate fluctuations, term deposits and restricted cash. Future cash flows for these forward exchange contracts are determined based on forward exchange rate curves. The fair value of these instruments corresponds to their discounted cash flows. The fair value of the term deposits and restricted cash is determined by discounting the expected cash flows at market interest rates.
Under Hierarchy Level 3, financial assets include investments at fair value with changes recognized in other comprehensive income, as well as financial assets and financial liabilities from collaborations. The underlying valuations are performed by employees of the finance department, which directly report to the Chief Financial Officer. Valuation process and results are discussed and agreed on a regular basis between the involved parties. To determine the fair value of financial assets from collaborations, expected cash inflows from the planned losses of Incyte resulting from the joint marketing activities in the U.S. for tafasitamab are discounted using market interest rates for financial instruments with a comparable currency and term, taking into account the credit risk of Incyte. To determine the fair value of financial liabilities from collaborations for disclosure purposes (which are recognized at amortized cost using the effective interest method as described above), expected cash outflows from planned profits to Incyte resulting from the joint marketing activities in the U.S. for tafasitamab are discounted at market rates of
| | | | |
| Group Interim Statement | | | | 39 |
interest for financial instruments with a comparable currency and term, taking into account the credit risk of MorphoSys. The cash inflows and outflows represent an estimate of future revenues and costs from the joint marketing activities in the U.S. of tafasitamab and are subject to significant judgement. These estimates are based on assumptions that are jointly developed and approved twice a year by the responsible departments of MorphoSys and Incyte. Furthermore, the financial assets from collaborations and financial liabilities from collaborations are subject to significant uncertainties with regard to the foreign currency development.
Normally, transfers between the different hierarchy levels of fair values will be reflected as of the balance sheet dates, but neither in 2019 nor in 2020 such transfers had to be recorded.
The fair values of financial assets and liabilities and the carrying amounts presented in the consolidated balance sheet consist of the following items:
| | | | |
| 40 | | Group Interim Statement | | |
| | | | | | | | | | | | | | | | | | | | | | | | | | | | | | |
June 30, 2020;
in 000’ € | | | | Hierarchy
Level | | | | | Not classified
into a
Measurement
Category | | | | | Financial Assets at
Amortized Cost | | | | | Financial Assets at Fair Value (Through Profit or Loss) | | | | | | |
| | | | | | | | | | | | | | | | | | | | | | | | | | | | | | | |
Cash and Cash Equivalents | | | | | * | | | | | | | | | | | | 33,404 | | | | | | 0 | | | | | | | |
Financial Assets at Fair Value through Profit or Loss | | | | | 1 | | | | | | | | | | | | 0 | | | | | | 393,938 | | | | | | | |
Other Financial Assets at Amortized Cost | | | | | * | | | | | | | | | | | | 387,451 | | | | | | 0 | | | | | | | |
Accounts Receivable and Contract Assets | | | | | * | | | | | | | | | | | | 33,103 | | | | | | 0 | | | | | | | |
Financial Assets from Collaborations | | | | | 3 | | | | | | | | | | | | 0 | | | | | | 45,332 | | | | | | | |
Current Financial Assets | | | | | | | | | | | | | | | | | 453,958 | | | | | | 439,270 | | | | | | | |
Other Financial Assets at Amortized Cost, Net of Current Portion | | | | | 2 | | | | | | | | | | | | 247,052 | | | | | | 0 | | | | | | | |
Shares at Fair Value through Other Comprehensive Income | | | | | | | | | | | | | | | | | | | | | | | | | | | | | | |
thereof Shares at Level 1 | | | | | 1 | | | | | | | | | | | | 0 | | | | | | 0 | | | | | | | |
thereof Shares at Level 3 | | | | | 3 | | | | | | | | | | | | 0 | | | | | | 0 | | | | | | | |
Prepaid Expenses and Other Assets, Net of Current Portion | | | | | | | | | | | | | | | | | | | | | | | | | | | | | | |
thereof Non-Financial Assets | | | | | n/a | | | | | | 139 | | | | | | | | | | | | | | | | | | | |
thereof Restricted Cash | | | | | 2 | | | | | | | | | | | | 968 | | | | | | 0 | | | | | | | |
Non-current Financial Assets | | | | | | | | | | | 139 | | | | | | 248,020 | | | | | | 0 | | | | | | | |
Total | | | | | | | | | | | 139 | | | | | | 701,978 | | | | | | 439,270 | | | | | | | |
Accounts Payable and Accruals | | | | | * | | | | | | | | | | | | 0 | | | | | | 0 | | | | | | | |
Current Portion of Lease Liabilities | | | | | n/a | | | | | | (3,120 | ) | | | | | | | | | | | | | | | | | | |
Current Financial Liabilities | | | | | | | | | | | (3,120 | ) | | | | | 0 | | | | | | 0 | | | | | | | |
Lease Liabilities, Net of Current Portion | | | | | n/a | | | | | | (43,991 | ) | | | | | | | | | | | | | | | | | | |
Financial Liabilities from Collaborations | | | | | 3 | | | | | | | | | | | | 0 | | | | | | 0 | | | | | | | |
Non-current Financial Liabilities | | | | | | | | | | | (43,991 | ) | | | | | 0 | | | | | | 0 | | | | | | | |
Total | | | | | | | | | | | (47,111 | ) | | | | | 0 | | | | | | 0 | | | | | | | |
| | | | |
| Group Interim Statement | | | | 41 |
| | | | | | | | | | | | | | | | | | | | | | | | | | | | | | |
| | | | | Financial Assets at
Fair Value (Through
Other
Comprehensive
Income) | | | | | | Financial Liabilities at
Amortized Cost | | | | Financial Liabilities at
Fair Value | | | | | Total Carrying
Amount | | | | | | Fair value |
| | | | | | | | | | | | | | | | | | | | | | | | | | |
| | | | | | 0 | | | | | | | 0 | | | | 0 | | | | | | | 33,404 | | | | | | | * |
| | | | | | | | | | | |
| | | | | | 0 | | | | | | | 0 | | | | 0 | | | | | | | 393,938 | | | | | | | 393,938 |
| | | | | | 0 | | | | | | | 0 | | | | 0 | | | | | | | 387,451 | | | | | | | * |
| | | | | | 0 | | | | | | | 0 | | | | 0 | | | | | | | 33,103 | | | | | | | * |
| | | | | | 0 | | | | | | | 0 | | | | 0 | | | | | | | 45,332 | | | | | | | 45,332 |
| | | | | | 0 | | | | | | | 0 | | | | 0 | | | | | | | 893,228 | | | | | | | |
| | | | | | | | | | | |
| | | | | | 0 | | | | | | | 0 | | | | 0 | | | | | | | 247,052 | | | | | | | 247,052 |
| | | | | | | | | | | | | | | | | | | | | | | | 9,408 | | | | | | | |
| | | | | | 9,408 | | | | | | | 0 | | | | 0 | | | | | | | 9,408 | | | | | | | 9,408 |
| | | | | | 0 | | | | | | | 0 | | | | 0 | | | | | | | 0 | | | | | | | 0 |
| | | | | | | | | | | |
| | | | | | | | | | | | | | | | | | | | | | | | 1,107 | | | | | | | |
| | | | | | | | | | | | | | | | | | | | | | | | 139 | | | | | | | n/a |
| | | | | | 0 | | | | | | | 0 | | | | 0 | | | | | | | 968 | | | | | | | 968 |
| | | | | | 9,408 | | | | | | | 0 | | | | 0 | | | | | | | 257,567 | | | | | | | |
| | | | | | 9,408 | | | | | | | 0 | | | | 0 | | | | | | | 1,150,795 | | | | | | | |
| | | | | | 0 | | | | | | | (54,139) | | | | 0 | | | | | | | (54,139 | ) | | | | | | * |
| | | | | | | | | | | | | | | | | | | | | | | | (3,120 | ) | | | | | | ** |
| | | | | | 0 | | | | | | | (54,139) | | | | 0 | | | | | | | (57,259 | ) | | | | | | |
| | | | | | | | | | | | | | | | | | | | | | | | (43,991 | ) | | | | | | ** |
| | | | | | 0 | | | | | | | (538,200) | | | | 0 | | | | | | | (538,200 | ) | | | | | | (633,807) |
| | | | | | 0 | | | | | | | (538,200) | | | | 0 | | | | | | | (582,191 | ) | | | | | | |
| | | | | | 0 | | | | | | | (592,339) | | | | 0 | | | | | | | (639,450 | ) | | | | | | |
* Declaration waived in line with IFRS 7.29 (a). For these instruments the carrying amount is a reasonable approximation of fair value.
** Declaration waived in line with IFRS 7.29 (d) as disclosure is not required for lease liabilities.
| | | | |
| 42 | | Group Interim Statement | | |
| | | | | | | | | | | | | | | | | | | | | | | | | | | | | | |
December 31, 2019;
in 000’ € | | | | Hierarchy
Level | | | | | Not classified
into a
Measurement
Category | | | | | Financial Assets at
Amortized Cost | | | | | Financial Assets
at Fair Value
(Through Profit
or Loss) | | | | |
| |
| | | | | | | | | | | | | | | | | | | | | | | | | | | | | | |
| Cash and Cash Equivalents | | | | | * | | | | | | | | | | | | 44,314 | | | | | | 0 | | | | | | | |
| Financial Assets at Fair Value through Profit or Loss | | | | | 1 | | | | | | | | | | | | 0 | | | | | | 20,455 | | | | | | | |
| Other Financial Assets at Amortized Cost | | | | | * | | | | | | | | | | | | 207,735 | | | | | | 0 | | | | | | | |
| Accounts Receivable | | | | | * | | | | | | | | | | | | 15,082 | | | | | | 0 | | | | | | | |
| Other Receivables | | | | | | | | | | | | | | | | | | | | | | | | | | | | | | |
| thereof Financial Assets | | | | | * | | | | | | | | | | | | 1,217 | | | | | | | | | | | | | |
| thereof Forward Exchange Contracts used for Hedging | | | | | 2 | | | | | | | | | | | | 0 | | | | | | 396 | | | | | | | |
| Current Financial Assets | | | | | | | | | | | | | | | | | 268,348 | | | | | | 20,851 | | | | | | | |
| Other Financial Assets at Amortized Cost, Net of Current Portion | | | | | 2 | | | | | | | | | | | | 84,922 | | | | | | 0 | | | | | | | |
| Shares at Fair Value through Other Comprehensive Income | | | | | | | | | | | | | | | | | | | | | | | | | | | | | | |
| thereof Shares at Level 1 | | | | | 1 | | | | | | | | | | | | 0 | | | | | | 0 | | | | | | | |
| thereof Shares at Level 3 | | | | | 3 | | | | | | | | | | | | 0 | | | | | | 0 | | | | | | | |
| Prepaid Expenses and Other Assets, Net of Current Portion | | | | | | | | | | | | | | | | | | | | | | | | | | | | | | |
| thereof Non-Financial Assets | | | | | n/a | | | | | | 147 | | | | | | | | | | | | | | | | | | | |
| thereof Restricted Cash | | | | | 2 | | | | | | | | | | | | 989 | | | | | | 0 | | | | | | | |
| Non-current Financial Assets | | | | | | | | | | | 147 | | | | | | 85,911 | | | | | | 0 | | | | | | | |
| Total | | | | | | | | | | | 147 | | | | | | 354,259 | | | | | | 20,851 | | | | | | | |
| Accounts Payable and Accruals | | | | | * | | | | | | | | | | | | 0 | | | | | | 0 | | | | | | | |
| Current Portion of Lease Liabilities | | | | | n/a | | | | | | (2,515 | ) | | | | | | | | | | | | | | | | | | |
| Convertible Bonds—Liability Component | | | | | 2 | | | | | | | | | | | | 0 | | | | | | 0 | | | | | | | |
| Current Financial Liabilities | | | | | | | | | | | (2,515 | ) | | | | | 0 | | | | | | 0 | | | | | | | |
| Lease Liabilities, Net of Current Portion | | | | | n/a | | | | | | (40,042 | ) | | | | | | | | | | | | | | | | | | |
| Non-current Financial Liabilities | | | | | | | | | | | (40,042 | ) | | | | | 0 | | | | | | 0 | | | | | | | |
| Total | | | | | | | | | | | (42,557 | ) | | | | | 0 | | | | | | 0 | | | | | | | |
| | | | |
| Group Interim Statement | | | | 43 |
| | | | | | | | | | | | | | | | | | | | | | | | | | | | | | |
| | | | | Financial Assets at
Fair Value (Through
Other
Comprehensive
Income) | | | | | Financial Liabilities at
Amortized Cost | | | | | Financial Liabilities at
Fair Value | | | | | Total Carrying
Amount | | | | | Fair value | |
| | | | | | | | | | | | | | | | | | | | | | | | | | | | | | | |
| | | | | | 0 | | | | | | 0 | | | | | | 0 | | | | | | 44,314 | | | | | | * | |
| | | | | | | | | | | |
| | | | | | 0 | | | | | | 0 | | | | | | 0 | | | | | | 20,455 | | | | | | 20,455 | |
| | | | | | 0 | | | | | | 0 | | | | | | 0 | | | | | | 207,735 | | | | | | * | |
| | | | | | 0 | | | | | | 0 | | | | | | 0 | | | | | | 15,082 | | | | | | * | |
| | | | | | | | | | | | | | | | | | | | | | | | 1,613 | | | | | | | |
| | | | | | | | | | | | | | | | | | | | | | | | 1,217 | | | | | | * | |
| | | | | | | | | | | |
| | | | | | 0 | | | | | | 0 | | | | | | 0 | | | | | | 396 | | | | | | 396 | |
| | | | | | 0 | | | | | | 0 | | | | | | 0 | | | | | | 289,199 | | | | | | | |
| | | | | | | | | | | |
| | | | | | 0 | | | | | | 0 | | | | | | 0 | | | | | | 84,922 | | | | | | 84,922 | |
| | | | | | | | | | | |
| | | | | | | | | | | | | | | | | | | | | | | | 14,077 | | | | | | | |
| | | | | | 13,690 | | | | | | 0 | | | | | | 0 | | | | | | 13,690 | | | | | | 13,690 | |
| | | | | | 387 | | | | | | 0 | | | | | | 0 | | | | | | 387 | | | | | | 387 | |
| | | | | | | | | | | |
| | | | | | | | | | | | | | | | | | | | | | | | 1,136 | | | | | | | |
| | | | | | | | | | | | | | | | | | | | | | | | 147 | | | | | | n/a | |
| | | | | | 0 | | | | | | 0 | | | | | | 0 | | | | | | 989 | | | | | | 989 | |
| | | | | | 14,077 | | | | | | 0 | | | | | | 0 | | | | | | 100,135 | | | | | | | |
| | | | | | 14,077 | | | | | | 0 | | | | | | 0 | | | | | | 389,334 | | | | | | | |
| | | | | | 0 | | | | | | (57,042 | ) | | | | | 0 | | | | | | (57,042 | ) | | | | | * | |
| | | | | | | | | | | | | | | | | | | | | | | | (2,515 | ) | | | | | * | * |
| | | | | | 0 | | | | | | (12 | ) | | | | | 0 | | | | | | (12 | ) | | | | | (12 | ) |
| | | | | | 0 | | | | | | (57,042 | ) | | | | | 0 | | | | | | (59,569 | ) | | | | | | |
| | | | | | | | | | | | | | | | | | | | | | | | (40,042 | ) | | | | | * | * |
| | | | | | 0 | | | | | | (12 | ) | | | | | 0 | | | | | | (40,042 | ) | | | | | | |
| | | | | | 0 | | | | | | (57,054 | ) | | | | | 0 | | | | | | (99,611 | ) | | | | | | |
* Declaration waived in line with IFRS 7.29 (a). For these instruments the carrying amount is a reasonable approximation of fair value.
** Declaration waived in line with IFRS 7.29 (d) as disclosure is not required for lease liabilities.
In the first half of 2020, investments that are valued according to level 3 developed as follows:
| | | | | | | | | | | | |
in 000’ € | | | | | 2020 | | | | | | 2019 | |
| | | | | | | | | | | | | |
| Opening Balance | | | | | 387 | | | | | | 232 | |
| Additions | | | | | 0 | | | | | | 0 | |
| Disposals | | | | | 0 | | | | | | 0 | |
| Through Other Comprehensive Income | | | | | (387 | ) | | | | | 155 | |
| Through Profit or Loss | | | | | 0 | | | | | | 0 | |
| Closing Balance | | | | | 0 | | | | | | 387 | |
| | | | |
| 44 | | Group Interim Statement | | |
As of June 30, 2020, the fair value of the investment in adivo GmbH was € 0 (December 31, 2019: € 0.4 million). The decrease of € 0.4 million was recognized in other comprehensive income. The reason for the decline was a change in the corporate planning and the probability-weighted estimate of cash flows. A sensitivity analysis would not show a significant different effect.
Financial assets from collaborations that are valued according to level 3, changed in the first half of 2020 as follows:
| | | | | | | | |
In T € | | | | | | | 2020 | |
| | | | | | | | | |
Opening Balance | | | | | | | 0 | |
Additions | | | | | | | 45,090 | |
Disposals | | | | | | | 0 | |
Through Other Comprehensive Income | | | | | | | 0 | |
Through Profit or Loss (in Finance Result) | | | | | | | 242 | |
Closing Balance | | | | | | | 45,332 | |
If the key input parameters of revenue and cost components had changed in determining the fair value of the financial assets from collaborations at the time of acquisition by 1%, and the USD/EUR exchange rate had changed by 5% in either direction, the fair value would have ranged from US$ 47.2 million to US$ 50.6 million. As of June 30, 2020, this fair value would have been in a range of US$ 49.7 million to US$ 51.8 million, if the same input parameters had changed in the same range as at the time of acquisition.
| |  | Changes in Stockholders’ Equity |
COMMON STOCK
On June 30, 2020, the Company’s common stock, including treasury shares, totaled € 32,890,046 (December 31, 2019: € 31,957,958). Common stock was higher primarily as a result of the purchase of 3,692,754 ADS, which is equivalent to 907,441 shares, by Incyte. These shares were issued through a capital increase from Authorized Capital 2017-I. Common stock also increased by € 24,647 due to the exercise of 24,647 convertible bonds granted to the Management Board and to former employees. The weighted-average exercise price of the convertible bonds was € 31.88.
As of June 30, 2020, the value of treasury shares decreased from € 8,357,250 on December 31, 2019 to € 6,383,882. The reason for this decrease was the transfer of 52,322 treasury shares from the 2016 Long-Term Incentive Plan (LTI Plan) in the amount of € 1,933,821 to the Management Board and Senior Management Group of MorphoSys AG. The vesting period for this LTI Plan expired on April 1, 2020 and offers beneficiaries a six-month option until October 20, 2020 to receive a total of 91,037 shares. In addition, a total of 1,070 treasury shares from the 2019 LTI Plan in the amount of € 39,547 were transferred to selected employees of MorphoSys US Inc. As a
| | | | |
| Group Interim Statement | | | | 45 |
result of these transactions, MorphoSys held 172,408 treasury shares as of June 30, 2020, (December 31, 2019: 225,800 shares).
ADDITIONAL PAID-IN CAPITAL
On June 30, 2020, additional paid-in capital amounted to € 710,306,493 (December 31, 2019: € 628,176,568). The increase of € 82,129,925 mainly resulted from the capital increase with Incyte in the amount of € 79,590,657 net of transaction costs of € 100,370, the allocation of personnel expenses from share-based payments in the amount of € 3,751,660 and the exercise of convertible bonds in the amount of € 760,976. Part of the increase was offset by a decline that resulted from the reclassifications of treasury shares related to share allocations from the 2016 Long-Term Incentive Plan of MorphoSys AG in the amount of € 1,933,821 as well as from the 2019 LTI Plan of MorphoSys US Inc. in the amount of € 39,547.
OTHER COMPREHENSIVE INCOME RESERVE
On June 30, 2020, the other comprehensive income reserve amounted to € -4,280,863 (December 31, 2019: €-1,295,718). As of June 30, 2020, this reserve included changes in the fair value of equity instruments of € -4,853,020 (December 31, 2019: € -1,287,618) and foreign currency translation differences from consolidation of € 572,157 (December 31, 2019: € -8,100).
| |  | Development of Stock Options, Performance Share Units, Performance Shares and Convertible Bonds |
In the first six months of 2020, there were no convertible bonds issued to the Management Board, Senior Management Group or employees.
In April 2020 under the 2020 Stock Option Plan (SOP), a total of 108,215 stock options were issued to the Management Board, Senior Management Group and certain Company employees who were not members of the Senior Management Group. Further details can be found in Note 9.
In April and in June 2020, 27,795 and 8,361 performance share units were issued under the 2020 Performance Share Unit Program (PSU Program) to the Management Board, the Senior Management Group and certain Company employees who were not members of the Senior Management Group. Further details can be found in Note 10.
In April 2020, 42,307 performance shares were granted under the MorphoSys US Inc. 2020 Restricted Stock Unit Plan (RSU Plan) to the President and certain employees of MorphoSys US Inc. Further details can be found in Note 11.
After the expiration of the four-year vesting period, the Management Board, Senior Management Group and former members of the Senior Management Group who have since left the Company were granted a six-month period to receive a total of 91,037 shares under the 2016 LTI Plan. As of June 30, 2020, a total of 52,322 shares from the
| | | | |
| 46 | | Group Interim Statement | | |
2016 LTI Plan were transferred to the program’s beneficiaries.
After the expiration of the first one-year performance period, the President and selected employees of MorphoSys US Inc. were granted a six-month period to receive a total of 3,349 shares under the 2019 LTI Plan. As of June 30, 2020, a total of 1,070 shares from the 2019 LTI Plan were transferred to the program’s beneficiaries.
After the expiration of the four-year vesting period, the Management Board and Senior Management Group had the option until March 31, 2020 to exercise a total of 436,585 convertible bonds from the 2013 program. As of March 31, 2020, a total of 436,585 conversion rights from this program had been exercised and thereby created the same number of shares.
| |  | Stock Options |
On April 1, 2020, MorphoSys established a stock option plan (SOP) for the Management Board, the Senior Management Group and certain employees of the Company who are not members of the Senior Management Group (beneficiaries). In accordance with IFRS 2, the program is considered an equity-settled share-based payment and is accounted for accordingly. The grant date in accordance with IFRS 2 was April 21, 2020, and the vesting period/performance period is four years. Each stock option grants up to two subscription rights to shares of the Company. The subscription rights vest each year by 25 % during the four-year vesting period, provided that the performance criteria specified for the respective period have been 100 % fulfilled. The number of subscription rights vested per year is calculated based on the key performance criteria of the absolute MorphoSys share price performance, and the relative MorphoSys share price performance compared to the Nasdaq Biotech Index and the TecDAX Index. The performance criteria can be met annually up to a maximum of 200 %. If the share price development falls short of the program’s performance parameters, the target achievement for that year is 0 %.
The exercise price, derived from the average market price of the Company’s shares in the XETRA closing auction on the Frankfurt Stock Exchange from the 30 trading days prior to the issue of the stock options, is € 93.66.
MorphoSys reserves the right to settle the exercise of stock options through either newly created shares from Conditional Capital 2016-III or, alternatively, through the issuance of treasury shares or in cash should the exercise from Conditional Capital 2016-III not be possible. The exercise period is three years after the end of the four-year vesting period/performance period, which is March 31, 2027.
If a member of the Management Board ceases to hold an office at MorphoSys Group prior to the end of the four-year vesting period/performance period, the Management Board member (or the member’s heirs) would be entitled
| | | | |
| Group Interim Statement | | | | 47 |
to a precise daily pro rata amount of subscription rights.
If a member of the Management Board ceases to hold an office at MorphoSys Group for a compelling reason as defined by Section 626 (2) of the German Civil Code (BGB), all unexercised stock options will be forfeited without any entitlement to compensation.
If a cumulative absence of more than 90 days occurs during the four-year vesting period/performance period, the beneficiary is entitled to a precise daily pro rata amount of subscription rights. Absence is defined as either a continued period of lost work time due to illness or inactivity of a beneficiary or employment relationship without continued pay.
If a change of control occurs during the four-year vesting period, the stock options will become fully vested. In this case, however, the right to exercise the stock options arises only at the end of the four-year vesting period.
As of April 1, 2020, a total of 108,215 stock options had been granted to beneficiaries, of which 47,913 had been granted to the Management Board, 45,432 to the Senior Management Group and 14,870 to certain Company employees who are not members of the Senior Management Group. The stated number of stock options granted is based on 100 % target achievement. The fair value of the stock options on the grant date in accordance with IFRS 2 was € 38.20 per stock option. In the period from the grant date to June 30, 2019, no beneficiaries have left MorphoSys, and no stock options have been forfeited. For the calculation of personnel expenses resulting from share-based payment under the 2020 Stock Option Plan, the assumption is that ten beneficiaries would leave the Company during the four-year period.
The fair value of the stock options from the 2020 Stock Option Plan was determined using a Monte Carlo simulation. The expected volatility is based on the development of the share volatility of the last four years. Furthermore, the calculation of fair value equally considered the performance criteria of the absolute and relative performance of MorphoSys shares compared to the development of the Nasdaq Biotech Index and the TecDAX Index. The program’s parameters are listed in the table below.
| | | | |
| 48 | | Group Interim Statement | | |
| | | | | | |
| | | | | April 2020 Stock Option Plan | |
| | | | | | |
Share Price on Grant Date in € | | | | | 94.90 | |
Exercise Price in € | | | | | 93.66 | |
Expected Volatility of the MorphoSys share in % | | | | | 39.86 | |
Expected Volatility of the Nasdaq Biotech Index in % | | | | | 25.32 | |
Expected Volatility of the TecDAX Index in % | | | | | 20.48 | |
Performance Term of Program in Years | | | | | 4.0 | |
Dividend Yield in % | | | | | n/a | |
Risk-free Interest Rate in % | | | | | between -0.55 and -0.83 | |
| |  | Performance Share Unit Program |
On April 1, 2020, MorphoSys established a Performance Share Unit Program (PSU Program) for the Management Board, the Senior Management Group and certain Company employees who are not members of the Senior Management Group (beneficiaries). According to IFRS 2, this program is considered a share-based payment program with settlement in cash and is accounted for accordingly. The PSU Program is a performance-based program and is paid out in cash when predefined key performance criteria are achieved. The grant date in accordance with IFRS 2 was April 21, 2020, and the vesting/performance period is four years. If the predefined performance criteria for the respective period are fully met, 25 % of the performance share units become vested in each year of the four-year vesting period. The number of performance share units earned per year is calculated based on the performance criteria of the absolute and relative performance of the MorphoSys share price compared to the performance of the Nasdaq Biotech Index and the TecDAX Index. The performance criteria can be met annually up to a maximum of 200 %. If less than 0 % of the defined performance criteria are met in a given year, no performance share units are earned for that year. However, the right to receive a certain cash settlement from the PSU Program arises only at the end of the four-year vesting/performance period. After the end of the four-year vesting period, there is a six-month period during which the performance shares can be transferred from the Company to the beneficiaries.
MorphoSys reserves the right to pay its obligation under the PSU Program at the end of the vesting period in ordinary shares of MorphoSys AG equal to the value of the performance share units earned. The currently available treasury stock is not expected to be sufficient to satisfy the vested rights, which is why MorphoSys is accounting for the plan as a share-based payment program with settlement in cash in accordance with IFRS 2.
If a member of the Management Board ceases to hold an office at MorphoSys Group prior to the end of the four-year vesting period/performance period, the Management Board member (or the member’s heirs) is entitled to a precise monthly pro rata amount of performance share units.
| | | | |
| Group Interim Statement | | | | 49 |
If a member of the Management Board ceases to hold an office at MorphoSys Group for good reason as defined by Section 626 (2) of the German Civil Code (BGB), the beneficiary will not be entitled to performance share units.
If a cumulative absence of more than 12 months occurs during the four-year vesting period/performance period, the beneficiary is entitled to a precise daily pro rata amount of performance share units. Absence is defined as either a continued period of lost work time due to illness or inactivity of a beneficiary or employment relationship without continued pay.
If a change of control occurs during the four-year vesting period, all performance share units will become fully vested. In this case, the right to receive a certain allocation of performance share units under the PSU Program arises only at the end of the four-year vesting period.
As of April 1, 2020 a total of 27,795 performance share units were granted to beneficiaries consisting of 12,320 performance share units granted to the Management Board, 11,668 performance share units granted to the Senior Management Group and 3,807 performance share units allocated to certain Company employees who are not members of the Senior Management Group. The number of performance share units stated is based on 100 % target achievement. The fair value of the performance share units on the grant date of June 30, 2020 was € 90.35 per performance share unit. From the grant date until June 30, 2020, no beneficiaries have left MorphoSys, and no performance share units have been forfeited. For the calculation of the personnel expenses from share-based payment under the 2020 PSU Program, the assumption is that ten beneficiaries would leave the Company during the four-year period.
On June 1, 2020, MorphoSys established a further Performance Share Unit Program (PSU Program) for one member of the Management Board. The conditions were identical to those of the program as of April 1, 2020. A total of 8,361 performance share units were granted. The fair value of the performance share units was € 90.75 each as of June 30, 2020.
The fair value of the performance share units from the 2020 Performance Share Units Program was determined using a Monte Carlo simulation. The expected volatility is based on the development of the share volatility of the last four years. Furthermore, the calculation of the fair value equally considered the performance criteria of the absolute and relative performance of MorphoSys shares compared to the development of the Nasdaq Biotech Index and the TecDAX Index. The program’s parameters are listed in the table below.
| | | | |
| 50 | | Group Interim Statement | | |
| | | | | | | | | | | | | | |
| | | | | April 2020 Performance
Share Unit Program | | | | | | June 2020 Performance
Share Unit Program | |
| | | | | | | | | | | | |
| | | | | |
Share Price in € on June 30, 2020 | | | | | 112.45 | | | | | | | | 112.45 | |
Exercise Price in € | | | | | n/a | | | | | | | | n/a | |
Expected Volatility of the MorphoSys share in % | | | | | 40.20 | | | | | | | | 39.75 | |
Expected Volatility of the Nasdaq Biotech Index in % | | | | | 25.64 | | | | | | | | 25.36 | |
Expected Volatility of the TecDAX Index in % | | | | | 21.00 | | | | | | | | 20.69 | |
Remaining Performance Term of Program in Years | | | | | 3.75 | | | | | | | | 3.92 | |
Dividend Yield in % | | | | | n/a | | | | | | | | n/a | |
Risk-free Interest Rate in % | | | | | between -0.57 and -0.80 | | | | | | | | between -0.58 and -0.79 | |
| |  | MorphoSys US Inc. – 2020 Long-Term Incentive Plan |
On April 1, 2020, MorphoSys established a Long-Term Incentive Plan (LTI Plan) for certain employees of MorphoSys US Inc. (beneficiaries). According to IFRS 2, this program is considered a share-based payment program with settlement in equity instruments and is accounted for accordingly. The LTI Plan is a performance-related share plan (Restricted Stock Unit Plan – RSUP) and is paid out in shares of MorphoSys AG created from authorized capital when predefined key performance criteria are achieved. The plan has a term of three years and comprises three performance periods with a term of one year each. If the predefined performance criteria for the respective period are fully met, 33.3 % of the performance shares become vested in each year. The number of shares vested per year is calculated based on key performance criteria of MorphoSys US Inc. and the share price performance of MorphoSys AG during the annual performance period. The performance criteria can be met annually up to a maximum of 125 %. If the specified performance criteria are met by less than 0 % in one year, no shares will be earned for that year. After the end of the total three-year performance period, the final number of shares vested is calculated and the shares created through authorized capital are transferred from the Company to the beneficiaries.
MorphoSys reserves the right to pay a certain amount of the LTI Plan in cash equal to the amount of the performance shares at the end of the performance period.
If a beneficiary ceases to hold office or is no longer employed at MorphoSys US Inc. before the end of the one-year performance period, the beneficiary will forfeit his or her entitlement to a pro rata number of performance shares during the relevant one-year performance period and future performance periods. Entitlements from previously completed one-year performance periods are retained.
| | | | |
| Group Interim Statement | | | | 51 |
As of April 1, 2020, U.S. beneficiaries had been granted 42,307 restricted shares. The stated number of shares granted is based on 100 % target achievement. The fair value of the performance shares as of April 1, 2020 was € 98.10 per share. In the period from April 1, 2020 to June 30, 2020, no U.S. beneficiary had left MorphoSys US Inc., and therefore no restricted shares had expired. For the 2020 LTI Plan, the calculation of personnel expenses from share-based compensation was based on the assumption that four beneficiaries would leave the Company during the three-year period.
 | MorphoSys US Inc. – 2020 Cash Long-Term Incentive Plan |
On April 30, 2020, MorphoSys US Inc. established a Cash Long-Term Incentive Plan (CLTI Plan) for certain employees of MorphoSys US Inc. (beneficiaries). According to IFRS 2, the program is considered a share-based payment program with settlement in cash and is accounted for accordingly. The CLTI Plan is to be paid out in cash provided predefined performance criteria have been fulfilled. The term of the plan is three years and includes three one-year performance periods. If the predefined performance criteria for the respective period are fully met, 33.3 % of the cash award becomes vested in each year. The amount of the award vested per year is calculated based on key performance criteria of MorphoSys US Inc. and the share price performance of MorphoSys AG during the annual performance period. The performance criteria can be met up to a maximum of 125% per year. If less than 50 % of the defined performance criteria are met in any one year, no award will be vested for that year. At the end of the total three-year performance period, the vested cash award will be settled by MorphoSys US Inc.
If a beneficiary is no longer employed at MorphoSys US Inc. before the end of the one-year performance period, the beneficiary will forfeit his or her entitlement to a cash award during the relevant one-year performance period and future performance periods. Entitlements from previously completed one-year performance periods are retained.
 | Personnel Expenses Resulting from Share-Based Payments |
In the first six months of 2020, personnel expenses resulting from share-based payments totaling € 4.4 million were recognized in the income statement (H1 2019: € 3.1 million). In 2020, this amount solely resulted from share-based payments settled with equity instruments, of which an amount of € 0.7 million was related to personnel expenses associated with LTI programs (H1 2019: € 1.5 million), € 1.9 million (H1 2019: € 1.6 million) to stock options, € 1.2 million (H1 2019: € 0 million) to restricted stock units and € 0.6 million (H1 2019: € 0) from performance share units. The provision for performance share units amounts to € 0.6 million as of June 30, 2020 (December 31, 2019: € 0).
| | | | |
| 52 | | Group Interim Statement | | |
 | Managers’ Transactions |
The Group engages in business relationships with its Management Board and Supervisory Board members as related parties. In addition to cash compensation, the Company has granted stock options and performance shares to members of the Management Board.
The tables below show the shares, stock options and performance shares held by the members of the Management and Supervisory Boards, as well as the changes in the members’ ownership in the first six months of 2020.
SHARES
| | | | | | | | | | | | | | | | | | | | | | | | |
| | | | | 01/01/2020 | | | | | Additions | | | | | Sales | | | | | 06/30/2020 | |
| | | | | | | | | | | | | | | | | | | | | | | | | |
| | | | | | | | |
Management Board | | | | | | | | | | | | | | | | | | | | | | | | |
Dr. Jean-Paul Kress | | | | | - | | | | | | 0 | | | | | | 0 | | | | | | 0 | |
Jens Holstein | | | | | 19,517 | | | | | | 13,677 | | | | | | 0 | | | | | | 33,194 | |
Dr. Malte Peters | | | | | 3,313 | | | | | | 0 | | | | | | 0 | | | | | | 3,313 | |
Dr. Roland Wandeler 1 | | | | | - | | | | | | 0 | | | | | | 0 | | | | | | 0 | |
Dr. Markus Enzelberger 2 | | | | | 1,676 | | | | | | 0 | | | | | | 0 | | | | | | - | |
Total | | | | | 24,506 | | | | | | 13,677 | | | | | | 0 | | | | | | 36,507 | |
| | | | | | | | | | | | | | | | | | | | | | | | | |
Supervisory Board | | | | | | | | | | | | | | | | | | | | | | | | |
Dr. Marc Cluzel | | | | | 750 | | | | | | 0 | | | | | | 0 | | | | | | 750 | |
Michael Brosnan | | | | | 0 | | | | | | 0 | | | | | | 0 | | | | | | 0 | |
Sharon Curran | | | | | 0 | | | | | | 0 | | | | | | 0 | | | | | | 0 | |
Dr. George Golumbeski | | | | | 0 | | | | | | 0 | | | | | | 0 | | | | | | 0 | |
Wendy Johnson | | | | | 500 | | | | | | 0 | | | | | | 0 | | | | | | 500 | |
Krisja Vermeylen | | | | | 350 | | | | | | 0 | | | | | | 0 | | | | | | 350 | |
Dr. Frank Morich 3 | | | | | 1,000 | | | | | | 0 | | | | | | 0 | | | | | | - | |
Total | | | | | 2,600 | | | | | | 0 | | | | | | 0 | | | | | | 1,600 | |
STOCK OPTIONS
| | | | | | | | | | | | | | | | | | | | | | | | | | | | | | |
| | | | | 01/01/2020 | | | | | Additions | | | | | Forfeitures | | | | | Exercises | | | | | 06/30/2020 | |
| | | | | | | | | | | | | | | | | | | | | | | | | | | | | | | |
| | | | | | | | | | |
Management Board | | | | | | | | | | | | | | | | | | | | | | | | | | | | | | |
Dr. Jean-Paul Kress | | | | | 57,078 | | | | | | 24,911 | | | | | | 0 | | | | | | 0 | | | | | | 81,989 | |
Jens Holstein | | | | | 21,609 | | | | | | 11,501 | | | | | | 0 | | | | | | 0 | | | | | | 33,110 | |
Dr. Malte Peters | | | | | 21,609 | | | | | | 11,501 | | | | | | 0 | | | | | | 0 | | | | | | 33,110 | |
Dr. Roland Wandeler 1 | | | | | - | | | | | | 0 | | | | | | 0 | | | | | | 0 | | | | | | 0 | |
Dr. Markus Enzelberger 2 | | | | | 18,678 | | | | | | 0 | | | | | | 0 | | | | | | 0 | | | | | | - | |
Total | | | | | 118,974 | | | | | | 47,913 | | | | | | 0 | | | | | | 0 | | | | | | 148,209 | |
| | | | |
| Group Interim Statement | | | | 53 |
PERFORMANCE SHARES
| | | | | | | | | | | | | | | | | | | | | | | | | | | | | | | | | | | | |
| | | | | 01/01/2020 | | | | | Additions | | | | | Adjustment due to
performance
criteria 4 | | | | | Forfeitures | | | | | Allocations 5 | | | | | 06/30/2020 | |
| | | | | | | | | | | | | | | | | | | | | | | | | | | | | | | | | | | | | |
| | | | | | | | | | | | | |
Management Board | | | | | | | | | | | | | | | | | | | | | | | | | | | | | | | | | | | | |
Dr. Jean-Paul Kress | | | | | 0 | | | | | | 0 | | | | | | 0 | | | | | | 0 | | | | | | 0 | | | | | | 0 | |
Jens Holstein | | | | | 12,693 | | | | | | 0 | | | | | | 10,031 | | | | | | 0 | | | | | | 13,677 | | | | | | 9,047 | |
Dr. Malte Peters | | | | | 7,197 | | | | | | 0 | | | | | | 1,850 | | | | | | 0 | | | | | | 0 | | | | | | 9,047 | |
Dr. Roland Wandeler 1 | | | | | - | | | | | | 0 | | | | | | 0 | | | | | | 0 | | | | | | 0 | | | | | | 0 | |
Dr. Markus Enzelberger 2 | | | | | 7,259 | | | | | | 0 | | | | | | 0 | | | | | | 0 | | | | | | 1,837 | | | | | | - | |
Total | | | | | 27,149 | | | | | | 0 | | | | | | | | | | | | 0 | | | | | | 15,514 | | | | | | 18,094 | |
1 Dr. Roland Wandeler has joined the Management Board of MorphoSys AG on May 5, 2020.
2 Dr. Markus Enzelberger resigned from the management board as of February 29, 2020. Changes in the number of shares after resignation from the Management Board of MorphoSys AG are not presented in the tables.
3 Dr. Frank Morich has left the Supervisory Board of MorphoSys AG on May 11, 2020. Changes in the number of shares after resignation from the Supervisory Board of MorphoSys AG are not presented in the tables.
4 Adjustments based on determined performance criteria. For performance criteria that have not yet been met, 100 % target achievement is assumed.
5 Allocations are made as soon as performance shares are transferred within the six-month exercise period after the end of the four-year waiting period.
Members of the MorphoSys AG Supervisory Board do not hold any stock options, convertible bonds or performance shares.
 | Transactions with Related Parties |
With the exception of the transactions described under “Managers’ Transactions”, there were no further transactions carried out with related parties in the first six months of 2020. On June 30, 2020, the Senior Management Group of MorphoSys AG held 136,137 stock options (December 31, 2019: 100,832 units), 0 convertible bonds (December 31, 2019: 11,233 units) and 42,159 performance shares (December 31, 2019: 63,786 units), which were granted to them by the Company. On June 30, 2020, the President of MorphoSys US Inc. held 5,065 performance shares (December 31, 2019: 5,065 units) and 5,125 “restricted shares” (December 31, 2019: 0 units), which were granted to him by the Company.
In the first six months of 2020, a new stock option program and a new performance share program were issued to the Senior Management Group of MorphoSys AG. In addition, a new restricted share program was issued to the President of MorphoSys US Inc. Further details are available in Sections 8, 9 and 10 of this report.
On April 1, 2020, a total of 30,054 shares were granted to the Senior Management Group of MorphoSys AG under the 2016 LTI Plan. Beneficiaries have a six-month period to receive the shares. As of June 30, 2020, the Senior Management Group had exercised options for a total of 16,434 shares.
| | | | |
| 54 | | Group Interim Statement | | |
 | Further Significant Events and Transactions |
Due to the business model, the Covid-19 pandemic has had little impact on MorphoSys’ net assets, financial position and results of operations in the first six months of 2020. There were no significant asset impairments related to Covid-19.
On March 2, 2020, MorphoSys announced that the FDA formally accepted the marketing authorization application for Tafasitamab. This acceptance triggered a milestone payment of € 11.4 million, which was capitalized in the balance sheet item “in-process R&D programs”.
In the first six months of 2020, a full impairment loss on a license in the amount of € 2.0 million was recognized. No impairment loss was recognized in the same period of the previous year.
On June 30, 2020, an intangible asset not yet available for use (MOR107) from the Lanthio Group acquisition was subject to an event-related impairment test. Since the program is not expected to progress towards clinical development, a full impairment in the amount of € 11.7 million was recognized.
Inventories amounting to € 15.3 million as of June 30, 2020 (December 31, 2019: € 0.3 million) consisted of raw materials and supplies as well as finished products. Impairments to net realizable value to zero recognized on the antibody material resulting from fermentation runs (tafasitamab) in prior periods have been reversed due to the market approval of tafasitamab. This will now be used for commercialization purposes and therefore qualifies as inventories according to IAS 2. This resulted in net income in the amount of € 15.1 million, of which € 13.3 million have to be attributed to the fiscal year 2019. This reversal of impairment was included in cost of sales and research and development expenses.
| | | | |
| Group Interim Statement | | | | 55 |
 | Subsequent Events |
On July 3, 2020, Lanthio Group was granted a cost subsidy of € 1.6 million within the framework of a technology grant from the Dutch government.
On July 14, 2020, MorphoSys announced that its licensee Janssen announced the FDA approval of Tremfya® (guselkumab) as a treatment for adult patients living with active psoriatic arthritis (PsA). The approval was based on results from the phase 3 studies DISCOVER-1 and DISCOVER-2, which evaluated the efficacy and safety of Tremfya® in adults with active PsA compared to placebo. The results showed that a significant percentage of patients reached the studies’ primary endpoint.
End of July 2020 the first autoimmune membranous nephropathy (aMN) patient was dosed with felzartamab (MOR202) in the M-PLACE study.
On August 1, 2020, MorphoSys and Incyte announced that the FDA has approved Monjuvi® (tafasitamab-cxix) in combination with lenalidomide for the treatment of adult patients with relapsed or refractory diffuse large B-cell lymphoma (DLBCL) not otherwise specified, including DLBCL arising from low grade lymphoma, and who are not eligible for autologous stem cell transplant (ASCT).
| | | | |
| 56 | | Group Interim Statement | | |
Responsibility Statement
“To the best of our knowledge, and in accordance with the applicable accounting principles for interim financial reporting, the interim consolidated financial statements give a true and fair view of the Group’s net assets, financial position and results of operations, and the group interim management report provides a fair view of the development and performance of the business and the position of the Group together with a description of the principal opportunities and risks associated with the Group’s expected development during the remainder of the financial year.”
Planegg, August 5, 2020
| | | | |
Dr. Jean-Paul Kress | | Jens Holstein | | |
Chief Executive Officer | | Chief Financial Officer | | |
| | |
Dr. Malte Peters | | Dr. Roland Wandeler | | |
| Chief Research and Development Officer | | Chief Operating Officer | | |
| | | | |
| Group Interim Statement | | | | 57 |
Imprint
MorphoSys AG
Semmelweisstr. 7
82152 Planegg
Germany
| | |
Tel.: | | +49-89-89927-0 |
Fax: | | +49-89-89927-222 |
Email: | | info@morphosys.com |
www.morphosys.com
Corporate Communications and Investor Relations
| | |
Tel.: | | +49 -89-89927-404 |
Fax: | | +49 -89-89927-5404 |
Email: | | investors@morphosys.com |
Published on August 5, 2020
This half-year report is also available in German and can be downloaded from the Company’s website (PDF).
Concept and Design
3st kommunikation GmbH, Mainz
Translation
Klusmann Communications, Niedernhausen
Produced in-house using firesys.
HuCAL®, HuCAL GOLD®, HuCAL PLATINUM®, CysDisplay®, RapMAT®, arYla®, Ylanthia®, 100 billion high potentials®, Slonomics®, Lanthio Pharma®, LanthioPep® and ENFORCER® are registered trademarks of the MorphoSys Group. Tremfya® is a registered trademark of Janssen Biotech, Inc. XmAb® is a registered trademark of Xencor Inc.
Financial Calendar 2020
| | |
MARCH 18, 2020 | | PUBLICATION OF 2019 YEAR-END RESULTS |
MAY 6, 2020 | | PUBLICATION OF FIRST QUARTER INTERIM STATEMENT 2020 |
MAY 27, 2020 | | 2020 ANNUAL GENERAL MEETING |
AUGUST 5, 2020 | | PUBLICATION OF 2020 HALF-YEAR REPORT |
NOVEMBER 11, 2020 | | PUBLICATION OF THIRD QUARTER INTERIM STATEMENT 2020 |

MorphoSys AG
Semmelweisstr. 7
82152 Planegg
Germany
Tel.: +49-89-89927-0
Fax: +49-89-89927-222
www.morphosys.de