United States
Securities and Exchange Commission
Washington, D.C. 20549
Form N-CSR
Certified Shareholder Report of Registered Management Investment Companies
811-21822
(Investment Company Act File Number)
Federated Managed Pool Series
_______________________________________________________________
(Exact Name of Registrant as Specified in Charter)
Federated Investors Funds
4000 Ericsson Drive
Warrendale, Pennsylvania 15086-7561
(Address of Principal Executive Offices)
(412) 288-1900
(Registrant's Telephone Number)
John W. McGonigle, Esquire
Federated Investors Tower
1001 Liberty Avenue
Pittsburgh, Pennsylvania 15222-3779
(Name and Address of Agent for Service)
(Notices should be sent to the Agent for Service)
Date of Fiscal Year End: 12/31/2011
Date of Reporting Period: 12/31/2011
Item 1. Reports to Stockholders
| | Annual Shareholder Report |
| | December 31, 2011 |
|
Federated Corporate Bond Strategy Portfolio
A Portfolio of Federated Managed Pool Series
Not FDIC Insured May Lose Value No Bank Guarantee
Management's Discussion of Fund Performance (unaudited)
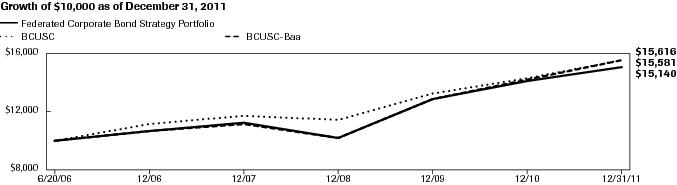
The Fund's total return, based on net asset value, for the 12-month reporting period ended December 31, 2011, was 7.12%. The total return of the Barclays Capital U.S. Credit Index (BCUSC), the Fund's broad-based securities market index, was 8.35%, and the total return of the Baa Component of the Barclays Capital U.S. Credit Index (BCUSC-Baa ),1 was 9.48%, for the same period. The Fund's total return for the most recently completed fiscal year reflected actual cash flows, transaction costs and other expenses which were not reflected in the total return of the indexes.
During the period, the most significant factors affecting the Fund's performance relative to the BCUSC-Baa were: (1) interest rate sensitivity (referred to as duration);2 (2) the allocation of the portfolio among securities of similar types of issuers (referred to as “sectors”); (3) individual security selection; and (4) selection of securities with different maturities (referred to as “yield curve” strategy).
Market Overview
The reporting period had a number of domestic and international events that contributed to a volatile year for the U.S. financial markets and also led to varying levels of economic activity. The first quarter of 2011 was a positive period for risk-based assets, including corporate and high-yield bonds.3 The Federal Reserve (the “Fed”) maintained the low interest rate environment with a federal funds target rate of 0.00% to 0.25% and direct purchases of U.S. Treasury and agency-backed mortgage securities. However, in the spring of 2011, geo-political risks increased in the Middle East and North Africa, resulting in higher oil prices and reduced consumer spending power and confidence. The Japanese earthquake and tsunami led to disruptions in the global supply chain from Asia, which resulted in reduced economic activity later in the year. Concerns over the European sovereign debt crisis also re-emerged. European governments announced new austerity programs, which investors feared would lead to recessions in both Europe and the United States.
In the third quarter of 2011, declining economic statistics re-enforced the fear of a double-dip recession in the United States. In addition, the failure of the U.S. government to reach a substantial federal deficit reduction plan led Standard & Poor's to downgrade the U.S. long-term sovereign debt rating to “AA+” from “AAA.” Faced with the potential of a stalling U.S. economy, the Fed took the unprecedented step of announcing short-term rates would remain low for a specific period of time, in this case through mid-2013. The Fed also announced a plan called “Operation Twist,” which was intended to reduce longer-term rates by extending the maturities of the Fed's portfolio through the purchase of $400 million of Treasury securities with maturities of between 6 and 30 years. The combination of increased investor demand for U.S. Treasuries in a flight to quality trade and the new Fed plan of buying U.S. Treasuries resulted in a significant decline in U.S. Treasury yields and a flattening of the U.S. Treasury yield curve. In the third quarter of 2011, the total return for U.S. Treasury bonds was 6.48% compared to only 2.85% for corporate bonds. Throughout the fourth quarter of 2011, the economic statistics began to improve, which helped reduce investors' fears of a double-dip recession in the United States. However, the European sovereign debt issues and the failure of the Congressional “Super-Committee” to reach a viable deficit reduction plan continued to create uncertainty in the capital markets and to suppress U.S. Treasury yields.
Duration
Duration was the main contributor to the Fund's underperformance for the reporting period. As previously discussed, interest rates were volatile during the fiscal year. The Fund's duration, which was less than the BCUSC-Baa for most of the reporting period, caused a drag in the Fund's performance. During the reporting period, the Fund used U.S. Treasury futures contracts to help manage the duration of the Fund. These positions had a slightly negative contribution to Fund performance for the fiscal year.
Sector
Sector allocation was a negative performance contributor relative to the BCUSC-Baa. The Fund maintained an overweight position in the Financial sector. These securities were higher quality than the Baa category, but they underperformed. An underweight position in the Supranational sector was able to partially offset the negative contribution from the Financial sector and contribute positively to the Fund's performance for the reporting period.
Annual Shareholder Report
Security SelectionIn total, individual security selection varied widely in terms of relative contribution to the Fund's performance and combined to negatively affect the performance of the Fund for the fiscal year. The economically sensitive Metals & Mining industry and some select European credits led to the underperformance relative to the BCUSC-Baa.
Yield Curve
Fund performance benefited from the yield curve strategy during the year relative to the BCUSC-Baa. The Fund was positioned for a flattening of the yield curve (i.e., longer rates decline more than shorter rates). For the year, interest rates declined for all maturities beyond three months with the greatest declines in the longer part of the curve, thus benefiting shareholders.4
| 1 | The BCUSC is composed of all publicly issued, fixed-rate, nonconvertible, investment-grade corporate debt. Issues are rated at least Baa by Moody's Investors Service or BBB by Standard & Poor's, if unrated by Moody's. The BCUSC-Baa is an index comprised of corporate bonds or securities represented by the following sectors: industrial, utility and finance, including both U.S. and non-U.S. corporations and non-corporate bonds or securities represented by the following sectors: sovereign, supranational, foreign agencies and foreign local governments. The indexes are unmanaged and, unlike the Fund, are not affected by cash flows. It is not possible to invest directly in an index. |
| 2 | Duration is a measure of a security's price sensitivity to changes in interest rates. Securities with longer durations are more sensitive to changes in interest rates than securities of shorter durations. |
| 3 | High-yield, lower-rated securities generally entail greater market, credit and liquidity risks than investment-grade securities and may include higher volatility and higher risk of default. |
| 4 | Bond prices are sensitive to changes in interest rates and a rise in interest rates can cause a decline in their prices. |
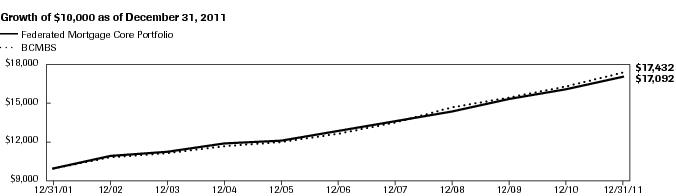
Annual Shareholder Report FUND PERFORMANCE AND GROWTH OF A $10,000 INVESTMENT
The Average Annual Total Return table below shows returns averaged over the stated periods. The graph below illustrates the hypothetical investment of $10,0001 in the Federated Corporate Bond Strategy Portfolio (the “Fund”) from June 20, 2006 (start of performance) to December 31, 2011, compared to the Barclays Capital U.S. Credit Index (BCUSC)2 and the Baa Component of the Barclays Capital U.S. Credit Index (BCUSC-Baa).2
| Average Annual Total Returns for the Period Ended 12/31/2011 | |
| 1 Year | 7.12% |
| 5 Years | 7.23% |
| Start of Performance* | 7.78% |
| * | The Fund's start of performance date was June 20, 2006. |
Performance data quoted represents past performance which is no guarantee of future results. Investment return and principal value will fluctuate so that an investor's shares, when redeemed, may be worth more or less than their original cost. Mutual fund performance changes over time and current performance may be lower or higher than what is stated. For current to the most recent month-end performance and after-tax returns, call 1-800-341-7400. Returns shown do not reflect the deduction of taxes that a shareholder would pay on Fund distributions or the redemption of Fund shares. Mutual funds are not obligations of or guaranteed by any bank and are not federally insured.
Growth of a $10,000 Investment
| Federated Corporate Bond Strategy Portfolio | C000030208 | BCUSC | BCUSC-Baa |
| 6/20/2006 | 10,000 | 10,000 | 10,000 |
| 12/31/2006 | 10,678 | 11,215 | 10,653 |
| 12/31/2007 | 11,235 | 11,788 | 11,158 |
| 12/31/2008 | 10,251 | 11,425 | 10,190 |
| 12/31/2009 | 12,900 | 13,258 | 12,963 |
| 12/31/2010 | 14,134 | 14,381 | 14,264 |
| 12/31/2011 | 15,140 | 15,581 | 15,616 |
41 graphic description end -->
| 1 | The Fund's performance assumes the reinvestment of all dividends and distributions. The BCUSC and BCUSC-Baa have been adjusted to reflect reinvestment of dividends on securities in an index. |
| 2 | The BCUSC and BCUSC-Baa are not adjusted to reflect sales charges, expenses or other fees that the Securities and Exchange Commission requires to be reflected in the Fund's performance. The indexes are unmanaged and, unlike the Fund, are not affected by cash flows. It is not possible to invest directly in an index. |
Annual Shareholder Report Portfolio of Investments Summary Table (unaudited)
At December 31, 2011, the Fund's portfolio composition1 was as follows:
| Security Type | Percentage of
Total Net Assets |
| Corporate Debt Securities | 90.5% |
| Foreign Government Debt Securities | 6.2% |
| U.S. Treasury Security | 1.0% |
| Derivative Contracts2 | (0.1)% |
| Cash Equivalents3 | 1.3% |
| Other Assets and Liabilities — Net4 | 1.1% |
| TOTAL | 100.0% |
| 1 | See the Fund's Prospectus and Statement of Additional Information for a description of these security types. |
| 2 | Based upon net unrealized appreciation (depreciation) or value of the derivative contracts as applicable. Derivative contracts may consist of futures, forwards, options and swaps. The impact of a derivative contract on the Fund's performance may be larger than its unrealized appreciation (depreciation) or value may indicate. In many cases, the notional value or amount of a derivative contract may provide a better indication of the contract's significance to the portfolio. More complete information regarding the Fund's direct investments in derivative contracts, including unrealized appreciation (depreciation), value and notional values or amounts of such contracts, can be found in the table at the end of the Portfolio of Investments included in this Report. |
| 3 | Cash Equivalents include any investments in money market mutual funds and/or overnight repurchase agreements. |
| 4 | Assets, other than investments in securities and derivative contracts, less liabilities. See Statement of Assets and Liabilities. |
Annual Shareholder Report Portfolio of Investments
December 31, 2011
Principal
Amount
or Shares | | | Value |
| | Corporate Bonds – 90.5% | |
| | Basic Industry - Chemicals – 4.0% | |
| $15,000 | | Albemarle Corp., Sr. Note, 5.10%, 2/1/2015 | 16,235 |
| 525,000 | | Dow Chemical Co., Note, 8.55%, 5/15/2019 | 684,784 |
| 250,000 | | Eastman Chemical Co., Sr. Unsecd. Note, 5.50%, 11/15/2019 | 284,755 |
| 70,000 | | FMC Corp., Sr. Unsecd. Note, 3.95%, 2/1/2022 | 71,196 |
| 120,000 | 1,2 | Incitec Pivot Finance LLC, Company Guarantee, Series 144A, 4.00%, 12/7/2015 | 123,504 |
| 85,000 | 1,2 | Incitec Pivot Finance LLC, Company Guarantee, Series 144A, 6.00%, 12/10/2019 | 93,350 |
| 160,000 | | RPM International, Inc., Sr. Unsecd. Note, 6.125%, 10/15/2019 | 174,125 |
| | TOTAL | 1,447,949 |
| | Basic Industry - Metals & Mining – 7.2% | |
| 250,000 | | Alcoa, Inc., Note, 5.55%, 2/1/2017 | 266,944 |
| 110,000 | | Allegheny Technologies, Inc., Sr. Note, 9.375%, 6/1/2019 | 140,637 |
| 235,000 | | Anglogold Ashanti Holdings PLC, Sr. Note, 6.50%, 4/15/2040 | 228,984 |
| 600,000 | | ArcelorMittal, Sr. Unsecd. Note, 5.25%, 8/5/2020 | 545,569 |
| 310,000 | | ArcelorMittal, Sr. Unsecd. Note, 6.75%, 3/1/2041 | 279,159 |
| 75,000 | | Barrick Gold Corp., 4.875%, 11/15/2014 | 81,810 |
| 150,000 | | Carpenter Technology Corp., Sr. Unsecd. Note, 5.20%, 7/15/2021 | 146,845 |
| 130,000 | 1,2 | Gerdau S.A., Company Guarantee, Series 144A, 5.75%, 1/30/2021 | 129,675 |
| 250,000 | 1,2 | Gold Fields Orogen Holding BVI Ltd., Company Guarantee, Series 144A, 4.875%, 10/7/2020 | 221,040 |
| 200,000 | 1,2 | Hyundai Steel Co., Sr. Unsecd. Note, Series 144A, 4.625%, 4/21/2016 | 199,584 |
| 250,000 | | Southern Copper Corp., Note, 6.75%, 4/16/2040 | 252,246 |
| 100,000 | | Xstrata Canada Corp., 6.00%, 10/15/2015 | 109,561 |
| | TOTAL | 2,602,054 |
| | Basic Industry - Paper – 1.8% | |
| 245,000 | | International Paper Co., Sr. Unsecd. Note, 7.50%, 8/15/2021 | 303,217 |
| 140,000 | | Plum Creek Timberlands LP, Sr. Unsecd. Note, 4.70%, 3/15/2021 | 141,265 |
| 100,000 | | Weyerhaeuser Co., Deb., 7.375%, 3/15/2032 | 105,097 |
| 100,000 | | Weyerhaeuser Co., Sr. Unsecd. Note, 7.375%, 10/1/2019 | 112,802 |
| | TOTAL | 662,381 |
| | Capital Goods - Aerospace & Defense – 0.2% | |
| 100,000 | 1,2 | Meccanica Holdings USA, Inc., Company Guarantee, Series 144A, 6.25%, 1/15/2040 | 71,630 |
| | Capital Goods - Building Materials – 1.0% | |
| 100,000 | | Masco Corp., Note, 5.875%, 7/15/2012 | 101,502 |
| 30,000 | | Masco Corp., Sr. Unsecd. Note, 7.125%, 3/15/2020 | 30,314 |
| 200,000 | | Valmont Industries, Inc., Sr. Unsecd. Note, 6.625%, 4/20/2020 | 231,789 |
| | TOTAL | 363,605 |
| | Capital Goods - Construction Machinery – 0.3% | |
| 120,000 | 1,2 | AGCO Corp., Sr. Unsecd. Note, Series 144A, 5.875%, 12/1/2021 | 121,521 |
| | Capital Goods - Diversified Manufacturing – 0.5% | |
| 30,000 | | Harsco Corp., 5.75%, 5/15/2018 | 34,664 |
| 50,000 | | Textron Financial Corp., 5.40%, 4/28/2013 | 51,458 |
| 136,000 | 1,2 | Textron Financial Corp., Jr. Sub. Note, Series 144A, 6.00%, 2/15/2067 | 99,960 |
| | TOTAL | 186,082 |
| | Capital Goods - Packaging – 0.7% | |
| 220,000 | | Sonoco Products Co., Sr. Unsecd. Note, 5.75%, 11/1/2040 | 235,834 |
| | Communications - Media & Cable – 5.2% | |
| 225,000 | | Comcast Corp., 7.05%, 3/15/2033 | 285,144 |
Annual Shareholder ReportPrincipal
Amount
or Shares | | | Value |
| $100,000 | | Comcast Corp., Company Guarantee, 6.50%, 1/15/2017 | 117,906 |
| 50,000 | | Comcast Corp., Sr. Sub. Deb., 10.625%, 7/15/2012 | 52,303 |
| 260,000 | | DIRECTV Holdings LLC, Company Guarantee, 5.00%, 3/1/2021 | 278,716 |
| 245,000 | | DIRECTV Holdings LLC, Company Guarantee, 6.375%, 3/1/2041 | 282,920 |
| 40,000 | | Time Warner Cable, Inc., Company Guarantee, 5.50%, 9/1/2041 | 42,165 |
| 90,000 | | Time Warner Cable, Inc., Company Guarantee, 6.75%, 6/15/2039 | 107,240 |
| 420,000 | | Time Warner Cable, Inc., Company Guarantee, 8.25%, 4/1/2019 | 529,592 |
| 50,000 | | Time Warner Cable, Inc., Company Guarantee, 8.75%, 2/14/2019 | 64,198 |
| 100,000 | | Time Warner Cable, Inc., Sr. Unsecd. Note, 5.85%, 5/1/2017 | 114,071 |
| | TOTAL | 1,874,255 |
| | Communications - Media Noncable – 2.2% | |
| 100,000 | | Grupo Televisa S.A., 6.625%, 3/18/2025 | 116,544 |
| 50,000 | | Interpublic Group of Cos., Inc., Sr. Unsecd. Note, 10.00%, 7/15/2017 | 57,375 |
| 100,000 | | News America Holdings, Inc., Sr. Deb., 6.75%, 1/9/2038 | 117,626 |
| 350,000 | | News America, Inc., Company Guarantee, 5.65%, 8/15/2020 | 392,043 |
| 100,000 | 1,2 | Pearson Funding Two PLC, Sr. Unsecd. Note, Series 144A, 4.00%, 5/17/2016 | 106,240 |
| | TOTAL | 789,828 |
| | Communications - Telecom Wireless – 0.0% | |
| 5,000 | | Vodafone Group PLC, 5.35%, 2/27/2012 | 5,035 |
| | Communications - Telecom Wirelines – 3.7% | |
| 300,000 | | CenturyLink, Inc., Sr. Note, Series Q, 6.15%, 9/15/2019 | 301,737 |
| 250,000 | | CenturyLink, Inc., Sr. Unsecd. Note, 6.45%, 6/15/2021 | 250,811 |
| 90,000 | | Rogers Communications, Inc., 5.50%, 3/15/2014 | 97,088 |
| 100,000 | | Rogers Communications, Inc., Company Guarantee, 6.80%, 8/15/2018 | 121,992 |
| 325,000 | | Telecom Italia Capital SA, Company Guarantee, 6.00%, 9/30/2034 | 238,410 |
| 325,000 | | Telefonica Emisiones S.A.U., Company Guarantee, 5.462%, 2/16/2021 | 311,252 |
| 40,000 | | Telefonica SA, Company Guarantee, 7.045%, 6/20/2036 | 39,472 |
| | TOTAL | 1,360,762 |
| | Consumer Cyclical - Automotive – 1.7% | |
| 50,000 | 1,2 | American Honda Finance Corp., Series 144A, 7.625%, 10/1/2018 | 63,049 |
| 50,000 | | DaimlerChrysler North America Holding Corp., 6.50%, 11/15/2013 | 54,280 |
| 165,000 | | DaimlerChrysler North America Holding Corp., Company Guarantee, 8.50%, 1/18/2031 | 231,277 |
| 170,000 | 1,2 | Hyundai Capital Services, Inc., Note, Series 144A, 6.00%, 5/5/2015 | 181,266 |
| 80,000 | 1,2 | RCI Banque SA, Sr. Unsecd. Note, Series 144A, 4.60%, 4/12/2016 | 76,481 |
| | TOTAL | 606,353 |
| | Consumer Cyclical - Entertainment – 2.6% | |
| 150,000 | | NBC Universal, Inc., Sr. Unsecd. Note, 5.15%, 4/30/2020 | 168,101 |
| 150,000 | | NBC Universal, Inc., Sr. Unsecd. Note, 5.95%, 4/1/2041 | 179,193 |
| 250,000 | | NBC Universal, Inc., Sr. Unsecd. Note, 6.40%, 4/30/2040 | 309,494 |
| 200,000 | | Time Warner, Inc., Company Guarantee, 6.20%, 3/15/2040 | 239,666 |
| 50,000 | | Viacom, Inc., Sr. Unsecd. Note, 2.50%, 12/15/2016 | 50,310 |
| | TOTAL | 946,764 |
| | Consumer Cyclical - Lodging – 1.1% | |
| 250,000 | | Choice Hotels International, Inc., Company Guarantee, 5.70%, 8/28/2020 | 260,652 |
| 20,000 | | Wyndham Worldwide Corp., Sr. Unsecd. Note, 5.625%, 3/1/2021 | 20,681 |
| 125,000 | | Wyndham Worldwide Corp., Sr. Unsecd. Note, 6.00%, 12/1/2016 | 134,972 |
| | TOTAL | 416,305 |
| | Consumer Cyclical - Retailers – 0.7% | |
| 75,000 | | JC Penney Corp., Inc., Sr. Unsecd. Note, 5.75%, 2/15/2018 | 75,750 |
Annual Shareholder ReportPrincipal
Amount
or Shares | | | Value |
| $130,000 | | JC Penney Corp., Inc., Sr. Unsecd. Note, 7.40%, 4/1/2037 | 121,550 |
| 60,000 | | O'Reilly Automotive, Inc., Company Guarantee, 4.875%, 1/14/2021 | 63,934 |
| | TOTAL | 261,234 |
| | Consumer Non-Cyclical - Food/Beverage – 1.5% | |
| 80,000 | 1,2 | Bacardi Ltd., Sr. Note, Series 144A, 7.45%, 4/1/2014 | 90,156 |
| 300,000 | | Kraft Foods, Inc., Sr. Unsecd. Note, 6.50%, 2/9/2040 | 390,969 |
| 60,000 | | Ralcorp Holdings, Inc., Sr. Secd. Note, 6.625%, 8/15/2039 | 61,876 |
| | TOTAL | 543,001 |
| | Consumer Non-Cyclical - Health Care – 0.1% | |
| 35,000 | | CareFusion Corp., Sr. Unsecd. Note, 6.375%, 8/1/2019 | 41,381 |
| | Consumer Non-Cyclical - Pharmaceuticals – 0.1% | |
| 40,000 | | Dentsply International, Inc., Sr. Unsecd. Note, 2.75%, 8/15/2016 | 40,409 |
| | Consumer Non-Cyclical - Supermarkets – 0.7% | |
| 100,000 | | Kroger Co., Bond, 6.90%, 4/15/2038 | 127,696 |
| 100,000 | | Kroger Co., Note, 6.80%, 12/15/2018 | 123,329 |
| | TOTAL | 251,025 |
| | Consumer Non-Cyclical - Tobacco – 1.8% | |
| 415,000 | | Altria Group, Inc., 9.25%, 8/6/2019 | 558,401 |
| 100,000 | | Lorillard Tobacco Co., Sr. Unsecd. Note, 7.00%, 8/4/2041 | 105,273 |
| | TOTAL | 663,674 |
| | Energy - Independent – 4.9% | |
| 125,000 | | Canadian Natural Resources Ltd., 4.90%, 12/1/2014 | 137,544 |
| 50,000 | | Canadian Natural Resources Ltd., 5.45%, 10/1/2012 | 51,727 |
| 50,000 | 1,2 | Petroleos Mexicanos, Company Guarantee, Series 144A, 6.50%, 6/2/2041 | 56,773 |
| 850,000 | | Petroleos Mexicanos, Company Guarantee, Series WI, 4.875%, 3/15/2015 | 902,580 |
| 190,000 | | Petroleos Mexicanos, Company Guarantee, Series WI, 5.50%, 1/21/2021 | 206,360 |
| 240,000 | | Petroleos Mexicanos, Company Guarantee, Series WI, 6.00%, 3/5/2020 | 269,564 |
| 100,000 | | Talisman Energy, Inc., Sr. Unsecd. Note, 3.75%, 2/1/2021 | 98,651 |
| 42,909 | 1,2 | Tengizchevroil LLP, Series 144A, 6.124%, 11/15/2014 | 44,143 |
| | TOTAL | 1,767,342 |
| | Energy - Integrated – 1.8% | |
| 100,000 | | Hess Corp., 7.00%, 2/15/2014 | 110,854 |
| 100,000 | | Husky Oil Ltd., Deb., 7.55%, 11/15/2016 | 121,749 |
| 100,000 | | Petro-Canada, Bond, 5.35%, 7/15/2033 | 105,435 |
| 280,000 | | Petrobras International Finance Co., Company Guarantee, 6.75%, 1/27/2041 | 320,501 |
| | TOTAL | 658,539 |
| | Energy - Oil Field Services – 1.3% | |
| 35,000 | | Nabors Industries, Inc., Company Guarantee, 5.00%, 9/15/2020 | 35,905 |
| 100,000 | | Nabors Industries, Inc., Company Guarantee, 9.25%, 1/15/2019 | 125,998 |
| 90,000 | | Noble Holding International Ltd., Company Guarantee, 4.90%, 8/1/2020 | 95,519 |
| 50,000 | 1,2 | Schlumberger Investment SA, Company Guarantee, Series 144A, 1.95%, 9/14/2016 | 50,549 |
| 150,000 | | Weatherford International Ltd., 7.00%, 3/15/2038 | 172,516 |
| | TOTAL | 480,487 |
| | Energy - Refining – 1.4% | |
| 150,000 | | Marathon Petroleum Corp., Sr. Unsecd. Note, 6.50%, 3/1/2041 | 169,467 |
| 250,000 | | Valero Energy Corp., 9.375%, 3/15/2019 | 320,750 |
| | TOTAL | 490,217 |
| | Financial Institution - Banking – 9.0% | |
| 200,000 | | Associated Banc-Corp., Sr. Unsecd. Note, 5.125%, 3/28/2016 | 205,774 |
Annual Shareholder ReportPrincipal
Amount
or Shares | | | Value |
| $350,000 | | Bank of America Corp., Sr. Unsecd. Note, 5.00%, 5/13/2021 | 321,361 |
| 30,000 | | Capital One Capital IV, 6.745%, 2/17/2037 | 29,775 |
| 170,000 | | Capital One Capital V, 10.25%, 8/15/2039 | 177,437 |
| 150,000 | | Capital One Capital VI, 8.875%, 5/15/2040 | 156,220 |
| 240,000 | | Capital One Financial Corp., Sr. Note, 7.375%, 5/23/2014 | 263,995 |
| 270,000 | | City National Corp., Note, 5.25%, 9/15/2020 | 268,817 |
| 310,000 | | Fifth Third Bancorp, Sr. Unsecd. Note, 3.625%, 1/25/2016 | 317,607 |
| 350,000 | | Goldman Sachs Group, Inc., Sr. Unsecd. Note, 5.375%, 3/15/2020 | 345,090 |
| 110,000 | | HSBC Holdings PLC, Sr. Unsecd. Note, 5.10%, 4/5/2021 | 117,254 |
| 40,000 | | Huntington Bancshares, Inc., Sub. Note, 7.00%, 12/15/2020 | 45,395 |
| 350,000 | | Morgan Stanley, Sr. Unsecd. Note, 5.75%, 1/25/2021 | 325,901 |
| 355,000 | | SunTrust Banks, Inc., Sr. Unsecd. Note, 3.60%, 4/15/2016 | 361,937 |
| 290,000 | | Suntrust Capital VIII, Jr. Sub. Note, 6.10%, 12/15/2036 | 287,283 |
| 50,000 | | Wilmington Trust Corp., Sub. Note, 8.50%, 4/2/2018 | 59,659 |
| | TOTAL | 3,283,505 |
| | Financial Institution - Brokerage – 1.8% | |
| 190,000 | 1,2 | Cantor Fitzgerald LP, Bond, Series 144A, 7.875%, 10/15/2019 | 190,626 |
| 10,000 | | Eaton Vance Corp., 6.50%, 10/2/2017 | 10,937 |
| 75,000 | 1,2 | FMR LLC, Series 144A, 4.75%, 3/1/2013 | 77,397 |
| 150,000 | | Janus Capital Group, Inc., Sr. Note, 6.70%, 6/15/2017 | 159,396 |
| 250,000 | | Jefferies Group, Inc., Sr. Unsecd. Note, 6.875%, 4/15/2021 | 226,875 |
| | TOTAL | 665,231 |
| | Financial Institution - Finance Noncaptive – 1.6% | |
| 100,000 | | HSBC Finance Capital Trust IX, Note, 5.911%, 11/30/2035 | 82,750 |
| 480,000 | | International Lease Finance Corp., Sr. Unsecd. Note, 5.75%, 5/15/2016 | 445,722 |
| 70,000 | 1,2 | Macquarie Group Ltd., Sr. Unsecd. Note, Series 144A, 6.00%, 1/14/2020 | 66,064 |
| | TOTAL | 594,536 |
| | Financial Institution - Insurance - Life – 4.9% | |
| 75,000 | | AXA-UAP, Sub. Note, 8.60%, 12/15/2030 | 74,174 |
| 100,000 | | American International Group, Inc., Sr. Unsecd. Note, 4.25%, 9/15/2014 | 97,276 |
| 425,000 | | American International Group, Inc., Sr. Unsecd. Note, 6.40%, 12/15/2020 | 429,528 |
| 50,000 | | Lincoln National Corp., Sr. Note, 7.00%, 6/15/2040 | 56,482 |
| 200,000 | | Lincoln National Corp., Sr. Unsecd. Note, 6.25%, 2/15/2020 | 216,590 |
| 100,000 | | MetLife, Inc., Jr. Sub. Note, 10.75%, 8/1/2039 | 131,500 |
| 50,000 | 1,2 | Penn Mutual Life Insurance Co., Sr. Note, Series 144A, 7.625%, 6/15/2040 | 60,297 |
| 150,000 | | Prudential Financial, Inc., Sr. Note, Series MTND, 7.375%, 6/15/2019 | 178,669 |
| 300,000 | | Prudential Financial, Inc., Sr. Unsecd. Note, 5.375%, 6/21/2020 | 319,713 |
| 200,000 | | Prudential Financial, Inc., Sr. Unsecd. Note, Series MTN, 4.75%, 9/17/2015 | 211,804 |
| | TOTAL | 1,776,033 |
| | Financial Institution - Insurance - P&C – 3.0% | |
| 450,000 | | CNA Financial Corp., 6.50%, 8/15/2016 | 487,328 |
| 50,000 | | CNA Financial Corp., Sr. Unsecd. Note, 5.875%, 8/15/2020 | 51,432 |
| 50,000 | | CNA Financial Corp., Sr. Unsecd. Note, 7.35%, 11/15/2019 | 55,793 |
| 75,000 | | Horace Mann Educators Corp., Sr. Note, 6.85%, 4/15/2016 | 81,041 |
| 60,000 | 1,2 | Liberty Mutual Group, Inc., Company Guarantee, Series 144A, 5.00%, 6/1/2021 | 58,881 |
| 125,000 | 1,2 | Liberty Mutual Group, Inc., Unsecd. Note, Series 144A, 5.75%, 3/15/2014 | 130,438 |
| 195,000 | 1,2 | Nationwide Mutual Insurance Co., Sub. Note, Series 144A, 9.375%, 8/15/2039 | 235,061 |
| | TOTAL | 1,099,974 |
Annual Shareholder ReportPrincipal
Amount
or Shares | | | Value |
| | Financial Institution - REITs – 3.5% | |
| $100,000 | | Boston Properties LP, Sr. Unsecd. Note, 5.875%, 10/15/2019 | 112,970 |
| 325,000 | | Equity One, Inc., Bond, 6.00%, 9/15/2017 | 339,145 |
| 230,000 | | Health Care REIT, Inc., Sr. Unsecd. Note, 6.125%, 4/15/2020 | 238,615 |
| 230,000 | | Prologis, Conv. Bond, 2.25%, 4/1/2037 | 229,786 |
| 210,000 | | Regency Centers LP, Company Guarantee, 4.80%, 4/15/2021 | 213,474 |
| 110,000 | | Tanger Properties LP, Sr. Unsecd. Note, 6.125%, 6/1/2020 | 122,507 |
| | TOTAL | 1,256,497 |
| | Technology – 1.2% | |
| 100,000 | | BMC Software, Inc., 7.25%, 6/1/2018 | 115,803 |
| 120,000 | | Fiserv, Inc., Sr. Note, 6.80%, 11/20/2017 | 139,773 |
| 30,000 | | Juniper Networks, Inc., Sr. Unsecd. Note, 5.95%, 3/15/2041 | 32,821 |
| 75,000 | | Verisk Analytics, Inc., Sr. Unsecd. Note, 4.875%, 1/15/2019 | 75,757 |
| 60,000 | | Xerox Corp., Sr. Unsecd. Note, 4.50%, 5/15/2021 | 60,900 |
| | TOTAL | 425,054 |
| | Transportation - Airlines – 0.2% | |
| 75,000 | | Southwest Airlines Co., Deb., 7.375%, 3/1/2027 | 86,368 |
| | Transportation - Railroads – 1.2% | |
| 75,000 | | Burlington Northern Santa Fe Corp., 4.875%, 1/15/2015 | 82,025 |
| 100,000 | | Canadian Pacific Railway Co., Sr. Unsecd. Note, 4.45%, 3/15/2023 | 100,847 |
| 100,000 | | Canadian Pacific RR, 7.125%, 10/15/2031 | 118,730 |
| 125,000 | | Union Pacific Corp., 4.875%, 1/15/2015 | 137,408 |
| | TOTAL | 439,010 |
| | Transportation - Services – 0.7% | |
| 45,000 | | Ryder System, Inc., Sr. Unsecd. Note, Series MTN, 3.50%, 6/1/2017 | 46,229 |
| 180,000 | | Ryder System, Inc., Sr. Unsecd. Note, Series MTN, 7.20%, 9/1/2015 | 210,626 |
| | TOTAL | 256,855 |
| | Utility - Electric – 8.3% | |
| 200,000 | | Appalachian Power Co., Sr. Unsecd. Note, 7.00%, 4/1/2038 | 269,413 |
| 75,000 | | Cleveland Electric Illuminating Co., Sr. Unsecd. Note, 5.95%, 12/15/2036 | 80,057 |
| 100,000 | | Commonwealth Edison Co., 1st Mtg. Bond, 6.15%, 9/15/2017 | 118,184 |
| 50,000 | | Dominion Resources, Inc., Sr. Unsecd. Note, 8.875%, 1/15/2019 | 66,417 |
| 160,000 | | Exelon Generation Co. LLC, Sr. Unsecd. Note, 5.75%, 10/1/2041 | 184,063 |
| 100,000 | | Exelon Generation Co. LLC, Sr. Unsecd. Note, 6.25%, 10/1/2039 | 122,176 |
| 50,000 | | FPL Group Capital, Inc., 7.875%, 12/15/2015 | 59,474 |
| 420,000 | | FirstEnergy Solutions Corp., Company Guarantee, 6.05%, 8/15/2021 | 466,761 |
| 54,769 | 1,2 | Great River Energy, 1st Mtg. Note, Series 144A, 5.829%, 7/1/2017 | 60,252 |
| 160,000 | | KCP&L Greater Missouri Operations Co., Sr. Unsecd. Note, 11.875%, 7/1/2012 | 167,956 |
| 200,000 | | National Rural Utilities Cooperative Finance Corp., Sr. Unsecd. Note, 10.375%, 11/1/2018 | 286,562 |
| 50,000 | | PPL Energy Supply LLC, Sr. Unsecd. Note, 6.00%, 12/15/2036 | 53,101 |
| 200,000 | 1,2 | PPL WEM Holdings PLC, Sr. Unsecd. Note, Series 144A, 5.375%, 5/1/2021 | 210,038 |
| 130,000 | | PSEG Power LLC, Company Guarantee, 2.50%, 4/15/2013 | 132,244 |
| 200,000 | | PSEG Power LLC, Company Guarantee, 5.125%, 4/15/2020 | 224,132 |
| 30,000 | | Progress Energy, Inc., 7.05%, 3/15/2019 | 37,187 |
| 80,000 | | TECO Finance, Inc., Company Guarantee, 5.15%, 3/15/2020 | 88,215 |
| 250,000 | | UIL Holdings Corp., Sr. Unsecd. Note, 4.625%, 10/1/2020 | 259,491 |
| 100,000 | | Union Electric Co., 6.00%, 4/1/2018 | 118,806 |
| | TOTAL | 3,004,529 |
| | Utility - Natural Gas Distributor – 1.9% | |
| 250,000 | | Atmos Energy Corp., 4.95%, 10/15/2014 | 274,063 |
Annual Shareholder ReportPrincipal
Amount
or Shares | | | Value |
| $25,000 | | Atmos Energy Corp., 5.125%, 1/15/2013 | 26,072 |
| 40,000 | 1,2 | Florida Gas Transmission Co. LLC, Sr. Unsecd. Note, Series 144A, 5.45%, 7/15/2020 | 44,074 |
| 90,000 | | National Fuel Gas Co., Sr. Unsecd. Note, 4.90%, 12/1/2021 | 92,262 |
| 120,000 | | Sempra Energy, Sr. Unsecd. Note, 6.00%, 10/15/2039 | 149,549 |
| 75,000 | | Sempra Energy, Sr. Unsecd. Note, 6.50%, 6/1/2016 | 87,762 |
| | TOTAL | 673,782 |
| | Utility - Natural Gas Pipelines – 6.7% | |
| 75,000 | | Consolidated Natural Gas Co., Series A, 5.00%, 12/1/2014 | 81,840 |
| 75,000 | | Duke Capital Corp., Sr. Note, 6.25%, 2/15/2013 | 78,629 |
| 80,000 | | Enbridge Energy Partners LP, Sr. Unsecd. Note, 5.50%, 9/15/2040 | 89,420 |
| 50,000 | | Enterprise Products Operating LLC, 4.60%, 8/1/2012 | 50,745 |
| 200,000 | | Enterprise Products Operating LLC, Company Guarantee, 5.25%, 1/31/2020 | 221,119 |
| 415,000 | | Enterprise Products Operating LLC, Company Guarantee, Series O, 9.75%, 1/31/2014 | 479,661 |
| 325,000 | | Kinder Morgan Energy Partners LP, Sr. Unsecd. Note, 5.80%, 3/15/2035 | 331,848 |
| 370,000 | | Kinder Morgan Energy Partners LP, Sr. Unsecd. Note, 6.375%, 3/1/2041 | 414,292 |
| 240,000 | | Spectra Energy Capital LLC, Company Guarantee, 5.65%, 3/1/2020 | 266,339 |
| 120,000 | | Williams Partners LP, 5.25%, 3/15/2020 | 133,015 |
| 260,000 | | Williams Partners LP, Sr. Unsecd. Note, 4.125%, 11/15/2020 | 267,226 |
| | TOTAL | 2,414,134 |
| | TOTAL CORPORATE BONDS
(IDENTIFIED COST $30,968,043) | 32,863,175 |
| | Governments/Agencies – 6.2% | |
| | Sovereign – 6.2% | |
| 600,000 | | Brazil, Government of, Sr. Unsecd. Note, 4.875%, 1/22/2021 | 670,500 |
| 200,000 | | Brazil, Government of, Sr. Unsecd. Note, 6.00%, 1/17/2017 | 233,500 |
| 250,000 | | Colombia, Government of, Sr. Unsecd. Note, 4.375%, 7/12/2021 | 268,750 |
| 300,000 | | Panama, Government of, Sr. Unsecd. Note, 5.20%, 1/30/2020 | 339,750 |
| 190,000 | | Peru, Government of, 6.55%, 3/14/2037 | 241,300 |
| 206,000 | | United Mexican States, 6.75%, 9/27/2034 | 268,315 |
| 210,000 | | United Mexican States, Note, 5.625%, 1/15/2017 | 241,500 |
| | TOTAL GOVERNMENTS/AGENCIES
(IDENTIFIED COST $2,068,443) | 2,263,615 |
| | U.S. Treasury – 1.0% | |
| 350,000 | | United States Treasury Note, 0.875%, 11/30/2016
(IDENTIFIED COST $351,114) | 351,108 |
| | MUTUAL FUND – 1.3% | |
| 480,533 | 3,4 | Federated Prime Value Obligations Fund, Institutional Shares, 0.21%
(AT NET ASSET VALUE) | 480,533 |
| | TOTAL INVESTMENTS — 99.0%
(IDENTIFIED COST $33,868,133)5 | 35,958,431 |
| | OTHER ASSETS AND LIABILITIES - NET — 1.0%6 | 362,363 |
| | TOTAL NET ASSETS — 100% | $36,320,794 |
At December 31, 2011, the Fund had the following outstanding futures contracts:
| Description | Number of
Contracts | Notional
Value | Expiration
Date | Unrealized
Depreciation |
| 7 U.S. Treasury Bond 30-Year Short Futures | 11 | $1,592,938 | March 2012 | $(16,680) |
| 7 U.S. Treasury Notes 5-Year Short Futures | 8 | $986,063 | March 2012 | $(4,767) |
| 7 U.S. Treasury Notes 10-Year Short Futures | 13 | $1,704,625 | March 2012 | $(13,044) |
| UNREALIZED DEPRECIATION ON FUTURES CONTRACTS | $(34,491) |
Unrealized Depreciation on Futures Contracts is included in “Other Assets and Liabilities — Net.”
Annual Shareholder Report| 1 | Denotes a restricted security that either: (a) cannot be offered for public sale without first being registered, or being able to take advantage of an exemption from registration, under the Securities Act of 1933; or (b) is subject to a contractual restriction on public sales. At December 31, 2011, these restricted securities amounted to $2,862,049, which represented 7.9% of total net assets. |
| 2 | Denotes a restricted security that may be resold without restriction to “qualified institutional buyers” as defined in Rule 144A under the Securities Act of 1933 and that the Fund has determined to be liquid under criteria established by the Fund's Board of Trustees (the “Trustees”). At December 31, 2011, these liquid restricted securities amounted to $2,862,049, which represented 7.9% of total net assets. |
| 3 | Affiliated holding. |
| 4 | 7-Day net yield. |
| 5 | Also represents cost for federal tax purposes. |
| 6 | Assets, other than investments in securities, less liabilities. See Statement of Assets and Liabilities. |
| 7 | Non-income producing security. |
Note: The categories of investments are shown as a percentage of total net assets at December 31, 2011.
Various inputs are used in determining the value of the Fund's investments. These inputs are summarized in the three broad levels listed below:
Level 1 — quoted prices in active markets for identical securities, including investment companies with daily net asset values, if applicable. Level 2 — other significant observable inputs (including quoted prices for similar securities, interest rates, prepayment speeds, credit risk, etc.). Also includes securities valued at amortized cost. Level 3 — significant unobservable inputs (including the Fund's own assumptions in determining the fair value of investments).The inputs or methodology used for valuing securities are not an indication of the risk associated with investing in those securities.
The following is a summary of the inputs used, as of December 31, 2011, in valuing the Fund's assets carried at fair value:
| Valuation Inputs |
| Level 1 —
Quoted
Prices and
Investments in
Mutual Funds | Level 2 —
Other
Significant
Observable
Inputs | Level 3 —
Significant
Unobservable
Inputs | Total |
| Debt Securities: | | | | |
| Corporate Bonds | $ — | $32,863,175 | $ — | $32,863,175 |
| Governments/Agencies | — | 2,263,615 | — | 2,263,615 |
| U.S. Treasury | — | 351,108 | — | 351,108 |
| Mutual Fund | 480,533 | — | — | 480,533 |
| TOTAL SECURITIES | $480,533 | $35,477,898 | $ — | $35,958,431 |
| OTHER FINANCIAL INSTRUMENTS* | $(34,491) | $ — | $ — | $(34,491) |
| * | Other financial instruments include futures contracts. |
The following acronym is used throughout this portfolio:
| REIT(s) | — Real Estate Investment Trust(s) |
See Notes which are an integral part of the Financial Statements
Annual Shareholder Report Financial Highlights
(For a Share Outstanding Throughout Each Period)
| Year Ended December 31 | 2011 | 2010 | 2009 | 2008 | 2007 |
| Net Asset Value, Beginning of Period | $10.78 | $10.37 | $8.76 | $10.21 | $10.33 |
| Income From Investment Operations: | | | | | |
| Net investment income | 0.57 | 0.57 | 0.59 | 0.58 | 0.62 |
| Net realized and unrealized gain (loss) on investments and futures contracts | 0.18 | 0.41 | 1.61 | (1.44) | (0.10) |
| TOTAL FROM INVESTMENT OPERATIONS | 0.75 | 0.98 | 2.20 | (0.86) | 0.52 |
| Less Distributions: | | | | | |
| Distributions from net investment income | (0.57) | (0.57) | (0.59) | (0.58) | (0.62) |
| Distributions from net realized gain on investments and futures contracts | (0.23) | — | — | (0.01) | (0.02) |
| TOTAL DISTRIBUTIONS | (0.80) | (0.57) | (0.59) | (0.59) | (0.64) |
| Net Asset Value, End of Period | $10.73 | $10.78 | $10.37 | $8.76 | $10.21 |
| Total Return1 | 7.12% | 9.56% | 25.84% | (8.75)% | 5.22% |
| Ratios to Average Net Assets: | | | | | |
| Net expenses2 | 0.00% | 0.00% | 0.00% | 0.00% | 0.00% |
| Net investment income | 5.19% | 5.28% | 6.01% | 6.03% | 6.09% |
| Expense waiver/reimbursement3 | 0.80% | 0.85% | 1.68% | 2.40% | 4.89%4 |
| Supplemental Data: | | | | | |
| Net assets, end of period (000 omitted) | $36,321 | $46,004 | $30,886 | $12,525 | $7,797 |
| Portfolio turnover | 80% | 31% | 42% | 89% | 29% |
| 1 | Based on net asset value. |
| 2 | The Adviser has contractually agreed to reimburse all operating expenses, excluding extraordinary expenses, incurred by the Fund. |
| 3 | This expense decrease is reflected in both the net expense and the net investment income ratios shown above. |
| 4 | Additional information relating to contractual expense waivers, which has no effect on net expenses, net investment income and net assets previously reported, has been provided to conform to the current year presentation. |
See Notes which are an integral part of the Financial Statements
Annual Shareholder Report Statement of Assets and Liabilities
December 31, 2011
| Assets: | | |
| Total investments in securities, at value including $480,533 of investments in an affiliated holding (Note 5) (identified cost $33,868,133) | | $35,958,431 |
| Restricted cash (Note 2) | | 62,100 |
| Income receivable | | 550,207 |
| Receivable for shares sold | | 2,069 |
| TOTAL ASSETS | | 36,572,807 |
| Liabilities: | | |
| Payable for shares redeemed | $38,412 | |
| Payable for daily variation margin | 8,469 | |
| Income distribution payable | 154,285 | |
| Payable to adviser (Note 5) | 1,492 | |
| Payable for Directors'/Trustees' fees | 236 | |
| Payable for auditing fees | 24,475 | |
| Payable for portfolio accounting fees | 13,268 | |
| Accrued expenses | 11,376 | |
| TOTAL LIABILITIES | | 252,013 |
| Net assets for 3,385,681 shares outstanding | | $36,320,794 |
| Net Assets Consist of: | | |
| Paid-in capital | | $34,288,593 |
| Net unrealized appreciation of investments and futures contracts | | 2,055,807 |
| Accumulated net realized loss on investments and futures contracts | | (26,659) |
| Undistributed net investment income | | 3,053 |
| TOTAL NET ASSETS | | $36,320,794 |
| Net Asset Value, Offering Price and Redemption Proceeds Per Share: | | |
| $36,320,794 ÷ 3,385,681 shares outstanding, no par value, unlimited shares authorized | | $10.73 |
See Notes which are an integral part of the Financial Statements
Annual Shareholder Report Statement of Operations
Year Ended December 31, 2011
| Investment Income: | | | |
| Interest | | | $2,225,385 |
| Dividends received from an affiliated holding (Note 5) | | | 1,245 |
| TOTAL INCOME | | | 2,226,630 |
| Expenses: | | | |
| Administrative fee (Note 5) | | $150,000 | |
| Custodian fees | | 8,861 | |
| Transfer and dividend disbursing agent fees and expenses | | 16,940 | |
| Directors'/Trustees' fees | | 2,959 | |
| Auditing fees | | 24,499 | |
| Legal fees | | 6,841 | |
| Portfolio accounting fees | | 75,686 | |
| Share registration costs | | 29,301 | |
| Printing and postage | | 13,235 | |
| Insurance premiums | | 4,083 | |
| Miscellaneous | | 10,003 | |
| TOTAL EXPENSES | | 342,408 | |
| Waiver and Reimbursement (Note 5): | | | |
| Waiver of administrative fee | $(24,570) | | |
| Reimbursement of other operating expenses | (317,838) | | |
| TOTAL WAIVER AND REIMBURSEMENT | | (342,408) | |
| Net expenses | | | — |
| Net investment income | | | 2,226,630 |
| Realized and Unrealized Gain (Loss) on Investments and Futures Contracts: | | | |
| Net realized gain on investments | | | 1,429,447 |
| Net realized loss on futures contracts | | | (606,125) |
| Net change in unrealized appreciation of investments | | | (45,083) |
| Net change in unrealized depreciation of futures contracts | | | 33,824 |
| Net realized and unrealized gain on investments and futures contracts | | | 812,063 |
| Change in net assets resulting from operations | | | $3,038,693 |
See Notes which are an integral part of the Financial Statements
Annual Shareholder Report Statement of Changes in Net Assets
| Year Ended December 31 | 2011 | 2010 |
| Increase (Decrease) in Net Assets | | |
| Operations: | | |
| Net investment income | $2,226,630 | $2,038,568 |
| Net realized gain on investments and futures contracts | 823,322 | 102,085 |
| Net change in unrealized appreciation/depreciation of investments and futures contracts | (11,259) | 1,036,114 |
| CHANGE IN NET ASSETS RESULTING FROM OPERATIONS | 3,038,693 | 3,176,767 |
| Distributions to Shareholders: | | |
| Distributions from net investment income | (2,226,103) | (2,038,582) |
| Distributions from net realized gain on investments and futures contracts | (788,367) | — |
| CHANGE IN NET ASSETS RESULTING FROM DISTRIBUTIONS TO SHAREHOLDERS | (3,014,470) | (2,038,582) |
| Share Transactions: | | |
| Proceeds from sale of shares | 17,427,295 | 21,869,222 |
| Net asset value of shares issued to shareholders in payment of distributions declared | 76,117 | — |
| Cost of shares redeemed | (27,210,376) | (7,890,348) |
| CHANGE IN NET ASSETS RESULTING FROM SHARE TRANSACTIONS | (9,706,964) | 13,978,874 |
| Change in net assets | (9,682,741) | 15,117,059 |
| Net Assets: | | |
| Beginning of period | 46,003,535 | 30,886,476 |
| End of period (including undistributed net investment income of $3,053 and $2,526, respectively) | $36,320,794 | $46,003,535 |
See Notes which are an integral part of the Financial Statements
Annual Shareholder Report Notes to Financial Statements
December 31, 2011
1. ORGANIZATION
Federated Managed Pool Series (the “Trust”) is registered under the Investment Company Act of 1940, as amended (the “Act”), as an open-end management investment company. The Trust consists of four portfolios. The financial statements included herein are only those of Federated Corporate Bond Strategy Portfolio (the “Fund”), a non-diversified portfolio. The financial statements of the other portfolios are presented separately. The assets of each portfolio are segregated and a shareholder's interest is limited to the portfolio in which shares are held. Each portfolio pays its own expenses. The investment objective of the Fund is to provide total return.
2. SIGNIFICANT ACCOUNTING POLICIES
The following is a summary of significant accounting policies consistently followed by the Fund in the preparation of its financial statements. These policies are in conformity with U.S. generally accepted accounting principles (GAAP).
Investment Valuation
In calculating its net asset value (NAV), the Fund generally values investments as follows:
- Fixed-income securities acquired with remaining maturities greater than 60 days are fair valued using price evaluations provided by a pricing service approved by the Trustees.
- Fixed-income securities acquired with remaining maturities of 60 days or less are valued at their cost (adjusted for the accretion of any discount or amortization of any premium), which approximates market value.
- Shares of other mutual funds are valued based upon their reported NAVs.
- Derivative contracts listed on exchanges are valued at their reported settlement or closing price.
- Over-the-counter (OTC) derivative contracts are fair valued using price evaluations provided by a pricing service approved by the Trustees.
- For securities that are fair valued in accordance with procedures established by and under the general supervision of the Trustees, certain factors may be considered such as: the purchase price of the security, information obtained by contacting the issuer, analysis of the issuer's financial statements or other available documents, fundamental analytical data, the nature and duration of restrictions on disposition, the movement of the market in which the security is normally traded and public trading in similar securities of the issuer or comparable issuers.
If the Fund cannot obtain a price or price evaluation from a pricing service for an investment, the Fund may attempt to value the investment based upon the mean of bid and asked quotations or fair value the investment based on price evaluations, from one or more dealers. If any price, quotation, price evaluation or other pricing source is not readily available when the NAV is calculated, the Fund uses the fair value of the investment determined in accordance with the procedures described below. There can be no assurance that the Fund could purchase or sell an investment at the price used to calculate the Fund's NAV.
Fair Valuation and Significant Events Procedures
The Trustees have authorized the use of pricing services to provide evaluations of the current fair value of certain investments for purposes of calculating the NAV. Factors considered by pricing services in evaluating an investment include the yields or prices of investments of comparable quality, coupon, maturity, call rights and other potential prepayments, terms and type, reported transactions, indications as to values from dealers and general market conditions. Some pricing services provide a single price evaluation reflecting the bid-side of the market for an investment (a “bid” evaluation). Other pricing services offer both bid evaluations and price evaluations indicative of a price between the prices bid and asked for the investment (a “mid” evaluation). The Fund normally uses bid evaluations for U.S. Treasury and Agency securities, mortgage-backed securities and municipal securities. The Fund normally uses mid evaluations for other types of fixed-income securities and OTC derivative contracts. In the event that market quotations and price evaluations are not available for an investment, the fair value of the investment is determined in accordance with procedures adopted by the Trustees.
The Trustees also have adopted procedures requiring an investment to be priced at its fair value whenever the Adviser determines that a significant event affecting the value of the investment has occurred between the time as of which the price of the investment would otherwise be determined and the time as of which the NAV is computed. An event is considered significant if there is both an affirmative expectation that the investment's value will change in response to the event and a reasonable basis for quantifying the resulting change in value. Examples of significant events that may occur after the close of the principal market on which a security is traded, or after the time of a price evaluation provided by a pricing service or a dealer, include:
- With respect to securities traded in foreign markets, significant trends in U.S. equity markets or in the trading of foreign securities index futures or options contracts;
- With respect to price evaluations of fixed-income securities determined before the close of regular trading on the NYSE, actions by the Federal Reserve Open Market Committee and other significant trends in U.S. fixed-income markets;
- Political or other developments affecting the economy or markets in which an issuer conducts its operations or its securities are traded; and
- Announcements concerning matters such as acquisitions, recapitalizations, litigation developments, a natural disaster affecting the issuer's operations or regulatory changes or market developments affecting the issuer's industry.
The Trustees have approved the use of a pricing service to determine the fair value of equity securities traded principally in foreign markets when the Adviser determines that there has been a significant trend in the U.S. equity markets or in index futures trading. For other significant events, the Fund may seek to obtain more current quotations or price evaluations from alternative pricing sources. If a reliable alternative pricing source is not available, the Fund will determine the fair value of the investment using another method approved by the Trustees.
Annual Shareholder Report
Repurchase AgreementsThe Fund may invest in repurchase agreements for short-term liquidity purposes. It is the policy of the Fund to require the other party to a repurchase agreement to transfer to the Fund's custodian or sub-custodian eligible securities or cash with a market value (after transaction costs) at least equal to the repurchase price to be paid under the repurchase agreement. The eligible securities are transferred to accounts with the custodian or sub-custodian in which the Fund holds a “securities entitlement” and exercises “control” as those terms are defined in the Uniform Commercial Code. The Fund has established procedures for monitoring the market value of the transferred securities and requiring the transfer of additional eligible securities if necessary to equal at least the repurchase price. These procedures also allow the other party to require securities to be transferred from the account to the extent that their market value exceeds the repurchase price or in exchange for other eligible securities of equivalent market value.
The insolvency of the other party or other failure to repurchase the securities may delay the disposition of the underlying securities or cause the Fund to receive less than the full repurchase price. Under the terms of the repurchase agreement, any amounts received by the Fund in excess of the repurchase price and related transaction costs must be remitted to the other party.
The Fund may enter into repurchase agreements in which eligible securities are transferred into joint trading accounts maintained by the custodian or sub-custodian for investment companies and other clients advised by the Fund's Adviser and its affiliates. The Fund will participate on a pro rata basis with the other investment companies and clients in its share of the securities transferred under such repurchase agreements and in its share of proceeds from any repurchase or other disposition of such securities.
Investment Income, Gains and Losses, Expenses and Distributions
Investment transactions are accounted for on a trade-date basis. Realized gains and losses from investment transactions are recorded on an identified-cost basis. Interest income and expenses are accrued daily. Dividend income and distributions to shareholders are recorded on the ex-dividend date. Distributions of net investment income are declared daily and paid monthly. Non-cash dividends included in dividend income, if any, are recorded at fair value.
Premium and Discount Amortization/Paydown Gains and Losses
All premiums and discounts on fixed-income securities are amortized/accreted using the effective interest rate method. Gains and losses realized on principal payment of mortgage-backed securities (paydown gains and losses) are classified as part of investment income.
Federal Taxes
It is the Fund's policy to comply with the Subchapter M provision of the Internal Revenue Code (the “Code”) and to distribute to shareholders each year substantially all of its income. Accordingly, no provision for federal income tax is necessary. As of and during the year ended December 31, 2011, the Fund did not have a liability for any uncertain tax positions. The Fund recognizes interest and penalties, if any, related to tax liabilities as income tax expense in the Statement of Operations. As of December 31, 2011, tax years 2008 through 2011 remain subject to examination by the Fund's major tax jurisdictions, which include the United States of America and the Commonwealth of Massachusetts.
When-Issued and Delayed Delivery Transactions
The Fund may engage in when-issued or delayed delivery transactions. The Fund records when-issued securities on the trade date and maintains security positions such that sufficient liquid assets will be available to make payment for the securities purchased. Securities purchased on a when-issued or delayed delivery basis are marked to market daily and begin earning interest on the settlement date. Losses may occur on these transactions due to changes in market conditions or the failure of counterparties to perform under the contract.
Futures Contracts
The Fund purchases and sells financial futures contracts to manage cash flows, enhance yield and to potentially reduce transaction costs. Upon entering into a financial futures contract with a broker, the Fund is required to deposit in a segregated account a specified amount of cash or U.S. government securities which is shown as Restricted Cash in the Statement of Assets and Liabilities. Futures contracts are valued daily and unrealized gains or losses are recorded in a “variation margin” account. Daily, the Fund receives from or pays to the broker a specified amount of cash based upon changes in the variation margin account. When a contract is closed, the Fund recognizes a realized gain or loss. Futures contracts have market risks, including the risk that the change in the value of the contract may not correlate with the changes in the value of the underlying securities. There is minimal counterparty risk to the Fund since futures are exchange traded and the exchange's clearing house, as counterparty to all exchange-traded futures, guarantees the futures against default.
Futures contracts outstanding at period end are listed after the Fund's Portfolio of Investments.
The average notional market value of long and short futures contracts held by the Fund throughout the period was $194,471 and $3,050,519, respectively. This is based on amounts held as of each month-end throughout the fiscal period.
Restricted Securities
The Fund may purchase securities which are considered restricted. Restricted securities are securities that either: (a) cannot be offered for public sale without first being registered, or being able to take advantage of an exemption from registration, under the Securities Act of 1933; or (b) are subject to contractual restrictions on public sales. In some cases, when a security cannot be offered for public sale without first being registered, the issuer of the restricted security has agreed to register such securities for resale, at the issuer's expense, either upon demand by the Fund or in connection with another registered offering of the securities. Many such restricted securities may be resold in the secondary market in transactions exempt from registration. Restricted securities may be determined to be liquid under criteria established by the Trustees. The Fund will not incur any registration costs upon such resales. The Fund's restricted securities are valued at the price provided by dealers in the secondary market or, if no market prices are available, at the fair value as determined in accordance with procedures established by and under the general supervision of the Trustees.
Annual Shareholder Report
Additional Disclosure Related to Derivative Instruments| Fair Value of Derivative Instruments |
| Liability |
| Statement of
Assets and
Liabilities
Location | Fair
Value |
Derivatives not accounted for as hedging instruments
under ASC Topic 815 | | |
| Interest rate contracts | Payable for daily
variation margin | $34,491* |
| * | Includes cumulative appreciation/depreciation of futures contracts as reported in the footnotes to the Portfolio of Investments. Only the current day's variation margin is reported within the Statement of Assets and Liabilities. |
The Effect of Derivative Instruments on the Statement of Operations for the Year Ended December 31, 2011
| Amount of Realized Gain or (Loss) on Derivatives Recognized in Income |
| Futures |
| Interest rate contracts | $(606,125) |
| Change in Unrealized Appreciation or (Depreciation) on Derivatives Recognized in Income |
| Futures |
| Interest rate contracts | $33,824 |
Other
The preparation of financial statements in conformity with GAAP requires management to make estimates and assumptions that affect the amounts of assets, liabilities, expenses and revenues reported in the financial statements. Actual results could differ from those estimated.
3. SHARES OF BENEFICIAL INTEREST
The following table summarizes share activity:
| Year Ended December 31 | 2011 | 2010 |
| Shares sold | 1,593,526 | 2,011,820 |
| Shares issued to shareholders in payment of distributions declared | 7,140 | — |
| Shares redeemed | (2,481,311) | (724,426) |
| NET CHANGE RESULTING FROM FUND SHARE TRANSACTIONS | (880,645) | 1,287,394 |
4. FEDERAL TAX INFORMATION
The tax character of distributions as reported on the Statement of Changes in Net Assets for the years ended December 31, 2011 and 2010, was as follows:
| 2011 | 2010 |
| Ordinary income | $2,226,103 | $2,038,582 |
| Long-term capital gains | $788,367 | $ — |
As of December 31, 2011, the components of distributable earnings on a tax basis were as follows:
| Undistributed ordinary income | $3,053 |
| Net unrealized appreciation | $2,090,298 |
| Capital loss deferrals | $(61,150) |
At December 31, 2011, the cost of investments for federal tax purposes was $33,868,133. The net unrealized appreciation of investments for federal tax purposes excluding any unrealized depreciation resulting from futures contracts was $2,090,298. This consists of net unrealized appreciation from investments for those securities having an excess of value over cost of $2,485,756 and net unrealized depreciation from investments for those securities having an excess of cost over value of $395,458.
The Fund used capital loss carryforwards of $49,951 to offset taxable capital gains realized during the year ended December 31, 2011.
Under current tax regulations, capital losses on securities transactions realized after October 31 may be deferred and treated as occurring on the first day of the following fiscal year. As of December 31, 2011, for federal income tax purposes, post October losses of $61,150 were deferred to January 1, 2012.
Annual Shareholder Report
5. INVESTMENT ADVISER FEE AND OTHER TRANSACTIONS WITH AFFILIATESInvestment Adviser Fee
Federated Investment Management Company is the Fund's investment adviser (the “Adviser”). The Adviser provides investment adviser services at no fee, because all eligible investors are: (1) in separately managed or wrap fee programs, who often pay a single aggregate fee to the wrap program sponsor for all costs and expenses of the wrap-fee programs; (2) in certain other separately managed accounts and discretionary investment accounts; or (3) to the extent permitted under applicable law, other Federated funds. The Adviser has contractually agreed to reimburse all operating expenses, excluding extraordinary expenses, incurred by the Fund. For the year ended December 31, 2011, the Adviser reimbursed $317,838 of other operating expenses.
Administrative Fee
Federated Administrative Services (FAS), under the Administrative Services Agreement, provides the Fund with administrative personnel and services. The fee paid to FAS is based on the average aggregate daily net assets of certain Federated funds as specified below:
| Administrative Fee | Average Aggregate Daily Net Assets
of the Federated Funds |
| 0.150% | on the first $5 billion |
| 0.125% | on the next $5 billion |
| 0.100% | on the next $10 billion |
| 0.075% | on assets in excess of $20 billion |
The administrative fee received during any fiscal year shall be at least $150,000 per portfolio and $40,000 per each additional class of Shares. FAS may voluntarily choose to waive any portion of its fee. FAS can modify or terminate this voluntary waiver at any time at its sole discretion. For the year ended December 31, 2011, FAS waived $24,570 of its fee. The net fee paid to FAS was 0.292% of average daily net assets of the Fund. The Fund is currently being charged the minimum administrative fee; therefore the fee as a percentage of average daily net assets is greater than the amounts presented in the chart above. For the year ended December 31, 2011, the Fund's Adviser reimbursed the Fund for any fee paid to FAS.
General
Certain Officers and Trustees of the Fund are Officers and Directors or Trustees of the above companies.
Transactions Involving Affiliated Holdings
Affiliated holdings are mutual funds which are managed by the Adviser or an affiliate of the Adviser. Transactions involving the affiliated holding during the year ended December 31, 2011, were as follows:
| Federated Prime Value
Obligations Fund,
Institutional Shares |
| Balance of Shares Held 12/31/2010 | 937,657 |
| Purchases/Additions | 20,993,605 |
| Sales/Reductions | 21,450,729 |
| Balance of Shares Held 12/31/2011 | 480,533 |
| Value | $480,533 |
| Dividend Income | $1,245 |
6. Investment TRANSACTIONS
Purchases and sales of investments, excluding long-term U.S. government securities and short-term obligations, for the year ended December 31, 2011, were as follows:
| Purchases | $13,817,497 |
| Sales | $23,050,128 |
7. LINE OF CREDIT
The Fund participates in a $100,000,000 unsecured, uncommitted revolving line of credit (LOC) agreement with PNC Bank. The LOC was made available for extraordinary or emergency purposes, primarily for financing redemption payments. Borrowings are charged interest at a rate offered to the Fund by PNC Bank at the time of the borrowing. As of December 31, 2011, there were no outstanding loans. During the year ended December 31, 2011, the Fund did not utilize the LOC.
8. INTERFUND LENDING
Pursuant to an Exemptive Order issued by the Securities and Exchange Commission, the Fund, along with other funds advised by subsidiaries of Federated Investors, Inc., may participate in an interfund lending program. This program provides an alternative credit facility allowing the Fund to borrow from other participating affiliated funds. As of December 31, 2011, there were no outstanding loans. During the year ended December 31, 2011, the program was not utilized.
Annual Shareholder Report
9. RECENT ACCOUNTING PRONOUNCEMENTSIn April 2011, the Financial Accounting Standards Board (FASB) released Accounting Standards Update (ASU) No. 2011-03, “Reconsideration of Effective Control for Repurchase Agreements.” This ASU amends FASB Accounting Standards Codification (ASC) Topic 860, “Transfers and Servicing”; specifically the criteria required to determine whether a repurchase agreement and similar agreements should be accounted for as sales of financial assets or secured borrowings with commitments. This ASU is effective for fiscal years and interim periods beginning after December 15, 2011. Management has concluded that the adoption of ASU No. 2011-03 is not expected to have a material impact on the Fund's financial statements and the accompanying notes, net assets or results of operations.
In addition, in May 2011, FASB released ASU No. 2011-04, “Amendments to Achieve Common Fair Value Measurement and Disclosure Requirements in U.S. GAAP and IFRSs.” This ASU amends FASB ASC Topic 820, “Fair Value Measurement,” to establish common requirements for measuring fair value and for disclosing information about fair value measurements in accordance with GAAP. This ASU is effective for fiscal years and interim periods beginning after December 15, 2011. Management has concluded that the adoption of ASU No. 2011-04 is not expected to have a material impact on the Fund's financial statements and the accompanying notes.
10. FEDERAL TAX INFORMATION (UNAUDITED)
For the year ended December 31, 2011, the amount of long-term capital gains designated by the Fund was $788,367.
Annual Shareholder Report Report of Independent Registered Public Accounting Firm
TO THE BOARD OF Trustees of Federated Managed Pool Series AND SHAREHOLDERS OF Federated Corporate Bond Strategy Portfolio:
We have audited the accompanying statement of assets and liabilities of Federated Corporate Bond Strategy Portfolio (the “Fund”) (one of the portfolios constituting Federated Managed Pool Series), including the portfolio of investments, as of December 31, 2011, and the related statement of operations for the year then ended, the statement of changes in net assets for each of the two years in the period then ended and the financial highlights for each of the five years in the period then ended. These financial statements and financial highlights are the responsibility of the Fund's management. Our responsibility is to express an opinion on these financial statements and financial highlights based on our audits.
We conducted our audits in accordance with standards of the Public Company Accounting Oversight Board (United States). Those standards require that we plan and perform the audit to obtain reasonable assurance about whether the financial statements and financial highlights are free of material misstatement. We were not engaged to perform an audit of the Fund's internal control over financial reporting. Our audits included consideration of internal control over financial reporting as a basis for designing audit procedures that are appropriate in the circumstances, but not for the purpose of expressing an opinion on the effectiveness of the Fund's internal control over financial reporting. Accordingly, we express no such opinion. An audit also includes examining, on a test basis, evidence supporting the amounts and disclosures in the financial statements and financial highlights, assessing the accounting principles used and significant estimates made by management, and evaluating the overall financial statement presentation. Our procedures included confirmation of securities owned as of December 31, 2011, by correspondence with the custodian and others. We believe that our audits provide a reasonable basis for our opinion.
In our opinion, the financial statements and financial highlights referred to above present fairly, in all material respects, the financial position of the Federated Corporate Bond Strategy Portfolio, a portfolio of Federated Managed Pool Series, at December 31, 2011, the results of its operations for the year then ended, the changes in its net assets for each of the two years in the period then ended, and the financial highlights for each of the five years in the period then ended, in conformity with U.S. generally accepted accounting principles.
Boston, Massachusetts
February 22, 2012
Annual Shareholder Report Shareholder Expense Example (unaudited)
As a shareholder of the Fund, you incur ongoing costs, including to the extent applicable, management fees, distribution (12b-1) fees and/or shareholder services fees and other Fund expenses. This Example is intended to help you to understand your ongoing costs (in dollars) of investing in the Fund and to compare these costs with the ongoing costs of investing in other mutual funds. It is based on an investment of $1,000 invested at the beginning of the period and held for the entire period from July 1, 2011 to December 31, 2011.
ACTUAL EXPENSES
The first section of the table below provides information about actual account values and actual expenses. You may use the information in this section, together with the amount you invested, to estimate the expenses that you incurred over the period. Simply divide your account value by $1,000 (for example, an $8,600 account value divided by $1,000 = 8.6), then multiply the result by the number in the first section under the heading entitled “Expenses Paid During Period” to estimate the expenses attributable to your investment during this period.
HYPOTHETICAL EXAMPLE FOR COMPARISON PURPOSES
The second section of the table below provides information about hypothetical account values and hypothetical expenses based on the Fund's actual expense ratio and an assumed rate of return of 5% per year before expenses, which is not the Fund's actual return. Thus, you should not use the hypothetical account values and expenses to estimate the actual ending account balance or your expenses for the period. Rather, these figures are required to be provided to enable you to compare the ongoing costs of investing in the Fund with other funds. To do so, compare this 5% hypothetical example with the 5% hypothetical examples that appear in the shareholder reports of the other funds.
Please note that the expenses shown in the table are meant to highlight your ongoing costs only. Therefore, the second section of the table is useful in comparing ongoing costs only, and will not help you determine the relative total costs of owning different funds.
| Beginning
Account Value
7/1/2011 | Ending
Account Value
12/31/2011 | Expenses Paid
During Period1 |
| Actual | $1,000 | $1,035.30 | $0.00 |
| Hypothetical (assuming a 5% return before expenses) | $1,000 | $1,025.21 | $0.00 |
| 1 | Expenses are equal to the Fund's annualized net expense ratio of 0.00%, multiplied by the average account value over the period, multiplied by 184/365 (to reflect the one-half-year period). Federated Investment Management Company has contractually agreed to reimburse all operating expenses, excluding extraordinary expenses, incurred by the Fund. This agreement has no fixed term. |
Annual Shareholder Report Board of Trustees and Trust Officers
The Board of Trustees is responsible for managing the Trust's business affairs and for exercising all the Trust's powers except those reserved for the shareholders. The following tables give information about each Trustee and the senior officers of the Fund. Where required, the tables separately list Trustees who are “interested persons” of the Fund (i.e., “Interested” Trustees) and those who are not (i.e., “Independent” Trustees). Unless otherwise noted, the address of each person listed is Federated Investors Tower, 1001 Liberty Avenue, Pittsburgh, PA 15222. The address of all Independent Trustees listed is 4000 Ericsson Drive, Warrendale, PA 15086-7561; Attention: Mutual Fund Board. As of December 31, 2011, the Trust comprised four portfolio(s), and the Federated Fund Family consisted of 43 investment companies (comprising 134 portfolios). Unless otherwise noted, each Officer is elected annually. Unless otherwise noted, each Trustee oversees all portfolios in the Federated Fund Family and serves for an indefinite term. The Fund's Statement of Additional Information includes additional information about Trust Trustees and is available, without charge and upon request, by calling 1-800-341-7400.
Interested Trustees Background
Name
Birth Date
Positions Held with Trust
Date Service Began | Principal Occupation(s) for Past Five Years,
Other Directorships Held and Previous Position(s) |
John F. Donahue*
Birth Date: July 28, 1924
Trustee
Began serving: November 2005 | Principal Occupations: Director or Trustee of the Federated Fund Family; Chairman and Director, Federated Investors, Inc.; Chairman of the Federated Fund Family's Executive Committee.
Previous Positions: Chairman of the Federated Fund Family; Trustee, Federated Investment Management Company; Chairman and Director, Federated Investment Counseling. |
J. Christopher Donahue*
Birth Date: April 11, 1949
President and Trustee
Began serving: October 2005 | Principal Occupations: Principal Executive Officer and President of the Federated Fund Family; Director or Trustee of some of the Funds in the Federated Fund Family; President, Chief Executive Officer and Director, Federated Investors, Inc.; Chairman and Trustee, Federated Investment Management Company; Trustee, Federated Investment Counseling; Chairman and Director, Federated Global Investment Management Corp.; Chairman, Federated Equity Management Company of Pennsylvania and Passport Research, Ltd. (investment advisory subsidiary of Federated); Trustee, Federated Shareholder Services Company; Director, Federated Services Company.
Previous Positions: President, Federated Investment Counseling; President and Chief Executive Officer, Federated Investment Management Company, Federated Global Investment Management Corp. and Passport Research, Ltd. |
| * | Family relationships and reasons for “interested” status: John F. Donahue is the father of J. Christopher Donahue; both are “interested” due to their beneficial ownership of shares of Federated Investors, Inc. and the positions they hold with Federated and its subsidiaries. |
INDEPENDENT Trustees Background
Name
Birth Date
Positions Held with Trust
Date Service Began | Principal Occupation(s) for Past Five Years,
Other Directorships Held, Previous Position(s) and Qualifications |
Nicholas P. Constantakis, CPA
Birth Date: September 3, 1939
Trustee
Began serving: November 2005 | Principal Occupation: Director or Trustee of the Federated Fund Family.
Other Directorship Held: Director, Chairman of the Audit Committee, and member of the Compensation Committee, Michael Baker Corporation (architecture, engineering and construction services).
Previous Position: Partner, Andersen Worldwide SC.
Qualifications: Public accounting and director experience. |
John F. Cunningham
Birth Date: March 5, 1943
Trustee
Began serving: November 2005 | Principal Occupation: Director or Trustee of the Federated Fund Family.
Other Directorships Held: Chairman, President and Chief Executive Officer, Cunningham & Co., Inc. (strategic business consulting); Trustee Associate, Boston College.
Previous Positions: Director, Redgate Communications and EMC Corporation (computer storage systems); Chairman of the Board and Chief Executive Officer, Computer Consoles, Inc.; President and Chief Operating Officer, Wang Laboratories; Director, First National Bank of Boston; Director, Apollo Computer, Inc.
Qualifications: Business management and director experience. |
Annual Shareholder ReportName
Birth Date
Positions Held with Trust
Date Service Began | Principal Occupation(s) for Past Five Years,
Other Directorships Held, Previous Position(s) and Qualifications |
Maureen Lally-Green
Birth Date: July 5, 1949
Trustee
Began serving: August 2009 | Principal Occupations: Director or Trustee of the Federated Fund Family; Director, Office of Church Relations, Diocese of Pittsburgh; Adjunct Professor of Law, Duquesne University School of Law.
Other Directorships Held: Director, Auberle; Trustee, St. Francis University; Director, Ireland Institute of Pittsburgh; Director, UPMC Mercy Hospital; Regent, St. Vincent Seminary; Director, Epilepsy Foundation of Western and Central Pennsylvania; Director, Saint Thomas More Society, Allegheny County.
Previous Position: Pennsylvania Superior Court Judge.
Qualifications: Legal and director experience. |
Peter E. Madden
Birth Date: March 16, 1942
Trustee
Began serving: November 2005 | Principal Occupation: Director or Trustee, and Chairman of the Board of Directors or Trustees, of the Federated Fund Family.
Previous Positions: Representative, Commonwealth of Massachusetts General Court; President, Chief Operating Officer and Director, State Street Bank and Trust Company and State Street Corporation (retired); Director, VISA USA and VISA International; Chairman and Director, Massachusetts Bankers Association; Director, Depository Trust Corporation; Director, The Boston Stock Exchange.
Qualifications: Business management, mutual fund services and director experience. |
Charles F. Mansfield, Jr.
Birth Date: April 10, 1945
Trustee
Began serving: November 2005 | Principal Occupations: Director or Trustee of the Federated Fund Family; Management Consultant.
Previous Positions: Chief Executive Officer, PBTC International Bank; Partner, Arthur Young & Company (now Ernst & Young LLP); Chief Financial Officer of Retail Banking Sector, Chase Manhattan Bank; Senior Vice President, HSBC Bank USA (formerly Marine Midland Bank); Vice President, Citibank; Assistant Professor of Banking and Finance, Frank G. Zarb School of Business, Hofstra University; Executive Vice President, DVC Group, Inc. (marketing, communications and technology).
Qualifications: Banking, business management, education and director experience. |
Thomas M. O'Neill
Birth Date: June 14, 1951
Trustee
Began serving: October 2006 | Principal Occupations: Director or Trustee, Vice Chairman of the Audit Committee of the Federated Fund Family; Sole Proprietor, Navigator Management Company (investment and strategic consulting).
Other Directorships Held: Board of Overseers, Children's Hospital of Boston; Visiting Committee on Athletics, Harvard College; Board of Directors, Medicines for Humanity; Board of Directors, The Golisano Children's Museum of Naples, Florida.
Previous Positions: Chief Executive Officer and President, Managing Director and Chief Investment Officer, Fleet Investment Advisors; President and Chief Executive Officer, Aeltus Investment Management, Inc.; General Partner, Hellman, Jordan Management Co., Boston, MA; Chief Investment Officer, The Putnam Companies, Boston, MA; Credit Analyst and Lending Officer, Fleet Bank; Director and Consultant, EZE Castle Software (investment order management software); Director, Midway Pacific (lumber).
Qualifications: Business management, mutual fund, director and investment experience. |
John S. Walsh
Birth Date: November 28, 1957
Trustee
Began serving: November 2005 | Principal Occupations: Director or Trustee, Chairman of the Audit Committee of the Federated Fund Family; President and Director, Heat Wagon, Inc. (manufacturer of construction temporary heaters); President and Director, Manufacturers Products, Inc. (distributor of portable construction heaters); President, Portable Heater Parts, a division of Manufacturers Products, Inc.
Previous Position: Vice President, Walsh & Kelly, Inc.
Qualifications: Business management and director experience. |
OFFICERS
Name
Birth Date
Address
Positions Held with Trust
Date Service Began | Principal Occupation(s) for Past Five Years
and Previous Position(s) |
John W. McGonigle
Birth Date: October 26, 1938
EXECUTIVE VICE PRESIDENT AND SECRETARY
Began serving: October 2005 | Principal Occupations: Executive Vice President and Secretary of the Federated Fund Family; Vice Chairman, Executive Vice President, Secretary and Director, Federated Investors, Inc.
Previous Positions: Trustee, Federated Investment Management Company and Federated Investment Counseling; Director, Federated Global Investment Management Corp., Federated Services Company and Federated Securities Corp. |
Richard A. Novak
Birth Date: December 25, 1963
TREASURER
Began serving: January 2006 | Principal Occupations: Principal Financial Officer and Treasurer of the Federated Fund Family; Senior Vice President, Federated Administrative Services; Financial and Operations Principal for Federated Securities Corp., Edgewood Services, Inc. and Southpointe Distribution Services, Inc.
Previous Positions: Controller of Federated Investors, Inc.; Vice President, Finance of Federated Services Company; held various financial management positions within The Mercy Hospital of Pittsburgh; Auditor, Arthur Andersen & Co. |
Annual Shareholder ReportName
Birth Date
Address
Positions Held with Trust
Date Service Began | Principal Occupation(s) for Past Five Years
and Previous Position(s) |
Richard B. Fisher
Birth Date: May 17, 1923
VICE CHAIRMAN
Began serving: October 2005 | Principal Occupations: Vice Chairman or Vice President of some of the Funds in the Federated Fund Family; Vice Chairman, Federated Investors, Inc.; Chairman, Federated Securities Corp.
Previous Positions: President and Director or Trustee of some of the Funds in the Federated Fund Family; Executive Vice President, Federated Investors, Inc.; Director and Chief Executive Officer, Federated Securities Corp. |
Brian P. Bouda
Birth Date: February 28, 1947
CHIEF COMPLIANCE OFFICER AND SENIOR VICE PRESIDENT
Began serving: October 2005 | Principal Occupations: Senior Vice President and Chief Compliance Officer of the Federated Fund Family; Vice President and Chief Compliance Officer of Federated Investors, Inc. and Chief Compliance Officer of its subsidiaries. Mr. Bouda joined Federated in 1999 and is a member of the American Bar Association and the State Bar Association of Wisconsin. |
Robert J. Ostrowski
Birth Date: April 26, 1963
CHIEF INVESTMENT OFFICER
Began serving: September 2006 | Principal Occupations: Robert J. Ostrowski joined Federated in 1987 as an Investment Analyst and became a Portfolio Manager in 1990. He was named Chief Investment Officer of taxable fixed-income products in 2004 and also serves as a Senior Portfolio Manager. He has been a Senior Vice President of the Fund's Adviser since 1997. Mr. Ostrowski has received the Chartered Financial Analyst designation. He received his M.S. in Industrial Administration from Carnegie Mellon University. |
Joseph M. Balestrino
Birth Date: November 3, 1954
VICE PRESIDENT
Began serving: October 2005 | Principal Occupations: Joseph M. Balestrino is Vice President of the Trust. Mr. Balestrino joined Federated in 1986 and has been a Senior Portfolio Manager and Senior Vice President of the Fund's Adviser since 1998. He was a Portfolio Manager and a Vice President of the Fund's Adviser from 1995 to 1998. Mr. Balestrino served as a Portfolio Manager and an Assistant Vice President of the Adviser from 1993 to 1995. Mr. Balestrino has received the Chartered Financial Analyst designation and holds a Master's Degree in Urban and Regional Planning from the University of Pittsburgh. |
Annual Shareholder Report Evaluation and Approval of Advisory Contract – May 2011
Federated corporate bond strategy portfolio (the “Fund”)
The Fund's Board reviewed the Fund's investment advisory contract at meetings held in May 2011. The Board's decision regarding the contract reflects the exercise of its business judgment on whether to continue the existing arrangements. The Fund is distinctive in that it: is used to implement particular investment strategies that are offered to investors in certain separately managed or wrap fee accounts or programs or certain other discretionary investments accounts; and may also be offered to other Federated funds. In addition, the Adviser does not charge an investment advisory fee for its services although it or its affiliates may receive compensation for managing assets invested in the Fund.
The Federated Funds' Board had previously appointed a Senior Officer, whose duties include specified responsibilities relating to the process by which advisory fees are to be charged to a Federated fund. The Senior Officer has the authority to retain consultants, experts, or staff as may be reasonably necessary to assist in the performance of his duties, reports directly to the Board, and may be terminated only with the approval of a majority of the independent members of the Board. The Senior Officer prepared and furnished to the Board an independent, written evaluation that covered topics discussed below (the “Evaluation”). The Board considered that Evaluation, along with other information, in deciding to approve the advisory contract.
As previously noted, the Adviser does not charge an investment advisory fee for its services; however, the Board did consider compensation and benefits received by the Adviser, including fees received for services provided to the Fund by other entities in the Federated organization and research services received by the Adviser from brokers that execute Federated fund trades. The Board is also familiar with and considered judicial decisions concerning allegedly excessive investment advisory fees which have indicated that the following factors may be relevant to an Adviser's fiduciary duty with respect to its receipt of compensation from a fund: the nature and quality of the services provided by the Adviser, including the performance of the Fund; the Adviser's cost of providing the services; the extent to which the Adviser may realize “economies of scale” as the Fund grows larger; any indirect benefits that may accrue to the Adviser and its affiliates as a result of the Adviser's relationship with the Fund; performance and expenses of comparable funds; and the extent to which the independent Board members are fully informed about all facts the Board deems relevant bearing on the Adviser's services and fees. The Board further considered management fees (including any components thereof) charged to institutional and other clients of the Adviser for what might be viewed as like services, and the cost to the Adviser and its affiliates of supplying services pursuant to the management fee agreements, excluding any intra-corporate profit and profit margins of the Adviser and its affiliates for supplying such services. The Board was aware of these factors and was guided by them in its review of the Fund's advisory contract to the extent it considered them to be appropriate and relevant, as discussed further below.
The Board considered and weighed these circumstances in light of its substantial accumulated experience in governing the Fund and working with Federated on matters relating to the Federated funds, and was assisted in its deliberations by independent legal counsel. Throughout the year, the Board has requested and received substantial and detailed information about the Fund and the Federated organization that was in addition to the extensive materials that comprise and accompany the Senior Officer's Evaluation. Federated provided much of this information at each regular meeting of the Board, and furnished additional information in connection with the particular meeting at which the Board's formal review of the advisory contract occurred. Between regularly scheduled meetings, the Board has received information on particular matters as the need arose. Thus, the Board's consideration of the advisory contract included review of the Senior Officer's Evaluation, accompanying data and additional information covering such matters as: the Adviser's investment philosophy, personnel and processes; investment and operating strategies; the Fund's short- and long-term performance, and comments on the reasons for performance; the Fund's investment objectives; the Fund's overall expense structure; the use and allocation of brokerage commissions derived from trading the Fund's portfolio securities (if any); and the nature, quality and extent of the advisory and other services provided to the Fund by the Adviser and its affiliates. The Board also considered the preferences and expectations of Fund shareholders and their relative sophistication; the continuing state of competition in the mutual fund industry and market practices; the Fund's relationship to the Federated family of funds which include a comprehensive array of funds with different investment objectives, policies and strategies which are available for exchange without the incurrence of additional sales charges; compliance and audit reports concerning the Federated funds and the Federated companies that service them (including communications from regulatory agencies), as well as Federated's responses to any issues raised therein; and relevant developments in the mutual fund industry and how the Federated funds and/or Federated are responding to them. The Board's evaluation process is evolutionary. The criteria considered and the emphasis placed on relevant criteria change in recognition of changing circumstances in the mutual fund marketplace.
Because the Adviser does not charge the Fund an investment advisory fee, the Fund's Board does not consider fee comparisons to other mutual funds or other institutional or separate accounts to be relevant.
Annual Shareholder Report
The Board also received financial information about Federated, including information regarding the compensation and benefits Federated derived from its relationships with the Federated funds. Because the Adviser does not charge an investment advisory fee for its services, this information generally covered fees received by Federated's subsidiaries for providing other services to the Federated funds under separate contracts (e.g., for serving as the Federated funds' administrator). The information also detailed any indirect benefit Federated may derive from its receipt of research services from brokers who execute Federated fund trades. In addition, the Board considered the fact that, in order for a fund to be competitive in the marketplace, Federated and its affiliates frequently waive non-advisory fees and/or reimburse other expenses and have disclosed to fund investors and/or indicated to the Board their intention to do so in the future, where appropriate. Moreover, the Board receives regular reporting as to the institution or elimination of these voluntary waivers.The Board and the Senior Officer also reviewed information compiled by Federated comparing profitability information for Federated to other publicly held fund management companies. In this regard, the Senior Officer noted the limited availability of such information, but nonetheless concluded that Federated's profit margins did not appear to be excessive and the Board agreed.
The Senior Officer noted that, considering the totality of the circumstances, and all of the factors referenced within his Evaluation, he had concluded that, subject to comments and recommendations made within his Evaluation, his observations and the information accompanying the Evaluation supported a finding by the Board that the management fees for each of the funds are reasonable and that Federated appeared to provide appropriate administrative services to the Fund for the fees paid. The Board concluded that the nature, quality and scope of services provided the Fund by the Adviser and its affiliates were satisfactory.
The Board based its decision to approve the advisory contract on the totality of the circumstances and relevant factors and with a view to past and future long-term considerations. Not all of the factors and considerations identified above were necessarily relevant to the Fund, nor did the Board consider any one of them to be determinative. In particular, due to the unusual nature of the Fund as primarily an internal product with no advisory fee, the Board does not consider the assessment of whether economies of scale would be realized if the Fund were to grow to some sufficient size to be relevant. With respect to the factors that were relevant, the Board's decision to approve the contract reflects its determination that Federated's performance and actions provided a satisfactory basis to support the decision to continue the existing arrangement.
Annual Shareholder Report Voting Proxies on Fund Portfolio Securities
A description of the policies and procedures that the Fund uses to determine how to vote proxies, if any, relating to securities held in the Fund's portfolio, as well as a report on “Form N-PX” of how the Fund voted any such proxies during the most recent 12-month period ended June 30, are available, without charge and upon request, by calling 1-800-341-7400. These materials are also available at the SEC's website at www.sec.gov.
Quarterly Portfolio Schedule
The Fund files with the SEC a complete schedule of its portfolio holdings, as of the close of the first and third quarters of its fiscal year, on “Form N-Q.” These filings are available on the SEC's website at www.sec.gov and may be reviewed and copied at the SEC's Public Reference Room in Washington, DC. (Call 1-800-SEC-0330 for information on the operation of the Public Reference Room.)
Annual Shareholder ReportMutual funds are not bank deposits or obligations, are not guaranteed by any bank and are not insured or guaranteed by the U.S. government, the Federal Deposit Insurance Corporation, the Federal Reserve Board or any other government agency. Investment in mutual funds involves investment risk, including the possible loss of principal.
This Report is authorized for distribution to prospective investors only when preceded or accompanied by the Fund's Prospectus, which contains facts concerning its objective and policies, management fees, expenses and other information.
Federated Corporate Bond Strategy Portfolio
Federated Investors Funds
4000 Ericsson Drive
Warrendale, PA 15086-7561
Contact us at FederatedInvestors.com
or call 1-800-341-7400.
Federated Securities Corp., Distributor
CUSIP 31421P100
36217 (2/12)
Federated is a registered trademark of Federated Investors, Inc.
2012 © Federated Investors, Inc.
Federated High-Yield Strategy Portfolio
A Portfolio of Federated Managed Pool SeriesANNUAL SHAREHOLDER REPORT
December 31, 2011
Ticker: FHYSX
MANAGEMENT'S DISCUSSION OF FUND PERFORMANCE
PORTFOLIO OF INVESTMENTS SUMMARY TABLE
PORTFOLIO OF INVESTMENTS
FINANCIAL HIGHLIGHTS
STATEMENT OF ASSETS AND LIABILITIES
STATEMENT OF OPERATIONS
STATEMENT OF CHANGES IN NET ASSETS
NOTES TO FINANCIAL STATEMENTS
REPORT OF INDEPENDENT REGISTERED PUBLIC ACCOUNTING FIRM
SHAREHOLDER EXPENSE EXAMPLE
FINANCIAL STATEMENTS FOR HIGH YIELD BOND PORTFOLIO
BOARD OF TRUSTEES AND TRUST OFFICERS
EVALUATION AND APPROVAL OF ADVISORY CONTRACT
VOTING PROXIES ON FUND PORTFOLIO SECURITIES
QUARTERLY PORTFOLIO SCHEDULE
Management's Discussion of Fund Performance (unaudited)
The Fund's total return, based on net asset value, for the 12-month reporting period ended December 31, 2011, was 6.09%. The total return of the Barclays Capital U.S. Corporate High Yield 2% Issuer Capped Index (BCHY2%ICI),1 the Fund's broad-based securities market index, was 4.96% during the same period. The Fund's total return for the most recently completed fiscal year reflected actual cash flows, transaction costs and other expenses which were not reflected in the total return of the BCHY2%ICI.
MARKET OVERVIEW
The high-yield market endured significant month-to-month volatility over the reporting period. Two major uncertainty factors drove the volatility. First, there was substantial uncertainty regarding the strength of the U.S. economy. While the reporting period started and ended with some optimism that a path of slow but sustainable economic growth was the most likely outcome, the middle part of the period was characterized by concerns of faltering growth and a potential “double-dip” recession. Second, considerable uncertainty was generated by government debt concerns in the euro zone. At the beginning of the reporting period, these concerns were focused mainly on Greece and Portugal. However, by the end of the reporting period, concerns had spread to Italy, Spain and France, along with concerns about slow economic growth for the euro zone as a whole due to fiscal austerity plans in many countries. Despite these macro uncertainties, the one constant from a high-yield perspective was the overall strength in corporate credit conditions. Strong earnings, large cash balances, solid balance sheets and a desire to reduce overall financial risk characterized corporate credit markets. For example, the default rate as calculated by the Altman & Kuehne High Yield Bond Default and Return Report (New York University) was 0.66% for the first nine months of 2011 after totaling just 1.13% for all of 2010. Both of these rates are well below the 3.56% average annual default rate between 1978 and 2010. However, the overall macro concerns tended to offset the positive of corporate credit conditions, as shown by a widening in the yield spread between high-yield bonds and U.S. Treasury securities — according to the Credit Suisse High Yield Bond Index,2 the spread increased from 571 basis points on December 31, 2010, to 728 basis points on December 31, 2011.
Within the high-yield market,3 major industry sectors that substantially outperformed the overall BCHY2%ICI included: Media – Cable, Natural Gas Utilities, Food & Beverage, Energy and Lodging. Major industry sectors that substantially underperformed the overall BCHY2%ICI included: Home Construction, Transportation, Wireless Communications, Consumer Products and Industrial – Other. From a ratings quality perspective, the higher-quality, more interest rate sensitive “BB” rated sector led the way with a total return of 6.81%, followed by the “B” rated sector at 5.41% and the lower-quality “CCC” rated sector well behind at 1.18%, during this period.
Fund Performance
The Fund outperformed the BCHY2%ICI for the reporting period. The main reason for the Fund's outperformance was outstanding security selection which more than offset an overweight position, relative to the BCHY2%ICI, in the poor performing “CCC” rated quality sector and an underweight position in the strong performing “BB” rated quality sector. Security selection was particularly strong in the Gaming, Paper, Services, Technology, Transportation and Wireless Telecommunication sectors. Strong security selection in the Consumer Products and Media – Non Cable sectors more than offset overweight positions in these weak performing industry sectors, while strong security selection in the Energy sector more than offset an underweight position in this strong performing industry sector. The Fund had an underweight position, relative to the BCHY2%ICI, in the weak performing Home Construction sector which also aided Fund performance. Specific Fund holdings that substantially outperformed the BCHY2%ICI included: Petrohawk, Universal City Development, Diversey Inc., Nalco, Sealed Air, Brigham Exploration and Macy's.
The Fund's performance was negatively affected by poor security selection in the Automotive and Electric Utility sectors. Also, an overweight position, relative to the BCHY2%ICI, in the poor performing Industrial – Other sector and an underweight position in the strong performing Wireline and Electric Utility sectors hindered performance. Specific Fund holdings that substantially underperformed the BCHY2%ICI included: Aquilex Holdings, Texas Competitive Electric, American Standard, ATP Oil and Gas, Momentive Performance Materials, Exide Technologies and Houghton Mifflin.
| 1 | The BCHY2%ICI is the 2% Issuer Cap component of the Barclay's Capital U.S. Corporate High Yield Index (BCHYI). The BCHYI is an index that covers the universe of fixed-rate, noninvestment-grade debt. Pay-in-kind (PIK) bonds, Eurobonds and debt issues from countries designated as emerging markets (e.g., Argentina, Brazil, Venezuela, etc.) are excluded, but Canadian and global bonds (SEC registered) of issuers in non-EMG countries are included. Original issue zeroes, step-up coupon structures, and 144-As are also included. The index is unmanaged and, unlike the Fund, not affected by cashflows. It is not possible to invest directly in an index. |
| 2 | Credit Suisse High Yield Bond Index serves as a benchmark to evaluate the performance of low quality bonds. Low quality is defined as those bonds in the range from “BB” to “CCC” and defaults. The index is unmanaged, and it is not possible to invest directly in an index. |
| 3 | High-yield, lower-rated securities generally entail greater market, credit and liquidity risks than investment-grade securities and may include higher volatility and higher risk of default. |
Annual Shareholder Report1
FUND PERFORMANCE AND GROWTH OF A $10,000 INVESTMENT
The Average Annual Total Return table below shows returns averaged over the stated periods. The graph below illustrates the hypothetical investment of $10,0001 in the Federated High-Yield Strategy Portfolio (the “Fund”) from December 24, 2008 (start of performance) to December 31, 2011, compared to the Barclays Capital U.S. Corporate High Yield 2% Issuer Capped Index (BCHY2%ICI).2
| Average Annual Total Returns for the Period Ended 12/31/2011 | |
| 1 Year | 6.09% |
| Start of Performance* | 24.54% |
| * | The Fund's start of performance date was December 24, 2008. |
Performance data quoted represents past performance which is no guarantee of future results. Investment return and principal value will fluctuate so that an investor's shares, when redeemed, may be worth more or less than their original cost. Mutual fund performance changes over time and current performance may be lower or higher than what is stated. For current to the most recent month-end performance and after-tax returns, visit FederatedInvestors.com or call 1-800-341-7400. Returns shown do not reflect the deduction of taxes that a shareholder would pay on Fund distributions or the redemption of Fund shares. Mutual funds are not obligations of or guaranteed by any bank and are not federally insured.
Growth of a $10,000 Investment
| Federated High Yield Strategy Portfolio | C000030209 | BCHY2%ICI |
| 12/24/2008 | 10,000 | 10,000 |
| 12/31/2008 | 10,448 | 10,501 |
| 12/31/2009 | 15,901 | 16,672 |
| 12/31/2010 | 18,296 | 19,162 |
| 12/31/2011 | 19,411 | 20,113 |
41 graphic description end -->
| 1 | The Fund's performance assumes the reinvestment of all dividends and distributions. The BCHY2%ICI has been adjusted to reflect reinvestment of dividends on securities in the index. |
| 2 | The BCHY2%ICI is not adjusted to reflect sales charges, expense or other fees that the Securities and Exchange Commission requires to be reflected in the Fund's performance. The index is unmanaged and, unlike the Fund, is not affected by cash flows. It is not possible to invest directly in an index. |
Annual Shareholder Report2
Portfolio of Investments Summary Table (unaudited)
At December 31, 2011, the Fund's index classification1 was as follows:
| Index Classification | Percentage of
Total Net Assets2 |
| Technology | 12.0% |
| Health Care | 9.9% |
| Media — Non-cable | 7.9% |
| Energy | 6.5% |
| Automotive | 6.4% |
| Financial Institutions | 6.1% |
| Retailers | 4.6% |
| Food & Beverage | 4.4% |
| Gaming | 4.3% |
| Consumer Products | 4.1% |
| Industrial — Other | 4.0% |
| Packaging | 3.9% |
| Chemicals | 3.6% |
| Wireless Communications | 3.4% |
| Other3 | 16.9% |
| Cash Equivalents4 | 0.9% |
| Other Assets and Liabilities — Net 5 | 1.1% |
| TOTAL | 100.0% |
| 1 | Index classifications are based upon, and individual portfolio securities are assigned to, the classifications and sub-classifications of the Barclays Capital U.S. Corporate High Yield 2% Issuer Capped Index (BCHY2%ICI). Individual portfolio securities that are not included in the BCHY2%ICI are assigned to an index classification by the Fund's Adviser. |
| 2 | As of the date specified above, the Fund owned shares of one or more affiliated investment companies. For purposes of this table, the affiliated investment company (other than an affiliated money market mutual fund) is not treated as a single portfolio security, but rather the Fund is treated as owning a pro rata portion of each security and each other asset and liability owned by the affiliated investment company. Accordingly, the percentages of total net assets shown in the table will differ from those presented on the Portfolio of Investments. |
| 3 | For purposes of this table, index classifications which constitute less than 2.5% of the Fund's total net assets have been aggregated under the designation “Other.” |
| 4 | Cash Equivalents include any investments in money market mutual funds and/or overnight repurchase agreements. |
| 5 | Assets, other than investments in securities, less liabilities. See Statement of Assets and Liabilities. |
Annual Shareholder Report3
Portfolio of Investments
December 31, 2011
| Shares | | | Value |
| | MUTUAL FUND – 100.6% | |
| 1,410,233 | 1 | High Yield Bond Portfolio | 8,954,981 |
| | TOTAL INVESTMENTS — 100.6%
(IDENTIFIED COST $9,180,529)2 | 8,954,981 |
| | OTHER ASSETS AND LIABILITIES - NET — (0.6)%3 | (54,602) |
| | TOTAL NET ASSETS — 100% | $8,900,379 |
| 1 | Due to this affiliated holding representing greater than 75% of the Fund's total net assets, a copy of the affiliated holding's most recent Annual Report is included with this Report. |
| 2 | The cost of investments for federal tax purposes amounts to $9,185,184. |
| 3 | Assets, other than investments in securities, less liabilities. See Statement of Assets and Liabilities. |
Note: The categories of investments are shown as a percentage of total net assets at December 31, 2011.
Various inputs are used in determining the value of the Fund's investments. These inputs are summarized in the three broad levels listed below:
Level 1 — quoted prices in active markets for identical securities, including investment companies with daily net asset values, if applicable. Level 2 — other significant observable inputs (including quoted prices for similar securities, interest rates, prepayment speeds, credit risk, etc.). Also includes securities valued at amortized cost. Level 3 — significant unobservable inputs (including the Fund's own assumptions in determining the fair value of investments).The inputs or methodology used for valuing securities are not an indication of the risk associated with investing in those securities.
As of December 31, 2011, all investments of the Fund utilized Level 1 inputs in valuing the Fund's assets carried at fair value. High Yield Bond Portfolio (HYCORE) is an affiliated partnership offered only to registered investment companies and other accredited investors.
See Notes which are an integral part of the Financial Statements
Annual Shareholder Report4
Financial Highlights
(For a Share Outstanding Throughout Each Period)
| Year Ended December 31, | Period Ended
12/31/20081 |
| 2011 | 2010 | 2009 |
| Net Asset Value, Beginning of Period | $13.79 | $14.18 | $10.41 | $10.00 |
| Income From Investment Operations: | | | | |
| Net investment income | 1.22 | 1.40 | 1.27 | 0.03 |
| Net realized and unrealized gain (loss) on investments | (0.41) | 0.62 | 3.92 | 0.41 |
| TOTAL FROM INVESTMENT OPERATIONS | 0.81 | 2.02 | 5.19 | 0.44 |
| Less Distributions: | | | | |
| Distributions from net investment income | (1.22) | (1.40) | (1.27) | (0.03) |
| Distributions from net realized gain on investments | (0.06) | (1.01) | (0.15) | — |
| TOTAL DISTRIBUTIONS | (1.28) | (2.41) | (1.42) | (0.03) |
| Net Asset Value, End of Period | $13.32 | $13.79 | $14.18 | $10.41 |
| Total Return2 | 6.09% | 15.07% | 52.35% | 4.38% |
| Ratios to Average Net Assets: | | | | |
| Net expenses3 | 0.00% | 0.00% | 0.00% | 0.00%4 |
| Net investment income | 8.98% | 9.68% | 9.42% | 16.78%4 |
| Expense waiver/reimbursement5 | 3.07% | 2.92% | 7.69% | 932.30%4 |
| Supplemental Data: | | | | |
| Net assets, end of period (000 omitted) | $8,900 | $9,720 | $9,156 | $435 |
| Portfolio turnover | 82% | 125% | 40% | 0% |
| 1 | Reflects operations for the period from December 24, 2008 (date of initial investment) to December 31, 2008. |
| 2 | Based on net asset value. Total returns for periods of less than one year are not annualized. |
| 3 | The Adviser has contractually agreed to reimburse all operating expenses, excluding extraordinary expenses, incurred by the Fund. |
| 4 | Computed on an annualized basis. |
| 5 | This expense decrease is reflected in both the net expense and the net investment income ratios shown above. |
See Notes which are an integral part of the Financial Statements
Annual Shareholder Report5
Statement of Assets and Liabilities
December 31, 2011
| Assets: | | |
| Total investments in an affiliated holding (Note 5) (identified cost $9,180,529) | | $8,954,981 |
| Cash | | 23,623 |
| Receivable for investments sold | | 26,000 |
| Receivable for shares sold | | 144 |
| TOTAL ASSETS | | 9,004,748 |
| Liabilities: | | |
| Income distribution payable | $64,927 | |
| Payable for investment adviser fee (Note 5) | 619 | |
| Payable for transfer and dividend disbursing agent fees and expenses | 2,658 | |
| Payable for Directors'/Trustees' fees | 296 | |
| Payable for auditing fees | 24,474 | |
| Payable for portfolio accounting fees | 7,023 | |
| Accrued expenses | 4,372 | |
| TOTAL LIABILITIES | | 104,369 |
| Net assets for 668,350 shares outstanding | | $8,900,379 |
| Net Assets Consist of: | | |
| Paid-in capital | | $9,219,008 |
| Net unrealized depreciation of investments | | (225,548) |
| Accumulated net realized loss on investments | | (93,081) |
| TOTAL NET ASSETS | | $8,900,379 |
| Net Asset Value, Offering Price and Redemption Proceeds Per Share: | | |
| $8,900,379 ÷ 668,350 shares outstanding, no par value, unlimited shares authorized | | $13.32 |
See Notes which are an integral part of the Financial Statements
Annual Shareholder Report6
Statement of Operations
Year Ended December 31, 2011
| Investment Income: | | | |
| Dividends received from an affiliated holding (Note 5) | | | $841,149 |
| Expenses: | | | |
| Administrative fee (Note 5) | | $150,000 | |
| Custodian fees | | 3,433 | |
| Transfer and dividend disbursing agent fees and expenses | | 14,935 | |
| Directors'/Trustees' fees | | 2,053 | |
| Auditing fees | | 24,498 | |
| Legal fees | | 5,350 | |
| Portfolio accounting fees | | 42,092 | |
| Share registration costs | | 24,257 | |
| Printing and postage | | 14,130 | |
| Insurance premiums | | 3,977 | |
| Miscellaneous | | 3,097 | |
| TOTAL EXPENSES | | 287,822 | |
| Waiver and Reimbursement (Note 5): | | | |
| Waiver of administrative fee | $(24,905) | | |
| Reimbursement of other operating expenses | (262,917) | | |
| TOTAL WAIVER AND REIMBURSEMENT | | (287,822) | |
| Net expenses | | | — |
| Net investment income | | | 841,149 |
| Realized and Unrealized Loss on Investments: | | | |
| Net realized loss on sales of investments in an affiliated holding (Note 5) | | | (93,081) |
| Net change in unrealized appreciation of investments | | | (344,031) |
| Net realized and unrealized loss on investments | | | (437,112) |
| Change in net assets resulting from operations | | | $404,037 |
See Notes which are an integral part of the Financial Statements
Annual Shareholder Report7
Statement of Changes in Net Assets
| Year Ended December 31 | 2011 | 2010 |
| Increase (Decrease) in Net Assets | | |
| Operations: | | |
| Net investment income | $841,149 | $960,322 |
| Net realized gain (loss) on investments | (93,081) | 590,631 |
| Net change in unrealized appreciation/depreciation of investments | (344,031) | (395,827) |
| CHANGE IN NET ASSETS RESULTING FROM OPERATIONS | 404,037 | 1,155,126 |
| Distributions to Shareholders: | | |
| Distributions from net investment income | (841,149) | (960,322) |
| Distributions from net realized gain on investments | (43,729) | (646,491) |
| CHANGE IN NET ASSETS RESULTING FROM DISTRIBUTIONS TO SHAREHOLDERS | (884,878) | (1,606,813) |
| Share Transactions: | | |
| Proceeds from sale of shares | 6,346,928 | 10,384,450 |
| Cost of shares redeemed | (6,686,118) | (9,368,423) |
| CHANGE IN NET ASSETS RESULTING FROM SHARE TRANSACTIONS | (339,190) | 1,016,027 |
| Change in net assets | (820,031) | 564,340 |
| Net Assets: | | |
| Beginning of period | 9,720,410 | 9,156,070 |
| End of period | $8,900,379 | $9,720,410 |
See Notes which are an integral part of the Financial Statements
Annual Shareholder Report8
Notes to Financial Statements
December 31, 2011
1. ORGANIZATION
Federated Managed Pool Series (the “Trust”) is registered under the Investment Company Act of 1940, as amended (the “Act”), as an open-end management investment company. The Trust consists of four portfolios. The financial statements included herein are only those of Federated High-Yield Strategy Portfolio (the “Fund”), a non-diversified portfolio. The financial statements of the other portfolios are presented separately. The assets of each portfolio are segregated and a shareholder's interest is limited to the portfolio in which shares are held. Each portfolio pays its own expenses. The investment objective of the Fund is to seek high current income.
2. SIGNIFICANT ACCOUNTING POLICIES
The following is a summary of significant accounting policies consistently followed by the Fund in the preparation of its financial statements. These policies are in conformity with U.S. generally accepted accounting principles (GAAP).
Investment Valuation
In calculating its net asset value (NAV), the Fund generally values investments as follows:
- Shares of other mutual funds are valued based upon their reported NAVs.
- Equity securities listed on an exchange or traded through a regulated market system are valued at their last reported sale price or official closing price in their principal exchange or market.
- Fixed-income securities acquired with remaining maturities greater than 60 days are fair valued using price evaluations provided by a pricing service approved by the Board of Trustees (the “Trustees”).
- Fixed-income securities acquired with remaining maturities of 60 days or less are valued at their cost (adjusted for the accretion of any discount or amortization of any premium), which approximates market value.
- Derivative contracts listed on exchanges are valued at their reported settlement or closing price.
- Over-the-counter (OTC) derivative contracts are fair valued using price evaluations provided by a pricing service approved by the Trustees.
- For securities that are fair valued in accordance with procedures established by and under the general supervision of the Trustees, certain factors may be considered such as: the purchase price of the security, information obtained by contacting the issuer, analysis of the issuer's financial statements or other available documents, fundamental analytical data, the nature and duration of restrictions on disposition, the movement of the market in which the security is normally traded and public trading in similar securities of the issuer or comparable issuers.
If the Fund cannot obtain a price or price evaluation from a pricing service for an investment, the Fund may attempt to value the investment based upon the mean of bid and asked quotations or fair value the investment based on price evaluations, from one or more dealers. If any price, quotation, price evaluation or other pricing source is not readily available when the NAV is calculated, the Fund uses the fair value of the investment determined in accordance with the procedures described below. There can be no assurance that the Fund could purchase or sell an investment at the price used to calculate the Fund's NAV.
Fair Valuation and Significant Events Procedures
The Trustees have authorized the use of pricing services to provide evaluations of the current fair value of certain investments for purposes of calculating the NAV. Factors considered by pricing services in evaluating an investment include the yields or prices of investments of comparable quality, coupon, maturity, call rights and other potential prepayments, terms and type, reported transactions, indications as to values from dealers and general market conditions. Some pricing services provide a single price evaluation reflecting the bid-side of the market for an investment (a “bid” evaluation). Other pricing services offer both bid evaluations and price evaluations indicative of a price between the prices bid and asked for the investment (a “mid” evaluation). The Fund normally uses bid evaluations for U.S. Treasury and Agency securities, mortgage-backed securities and municipal securities. The Fund normally uses mid evaluations for other types of fixed-income securities and OTC derivative contracts. In the event that market quotations and price evaluations are not available for an investment, the fair value of the investment is determined in accordance with procedures adopted by the Trustees.
The Trustees also have adopted procedures requiring an investment to be priced at its fair value whenever the Adviser determines that a significant event affecting the value of the investment has occurred between the time as of which the price of the investment would otherwise be determined and the time as of which the NAV is computed. An event is considered significant if there is both an affirmative expectation that the investment's value will change in response to the event and a reasonable basis for quantifying the resulting change in value. Examples of significant events that may occur after the close of the principal market on which a security is traded, or after the time of a price evaluation provided by a pricing service or a dealer, include:
- With respect to securities traded in foreign markets, significant trends in U.S. equity markets or in the trading of foreign securities index futures or options contracts;
- With respect to price evaluations of fixed-income securities determined before the close of regular trading on the NYSE, actions by the Federal Reserve Open Market Committee and other significant trends in U.S. fixed-income markets;
- Political or other developments affecting the economy or markets in which an issuer conducts its operations or its securities are traded; and
- Announcements concerning matters such as acquisitions, recapitalizations, litigation developments, a natural disaster affecting the issuer's operations or regulatory changes or market developments affecting the issuer's industry.
The Trustees have approved the use of a pricing service to determine the fair value of equity securities traded principally in foreign markets when the Adviser determines that there has been a significant trend in the U.S. equity markets or in index futures trading. For other significant events, the Fund may seek to obtain more current quotations or price evaluations from alternative pricing sources. If a reliable alternative pricing source is not available, the Fund will determine the fair value of the investment using another method approved by the Trustees.
Annual Shareholder Report
9
Repurchase AgreementsThe Fund may invest in repurchase agreements for short-term liquidity purposes. It is the policy of the Fund to require the other party to a repurchase agreement to transfer to the Fund's custodian or sub-custodian eligible securities or cash with a market value (after transaction costs) at least equal to the repurchase price to be paid under the repurchase agreement. The eligible securities are transferred to accounts with the custodian or sub-custodian in which the Fund holds a “securities entitlement” and exercises “control” as those terms are defined in the Uniform Commercial Code. The Fund has established procedures for monitoring the market value of the transferred securities and requiring the transfer of additional eligible securities if necessary to equal at least the repurchase price. These procedures also allow the other party to require securities to be transferred from the account to the extent that their market value exceeds the repurchase price or in exchange for other eligible securities of equivalent market value.
The insolvency of the other party or other failure to repurchase the securities may delay the disposition of the underlying securities or cause the Fund to receive less than the full repurchase price. Under the terms of the repurchase agreement, any amounts received by the Fund in excess of the repurchase price and related transaction costs must be remitted to the other party.
The Fund may enter into repurchase agreements in which eligible securities are transferred into joint trading accounts maintained by the custodian or sub-custodian for investment companies and other clients advised by the Fund's Adviser and its affiliates. The Fund will participate on a pro rata basis with the other investment companies and clients in its share of the securities transferred under such repurchase agreements and in its share of proceeds from any repurchase or other disposition of such securities.
Investment Income, Gains and Losses, Expenses and Distributions
Investment transactions are accounted for on a trade-date basis. Realized gains and losses from investment transactions are recorded on an identified-cost basis. Interest income and expenses are accrued daily. Dividend income and distributions to shareholders are recorded on the ex-dividend date. Distributions of net investment income are declared daily and paid monthly.
Premium and Discount Amortization
All premiums and discounts on fixed-income securities are amortized/accreted using the effective interest rate method.
Federal Taxes
It is the Fund's policy to comply with the Subchapter M provision of the Internal Revenue Code (the “Code”) and to distribute to shareholders each year substantially all of its income. Accordingly, no provision for federal income tax is necessary. As of and during the year ended December 31, 2011, the Fund did not have a liability for any uncertain tax positions. The Fund recognizes interest and penalties, if any, related to tax liabilities as income tax expense in the Statement of Operations. As of December 31, 2011, tax years 2008 through 2011 remain subject to examination by the Fund's major tax jurisdictions, which include the United States of America and the Commonwealth of Massachusetts.
When-Issued and Delayed Delivery Transactions
The Fund may engage in when-issued or delayed delivery transactions. The Fund records when-issued securities on the trade date and maintains security positions such that sufficient liquid assets will be available to make payment for the securities purchased. Securities purchased on a when-issued or delayed delivery basis are marked to market daily and begin earning interest on the settlement date. Losses may occur on these transactions due to changes in market conditions or the failure of counterparties to perform under the contract.
Other
The preparation of financial statements in conformity with GAAP requires management to make estimates and assumptions that affect the amounts of assets, liabilities, expenses and revenues reported in the financial statements. Actual results could differ from those estimated.
3. SHARES OF BENEFICIAL INTEREST
The following table summarizes share activity:
| Year Ended December 31 | 2011 | 2010 |
| Shares sold | 467,532 | 718,652 |
| Shares redeemed | (504,077) | (659,617) |
| NET CHANGE RESULTING FROM FUND SHARE TRANSACTIONS | (36,545) | 59,035 |
4. FEDERAL TAX INFORMATION
The tax character of distributions as reported on the Statement of Changes in Net Assets for the years ended December 31, 2011 and 2010, was as follows:
| 2011 | 2010 |
| Ordinary income1 | $884,878 | $1,599,929 |
| Long-term capital gains | $ — | $6,884 |
| 1 | For tax purposes, short-term capital gain distributions are considered ordinary income distributions. |
As of December 31, 2011, the components of distributable earnings on a tax basis were as follows:
| Net unrealized depreciation | $(230,203) |
| Capital loss carryforwards | $(88,426) |
Annual Shareholder Report10
The difference between book-basis and tax-basis net unrealized appreciation/depreciation is attributable to differing treatments for the deferral of losses on wash sales.
At December 31, 2011, the cost of investments for federal tax purposes was $9,185,184. The net unrealized depreciation of investments for federal tax purposes was $230,203. This consists of net unrealized depreciation from investments for those securities having an excess of cost over value of $230,203.
At December 31, 2011, the Fund had a capital loss carryforward of $88,426 which will reduce the Fund's taxable income arising from future net realized gains on investments, if any, to the extent permitted by the Code, thereby reducing the amount of distributions to shareholders which would otherwise be necessary to relieve the Fund of any liability for federal income tax. Pursuant to the Code, a net capital loss incurred in taxable years beginning on or before December 22, 2010, is characterized as short-term and may be carried forward for a maximum of eight tax years (“Carryforward Limit”), whereas a net capital loss incurred in taxable years beginning after December 22, 2010, retains its character as either short-term or long-term, does not expire and is required to be utilized prior to the losses which have a Carryforward Limit.
The following schedule summarizes the Fund's short-term and long-term capital loss carryforwards and expiration year:
| Expiration Year | Short-Term | Long-Term | Total |
| No expiration | $81,432 | $6,994 | $88,426 |
5. INVESTMENT ADVISER FEE AND OTHER TRANSACTIONS WITH AFFILIATES
Investment Adviser Fee
Federated Investment Management Company is the Fund's investment adviser (the “Adviser”). The Adviser provides investment adviser services at no fee, because all eligible investors are: (1) in separately managed or wrap fee programs, who often pay a single aggregate fee to the wrap program sponsor for all costs and expenses of the wrap-fee programs; or (2) in certain other separately managed accounts and discretionary investment accounts. The Adviser has contractually agreed to reimburse all operating expenses, excluding extraordinary expenses, incurred by the Fund. For the year ended December 31, 2011, the Adviser reimbursed $262,917 of other operating expenses.
Administrative Fee
Federated Administrative Services (FAS), under the Administrative Services Agreement, provides the Fund with administrative personnel and services. The fee paid to FAS is based on the average aggregate daily net assets of certain Federated funds as specified below:
| Administrative Fee | Average Aggregate Daily Net Assets
of the Federated Funds |
| 0.150% | on the first $5 billion |
| 0.125% | on the next $5 billion |
| 0.100% | on the next $10 billion |
| 0.075% | on assets in excess of $20 billion |
The administrative fee received during any fiscal year shall be at least $150,000 per portfolio and $40,000 per each additional class of Shares. FAS may voluntarily choose to waive any portion of its fee. FAS can modify or terminate this voluntary waiver at any time at its sole discretion. For the year ended December 31, 2011, FAS waived $24,905 of its fee. The net fee paid to FAS was 1.336% of average daily net assets of the Fund. The Fund is currently being charged the minimum administrative fee; therefore the fee as a percentage of average daily net assets is greater than the amounts presented in the chart above. For the year ended December 31, 2011, the Adviser reimbursed the Fund for any fee paid to FAS.
General
Certain Officers and Trustees of the Fund are Officers and Directors or Trustees of the above companies.
Transactions Involving Affiliated Holdings
Affiliated holdings are mutual funds which are managed by the Adviser or an affiliate of the Adviser. Transactions involving the affiliated holding during the year ended December 31, 2011, were as follows:
| High Yield
Bond Portfolio |
| Balance of Shares Held 12/31/2010 | 1,509,761 |
| Purchases/Additions | 1,152,483 |
| Sales/Reductions | 1,252,011 |
| Balance of Shares Held 12/31/2011 | 1,410,233 |
| Value | $8,954,981 |
| Dividend Income | $841,149 |
The Fund invests in HYCORE, a portfolio of Federated Core Trust (“Core Trust”) which is managed by Federated Investment Management Company, the Fund's Adviser. Core Trust is an open-end management company, registered under the Act, available only to registered investment companies and other institutional investors. The investment objective of HYCORE is to seek high current income. Federated Investors, Inc. receives no advisory or administrative fees from HYCORE. Income distributions from HYCORE are declared daily and paid monthly. All income distributions are recorded by the Fund as dividend income. Capital gain distributions of HYCORE, if any, are declared and paid annually, and are recorded by Annual Shareholder Report
11
the Fund as capital gains received. The performance of the Fund is directly affected by the performance of HYCORE. The financial statements of HYCORE are included within this Report to illustrate the security holding, financial condition, results of operations and changes in net assets of the portfolio in which the Fund invested 100.6% of its net assets at December 31, 2011. The financial statements of HYCORE should be read in conjunction with the Fund's financial statements. The valuation of securities held by HYCORE is discussed in the notes to its financial statements. 6. Investment TRANSACTIONS
Purchases and sales of investments, excluding long-term U.S. government securities and short-term obligations, for the year ended December 31, 2011, were as follows:
| Purchases | $7,503,626 |
| Sales | $7,951,200 |
7. LINE OF CREDIT
The Fund participates in a $100,000,000 unsecured, uncommitted revolving line of credit (LOC) agreement with PNC Bank. The LOC was made available for extraordinary or emergency purposes, primarily for financing redemption payments. Borrowings are charged interest at a rate offered to the Fund by PNC Bank at the time of the borrowing. As of December 31, 2011, there were no outstanding loans. During the year ended December 31, 2011, the Fund did not utilize the LOC.
8. INTERFUND LENDING
Pursuant to an Exemptive Order issued by the Securities and Exchange Commission, the Fund, along with other funds advised by subsidiaries of Federated Investors, Inc., may participate in an interfund lending program. This program provides an alternative credit facility allowing the Fund to borrow from other participating affiliated funds. As of December 31, 2011, there were no outstanding loans. During the year ended December 31, 2011, the program was not utilized.
9. recent accounting pronouncements
In April 2011, the Financial Accounting Standards Board (FASB) released Accounting Standards Update (ASU) No. 2011-03, “Reconsideration of Effective Control for Repurchase Agreements.” This ASU amends FASB Accounting Standards Codification (ASC) Topic 860, “Transfers and Servicing”; specifically the criteria required to determine whether a repurchase agreement and similar agreements should be accounted for as sales of financial assets or secured borrowings with commitments. This ASU is effective for fiscal years and interim periods beginning after December 15, 2011. Management has concluded that the adoption of ASU No. 2011-03 is not expected to have a material impact on the Fund's financial statements and the accompanying notes, net assets or results of operations.
In addition, in May 2011, FASB released ASU No. 2011-04, “Amendments to Achieve Common Fair Value Measurement and Disclosure Requirements in U.S. GAAP and IFRSs.” This ASU amends FASB ASC Topic 820, “Fair Value Measurement,” to establish common requirements for measuring fair value and for disclosing information about fair value measurements in accordance with GAAP. This ASU is effective for fiscal years and interim periods beginning after December 15, 2011. Management has concluded that the adoption of ASU No. 2011-04 is not expected to have a material impact on the Fund's financial statements and the accompanying notes.
Annual Shareholder Report12
Report of Independent Registered Public Accounting Firm
TO THE BOARD OF Trustees of Federated Managed Pool Series AND SHAREHOLDERS OF Federated High-Yield Strategy Portfolio:
We have audited the accompanying statement of assets and liabilities of Federated High-Yield Strategy Portfolio (the “Fund”) (one of the portfolios constituting Federated Managed Pool Series), including the portfolio of investments, as of December 31, 2011, and the related statement of operations for the year then ended, the statement of changes in net assets for each of the two years in the period then ended and the financial highlights for each of the periods indicated therein. These financial statements and financial highlights are the responsibility of the Fund's management. Our responsibility is to express an opinion on these financial statements and financial highlights based on our audits.
We conducted our audits in accordance with standards of the Public Company Accounting Oversight Board (United States). Those standards require that we plan and perform the audit to obtain reasonable assurance about whether the financial statements and financial highlights are free of material misstatement. We were not engaged to perform an audit of the Fund's internal control over financial reporting. Our audits included consideration of internal control over financial reporting as a basis for designing audit procedures that are appropriate in the circumstances, but not for the purpose of expressing an opinion on the effectiveness of the Fund's internal control over financial reporting. Accordingly, we express no such opinion. An audit also includes examining, on a test basis, evidence supporting the amounts and disclosures in the financial statements and financial highlights, assessing the accounting principles used and significant estimates made by management, and evaluating the overall financial statement presentation. Our procedures included confirmation of securities owned as of December 31, 2011, by correspondence with the custodian and others. We believe that our audits provide a reasonable basis for our opinion.
In our opinion, the financial statements and financial highlights referred to above present fairly, in all material respects, the financial position of the Federated High-Yield Strategy Portfolio, a portfolio of Federated Managed Pool Series, at December 31, 2011, the results of its operations for the year then ended, the changes in its net assets for each of the two years in the period then ended and the financial highlights for each of the periods indicated therein, in conformity with U.S. generally accepted accounting principles.
Boston, Massachusetts
February 22, 2012
Annual Shareholder Report13
Shareholder Expense Example (unaudited)
As a shareholder of the Fund, you incur ongoing costs, including to the extent applicable, management fees, distribution (12b-1) fees and/or shareholder services fees and other Fund expenses. This Example is intended to help you to understand your ongoing costs (in dollars) of investing in the Fund and to compare these costs with the ongoing costs of investing in other mutual funds. It is based on an investment of $1,000 invested at the beginning of the period and held for the entire period from July 1, 2011 to December 31, 2011.
ACTUAL EXPENSES
The first section of the table below provides information about actual account values and actual expenses. You may use the information in this section, together with the amount you invested, to estimate the expenses that you incurred over the period. Simply divide your account value by $1,000 (for example, an $8,600 account value divided by $1,000 = 8.6), then multiply the result by the number in the first section under the heading entitled “Expenses Paid During Period” to estimate the expenses attributable to your investment during this period.
HYPOTHETICAL EXAMPLE FOR COMPARISON PURPOSES
The second section of the table below provides information about hypothetical account values and hypothetical expenses based on the Fund's actual expense ratio and an assumed rate of return of 5% per year before expenses, which is not the Fund's actual return. Thus, you should not use the hypothetical account values and expenses to estimate the actual ending account balance or your expenses for the period. Rather, these figures are required to be provided to enable you to compare the ongoing costs of investing in the Fund with other funds. To do so, compare this 5% hypothetical example with the 5% hypothetical examples that appear in the shareholder reports of the other funds.
Please note that the expenses shown in the table are meant to highlight your ongoing costs only. Therefore, the second section of the table is useful in comparing ongoing costs only, and will not help you determine the relative total costs of owning different funds.
| Beginning
Account Value
7/1/2011 | Ending
Account Value
12/31/2011 | Expenses Paid
During Period1 |
| Actual | $1,000 | $1,013.90 | $0.00 |
| Hypothetical (assuming a 5% return before expenses) | $1,000 | $1,025.21 | $0.00 |
| 1 | Expenses are equal to the Fund's annualized net expense ratio of 0.00%, multiplied by the average account value over the period, multiplied by 184/365 (to reflect the one-half-year period). The Adviser has contractually agreed to reimburse all operating expenses, excluding extraordinary expenses, incurred by the Fund. This agreement has no fixed term. |
Annual Shareholder Report14
Management's Discussion of Fund Performance (unaudited) – High Yield Bond Portfolio
The Fund's total return, based on net asset value, for the 12-month reporting period ended December 31, 2011, was 6.04%. The total return of the Barclays Capital U.S. Corporate High Yield 2% Issuer Capped Index (BCHY2%ICI),1 the Fund's broad-based securities market index, was 4.96% during the same period. The Fund's total return for the most recently completed fiscal year reflected actual cash flows, transaction costs and other expenses which were not reflected in the total return of the BCHY2%ICI.
MARKET OVERVIEW
The high-yield market endured significant month-to-month volatility over the reporting period. Two major uncertainty factors drove the volatility. First, there was substantial uncertainty regarding the strength of the U.S. economy. While the reporting period started and ended with some optimism that a path of slow but sustainable economic growth was the most likely outcome, the middle part of the period was characterized by concerns of faltering growth and a potential “double-dip” recession. Second, considerable uncertainty was generated by government debt concerns in the euro zone. At the beginning of the reporting period, these concerns were focused mainly on Greece and Portugal. However, by the end of the reporting period, concerns had spread to Italy, Spain and France, along with concerns about slow economic growth for the euro zone as a whole due to fiscal austerity plans in many countries. Despite these macro uncertainties, the one constant from a high-yield perspective was the overall strength in corporate credit conditions. Strong earnings, large cash balances, solid balance sheets and a desire to reduce overall financial risk characterized corporate credit markets. For example, the default rate as calculated by the Altman & Kuehne High-Yield Bond Default and Return Report (New York University) was 0.66% for the first nine months of 2011 after totaling just 1.13% for all of 2010. Both of these rates are well below the 3.56% average annual default rate between 1978 and 2010. However, the overall macro concerns tended to offset the positive of corporate credit conditions, as shown by a widening in the yield spread between high-yield bonds and U.S. Treasury securities — according to the Credit Suisse High Yield Bond Index,2 the spread increased from 571 basis points on December 31, 2010, to 728 basis points on December 31, 2011.
Within the high-yield market,3 major industry sectors that substantially outperformed the overall BCHY2%ICI included: Media – Cable, Natural Gas Utilities, Food & Beverage, Energy and Lodging. Major industry sectors that substantially underperformed the overall BCHY2%ICI included: Home Construction, Transportation, Wireless Communications, Consumer Products and Industrial – Other. From a ratings quality perspective, the higher-quality, more interest rate sensitive “BB” rated sector led the way with a total return of 6.81%, followed by the “B” rated sector at 5.41% and the lower-quality “CCC” rated sector well behind at 1.18%, during this period.
Fund Performance
The Fund outperformed the BCHY2%ICI for the reporting period. The main reason for the Fund's outperformance was outstanding security selection which more than offset an overweight position, relative to the BCHY2%ICI, in the poor performing “CCC” rated quality sector and an underweight position in the strong performing “BB” rated quality sector. Security selection was particularly strong in the Gaming, Paper, Services, Technology, Transportation and Wireless Telecommunication sectors. Strong security selection in the Consumer Products and Media – Non Cable sectors more than offset overweight positions in these weak performing industry sectors, while strong security selection in the Energy sector more than offset an underweight position in this strong performing industry sector. The Fund had an underweight position, relative to the BCHY2%ICI, in the weak performing Home Construction sector which also aided Fund performance. Specific Fund holdings that substantially outperformed the BCHY2%ICI included: Petrohawk, Universal City Development, Diversey Inc., Nalco, Sealed Air, Brigham Exploration and Macy's.
The Fund's performance was negatively affected by poor security selection in the Automotive and Electric Utility sectors. Also, an overweight position, relative to the BCHY2%ICI, in the poor performing Industrial – Other sector and an underweight position in the strong performing Wireline and Electric Utility sectors hindered performance. Specific Fund holdings that substantially underperformed the BCHY2%ICI included: Aquilex Holdings, Texas Competitive Electric, American Standard, ATP Oil and Gas, Momentive Performance Materials, Exide Technologies and Houghton Mifflin.
| 1 | The BCHY2%ICI is the 2% Issuer Cap component of the Barclay's Capital U.S. Corporate High Yield Index (BCHYI). The BCHYI is an index that covers the universe of fixed-rate, noninvestment-grade debt. Pay-in-kind (PIK) bonds, Eurobonds and debt issues from countries designated as emerging markets (e.g., Argentina, Brazil, Venezuela, etc.) are excluded, but Canadian and global bonds (SEC registered) of issuers in non-EMG countries are included. Original issue zeroes, step-up coupon structures, and 144-As are also included. The index is unmanaged, and it is not possible to invest directly in an index. |
| 2 | Credit Suisse High Yield Bond Index serves as a benchmark to evaluate the performance of low quality bonds. Low quality is defined as those bonds in the range from “BB” to “CCC” and defaults. The index is unmanaged, and it is not possible to invest directly in an index. |
| 3 | High-yield, lower-rated securities generally entail greater market, credit and liquidity risks than investment-grade securities and may include higher volatility and higher risk of default. |
Annual Shareholder Report15
FUND PERFORMANCE AND GROWTH OF A $10,000 INVESTMENT
The Average Annual Total Return table below shows returns averaged over the stated periods. The graph below illustrates the hypothetical investment of $10,0001 in the High Yield Bond Portfolio (the “Fund”) from December 31, 2001 to December 31, 2011, compared to the Barclays Capital U.S. Corporate High Yield 2% Issuer Capped Index (BCHY2%ICI).2
| Average Annual Total Returns for the Period Ended 12/31/2011 | |
| 1 Year | 6.04% |
| 5 Years | 8.15% |
| 10 Years | 9.42% |
Performance data quoted represents past performance which is no guarantee of future results. Investment return and principal value will fluctuate so that an investor's shares, when redeemed, may be worth more or less than their original cost. Mutual fund performance changes over time and current performance may be lower or higher than what is stated. For current to the most recent month-end performance and after-tax returns, visit FederatedInvestors.com or call 1-800-341-7400. Returns shown do not reflect the deduction of taxes that a shareholder would pay on Fund distributions or the redemption of Fund shares. Mutual funds are not obligations of or guaranteed by any bank and are not federally insured.
Growth of a $10,000 Investment
| High Yield Bond Portfolio | C000024830 | BCHY2%ICI |
| 12/31/2001 | 10,000 | 10,000 |
| 12/31/2002 | 10,390 | 10,347 |
| 12/31/2003 | 12,916 | 12,368 |
| 12/31/2004 | 14,388 | 13,529 |
| 12/31/2005 | 14,884 | 13,903 |
| 12/31/2006 | 16,621 | 15,398 |
| 12/31/2007 | 17,366 | 15,748 |
| 12/31/2008 | 13,280 | 11,672 |
| 12/31/2009 | 20,158 | 18,531 |
| 12/31/2010 | 23,194 | 21,300 |
| 12/31/2011 | 24,594 | 22,356 |
41 graphic description end -->
| 1 | The Fund's performance assumes the reinvestment of all dividends and distributions. The BCHY2%ICI has been adjusted to reflect reinvestment of dividends on securities in the index. |
| 2 | The BCHY2%ICI is not adjusted to reflect sales charges, expenses or other fees that the Securities and Exchange Commission requires to be reflected in the Fund's performance. The index is unmanaged and, unlike the Fund, is not affected by cash flows. It is not possible to invest directly in an index. |
Annual Shareholder Report16
Portfolio of Investments Summary Table (unaudited) – High Yield Bond Portfolio
At December 31, 2011, the Fund's index classification1 was as follows:
| Index Classification | Percentage of
Total Net Assets |
| Technology | 11.9% |
| Health Care | 9.8% |
| Media — Non-Cable | 7.9% |
| Automotive | 6.4% |
| Energy | 6.4% |
| Financial Institutions | 6.1% |
| Retailers | 4.6% |
| Gaming | 4.4% |
| Food & Beverage | 4.3% |
| Consumer Products | 4.1% |
| Industrial — Other | 4.0% |
| Packaging | 3.9% |
| Chemicals | 3.6% |
| Wireless Communications | 3.4% |
| Other2 | 16.6% |
| Cash Equivalents3 | 0.9% |
| Other Assets and Liabilities — Net4 | 1.7% |
| TOTAL | 100.0% |
| 1 | Index classifications are based upon, and individual portfolio securities are assigned to, the classifications and sub-classifications of the Barclays Capital U.S. Corporate High Yield 2% Issuer Capped Index (BCHY2%ICI). Individual portfolio securities that are not included in the BCHY2%ICI are assigned to an index classification by the Fund's adviser. |
| 2 | For purposes of this table, index classifications which constitute less than 2.5% of the Fund's total net assets have been aggregated under the designation “Other.” |
| 3 | Cash Equivalents include any investments in money market mutual funds and/or overnight repurchase agreements. |
| 4 | Assets, other than investments in securities, less liabilities. See Statement of Assets and Liabilities. |
Annual Shareholder Report17
Portfolio of Investments – High Yield Bond Portfolio
December 31, 2011
Principal
Amount
or Shares | | | Value |
| | Corporate Bonds – 97.1% | |
| | Aerospace/Defense – 1.4% | |
| $1,750,000 | | Alliant Techsystems, Inc., Sr. Sub. Note, 6.75%, 4/1/2016 | 1,802,500 |
| 2,550,000 | 1,2 | Altegrity, Inc., Company Guarantee, Series 144A, 10.50%, 11/1/2015 | 2,307,750 |
| 3,150,000 | 1 | Altegrity, Inc., Company Guarantee, Series 144A, 11.75%, 5/1/2016 | 2,772,000 |
| 1,950,000 | | ManTech International Corp., Company Guarantee, 7.25%, 4/15/2018 | 1,996,313 |
| 2,013,614 | 1,2 | Sequa Corp., Bond, Series 144A, 13.50%, 12/1/2015 | 2,164,635 |
| 2,975,000 | 1,2 | Sequa Corp., Sr. Note, Series 144A, 11.75%, 12/1/2015 | 3,183,250 |
| 11,500,000 | | TransDigm, Inc., Company Guarantee, 7.75%, 12/15/2018 | 12,420,000 |
| | TOTAL | 26,646,448 |
| | Automotive – 6.3% | |
| 3,700,000 | | Affinia Group, Inc., Company Guarantee, 9.00%, 11/30/2014 | 3,681,500 |
| 2,600,000 | 1,2 | Affinia Group, Inc., Sr. Secd. Note, Series 144A, 10.75%, 8/15/2016 | 2,834,000 |
| 4,025,000 | 1,2 | Allison Transmission, Inc., Sr. Unsecd. Note, Series 144A, 7.125%, 5/15/2019 | 3,964,625 |
| 1,475,000 | | American Axle & Manufacturing Holdings, Inc., Sr. Note, 7.75%, 11/15/2019 | 1,452,875 |
| 556,000 | 1,2 | American Axle & Manufacturing Holdings, Inc., Sr. Sub. Note, Series 144A, 9.25%, 1/15/2017 | 606,040 |
| 3,700,000 | | ArvinMeritor, Inc., Company Guarantee, 10.625%, 3/15/2018 | 3,496,500 |
| 3,650,000 | 1,2 | Chrysler Group LLC, Sr. Secd. Note, Series 144A, 8.00%, 6/15/2019 | 3,358,000 |
| 7,300,000 | 1,2 | Chrysler Group LLC, Sr. Secd. Note, Series 144A, 8.25%, 6/15/2021 | 6,679,500 |
| 3,950,000 | | Cooper-Standard Automotive, Inc., Company Guarantee, 8.50%, 5/1/2018 | 4,152,437 |
| 700,000 | | Dana Holding Corp., Sr. Note, 6.50%, 2/15/2019 | 710,500 |
| 750,000 | | Dana Holding Corp., Sr. Note, 6.75%, 2/15/2021 | 772,500 |
| 9,525,000 | | Exide Technologies, Sr. Secd. Note, 8.625%, 2/1/2018 | 7,381,875 |
| 2,450,000 | | Ford Motor Credit Co., 5.875%, 8/2/2021 | 2,557,151 |
| 1,425,000 | | Ford Motor Credit Co., Note, 7.50%, 8/1/2012 | 1,471,632 |
| 2,900,000 | | Ford Motor Credit Co., Sr. Note, 7.00%, 4/15/2015 | 3,124,750 |
| 2,625,000 | | Ford Motor Credit Co., Sr. Note, 8.00%, 6/1/2014 | 2,859,116 |
| 5,600,000 | | Ford Motor Credit Co., Sr. Unsecd. Note, 6.625%, 8/15/2017 | 6,104,549 |
| 10,200,000 | | Ford Motor Credit Co., Sr. Unsecd. Note, 8.00%, 12/15/2016 | 11,600,909 |
| 4,675,000 | | Ford Motor Credit Co., Sr. Unsecd. Note, 8.125%, 1/15/2020 | 5,518,655 |
| 8,025,000 | 1,2 | International Automotive Components, Sr. Secd. Note, Series 144A, 9.125%, 6/1/2018 | 7,222,500 |
| 700,000 | 1,2 | Jaguar Land Rover PLC, Series 144A, 7.75%, 5/15/2018 | 670,250 |
| 3,850,000 | 1,2 | Jaguar Land Rover PLC, Sr. Unsecd. Note, Series 144A, 8.125%, 5/15/2021 | 3,638,250 |
| 800,000 | | Lear Corp., Company Guarantee, 8.125%, 3/15/2020 | 884,000 |
| 958,000 | | Navistar International Corp., Sr. Note, 8.25%, 11/1/2021 | 1,023,863 |
| 6,375,000 | 1,2 | Pittsburgh Glass Works, LLC, Sr. Secd. Note, Series 144A, 8.50%, 4/15/2016 | 6,167,812 |
| 4,875,000 | 1,2 | Stoneridge, Inc., Sr. Secd. Note, Series 144A, 9.50%, 10/15/2017 | 5,021,250 |
| 4,350,000 | | Tenneco Automotive, Inc., Company Guarantee, 6.875%, 12/15/2020 | 4,480,500 |
| 425,000 | | Tenneco Automotive, Inc., Company Guarantee, 7.75%, 8/15/2018 | 452,625 |
| 4,399,000 | | Tomkins LLC/Tomkins Inc., Term Loan — 2nd Lien, 9.00%, 10/1/2018 | 4,899,386 |
| 3,175,000 | 1,2 | Tower Automotive, Inc., Sr. Secd. Note, Series 144A, 10.625%, 9/1/2017 | 3,206,750 |
| 8,200,000 | | United Components, Inc., Company Guarantee, Series WI, 8.625%, 2/15/2019 | 7,995,000 |
| | TOTAL | 117,989,300 |
| | Building Materials – 2.0% | |
| 700,000 | 1 | American Standard Cos., Sr. Secd. Note, Series 144A, 10.75%, 1/15/2016 | 420,000 |
| 4,775,000 | | Associated Materials, Inc., Sr. Secd. Note, 9.125%, 11/1/2017 | 4,190,062 |
| 1,875,000 | 1,2 | Building Materials Corp. of America, Bond, Series 144A, 6.75%, 5/1/2021 | 1,973,438 |
| 2,125,000 | 1,2 | Building Materials Corp. of America, Sr. Note, Series 144A, 7.50%, 3/15/2020 | 2,305,625 |
Annual Shareholder Report18
Principal
Amount
or Shares | | | Value |
| $2,700,000 | | Interline Brands, Inc., Company Guarantee, 7.00%, 11/15/2018 | 2,808,000 |
| 4,450,000 | 1,2 | Masonite International Corp., Sr. Note, Series 144A, 8.25%, 4/15/2021 | 4,383,250 |
| 9,150,000 | | Norcraft Cos. L.P., Sr. Secd. Note, Series WI, 10.50%, 12/15/2015 | 8,578,125 |
| 3,075,000 | 1,2 | Nortek Holdings, Inc., Sr. Note, Series 144A, 10.00%, 12/1/2018 | 2,928,937 |
| 5,925,000 | 1,2 | Nortek Holdings, Inc., Sr. Note, Series 144A, 8.50%, 4/15/2021 | 5,036,250 |
| 5,475,000 | | Ply Gem Industries, Inc., Sr. Secd. Note, Series WI, 8.25%, 2/15/2018 | 4,797,469 |
| | TOTAL | 37,421,156 |
| | Chemicals – 3.6% | |
| 5,750,000 | | Compass Minerals International, Inc., Company Guarantee, 8.00%, 6/1/2019 | 6,224,375 |
| 5,575,000 | | Ferro Corp., Sr. Note, 7.875%, 8/15/2018 | 5,630,750 |
| 6,500,000 | | Hexion U.S. Finance Corp., Sr. Secd. Note, 8.875%, 2/1/2018 | 6,126,250 |
| 4,125,000 | | Hexion U.S. Finance Corp., Sr. Secd. Note, Series WI, 9.00%, 11/15/2020 | 3,423,750 |
| 6,900,000 | | Huntsman International LLC, Company Guarantee, 5.50%, 6/30/2016 | 6,796,500 |
| 3,900,000 | | Huntsman International LLC, Company Guarantee, 8.625%, 3/15/2021 | 4,153,500 |
| 3,300,000 | | Huntsman International LLC, Company Guarantee, Series WI, 8.625%, 3/15/2020 | 3,514,500 |
| 2,550,000 | | Koppers Holdings, Inc., Company Guarantee, Series WI, 7.875%, 12/1/2019 | 2,715,750 |
| 4,925,000 | | Momentive Performance Materials, Inc., Sr. Note, Series WI, 9.00%, 1/15/2021 | 3,767,625 |
| 350,000 | | Nalco Co., Sr. Note, 8.25%, 5/15/2017 | 399,000 |
| 4,375,000 | 1,2 | Nalco Co., Sr. Note, Series 144A, 6.625%, 1/15/2019 | 5,064,062 |
| 5,850,000 | | Omnova Solutions, Inc., Company Guarantee, 7.875%, 11/1/2018 | 5,089,500 |
| 4,575,000 | 1,2 | Oxea Finance, Sr. Secd. Note, Series 144A, 9.50%, 7/15/2017 | 4,597,875 |
| 6,875,000 | | Solutia, Inc., Company Guarantee, 8.75%, 11/1/2017 | 7,545,312 |
| 1,375,000 | | Solutia, Inc., Sr. Note, 7.875%, 3/15/2020 | 1,502,188 |
| 1,100,000 | | Union Carbide Corp., Sr. Deb., 7.875%, 4/1/2023 | 1,302,813 |
| | TOTAL | 67,853,750 |
| | Construction Machinery – 0.9% | |
| 1,000,000 | | RSC Equipment Rental, Inc., Company Guarantee, Series WI, 8.25%, 2/1/2021 | 1,017,500 |
| 2,373,000 | | RSC Equipment Rental, Inc., Sr. Note, 9.50%, 12/1/2014 | 2,450,123 |
| 3,625,000 | | RSC Equipment Rental, Inc., Sr. Note, Series WI, 10.25%, 11/15/2019 | 3,969,375 |
| 1,575,000 | 1,2 | RSC Equipment Rental, Inc., Sr. Secd. Note, Series 144A, 10.00%, 7/15/2017 | 1,842,750 |
| 7,800,000 | | United Rentals, Inc., Sr. Sub. Note, 8.375%, 9/15/2020 | 7,644,000 |
| | TOTAL | 16,923,748 |
| | Consumer Products – 4.1% | |
| 3,825,000 | | Central Garden & Pet Co., Sr. Sub., 8.25%, 3/1/2018 | 3,767,625 |
| 5,425,000 | | Easton Bell Sports Inc., Sr. Secd. Note, 9.75%, 12/1/2016 | 5,940,375 |
| 8,400,000 | | Jarden Corp., Sr. Sub. Note, 7.50%, 5/1/2017 | 8,946,000 |
| 1,850,000 | | Jarden Corp., Sr. Unsecd. Note, 8.00%, 5/1/2016 | 2,007,250 |
| 3,032,000 | | Libbey Glass, Inc., Sr. Secd. Note, 10.00%, 2/15/2015 | 3,259,400 |
| 4,350,000 | | Prestige Brands Holdings, Inc., Company Guarantee, 8.25%, 4/1/2018 | 4,480,500 |
| 2,059,000 | 1,2 | Sealy Mattress Co., Sr. Secd. Note, Series 144A, 10.875%, 4/15/2016 | 2,259,752 |
| 12,075,000 | | Sealy Mattress Co., Sr. Sub. Note, 8.25%, 6/15/2014 | 12,014,625 |
| 8,575,000 | 1,2 | Simmons Co., Company Guarantee, Series 144A, 11.25%, 7/15/2015 | 8,896,562 |
| 350,000 | 1,2 | Spectrum Brands Holdings, Inc., 9.50%, 6/15/2018 | 384,563 |
| 2,025,000 | | Spectrum Brands Holdings, Inc., Sr. Secd. Note, 9.50%, 6/15/2018 | 2,224,969 |
| 9,420,770 | | Spectrum Brands, Inc., Bond, 12.00%, 8/28/2019 | 10,292,191 |
| 13,725,000 | | Visant Corp., Company Guarantee, Series WI, 10.00%, 10/1/2017 | 12,627,000 |
| | TOTAL | 77,100,812 |
| | Energy – 6.4% | |
| 7,725,000 | | ATP Oil & Gas Corp., Sr. Secd. 2nd Priority Note, Series WI, 11.875%, 5/1/2015 | 5,117,812 |
Annual Shareholder Report19
Principal
Amount
or Shares | | | Value |
| $6,675,000 | | Basic Energy Services, Inc., Company Guarantee, 7.125%, 4/15/2016 | 6,725,062 |
| 1,075,000 | | Basic Energy Services, Inc., Company Guarantee, Series WI, 7.75%, 2/15/2019 | 1,088,438 |
| 950,000 | | Berry Petroleum Co., Sr. Unsecd. Note, 6.75%, 11/1/2020 | 964,250 |
| 6,275,000 | 1,2 | CHC Helicopter Corp., Sr. Secd. Note, Series 144A, 9.25%, 10/15/2020 | 5,678,875 |
| 6,700,000 | 1,2 | CVR Energy, Inc., 2nd Priority Sr. Secd. Note, Series 144A, 10.875%, 4/1/2017 | 7,537,500 |
| 1,700,000 | 1,2 | Carrizo Oil & Gas, Inc., Company Guarantee, 8.625%, 10/15/2018 | 1,717,000 |
| 975,000 | | Chaparral Energy Inc., Company Guarantee, 8.875%, 2/1/2017 | 1,014,000 |
| 6,575,000 | | Chaparral Energy Inc., Company Guarantee, 9.875%, 10/1/2020 | 7,133,875 |
| 1,300,000 | | Chesapeake Energy Corp., Sr. Note, 6.875%, 11/15/2020 | 1,397,500 |
| 4,375,000 | | Chesapeake Energy Corp., Sr. Note, 6.875%, 8/15/2018 | 4,703,125 |
| 3,275,000 | | Chesapeake Energy Corp., Sr. Unsecd. Note, 6.625%, 8/15/2020 | 3,528,813 |
| 1,750,000 | | Compagnie Generale de Geophysique Veritas, Company Guarantee, 9.50%, 5/15/2016 | 1,898,750 |
| 2,375,000 | | Compagnie Generale de Geophysique Veritas, Sr. Unsecd. Note, 6.50%, 6/1/2021 | 2,315,625 |
| 5,825,000 | | Compagnie Generale de Geophysique Veritas, Sr. Unsecd. Note, 7.75%, 5/15/2017 | 5,926,937 |
| 4,100,000 | | Complete Production Services, Inc., Sr. Note, 8.00%, 12/15/2016 | 4,284,500 |
| 4,850,000 | | Comstock Resources, Inc., Company Guarantee, 7.75%, 4/1/2019 | 4,631,750 |
| 3,825,000 | | Concho Resources, Inc., Sr. Note, 7.00%, 1/15/2021 | 4,126,219 |
| 2,175,000 | | Copano Energy LLC, Company Guarantee, 7.125%, 4/1/2021 | 2,207,625 |
| 1,625,000 | | Denbury Resources, Inc., Sr. Sub. Note, 6.375%, 8/15/2021 | 1,706,250 |
| 1,300,000 | | Denbury Resources, Inc., Sr. Sub. Note, 9.75%, 3/1/2016 | 1,439,750 |
| 2,142,000 | | Denbury Resources, Inc., Sr. Sub., 8.25%, 2/15/2020 | 2,404,395 |
| 3,925,000 | | EXCO Resources, Inc., Sr. Note, 7.50%, 9/15/2018 | 3,728,750 |
| 1,525,000 | | Energy XXI Gulf Coast Inc., 7.75%, 6/15/2019 | 1,563,125 |
| 1,900,000 | | Energy XXI Gulf Coast Inc., 9.25%, 12/15/2017 | 2,071,000 |
| 5,600,000 | | Forbes Energy Services Ltd., Company Guarantee, Series WI, 9.00%, 6/15/2019 | 5,264,000 |
| 3,875,000 | | Linn Energy LLC, Company Guarantee, 7.75%, 2/1/2021 | 4,049,375 |
| 4,725,000 | | Linn Energy LLC, Sr. Unsecd. Note, 8.625%, 4/15/2020 | 5,150,250 |
| 5,925,000 | | PHI, Inc., Company Guarantee, Series WI, 8.625%, 10/15/2018 | 5,969,437 |
| 2,700,000 | | Plains Exploration & Production Co., 6.75%, 2/1/2022 | 2,841,750 |
| 2,000,000 | | Plains Exploration & Production Co., Sr. Note, 7.625%, 6/1/2018 | 2,130,000 |
| 1,825,000 | 1,2 | SM Energy Co., Sr. Unsecd. Note, Series 144A, 6.50%, 11/15/2021 | 1,888,875 |
| 1,775,000 | | Sesi LLC, Sr. Note, Series WI, 6.375%, 5/1/2019 | 1,814,938 |
| 1,425,000 | 1,2 | Sesi LLC, Sr. Unsecd. Note, Series 144A, 7.125%, 12/15/2021 | 1,499,813 |
| 5,450,000 | 1,2 | W&T Offshore, Inc., Sr. Note, Series 144A, 8.50%, 6/15/2019 | 5,668,000 |
| | TOTAL | 121,187,364 |
| | Entertainment – 1.2% | |
| 7,850,000 | | Cedar Fair LP, Company Guarantee, 9.125%, 8/1/2018 | 8,576,125 |
| 7,075,000 | | Cinemark USA, Inc., Company Guarantee, 8.625%, 6/15/2019 | 7,729,438 |
| 800,000 | | Cinemark USA, Inc., Company Guarantee, Series WI, 7.375%, 6/15/2021 | 822,000 |
| 2,475,000 | 1,3,4,5 | Hard Rock Park Operations LLC, Sr. Secd. Note, Series 144A, 0.00%, 4/1/2012 | 0 |
| 4,525,000 | | Regal Cinemas, Inc., Company Guarantee, 8.625%, 7/15/2019 | 4,909,625 |
| | TOTAL | 22,037,188 |
| | Financial Institutions – 5.9% | |
| 3,800,000 | | Ally Financial, Inc., Company Guarantee, 7.50%, 9/15/2020 | 3,852,250 |
| 2,555,000 | | Ally Financial, Inc., Company Guarantee, 8.00%, 11/1/2031 | 2,478,350 |
| 3,550,000 | | Ally Financial, Inc., Company Guarantee, 8.00%, 3/15/2020 | 3,647,625 |
| 12,275,000 | | Ally Financial, Inc., Company Guarantee, 8.30%, 2/12/2015 | 12,980,813 |
| 4,575,000 | | Ally Financial, Inc., Company Guarantee, Series UNRE, 7.00%, 2/1/2012 | 4,597,875 |
| 3,375,000 | | Ally Financial, Inc., Company Guarantee, Series WI, 6.25%, 12/1/2017 | 3,268,968 |
Annual Shareholder Report20
Principal
Amount
or Shares | | | Value |
| $2,150,000 | 1,2 | CIT Group, Inc., Sr. 2nd Priority Note, Series 144A, 6.625%, 4/1/2018 | 2,236,000 |
| 38,100,000 | 1,2 | CIT Group, Inc., Sr. Secd. Note, Series 144A, 7.00%, 5/2/2017 | 38,100,000 |
| 1,225,000 | | International Lease Finance Corp., Sr. Unsecd. Note, 5.75%, 5/15/2016 | 1,137,519 |
| 1,225,000 | | International Lease Finance Corp., Sr. Unsecd. Note, 6.25%, 5/15/2019 | 1,132,941 |
| 1,100,000 | | International Lease Finance Corp., Sr. Unsecd. Note, 8.25%, 12/15/2020 | 1,113,750 |
| 4,300,000 | | International Lease Finance Corp., Sr. Unsecd. Note, 8.625%, 9/15/2015 | 4,423,625 |
| 16,125,000 | | International Lease Finance Corp., Sr. Unsecd. Note, 8.75%, 3/15/2017 | 16,649,062 |
| 1,025,000 | | International Lease Finance Corp., Sr. Unsecd. Note, 8.875%, 9/1/2017 | 1,066,000 |
| 14,125,000 | | Nuveen Investments, Company Guarantee, 10.50%, 11/15/2015 | 14,089,687 |
| | TOTAL | 110,774,465 |
| | Food & Beverage – 4.3% | |
| 7,125,000 | 1,2 | Aramark Corp., Series 144A, 8.625%, 5/1/2016 | 7,374,375 |
| 9,175,000 | | Aramark Corp., Sr. Note, 8.50%, 2/1/2015 | 9,450,250 |
| 4,625,000 | | B&G Foods, Inc., Sr. Note, 7.625%, 1/15/2018 | 4,937,188 |
| 925,000 | | Darling International, Inc., Company Guarantee, 8.50%, 12/15/2018 | 1,031,375 |
| 9,025,000 | | Dean Foods Co., Company Guarantee, 7.00%, 6/1/2016 | 8,957,312 |
| 6,675,000 | | Dean Foods Co., Sr. Note, Series WI, 9.75%, 12/15/2018 | 7,142,250 |
| 6,600,000 | | Del Monte Foods Co., Sr. Unsecd. Note, 7.625%, 2/15/2019 | 6,369,000 |
| 12,350,000 | | Michael Foods, Inc., Company Guarantee, Series WI, 9.75%, 7/15/2018 | 13,060,125 |
| 7,450,000 | | Pinnacle Foods Finance LLC/Pinnacle Foods Finance Corp., Company Guarantee, 9.25%, 4/1/2015 | 7,682,812 |
| 4,700,000 | | Pinnacle Foods Finance LLC/Pinnacle Foods Finance Corp., Sr. Sub. Note, Series WI, 10.625%, 4/1/2017 | 4,958,500 |
| 2,000,000 | | Smithfield Foods, Inc., Sr. Note, 7.75%, 7/1/2017 | 2,200,000 |
| 8,700,000 | 1,2 | U.S. Foodservice, Inc., Sr. Unsecd. Note, Series 144A, 8.50%, 6/30/2019 | 8,460,750 |
| | TOTAL | 81,623,937 |
| | Gaming – 4.4% | |
| 5,822,000 | | American Casino & Entertainment, Sr. Secd. Note, 11.00%, 6/15/2014 | 5,952,995 |
| 3,725,000 | | Ameristar Casinos, Inc., Sr. Unsecd. Note, Series WI, 7.50%, 4/15/2021 | 3,855,375 |
| 8,700,000 | 1,2 | Great Canadian Gaming Corp., Company Guarantee, Series 144A, 7.25%, 2/15/2015 | 8,830,500 |
| 10,450,000 | | Harrah's Operating Co., Inc., Sr. Secd. Note, 11.25%, 6/1/2017 | 11,142,312 |
| 8,400,000 | | Jacobs Entertainment, Inc., Sr. Note, 9.75%, 6/15/2014 | 7,812,000 |
| 14,200,000 | | MGM Mirage, Inc., Sr. Note, 7.50%, 6/1/2016 | 13,667,500 |
| 800,000 | | MGM Mirage, Inc., Sr. Secd. Note, 11.125%, 11/15/2017 | 916,000 |
| 1,000,000 | | MGM Mirage, Inc., Sr. Secd. Note, 9.00%, 3/15/2020 | 1,112,500 |
| 5,925,000 | | Peninsula Gaming, LLC, Company Guarantee, 10.75%, 8/15/2017 | 6,236,063 |
| 3,550,000 | | Peninsula Gaming, LLC, Sr. Secd. Note, 8.375%, 8/15/2015 | 3,780,750 |
| 1,200,000 | | Penn National Gaming, Inc., Sr. Sub., 8.75%, 8/15/2019 | 1,311,000 |
| 4,100,000 | 1,2 | San Pasqual Casino Development Group, Inc., Sr. Note, Series 144A, 8.00%, 9/15/2013 | 4,059,000 |
| 4,785,000 | 1,2 | Seminole Tribe of Florida, Bond, Series 144A, 7.804%, 10/1/2020 | 4,669,155 |
| 3,075,000 | 1,2 | Seminole Tribe of Florida, Note, Series 144A, 7.75%, 10/1/2017 | 3,213,375 |
| 6,025,000 | 1,2 | Sugarhouse HSP Gaming Finance Corp., Sr. Secd. Note, Series 144A, 8.625%, 4/15/2016 | 6,205,750 |
| | TOTAL | 82,764,275 |
| | Health Care – 9.8% | |
| 6,725,000 | | Alere, Inc., Company Guarantee, 9.00%, 5/15/2016 | 6,825,875 |
| 4,750,000 | | Alere, Inc., Sr. Note, 7.875%, 2/1/2016 | 4,785,625 |
| 6,250,000 | | Bausch & Lomb, Inc., Sr. Unsecd. Note, 9.875%, 11/1/2015 | 6,593,750 |
| 15,200,000 | | Biomet, Inc., Sr. Sub. Note, Series WI, 11.625%, 10/15/2017 | 16,568,000 |
| 5,550,000 | | CRC Health Corp., Sr. Sub. Note, 10.75%, 2/1/2016 | 5,300,250 |
| 3,375,000 | | DJO Finance LLC, Company Guarantee, Series WI, 7.75%, 4/15/2018 | 2,607,187 |
| 1,825,000 | | DJO Finance LLC, Company Guarantee, Series WI, 9.75%, 10/15/2017 | 1,428,063 |
Annual Shareholder Report21
Principal
Amount
or Shares | | | Value |
| $10,300,000 | | Emergency Medical Services Corp., Company Guarantee, Series WI, 8.125%, 6/1/2019 | 10,325,750 |
| 4,750,000 | 1,2 | ExamWorks Group Inc., Sr. Unsecd. Note, Series 144A, 9.00%, 7/15/2019 | 4,322,500 |
| 5,425,000 | | Grifols, Inc., Sr. Note, Series WI, 8.25%, 2/1/2018 | 5,723,375 |
| 5,850,000 | | HCA Holdings, Inc, Sr. Unsecd. Note, Series WI, 7.75%, 5/15/2021 | 5,981,625 |
| 2,925,000 | | HCA, Inc., Sr. Note, 7.50%, 11/6/2033 | 2,544,750 |
| 1,825,000 | | HCA, Inc., Sr. Secd. Note, 6.50%, 2/15/2020 | 1,898,000 |
| 24,525,000 | | HCA, Inc., Sr. Unsecd. Note, 7.50%, 2/15/2022 | 25,138,125 |
| 7,625,000 | | Iasis Healthcare, Sr. Unsecd. Note, 8.375%, 5/15/2019 | 6,690,937 |
| 5,575,000 | 1,2 | Inventiv Health Inc., Sr. Note, Series 144a, 10.00%, 8/15/2018 | 5,129,000 |
| 7,300,000 | 1,2 | Jaguar Holding Co., Sr. Note, 9.50%, 12/1/2019 | 7,701,500 |
| 6,050,000 | 1,2 | Kinetic Concepts, Inc., Series 144A, 10.50%, 11/1/2018 | 5,944,125 |
| 10,450,000 | 1,2 | Multiplan, Inc., Company Guarantee, Series 144A, 9.875%, 9/1/2018 | 10,920,250 |
| 5,000,000 | | Omnicare, Inc., Sr. Sub., 7.75%, 6/1/2020 | 5,393,750 |
| 8,700,000 | | United Surgical Partners International, Inc., Company Guarantee, 9.25%, 5/1/2017 | 8,787,000 |
| 1,775,000 | | Universal Hospital Services, Inc., Floating Rate Note — Sr. Secured Note, 4.121%, 6/1/2015 | 1,610,813 |
| 8,675,000 | | Universal Hospital Services, Inc., Sr. Secd. Note, 8.50%, 6/1/2015 | 8,805,125 |
| 13,138,906 | | VWR Funding, Inc., Company Guarantee, Series B, 10.25%, 7/15/2015 | 13,631,615 |
| 10,350,000 | | Vanguard Health Holdings II, Company Guarantee, 8.00%, 2/1/2018 | 10,324,125 |
| | TOTAL | 184,981,115 |
| | Industrial - Other – 4.0% | |
| 4,350,000 | | American Tire Distributors, Inc., Sr. Secd. Note, Series 144A, 9.75%, 6/1/2017 | 4,502,250 |
| 1,975,000 | 1,2 | Amsted Industries, Inc., Sr. Note, Series 144A, 8.125%, 3/15/2018 | 2,103,375 |
| 1,925,000 | | Atkore International, Inc., Sr. Secd. Note, Series WI, 9.875%, 1/1/2018 | 1,852,813 |
| 1,000,000 | | Belden CDT, Inc., Company Guarantee, 9.25%, 6/15/2019 | 1,072,500 |
| 4,875,000 | | Belden CDT, Inc., Sr. Sub. Note, 7.00%, 3/15/2017 | 4,893,281 |
| 5,700,000 | 1,2 | Cleaver-Brooks, Inc., Sr. Secd. Note, Series 144A, 12.25%, 5/1/2016 | 5,757,000 |
| 4,150,000 | 1,2 | Dynacast International LLC, Series 144A, 9.25%, 7/15/2019 | 3,921,750 |
| 7,475,000 | | General Cable Corp., Sr. Note, 7.125%, 4/1/2017 | 7,493,687 |
| 4,675,000 | 1,2 | International Wire Group Holdings, Inc., Sr. Secd. Note, Series 144A, 9.75%, 4/15/2015 | 4,745,125 |
| 8,225,000 | 1,2 | Knowledge Learning Corp., Sr. Sub. Note, Series 144A, 7.75%, 2/1/2015 | 7,710,937 |
| 5,050,000 | 1,2 | Maxim Finance Corp., Sr. Secd. Note, Series 144A, 12.25%, 4/15/2015 | 4,570,250 |
| 4,000,000 | | Mueller Water Products, Inc., Company Guarantee, 8.75%, 9/1/2020 | 4,365,000 |
| 4,275,000 | | Mueller Water Products, Inc., Sr. Sub. Note, Series WI, 7.375%, 6/1/2017 | 3,911,625 |
| 7,300,000 | | Rexnord, Inc., Company Guarantee, 8.50%, 5/1/2018 | 7,774,500 |
| 2,825,000 | | SPX Corp., Sr. Unsecd. Note, 7.625%, 12/15/2014 | 3,121,625 |
| 6,350,000 | | The Hillman Group, Inc., Sr. Unsecd. Note, 10.875%, 6/1/2018 | 6,318,250 |
| 785,000 | | Thermon Industries, Inc., Sr. Secd. Note, Series WI, 9.50%, 5/1/2017 | 849,763 |
| | TOTAL | 74,963,731 |
| | Lodging – 0.2% | |
| 3,700,000 | | Host Hotels & Resorts LP, Sr. Note, 6.875%, 11/1/2014 | 3,792,500 |
| | Media - Cable – 1.2% | |
| 1,325,000 | 1,2 | Cequel Communications Holdings, Sr. Note, Series 144A, 8.625%, 11/15/2017 | 1,411,125 |
| 1,275,000 | | Charter Communications Holdings II, 7.375%, 6/1/2020 | 1,351,500 |
| 4,000,000 | | Charter Communications Holdings II, Company Guarantee, 7.25%, 10/30/2017 | 4,235,000 |
| 1,325,000 | | Charter Communications Holdings II, Company Guarantee, Series WI, 7.875%, 4/30/2018 | 1,419,406 |
| 800,000 | | Charter Communications Holdings II, Company Guarantee, Series WI, 8.125%, 4/30/2020 | 880,000 |
| 4,450,000 | | Charter Communications Holdings II, Sr. Note, 7.00%, 1/15/2019 | 4,661,375 |
| 2,725,000 | 1,2 | Insight Communication Co., Sr. Note, Series 144A, 9.375%, 7/15/2018 | 3,126,938 |
Annual Shareholder Report22
Principal
Amount
or Shares | | | Value |
| $5,750,000 | | Virgin Media, Inc., Company Guarantee, Series 1, 9.50%, 8/15/2016 | 6,483,125 |
| | TOTAL | 23,568,469 |
| | Media - Non-Cable – 7.9% | |
| 3,050,000 | 1,2 | AMC Networks, Inc., Sr. Note, Series 144A, 7.75%, 7/15/2021 | 3,332,125 |
| 8,950,000 | | Clear Channel Communications, Inc., Company Guarantee, 9.00%, 3/1/2021 | 7,585,125 |
| 8,325,000 | | Clear Channel Outdoor Holdings, Inc., Company Guarantee, Series B, 9.25%, 12/15/2017 | 9,032,625 |
| 725,000 | | Clear Channel Worldwide, Company Guarantee, 9.25%, 12/15/2017 | 783,000 |
| 7,200,000 | | Crown Media Holdings, Inc., Company Guarantee, 10.50%, 7/15/2019 | 7,614,000 |
| 6,150,000 | 1,2 | Cumulus Media, Inc., Sr. Note, Series 144A, 7.75%, 5/1/2019 | 5,488,875 |
| 6,575,000 | 1,2 | Entercom Radio LLC, Sr. Unsecd. Note, Series 144A, 10.50%, 12/1/2019 | 6,607,875 |
| 6,025,000 | | Entravision Communications Corp., Sr. Secd. Note, 8.75%, 8/1/2017 | 5,934,625 |
| 6,875,000 | 1,2 | FoxCo Acquisitions, LLC, Sr. Note, Series 144A, 13.375%, 7/15/2016 | 7,536,719 |
| 2,750,000 | 1,2 | Houghton Mifflin Co., Sr. Secd. Note, Series 144A, 10.50%, 6/1/2019 | 1,691,250 |
| 5,200,000 | 3 | Idearc, Inc., Company Guarantee, (Litigation Trust Interests), 8.00%, 11/15/2016 | 58,500 |
| 3,050,000 | | Intelsat Bermuda, Ltd., Company Guarantee, 11.50%, 2/4/2017 | 2,950,875 |
| 5,300,000 | | Intelsat Jackson Holdings S.A., Company Guarantee, 8.50%, 11/1/2019 | 5,631,250 |
| 1,625,000 | 1,2 | Intelsat Jackson Holdings S.A., Company Guarantee, Series 144A, 7.25%, 4/1/2019 | 1,653,438 |
| 2,350,000 | 1,2 | Intelsat Jackson Holdings S.A., Company Guarantee, Series 144A, 7.50%, 4/1/2021 | 2,382,312 |
| 17,475,000 | | Intelsat Jackson Holdings S.A., Sr. Note, 11.25%, 6/15/2016 | 18,403,359 |
| 3,900,000 | | Lamar Media Corp., Company Guarantee, 7.875%, 4/15/2018 | 4,153,500 |
| 2,750,000 | | Lamar Media Corp., Sr. Sub. Note, Series B, 6.625%, 8/15/2015 | 2,811,875 |
| 3,450,000 | | Lamar Media Corp., Sr. Unsecd. Note, Series C, 6.625%, 8/15/2015 | 3,527,625 |
| 7,775,000 | | MDC Partners, Inc., Company Guarantee, 11.00%, 11/1/2016 | 8,358,125 |
| 1,200,000 | 1,2 | MDC Partners, Inc., Company Guarantee, Series 144A, 11.00%, 11/1/2016 | 1,278,000 |
| 2,275,000 | | Nexstar Broadcasting Group, Inc., Company Guarantee, 7.00%, 1/15/2014 | 2,232,344 |
| 4,701,808 | | Nexstar Broadcasting Group, Inc., Company Guarantee, Series 1, 7.00%, 1/15/2014 | 4,613,649 |
| 1,550,000 | | Nexstar Broadcasting Group, Inc., Sr. Secd. Note, Series WI, 8.875%, 4/15/2017 | 1,596,500 |
| 2,475,000 | | Nielsen Finance LLC/Nielsen Finance Co., Company Guarantee, 7.75%, 10/15/2018 | 2,685,375 |
| 4,750,000 | 1,2 | ProQuest Co., Company Guarantee, Series 144A, 9.00%, 10/15/2018 | 3,871,250 |
| 8,325,000 | | SSI Investments II Ltd., Company Guarantee, 11.125%, 6/1/2018 | 8,845,312 |
| 4,450,000 | 1,2 | Sirius XM Radio Inc., Sr. Note, Series 144A, 8.75%, 4/1/2015 | 4,895,000 |
| 8,523,000 | | Southern Graphics Systems, Inc., Sr. Sub. Note, Series WI, 12.00%, 12/15/2013 | 8,608,230 |
| 4,525,000 | 1,2 | XM Satellite Radio, Inc., Sr. Unsecd. Note, Series 144A, 7.625%, 11/1/2018 | 4,773,875 |
| | TOTAL | 148,936,613 |
| | Metals & Mining – 0.0% | |
| 1,825,000 | 3,4,5 | Aleris International, Inc., Company Guarantee, 9.00%, 12/15/2014 | 183 |
| 2,325,000 | 3,4,5 | Aleris International, Inc., Sr. Sub. Note, 10.00%, 12/15/2016 | 0 |
| | TOTAL | 183 |
| | Packaging – 3.9% | |
| 4,950,000 | 1,2 | Ardagh Packaging Finance PLC, Company Guarantee, Series 144A, 9.125%, 10/15/2020 | 4,925,250 |
| 3,025,000 | | Berry Plastics Corp., Sr. Secd. Note, 9.50%, 5/15/2018 | 3,055,250 |
| 3,325,000 | | Bway Holding Co., Company Guarantee, Series WI, 10.00%, 6/15/2018 | 3,557,750 |
| 7,236,444 | | Bway Holding Co., Sr. Unsecd. Note, 10.125%, 11/1/2015 | 7,055,533 |
| 1,575,000 | | Crown Americas, LLC, Company Guarantee, 6.25%, 2/1/2021 | 1,653,750 |
| 2,075,000 | | Crown Americas, LLC, Company Guarantee, 7.625%, 5/15/2017 | 2,274,719 |
| 3,850,000 | | Greif, Inc., Sr. Unsecd. Note, 7.75%, 8/1/2019 | 4,177,250 |
| 1,325,000 | | Owens-Brockway Glass Container, Inc., Company Guarantee, 7.375%, 5/15/2016 | 1,457,500 |
| 6,150,000 | 1,2 | Packaging Dynamics Corp., Sr. Secd. Note, Series 144A, 8.75%, 2/1/2016 | 6,180,750 |
| 4,825,000 | 1,2 | Reynolds Group, Sr. Note, Series 144A, 9.00%, 4/15/2019 | 4,607,875 |
Annual Shareholder Report23
Principal
Amount
or Shares | | | Value |
| $4,500,000 | 1,2 | Reynolds Group, Sr. Note, Series 144A, 9.25%, 5/15/2018 | 4,331,250 |
| 3,650,000 | 1,2 | Reynolds Group, Sr. Note, Series 144A, 9.875%, 8/15/2019 | 3,558,750 |
| 1,850,000 | 1,2 | Reynolds Group, Sr. Secd. Note, Series 144A, 7.125%, 4/15/2019 | 1,891,625 |
| 3,275,000 | 1,2 | Reynolds Group, Sr. Secd. Note, Series 144A, 8.75%, 10/15/2016 | 3,463,312 |
| 12,625,000 | 1,2 | Reynolds Group, Sr. Unsecd. Note, Series 144a, 8.25%, 2/15/2021 | 11,236,250 |
| 8,475,000 | 1,2 | Sealed Air Corp., Sr. Unsecd. Note, Series 144A, 8.375%, 9/15/2021 | 9,407,250 |
| | TOTAL | 72,834,064 |
| | Paper – 0.9% | |
| 2,000,000 | | Boise Paper Holdings, LLC, Company Guarantee, 9.00%, 11/1/2017 | 2,160,000 |
| 1,450,000 | | Cascades, Inc., Company Guarantee, Series WI, 7.875%, 1/15/2020 | 1,413,750 |
| 750,000 | | Clearwater Paper Corp., Company Guarantee, 7.125%, 11/1/2018 | 783,750 |
| 1,000,000 | | Clearwater Paper Corp., Sr. Unsecd. Note, 10.625%, 6/15/2016 | 1,120,000 |
| 850,000 | | Graphic Packaging International Corp., Company Guarantee, 9.50%, 6/15/2017 | 935,000 |
| 1,800,000 | | Graphic Packaging International Corp., Sr. Note, 7.875%, 10/1/2018 | 1,926,000 |
| 3,470,000 | 1,2 | Longview Fibre Co., Sr. Secd. Note, Series 144A, 8.00%, 6/1/2016 | 3,487,350 |
| 5,725,000 | | Rock-Tenn Co., Company Guarantee, 9.25%, 3/15/2016 | 6,097,125 |
| | TOTAL | 17,922,975 |
| | Restaurants – 1.4% | |
| 10,890,000 | | DineEquity Inc., Company Guarantee, Series WI, 9.50%, 10/30/2018 | 11,747,587 |
| 9,125,000 | 1,2 | NPC International, Inc., 10.50%, 1/15/2020 | 9,216,250 |
| 6,625,000 | 1,2 | Seminole Hard Rock Entertainment, Inc./Seminole Hard Rock International LLC, Sr. Secd. Note, Series 144A, 3.046%, 3/15/2014 | 6,227,500 |
| | TOTAL | 27,191,337 |
| | Retailers – 4.6% | |
| 6,225,000 | 1,2 | Academy Finance Corp., Series 144A, 9.25%, 8/1/2019 | 6,178,312 |
| 3,600,000 | | Express, LLC, Company Guarantee, 8.75%, 3/1/2018 | 3,915,000 |
| 8,675,000 | | Gymboree Corp., Sr. Unsecd. Note, 9.125%, 12/1/2018 | 7,634,000 |
| 1,575,000 | | JC Penney Corp., Inc., Sr. Unsecd. Note, 7.40%, 4/1/2037 | 1,472,625 |
| 10,850,000 | 1,2 | Jo-Ann Stores, Inc., Sr. Unsecd. Note, Series 144A, 8.125%, 3/15/2019 | 10,388,875 |
| 5,950,000 | | Limited Brands, Inc., Company Guarantee, 8.50%, 6/15/2019 | 6,961,500 |
| 4,825,000 | | Michaels Stores, Inc., Company Guarantee, 7.75%, 11/1/2018 | 4,897,375 |
| 9,775,000 | 1,2 | PETCO Animal Supplies, Inc., Sr. Note, Series 144A, 9.25%, 12/1/2018 | 10,532,562 |
| 2,275,000 | 1,2 | QVC, Inc., Sr. Secd. Note, Series 144A, 7.125%, 4/15/2017 | 2,422,875 |
| 3,475,000 | 1,2 | QVC, Inc., Sr. Secd. Note, Series 144A, 7.50%, 10/1/2019 | 3,744,313 |
| 3,650,000 | 1,2 | Sally Beauty Holdings, Inc., Sr. Note, Series 144A, 6.875%, 11/15/2019 | 3,832,500 |
| 1,875,000 | | The Yankee Candle Co., Inc., Sr. Note, Series B, 8.50%, 2/15/2015 | 1,903,125 |
| 10,100,000 | | The Yankee Candle Co., Inc., Sr. Sub. Note, Series B, 9.75%, 2/15/2017 | 9,898,000 |
| 8,750,000 | | United Auto Group, Inc., Sr. Sub. Note, 7.75%, 12/15/2016 | 9,012,500 |
| 4,800,000 | | YCC Holdings LLC, Sr. Unsecd. Note, 10.25%, 2/15/2016 | 4,224,000 |
| | TOTAL | 87,017,562 |
| | Services – 1.9% | |
| 7,875,000 | 1,2 | Garda World Security Corp., Sr. Unsecd. Note, Series 144A, 9.75%, 3/15/2017 | 8,032,500 |
| 4,150,000 | 1,2 | Reliance Intermediate Holdings LP, Sr. Unsecd. Note, Series 144A, 9.50%, 12/15/2019 | 4,419,750 |
| 5,925,000 | | Trans Union LLC, Company Guarantee, Series 144A, 11.375%, 6/15/2018 | 6,798,937 |
| 9,300,000 | | West Corp., Company Guarantee, 11.00%, 10/15/2016 | 9,834,750 |
| 5,800,000 | | West Corp., Company Guarantee, 7.875%, 1/15/2019 | 5,785,500 |
| 775,000 | | West Corp., Company Guarantee, 8.625%, 10/1/2018 | 786,625 |
| | TOTAL | 35,658,062 |
| | Technology – 11.9% | |
| 475,000 | | Advanced Micro Devices, Inc., Sr. Unsecd. Note, 7.75%, 8/1/2020 | 490,438 |
Annual Shareholder Report24
Principal
Amount
or Shares | | | Value |
| $7,475,000 | | Advanced Micro Devices, Inc., Sr. Unsecd. Note, Series WI, 8.125%, 12/15/2017 | 7,792,687 |
| 7,950,000 | 1,2 | Allen Systems Group, Inc., Sr. Secd. 2nd Priority Note, Series 144A, 10.50%, 11/15/2016 | 6,956,250 |
| 7,125,000 | | Aspect Software, Inc., Sr. Note, Series WI, 10.625%, 5/15/2017 | 7,427,812 |
| 2,975,000 | 1,2 | Beagle Acquisition Corp., Sr. Unsecd. Note, Series 144A, 11.00%, 12/31/2019 | 3,127,469 |
| 2,800,000 | | CDW LLC/ CDW Finance, Company Guarantee, 12.535%, 10/12/2017 | 2,828,000 |
| 11,850,000 | | CDW LLC/ CDW Finance, Sr. Unsecd. Note, Series WI, 8.50%, 4/1/2019 | 11,998,125 |
| 1,500,000 | | Ceridian Corp., Sr. Unsecd. Note, 11.25%, 11/15/2015 | 1,177,500 |
| 8,950,000 | 1,2 | CommScope, Inc., Sr. Note, Series 144A, 8.25%, 1/15/2019 | 8,994,750 |
| 8,675,000 | 1,2 | Compucom System, Inc., Sr. Sub. Note, Series 144A, 12.50%, 10/1/2015 | 8,891,875 |
| 7,000,000 | 1,2 | CoreLogic, Inc., Sr. Unsecd. Note, Series 144A, 7.25%, 6/1/2021 | 6,737,500 |
| 8,025,000 | 1,2 | Eagle Parent, Inc., Sr. Note, Series 144A, 8.625%, 5/1/2019 | 7,704,000 |
| 1,950,000 | | Fidelity National Information Services, Inc., Company Guarantee, Series WI, 7.625%, 7/15/2017 | 2,120,625 |
| 5,050,000 | | Fidelity National Information Services, Inc., Company Guarantee, Series WI, 7.875%, 7/15/2020 | 5,479,250 |
| 3,900,000 | 1,2 | First Data Corp., Sr. Secd. 2nd Priority Note, Series 144A, 8.25%, 1/15/2021 | 3,510,000 |
| 4,525,000 | 1,2 | First Data Corp., Sr. Secd. 2nd Priority Note, Series 144A, 8.75%, 1/15/2022 | 3,914,125 |
| 6,675,000 | | Freescale Semiconductor, Inc., Company Guarantee, 10.75%, 8/1/2020 | 6,992,062 |
| 6,625,000 | 1,2 | Freescale Semiconductor, Inc., Sr. Secd. Note, Series 144A, 9.25%, 4/15/2018 | 7,113,594 |
| 8,025,000 | | GXS WORLDWIDE INC., Sr. Secd. Note, 9.75%, 6/15/2015 | 7,463,250 |
| 7,350,000 | 1,2 | IGATE Capital Corp., Sr. Note, Series 144A, 9.00%, 5/1/2016 | 7,625,625 |
| 5,750,000 | | Interactive Data Corp., Company Guarantee, 10.25%, 8/1/2018 | 6,325,000 |
| 3,650,000 | | Iron Mountain, Inc., Sr. Sub. Note, 7.75%, 10/1/2019 | 3,873,563 |
| 5,800,000 | | Kemet Corp., Sr. Note, 10.50%, 5/1/2018 | 6,162,500 |
| 7,700,000 | | Lender Processing Services, Sr. Note, 8.125%, 7/1/2016 | 7,603,750 |
| 6,575,000 | | MagnaChip Semiconductor S.A., Sr. Note, Series WI, 10.50%, 4/15/2018 | 6,870,875 |
| 6,462,000 | | SERENA Software, Inc., Sr. Sub. Note, 10.375%, 3/15/2016 | 6,655,860 |
| 7,875,000 | | SITEL Corp., Sr. Unsecd. Note, 11.50%, 4/1/2018 | 5,847,187 |
| 2,600,000 | 1,2 | Seagate Technology HDD Holdings, Company Guarantee, Series 144A, 7.75%, 12/15/2018 | 2,778,750 |
| 6,450,000 | | Seagate Technology HDD Holdings, Sr. Note, 6.80%, 10/1/2016 | 6,933,750 |
| 1,875,000 | | Seagate Technology HDD Holdings, Sr. Unsecd. Note, 6.875%, 5/1/2020 | 1,935,938 |
| 1,550,000 | 1,2 | Seagate Technology HDD Holdings, Sr. Unsecd. Note, Series 144A, 7.00%, 11/1/2021 | 1,596,500 |
| 6,125,000 | 1,2 | SoftBrands, Inc., Sr. Note, Series 144A, 11.50%, 7/15/2018 | 5,971,875 |
| 4,350,000 | 1,2 | Solera Holdings, Inc., Company Guarantee, Series 144A, 6.75%, 6/15/2018 | 4,415,250 |
| 6,550,000 | | Spansion, Inc., Sr. Unsecd. Note, Series WI, 7.875%, 11/15/2017 | 5,993,250 |
| 5,875,000 | | Stream Global Services, Inc., Sr. Secd. Note, 11.25%, 10/1/2014 | 5,992,500 |
| 5,425,000 | | SunGard Data Systems, Inc., Company Guarantee, 10.625%, 5/15/2015 | 5,804,750 |
| 1,250,000 | | SunGard Data Systems, Inc., Company Guarantee, 7.375%, 11/15/2018 | 1,285,938 |
| 9,625,000 | | SunGard Data Systems, Inc., Sr. Sub. Note, Series WI, 10.25%, 8/15/2015 | 10,022,031 |
| 8,475,000 | | Syniverse Holdings, Inc., Company Guarantee, 9.125%, 1/15/2019 | 8,983,500 |
| 1,800,000 | 1,2 | Viasystems, Inc., Sr. Secd. Note, Series 144A, 12.00%, 1/15/2015 | 1,937,250 |
| | TOTAL | 225,334,954 |
| | Transportation – 1.0% | |
| 5,850,000 | | Avis Budget Group, Inc., Company Guarantee, 8.25%, 1/15/2019 | 5,835,375 |
| 4,525,000 | | Avis Budget Group, Inc., Company Guarantee, 9.625%, 3/15/2018 | 4,706,000 |
| 4,100,000 | | Hertz Corp., Company Guarantee, 6.75%, 4/15/2019 | 4,130,750 |
| 1,500,000 | | Hertz Corp., Company Guarantee, 7.50%, 10/15/2018 | 1,575,000 |
| 474,000 | | Hertz Corp., Sr. Note, 8.875%, 1/1/2014 | 478,740 |
| 1,425,000 | | Stena AB, Sr. Note, 7.00%, 12/1/2016 | 1,316,344 |
| | TOTAL | 18,042,209 |
Annual Shareholder Report25
Principal
Amount
or Shares | | | Value |
| | Utility - Electric – 1.6% | |
| $9,825,000 | 1,2 | Calpine Corp., Sr. Secd. Note, Series 144A, 7.50%, 2/15/2021 | 10,561,875 |
| 2,075,000 | | Edison Mission Energy, Sr. Note, 7.75%, 6/15/2016 | 1,525,125 |
| 1,200,000 | | Edison Mission Energy, Sr. Unsecd. Note, 7.00%, 5/15/2017 | 786,000 |
| 1,082,908 | 1 | FPL Energy National Wind, Note, Series 144A, 6.125%, 3/25/2019 | 1,066,127 |
| 1,025,000 | 1,2 | NRG Energy, Inc., Company Guarantee, Series 144A, 7.625%, 5/15/2019 | 1,009,625 |
| 1,775,000 | 1,2 | NRG Energy, Inc., Company Guarantee, Series 144A, 7.875%, 5/15/2021 | 1,739,500 |
| 10,200,000 | | NRG Energy, Inc., Company Guarantee, Series WI, 7.625%, 1/15/2018 | 10,251,000 |
| 3,975,000 | | Texas Competitive Electric Holdings Co. LLC, Company Guarantee, Series A, 10.25%, 11/1/2015 | 1,431,000 |
| 3,025,000 | 1,2 | Texas Competitive Electric Holdings Co. LLC, Sr. Secd. Note, Series 144A, 11.50%, 10/1/2020 | 2,582,594 |
| | TOTAL | 30,952,846 |
| | Utility - Natural Gas – 2.4% | |
| 9,150,000 | | Crosstex Energy, Inc., Company Guarantee, 8.875%, 2/15/2018 | 10,042,125 |
| 10,450,000 | | Energy Transfer Equity LP, Sr. Unsecd. Note, 7.50%, 10/15/2020 | 11,468,875 |
| 1,900,000 | | Ferrellgas, L.P., Sr. Unsecd. Note, 6.50%, 5/1/2021 | 1,681,500 |
| 5,500,000 | | Holly Energy Partners LP, Sr. Note, 6.25%, 3/1/2015 | 5,568,750 |
| 7,125,000 | | Inergy LP, Company Guarantee, 6.875%, 8/1/2021 | 7,196,250 |
| 1,125,000 | | Regency Energy Partners LP, Company Guarantee, 9.375%, 6/1/2016 | 1,243,125 |
| 4,275,000 | | Regency Energy Partners LP, Sr. Note, 6.875%, 12/1/2018 | 4,563,562 |
| 2,975,000 | | Southern Star Central Corp., Sr. Note, 6.75%, 3/1/2016 | 3,041,938 |
| | TOTAL | 44,806,125 |
| | Wireless Communications – 3.4% | |
| 1,175,000 | 1,2 | Digicel Ltd., Sr. Note, Series 144A, 10.50%, 4/15/2018 | 1,192,625 |
| 3,475,000 | 1,2 | Digicel Ltd., Sr. Note, Series 144A, 12.00%, 4/1/2014 | 3,909,375 |
| 3,125,000 | 1,2 | Digicel Ltd., Sr. Note, Series 144A, 8.25%, 9/1/2017 | 3,171,875 |
| 8,225,000 | 1,2 | Digicel Ltd., Sr. Note, Series 144A, 8.875%, 1/15/2015 | 8,142,750 |
| 2,425,000 | 1,2 | Digicel Ltd., Sr. Note, Series 144A, 9.125%, 1/15/2015 | 2,388,625 |
| 6,475,000 | | MetroPCS Wireless, Inc., Sr. Note, 6.625%, 11/15/2020 | 6,054,125 |
| 5,500,000 | | MetroPCS Wireless, Inc., Sr. Note, 7.875%, 9/1/2018 | 5,603,125 |
| 5,600,000 | | Nextel Communications, Inc., Sr. Note, Series D, 7.375%, 8/1/2015 | 5,152,000 |
| 925,000 | | Sprint Capital Corp., Company Guarantee, 6.875%, 11/15/2028 | 664,844 |
| 18,850,000 | | Sprint Capital Corp., Company Guarantee, 6.90%, 5/1/2019 | 15,598,375 |
| 7,300,000 | 1,2 | Sprint Capital Corp., Gtd. Note, Series 144A, 9.00%, 11/15/2018 | 7,683,250 |
| 1,800,000 | 1,2 | Sprint Capital Corp., Note, 11.50%, 11/15/2021 | 1,786,500 |
| 3,650,000 | | Sprint Nextel Corp., Unsecd. Note, 6.00%, 12/1/2016 | 3,047,750 |
| | TOTAL | 64,395,219 |
| | Wireline Communications – 0.5% | |
| 3,775,000 | 1,2 | Level 3 Communications, Inc., Sr. Unsecd. Note, Series 144A, 8.125%, 7/1/2019 | 3,727,813 |
| 725,000 | | TW Telecom, Inc., Company Guarantee, Series WI, 8.00%, 3/1/2018 | 775,750 |
| 4,900,000 | | Windstream Corp., Company Guarantee, 8.125%, 9/1/2018 | 5,273,625 |
| | TOTAL | 9,777,188 |
| | TOTAL CORPORATE BONDS
(IDENTIFIED COST $1,797,002,491) | 1,832,497,595 |
| | COMMON STOCKS – 0.1% | |
| | Automotive – 0.1% | |
| 51,301 | 3 | General Motors Co. | 1,039,871 |
| 12,700,000 | 1,3 | General Motors Co. Escrow Shares | 190,500 |
| | TOTAL | 1,230,371 |
| | Metals & Mining – 0.0% | |
| 57,533 | 1,3,5 | Royal Oak Mines, Inc. | 0 |
Annual Shareholder Report26
Principal
Amount
or Shares | | | Value |
| | Other – 0.0% | |
| 171 | 1,3,5 | CVC Claims Litigation LLC | 0 |
| | TOTAL COMMON STOCKS
(IDENTIFIED COST $6,441,659) | 1,230,371 |
| | PREFERRED STOCK – 0.2% | |
| | Financial Institutions – 0.2% | |
| 4,300 | 1,2 | Ally Financial, Inc., Pfd., Series 144A, 7.000%
(IDENTIFIED COST $1,352,990) | 3,082,697 |
| | WARRANTS – 0.0% | |
| | Automotive – 0.0% | |
| 46,637 | 3 | General Motors Co., Warrants | 547,052 |
| 46,637 | 3 | General Motors Co., Warrants | 364,702 |
| | TOTAL WARRANTS
(IDENTIFIED COST $5,097,581) | 911,754 |
| | MUTUAL FUND – 0.9% | |
| 16,682,856 | 6,7 | Federated Prime Value Obligations Fund, Institutional Shares, 0.21%
(AT NET ASSET VALUE) | 16,682,856 |
| | TOTAL INVESTMENTS — 98.3%
(IDENTIFIED COST $1,826,577,577)8 | 1,854,405,273 |
| | OTHER ASSETS AND LIABILITIES - NET — 1.7%9 | 32,093,933 |
| | TOTAL NET ASSETS — 100% | $1,886,499,206 |
| 1 | Denotes a restricted security that either: (a) cannot be offered for public sale without first being registered, or being able to take advantage of an exemption from registration, under the Securities Act of 1933; or (b) is subject to a contractual restriction on public sales. At December 31, 2011, these restricted securities amounted to $563,498,881, which represented 29.9% of total net assets. |
| 2 | Denotes a restricted security that may be resold without restriction to “qualified institutional buyers” as defined in Rule 144A under the Securities Act of 1933 and that the Fund has determined to be liquid under criteria established by the Fund's Board of Trustees (the “Trustees”). At December 31, 2011, these liquid restricted securities amounted to $559,050,254, which represented 29.6% of total net assets. |
| 3 | Non-income producing security. |
| 4 | Issuer in default. |
| 5 | Market quotations and price evaluations are not available. Fair value determined in accordance with procedures established by and under the general supervision of the Trustees. |
| 6 | Affiliated holding. |
| 7 | 7-Day net yield. |
| 8 | The cost of investments for federal tax purposes amounts to $1,816,343,426. |
| 9 | Assets, other than investments in securities, less liabilities. See Statement of Assets and Liabilities. |
Note: The categories of investments are shown as a percentage of total net assets at December 31, 2011.
Various inputs are used in determining the value of the Fund's investments. These inputs are summarized in the three broad levels listed below:
Level 1 — quoted prices in active markets for identical securities, including investment companies with daily net asset values, if applicable. Level 2 — other significant observable inputs (including quoted prices for similar securities, interest rates, prepayment speeds, credit risk, etc.). Also includes securities valued at amortized cost. Level 3 — significant unobservable inputs (including the Fund's own assumptions in determining the fair value of investments).The inputs or methodology used for valuing securities are not an indication of the risk associated with investing in those securities.
Annual Shareholder Report
27
The following is a summary of the inputs used, as of December 31, 2011, in valuing the Fund's assets carried at fair value:| Valuation Inputs |
| Level 1 —
Quoted
Prices and
Investments in
Mutual Funds | Level 2 —
Other
Significant
Observable
Inputs | Level 3 —
Significant
Unobservable
Inputs | Total |
| Debt Securities: | | | | |
| Corporate Bonds | $ — | $1,832,497,412 | $183 | $1,832,497,595 |
| Equity Securities: | | | | |
| Common Stock | | | | |
| Domestic | 1,230,371 | — | 0 | 1,230,371 |
| International | — | — | 0 | 0 |
| Preferred Stock | | | | |
| Domestic | — | 3,082,697 | — | 3,082,697 |
| Warrants | 911,754 | — | — | 911,754 |
| Mutual Fund | 16,682,856 | — | — | 16,682,856 |
| TOTAL SECURITIES | $18,824,981 | $1,835,580,109 | $183 | $1,854,405,273 |
Following is a reconciliation of assets in which significant unobservable inputs (Level 3) were used in determining fair value:
| Investments
in Corporate
Bond
Securities | Investments
in Equity-
Domestic
Securities | Investments
in Equity-
International
Securities |
| Balance as of January 1, 2011 | $0 | $0 | $1,360 |
| Change in unrealized appreciation/depreciation | (11,782) | — | (1,360) |
| (Sales) | (2,083) | — | — |
| Transfers in and/or out of Level 3 | 14,0481 | — | — |
| Balance as of December 31, 2011 | $183 | $0 | $0 |
| The total change in unrealized appreciation (depreciation) included in the Statement of Operations attributable to investments still held at December 31, 2011. | $(11,782) | $ — | $(1,360) |
| 1 | Transferred from Level 2 to Level 3 because fair values were determined using valuation techniques utilizing unobservable market data due to observable market data being unavailable. Transfers shown represent the value of the securities at the beginning of the period. |
See Notes which are an integral part of the Financial Statements
Annual Shareholder Report28
Financial Highlights – High Yield Bond Portfolio
(For a Share Outstanding Throughout Each Period)
| Year Ended December 31 | 2011 | 2010 | 2009 | 2008 | 2007 |
| Net Asset Value, Beginning of Period | $6.55 | $6.27 | $4.57 | $6.61 | $6.88 |
| Income From Investment Operations: | | | | | |
| Net investment income | 0.57 | 0.61 | 0.57 | 0.58 | 0.58 |
| Net realized and unrealized gain (loss) on investments and foreign currency transactions | (0.19) | 0.29 | 1.69 | (2.04) | (0.28) |
| TOTAL FROM INVESTMENT OPERATIONS | 0.38 | 0.90 | 2.26 | (1.46) | 0.30 |
| Less Distributions: | | | | | |
| Distributions from net investment income | (0.58) | (0.62) | (0.56) | (0.58) | (0.57) |
| Net Asset Value, End of Period | $6.35 | $6.55 | $6.27 | $4.57 | $6.61 |
| Total Return1 | 6.04% | 15.06% | 51.79% | (23.53)% | 4.48% |
| Ratios to Average Net Assets: | | | | | |
| Net expenses | 0.00%2 | 0.00%2 | 0.00%2 | 0.03% | 0.03% |
| Net investment income | 8.75% | 9.41% | 11.01% | 10.02% | 8.20% |
| Expense waiver/reimbursement3 | 0.10% | 0.10% | 0.10% | 0.08% | 0.08% |
| Supplemental Data: | | | | | |
| Net assets, end of period (000 omitted) | $1,886,499 | $1,995,842 | $1,609,205 | $887,322 | $843,319 |
| Portfolio turnover | 34% | 37% | 20% | 16% | 35% |
| 1 | Based on net asset value. |
| 2 | The Adviser has voluntarily agreed to reimburse all operating expenses incurred by the Fund. This arrangement has no fixed term. |
| 3 | This expense decrease is reflected in both the net expense and the net investment income ratios shown above. |
See Notes which are an integral part of the Financial Statements
Annual Shareholder Report29
Statement of Assets and Liabilities – High Yield Bond Portfolio
December 31, 2011
| Assets: | | |
| Total investments in securities, at value including $16,682,856 of investments in an affiliated holding (Note 5) (identified cost $1,826,577,577) | | $1,854,405,273 |
| Income receivable | | 38,104,765 |
| Receivable for shares sold | | 7,500,000 |
| TOTAL ASSETS | | 1,900,010,038 |
| Liabilities: | | |
| Payable for shares redeemed | $26,000 | |
| Income distribution payable | 13,424,918 | |
| Payable to adviser (Note 5) | 1,102 | |
| Payable for Directors'/Trustees' fees | 848 | |
| Accrued expenses | 57,964 | |
| TOTAL LIABILITIES | | 13,510,832 |
| Net assets for 297,031,671 shares outstanding | | $1,886,499,206 |
| Net Assets Consist of: | | |
| Paid-in capital | | $1,873,435,655 |
| Net unrealized appreciation of investments | | 27,827,696 |
| Accumulated net realized loss on investments, swap contracts and foreign currency transactions | | (15,125,038) |
| Undistributed net investment income | | 360,893 |
| TOTAL NET ASSETS | | $1,886,499,206 |
| Net Asset Value, Offering Price and Redemption Proceeds Per Share: | | |
| $1,886,499,206 ÷ 297,031,671 shares outstanding, no par value, unlimited shares authorized | | $6.35 |
See Notes which are an integral part of the Financial Statements
Annual Shareholder Report30
Statement of Operations – High Yield Bond Portfolio
Year Ended December 31, 2011
| Investment Income: | | | |
| Interest | | | $167,675,726 |
| Dividends (including $30,744 received from an affiliated holding (Note 5)) | | | 341,246 |
| TOTAL INCOME | | | 168,016,972 |
| Expenses: | | | |
| Administrative fee (Note 5) | | $1,498,783 | |
| Custodian fees | | 69,460 | |
| Transfer and dividend disbursing agent fees and expenses | | 15,039 | |
| Directors'/Trustees' fees | | 15,421 | |
| Auditing fees | | 28,725 | |
| Legal fees | | 6,969 | |
| Portfolio accounting fees | | 202,865 | |
| Printing and postage | | 10,893 | |
| Insurance premiums | | 9,188 | |
| Miscellaneous | | 8,738 | |
| TOTAL EXPENSES | | 1,866,081 | |
| Waiver and Reimbursement (Note 5): | | | |
| Waiver of administrative fee | $(1,498,783) | | |
| Reimbursement of other operating expenses | (367,298) | | |
| TOTAL WAIVER AND REIMBURSEMENT | | (1,866,081) | |
| Net expenses | | | — |
| Net investment income | | | 168,016,972 |
| Realized and Unrealized Gain (Loss) on Investments: | | | |
| Net realized gain on investments | | | 50,595,913 |
| Net change in unrealized appreciation of investments | | | (104,874,354) |
| Net realized and unrealized loss on investments | | | (54,278,441) |
| Change in net assets resulting from operations | | | $113,738,531 |
See Notes which are an integral part of the Financial Statements
Annual Shareholder Report31
Statement of Changes in Net Assets – High Yield Bond Portfolio
| Year Ended December 31 | 2011 | 2010 |
| Increase (Decrease) in Net Assets | | |
| Operations: | | |
| Net investment income | $168,016,972 | $174,413,460 |
| Net realized gain on investments | 50,595,913 | 1,175,272 |
| Net change in unrealized appreciation/depreciation of investments and translation of assets and liabilities in foreign currency | (104,874,354) | 81,088,327 |
| CHANGE IN NET ASSETS RESULTING FROM OPERATIONS | 113,738,531 | 256,677,059 |
| Distributions to Shareholders: | | |
| Distributions from net investment income | (172,505,203) | (180,820,404) |
| Share Transactions: | | |
| Proceeds from sale of shares | 240,058,657 | 536,950,223 |
| Net asset value of shares issued to shareholders in payment of distributions declared | 8,141,279 | 12,820,982 |
| Cost of shares redeemed | (298,775,834) | (238,991,030) |
| CHANGE IN NET ASSETS RESULTING FROM SHARE TRANSACTIONS | (50,575,898) | 310,780,175 |
| Change in net assets | (109,342,570) | 386,636,830 |
| Net Assets: | | |
| Beginning of period | 1,995,841,776 | 1,609,204,946 |
| End of period (including undistributed net investment income of $360,893 and $320,562, respectively) | $1,886,499,206 | $1,995,841,776 |
See Notes which are an integral part of the Financial Statements
Annual Shareholder Report32
Notes to Financial Statements – High Yield Bond Portfolio
December 31, 2011
1. ORGANIZATION
Federated Core Trust (the “Trust”) is registered under the Investment Company Act of 1940, as amended (the “Act”), as a diversified, open-end management investment company. The Trust consists of five diversified portfolios. The financial statements included herein are only those of High Yield Bond Portfolio (the “Fund”). The financial statements of the other portfolios are presented separately. The assets of each portfolio are segregated and a shareholder's interest is limited to the portfolio in which shares are held. Each portfolio pays its own expenses. The investment objective of the Fund is to seek high current income.
The Fund's portfolio consists primarily of lower-rated, corporate debt obligations. These lower-rated debt obligations may be more susceptible to real or perceived adverse economic conditions than investment-grade bonds. These lower-rated debt obligations are regarded as predominately speculative with respect to each issuer's continuing ability to make interest and principal payments (i.e., the obligations are subject to the risk of default). Currently, Shares of the Fund are being offered for investment only to investment companies, insurance company separate accounts, common or commingled trust funds or similar organizations or parties that are “accredited investors” within the meaning of Regulation D of the Securities Act of 1933.
2. SIGNIFICANT ACCOUNTING POLICIES
The following is a summary of significant accounting policies consistently followed by the Fund in the preparation of its financial statements. These policies are in conformity with U.S. generally accepted accounting principles (GAAP).
Investment Valuation
In calculating its net asset value (NAV), the Fund generally values investments as follows:
- Fixed-income securities acquired with remaining maturities greater than 60 days are fair valued using price evaluations provided by a pricing service approved by the Trustees.
- Fixed-income securities acquired with remaining maturities of 60 days or less are valued at their cost (adjusted for the accretion of any discount or amortization of any premium), which approximates market value.
- Shares of other mutual funds are valued based upon their reported NAVs.
- Equity securities listed on an exchange or traded through a regulated market system are valued at their last reported sale price or official closing price in their principal exchange or market.
- Derivative contracts listed on exchanges are valued at their reported settlement or closing price.
- Over-the-counter (OTC) derivative contracts are fair valued using price evaluations provided by a pricing service approved by the Trustees.
- For securities that are fair valued in accordance with procedures established by and under the general supervision of the Trustees, certain factors may be considered such as: the purchase price of the security, information obtained by contacting the issuer, analysis of the issuer's financial statements or other available documents, fundamental analytical data, the nature and duration of restrictions on disposition, the movement of the market in which the security is normally traded and public trading in similar securities of the issuer or comparable issuers.
If the Fund cannot obtain a price or price evaluation from a pricing service for an investment, the Fund may attempt to value the investment based upon the mean of bid and asked quotations or fair value the investment based on price evaluations, from one or more dealers. If any price, quotation, price evaluation or other pricing source is not readily available when the NAV is calculated, the Fund uses the fair value of the investment determined in accordance with the procedures described below. There can be no assurance that the Fund could purchase or sell an investment at the price used to calculate the Fund's NAV.
Fair Valuation and Significant Events Procedures
The Trustees have authorized the use of pricing services to provide evaluations of the current fair value of certain investments for purposes of calculating the NAV. Factors considered by pricing services in evaluating an investment include the yields or prices of investments of comparable quality, coupon, maturity, call rights and other potential prepayments, terms and type, reported transactions, indications as to values from dealers and general market conditions. Some pricing services provide a single price evaluation reflecting the bid-side of the market for an investment (a “bid” evaluation). Other pricing services offer both bid evaluations and price evaluations indicative of a price between the prices bid and asked for the investment (a “mid” evaluation). The Fund normally uses bid evaluations for U.S. Treasury and Agency securities, mortgage-backed securities and municipal securities. The Fund normally uses mid evaluations for other types of fixed-income securities and OTC derivative contracts. In the event that market quotations and price evaluations are not available for an investment, the fair value of the investment is determined in accordance with procedures adopted by the Trustees.
The Trustees also have adopted procedures requiring an investment to be priced at its fair value whenever the Adviser determines that a significant event affecting the value of the investment has occurred between the time as of which the price of the investment would otherwise be determined and the time as of which the NAV is computed. An event is considered significant if there is both an affirmative expectation that the investment's value will change in response to the event and a reasonable basis for quantifying the resulting change in value. Examples of significant events that may occur after the close of the principal market on which a security is traded, or after the time of a price evaluation provided by a pricing service or a dealer, include:
- With respect to securities traded in foreign markets, significant trends in U.S. equity markets or in the trading of foreign securities index futures or options contracts;
- With respect to price evaluations of fixed-income securities determined before the close of regular trading on the NYSE, actions by the Federal Reserve Open Market Committee and other significant trends in U.S. fixed-income markets;
- Political or other developments affecting the economy or markets in which an issuer conducts its operations or its securities are traded; and
Annual Shareholder Report33
- Announcements concerning matters such as acquisitions, recapitalizations, litigation developments, a natural disaster affecting the issuer's operations or regulatory changes or market developments affecting the issuer's industry.
The Trustees have approved the use of a pricing service to determine the fair value of equity securities traded principally in foreign markets when the Adviser determines that there has been a significant trend in the U.S. equity markets or in index futures trading. For other significant events, the Fund may seek to obtain more current quotations or price evaluations from alternative pricing sources. If a reliable alternative pricing source is not available, the Fund will determine the fair value of the investment using another method approved by the Trustees.
Repurchase Agreements
The Fund may invest in repurchase agreements for short-term liquidity purposes. It is the policy of the Fund to require the other party to a repurchase agreement to transfer to the Fund's custodian or sub-custodian eligible securities or cash with a market value (after transaction costs) at least equal to the repurchase price to be paid under the repurchase agreement. The eligible securities are transferred to accounts with the custodian or sub-custodian in which the Fund holds a “securities entitlement” and exercises “control” as those terms are defined in the Uniform Commercial Code. The Fund has established procedures for monitoring the market value of the transferred securities and requiring the transfer of additional eligible securities if necessary to equal at least the repurchase price. These procedures also allow the other party to require securities to be transferred from the account to the extent that their market value exceeds the repurchase price or in exchange for other eligible securities of equivalent market value.
The insolvency of the other party or other failure to repurchase the securities may delay the disposition of the underlying securities or cause the Fund to receive less than the full repurchase price. Under the terms of the repurchase agreement, any amounts received by the Fund in excess of the repurchase price and related transaction costs must be remitted to the other party.
The Fund may enter into repurchase agreements in which eligible securities are transferred into joint trading accounts maintained by the custodian or sub-custodian for investment companies and other clients advised by the Fund's Adviser and its affiliates. The Fund will participate on a pro rata basis with the other investment companies and clients in its share of the securities transferred under such repurchase agreements and in its share of proceeds from any repurchase or other disposition of such securities.
Investment Income, Gains and Losses, Expenses and Distributions
Investment transactions are accounted for on a trade-date basis. Realized gains and losses from investment transactions are recorded on an identified-cost basis. Interest income and expenses are accrued daily. Dividend income and distributions to shareholders are recorded on the ex-dividend date. Foreign dividends are recorded on the ex-dividend date or when the Fund is informed of the ex-dividend date. Distributions of net investment income are declared daily and paid monthly. Non-cash dividends included in dividend income, if any, are recorded at fair value.
Premium and Discount Amortization
All premiums and discounts on fixed-income securities are amortized/accreted using the effective interest rate method.
Federal Taxes
It is the Fund's policy to comply with the Subchapter M provision of the Internal Revenue Code (the “Code”) and to distribute to shareholders each year substantially all of its income. Accordingly, no provision for federal income tax is necessary. As of and during the year ended December 31, 2011, the Fund did not have a liability for any uncertain tax positions. The Fund recognizes interest and penalties, if any, related to tax liabilities as income tax expense in the Statement of Operations. As of December 31, 2011, tax years 2008 through 2011 remain subject to examination by the Fund's major tax jurisdictions, which include the United States of America and the Commonwealth of Massachusetts.
When-Issued and Delayed Delivery Transactions
The Fund may engage in when-issued or delayed delivery transactions. The Fund records when-issued securities on the trade date and maintains security positions such that sufficient liquid assets will be available to make payment for the securities purchased. Securities purchased on a when-issued or delayed delivery basis are marked to market daily and begin earning interest on the settlement date. Losses may occur on these transactions due to changes in market conditions or the failure of counterparties to perform under the contract.
Foreign Currency Translation
The accounting records of the Fund are maintained in U.S. dollars. All assets and liabilities denominated in foreign currencies (FCs) are translated into U.S. dollars based on the rates of exchange of such currencies against U.S. dollars on the date of valuation. Purchases and sales of securities, income and expenses are translated at the rate of exchange quoted on the respective date that such transactions are recorded. The Fund does not isolate that portion of the results of operations resulting from changes in foreign exchange rates on investments from the fluctuations arising from changes in market prices of securities held. Such fluctuations are included with the net realized and unrealized gain or loss from investments.
Reported net realized foreign exchange gains or losses arise from sales of portfolio securities, sales and maturities of short-term securities, sales of FCs, currency gains or losses realized between the trade and settlement dates on securities transactions, the difference between the amounts of dividends, interest and foreign withholding taxes recorded on the Fund's books, and the U.S. dollar equivalent of the amounts actually received or paid. Net unrealized foreign exchange gains and losses arise from changes in the value of assets and liabilities other than investments in securities at fiscal year end, resulting from changes in the exchange rate.
Restricted Securities
The Fund may purchase securities which are considered restricted. Restricted securities are securities that either: (a) cannot be offered for public sale without first being registered, or being able to take advantage of an exemption from registration, under the Securities Act of 1933; or (b) are subject to contractual restrictions on public sales. In some cases, when a security cannot be offered for public sale without first being registered, the issuer of the restricted security has agreed to register such securities for resale, at the issuer's expense, either upon demand by the Fund or in connection with another registered offering of the securities. Many such restricted securities may be resold in the secondary market in Annual Shareholder Report
34
transactions exempt from registration. Restricted securities may be determined to be liquid under criteria established by the Trustees. The Fund will not incur any registration costs upon such resales. The Fund's restricted securities are valued at the price provided by dealers in the secondary market or, if no market prices are available, at the fair value as determined in accordance with procedures established by and under the general supervision of the Trustees.Additional information on restricted securities, excluding securities purchased under Rule 144A that have been deemed liquid by the Trustees, if applicable, held at December 31, 2011, is as follows:
| Security | Acquisition Date | Cost | Market Value |
| Altegrity, Inc., Company Guarantee, Series 144A, 11.75%, 5/1/2016 | 10/19/2007 – 2/8/2011 | $2,780,734 | $2,772,000 |
| American Standard Cos., Sr. Secd. Note, Series 144A, 10.75%, 1/15/2016 | 1/13/2011 | $700,000 | $420,000 |
| CVC Claims Litigation LLC | 3/26/1997 - 5/20/1998 | $1,676,091 | $0 |
| FPL Energy National Wind, Note, Series 144A, 6.125%, 3/25/2019 | 2/16/2005 – 5/27/2009 | $988,731 | $1,066,127 |
| General Motors Co. Escrow Shares | 4/21/2011 | $264,901 | $190,500 |
| Hard Rock Park Operations LLC, Sr. Secd. Note, Series 144A, 0.00%, 4/1/2012 | 3/23/2006 - 1/2/2008 | $2,334,293 | $0 |
| Royal Oak Mines, Inc. | 2/24/1999 | $6,392 | $0 |
Other
The preparation of financial statements in conformity with GAAP requires management to make estimates and assumptions that affect the amounts of assets, liabilities, expenses and revenues reported in the financial statements. Actual results could differ from those estimated.
3. SHARES OF BENEFICIAL INTEREST
The following table summarizes share activity:
| Year Ended December 31 | 2011 | 2010 |
| Shares sold | 36,857,254 | 83,555,328 |
| Shares issued to shareholders in payment of distributions declared | 1,250,218 | 2,000,660 |
| Shares redeemed | (45,874,569) | (37,295,950) |
| NET CHANGE RESULTING FROM FUND SHARE TRANSACTIONS | (7,767,097) | 48,260,038 |
4. FEDERAL TAX INFORMATION
The timing and character of income and capital gain distributions are determined in accordance with income tax regulations, which may differ from GAAP. These differences are due to differing treatments for expiration of capital loss carryforwards, defaulted securities and discount accretion/premium amortization on debt securities.
For the year ended December 31, 2011, permanent differences identified and reclassified among the components of net assets were as follows:
| Increase (Decrease) |
| Paid-In Capital | Undistributed
Net Investment
Income (Loss) | Accumulated
Net Realized
Gain (Loss) |
| $(4,844,584) | $4,528,562 | $316,022 |
Net investment income (loss), net realized gains (losses), and net assets were not affected by this reclassification.
The tax character of distributions as reported on the Statement of Changes in Net Assets for the years ended December 31, 2011 and 2010, was as follows:
| 2011 | 2010 |
| Ordinary income | $172,505,203 | $180,820,404 |
As of December 31, 2011, the components of distributable earnings on a tax basis were as follows:
| Undistributed ordinary income | $1,158,737 |
| Net unrealized appreciation | $38,061,847 |
| Capital loss carryforwards and deferrals | $(26,157,033) |
The difference between book-basis and tax-basis net unrealized appreciation/depreciation is attributable to differing treatments for wash sales, defaulted bond interest and discount accretion/premium amortization on debt securities.
At December 31, 2011, the cost of investments for federal tax purposes was $1,816,343,426. The net unrealized appreciation of investments for federal tax purposes was $38,061,847. This consists of net unrealized appreciation from investments for those securities having an excess of value over cost of $104,689,348 and net unrealized depreciation from investments for those securities having an excess of cost over value of $66,627,501.
Annual Shareholder Report
35
At December 31, 2011, the Fund had a capital loss carryforward of $20,578,054 which will reduce the Fund's taxable income arising from future net realized gains on investments, if any, to the extent permitted by the Code, thereby reducing the amount of distributions to shareholders which would otherwise be necessary to relieve the Fund of any liability for federal income tax. Pursuant to the Code, a net capital loss incurred in taxable years beginning on or before December 22, 2010, is characterized as short-term and may be carried forward for a maximum of eight tax years (“Carryforward Limit”), whereas a net capital loss incurred in taxable years beginning after December 22, 2010, retains its character as either short-term or long-term, does not expire and is required to be utilized prior to the losses which have a Carryforward Limit.The following schedule summarizes the Fund's short-term and long-term capital loss carryforwards and expiration year:
| Expiration Year | Short-Term | Long-Term | Total |
| 2016 | $1,695,355 | NA | $1,695,355 |
| 2017 | 18,882,699 | NA | 18,882,699 |
The Fund used capital loss carryforwards of $40,801,012 to offset taxable capital gains realized during the year ended December 31, 2011. Additionally, capital loss carryforwards of $4,844,584 expired during the year ended December 31, 2011.
Under current tax regulations, capital losses on securities transactions realized after October 31 may be deferred and treated as occurring on the first day of the following fiscal year. As of December 31, 2011, for federal income tax purposes, post October losses of $5,578,979 were deferred to January 1, 2012.
5. INVESTMENT ADVISER FEE AND OTHER TRANSACTIONS WITH AFFILIATES
Investment Adviser Fee
Federated Investment Management Company is the Fund's investment adviser (the “Adviser”), subject to direction of the Trustees. The Adviser provides investment adviser services at no fee, because all investors in the Fund are other Federated Funds, insurance company separate accounts, common or comingled trust funds or similar organizations or entities that are “accredited investors” within the meaning of Regulation D of the 1933 Act. The Adviser may voluntarily choose to reimburse certain operating expenses of the Fund. The Adviser can modify or terminate this voluntary reimbursement at any time at its sole discretion. For the year ended December 31, 2011, the Adviser voluntarily reimbursed $367,298 of other operating expenses.
Administrative Fee
Federated Administrative Services (FAS), under the Administrative Services Agreement, provides the Fund with administrative personnel and services. The fee paid to FAS is based on the average aggregate daily net assets of certain Federated funds as specified below:
| Administrative Fee | Average Aggregate Daily Net Assets
of the Federated Funds |
| 0.150% | on the first $5 billion |
| 0.125% | on the next $5 billion |
| 0.100% | on the next $10 billion |
| 0.075% | on assets in excess of $20 billion |
The administrative fee received during any fiscal year shall be at least $150,000 per portfolio and $40,000 per each additional class of Shares. FAS may voluntarily choose to waive any portion of its fee. FAS can modify or terminate this voluntary waiver at any time at its sole discretion. For the year ended December 31, 2011, FAS waived its entire fee of $1,498,783.
Interfund Transactions
During the year ended December 31, 2011, the Fund engaged in purchase and sale transactions with funds that have a common investment adviser (or affiliated investment advisers), common Directors/Trustees, and/or common Officers. These purchase and sale transactions complied with Rule 17a-7 under the Act and amounted to $73,219 and $0, respectively.
General
Certain Officers and Trustees of the Fund are Officers and Directors or Trustees of the above companies.
Annual Shareholder Report
36
Transactions Involving Affiliated HoldingsAffiliated holdings are mutual funds which are managed by the Adviser or an affiliate of the Adviser. Transactions involving the affiliated holding during the year ended December 31, 2011, were as follows:
| Federated
Prime Value
Obligations Fund,
Institutional Shares |
| Balance of Shares Held 12/31/2010 | 22,314,015 |
| Purchases/Additions | 481,843,166 |
| Sales/Reductions | 487,474,325 |
| Balance of Shares Held 12/31/2011 | 16,682,856 |
| Value | $16,682,856 |
| Dividend Income | $30,744 |
6. Investment TRANSACTIONS
Purchases and sales of investments, excluding long-term U.S. government securities and short-term obligations, for the year ended December 31, 2011, were as follows:
| Purchases | $641,430,880 |
| Sales | $699,837,154 |
7. LINE OF CREDIT
The Fund participates in a $100,000,000 unsecured, uncommitted revolving line of credit (LOC) agreement with PNC Bank. The LOC was made available for extraordinary or emergency purposes, primarily for financing redemption payments. Borrowings are charged interest at a rate offered to the Fund by PNC Bank at the time of the borrowing. As of December 31, 2011, there were no outstanding loans. During the year ended December 31, 2011, the Fund did not utilize the LOC.
8. INTERFUND LENDING
Pursuant to an Exemptive Order issued by the Securities and Exchange Commission, the Fund, along with other funds advised by subsidiaries of Federated Investors, Inc., may participate in an interfund lending program. This program provides an alternative credit facility allowing the Fund to borrow from other participating affiliated funds. As of December 31, 2011, there were no outstanding loans. During the year ended December 31, 2011, the program was not utilized.
9. RECENT ACCOUNTING PRONOUNCEMENTS
In April 2011, the Financial Accounting Standards Board (FASB) released Accounting Standards Update (ASU) No. 2011-03, “Reconsideration of Effective Control for Repurchase Agreements.” This ASU amends FASB Accounting Standards Codification (ASC) Topic 860, “Transfers and Servicing”; specifically the criteria required to determine whether a repurchase agreement and similar agreements should be accounted for as sales of financial assets or secured borrowings with commitments. This ASU is effective for fiscal years and interim periods beginning after December 15, 2011. Management has concluded that the adoption of ASU No. 2011-03 is not expected to have a material impact on the Fund's financial statements and the accompanying notes, net assets or results of operations.
In addition, in May 2011, FASB released ASU No. 2011-04, “Amendments to Achieve Common Fair Value Measurement and Disclosure Requirements in U.S. GAAP and IFRSs.” This ASU amends FASB ASC Topic 820, “Fair Value Measurement,” to establish common requirements for measuring fair value and for disclosing information about fair value measurements in accordance with GAAP. This ASU is effective for fiscal years and interim periods beginning after December 15, 2011. Management has concluded that the adoption of ASU No. 2011-04 is not expected to have a material impact on the Fund's financial statements and the accompanying notes.
Annual Shareholder Report37
Report of Independent Registered Public Accounting Firm
TO THE BOARD OF Trustees of Federated Core trust AND SHAREHOLDERS OF High Yield Bond Portfolio:
We have audited the accompanying statement of assets and liabilities of High Yield Bond Portfolio (the “Fund”) (one of the portfolios constituting Federated Core Trust), including the portfolio of investments, as of December 31, 2011, and the related statement of operations for the year then ended, the statement of changes in net assets for each of the two years in the period then ended, and the financial highlights for each of the five years in the period then ended. These financial statements and financial highlights are the responsibility of the Fund's management. Our responsibility is to express an opinion on these financial statements and financial highlights based on our audits.
We conducted our audits in accordance with standards of the Public Company Accounting Oversight Board (United States). Those standards require that we plan and perform the audit to obtain reasonable assurance about whether the financial statements and financial highlights are free of material misstatement. We were not engaged to perform an audit of the Fund's internal control over financial reporting. Our audits included consideration of internal control over financial reporting as a basis for designing audit procedures that are appropriate in the circumstances, but not for the purpose of expressing an opinion on the effectiveness of the Fund's internal control over financial reporting. Accordingly, we express no such opinion. An audit also includes examining, on a test basis, evidence supporting the amounts and disclosures in the financial statements and financial highlights, assessing the accounting principles used and significant estimates made by management, and evaluating the overall financial statement presentation. Our procedures included confirmation of securities owned as of December 31, 2011, by correspondence with the custodian and others. We believe that our audits provide a reasonable basis for our opinion.
In our opinion, the financial statements and financial highlights referred to above present fairly, in all material respects, the financial position of High Yield Bond Portfolio, a portfolio of Federated Core Trust, at December 31, 2011, the results of its operations for the year then ended, the changes in its net assets for each of the two years in the period then ended, and the financial highlights for each of the five years in the period then ended, in conformity with U.S. generally accepted accounting principles.
Boston, Massachusetts
February 22, 2012
Annual Shareholder Report38
Shareholder Expense Example (unaudited) – High Yield Bond Portfolio
As a shareholder of the Fund, you incur ongoing costs, including to the extent applicable, management fees, distribution (12b-1) fees and/or shareholder services fees and other Fund expenses. This Example is intended to help you to understand your ongoing costs (in dollars) of investing in the Fund and to compare these costs with the ongoing costs of investing in other mutual funds. It is based on an investment of $1,000 invested at the beginning of the period and held for the entire period from July 1, 2011 to December 31, 2011.
ACTUAL EXPENSES
The first section of the table below provides information about actual account values and actual expenses. You may use the information in this section, together with the amount you invested, to estimate the expenses that you incurred over the period. Simply divide your account value by $1,000 (for example, an $8,600 account value divided by $1,000 = 8.6), then multiply the result by the number in the first section under the heading entitled “Expenses Paid During Period” to estimate the expenses attributable to your investment during this period.
HYPOTHETICAL EXAMPLE FOR COMPARISON PURPOSES
The second section of the table below provides information about hypothetical account values and hypothetical expenses based on the Fund's actual expense ratio and an assumed rate of return of 5% per year before expenses, which is not the Fund's actual return. Thus, you should not use the hypothetical account values and expenses to estimate the actual ending account balance or your expenses for the period. Rather, these figures are required to be provided to enable you to compare the ongoing costs of investing in the Fund with other funds. To do so, compare this 5% hypothetical example with the 5% hypothetical examples that appear in the shareholder reports of the other funds.
Please note that the expenses shown in the table are meant to highlight your ongoing costs only. Therefore, the second section of the table is useful in comparing ongoing costs only, and will not help you determine the relative total costs of owning different funds.
| Beginning
Account Value
7/1/2011 | Ending
Account Value
12/31/2011 | Expenses Paid
During Period1 |
| Actual | $1,000.00 | $1,013.10 | $0.00 |
| Hypothetical (assuming a 5% return before expenses) | $1,000.00 | $1,025.21 | $0.00 |
| 1 | Expenses are equal to the Fund's annualized net expense ratio of 0.00%, multiplied by the average account value over the period, multiplied by 184/365 (to reflect the one-half-year period). The Adviser has voluntarily agreed to reimburse all operating expenses incurred by the Fund. This arrangement has no fixed term. |
Annual Shareholder Report39
Board of Trustee and Trust Officers
The Board of Trustee is responsible for managing the Trust's business affairs and for exercising all the Trust's powers except those reserved for the shareholders. The following tables give information about each Trustee and the senior officers of the Fund. Where required, the tables separately list Trustee who are “interested persons” of the Fund (i.e., “Interested” Trustee) and those who are not (i.e., “Independent” Trustee). Unless otherwise noted, the address of each person listed is Federated Investors Tower, 1001 Liberty Avenue, Pittsburgh, PA 15222. The address of all Independent Trustee listed is 4000 Ericsson Drive, Warrendale, PA 15086-7561; Attention: Mutual Fund Board. As of December 31, 2011, the Trust comprised four portfolio(s), and the Federated Fund Family consisted of 43 investment companies (comprising 134 portfolios). Unless otherwise noted, each Officer is elected annually. Unless otherwise noted, each Trustee oversees all portfolios in the Federated Fund Family and serves for an indefinite term. The Fund's Statement of Additional Information includes additional information about Trust Trustee and is available, without charge and upon request, by calling 1-800-341-7400.
Interested Trustees Background
Name
Birth Date
Positions Held with Trust
Date Service Began | Principal Occupation(s) for Past Five Years,
Other Directorships Held and Previous Position(s) |
John F. Donahue*
Birth Date: July 28, 1924
Trustee
Began serving: November 2005 | Principal Occupations: Director or Trustee of the Federated Fund Family; Chairman and Director, Federated Investors, Inc.; Chairman of the Federated Fund Family's Executive Committee.
Previous Positions: Chairman of the Federated Fund Family; Trustee, Federated Investment Management Company; Chairman and Director, Federated Investment Counseling. |
J. Christopher Donahue*
Birth Date: April 11, 1949
President and Trustee
Began serving: October 2005 | Principal Occupations: Principal Executive Officer and President of the Federated Fund Family; Director or Trustee of some of the Funds in the Federated Fund Family; President, Chief Executive Officer and Director, Federated Investors, Inc.; Chairman and Trustee, Federated Investment Management Company; Trustee, Federated Investment Counseling; Chairman and Director, Federated Global Investment Management Corp.; Chairman, Federated Equity Management Company of Pennsylvania and Passport Research, Ltd. (investment advisory subsidiary of Federated); Trustee, Federated Shareholder Services Company; Director, Federated Services Company.
Previous Positions: President, Federated Investment Counseling; President and Chief Executive Officer, Federated Investment Management Company, Federated Global Investment Management Corp. and Passport Research, Ltd. |
| * | Family relationships and reasons for “interested” status: John F. Donahue is the father of J. Christopher Donahue; both are “interested” due to their beneficial ownership of shares of Federated Investors, Inc. and the positions they hold with Federated and its subsidiaries. |
INDEPENDENT Trustees Background
Name
Birth Date
Positions Held with Trust
Date Service Began | Principal Occupation(s) for Past Five Years,
Other Directorships Held, Previous Position(s) and Qualifications |
Nicholas P. Constantakis, CPA
Birth Date: September 3, 1939
Trustee
Began serving: November 2005 | Principal Occupation: Director or Trustee of the Federated Fund Family.
Other Directorship Held: Director, Chairman of the Audit Committee, and member of the Compensation Committee, Michael Baker Corporation (architecture, engineering and construction services).
Previous Position: Partner, Andersen Worldwide SC.
Qualifications: Public accounting and director experience. |
John F. Cunningham
Birth Date: March 5, 1943
Trustee
Began serving: November 2005 | Principal Occupation: Director or Trustee of the Federated Fund Family.
Other Directorships Held: Chairman, President and Chief Executive Officer, Cunningham & Co., Inc. (strategic business consulting); Trustee Associate, Boston College.
Previous Positions: Director, Redgate Communications and EMC Corporation (computer storage systems); Chairman of the Board and Chief Executive Officer, Computer Consoles, Inc.; President and Chief Operating Officer, Wang Laboratories; Director, First National Bank of Boston; Director, Apollo Computer, Inc.
Qualifications: Business management and director experience. |
Annual Shareholder Report40
Name
Birth Date
Positions Held with Trust
Date Service Began | Principal Occupation(s) for Past Five Years,
Other Directorships Held, Previous Position(s) and Qualifications |
Maureen Lally-Green
Birth Date: July 5, 1949
Trustee
Began serving: August 2009 | Principal Occupations: Director or Trustee of the Federated Fund Family; Director, Office of Church Relations, Diocese of Pittsburgh; Adjunct Professor of Law, Duquesne University School of Law.
Other Directorships Held: Director, Auberle; Trustee, St. Francis University; Director, Ireland Institute of Pittsburgh; Director, UPMC Mercy Hospital; Regent, St. Vincent Seminary; Director, Epilepsy Foundation of Western and Central Pennsylvania; Director, Saint Thomas More Society, Allegheny County.
Previous Position: Pennsylvania Superior Court Judge.
Qualifications: Legal and director experience. |
Peter E. Madden
Birth Date: March 16, 1942
Trustee
Began serving: November 2005 | Principal Occupation: Director or Trustee, and Chairman of the Board of Directors or Trustees, of the Federated Fund Family.
Previous Positions: Representative, Commonwealth of Massachusetts General Court; President, Chief Operating Officer and Director, State Street Bank and Trust Company and State Street Corporation (retired); Director, VISA USA and VISA International; Chairman and Director, Massachusetts Bankers Association; Director, Depository Trust Corporation; Director, The Boston Stock Exchange.
Qualifications: Business management, mutual fund services and director experience. |
Charles F. Mansfield, Jr.
Birth Date: April 10, 1945
Trustee
Began serving: November 2005 | Principal Occupations: Director or Trustee of the Federated Fund Family; Management Consultant.
Previous Positions: Chief Executive Officer, PBTC International Bank; Partner, Arthur Young & Company (now Ernst & Young LLP); Chief Financial Officer of Retail Banking Sector, Chase Manhattan Bank; Senior Vice President, HSBC Bank USA (formerly Marine Midland Bank); Vice President, Citibank; Assistant Professor of Banking and Finance, Frank G. Zarb School of Business, Hofstra University; Executive Vice President, DVC Group, Inc. (marketing, communications and technology).
Qualifications: Banking, business management, education and director experience. |
Thomas M. O'Neill
Birth Date: June 14, 1951
Trustee
Began serving: October 2006 | Principal Occupations: Director or Trustee, Vice Chairman of the Audit Committee of the Federated Fund Family; Sole Proprietor, Navigator Management Company (investment and strategic consulting).
Other Directorships Held: Board of Overseers, Children's Hospital of Boston; Visiting Committee on Athletics, Harvard College; Board of Directors, Medicines for Humanity; Board of Directors, The Golisano Children's Museum of Naples, Florida.
Previous Positions: Chief Executive Officer and President, Managing Director and Chief Investment Officer, Fleet Investment Advisors; President and Chief Executive Officer, Aeltus Investment Management, Inc.; General Partner, Hellman, Jordan Management Co., Boston, MA; Chief Investment Officer, The Putnam Companies, Boston, MA; Credit Analyst and Lending Officer, Fleet Bank; Director and Consultant, EZE Castle Software (investment order management software); Director, Midway Pacific (lumber).
Qualifications: Business management, mutual fund, director and investment experience. |
John S. Walsh
Birth Date: November 28, 1957
Trustee
Began serving: November 2005 | Principal Occupations: Director or Trustee, Chairman of the Audit Committee of the Federated Fund Family; President and Director, Heat Wagon, Inc. (manufacturer of construction temporary heaters); President and Director, Manufacturers Products, Inc. (distributor of portable construction heaters); President, Portable Heater Parts, a division of Manufacturers Products, Inc.
Previous Position: Vice President, Walsh & Kelly, Inc.
Qualifications: Business management and director experience. |
OFFICERS
Name
Birth Date
Address
Positions Held with Trust
Date Service Began | Principal Occupation(s) for Past Five Years
and Previous Position(s) |
John W. McGonigle
Birth Date: October 26, 1938
EXECUTIVE VICE PRESIDENT AND SECRETARY
Began serving: October 2005 | Principal Occupations: Executive Vice President and Secretary of the Federated Fund Family; Vice Chairman, Executive Vice President, Secretary and Director, Federated Investors, Inc.
Previous Positions: Trustee, Federated Investment Management Company and Federated Investment Counseling; Director, Federated Global Investment Management Corp., Federated Services Company and Federated Securities Corp. |
Richard A. Novak
Birth Date: December 25, 1963
TREASURER
Began serving: January 2006 | Principal Occupations: Principal Financial Officer and Treasurer of the Federated Fund Family; Senior Vice President, Federated Administrative Services; Financial and Operations Principal for Federated Securities Corp., Edgewood Services, Inc. and Southpointe Distribution Services, Inc.
Previous Positions: Controller of Federated Investors, Inc.; Vice President, Finance of Federated Services Company; held various financial management positions within The Mercy Hospital of Pittsburgh; Auditor, Arthur Andersen & Co. |
Annual Shareholder Report41
Name
Birth Date
Address
Positions Held with Trust
Date Service Began | Principal Occupation(s) for Past Five Years
and Previous Position(s) |
Richard B. Fisher
Birth Date: May 17, 1923
VICE CHAIRMAN
Began serving: October 2005 | Principal Occupations: Vice Chairman or Vice President of some of the Funds in the Federated Fund Family; Vice Chairman, Federated Investors, Inc.; Chairman, Federated Securities Corp.
Previous Positions: President and Director or Trustee of some of the Funds in the Federated Fund Family; Executive Vice President, Federated Investors, Inc.; Director and Chief Executive Officer, Federated Securities Corp. |
Brian P. Bouda
Birth Date: February 28, 1947
CHIEF COMPLIANCE OFFICER AND SENIOR VICE PRESIDENT
Began serving: October 2005 | Principal Occupations: Senior Vice President and Chief Compliance Officer of the Federated Fund Family; Vice President and Chief Compliance Officer of Federated Investors, Inc. and Chief Compliance Officer of its subsidiaries. Mr. Bouda joined Federated in 1999 and is a member of the American Bar Association and the State Bar Association of Wisconsin. |
Robert J. Ostrowski
Birth Date: April 26, 1963
CHIEF INVESTMENT OFFICER
Began serving: September 2006 | Principal Occupations: Robert J. Ostrowski joined Federated in 1987 as an Investment Analyst and became a Portfolio Manager in 1990. He was named Chief Investment Officer of taxable fixed-income products in 2004 and also serves as a Senior Portfolio Manager. He has been a Senior Vice President of the Fund's Adviser since 1997. Mr. Ostrowski has received the Chartered Financial Analyst designation. He received his M.S. in Industrial Administration from Carnegie Mellon University. |
Joseph M. Balestrino
Birth Date: November 3, 1954
VICE PRESIDENT
Began serving: October 2005 | Principal Occupations: Joseph M. Balestrino is Vice President of the Trust. Mr. Balestrino joined Federated in 1986 and has been a Senior Portfolio Manager and Senior Vice President of the Fund's Adviser since 1998. He was a Portfolio Manager and a Vice President of the Fund's Adviser from 1995 to 1998. Mr. Balestrino served as a Portfolio Manager and an Assistant Vice President of the Adviser from 1993 to 1995. Mr. Balestrino has received the Chartered Financial Analyst designation and holds a Master's Degree in Urban and Regional Planning from the University of Pittsburgh. |
Annual Shareholder Report42
Evaluation and Approval of Advisory Contract – May 2011
federated high-yield strategy portfolio (the “Fund”)
The Fund's Board reviewed the Fund's investment advisory contract at meetings held in May 2011. The Board's decision regarding the contract reflects the exercise of its business judgment on whether to continue the existing arrangements. The Fund is distinctive in that it: is used to implement particular investment strategies that are offered to investors in certain separately managed or wrap fee accounts or programs or certain other discretionary investments accounts; and may also be offered to other Federated funds. In addition, the Adviser does not charge an investment advisory fee for its services although it or its affiliates may receive compensation for managing assets invested in the Fund.
The Federated Funds' Board had previously appointed a Senior Officer, whose duties include specified responsibilities relating to the process by which advisory fees are to be charged to a Federated fund. The Senior Officer has the authority to retain consultants, experts, or staff as may be reasonably necessary to assist in the performance of his duties, reports directly to the Board, and may be terminated only with the approval of a majority of the independent members of the Board. The Senior Officer prepared and furnished to the Board an independent, written evaluation that covered topics discussed below (the “Evaluation”). The Board considered that Evaluation, along with other information, in deciding to approve the advisory contract.
As previously noted, the Adviser does not charge an investment advisory fee for its services; however, the Board did consider compensation and benefits received by the Adviser, including fees received for services provided to the Fund by other entities in the Federated organization and research services received by the Adviser from brokers that execute Federated fund trades. The Board is also familiar with and considered judicial decisions concerning allegedly excessive investment advisory fees which have indicated that the following factors may be relevant to an Adviser's fiduciary duty with respect to its receipt of compensation from a fund: the nature and quality of the services provided by the Adviser, including the performance of the Fund; the Adviser's cost of providing the services; the extent to which the Adviser may realize “economies of scale” as the Fund grows larger; any indirect benefits that may accrue to the Adviser and its affiliates as a result of the Adviser's relationship with the Fund; performance and expenses of comparable funds; and the extent to which the independent Board members are fully informed about all facts the Board deems relevant bearing on the Adviser's services and fees. The Board further considered management fees (including any components thereof) charged to institutional and other clients of the Adviser for what might be viewed as like services, and the cost to the Adviser and its affiliates of supplying services pursuant to the management fee agreements, excluding any intra-corporate profit and profit margins of the Adviser and its affiliates for supplying such services. The Board was aware of these factors and was guided by them in its review of the Fund's advisory contract to the extent it considered them to be appropriate and relevant, as discussed further below.
The Board considered and weighed these circumstances in light of its substantial accumulated experience in governing the Fund and working with Federated on matters relating to the Federated funds, and was assisted in its deliberations by independent legal counsel. Throughout the year, the Board has requested and received substantial and detailed information about the Fund and the Federated organization that was in addition to the extensive materials that comprise and accompany the Senior Officer's Evaluation. Federated provided much of this information at each regular meeting of the Board, and furnished additional information in connection with the particular meeting at which the Board's formal review of the advisory contract occurred. Between regularly scheduled meetings, the Board has received information on particular matters as the need arose. Thus, the Board's consideration of the advisory contract included review of the Senior Officer's Evaluation, accompanying data and additional information covering such matters as: the Adviser's investment philosophy, personnel and processes; investment and operating strategies; the Fund's short- and long-term performance, and comments on the reasons for performance; the Fund's investment objectives; the Fund's overall expense structure; the use and allocation of brokerage commissions derived from trading the Fund's portfolio securities (if any); and the nature, quality and extent of the advisory and other services provided to the Fund by the Adviser and its affiliates. The Board also considered the preferences and expectations of Fund shareholders and their relative sophistication; the continuing state of competition in the mutual fund industry and market practices; the Fund's relationship to the Federated family of funds which include a comprehensive array of funds with different investment objectives, policies and strategies which are available for exchange without the incurrence of additional sales charges; compliance and audit reports concerning the Federated funds and the Federated companies that service them (including communications from regulatory agencies), as well as Federated's responses to any issues raised therein; and relevant developments in the mutual fund industry and how the Federated funds and/or Federated are responding to them. The Board's evaluation process is evolutionary. The criteria considered and the emphasis placed on relevant criteria change in recognition of changing circumstances in the mutual fund marketplace.
Because the Adviser does not charge the Fund an investment advisory fee, the Fund's Board does not consider fee comparisons to other mutual funds or other institutional or separate accounts to be relevant.
Annual Shareholder Report
43
The Board also received financial information about Federated, including information regarding the compensation and benefits Federated derived from its relationships with the Federated funds. Because the Adviser does not charge an investment advisory fee for its services, this information generally covered fees received by Federated's subsidiaries for providing other services to the Federated funds under separate contracts (e.g., for serving as the Federated funds' administrator). The information also detailed any indirect benefit Federated may derive from its receipt of research services from brokers who execute Federated fund trades. In addition, the Board considered the fact that, in order for a fund to be competitive in the marketplace, Federated and its affiliates frequently waive non-advisory fees and/or reimburse other expenses and have disclosed to fund investors and/or indicated to the Board their intention to do so in the future, where appropriate. Moreover, the Board receives regular reporting as to the institution or elimination of these voluntary waivers.The Board and the Senior Officer also reviewed information compiled by Federated comparing profitability information for Federated to other publicly held fund management companies. In this regard, the Senior Officer noted the limited availability of such information, but nonetheless concluded that Federated's profit margins did not appear to be excessive and the Board agreed.
The Senior Officer noted that, considering the totality of the circumstances, and all of the factors referenced within his Evaluation, he had concluded that, subject to comments and recommendations made within his Evaluation, his observations and the information accompanying the Evaluation supported a finding by the Board that the management fees for each of the funds are reasonable and that Federated appeared to provide appropriate administrative services to the Fund for the fees paid. The Board concluded that the nature, quality and scope of services provided the Fund by the Adviser and its affiliates were satisfactory.
The Board based its decision to approve the advisory contract on the totality of the circumstances and relevant factors and with a view to past and future long-term considerations. Not all of the factors and considerations identified above were necessarily relevant to the Fund, nor did the Board consider any one of them to be determinative. In particular, due to the unusual nature of the Fund as primarily an internal product with no advisory fee, the Board does not consider the assessment of whether economies of scale would be realized if the Fund were to grow to some sufficient size to be relevant. With respect to the factors that were relevant, the Board's decision to approve the contract reflects its determination that Federated's performance and actions provided a satisfactory basis to support the decision to continue the existing arrangement.
Annual Shareholder Report44
Voting Proxies on Fund Portfolio Securities
A description of the policies and procedures that the Fund uses to determine how to vote proxies, if any, relating to securities held in the Fund's portfolio, as well as a report on “Form N-PX” of how the Fund voted any such proxies during the most recent 12-month period ended June 30, are available, without charge and upon request, by calling 1-800-341-7400. These materials are also available at the SEC's website at www.sec.gov.
Quarterly Portfolio Schedule
The Fund files with the SEC a complete schedule of its portfolio holdings, as of the close of the first and third quarters of its fiscal year, on “Form N-Q.” These filings are available on the SEC's website at www.sec.gov and may be reviewed and copied at the SEC's Public Reference Room in Washington, DC. (Call 1-800-SEC-0330 for information on the operation of the Public Reference Room.)
Annual Shareholder Report45
Mutual funds are not bank deposits or obligations, are not guaranteed by any bank and are not insured or guaranteed by the U.S. government, the Federal Deposit Insurance Corporation, the Federal Reserve Board or any other government agency. Investment in mutual funds involves investment risk, including the possible loss of principal.
This Report is authorized for distribution to prospective investors only when preceded or accompanied by the Fund's Prospectus, which contains facts concerning its objective and policies, management fees, expenses and other information.
Federated High-Yield Strategy Portfolio
Federated Investors Funds
4000 Ericsson Drive
Warrendale, PA 15086-7561
Contact us at FederatedInvestors.com
or call 1-800-341-7400.
Federated Securities Corp., Distributor
CUSIP 31421P209
40004 (2/12)
Federated is a registered trademark of Federated Investors, Inc.
2012 © Federated Investors, Inc.
Federated Mortgage Strategy Portfolio
A Portfolio of Federated Managed Pool SeriesANNUAL SHAREHOLDER REPORT
December 31, 2011
Ticker: FMBPX
MANAGEMENT'S DISCUSSION OF FUND PERFORMANCE
PORTFOLIO OF INVESTMENTS SUMMARY TABLE
PORTFOLIO OF INVESTMENTS
FINANCIAL HIGHLIGHTS
STATEMENT OF ASSETS AND LIABILITIES
STATEMENT OF OPERATIONS
STATEMENT OF CHANGES IN NET ASSETS
NOTES TO FINANCIAL STATEMENTS
REPORT OF INDEPENDENT REGISTERED PUBLIC ACCOUNTING FIRM
SHAREHOLDER EXPENSE EXAMPLE
FINANCIAL STATEMENTS FOR FEDERATED MORTGAGE CORE PORTFOLIO
BOARD OF TRUSTEES AND TRUST OFFICERS
EVALUATION AND APPROVAL OF ADVISORY CONTRACT
VOTING PROXIES ON FUND PORTFOLIO SECURITIES
QUARTERLY PORTFOLIO SCHEDULE
Management's Discussion of Fund Performance (unaudited)
The Fund's total return, based on net asset value, for the 12-month reporting period ended December 31, 2011, was 5.44%. The Barclays Capital Mortgage-Backed Securities Index (BCMBS),1 the Fund's broad-based securities market index, returned 6.23%. The Fund's total return reflected actual cash flows, transaction costs and other expenses which are not reflected in the total return of the BCMBS.
Sector allocation and duration were the most significant factors affecting Fund performance relative to the BCMBS.
MARKET OVERVIEW
Political upheaval, government debt and European financial system concerns dominated headlines during the year. Waves of unrest swept the Middle East in the “Arab Spring,” leading to the fall of numerous political leaders and their governments. European leaders came under pressure as well due to unsustainable levels of debt and the strains on government finances and the European financial system.
As the risk of selected European defaults rose along with debt levels, implications for European banks, large holders of sovereign debt, became worrisome. The need to maintain proper bank capitalization along with a stable financial system became the focus for numerous government leader summits and meetings in an attempt to forge a restructuring plan. As a resolution remained elusive, yields rose as investors demanded greater compensation for potential default risk, raising costs for select eurozone governments. For investors, the demand for risk declined, instead favoring government bonds, most notably U.S. Treasuries. Consequently, Treasury demand remained robust despite Standard & Poor's downgrade of long-term U.S. government debt in August.
Central banks were quite active, led by the European Central Bank (ECB) and the Federal Reserve (the “Fed”), which acted to increase liquidity and support growth. The ECB purchased sovereign debt in an attempt to reduce finance costs; however, market pressure on severely indebted nations was significant, most notably for Greece, Spain, Italy and Portugal. Additionally, the ECB initiated a three-year financing program for European financial institutions, offering low-cost loans intended to increase liquidity.
The Fed commenced “Operation Twist” which entails the sale of shorter maturity Treasuries in favor of buying longer maturity issues. Combined with the purchase of agency mortgage-backed securities (MBS) with paydowns from the Fed's MBS portfolio, these programs were devised to support housing and reduce interest rates. In this environment, investors preferred the safety of government debt over other fixed-income securities offering greater yield despite signs of improving U.S. economic growth in the latter portion of the reporting period. The two-year and ten-year Treasury yields decreased 35 and 141 basis points to 0.24% and 1.88%, respectively.
SECTOR ALLOCATION
Virtually all holdings consisted of MBS issued by Freddie Mac, Fannie Mae and Ginnie Mae.2 Our allocation within that universe favored Fannie Mae and Freddie Mac MBS with an underweight to Ginnie Maes. Financial institution demand for Ginnie Maes remained strong due in part to the full faith and credit guarantee of the U.S. government and the favorable risk-based capital treatment. Such demand propelled Ginnie Mae valuations to historically high levels. The underweight proved detrimental as Ginnie Mae MBS outperformed their conventional counterparts by nearly 200 basis points. Therefore, sector allocation acted as a significant drag on Fund performance.
DURATION3
Duration was below the BCMBS for a significant portion of the reporting period in expectation of higher interest rates. As Treasury market yields declined, as highlighted above, the Fund's capital gains lagged, thus negatively contributing to Fund performance.
| 1 | The BCMBS is an unmanaged index composed of all fixed securities mortgage pools by Government National Mortgage Association (GNMA), Federal National Mortgage Association and the Federal Home Loan Mortgage Corporation, including GNMA Graduated Payment Mortgages. The index is unmanaged and, unlike the Fund, not affected by cashflows. It is not possible to invest directly in an index. |
| 2 | Bond prices are sensitive to changes in interest rates and a rise in interest rates can cause a decline in their prices. The value of some mortgage-backed securities may be particularly sensitive to changes in prevailing interest rates, and although the securities are generally supported by some form of government or private insurance, there is no assurance that private guarantors or insurers will meet their obligations. |
| 3 | Duration is a measure of a security's price sensitivity to changes in interest rates. Securities with longer durations are more sensitive to changes in interest rates than securities of shorter durations. |
Annual Shareholder Report1
FUND PERFORMANCE AND GROWTH OF A $10,000 INVESTMENT
The Average Annual Total Return table below shows returns averaged over the stated periods. The graph below illustrates the hypothetical investment of $10,0001 in the Federated Mortgage Strategy Portfolio (the “Fund”) from December 20, 2007 (start of performance) to December 31, 2011, compared to the Barclays Capital Mortgage-Backed Securities Index (BCMBS).2
| Average Annual Total Returns for the Period Ended 12/31/2011 | |
| 1 Year | 5.44% |
| Start of Performance* | 5.87% |
| * | The Fund's start of performance date was December 20, 2007. |
Performance data quoted represents past performance which is no guarantee of future results. Investment return and principal value will fluctuate so that an investor's shares, when redeemed, may be worth more or less than their original cost. Mutual fund performance changes over time and current performance may be lower or higher than what is stated. For current to the most recent month-end performance and after-tax returns, call 1-800-341-7400. Returns shown do not reflect the deduction of taxes that a shareholder would pay on Fund distributions or the redemption of Fund shares. Mutual funds are not obligations of or guaranteed by any bank and are not federally insured.
Growth of a $10,000 Investment
| Federated Mortgage Strategy Portfolio | C000030211 | BCMBS |
| 12/20/2007 | 10,000 | 10,000 |
| 12/31/2007 | 10,068 | 10,027 |
| 12/31/2008 | 10,588 | 10,882 |
| 12/31/2009 | 11,353 | 11,508 |
| 12/31/2010 | 11,938 | 12,141 |
| 12/31/2011 | 12,587 | 12,897 |
41 graphic description end -->
| 1 | The Fund's performance assumes the reinvestment of all dividends and distributions. The BCMBS has been adjusted to reflect reinvestment of dividends on securities in an index. |
| 2 | The BCMBS is not adjusted to reflect sales charges, expenses or other fees that the Securities and Exchange Commission requires to be reflected in the Fund's performance. The index is unmanaged and, unlike the Fund, is not affected by cash flows. It is not possible to invest directly in an index. |
Annual Shareholder Report2
Portfolio of Investments Summary Table (unaudited)
At December 31, 2011, the Fund's portfolio composition1 was as follows:
| Type of Investment | Percentage of
Total Net Assets2 |
| U.S. Government Agency Mortgage-Backed Securities | 100.1% |
| Non-Agency Mortgage-Backed Securities | 2.2% |
| Cash Equivalents3 | 0.9% |
| Repurchase Agreements — Collateral4 | 15.1% |
| Other Assets and Liabilities — Net5 | (18.3)% |
| TOTAL | 100.0% |
| 1 | See the Fund's Prospectus and Statement of Additional Information for a description of the types of securities in which the Fund invests. |
| 2 | As of the date specified above, the Fund owned shares of one or more affiliated investment companies. For purposes of this table, the affiliated investment company (other than an affiliated money market mutual fund) is not treated as a single portfolio security, but rather the Fund is treated as owning a pro rata portion of each security and each other asset and liability owned by the affiliated investment company. Accordingly, the percentages of total net assets shown in the table will differ from those presented on the Portfolio of Investments. |
| 3 | Cash Equivalents include any investments in money market mutual funds and/or overnight repurchase agreements, other than those representing securities lending collateral or dollar-roll collateral. |
| 4 | Includes repurchase agreements purchased with cash collateral received in securities lending and/or dollar-roll transactions, as well as cash covering when-issued and delayed delivery transactions. |
| 5 | Assets, other than investments in securities, less liabilities. See Statement of Assets and Liabilities. |
Annual Shareholder Report3
Portfolio of Investments
December 31, 2011
| Shares | | | Value |
| | MUTUAL FUND – 100.1% | |
| 3,849,026 | 1 | Federated Mortgage Core Portfolio | 39,260,063 |
| | TOTAL INVESTMENTS — 100.1%
(IDENTIFIED COST $38,844,868)2 | 39,260,063 |
| | OTHER ASSETS AND LIABILITIES - NET — (0.1)%3 | (27,923) |
| | TOTAL NET ASSETS — 100% | $39,232,140 |
| 1 | Due to this affiliated holding representing greater than 75% of the Fund's total net assets, a copy of the affiliated holding's most recent annual report is included with this report. |
| 2 | The cost of investments for federal tax purposes amounts to $38,914,995. |
| 3 | Assets, other than investments in securities, less liabilities. See Statement of Assets and Liabilities. |
Note: The categories of investments are shown as a percentage of total net assets at December 31, 2011.
Various inputs are used in determining the value of the Fund's investments. These inputs are summarized in the three broad levels listed below:
Level 1 — quoted prices in active markets for identical securities, including investment companies with daily net asset values, if applicable. Level 2 — other significant observable inputs (including quoted prices for similar securities, interest rates, prepayment speeds, credit risk, etc.). Also includes securities valued at amortized cost. Level 3 — significant unobservable inputs (including the Fund's own assumptions in determining the fair value of investments).The inputs or methodology used for valuing securities are not an indication of the risk associated with investing in those securities.
As of December 31, 2011, all investments of the Fund utilized Level 1 inputs in valuing the Fund's assets carried at fair value. Federated Mortgage Core Portfolio is an affiliated holding offered only to registered investment companies and other accredited investors.
See Notes which are an integral part of the Financial Statements
Annual Shareholder Report4
Financial Highlights
(For a Share Outstanding Throughout Each Period)
| Year Ended December 31, | Period
Ended
12/31/20071 |
| 2011 | 2010 | 2009 | 2008 |
| Net Asset Value, Beginning of Period | $10.17 | $10.16 | $10.00 | $10.05 | $10.00 |
| Income From Investment Operations: | | | | | |
| Net investment income | 0.40 | 0.49 | 0.53 | 0.55 | 0.02 |
| Net realized and unrealized gain (loss) on investments | 0.14 | 0.02 | 0.18 | (0.05) | 0.05 |
| TOTAL FROM INVESTMENT OPERATIONS | 0.54 | 0.51 | 0.71 | 0.50 | 0.07 |
| Less Distributions: | | | | | |
| Distributions from net investment income | (0.40) | (0.49) | (0.53) | (0.55) | (0.02) |
| Distributions from net realized gain on investments | (0.00)2 | (0.01) | (0.02) | — | — |
| TOTAL DISTRIBUTIONS | (0.40) | (0.50) | (0.55) | (0.55) | (0.02) |
| Net Asset Value, End of Period | $10.31 | $10.17 | $10.16 | $10.00 | $10.05 |
| Total Return3 | 5.44% | 5.16% | 7.22% | 5.17% | 0.68% |
| Ratios to Average Net Assets: | | | | | |
| Net expenses4 | 0.00% | 0.00% | 0.00% | 0.00% | 0.00%5 |
| Net investment income | 3.90% | 4.62% | 5.27% | 5.56% | 4.32%5 |
| Expense waiver/reimbursement6 | 0.89% | 2.97% | 2.96% | 3.03% | 394.30%5,7 |
| Supplemental Data: | | | | | |
| Net assets, end of period (000 omitted) | $39,232 | $25,000 | $8,291 | $10,079 | $580 |
| Portfolio turnover | 14% | 83% | 133% | 121% | 0% |
| 1 | Reflects operations for the period from December 20, 2007 (date of initial public investment) to December 31, 2007. |
| 2 | Represents less than $0.01. |
| 3 | Based on net asset value. Total returns for periods of less than one year are not annualized. |
| 4 | The Adviser has contractually agreed to reimburse all operating expenses, excluding extraordinary expenses, incurred by the Fund. |
| 5 | Computed on an annualized basis. |
| 6 | This expense decrease is reflected in both the net expense and the net investment income ratios shown above. |
| 7 | Additional information relating to contractual expense waivers, which has no effect on net expenses, net investment income and net assets previously reported, has been provided to conform to the current year presentation. |
See Notes which are an integral part of the Financial Statements
Annual Shareholder Report5
Statement of Assets and Liabilities
December 31, 2011
| Assets: | | |
| Total investments in an affiliated holding (Note 5) (identified cost $38,844,868) | | $39,260,063 |
| Receivable for investments sold | | 270,000 |
| Receivable for shares sold | | 166 |
| TOTAL ASSETS | | 39,530,229 |
| Liabilities: | | |
| Payable for shares redeemed | $132,736 | |
| Bank overdraft | 22,899 | |
| Income distribution payable | 100,838 | |
| Payable to adviser (Note 5) | 634 | |
| Payable for Directors'/Trustees' fees | 131 | |
| Payable for auditing fees | 24,450 | |
| Payable for portfolio accounting fees | 7,022 | |
| Accrued expenses | 9,379 | |
| TOTAL LIABILITIES | | 298,089 |
| Net assets for 3,806,202 shares outstanding | | $39,232,140 |
| Net Assets Consist of: | | |
| Paid-in capital | | $38,887,698 |
| Net unrealized appreciation of investments | | 415,195 |
| Accumulated net realized loss on investments | | (70,916) |
| Undistributed net investment income | | 163 |
| TOTAL NET ASSETS | | $39,232,140 |
| Net Asset Value, Offering Price and Redemption Proceeds Per Share: | | |
| $39,232,140 ÷ 3,806,202 shares outstanding, no par value, unlimited shares authorized | | $10.31 |
See Notes which are an integral part of the Financial Statements
Annual Shareholder Report6
Statement of Operations
Year Ended December 31, 2011
| Investment Income: | | | |
| Dividends received from an affiliated holding (Note 5) | | | $1,282,708 |
| Expenses: | | | |
| Administrative fee (Note 5) | | $150,000 | |
| Custodian fees | | 5,715 | |
| Transfer and dividend disbursing agent fees and expenses | | 15,201 | |
| Directors'/Trustees' fees | | 2,537 | |
| Auditing fees | | 24,475 | |
| Legal fees | | 6,544 | |
| Portfolio accounting fees | | 42,037 | |
| Share registration costs | | 27,206 | |
| Printing and postage | | 13,128 | |
| Insurance premiums | | 3,982 | |
| Miscellaneous | | 1,475 | |
| TOTAL EXPENSES | | 292,300 | |
| Waiver and Reimbursement (Note 5): | | | |
| Waiver of administrative fee | $(24,670) | | |
| Reimbursement of other operating expenses | (267,630) | | |
| TOTAL WAIVER AND REIMBURSEMENT | | (292,300) | |
| Net expenses | | | — |
| Net investment income | | | 1,282,708 |
| Realized and Unrealized Gain (Loss) on Investments: | | | |
| Net realized loss on investments in an affiliated holding (Note 5) | | | (27,982) |
| Net change in unrealized depreciation of investments | | | 502,386 |
| Net realized and unrealized gain on investments | | | 474,404 |
| Change in net assets resulting from operations | | | $1,757,112 |
See Notes which are an integral part of the Financial Statements
Annual Shareholder Report7
Statement of Changes in Net Assets
| Year Ended December 31 | 2011 | 2010 |
| Increase (Decrease) in Net Assets | | |
| Operations: | | |
| Net investment income | $1,282,708 | $465,495 |
| Net realized gain (loss) on investments | (27,982) | 21,966 |
| Net change in unrealized appreciation/depreciation of investments | 502,386 | (226,898) |
| CHANGE IN NET ASSETS RESULTING FROM OPERATIONS | 1,757,112 | 260,563 |
| Distributions to Shareholders: | | |
| Distributions from net investment income | (1,281,574) | (466,641) |
| Distributions from net realized gain on investments | (3,591) | (29,434) |
| CHANGE IN NET ASSETS RESULTING FROM DISTRIBUTIONS TO SHAREHOLDERS | (1,285,165) | (496,075) |
| Share Transactions: | | |
| Proceeds from sale of shares | 17,986,501 | 25,217,579 |
| Cost of shares redeemed | (4,226,065) | (8,273,804) |
| CHANGE IN NET ASSETS RESULTING FROM SHARE TRANSACTIONS | 13,760,436 | 16,943,775 |
| Change in net assets | 14,232,383 | 16,708,263 |
| Net Assets: | | |
| Beginning of period | 24,999,757 | 8,291,494 |
| End of period (including undistributed (distributions in excess of) net investment income of $163 and $(971), respectively) | $39,232,140 | $24,999,757 |
See Notes which are an integral part of the Financial Statements
Annual Shareholder Report8
Notes to Financial Statements
December 31, 2011
1. ORGANIZATION
Federated Managed Pool Series (the “Trust”) is registered under the Investment Company Act of 1940, as amended (the “Act”), as a diversified open-end management investment company. The Trust consists of four portfolios. The financial statements included herein are only those of Federated Mortgage Strategy Portfolio (the “Fund”), a non-diversified portfolio. The financial statements of the other portfolios are presented separately. The assets of each portfolio are segregated and a shareholder's interest is limited to the portfolio in which shares are held. Each portfolio pays its own expenses. The investment objective of the Fund is to provide total return.
2. SIGNIFICANT ACCOUNTING POLICIES
The following is a summary of significant accounting policies consistently followed by the Fund in the preparation of its financial statements. These policies are in conformity with U.S. generally accepted accounting principles (GAAP).
Investment Valuation
In calculating its net asset value (NAV) the Fund generally values investments as follows:
- Shares of other mutual funds are valued based upon their reported NAVs.
- Fixed-income securities acquired with remaining maturities greater than 60 days are fair valued using price evaluations provided by a pricing service approved by the Board of Trustees (the “Trustees”).
- Fixed-income securities acquired with remaining maturities of 60 days or less are valued at their cost (adjusted for the accretion of any discount or amortization of any premium), which approximates market value.
- Derivative contracts listed on exchanges are valued at their reported settlement or closing price.
- Over-the-counter (OTC) derivative contracts are fair valued using price evaluations provided by a pricing service approved by the Trustees.
- For securities that are fair valued in accordance with procedures established by and under the general supervision of the Trustees, certain factors may be considered such as: the purchase price of the security, information obtained by contacting the issuer, analysis of the issuer's financial statements or other available documents, fundamental analytical data, the nature and duration of restrictions on disposition, the movement of the market in which the security is normally traded and public trading in similar securities of the issuer or comparable issuers.
If the Fund cannot obtain a price or price evaluation from a pricing service for an investment, the Fund may attempt to value the investment based upon the mean of bid and asked quotations or fair value the investment based on price evaluations, from one or more dealers. If any price, quotation, price evaluation or other pricing source is not readily available when the NAV is calculated, the Fund uses the fair value of the investment determined in accordance with the procedures described below. There can be no assurance that the Fund could purchase or sell an investment at the price used to calculate the Fund's NAV.
Fair Valuation and Significant Events Procedures
The Trustees have authorized the use of pricing services to provide evaluations of the current fair value of certain investments for purposes of calculating the NAV. Factors considered by pricing services in evaluating an investment include the yields or prices of investments of comparable quality, coupon, maturity, call rights and other potential prepayments, terms and type, reported transactions, indications as to values from dealers and general market conditions. Some pricing services provide a single price evaluation reflecting the bid-side of the market for an investment (a “bid” evaluation). Other pricing services offer both bid evaluations and price evaluations indicative of a price between the prices bid and asked for the investment (a “mid” evaluation). The Fund normally uses bid evaluations for U.S. Treasury and Agency securities, mortgage-backed securities and municipal securities. The Fund normally uses mid evaluations for other types of fixed-income securities and OTC derivative contracts. In the event that market quotations and price evaluations are not available for an investment, the fair value of the investment is determined in accordance with procedures adopted by the Trustees.
The Trustees also have adopted procedures requiring an investment to be priced at its fair value whenever the Adviser determines that a significant event affecting the value of the investment has occurred between the time as of which the price of the investment would otherwise be determined and the time as of which the NAV is computed. An event is considered significant if there is both an affirmative expectation that the investment's value will change in response to the event and a reasonable basis for quantifying the resulting change in value. Examples of significant events that may occur after the close of the principal market on which a security is traded, or after the time of a price evaluation provided by a pricing service or a dealer, include:
- With respect to price evaluations of fixed-income securities determined before the close of regular trading on the NYSE, actions by the Federal Reserve Open Market Committee and other significant trends in U.S. fixed-income markets;
- Political or other developments affecting the economy or markets in which an issuer conducts its operations or its securities are traded; and
- Announcements concerning matters such as acquisitions, recapitalizations, litigation developments, a natural disaster affecting the issuer's operations or regulatory changes or market developments affecting the issuer's industry.
The Fund may seek to obtain more current quotations or price evaluations from alternative pricing sources. If a reliable alternative pricing source is not available, the Fund will determine the fair value of the investment using another method approved by the Trustees.
Repurchase Agreements
The Fund may invest in repurchase agreements for short-term liquidity purposes. It is the policy of the Fund to require the other party to a repurchase agreement to transfer to the Fund's custodian or sub-custodian eligible securities or cash with a market value (after transaction costs) at least equal to the repurchase price to be paid under the repurchase agreement. The eligible securities are transferred to accounts with the custodian or sub-custodian in which the Fund holds a “securities entitlement” and exercises “control” as those terms are defined in the Uniform Annual Shareholder Report
9
Commercial Code. The Fund has established procedures for monitoring the market value of the transferred securities and requiring the transfer of additional eligible securities if necessary to equal at least the repurchase price. These procedures also allow the other party to require securities to be transferred from the account to the extent that their market value exceeds the repurchase price or in exchange for other eligible securities of equivalent market value.The insolvency of the other party or other failure to repurchase the securities may delay the disposition of the underlying securities or cause the Fund to receive less than the full repurchase price. Under the terms of the repurchase agreement, any amounts received by the Fund in excess of the repurchase price and related transaction costs must be remitted to the other party.
The Fund may enter into repurchase agreements in which eligible securities are transferred into joint trading accounts maintained by the custodian or sub-custodian for investment companies and other clients advised by the Fund's Adviser and its affiliates. The Fund will participate on a pro rata basis with the other investment companies and clients in its share of the securities transferred under such repurchase agreements and in its share of proceeds from any repurchase or other disposition of such securities.
Investment Income, Gains and Losses, Expenses and Distributions
Investment transactions are accounted for on a trade-date basis. Realized gains and losses from investment transactions are recorded on an identified-cost basis. Interest income and expenses are accrued daily. Dividend income and distributions to shareholders are recorded on the ex-dividend date. Distributions of net investment income are declared daily and paid monthly.
Premium and Discount Amortization/Paydown Gains and Losses
All premiums and discounts on fixed-income securities, other than mortgage-backed securities, are amortized/accreted using the effective interest rate method. Gains and losses realized on principal payment of mortgage-backed securities (paydown gains and losses) are classified as part of investment income.
Federal Taxes
It is the Fund's policy to comply with the Subchapter M provision of the Internal Revenue Code and to distribute to shareholders each year substantially all of its income. Accordingly, no provision for federal income tax is necessary. As of and during the year ended December 31, 2011, the Fund did not have a liability for any uncertain tax positions. The Fund recognizes interest and penalties, if any, related to tax liabilities as income tax expense in the Statement of Operations. As of December 31, 2011, tax years 2008 through 2011 remain subject to examination by the Fund's major tax jurisdictions, which include the United States of America and the Commonwealth of Massachusetts.
When-Issued and Delayed Delivery Transactions
The Fund may engage in when-issued or delayed delivery transactions. The Fund records when-issued securities on the trade date and maintains security positions such that sufficient liquid assets will be available to make payment for the securities purchased. Securities purchased on a when-issued or delayed delivery basis are marked to market daily and begin earning interest on the settlement date. Losses may occur on these transactions due to changes in market conditions or the failure of counterparties to perform under the contract.
Other
The preparation of financial statements in conformity with GAAP requires management to make estimates and assumptions that affect the amounts of assets, liabilities, expenses and revenues reported in the financial statements. Actual results could differ from those estimated.
3. SHARES OF BENEFICIAL INTEREST
The following table summarizes share activity:
| Year Ended December 31 | 2011 | 2010 |
| Shares sold | 1,759,533 | 2,450,584 |
| Shares redeemed | (412,546) | (807,306) |
| NET CHANGE RESULTING FROM FUND SHARE TRANSACTIONS | 1,346,987 | 1,643,278 |
4. FEDERAL TAX INFORMATION
The tax character of distributions as reported on the Statement of Changes in Net Assets for the years ended December 31, 2011 and 2010, was as follows:
| 2011 | 2010 |
| Ordinary income1 | $1,283,042 | $490,915 |
| Long-term capital gains | $2,123 | $5,160 |
| 1 | For tax purposes, short-term capital gain distributions are considered ordinary income distributions. |
As of December 31, 2011, the components of distributable earnings on a tax basis were as follows:
| Undistributed ordinary income | $163 |
| Net unrealized appreciation | $345,068 |
| Capital loss deferrals | $(789) |
The difference between book-basis and tax-basis net unrealized appreciation/depreciation is attributable to differing treatments for the deferral of losses on wash sales.
Annual Shareholder Report
10
At December 31, 2011, the cost of investments for federal tax purposes was $38,914,995. The net unrealized appreciation of investments for federal tax purposes was $345,068. This consists of net unrealized appreciation from investments for those securities having an excess of value over cost of $345,068.Under current tax regulations, capital losses on securities transactions realized after October 31 may be deferred and treated as occurring on the first day of the following fiscal year. As of December 31, 2011, for federal income tax purposes, post October losses of $789 were deferred to January 1, 2012.
5. INVESTMENT ADVISER FEE AND OTHER TRANSACTIONS WITH AFFILIATES
Investment Adviser Fee
Federated Investment Management Company is the Fund's investment adviser (the “Adviser”). The Adviser provides investment adviser services at no fee, because all eligible investors are: (1) in separately managed or wrap fee programs, who often pay a single aggregate fee to the wrap program sponsor for all costs and expenses of the wrap-fee programs; or (2) in certain other separately managed accounts and discretionary investment accounts. The Adviser has contractually agreed to reimburse all operating expenses, excluding extraordinary expenses, incurred by the Fund. For the year ended December 31, 2011, the Adviser reimbursed $267,630 of other operating expenses.
Administrative Fee
Federated Administrative Services (FAS), under the Administrative Services Agreement, provides the Fund with administrative personnel and services. The fee paid to FAS is based on the average aggregate daily net assets of certain Federated funds as specified below:
| Administrative Fee | Average Aggregate Daily Net Assets
of the Federated Funds |
| 0.150% | on the first $5 billion |
| 0.125% | on the next $5 billion |
| 0.100% | on the next $10 billion |
| 0.075% | on assets in excess of $20 billion |
The administrative fee received during any fiscal year shall be at least $150,000 per portfolio and $40,000 per each additional class of Shares. FAS may voluntarily choose to waive any portion of its fee. FAS can modify or terminate this voluntary waiver at any time at its sole discretion. For the year ended December 31, 2011, FAS waived $24,670 of its fee. The net fee paid to FAS was 0.381% of average daily net assets of the Fund. The Fund is currently being charged the minimum administrative fee; therefore the fee as a percentage of average daily net assets is greater than the amounts presented in the chart above. For the year ended December 31, 2011, the Adviser reimbursed the Fund for any fee paid to FAS.
General
Certain Officers and Trustees of the Fund are Officers and Directors or Trustees of the above companies.
Transactions Involving Affiliated Holdings
Affiliated holdings are mutual funds which are managed by the Adviser or an affiliate of the Adviser. Transactions involving an affiliated holding during the year ended December 31, 2011, were as follows:
| Federated Mortgage
Core Portfolio |
| Balance of Shares Held 12/31/2010 | 2,496,999 |
| Purchases/Additions | 1,804,181 |
| Sales/Reductions | 452,154 |
| Balance of Shares Held 12/31/2011 | 3,849,026 |
| Value | $39,260,063 |
| Dividend Income | $1,282,708 |
The Fund invests in the Federated Mortgage Core Portfolio (“Mortgage Core”), a portfolio of Federated Core Trust (“Core Trust”), which is managed by Federated Investment Management Company, the Fund's Adviser. Core Trust is an open-end management investment company, registered under the Act, available only to registered investment companies and other institutional investors. The investment objective of Mortgage Core is to provide total return. Federated receives no advisory or administrative fees from Mortgage Core. Income distributions from Mortgage Core are declared daily and paid monthly. All income distributions are recorded by the Fund as dividend income. Capital gain distributions of Mortgage Core, if any, are declared and paid annually, and are recorded by the Fund as capital gains received. The performance of the Fund is directly affected by the performance of Mortgage Core. The financial statements of Mortgage Core are included within this report to illustrate the security holdings, financial condition, results of operations and changes in net assets of the Portfolio in which the Fund invested 100.1% of its net assets at December 31, 2011. The financial statements of Mortgage Core should be read in conjunction with the Fund's financial statements. The valuation of securities held by Mortgage Core is discussed in the notes to its financial statements.
Annual Shareholder Report
11
6. Investment TRANSACTIONSPurchases and sales of investments, excluding long-term U.S. government securities and short-term obligations, for the year ended December 31, 2011, were as follows:
| Purchases | $18,230,294 |
| Sales | $4,588,976 |
7. LINE OF CREDIT
The Fund participates in a $100,000,000 unsecured, uncommitted revolving line of credit (LOC) agreement with PNC Bank. The LOC was made available for extraordinary or emergency purposes, primarily for financing redemption payments. Borrowings are charged interest at a rate offered to the Fund by PNC Bank at the time of the borrowing. As of December 31, 2011, there were no outstanding loans. During the year ended December 31, 2011, the Fund did not utilize the LOC.
8. INTERFUND LENDING
Pursuant to an Exemptive Order issued by the Securities and Exchange Commission, the Fund, along with other funds advised by subsidiaries of Federated Investors, Inc., may participate in an interfund lending program. This program provides an alternative credit facility allowing the Fund to borrow from other participating affiliated funds. As of December 31, 2011, there were no outstanding loans. During the year ended December 31, 2011, the program was not utilized.
9. RECENT ACCOUNTING PRONOUNCEMENTS
In April 2011, the Financial Accounting Standards Board (FASB) released Accounting Standards Update (ASU) No. 2011-03, “Reconsideration of Effective Control for Repurchase Agreements.” This ASU amends FASB Accounting Standards Codification (ASC) Topic 860, “Transfers and Servicing”; specifically the criteria required to determine whether a repurchase agreement and similar agreements should be accounted for as sales of financial assets or secured borrowings with commitments. This ASU is effective for fiscal years and interim periods beginning after December 15, 2011. Management has concluded that the adoption of ASU No. 2011-03 is not expected to have a material impact on the Fund's financial statements and the accompanying notes, net assets or results of operations.
In addition, in May 2011, FASB released ASU No. 2011-04, “Amendments to Achieve Common Fair Value Measurement and Disclosure Requirements in U.S. GAAP and IFRSs.” This ASU amends FASB ASC Topic 820, “Fair Value Measurement,” to establish common requirements for measuring fair value and for disclosing information about fair value measurements in accordance with GAAP. This ASU is effective for fiscal years and interim periods beginning after December 15, 2011. Management has concluded that the adoption of ASU No. 2011-04 is not expected to have a material impact on the Fund's financial statements and the accompanying notes.
11. FEDERAL TAX INFORMATION (UNAUDITED)
For the year ended December 31, 2011, the amount of long-term capital gains designated by the Fund was $2,123.
Annual Shareholder Report12
Report of Independent Registered Public Accounting Firm
TO THE BOARD OF Trustees of Federated Managed Pool Series AND SHAREHOLDERS OF Federated Mortgage Strategy Portfolio:
We have audited the accompanying statement of assets and liabilities of Federated Mortgage Strategy Portfolio (the “Fund”) (one of the portfolios constituting Federated Managed Pool Series), including the portfolio of investments, as of December 31, 2011, and the related statement of operations for the year then ended, the statement of changes in net assets for each of the two years in the period then ended and the financial highlights for each of the periods indicated therein. These financial statements and financial highlights are the responsibility of the Fund's management. Our responsibility is to express an opinion on these financial statements and financial highlights based on our audits.
We conducted our audits in accordance with standards of the Public Company Accounting Oversight Board (United States). Those standards require that we plan and perform the audit to obtain reasonable assurance about whether the financial statements and financial highlights are free of material misstatement. We were not engaged to perform an audit of the Fund's internal control over financial reporting. Our audits included consideration of internal control over financial reporting as a basis for designing audit procedures that are appropriate in the circumstances, but not for the purpose of expressing an opinion on the effectiveness of the Fund's internal control over financial reporting. Accordingly, we express no such opinion. An audit also includes examining, on a test basis, evidence supporting the amounts and disclosures in the financial statements and financial highlights, assessing the accounting principles used and significant estimates made by management, and evaluating the overall financial statement presentation. Our procedures included confirmation of securities owned as of December 31, 2011, by correspondence with the custodian and others. We believe that our audits provide a reasonable basis for our opinion.
In our opinion, the financial statements and financial highlights referred to above present fairly, in all material respects, the financial position of the Federated Mortgage Strategy Portfolio, a portfolio of Federated Managed Pool Series, at December 31, 2011, the results of its operations for the year then ended, the changes in its net assets for each of the two years in the period then ended, and the financial highlights for each of the periods indicated therein, in conformity with U.S. generally accepted accounting principles.
Boston, Massachusetts
February 22, 2012
Annual Shareholder Report13
Shareholder Expense Example (unaudited)
As a shareholder of the Fund, you incur ongoing costs, including to the extent applicable, management fees, distribution (12b-1) fees and/or shareholder services fees and other Fund expenses. This Example is intended to help you to understand your ongoing costs (in dollars) of investing in the Fund and to compare these costs with the ongoing costs of investing in other mutual funds. It is based on an investment of $1,000 invested at the beginning of the period and held for the entire period from July 1, 2011 to December 31, 2011.
ACTUAL EXPENSES
The first section of the table below provides information about actual account values and actual expenses. You may use the information in this section, together with the amount you invested, to estimate the expenses that you incurred over the period. Simply divide your account value by $1,000 (for example, an $8,600 account value divided by $1,000 = 8.6), then multiply the result by the number in the first section under the heading entitled “Expenses Paid During Period” to estimate the expenses attributable to your investment during this period.
HYPOTHETICAL EXAMPLE FOR COMPARISON PURPOSES
The second section of the table below provides information about hypothetical account values and hypothetical expenses based on the Fund's actual expense ratio and an assumed rate of return of 5% per year before expenses, which is not the Fund's actual return. Thus, you should not use the hypothetical account values and expenses to estimate the actual ending account balance or your expenses for the period. Rather, these figures are required to be provided to enable you to compare the ongoing costs of investing in the Fund with other funds. To do so, compare this 5% hypothetical example with the 5% hypothetical examples that appear in the shareholder reports of the other funds.
Please note that the expenses shown in the table are meant to highlight your ongoing costs only. Therefore, the second section of the table is useful in comparing ongoing costs only, and will not help you determine the relative total costs of owning different funds.
| Beginning
Account Value
7/1/2011 | Ending
Account Value
12/31/2011 | Expenses Paid
During Period1 |
| Actual | $1,000.00 | $1,026.60 | $0.00 |
| Hypothetical (assuming a 5% return before expenses) | $1,000.00 | $1,025.21 | $0.00 |
| 1 | Expenses are equal to the Fund's annualized net expense ratio of 0.00%, multiplied by the average account value over the period, multiplied by 184/365 (to reflect the one-half-year period). The Adviser has contractually agreed to reimburse all operating expenses, excluding extraordinary expenses, incurred by the Fund. This agreement has no fixed term. |
Annual Shareholder Report14
Management's Discussion of Fund Performance (unaudited) – Federated Mortgage Core Portfolio
The Fund's total return, based on net asset value, for the 12-month reporting period ended December 31, 2011, was 5.45%. The Barclays Capital Mortgage-Backed Securities Index (BCMBS),1 the Fund's broad-based securities market index, returned 6.23%. The Fund's total return reflected actual cash flows, transaction costs and other expenses which are not reflected in the total return of the BCMBS.
Sector allocation and duration were the most significant factors affecting Fund performance relative to the BCMBS.
MARKET OVERVIEW
Political upheaval, government debt and European financial system concerns dominated headlines during the year. Waves of unrest swept the Middle East in the “Arab Spring,” leading to the fall of numerous political leaders and their governments. European leaders came under pressure as well due to unsustainable levels of debt and the strains on government finances and the European financial system.
As the risk of selected European defaults rose along with debt levels, implications for European banks, large holders of sovereign debt, became worrisome. The need to maintain proper bank capitalization along with a stable financial system became the focus for numerous government leader summits and meetings in an attempt to forge a restructuring plan. As a resolution remained elusive, yields rose as investors demanded greater compensation for potential default risk, raising costs for select eurozone governments. For investors, the demand for risk declined, instead favoring government bonds, most notably U.S. Treasuries. Consequently, Treasury demand remained robust despite Standard & Poor's downgrade of long-term U.S. government debt in August.
Central banks were quite active, led by the European Central Bank (ECB) and the Federal Reserve (the “Fed”), which acted to increase liquidity and support growth. The ECB purchased sovereign debt in an attempt to reduce finance costs; however, market pressure on severely indebted nations was significant, most notably for Greece, Spain, Italy and Portugal. Additionally, the ECB initiated a three-year financing program for European financial institutions, offering low-cost loans intended to increase liquidity.
The Fed commenced “Operation Twist” which entails the sale of shorter maturity Treasuries in favor of buying longer maturity issues. Combined with the purchase of agency mortgage-backed securities (MBS) with paydowns from the Fed's MBS portfolio, these programs were devised to support housing and reduce interest rates. In this environment, investors preferred the safety of government debt over other fixed-income securities offering greater yield despite signs of improving U.S. economic growth in the latter portion of the reporting period. The two-year and ten-year Treasury yields decreased 35 and 141 basis points to 0.24% and 1.88%, respectively.
SECTOR ALLOCATION
Virtually all holdings consisted of MBS issued by Freddie Mac, Fannie Mae and Ginnie Mae.2 Our allocation within that universe favored Fannie Mae and Freddie Mac MBS with an underweight to Ginnie Maes. Financial institution demand for Ginnie Maes remained strong due in part to the full faith and credit guarantee of the U.S. government and the favorable risk-based capital treatment. Such demand propelled Ginnie Mae valuations to historically high levels. The underweight proved detrimental as Ginnie Mae MBS outperformed their conventional counterparts by nearly 200 basis points. Therefore, sector allocation acted as a significant drag on Fund performance.
DURATION3
Duration was below the BCMBS for a significant portion of the reporting period in expectation of higher interest rates. As Treasury market yields declined, as highlighted above, the Fund's capital gains lagged, thus negatively contributing to Fund performance.
| 1 | The BCMBS is an unmanaged index composed of all fixed securities mortgage pools by Government National Mortgage Association (GNMA), Federal National Mortgage Association and the Federal Home Loan Mortgage Corporation, including GNMA Graduated Payment Mortgages. The index is unmanaged, and it is not possible to invest directly in an index. |
| 2 | Bond prices are sensitive to changes in interest rates and a rise in interest rates can cause a decline in their prices. The value of some mortgage-backed securities may be particularly sensitive to changes in prevailing interest rates, and although the securities are generally supported by some form of government or private insurance, there is no assurance that private guarantors or insurers will meet their obligations. |
| 3 | Duration is a measure of a security's price sensitivity to changes in interest rates. Securities with longer durations are more sensitive to changes in interest rates than securities of shorter durations. |
Annual Shareholder Report15
FUND PERFORMANCE AND GROWTH OF A $10,000 INVESTMENT
The Average Annual Total Return table below shows returns averaged over the stated periods. The graph below illustrates the hypothetical investment of $10,0001 in the Federated Mortgage Core Portfolio (the “Fund”) from December 31, 2001 to December 31, 2011, compared to the Barclays Capital Mortgage-Backed Securities Index (BCMBS).2
| Average Annual Total Returns for the Period Ended 12/31/2011 | |
| 1 Year | 5.45% |
| 5 Year | 5.87% |
| 10 Years | 5.51% |
Performance data quoted represents past performance which is no guarantee of future results. Investment return and principal value will fluctuate so that an investor's shares, when redeemed, may be worth more or less than their original cost. Mutual fund performance changes over time and current performance may be lower or higher than what is stated. For current to the most recent month-end performance and after-tax returns, call 1-800-341-7400. Returns shown do not reflect the deduction of taxes that a shareholder would pay on Fund distributions or the redemption of Fund shares. Mutual funds are not obligations of or guaranteed by any bank and are not federally insured.
Growth of a $10,000 Investment
| Federated Mortgage Core Portfolio | C000024828 | BCMBS |
| 12/31/2001 | 10,000 | 10,000 |
| 12/31/2002 | 10,943 | 10,875 |
| 12/31/2003 | 11,328 | 11,208 |
| 12/31/2004 | 11,889 | 11,736 |
| 12/31/2005 | 12,184 | 12,042 |
| 12/31/2006 | 12,853 | 12,671 |
| 12/31/2007 | 13,686 | 13,553 |
| 12/31/2008 | 14,409 | 14,708 |
| 12/31/2009 | 15,431 | 15,554 |
| 12/31/2010 | 16,208 | 16,410 |
| 12/31/2011 | 17,092 | 17,432 |
41 graphic description end -->
| 1 | The Fund's performance assumes the reinvestment of all dividends and distributions. The BCMBS has been adjusted to reflect reinvestment of dividends on securities in the index. |
| 2 | The BCMBS is not adjusted to reflect sales charges, expenses, or other fees that the Securities and Exchange Commission requires to be reflected in the Fund's performance. The index is unmanged, and unlike the Fund, is not affected by cash flows. It is not possble to invest directly in an index. |
Annual Shareholder Report16
Portfolio of Investments Summary Table (unaudited) – Federated Mortgage Core Portfolio
At December 31, 2011, the Fund's portfolio composition1 was as follows:
| Type of Investment | Percentage of
Total Net Assets |
| U.S. Government Agency Mortgage-Backed Securities | 100.1% |
| Non-Agency Mortgage-Backed Securities | 2.2% |
| Cash Equivalents2 | 0.9% |
| Repurchase Agreements — Collateral3 | 15.0% |
| Other Assets and Liabilities — Net4 | (18.2)% |
| TOTAL | 100.0% |
| 1 | See the Fund's Confidential Private Offering Memorandum for a description of the principal types of securities in which the Fund invests. |
| 2 | Cash Equivalents include any investments in money market mutual funds and/or overnight repurchase agreements other than those representing Securities Lending Collateral or Dollar-Roll Collateral. |
| 3 | Includes repurchase agreements purchased with cash collateral received in securities lending and/or dollar-roll transactions, as well as cash covering when-issued and delayed delivery transactions. |
| 4 | Assets, other than investments in securities, less liabilities. See Statement of Assets and Liabilities. |
Annual Shareholder Report17
Portfolio of Investments – Federated Mortgage Core Portfolio
December 31, 2011
Principal
Amount | | | Value |
| | Collateralized Mortgage Obligations – 5.7% | |
| | Federal Home Loan Mortgage Corporation – 2.0% | |
| $12,000,589 | 1 | REMIC 3144 FB, 0.628%, 4/15/2036 | 11,980,291 |
| 6,426,723 | 1 | REMIC 3160 FD, 0.608%, 5/15/2036 | 6,411,925 |
| 2,997,461 | 1 | REMIC 3175 FE, 0.588%, 6/15/2036 | 2,988,438 |
| 14,651,309 | 1 | REMIC 3179 FP, 0.658%, 7/15/2036 | 14,641,894 |
| 1,700,492 | 1 | REMIC 3206 FE, 0.678%, 8/15/2036 | 1,701,216 |
| 8,325,491 | 1 | REMIC 3260 PF, 0.578%, 1/15/2037 | 8,327,698 |
| 4,608,027 | 1 | REMIC 3296 YF, 0.678%, 3/15/2037 | 4,593,104 |
| 13,780,000 | | REMIC K704 A2, 2.412%, 8/25/2018 | 13,979,166 |
| | TOTAL | 64,623,732 |
| | Federal National Mortgage Association – 1.5% | |
| 1,255,661 | 1 | REMIC 2005-63 FC, 0.544%, 10/25/2031 | 1,248,335 |
| 8,422,077 | 1 | REMIC 2006-104 FY, 0.634%, 11/25/2036 | 8,411,814 |
| 11,376,710 | 1 | REMIC 2006-115 EF, 0.654%, 12/25/2036 | 11,368,266 |
| 2,645,132 | 1 | REMIC 2006-43 FL, 0.694%, 6/25/2036 | 2,646,743 |
| 4,581,511 | 1 | REMIC 2006-58 FP, 0.594%, 7/25/2036 | 4,569,513 |
| 9,045,463 | 1 | REMIC 2006-81 FB, 0.644%, 9/25/2036 | 9,035,775 |
| 8,648,390 | 1 | REMIC 2006-85 PF, 0.674%, 9/25/2036 | 8,636,582 |
| | TOTAL | 45,917,028 |
| | Non-Agency Mortgage – 2.2% | |
| 3,221,004 | | Chase Mortgage Finance Corp. 2004-S3, Class 1A1, 5.000%, 3/25/2034 | 3,163,775 |
| 4,590,399 | | Countrywide Home Loans 2005-21, Class A2, 5.500%, 10/25/2035 | 4,099,754 |
| 8,245,906 | | Countrywide Home Loans 2007-14, Class A18, 6.000%, 9/25/2037 | 7,317,350 |
| 3,254,856 | | Credit Suisse Mortgage Capital Certificate 2007-4, Class 4A2, 5.500%, 6/25/2037 | 2,640,061 |
| 7,777,750 | | Lehman Mortgage Trust 2007-9, Class 1A1, 6.000%, 10/25/2037 | 6,872,105 |
| 2,895,115 | | Residential Funding Mortgage Securities I 2005-SA3, Class 3A, 5.247%, 8/25/2035 | 2,188,180 |
| 12,389,098 | | Sequoia Mortgage Trust 2011-1, Class A1, 4.125%, 2/25/2041 | 12,381,077 |
| 23,311,209 | | Sequoia Mortgage Trust 2011-2, Class A1, 3.900%, 9/25/2041 | 23,614,255 |
| 9,966,345 | | Structured Asset Securities Corp. 2005-17, Class 5A1, 5.500%, 10/25/2035 | 8,450,744 |
| | TOTAL | 70,727,301 |
| | TOTAL COLLATERALIZED MORTGAGE OBLIGATIONS
(IDENTIFIED COST $185,319,536) | 181,268,061 |
| | Mortgage-Backed Securities – 95.6% | |
| | Federal Home Loan Mortgage Corporation – 37.7% | |
| 86,333,613 | 2 | 3.500%, 8/1/2025 - 1/1/2042 | 89,898,025 |
| 162,560,950 | | 4.000%, 2/1/2020 - 12/1/2040 | 170,629,866 |
| 421,773,807 | | 4.500%, 6/1/2019 - 1/1/2042 | 447,274,860 |
| 282,721,196 | | 5.000%, 7/1/2019 - 1/1/2042 | 303,970,231 |
| 133,897,966 | | 5.500%, 3/1/2021 - 1/1/2042 | 145,192,809 |
| 17,337,171 | | 6.000%, 5/1/2014 - 1/1/2042 | 19,030,236 |
| 13,359,439 | | 6.500%, 7/1/2014 - 4/1/2038 | 14,799,571 |
| 1,907,894 | | 7.000%, 1/1/2012 - 9/1/2037 | 2,154,271 |
| 478,482 | | 7.500%, 12/1/2022 - 5/1/2031 | 557,704 |
| 460,891 | | 8.000%, 3/1/2030 - 3/1/2031 | 549,266 |
| 9,829 | | 8.500%, 9/1/2025 | 11,696 |
| 1,208 | | 9.000%, 5/1/2017 | 1,208 |
| 888 | | 9.500%, 4/1/2021 | 1,027 |
| | TOTAL | 1,194,070,770 |
Annual Shareholder Report18
Principal
Amount | | | Value |
| | Federal National Mortgage Association – 44.8% | |
| $35,000,000 | | 3.000%, 1/1/2027 | 36,147,682 |
| 96,982,383 | 2 | 3.500%, 9/1/2025 - 1/1/2042 | 101,059,426 |
| 308,507,283 | 2 | 4.000%, 7/1/2025 - 1/1/2042 | 324,650,795 |
| 219,895,653 | 2 | 4.500%, 12/1/2019 - 1/1/2042 | 233,899,560 |
| 280,547,052 | 2 | 5.000%, 5/1/2023 - 1/1/2042 | 303,074,336 |
| 259,983,399 | | 5.500%, 9/1/2014 - 1/1/2042 | 283,078,837 |
| 97,579,735 | 2 | 6.000%, 12/1/2013 - 1/1/2042 | 107,453,363 |
| 17,669,987 | | 6.500%, 8/1/2014 - 10/1/2038 | 19,687,100 |
| 6,665,575 | | 7.000%, 3/1/2012 - 6/1/2037 | 7,511,148 |
| 543,801 | | 7.500%, 4/1/2015 - 6/1/2033 | 635,695 |
| 180,325 | | 8.000%, 7/1/2023 - 3/1/2031 | 213,136 |
| 5,505 | | 9.000%, 11/1/2021 - 6/1/2025 | 6,342 |
| | TOTAL | 1,417,417,420 |
| | Government National Mortgage Association – 13.1% | |
| 4,991,101 | | 3.500%, 11/20/2041 | 5,204,806 |
| 98,414,551 | 2 | 4.000%, 7/20/2040 - 1/20/2042 | 105,588,465 |
| 128,198,422 | 2 | 4.500%, 2/15/2039 - 1/20/2042 | 139,824,628 |
| 120,786,433 | 2 | 5.000%, 1/15/2039 - 1/15/2042 | 133,806,238 |
| 15,448,274 | | 5.500%, 12/15/2038 - 2/15/2039 | 17,309,778 |
| 8,031,267 | | 6.000%, 10/15/2028 - 3/15/2040 | 9,086,590 |
| 771,854 | | 6.500%, 10/15/2028 - 2/15/2032 | 882,356 |
| 942,592 | | 7.000%, 11/15/2027 - 12/15/2031 | 1,080,758 |
| 405,911 | | 7.500%, 4/15/2029 - 1/15/2031 | 474,573 |
| 488,005 | | 8.000%, 1/15/2022 - 11/15/2030 | 572,454 |
| 47,239 | | 8.500%, 3/15/2022 - 9/15/2029 | 55,347 |
| 1,741 | | 9.500%, 10/15/2020 | 2,054 |
| 99,689 | | 12.000%, 4/15/2015 - 6/15/2015 | 109,568 |
| | TOTAL | 413,997,615 |
| | TOTAL MORTGAGE-BACKED SECURITIES
(IDENTIFIED COST $2,936,276,272) | 3,025,485,805 |
| | Adjustable Rate Mortgages – 1.0% | |
| | Federal Home Loan Mortgage Corporation ARM – 0.5% | |
| 14,361,647 | | Federal Home Loan Mortgage Corp. ARM, 2.090%, 7/1/2034 | 15,000,813 |
| | Federal National Mortgage Association ARM – 0.5% | |
| 15,346,967 | | Federal National Mortgage Association ARM, 2.830%, 8/1/2035 | 16,344,520 |
| | TOTAL ADJUSTABLE RATE MORTGAGES
(IDENTIFIED COST $31,313,766) | 31,345,333 |
| | Repurchase Agreements – 15.9% | |
| 293,977,000 | 1 | Interest in $4,100,000,000 joint repurchase agreement 0.06%, dated 12/30/2011 under which Bank of America, N.A. will repurchase securities provided as collateral for $4,100,027,333 on 1/3/2012. The securities provided as collateral at the end of the period were U.S. Government Agency securities with various maturities to 4/15/2040 and the market value of those underlying securities was $4,218,795,473. | 293,977,000 |
| 54,174,000 | 1,3 | Interest in $82,383,000 joint repurchase agreement 0.05%, dated 12/19/2011 under which Barclays Capital, Inc. will repurchase securities provided as collateral for $82,387,005 on 1/23/2012. The securities provided as collateral at the end of the period were U.S. Government Agency securities with various maturities to 3/25/2049 and the market value of those underlying securities was $84,740,414. | 54,174,000 |
| 22,170,000 | 3 | Interest in $22,170,000 joint repurchase agreement 0.11%, dated 12/15/2011 under which Deutsche Bank Securities, Inc. will repurchase a security provided as collateral for $22,172,303 on 1/18/2012. The security provided as collateral at the end of the period was a U.S. Government Agency security maturing on 10/1/2031 and the market value of that underlying security was $22,876,521. | 22,170,000 |
Annual Shareholder Report19
Principal
Amount | | | Value |
| $134,569,000 | 1,3 | Interest in $158,580,000 joint repurchase agreement 0.06%, dated 12/12/2011 under which RBC Capital Markets, LLC will repurchase securities provided as collateral for $158,588,193 on 1/12/2012. The securities provided as collateral at the end of the period were U.S. Government Agency securities with various maturities to 12/25/2041 and the market value of those underlying securities was $162,724,728. | 134,569,000 |
| | TOTAL REPURCHASE AGREEMENTS
(AT COST) | 504,890,000 |
| | TOTAL INVESTMENTS — 118.2%
(IDENTIFIED COST $3,657,799,574)4 | 3,742,989,199 |
| | OTHER ASSETS AND LIABILITIES - NET — (18.2)%5 | (577,187,211) |
| | TOTAL NET ASSETS — 100% | $3,165,801,988 |
| 1 | All or a portion of these securities are segregated pending settlement of dollar-roll transactions. |
| 2 | All or a portion of these To Be Announced Securities (TBAs) are subject to dollar-roll transactions. |
| 3 | Although the repurchase date is more than seven days after the date of purchase, the Fund has the right to terminate the repurchase agreement at any time with seven-days' notice. |
| 4 | The cost of investments for federal tax purposes amounts to $3,643,995,980. |
| 5 | Assets, other than investment in securities, less liabilities. See Statement of Assets and Liabilities. A significant portion of this balance is the result of dollar-roll transactions as of December 31, 2011. |
Note: The categories of investments are shown as a percentage of total net assets at December 31, 2011.
Various inputs are used in determining the value of the Fund's investments. These inputs are summarized in the three broad levels listed below:
Level 1 — quoted prices in active markets for identical securities, including investment companies with daily net asset values, if applicable. Level 2 — other significant observable inputs (including quoted prices for similar securities, interest rates, prepayment speeds, credit risk, etc.). Also includes securities valued at amortized cost. Level 3 — significant unobservable inputs (including the Fund's own assumptions in determining the fair value of investments).The inputs or methodology used for valuing securities are not an indication of the risk associated with investing in those securities.
As of December 31, 2011, all investments of the Fund utilized Level 2 inputs in valuing the Fund's assets carried at fair value.
The following acronyms are used throughout this portfolio:
| ARM | — Adjustable Rate Mortgage |
| REMIC | — Real Estate Mortgage Investment Conduit |
See Notes which are an integral part of the Financial Statements
Annual Shareholder Report20
Financial Highlights – Federated Mortgage Core Portfolio
(For a Share Outstanding Throughout Each Period)
| Year Ended December 31 | 2011 | 2010 | 2009 | 2008 | 2007 |
| Net Asset Value, Beginning of Period | $10.06 | $10.05 | $9.89 | $9.93 | $9.88 |
| Income From Investment Operations: | | | | | |
| Net investment income | 0.331 | 0.441 | 0.53 | 0.55 | 0.57 |
| Net realized and unrealized gain (loss) on investments | 0.21 | 0.06 | 0.16 | (0.04) | 0.05 |
| TOTAL FROM INVESTMENT OPERATIONS | 0.54 | 0.50 | 0.69 | 0.51 | 0.62 |
| Less Distributions: | | | | | |
| Distributions from net investment income | (0.40) | (0.49) | (0.53) | (0.55) | (0.57) |
| Net Asset Value, End of Period | $10.20 | $10.06 | $10.05 | $9.89 | $9.93 |
| Total Return2 | 5.45% | 5.04% | 7.09% | 5.28% | 6.48% |
| Ratios to Average Net Assets: | | | | | |
| Net expenses | 0.00%3 | 0.00%3 | 0.00%3 | 0.00%3 | 0.02% |
| Net investment income | 3.25% | 4.37% | 4.86% | 5.22% | 5.66% |
| Expense waiver/reimbursement4 | 0.10% | 0.10% | 0.10% | 0.10% | 0.08% |
| Supplemental Data: | | | | | |
| Net assets, end of period (000 omitted) | $3,165,802 | $1,959,812 | $2,034,884 | $1,918,613 | $1,879,760 |
| Portfolio turnover | 226% | 176% | 156% | 186% | 285% |
| Portfolio turnover (excluding purchases and sales from dollar-roll transactions) | 52% | 60% | 50% | 43% | 55% |
| 1 | Per share numbers have been calculated using the average shares method. |
| 2 | Based on net asset value. |
| 3 | The Adviser has voluntarily agreed to reimburse all operating expenses incurred by the Fund. This arrangement has no fixed term. |
| 4 | This expense decrease is reflected in both the net expense and the net investment income ratios shown above. |
See Notes which are an integral part of the Financial Statements
Annual Shareholder Report21
Statement of Assets and Liabilities – Federated Mortgage Core Portfolio
December 31, 2011
| Assets: | | |
| Short-term investments in securities, at value | $504,890,000 | |
| Long-term investments in securities, at value | 3,238,099,199 | |
| Total investments in securities, at value (identified cost $3,657,799,574) | | $3,742,989,199 |
| Cash | | 766 |
| Income receivable | | 10,442,626 |
| Receivable for investments sold | | 208,915,221 |
| Receivable for shares sold | | 100,000 |
| Other receivables | | 267,647 |
| TOTAL ASSETS | | 3,962,715,459 |
| Liabilities: | | |
| Payable to adviser (Note 5) | 1,221 | |
| Payable for investments purchased | 789,114,917 | |
| Payable for shares redeemed | 270,000 | |
| Income distribution payable | 7,433,463 | |
| Accrued expenses | 93,870 | |
| TOTAL LIABILITIES | | 796,913,471 |
| Net assets for 310,354,438 shares outstanding | | $3,165,801,988 |
| Net Assets Consist of: | | |
| Paid-in capital | | $3,108,447,547 |
| Net unrealized appreciation of investments | | 84,440,085 |
| Accumulated net realized loss on investments and futures contracts | | (27,438,316) |
| Undistributed net investment income | | 352,672 |
| TOTAL NET ASSETS | | $3,165,801,988 |
| Net Asset Value, Offering Price and Redemption Proceeds Per Share: | | |
| $3,165,801,988 ÷ 310,354,438 shares outstanding, no par value, unlimited shares authorized | | $10.20 |
See Notes which are an integral part of the Financial Statements
Annual Shareholder Report22
Statement of Operations – Federated Mortgage Core Portfolio
Year Ended December 31, 2011
| Investment Income: | | | |
| Interest | | | $77,968,625 |
| Expenses: | | | |
| Administrative fee (Note 5) | | $1,870,894 | |
| Custodian fees | | 103,086 | |
| Transfer and dividend disbursing agent fees and expenses | | 14,436 | |
| Directors'/Trustees' fees | | 14,708 | |
| Auditing fees | | 26,424 | |
| Legal fees | | 6,835 | |
| Portfolio accounting fees | | 224,571 | |
| Printing and postage | | 9,081 | |
| Insurance premiums | | 6,861 | |
| Miscellaneous | | 5,132 | |
| TOTAL EXPENSES | | 2,282,028 | |
| Waiver and Reimbursement (Note 5): | | | |
| Waiver of administrative fee | $(1,870,894) | | |
| Reimbursement of other operating expenses | (411,134) | | |
| TOTAL WAIVER AND REIMBURSEMENT | | (2,282,028) | |
| Net expenses | | | — |
| Net investment income | | | 77,968,625 |
| Realized and Unrealized Gain on Investments: | | | |
| Net realized gain on investments | | | 31,889,919 |
| Net change in unrealized appreciation of investments | | | 24,516,264 |
| Net realized and unrealized gain on investments | | | 56,406,183 |
| Change in net assets resulting from operations | | | $134,374,808 |
See Notes which are an integral part of the Financial Statements
Annual Shareholder Report23
Statement of Changes in Net Assets – Federated Mortgage Core Portfolio
| Year Ended December 31 | 2011 | 2010 |
| Increase (Decrease) in Net Assets | | |
| Operations: | | |
| Net investment income | $77,968,625 | $74,657,588 |
| Net realized gain on investments | 31,889,919 | 8,793,513 |
| Net change in unrealized appreciation/depreciation of investments | 24,516,264 | (2,346,838) |
| CHANGE IN NET ASSETS RESULTING FROM OPERATIONS | 134,374,808 | 81,104,263 |
| Distributions to Shareholders: | | |
| Distributions from net investment income | (93,323,414) | (82,066,785) |
| Share Transactions: | | |
| Proceeds from sale of shares | 1,336,805,144 | 656,774,935 |
| Net asset value of shares issued to shareholders in payment of distributions declared | 10,532,038 | 17,784,906 |
| Cost of shares redeemed | (182,398,976) | (748,668,620) |
| CHANGE IN NET ASSETS RESULTING FROM SHARE TRANSACTIONS | 1,164,938,206 | (74,108,779) |
| Change in net assets | 1,205,989,600 | (75,071,301) |
| Net Assets: | | |
| Beginning of period | 1,959,812,388 | 2,034,883,689 |
| End of period (including undistributed net investment income of $352,672 and $189,657, respectively) | $3,165,801,988 | $1,959,812,388 |
See Notes which are an integral part of the Financial Statements
Annual Shareholder Report24
Notes to Financial Statements – Federated Mortgage Core Portfolio
December 31, 2011
1. ORGANIZATION
Federated Core Trust (the “Trust”) is registered under the Investment Company Act of 1940, as amended (the “Act”), as an open-end management investment company. The Trust consists of five diversified portfolios. The financial statements included herein are only those of Federated Mortgage Core Portfolio (the “Fund”). The financial statements of the other portfolios are presented separately. The assets of each portfolio are segregated and a shareholder's interest is limited to the portfolio in which shares are held. Each portfolio pays its own expenses. The Fund's investment objective is to provide total return. The Fund is an investment vehicle used by other Federated funds that invest some of their assets in mortgage-backed securities. Currently, shares of the Fund are being offered for investment only to investment companies, insurance company separate accounts, common or commingled trust funds or similar organizations or entities that are “accredited investors” within the meaning of Regulation D of the Securities Act of 1933.
2. SIGNIFICANT ACCOUNTING POLICIES
The following is a summary of significant accounting policies consistently followed by the Fund in the preparation of its financial statements. These policies are in conformity with U.S. generally accepted accounting principles (GAAP).
Investment Valuation
In calculating its net asset value (NAV), the Fund generally values investments as follows:
- Fixed-income securities acquired with remaining maturities greater than 60 days are fair valued using price evaluations provided by a pricing service approved by the Board of Trustees (the “Trustees”).
- Fixed-income securities acquired with remaining maturities of 60 days or less are valued at their cost (adjusted for the accretion of any discount or amortization of any premium), which approximates market value.
- Shares of other mutual funds are valued based upon their reported NAVs.
- Derivative contracts listed on exchanges are valued at their reported settlement or closing price.
- Over-the-counter (OTC) derivative contracts are fair valued using price evaluations provided by a pricing service approved by the Trustees.
- For securities that are fair valued in accordance with procedures established by and under the general supervision of the Trustees, certain factors may be considered such as: the purchase price of the security, information obtained by contacting the issuer, analysis of the issuer's financial statements or other available documents, fundamental analytical data, the nature and duration of restrictions on disposition, the movement of the market in which the security is normally traded and public trading in similar securities of the issuer or comparable issuers.
If the Fund cannot obtain a price or price evaluation from a pricing service for an investment, the Fund may attempt to value the investment based upon the mean of bid and asked quotations or fair value the investment based on price evaluations, from one or more dealers. If any price, quotation, price evaluation or other pricing source is not readily available when the NAV is calculated, the Fund uses the fair value of the investment determined in accordance with the procedures described below. There can be no assurance that the Fund could purchase or sell an investment at the price used to calculate the Fund's NAV.
Fair Valuation and Significant Events Procedures
The Trustees have authorized the use of pricing services to provide evaluations of the current fair value of certain investments for purposes of calculating the NAV. Factors considered by pricing services in evaluating an investment include the yields or prices of investments of comparable quality, coupon, maturity, call rights and other potential prepayments, terms and type, reported transactions, indications as to values from dealers and general market conditions. Some pricing services provide a single price evaluation reflecting the bid-side of the market for an investment (a “bid” evaluation). Other pricing services offer both bid evaluations and price evaluations indicative of a price between the prices bid and asked for the investment (a “mid” evaluation). The Fund normally uses bid evaluations for U.S. Treasury and Agency securities, mortgage-backed securities and municipal securities. The Fund normally uses mid evaluations for other types of fixed-income securities and OTC derivative contracts. In the event that market quotations and price evaluations are not available for an investment, the fair value of the investment is determined in accordance with procedures adopted by the Trustees.
The Trustees also have adopted procedures requiring an investment to be priced at its fair value whenever the Adviser determines that a significant event affecting the value of the investment has occurred between the time as of which the price of the investment would otherwise be determined and the time as of which the NAV is computed. An event is considered significant if there is both an affirmative expectation that the investment's value will change in response to the event and a reasonable basis for quantifying the resulting change in value. Examples of significant events that may occur after the close of the principal market on which a security is traded, or after the time of a price evaluation provided by a pricing service or a dealer, include:
- With respect to price evaluations of fixed-income securities determined before the close of regular trading on the NYSE, actions by the Federal Reserve Open Market Committee and other significant trends in U.S. fixed-income markets;
- Political or other developments affecting the economy or markets in which an issuer conducts its operations or its securities are traded; and
- Announcements concerning matters such as acquisitions, recapitalizations, litigation developments, a natural disaster affecting the issuer's operations or regulatory changes or market developments affecting the issuer's industry.
The Fund may seek to obtain more current quotations or price evaluations from alternative pricing sources. If a reliable alternative pricing source is not available, the Fund will determine the fair value of the investment using another method approved by the Trustees.
Annual Shareholder Report
25
Repurchase AgreementsThe Fund may invest in repurchase agreements for short-term liquidity purposes. It is the policy of the Fund to require the other party to a repurchase agreement to transfer to the Fund's custodian or sub-custodian eligible securities or cash with a market value (after transaction costs) at least equal to the repurchase price to be paid under the repurchase agreement. The eligible securities are transferred to accounts with the custodian or sub-custodian in which the Fund holds a “securities entitlement” and exercises “control” as those terms are defined in the Uniform Commercial Code. The Fund has established procedures for monitoring the market value of the transferred securities and requiring the transfer of additional eligible securities if necessary to equal at least the repurchase price. These procedures also allow the other party to require securities to be transferred from the account to the extent that their market value exceeds the repurchase price or in exchange for other eligible securities of equivalent market value.
The insolvency of the other party or other failure to repurchase the securities may delay the disposition of the underlying securities or cause the Fund to receive less than the full repurchase price. Under the terms of the repurchase agreement, any amounts received by the Fund in excess of the repurchase price and related transaction costs must be remitted to the other party.
The Fund may enter into repurchase agreements in which eligible securities are transferred into joint trading accounts maintained by the custodian or sub-custodian for investment companies and other clients advised by the Fund's Adviser and its affiliates. The Fund will participate on a pro rata basis with the other investment companies and clients in its share of the securities transferred under such repurchase agreements and in its share of proceeds from any repurchase or other disposition of such securities.
Investment Income, Gains and Losses, Expenses and Distributions
Investment transactions are accounted for on a trade-date basis. Realized gains and losses from investment transactions are recorded on an identified-cost basis. Interest income and expenses are accrued daily. Distributions to shareholders are recorded on the ex-dividend date. Distributions of net investment income are declared daily and paid monthly.
Premium and Discount Amortization/Paydown Gains and Losses
All premiums and discounts on fixed-income securities are amortized/accreted using the effective interest rate method. Gains and losses realized on principal payment of mortgage-backed securities (paydown gains and losses) are classified as part of investment income.
Federal Taxes
It is the Fund's policy to comply with the Subchapter M provision of the Internal Revenue Code (the “Code”) and to distribute to shareholders each year substantially all of its income. Accordingly, no provision for federal income tax is necessary. As of and during the year ended December 31, 2011, the Fund did not have a liability for any uncertain tax positions. The Fund recognizes interest and penalties, if any, related to tax liabilities as income tax expense in the Statement of Operations. As of December 31, 2011, tax years 2008 through 2011 remain subject to examination by the Fund's major tax jurisdictions, which include the United States of America and the Commonwealth of Massachusetts.
When-Issued and Delayed Delivery Transactions
The Fund may engage in when-issued or delayed delivery transactions. The Fund records when-issued securities on the trade date and maintains security positions such that sufficient liquid assets will be available to make payment for the securities purchased. Securities purchased on a when-issued or delayed delivery basis are marked to market daily and begin earning interest on the settlement date. Losses may occur on these transactions due to changes in market conditions or the failure of counterparties to perform under the contract.
The Fund may transact in To Be Announced Securities (TBAs). As with other delayed delivery transactions, a seller agrees to issue TBAs at a future date. However, the seller does not specify the particular securities to be delivered. Instead, the Fund agrees to accept any security that meets specified terms such as issuer, interest rate and terms of underlying mortgages. The Fund records TBAs on the trade date utilizing information associated with the specified terms of the transaction as opposed to the specific mortgages. TBAs are marked to market daily and begin earning interest on the settlement date. Losses may occur due to the fact that the actual underlying mortgages received may be less favorable than those anticipated by the Fund.
Dollar-Roll Transactions
The Fund engages in dollar-roll transactions in which the Fund sells mortgage-backed securities with a commitment to buy similar (same type, coupon and maturity), but not identical mortgage-backed securities on a future date at a lower price. Normally, one or both securities involved are TBA mortgage-backed securities. The Fund treats dollar-roll transactions as purchases and sales. Dollar-rolls are subject to interest rate risks and credit risks.
Other
The preparation of financial statements in conformity with GAAP requires management to make estimates and assumptions that affect the amounts of assets, liabilities, expenses and revenues reported in the financial statements. Actual results could differ from those estimated.
3. SHARES OF BENEFICIAL INTEREST
The following table summarizes share activity:
| Year Ended December 31 | 2011 | 2010 |
| Shares sold | 132,500,999 | 64,569,656 |
| Shares issued to shareholders in payment of distributions declared | 1,040,560 | 1,750,794 |
| Shares redeemed | (18,079,376) | (73,987,780) |
| NET CHANGE RESULTING FROM FUND SHARE TRANSACTIONS | 115,462,183 | (7,667,330) |
Annual Shareholder Report26
4. FEDERAL TAX INFORMATION
The timing and character of income and capital gain distributions are determined in accordance with income tax regulations, which may differ from GAAP. These differences are due to differing treatments for dollar-roll transactions.
For the year ended December 31, 2011, permanent differences identified and reclassified among the components of net assets were as follows:
| Increase (Decrease) |
Undistributed
Net Investment
Income (Loss) | Accumulated
Net Realized
Gain (Loss) |
| $15,517,804 | $(15,517,804) |
Net investment income (loss), net realized gains (losses) and net assets were not affected by this reclassification.
The tax character of distributions as reported on the Statement of Changes in Net Assets for the years ended December 31, 2011 and 2010, was as follows:
| 2011 | 2010 |
| Ordinary income | $93,323,414 | $82,066,785 |
As of December 31, 2011, the components of distributable earnings on a tax basis were as follows:
| Undistributed ordinary income | $352,672 |
| Net unrealized appreciation | $98,993,219 |
| Capital loss carryforwards | $(41,991,450) |
The difference between book-basis and tax-basis net unrealized appreciation/depreciation is attributable to differing treatments for the deferral of losses on wash sales and dollar-roll transactions.
At December 31, 2011, the cost of investments for federal tax purposes was $3,643,995,980. The net unrealized appreciation of investments for federal tax purposes was $98,993,219. This consists of net unrealized appreciation from investments for those securities having an excess of value over cost of $116,880,429 and net unrealized depreciation from investments for those securities having an excess of cost over value of $17,887,210.
At December 31, 2011, the Fund had a capital loss carryforward of $41,991,450 which will reduce the Fund's taxable income arising from future net realized gains on investments, if any, to the extent permitted by the Code, thereby reducing the amount of distributions to shareholders which would otherwise be necessary to relieve the Fund of any liability for federal income tax. Pursuant to the Code, a net capital loss incurred in taxable years beginning on or before December 22, 2010 is characterized as short-term and may be carried forward for a maximum of eight tax years (“Carryforward Limit”), whereas a net capital loss incurred in taxable years beginning after December 22, 2010, retains its character as either short-term or long-term, does not expire and is required to be utilized prior to the losses which have a Carryforward Limit.
The following schedule summarizes the Fund's short-term and long-term capital loss carryforwards and expiration year:
| Expiration Year | Short-Term | Long-Term | Total |
| 2013 | $1,956,693 | N/A | $1,956,693 |
| 2014 | $18,701,202 | N/A | $18,701,202 |
| 2015 | $6,318,825 | N/A | $6,318,825 |
| 2017 | $15,014,730 | N/A | $15,014,730 |
The Fund used capital loss carryforwards of $1,334,704 to offset taxable capital gains realized during the year ended December 31, 2011.
5. INVESTMENT ADVISER FEE AND OTHER TRANSACTIONS WITH AFFILIATES
Investment Adviser Fee
Federated Investment Management Company is the Fund's investment adviser (the “Adviser”), subject to the direction of the Trustees. The Adviser provides investment adviser services at no fee, because all investors in the fund are other Federated funds, insurance company separate accounts, common or commingled trust funds or similar organizations or entities that are “accredited investors” within the meaning of Regulation D of the 1933 Act. The Adviser may voluntarily choose to reimburse certain operating expenses of the Fund. The Adviser can modify or terminate this voluntary reimbursement at any time at its sole discretion. For the year ended December 31, 2011, the Adviser voluntarily reimbursed $411,134 of other operating expenses.
Annual Shareholder Report
27
Administrative FeeFederated Administrative Services (FAS), under the Administrative Services Agreement, provides the Fund with administrative personnel and services. The fee paid to FAS is based on the average aggregate daily net assets of certain Federated funds as specified below:
| Administrative Fee | Average Aggregate Daily Net Assets
of the Federated Funds |
| 0.150% | on the first $5 billion |
| 0.125% | on the next $5 billion |
| 0.100% | on the next $10 billion |
| 0.075% | on assets in excess of $20 billion |
The administrative fee received during any fiscal year shall be at least $150,000 per portfolio and $40,000 per each additional class of Shares. FAS may voluntarily choose to waive any portion of its fee. FAS can modify or terminate this voluntary waiver at any time at its sole discretion. For the year ended December 31, 2011, FAS waived its entire fee of $1,870,894.
General
Certain Officers and Trustees of the Fund are Officers and Directors or Trustees of the above companies.
6. Investment TRANSACTIONS
Purchases and sales of investments, excluding long-term U.S. government securities and short-term obligations for the year ended December 31, 2011, were as follows:
| Purchases | $79,117,042 |
| Sales | $64,226,991 |
7. LINE OF CREDIT
The Fund participates in a $100,000,000 unsecured, uncommitted revolving line of credit (LOC) agreement with PNC Bank. The LOC was made available for extraordinary or emergency purposes, primarily for financing redemption payments. Borrowings are charged interest at a rate offered to the Fund by PNC Bank at the time of the borrowing. As of December 31, 2011, there were no outstanding loans. During the year ended December 31, 2011, the Fund did not utilize the LOC.
8. INTERFUND LENDING
Pursuant to an Exemptive Order issued by the Securities and Exchange Commission, the Fund, along with other funds advised by subsidiaries of Federated Investors, Inc., may participate in an interfund lending program. This program provides an alternative credit facility allowing the Fund to borrow from other participating affiliated funds. As of December 31, 2011, there were no outstanding loans. During the year ended December 31, 2011, the program was not utilized.
9. RECENT ACCOUNTING PRONOUNCEMENTS
In April 2011, the Financial Accounting Standards Board (FASB) released Accounting Standards Update (ASU) No. 2011-03, “Reconsideration of Effective Control for Repurchase Agreements.” This ASU amends FASB Accounting Standards Codification (ASC) Topic 860, “Transfers and Servicing”; specifically the criteria required to determine whether a repurchase agreement and similar agreements should be accounted for as sales of financial assets or secured borrowings with commitments. This ASU is effective for fiscal years and interim periods beginning after December 15, 2011. Management has concluded that the adoption of ASU No. 2011-03 is not expected to have a material impact on the Fund's financial statements and the accompanying notes, net assets or results of operations.
In addition, in May 2011, FASB released ASU No. 2011-04, “Amendments to Achieve Common Fair Value Measurement and Disclosure Requirements in U.S. GAAP and IFRSs.” This ASU amends FASB ASC Topic 820, “Fair Value Measurement,” to establish common requirements for measuring fair value and for disclosing information about fair value measurements in accordance with GAAP. This ASU is effective for fiscal years and interim periods beginning after December 15, 2011. Management has concluded that the adoption of ASU No. 2011-04 is not expected to have a material impact on the Fund's financial statements and the accompanying notes.
Annual Shareholder Report28
Report of Independent Registered Public Accounting Firm
TO THE BOARD OF Trustees of Federated Core trust AND SHAREHOLDERS OF federated mortgage core portfolio:
We have audited the accompanying statement of assets and liabilities of Federated Mortgage Core Portfolio (the “Fund”) (one of the portfolios constituting Federated Core Trust), including the portfolio of investments, as of December 31, 2011, and the related statement of operations for the year then ended, the statement of changes in net assets for each of the two years in the period then ended, and the financial highlights for each of the five years in the period then ended. These financial statements and financial highlights are the responsibility of the Fund's management. Our responsibility is to express an opinion on these financial statements and financial highlights based on our audits.
We conducted our audits in accordance with standards of the Public Company Accounting Oversight Board (United States). Those standards require that we plan and perform the audit to obtain reasonable assurance about whether the financial statements and financial highlights are free of material misstatement. We were not engaged to perform an audit of the Fund's internal control over financial reporting. Our audits included consideration of internal control over financial reporting as a basis for designing audit procedures that are appropriate in the circumstances, but not for the purpose of expressing an opinion on the effectiveness of the Fund's internal control over financial reporting. Accordingly, we express no such opinion. An audit also includes examining, on a test basis, evidence supporting the amounts and disclosures in the financial statements and financial highlights, assessing the accounting principles used and significant estimates made by management, and evaluating the overall financial statement presentation. Our procedures included confirmation of securities owned as of December 31, 2011, by correspondence with the custodian and others or by other appropriate auditing procedures where replies from others were not received. We believe that our audits provide a reasonable basis for our opinion.
In our opinion, the financial statements and financial highlights referred to above present fairly, in all material respects, the financial position of Federated Mortgage Core Portfolio, a portfolio of Federated Core Trust, at December 31, 2011, the results of its operations for the year then ended, the changes in its net assets for each of the two years in the period then ended, and the financial highlights for each of the five years in the period then ended, in conformity with U.S. generally accepted accounting principles.
Boston, Massachusetts
February 22, 2012
Annual Shareholder Report29
Shareholder Expense Example (unaudited) – Federated Mortgage Core Portfolio
As a shareholder of the Fund, you incur ongoing costs, including to the extent applicable, management fees, distribution (12b-1) fees and/or shareholder services fees and other Fund expenses. This Example is intended to help you to understand your ongoing costs (in dollars) of investing in the Fund and to compare these costs with the ongoing costs of investing in other mutual funds. It is based on an investment of $1,000 invested at the beginning of the period and held for the entire period from July 1, 2011 to December 31, 2011.
ACTUAL EXPENSES
The first section of the table below provides information about actual account values and actual expenses. You may use the information in this section, together with the amount you invested, to estimate the expenses that you incurred over the period. Simply divide your account value by $1,000 (for example, an $8,600 account value divided by $1,000 = 8.6), then multiply the result by the number in the first section under the heading entitled “Expenses Paid During Period” to estimate the expenses attributable to your investment during this period.
HYPOTHETICAL EXAMPLE FOR COMPARISON PURPOSES
The second section of the table below provides information about hypothetical account values and hypothetical expenses based on the Fund's actual expense ratio and an assumed rate of return of 5% per year before expenses, which is not the Fund's actual return. Thus, you should not use the hypothetical account values and expenses to estimate the actual ending account balance or your expenses for the period. Rather, these figures are required to be provided to enable you to compare the ongoing costs of investing in the Fund with other funds. To do so, compare this 5% hypothetical example with the 5% hypothetical examples that appear in the shareholder reports of the other funds.
Please note that the expenses shown in the table are meant to highlight your ongoing costs only. Therefore, the second section of the table is useful in comparing ongoing costs only, and will not help you determine the relative total costs of owning different funds.
| Beginning
Account Value
7/1/2011 | Ending
Account Value
12/31/2011 | Expenses Paid
During Period1 |
| Actual | $1,000.00 | $1,026.60 | $0.00 |
| Hypothetical (assuming a 5% return before expenses) | $1,000.00 | $1,025.21 | $0.00 |
| 1 | Expenses are equal to the Fund's annualized net expense ratio of 0.00%, multiplied by the average account value over the period, multiplied by 184/365 (to reflect the one-half-year period). The Adviser has voluntarily agreed to reimburse all operating expenses incurred by the Fund. This arrangement has no fixed term. |
Annual Shareholder Report30
Board of Trustees and Trust Officers
The Board of Trustees is responsible for managing the Trust's business affairs and for exercising all the Trust's powers except those reserved for the shareholders. The following tables give information about each Trustee and the senior officers of the Fund. Where required, the tables separately list Trustees who are “interested persons” of the Fund (i.e., “Interested” Trustees) and those who are not (i.e., “Independent” Trustees). Unless otherwise noted, the address of each person listed is Federated Investors Tower, 1001 Liberty Avenue, Pittsburgh, PA 15222. The address of all Independent Trustees listed is 4000 Ericsson Drive, Warrendale, PA 15086-7561; Attention: Mutual Fund Board. As of December 31, 2011, the Trust comprised four portfolio(s), and the Federated Fund Family consisted of 43 investment companies (comprising 134 portfolios). Unless otherwise noted, each Officer is elected annually. Unless otherwise noted, each Trustee oversees all portfolios in the Federated Fund Family and serves for an indefinite term. The Fund's Statement of Additional Information includes additional information about Trust Trustees and is available, without charge and upon request, by calling 1-800-341-7400.
Interested Trustees Background
Name
Birth Date
Positions Held with Trust
Date Service Began | Principal Occupation(s) for Past Five Years,
Other Directorships Held and Previous Position(s) |
John F. Donahue*
Birth Date: July 28, 1924
Trustee
Began serving: November 2005 | Principal Occupations: Director or Trustee of the Federated Fund Family; Chairman and Director, Federated Investors, Inc.; Chairman of the Federated Fund Family's Executive Committee.
Previous Positions: Chairman of the Federated Fund Family; Trustee, Federated Investment Management Company; Chairman and Director, Federated Investment Counseling. |
J. Christopher Donahue*
Birth Date: April 11, 1949
President and Trustee
Began serving: October 2005 | Principal Occupations: Principal Executive Officer and President of the Federated Fund Family; Director or Trustee of some of the Funds in the Federated Fund Family; President, Chief Executive Officer and Director, Federated Investors, Inc.; Chairman and Trustee, Federated Investment Management Company; Trustee, Federated Investment Counseling; Chairman and Director, Federated Global Investment Management Corp.; Chairman, Federated Equity Management Company of Pennsylvania and Passport Research, Ltd. (investment advisory subsidiary of Federated); Trustee, Federated Shareholder Services Company; Director, Federated Services Company.
Previous Positions: President, Federated Investment Counseling; President and Chief Executive Officer, Federated Investment Management Company, Federated Global Investment Management Corp. and Passport Research, Ltd. |
| * | Family relationships and reasons for “interested” status: John F. Donahue is the father of J. Christopher Donahue; both are “interested” due to their beneficial ownership of shares of Federated Investors, Inc. and the positions they hold with Federated and its subsidiaries. |
INDEPENDENT Trustees Background
Name
Birth Date
Positions Held with Trust
Date Service Began | Principal Occupation(s) for Past Five Years,
Other Directorships Held, Previous Position(s) and Qualifications |
Nicholas P. Constantakis, CPA
Birth Date: September 3, 1939
Trustee
Began serving: November 2005 | Principal Occupation: Director or Trustee of the Federated Fund Family.
Other Directorship Held: Director, Chairman of the Audit Committee, and member of the Compensation Committee, Michael Baker Corporation (architecture, engineering and construction services).
Previous Position: Partner, Andersen Worldwide SC.
Qualifications: Public accounting and director experience. |
John F. Cunningham
Birth Date: March 5, 1943
Trustee
Began serving: November 2005 | Principal Occupation: Director or Trustee of the Federated Fund Family.
Other Directorships Held: Chairman, President and Chief Executive Officer, Cunningham & Co., Inc. (strategic business consulting); Trustee Associate, Boston College.
Previous Positions: Director, Redgate Communications and EMC Corporation (computer storage systems); Chairman of the Board and Chief Executive Officer, Computer Consoles, Inc.; President and Chief Operating Officer, Wang Laboratories; Director, First National Bank of Boston; Director, Apollo Computer, Inc.
Qualifications: Business management and director experience. |
Annual Shareholder Report31
Name
Birth Date
Positions Held with Trust
Date Service Began | Principal Occupation(s) for Past Five Years,
Other Directorships Held, Previous Position(s) and Qualifications |
Maureen Lally-Green
Birth Date: July 5, 1949
Trustee
Began serving: August 2009 | Principal Occupations: Director or Trustee of the Federated Fund Family; Director, Office of Church Relations, Diocese of Pittsburgh; Adjunct Professor of Law, Duquesne University School of Law.
Other Directorships Held: Director, Auberle; Trustee, St. Francis University; Director, Ireland Institute of Pittsburgh; Director, UPMC Mercy Hospital; Regent, St. Vincent Seminary; Director, Epilepsy Foundation of Western and Central Pennsylvania; Director, Saint Thomas More Society, Allegheny County.
Previous Position: Pennsylvania Superior Court Judge.
Qualifications: Legal and director experience. |
Peter E. Madden
Birth Date: March 16, 1942
Trustee
Began serving: November 2005 | Principal Occupation: Director or Trustee, and Chairman of the Board of Directors or Trustees, of the Federated Fund Family.
Previous Positions: Representative, Commonwealth of Massachusetts General Court; President, Chief Operating Officer and Director, State Street Bank and Trust Company and State Street Corporation (retired); Director, VISA USA and VISA International; Chairman and Director, Massachusetts Bankers Association; Director, Depository Trust Corporation; Director, The Boston Stock Exchange.
Qualifications: Business management, mutual fund services and director experience. |
Charles F. Mansfield, Jr.
Birth Date: April 10, 1945
Trustee
Began serving: November 2005 | Principal Occupations: Director or Trustee of the Federated Fund Family; Management Consultant.
Previous Positions: Chief Executive Officer, PBTC International Bank; Partner, Arthur Young & Company (now Ernst & Young LLP); Chief Financial Officer of Retail Banking Sector, Chase Manhattan Bank; Senior Vice President, HSBC Bank USA (formerly Marine Midland Bank); Vice President, Citibank; Assistant Professor of Banking and Finance, Frank G. Zarb School of Business, Hofstra University; Executive Vice President, DVC Group, Inc. (marketing, communications and technology).
Qualifications: Banking, business management, education and director experience. |
Thomas M. O'Neill
Birth Date: June 14, 1951
Trustee
Began serving: October 2006 | Principal Occupations: Director or Trustee, Vice Chairman of the Audit Committee of the Federated Fund Family; Sole Proprietor, Navigator Management Company (investment and strategic consulting).
Other Directorships Held: Board of Overseers, Children's Hospital of Boston; Visiting Committee on Athletics, Harvard College; Board of Directors, Medicines for Humanity; Board of Directors, The Golisano Children's Museum of Naples, Florida.
Previous Positions: Chief Executive Officer and President, Managing Director and Chief Investment Officer, Fleet Investment Advisors; President and Chief Executive Officer, Aeltus Investment Management, Inc.; General Partner, Hellman, Jordan Management Co., Boston, MA; Chief Investment Officer, The Putnam Companies, Boston, MA; Credit Analyst and Lending Officer, Fleet Bank; Director and Consultant, EZE Castle Software (investment order management software); Director, Midway Pacific (lumber).
Qualifications: Business management, mutual fund, director and investment experience. |
John S. Walsh
Birth Date: November 28, 1957
Trustee
Began serving: November 2005 | Principal Occupations: Director or Trustee, Chairman of the Audit Committee of the Federated Fund Family; President and Director, Heat Wagon, Inc. (manufacturer of construction temporary heaters); President and Director, Manufacturers Products, Inc. (distributor of portable construction heaters); President, Portable Heater Parts, a division of Manufacturers Products, Inc.
Previous Position: Vice President, Walsh & Kelly, Inc.
Qualifications: Business management and director experience. |
OFFICERS
Name
Birth Date
Address
Positions Held with Trust
Date Service Began | Principal Occupation(s) for Past Five Years
and Previous Position(s) |
John W. McGonigle
Birth Date: October 26, 1938
EXECUTIVE VICE PRESIDENT AND SECRETARY
Began serving: October 2005 | Principal Occupations: Executive Vice President and Secretary of the Federated Fund Family; Vice Chairman, Executive Vice President, Secretary and Director, Federated Investors, Inc.
Previous Positions: Trustee, Federated Investment Management Company and Federated Investment Counseling; Director, Federated Global Investment Management Corp., Federated Services Company and Federated Securities Corp. |
Richard A. Novak
Birth Date: December 25, 1963
TREASURER
Began serving: January 2006 | Principal Occupations: Principal Financial Officer and Treasurer of the Federated Fund Family; Senior Vice President, Federated Administrative Services; Financial and Operations Principal for Federated Securities Corp., Edgewood Services, Inc. and Southpointe Distribution Services, Inc.
Previous Positions: Controller of Federated Investors, Inc.; Vice President, Finance of Federated Services Company; held various financial management positions within The Mercy Hospital of Pittsburgh; Auditor, Arthur Andersen & Co. |
Annual Shareholder Report32
Name
Birth Date
Address
Positions Held with Trust
Date Service Began | Principal Occupation(s) for Past Five Years
and Previous Position(s) |
Richard B. Fisher
Birth Date: May 17, 1923
VICE CHAIRMAN
Began serving: October 2005 | Principal Occupations: Vice Chairman or Vice President of some of the Funds in the Federated Fund Family; Vice Chairman, Federated Investors, Inc.; Chairman, Federated Securities Corp.
Previous Positions: President and Director or Trustee of some of the Funds in the Federated Fund Family; Executive Vice President, Federated Investors, Inc.; Director and Chief Executive Officer, Federated Securities Corp. |
Brian P. Bouda
Birth Date: February 28, 1947
CHIEF COMPLIANCE OFFICER AND SENIOR VICE PRESIDENT
Began serving: October 2005 | Principal Occupations: Senior Vice President and Chief Compliance Officer of the Federated Fund Family; Vice President and Chief Compliance Officer of Federated Investors, Inc. and Chief Compliance Officer of its subsidiaries. Mr. Bouda joined Federated in 1999 and is a member of the American Bar Association and the State Bar Association of Wisconsin. |
Robert J. Ostrowski
Birth Date: April 26, 1963
CHIEF INVESTMENT OFFICER
Began serving: September 2006 | Principal Occupations: Robert J. Ostrowski joined Federated in 1987 as an Investment Analyst and became a Portfolio Manager in 1990. He was named Chief Investment Officer of taxable fixed-income products in 2004 and also serves as a Senior Portfolio Manager. He has been a Senior Vice President of the Fund's Adviser since 1997. Mr. Ostrowski has received the Chartered Financial Analyst designation. He received his M.S. in Industrial Administration from Carnegie Mellon University. |
Joseph M. Balestrino
Birth Date: November 3, 1954
VICE PRESIDENT
Began serving: October 2005 | Principal Occupations: Joseph M. Balestrino is Vice President of the Trust. Mr. Balestrino joined Federated in 1986 and has been a Senior Portfolio Manager and Senior Vice President of the Fund's Adviser since 1998. He was a Portfolio Manager and a Vice President of the Fund's Adviser from 1995 to 1998. Mr. Balestrino served as a Portfolio Manager and an Assistant Vice President of the Adviser from 1993 to 1995. Mr. Balestrino has received the Chartered Financial Analyst designation and holds a Master's Degree in Urban and Regional Planning from the University of Pittsburgh. |
Annual Shareholder Report33
Evaluation and Approval of Advisory Contract – May 2011
Federated Mortgage Strategy Portfolio (the “Fund”)
The Fund's Board reviewed the Fund's investment advisory contract at meetings held in May 2011. The Board's decision regarding the contract reflects the exercise of its business judgment on whether to continue the existing arrangements. The Fund is distinctive in that it: is used to implement particular investment strategies that are offered to investors in certain separately managed or wrap fee accounts or programs or certain other discretionary investments accounts; and may also be offered to other Federated funds. In addition, the Adviser does not charge an investment advisory fee for its services although it or its affiliates may receive compensation for managing assets invested in the Fund.
The Federated Funds' Board had previously appointed a Senior Officer, whose duties include specified responsibilities relating to the process by which advisory fees are to be charged to a Federated fund. The Senior Officer has the authority to retain consultants, experts, or staff as may be reasonably necessary to assist in the performance of his duties, reports directly to the Board, and may be terminated only with the approval of a majority of the independent members of the Board. The Senior Officer prepared and furnished to the Board an independent, written evaluation that covered topics discussed below (the “Evaluation”). The Board considered that Evaluation, along with other information, in deciding to approve the advisory contract.
As previously noted, the Adviser does not charge an investment advisory fee for its services; however, the Board did consider compensation and benefits received by the Adviser, including fees received for services provided to the Fund by other entities in the Federated organization and research services received by the Adviser from brokers that execute Federated fund trades. The Board is also familiar with and considered judicial decisions concerning allegedly excessive investment advisory fees which have indicated that the following factors may be relevant to an Adviser's fiduciary duty with respect to its receipt of compensation from a fund: the nature and quality of the services provided by the Adviser, including the performance of the Fund; the Adviser's cost of providing the services; the extent to which the Adviser may realize “economies of scale” as the Fund grows larger; any indirect benefits that may accrue to the Adviser and its affiliates as a result of the Adviser's relationship with the Fund; performance and expenses of comparable funds; and the extent to which the independent Board members are fully informed about all facts the Board deems relevant bearing on the Adviser's services and fees. The Board further considered management fees (including any components thereof) charged to institutional and other clients of the Adviser for what might be viewed as like services, and the cost to the Adviser and its affiliates of supplying services pursuant to the management fee agreements, excluding any intra-corporate profit and profit margins of the Adviser and its affiliates for supplying such services. The Board was aware of these factors and was guided by them in its review of the Fund's advisory contract to the extent it considered them to be appropriate and relevant, as discussed further below.
The Board considered and weighed these circumstances in light of its substantial accumulated experience in governing the Fund and working with Federated on matters relating to the Federated funds, and was assisted in its deliberations by independent legal counsel. Throughout the year, the Board has requested and received substantial and detailed information about the Fund and the Federated organization that was in addition to the extensive materials that comprise and accompany the Senior Officer's Evaluation. Federated provided much of this information at each regular meeting of the Board, and furnished additional information in connection with the particular meeting at which the Board's formal review of the advisory contract occurred. Between regularly scheduled meetings, the Board has received information on particular matters as the need arose. Thus, the Board's consideration of the advisory contract included review of the Senior Officer's Evaluation, accompanying data and additional information covering such matters as: the Adviser's investment philosophy, personnel and processes; investment and operating strategies; the Fund's short- and long-term performance, and comments on the reasons for performance; the Fund's investment objectives; the Fund's overall expense structure; the use and allocation of brokerage commissions derived from trading the Fund's portfolio securities (if any); and the nature, quality and extent of the advisory and other services provided to the Fund by the Adviser and its affiliates. The Board also considered the preferences and expectations of Fund shareholders and their relative sophistication; the continuing state of competition in the mutual fund industry and market practices; the Fund's relationship to the Federated family of funds which include a comprehensive array of funds with different investment objectives, policies and strategies which are available for exchange without the incurrence of additional sales charges; compliance and audit reports concerning the Federated funds and the Federated companies that service them (including communications from regulatory agencies), as well as Federated's responses to any issues raised therein; and relevant developments in the mutual fund industry and how the Federated funds and/or Federated are responding to them. The Board's evaluation process is evolutionary. The criteria considered and the emphasis placed on relevant criteria change in recognition of changing circumstances in the mutual fund marketplace.
Because the Adviser does not charge the Fund an investment advisory fee, the Fund's Board does not consider fee comparisons to other mutual funds or other institutional or separate accounts to be relevant.
Annual Shareholder Report
34
The Board also received financial information about Federated, including information regarding the compensation and benefits Federated derived from its relationships with the Federated funds. Because the Adviser does not charge an investment advisory fee for its services, this information generally covered fees received by Federated's subsidiaries for providing other services to the Federated funds under separate contracts (e.g., for serving as the Federated funds' administrator). The information also detailed any indirect benefit Federated may derive from its receipt of research services from brokers who execute Federated fund trades. In addition, the Board considered the fact that, in order for a fund to be competitive in the marketplace, Federated and its affiliates frequently waive non-advisory fees and/or reimburse other expenses and have disclosed to fund investors and/or indicated to the Board their intention to do so in the future, where appropriate. Moreover, the Board receives regular reporting as to the institution or elimination of these voluntary waivers.The Board and the Senior Officer also reviewed information compiled by Federated comparing profitability information for Federated to other publicly held fund management companies. In this regard, the Senior Officer noted the limited availability of such information, but nonetheless concluded that Federated's profit margins did not appear to be excessive and the Board agreed.
The Senior Officer noted that, considering the totality of the circumstances, and all of the factors referenced within his Evaluation, he had concluded that, subject to comments and recommendations made within his Evaluation, his observations and the information accompanying the Evaluation supported a finding by the Board that the management fees for each of the funds are reasonable and that Federated appeared to provide appropriate administrative services to the Fund for the fees paid. The Board concluded that the nature, quality and scope of services provided the Fund by the Adviser and its affiliates were satisfactory.
The Board based its decision to approve the advisory contract on the totality of the circumstances and relevant factors and with a view to past and future long-term considerations. Not all of the factors and considerations identified above were necessarily relevant to the Fund, nor did the Board consider any one of them to be determinative. In particular, due to the unusual nature of the Fund as primarily an internal product with no advisory fee, the Board does not consider the assessment of whether economies of scale would be realized if the Fund were to grow to some sufficient size to be relevant. With respect to the factors that were relevant, the Board's decision to approve the contract reflects its determination that Federated's performance and actions provided a satisfactory basis to support the decision to continue the existing arrangement.
Annual Shareholder Report35
Voting Proxies on Fund Portfolio Securities
A description of the policies and procedures that the Fund uses to determine how to vote proxies, if any, relating to securities held in the Fund's portfolio, as well as a report on “Form N-PX” of how the Fund voted any such proxies during the most recent 12-month period ended June 30, are available, without charge and upon request, by calling 1-800-341-7400. These materials are also available at the SEC's website at www.sec.gov.
Quarterly Portfolio Schedule
The Fund files with the SEC a complete schedule of its portfolio holdings, as of the close of the first and third quarters of its fiscal year, on “Form N-Q.” These filings are available on the SEC's website at www.sec.gov and may be reviewed and copied at the SEC's Public Reference Room in Washington, DC. (Call 1-800-SEC-0330 for information on the operation of the Public Reference Room.)
Annual Shareholder Report36
Notes
37
Notes38
Mutual funds are not bank deposits or obligations, are not guaranteed by any bank and are not insured or guaranteed by the U.S. government, the Federal Deposit Insurance Corporation, the Federal Reserve Board or any other government agency. Investment in mutual funds involves investment risk, including the possible loss of principal.
This Report is authorized for distribution to prospective investors only when preceded or accompanied by the Fund's Prospectus, which contains facts concerning its objective and policies, management fees, expenses and other information.
Federated Mortgage Strategy Portfolio
Federated Investors Funds
4000 Ericsson Drive
Warrendale, PA 15086-7561
Contact us at FederatedInvestors.com
or call 1-800-341-7400.
Federated Securities Corp., Distributor
CUSIP 31421P407
38011 (2/12)
Federated is a registered trademark of Federated Investors, Inc.
2012 © Federated Investors, Inc.
Item 2. Code of Ethics
(a) As of the end of the period covered by this report, the registrant has adopted a code of ethics (the "Section 406 Standards for Investment Companies - Ethical Standards for Principal Executive and Financial Officers") that applies to the registrant's Principal Executive Officer and Principal Financial Officer; the registrant's Principal Financial Officer also serves as the Principal Accounting Officer.
(c) Not Applicable
(d) Not Applicable
(e) Not Applicable
(f)(3) The registrant hereby undertakes to provide any person, without charge, upon request, a copy of the code of ethics. To request a copy of the code of ethics, contact the registrant at 1-800-341-7400, and ask for a copy of the Section 406 Standards for Investment Companies - Ethical Standards for Principal Executive and Financial Officers.
Item 3. Audit Committee Financial Expert
The registrant's Board has determined that each of the following members of the Board's Audit Committee is an “audit committee financial expert,” and is "independent," for purposes of this Item: Nicholas P. Constantakis, Charles F. Mansfield, Jr., Thomas M. O'Neill and John S. Walsh.
Item 4. Principal Accountant Fees and Services
(a) Audit Fees billed to the registrant for the two most recent fiscal years:
Fiscal year ended 2011 - $97,800
Fiscal year ended 2010 - $94,000
(b) Audit-Related Fees billed to the registrant for the two most recent fiscal years:
Fiscal year ended 2011 - $0
Fiscal year ended 2010 - $97
Travel to Audit Committee Meetings.
Amount requiring approval of the registrant’s audit committee pursuant to paragraph (c)(7)(ii) of Rule 2-01 of Regulation S-X, $0 and $0 respectively.
(c) Tax Fees billed to the registrant for the two most recent fiscal years:
Fiscal year ended 2011 - $0
Fiscal year ended 2010 - $0
Amount requiring approval of the registrant’s audit committee pursuant to paragraph (c)(7)(ii) of Rule 2-01 of Regulation S-X, $4,607 and $0 respectively. Fiscal year ended 2011- Tax preparation fees for fiscal year end 2010.
(d) All Other Fees billed to the registrant for the two most recent fiscal years:
Fiscal year ended 2011 - $0
Fiscal year ended 2010 - $0
Amount requiring approval of the registrant’s audit committee pursuant to paragraph (c)(7)(ii) of Rule 2-01 of Regulation S-X, $0 and $0 respectively.
(e)(1) Audit Committee Policies regarding Pre-approval of Services.
The Audit Committee is required to pre-approve audit and non-audit services performed by the independent auditor in order to assure that the provision of such services do not impair the auditor’s independence. Unless a type of service to be provided by the independent auditor has received general pre-approval, it will require specific pre-approval by the Audit Committee. Any proposed services exceeding pre-approved cost levels will require specific pre-approval by the Audit Committee.
Certain services have the general pre-approval of the Audit Committee. The term of the general pre-approval is 12 months from the date of pre-approval, unless the Audit Committee specifically provides for a different period. The Audit Committee will annually review the services that may be provided by the independent auditor without obtaining specific pre-approval from the Audit Committee and may grant general pre-approval for such services. The Audit Committee will revise the list of general pre-approved services from time to time, based on subsequent determinations. The Audit Committee will not delegate its responsibilities to pre-approve services performed by the independent auditor to management.
The Audit Committee has delegated pre-approval authority to its Chairman. The Chairman will report any pre-approval decisions to the Audit Committee at its next scheduled meeting. The Committee will designate another member with such pre-approval authority when the Chairman is unavailable.
AUDIT SERVICES
The annual Audit services engagement terms and fees will be subject to the specific pre-approval of the Audit Committee. The Audit Committee must approve any changes in terms, conditions and fees resulting from changes in audit scope, registered investment company (RIC) structure or other matters.
In addition to the annual Audit services engagement specifically approved by the Audit Committee, the Audit Committee may grant general pre-approval for other Audit Services, which are those services that only the independent auditor reasonably can provide. The Audit Committee has pre-approved certain Audit services, all other Audit services must be specifically pre-approved by the Audit Committee.
AUDIT-RELATED SERVICES
Audit-related services are assurance and related services that are reasonably related to the performance of the audit or review of the Company’s financial statements or that are traditionally performed by the independent auditor. The Audit Committee believes that the provision of Audit-related services does not impair the independence of the auditor, and has pre-approved certain Audit-related services, all other Audit-related services must be specifically pre-approved by the Audit Committee.
TAX SERVICES
The Audit Committee believes that the independent auditor can provide Tax services to the Company such as tax compliance, tax planning and tax advice without impairing the auditor’s independence. However, the Audit Committee will not permit the retention of the independent auditor in connection with a transaction initially recommended by the independent auditor, the purpose of which may be tax avoidance and the tax treatment of which may not be supported in the Internal Revenue Code and related regulations. The Audit Committee has pre-approved certain Tax services, all Tax services involving large and complex transactions must be specifically pre-approved by the Audit Committee.
ALL OTHER SERVICES
With respect to the provision of services other than audit, review or attest services the pre-approval requirement is waived if:
(1) The aggregate amount of all such services provided constitutes no more than five percent of the total amount of revenues paid by the registrant, the registrant’s adviser (not including any sub-adviser whose role is primarily portfolio management and is subcontracted with or overseen by another investment adviser), and any entity controlling, controlled by, or under common control with the investment adviser that provides ongoing services to the registrant to its accountant during the fiscal year in which the services are provided;
(2) Such services were not recognized by the registrant, the registrant’s adviser (not including any sub-adviser whose role is primarily portfolio management and is subcontracted with or overseen by another investment adviser), and any entity controlling, controlled by, or under common control with the investment adviser that provides ongoing services to the registrant at the time of the engagement to be non-audit services; and
(3) Such services are promptly brought to the attention of the Audit Committee of the issuer and approved prior to the completion of the audit by the Audit Committee or by one or more members of the Audit Committee who are members of the board of directors to whom authority to grant such approvals has been delegated by the Audit Committee.
The Audit Committee may grant general pre-approval to those permissible non-audit services classified as All Other services that it believes are routine and recurring services, and would not impair the independence of the auditor.
The SEC’s rules and relevant guidance should be consulted to determine the precise definitions of prohibited non-audit services and the applicability of exceptions to certain of the prohibitions.
PRE-APPROVAL FEE LEVELS
Pre-approval fee levels for all services to be provided by the independent auditor will be established annually by the Audit Committee. Any proposed services exceeding these levels will require specific pre-approval by the Audit Committee.
PROCEDURES
Requests or applications to provide services that require specific approval by the Audit Committee will be submitted to the Audit Committee by both the independent auditor and the Principal Accounting Officer and/or Internal Auditor, and must include a joint statement as to whether, in their view, the request or application is consistent with the SEC’s rules on auditor independence.
(e)(2) Percentage of services identified in items 4(b) through 4(d) that were approved by the registrants audit committee pursuant to paragraph (c)(7)(i)(C) of Rule 2-01 of Regulation S-X:
4(b)
Fiscal year ended 2011 – 0%
Fiscal year ended 2010 - 0%
Percentage of services provided to the registrants investment adviser and any entity controlling, controlled by, or under common control with the investment adviser that provides ongoing services to the registrant that were approved by the registrants audit committee pursuant to paragraph (c)(7)(i)(C) of Rule 2-01 of Regulation S-X, 0% and 0% respectively.
4(c)
Fiscal year ended 2011 – 0%
Fiscal year ended 2010 – 0%
Percentage of services provided to the registrants investment adviser and any entity controlling, controlled by, or under common control with the investment adviser that provides ongoing services to the registrant that were approved by the registrants audit committee pursuant to paragraph (c)(7)(i)(C) of Rule 2-01 of Regulation S-X, 0% and 0% respectively.
4(d)
Fiscal year ended 2011 – 0%
Fiscal year ended 2010 – 0%
Percentage of services provided to the registrants investment adviser and any entity controlling, controlled by, or under common control with the investment adviser that provides ongoing services to the registrant that were approved by the registrants audit committee pursuant to paragraph (c)(7)(i)(C) of Rule 2-01 of Regulation S-X, 0% and 0% respectively.
(f) NA
(g) Non-Audit Fees billed to the registrant, the registrant’s investment adviser, and certain entities controlling, controlled by or under common control with the investment adviser:
Fiscal year ended 2011 - $357,347
Fiscal year ended 2010 - $388,871
(h) The registrant’s Audit Committee has considered that the provision of non-audit services that were rendered to the registrant’s adviser (not including any sub-adviser whose role is primarily portfolio management and is subcontracted with or overseen by another investment adviser), and any entity controlling, controlled by, or under common control with the investment adviser that provides ongoing services to the registrant that were not pre-approved pursuant to paragraph (c)(7)(ii) of Rule 2-01 of Regulation S-X is compatible with maintaining the principal accountant’s independence.
Item 5. Audit Committee of Listed Registrants
Not Applicable
Item 6. Schedule of Investments
(a) The registrant’s Schedule of Investments is included as part of the Report to Stockholders filed under Item 1 of this form.
(b) Not Applicable; Fund had no divestments during the reporting period covered since the previous Form N-CSR filing.
Item 7. Disclosure of Proxy Voting Policies and Procedures for Closed-End Management Investment Companies
Not Applicable
Item 8. Portfolio Managers of Closed-End Management Investment Companies
Not Applicable
Item 9. Purchases of Equity Securities by Closed-End Management Investment Company and Affiliated Purchasers
Not Applicable
Item 10. Submission of Matters to a Vote of Security Holders
Not Applicable
Item 11. Controls and Procedures
(a) The registrant’s President and Treasurer have concluded that the
registrant’s disclosure controls and procedures (as defined in rule 30a-3(c) under the Act) are effective in design and operation and are sufficient to form the basis of the certifications required by Rule 30a-(2) under the Act, based on their evaluation of these disclosure controls and procedures within 90 days of the filing date of this report on Form N-CSR.
(b) There were no changes in the registrant’s internal control over financial reporting (as defined in rule 30a-3(d) under the Act) during the second fiscal quarter of the period covered by this report that have materially affected, or are reasonably likely to materially affect, the registrant’s internal control over financial reporting.
Item 12. Exhibits
(a)(1) Code of Ethics- Not Applicable to this Annual Report.
(a)(2) Certifications of Principal Executive Officer and Principal Financial Officer.
(a)(3) Not Applicable.
(b) Certifications pursuant to 18 U.S.C. Section 1350.
SIGNATURES
Pursuant to the requirements of the Securities Exchange Act of 1934 and the Investment Company Act of 1940, the registrant has duly caused this report to be signed on its behalf by the undersigned, thereunto duly authorized.
Registrant Federated Managed Pool Series
By /S/ Richard A. Novak
Richard A. Novak, Principal Financial Officer
Date February 27, 2012
Pursuant to the requirements of the Securities Exchange Act of 1934 and the Investment Company Act of 1940, this report has been signed below by the following persons on behalf of the registrant and in the capacities and on the dates indicated.
By /S/ J. Christopher Donahue
J. Christopher Donahue, Principal Executive Officer
Date February 27, 2012
By /S/ Richard A. Novak
Richard A. Novak, Principal Financial Officer
Date February 27, 2012