United States
Securities and Exchange Commission
Washington, D.C. 20549
Form N-CSR
Certified Shareholder Report of Registered Management Investment Companies
811-21822
(Investment Company Act File Number)
Federated Managed Pool Series
_______________________________________________________________
(Exact Name of Registrant as Specified in Charter)
Federated Investors Funds
4000 Ericsson Drive
Warrendale, Pennsylvania 15086-7561
(Address of Principal Executive Offices)
(412) 288-1900
(Registrant's Telephone Number)
Peter J. Germain, Esquire
Federated Investors Tower
1001 Liberty Avenue
Pittsburgh, Pennsylvania 15222-3779
(Name and Address of Agent for Service)
(Notices should be sent to the Agent for Service)
Date of Fiscal Year End: 12/31/17
Date of Reporting Period: 12/31/17
| Item 1. | Reports to Stockholders |

Annual Shareholder Report
December 31, 2017
Federated Corporate Bond Strategy Portfolio
A Portfolio of Federated Managed Pool Series
Not FDIC Insured ■ May Lose Value ■ No Bank Guarantee
CONTENTS
| 1 |
| 4 |
| 5 |
| 15 |
| 16 |
| 17 |
| 18 |
| 19 |
| 24 |
| 25 |
| 26 |
| 26 |
| 30 |
| 32 |
| 32 |
Management's Discussion of Fund Performance (Unaudited)
The total return of the Federated Corporate Bond Strategy Portfolio (the “Fund”), based on net asset value for the 12-month reporting period ended December 31, 2017 was 8.01%. The total return of the Bloomberg Barclays U.S. Credit Index (BBUSC),1 the Fund's broad-based securities market index, was 6.18%, and the total return of the Baa component of the Bloomberg Barclays U.S. Credit Index (BBUSC-Baa),2 the benchmark against which the Fund is managed, was 7.45%, for the same period. The Fund's total return for the most recently completed fiscal year reflected actual cash flows, transaction costs and other expenses, which were not reflected in the total return of the indexes.
During the reporting period, the most significant factors affecting the Fund's performance relative to the BBUSC-Baa were: (1) individual security selection; (2) selection of securities with different maturities (referred to as “yield curve” strategy); (3) the allocation of the portfolio among securities of similar types of issuers (referred to as “sectors”); and (4) duration,3 which is the sensitivity of the change in price of the portfolio to changes in interest rates.
Market Overview
In 2017, three federal funds rate hikes by the U.S. Federal Reserve (Fed) were the primary drivers of Treasury rates. Interest rates for maturities of one month to seven years all increased in the reporting period, while interest rates for the 10- and 30-year maturities decreased compared to the same 2016 period. The largest yield increases occurred in the front-end of the yield curve. Specifically, interest rates for maturities of one month to two years increased by at least 69 basis points, while the yield on the 10-year maturity declined slightly, and the yield on the 30-year maturity declined by 32 basis points. As a result, the Treasury curve experienced a bear flattening in 2017, which is typical during a period of Fed rate hikes. The flattening of the yield curve also led to the outperformance by longer maturity Treasury and corporate bonds. The credit-sensitive fixed-income markets such as high yield,4 investment-grade5 corporates and commercial mortgage-backed securities (CMBS) all outperformed the Treasury market on a total return and duration-adjusted basis. In addition, lower-quality credit outperformed higher-quality credit.
The flattening trend of the yield curve was fairly consistent throughout the reporting period as the Fed raised the federal funds target rate in March, June and December, putting upward pressure on the front-end of the yield curve. However, the yield on the 10-year Treasury peaked in March at 2.63%, declined to 2.04% in September, and then closed the year almost unchanged at 2.41%. Increased geo-political risk with North Korea, low domestic and global inflation, hurricanes in the U.S. and accommodative monetary policies by other developed market central banks all contributed to the downward pressure on longer-term rates. In addition to raising rates in 2017, the Fed announced plans in the third quarter to reduce the size of its Treasury and agency mortgage holdings on its balance sheet and implemented the balance sheet reduction plan in the fourth quarter. During the fourth quarter, President Trump also announced his selection of Jerome Powell to replace Janet Yellen as the next Federal Reserve Chairman. There was little market reaction to this announcement, reflecting the market's expectation that Fed policy will not change materially. Given the backdrop of stable economic growth, low inflation, consistent U.S. monetary policy and global investor demand for yield, the credit-sensitive fixed-income markets, such as investment-grade corporates, high yield and CMBS, all experienced strong investor demand in 2017.
The positive 2017 total return on the Baa Component of the Bloomberg Barclays U.S. Credit Index was due to tighter credit spreads, which more than offset the increase in Treasury rates in the front-end of the curve. The Option Adjusted Spread (OAS) for the BBUSC-Baa index tightened by 36 basis points to 124 basis points. The flattening of the yield and credit curves in 2017 led to the outperformance of longer maturity sectors and credits on a total and excess return basis.
Security selection
In total, individual security selection varied widely in terms of relative contribution to the Fund, but combined to be the largest positive contributor to the performance of the Fund for the reporting period. Some of the best performing corporate issuers for the Fund for the reporting period were from companies such as Kinder Morgan, Mead Johnson, Becton Dickinson & Co. and Reynolds American, Inc. Some of the worst performing issuers were Teva Pharmaceuticals, Under Armour and Sherwin Williams.
Yield Curve
During the reporting period, the yield curve strategy was a positive contributor to the Fund's performance relative to the BBUSC-Baa. The Fund maintained a flattening bias for the majority of the reporting period, which was a positive contributor to performance.
Annual Shareholder Report
Sector allocation
Sector allocation was a positive contributor to the Fund's outperformance for the reporting period. Overweights in the Metals & Mining and Refining sectors and underweights in the Pharmaceutical and Wireline sectors were positive contributors to Fund performance. These positives more than offset the negative contribution from an underweight to Sovereign Credits.
Duration
The Fund's duration, which was slightly less than the duration of the BBUSC-Baa benchmark, had no material impact on the Fund's performance for the reporting period. During the reporting period, the Fund used Treasury futures contracts6 to help manage the duration of the Fund, but these positions had no material impact on the Fund's performance for the reporting period.
| 1 | Please see the footnotes to the line graphs below for definitions of, and further information about the BBUSC. |
| 2 | Please see the footnotes to the line graphs below for definitions of, and further information about the BBUSC-Baa. |
| 3 | Duration is a measure of a security's price sensitivity to changes in interest rates. Securities with longer durations are more sensitive to changes in interest rates than securities of shorter durations. |
| 4 | High-yield, lower-rated securities generally entail greater market, credit and liquidity risks than investment-grade securities and may include higher volatility and a higher risk of default. |
| 5 | Investment-grade securities are securities that are rated at least “BBB- (minus)” or unrated securities of a comparable quality. Noninvestment-grade securities are securities that are not rated at least “BBB- (minus)” or unrated securities of a comparable quality. Credit ratings are an indication of the risk that a security will default. They do not protect a security from credit risk. Lower-rated bonds typically offer higher yields to help compensate investors for the increased risk associated with them. Among these risks are lower credit-worthiness, greater price volatility, more risk to principal and income than with higher-rated securities and increased possibilities of default. |
| 6 | The Fund's use of derivative instruments involves risks different from, or possibly greater than, the risks associated with investing directly in securities and other traditional instruments. |
Annual Shareholder Report
FUND PERFORMANCE AND GROWTH OF A $10,000 INVESTMENT
The graph below illustrates the hypothetical investment of $10,0001 in the Federated Corporate Bond Strategy Portfolio from December 31, 2007 to December 31, 2017, compared to the Bloomberg Barclays U.S. Credit Index (BBUSC)2 and the Baa component of the Bloomberg Barclays U.S. Credit Index (BBUSC-Baa).3 The Average Annual Total Return table below shows returns averaged over the stated periods.
Growth of a $10,000 Investment
Growth of $10,000 as of December 31, 2017

| Federated Corporate Bond Strategy Portfolio | | NA | BBUSC | BBUSC-Baa |
| F | NA | I | I |
| 12/31/2007 | 10,000 | | 10,000 | 10,000 |
| 12/31/2008 | 9,125 | | 9,692 | 9,133 |
| 12/31/2009 | 11,482 | | 11,247 | 11,617 |
| 12/31/2010 | 12,580 | | 12,200 | 12,783 |
| 12/31/2011 | 13,475 | | 13,219 | 13,995 |
| 12/31/2012 | 15,097 | | 14,457 | 15,579 |
| 12/31/2013 | 14,942 | | 14,166 | 15,258 |
| 12/31/2014 | 16,149 | | 15,232 | 16,530 |
| 12/31/2015 | 15,713 | | 15,115 | 16,079 |
| 12/31/2016 | 17,066 | | 15,966 | 17,347 |
| 12/31/2017 | 18,433 | | 16,952 | 18,638 |
41 graphic description end -->
Average Annual Total Returns for the Period Ended 12/31/2017
| | 1 Year | 5 Years | 10 Years |
| Fund | 8.01% | 4.07% | 6.31% |
| BBUSC | 6.18% | 3.24% | 5.42% |
| BBUSC-Baa | 7.45% | 3.65% | 6.42% |
Performance data quoted represents past performance which is no guarantee of future results. Investment return and principal value will fluctuate so that an investor's shares, when redeemed, may be worth more or less than their original cost. Mutual fund performance changes over time and current performance may be lower or higher than what is stated. For current to the most recent month-end performance and after-tax returns, call 1-800-341-7400. Returns shown do not reflect the deduction of taxes that a shareholder would pay on Fund distributions or the redemption of Fund shares. Mutual funds are not obligations of or guaranteed by any bank and are not federally insured.
| 1 | The Fund's performance assumes the reinvestment of all dividends and distributions. The BBUSC and BBUSC-Baa have been adjusted to reflect reinvestment of dividends on securities in an index. |
| 2 | The BBUSC is composed of all publicly issued, fixed-rate, nonconvertible, investment-grade corporate debt and a non-corporate component that includes foreign agencies, sovereigns, supranationals and local authorities. Issues are rated at least “Baa” by Moody's Investors Service or “BBB” by Standard & Poor's, if unrated by Moody's. The index is not adjusted to reflect sales loads, expenses or other fees that the Securities and Exchange Commission (SEC) requires to be reflected in the Fund's performance. The index is unmanaged and, unlike the Fund, is not affected by cash flows. It is not possible to invest directly in an index. |
| 3 | The BBUSC-Baa is a component of the BBUSC comprised of corporate bonds or securities represented by the following sectors: industrial, utility and finance, including both U.S. and non-U.S. corporations and non-corporate bonds or securities represented by the following sectors: sovereign, supranational, foreign agencies and foreign local governments. The index is not adjusted to reflect sales loads, expenses or other fees that the SEC requires to be reflected in the Fund's performance. The index is unmanaged and, unlike the Fund, is not affected by cash flows. It is not possible to invest directly in an index. |
Annual Shareholder Report
Portfolio of Investments Summary Table (unaudited)
At December 31, 2017, the Fund's portfolio composition1 was as follows:
| Security Type | Percentage of
Total Net Assets |
| Corporate Debt Securities | 95.5% |
| Foreign Government Debt Securities | 2.3% |
| Derivative Contracts2,3 | 0.0% |
| Cash Equivalents4 | 1.5% |
| Other Assets and Liabilities—Net5 | 0.7% |
| TOTAL | 100.0% |
| 1 | See the Fund's Prospectus and Statement of Additional Information for a description of these security types. |
| 2 | Based upon net unrealized appreciation (depreciation) or value of the derivative contracts as applicable. Derivative contracts may consist of futures, forwards, options and swaps. The impact of a derivative contract on the Fund's performance may be larger than its unrealized appreciation (depreciation) or value may indicate. In many cases, the notional value or amount of a derivative contract may provide a better indication of the contract's significance to the portfolio. More complete information regarding the Fund's direct investments in derivative contracts, including unrealized appreciation (depreciation), value and notional values or amounts of such contracts, can be found in the table at the end of the Portfolio of Investments included in this Report. |
| 3 | Represents less than 0.1%. |
| 4 | Cash Equivalents include any investments in money market mutual funds and/or overnight repurchase agreements. |
| 5 | Assets, other than investments in securities and derivative contracts, less liabilities. See Statement of Assets and Liabilities. |
Annual Shareholder Report
Portfolio of Investments
December 31, 2017
Principal
Amount
or Shares | | | Value |
| | | CORPORATE BONDS—95.5% | |
| | | Basic Industry - Chemicals—0.7% | |
| $90,000 | | Albemarle Corp., 4.15%, 12/1/2024 | $95,482 |
| 90,000 | | Albemarle Corp., Sr. Unsecd. Note, 5.45%, 12/1/2044 | 106,507 |
| 85,000 | | Incitec Pivot Finance LLC, Company Guarantee, Series 144A, 6.00%, 12/10/2019 | 90,071 |
| 300,000 | | RPM International, Inc., Sr. Unsecd. Note, 5.25%, 6/1/2045 | 346,602 |
| | | TOTAL | 638,662 |
| | | Basic Industry - Metals & Mining—2.3% | |
| 235,000 | | Anglogold Ashanti Holdings PLC, Sr. Note, 6.50%, 4/15/2040 | 248,406 |
| 40,000 | | Carpenter Technology Corp., Sr. Unsecd. Note, 4.45%, 3/1/2023 | 40,820 |
| 150,000 | | Carpenter Technology Corp., Sr. Unsecd. Note, 5.20%, 7/15/2021 | 156,567 |
| 130,000 | | Gerdau S.A., Company Guarantee, Series 144A, 5.75%, 1/30/2021 | 139,100 |
| 250,000 | | Gold Fields Orogen Holding BVI Ltd., Company Guarantee, Series 144A, 4.875%, 10/7/2020 | 255,625 |
| 280,000 | | Newcrest Finance Property Ltd., Sr. Unsecd. Note, Series 144A, 4.20%, 10/1/2022 | 291,897 |
| 225,000 | | Reliance Steel & Aluminum Co., Sr. Unsecd. Note, 4.50%, 4/15/2023 | 237,405 |
| 250,000 | | Southern Copper Corp., Sr. Unsecd. Note, 6.75%, 4/16/2040 | 325,813 |
| 170,000 | | Worthington Industries, Inc., Sr. Unsecd. Note, 4.30%, 8/1/2032 | 171,088 |
| 105,000 | | Worthington Industries, Inc., Sr. Unsecd. Note, 4.55%, 4/15/2026 | 108,957 |
| | | TOTAL | 1,975,678 |
| | | Basic Industry - Paper—1.2% | |
| 150,000 | | International Paper Co., Sr. Unsecd. Note, 3.00%, 2/15/2027 | 145,677 |
| 300,000 | | International Paper Co., Sr. Unsecd. Note, 4.40%, 8/15/2047 | 314,504 |
| 150,000 | | Weyerhaeuser Co., Sr. Unsecd. Note, 3.25%, 3/15/2023 | 152,929 |
| 140,000 | | Weyerhaeuser Co., Sr. Unsecd. Note, 4.70%, 3/15/2021 | 148,769 |
| 100,000 | | Weyerhaeuser Co., Sr. Unsecd. Note, 7.375%, 10/1/2019 | 108,404 |
| 100,000 | | Weyerhaeuser Co., Sr. Unsecd. Note, 7.375%, 3/15/2032 | 138,413 |
| | | TOTAL | 1,008,696 |
| | | Capital Goods - Aerospace & Defense—3.4% | |
| 150,000 | | Arconic, Inc., Sr. Unsecd. Note, 5.40%, 4/15/2021 | 159,712 |
| 230,000 | | BAE Systems Holdings, Inc., Sr. Unsecd. Note, Series 144A, 3.85%, 12/15/2025 | 238,861 |
| 360,000 | | Embraer Netherlands BV, Sr. Unsecd. Note, 5.05%, 6/15/2025 | 383,400 |
| 100,000 | | Embraer SA, Sr. Unsecd. Note, 5.15%, 6/15/2022 | 107,250 |
| 170,000 | | Hexcel Corp., Sr. Unsecd. Note, 3.95%, 2/15/2027 | 173,583 |
| 240,000 | | Huntington Ingalls Industries, Inc., Sr. Unsecd. Note, Series 144A, 3.483%, 12/1/2027 | 239,700 |
| 360,000 | | Lockheed Martin Corp., Sr. Unsecd. Note, 3.55%, 1/15/2026 | 374,357 |
| 740,000 | | Northrop Grumman Corp., Sr. Unsecd. Note, 3.25%, 1/15/2028 | 742,427 |
| 136,000 | 1 | Textron Financial Corp., Jr. Sub. Note, Series 144A, 3.151%, (3-month USLIBOR +1.735%), 2/15/2042 | 120,360 |
| 300,000 | | Textron, Inc., Sr. Unsecd. Note, 3.875%, 3/1/2025 | 311,382 |
| 50,000 | | Textron, Inc., Sr. Unsecd. Note, 4.30%, 3/1/2024 | 52,934 |
| | | TOTAL | 2,903,966 |
| | | Capital Goods - Building Materials—0.6% | |
| 125,000 | | Allegion US Holdings Co., Inc., Sr. Unsecd. Note, 3.20%, 10/1/2024 | 123,844 |
| 220,000 | | Allegion US Holdings Co., Inc., Sr. Unsecd. Note, 3.55%, 10/1/2027 | 218,088 |
| 170,000 | | Masco Corp., Sr. Unsecd. Note, 4.50%, 5/15/2047 | 173,521 |
| 4,000 | | Masco Corp., Sr. Unsecd. Note, 7.125%, 3/15/2020 | 4,382 |
| | | TOTAL | 519,835 |
| | | Capital Goods - Construction Machinery—0.4% | |
| 120,000 | | AGCO Corp., Sr. Unsecd. Note, 5.875%, 12/1/2021 | 129,638 |
Annual Shareholder Report
Principal
Amount
or Shares | | | Value |
| | | CORPORATE BONDS—continued | |
| | | Capital Goods - Construction Machinery—continued | |
| $180,000 | | CNH Industrial NV, Sr. Unsecd. Note, Series MTN, 3.85%, 11/15/2027 | $179,808 |
| | | TOTAL | 309,446 |
| | | Capital Goods - Diversified Manufacturing—0.9% | |
| 140,000 | | Lennox International, Inc., Sr. Unsecd. Note, 3.00%, 11/15/2023 | 138,403 |
| 60,000 | | Roper Technologies, Inc., Sr. Unsecd. Note, 3.85%, 12/15/2025 | 62,032 |
| 275,000 | | Valmont Industries, Inc., 5.25%, 10/1/2054 | 285,449 |
| 67,000 | | Valmont Industries, Inc., Sr. Unsecd. Note, 6.625%, 4/20/2020 | 72,930 |
| 240,000 | | Wabtec Corp., Sr. Unsecd. Note, 3.45%, 11/15/2026 | 235,088 |
| | | TOTAL | 793,902 |
| | | Capital Goods - Packaging—0.9% | |
| 180,000 | | Packaging Corp. of America, Sr. Unsecd. Note, 3.65%, 9/15/2024 | 184,791 |
| 65,000 | | Packaging Corp. of America, Sr. Unsecd. Note, 3.90%, 6/15/2022 | 67,761 |
| 80,000 | | Packaging Corp. of America, Sr. Unsecd. Note, 4.50%, 11/1/2023 | 86,156 |
| 220,000 | | Sonoco Products Co., Sr. Unsecd. Note, 5.75%, 11/1/2040 | 265,072 |
| 120,000 | | WestRock Co., Sr. Unsecd. Note, 4.00%, 3/1/2023 | 124,472 |
| 40,000 | | WestRock Co., Sr. Unsecd. Note, 4.45%, 3/1/2019 | 40,899 |
| | | TOTAL | 769,151 |
| | | Communications - Cable & Satellite—2.1% | |
| 190,000 | | CCO Safari II LLC, 6.484%, 10/23/2045 | 222,121 |
| 380,000 | | Charter Communications Operating LLC, 5.375%, 5/1/2047 | 390,752 |
| 300,000 | | Charter Communications, Inc., 4.20%, 3/15/2028 | 297,563 |
| 165,000 | | Cox Communications, Inc., Sr. Unsecd. Note, Series 144A, 3.35%, 9/15/2026 | 161,502 |
| 300,000 | | Time Warner Cable, Inc., Company Guarantee, 5.00%, 2/1/2020 | 313,220 |
| 300,000 | | Time Warner Cable, Inc., Company Guarantee, 5.50%, 9/1/2041 | 313,492 |
| 50,000 | | Time Warner Cable, Inc., Company Guarantee, 8.75%, 2/14/2019 | 53,322 |
| | | TOTAL | 1,751,972 |
| | | Communications - Media & Entertainment—5.1% | |
| 100,000 | | 21st Century Fox America, Inc., 6.75%, 1/9/2038 | 136,833 |
| 200,000 | | 21st Century Fox America, Inc., Sr. Unsecd. Note, 3.70%, 10/15/2025 | 209,006 |
| 300,000 | | 21st Century Fox America, Inc., Sr. Unsecd. Note, 3.70%, 9/15/2024 | 312,402 |
| 450,000 | | British Sky Broadcasting Group PLC, Series 144A, 3.75%, 9/16/2024 | 469,923 |
| 200,000 | | CBS Corp., 3.70%, 8/15/2024 | 206,044 |
| 200,000 | | CBS Corp., 4.90%, 8/15/2044 | 210,804 |
| 190,000 | | CBS Corp., Sr. Unsecd. Note, Series 144A, 3.70%, 6/1/2028 | 187,716 |
| 400,000 | | Discovery Communications LLC, Sr. Unsecd. Note, 3.95%, 3/20/2028 | 398,570 |
| 370,000 | | Discovery Communications LLC, Sr. Unsecd. Note, 4.90%, 3/11/2026 | 395,273 |
| 250,000 | | Grupo Televisa S.A., 6.625%, 3/18/2025 | 296,460 |
| 250,000 | | Grupo Televisa S.A., Sr. Unsecd. Note, 5.00%, 5/13/2045 | 256,709 |
| 70,000 | | Interpublic Group of Cos., Inc., Sr. Unsecd. Note, 4.00%, 3/15/2022 | 72,412 |
| 305,000 | | Omnicom Group, Inc., Sr. Unsecd. Note, 3.625%, 5/1/2022 | 315,146 |
| 200,000 | | Omnicom Group, Inc., Sr. Unsecd. Note, 3.65%, 11/1/2024 | 205,490 |
| 100,000 | | S&P Global, Inc., Sr. Note, 4.00%, 6/15/2025 | 105,182 |
| 230,000 | | S&P Global, Inc., Sr. Note, 4.40%, 2/15/2026 | 249,562 |
| 280,000 | | WPP Finance 2010, Sr. Unsecd. Note, 5.125%, 9/7/2042 | 302,650 |
| | | TOTAL | 4,330,182 |
| | | Communications - Telecom Wireless—1.6% | |
| 100,000 | | American Tower Corp., Sr. Unsecd. Note, 4.40%, 2/15/2026 | 105,308 |
| 200,000 | | American Tower Corp., Sr. Unsecd. Note, 5.00%, 2/15/2024 | 219,321 |
| 400,000 | | Crown Castle International Corp., Sr. Unsecd. Note, 4.45%, 2/15/2026 | 420,550 |
Annual Shareholder Report
Principal
Amount
or Shares | | | Value |
| | | CORPORATE BONDS—continued | |
| | | Communications - Telecom Wireless—continued | |
| $300,000 | | TELUS Corp., Sr. Unsecd. Note, 2.80%, 2/16/2027 | $284,503 |
| 330,000 | | Telefonaktiebolaget LM Ericsson, Sr. Unsecd. Note, 4.125%, 5/15/2022 | 332,606 |
| | | TOTAL | 1,362,288 |
| | | Communications - Telecom Wirelines—9.9% | |
| 300,000 | | AT&T, Inc., Sr. Unsecd. Note, 3.90%, 8/14/2027 | 302,507 |
| 750,000 | | AT&T, Inc., Sr. Unsecd. Note, 4.25%, 3/1/2027 | 765,767 |
| 1,290,000 | | AT&T, Inc., Sr. Unsecd. Note, 4.80%, 6/15/2044 | 1,279,598 |
| 800,000 | | AT&T, Inc., Sr. Unsecd. Note, 5.30%, 8/14/2058 | 805,219 |
| 400,000 | | AT&T, Inc., Sr. Unsecd. Note, 5.45%, 3/1/2047 | 428,748 |
| 245,000 | | AT&T, Inc., Sr. Unsecd. Note, 6.375%, 3/1/2041 | 289,729 |
| 225,000 | | Telefonica Emisiones SAU, Company Guarantee, 5.462%, 2/16/2021 | 243,539 |
| 180,000 | | Telefonica Emisiones SAU, Sr. Unsecd. Note, 5.213%, 3/8/2047 | 204,902 |
| 40,000 | | Telefonica SA, Company Guarantee, 7.045%, 6/20/2036 | 53,784 |
| 750,000 | | Verizon Communications, Inc., Sr. Unsecd. Note, 4.125%, 3/16/2027 | 783,312 |
| 390,000 | | Verizon Communications, Inc., Sr. Unsecd. Note, 4.125%, 8/15/2046 | 361,419 |
| 300,000 | | Verizon Communications, Inc., Sr. Unsecd. Note, 4.15%, 3/15/2024 | 315,892 |
| 360,000 | | Verizon Communications, Inc., Sr. Unsecd. Note, 4.522%, 9/15/2048 | 355,606 |
| 534,000 | | Verizon Communications, Inc., Sr. Unsecd. Note, 5.012%, 4/15/2049 | 561,806 |
| 1,500,000 | | Verizon Communications, Inc., Sr. Unsecd. Note, 5.15%, 9/15/2023 | 1,670,791 |
| | | TOTAL | 8,422,619 |
| | | Consumer Cyclical - Automotive—2.0% | |
| 200,000 | | Ford Motor Co., Sr. Unsecd. Note, 4.75%, 1/15/2043 | 203,404 |
| 200,000 | | Ford Motor Credit Co. LLC, Sr. Unsecd. Note, 3.336%, 3/18/2021 | 203,262 |
| 470,000 | | Ford Motor Credit Co. LLC, Sr. Unsecd. Note, 4.25%, 9/20/2022 | 493,299 |
| 200,000 | | General Motors Co., Sr. Unsecd. Note, 4.00%, 4/1/2025 | 205,664 |
| 455,000 | | General Motors Co., Sr. Unsecd. Note, 5.20%, 4/1/2045 | 482,161 |
| 110,000 | | General Motors Co., Sr. Unsecd. Note, 6.75%, 4/1/2046 | 138,877 |
| | | TOTAL | 1,726,667 |
| | | Consumer Cyclical - Retailers—2.2% | |
| 100,000 | | Advance Auto Parts, Inc., 4.50%, 12/1/2023 | 105,252 |
| 80,000 | | Advance Auto Parts, Inc., Company Guarantee, 4.50%, 1/15/2022 | 83,900 |
| 130,000 | | AutoNation, Inc., Sr. Unsecd. Note, 4.50%, 10/1/2025 | 136,237 |
| 55,000 | | AutoZone, Inc., Sr. Unsecd. Note, 3.125%, 4/21/2026 | 53,653 |
| 50,000 | | CVS Health Corp., Sr. Unsecd. Note, 3.875%, 7/20/2025 | 51,563 |
| 520,000 | | CVS Health Corp., Sr. Unsecd. Note, 5.125%, 7/20/2045 | 597,758 |
| 70,000 | | Dollar General Corp., Sr. Unsecd. Note, 3.875%, 4/15/2027 | 73,122 |
| 310,000 | | Dollar General Corp., Sr. Unsecd. Note, 4.15%, 11/1/2025 | 328,606 |
| 335,000 | | O'Reilly Automotive, Inc., Company Guarantee, 4.875%, 1/14/2021 | 355,945 |
| 120,000 | | Under Armour, Inc., Sr. Unsecd. Note, 3.25%, 6/15/2026 | 105,226 |
| | | TOTAL | 1,891,262 |
| | | Consumer Non-Cyclical - Food/Beverage—4.7% | |
| 125,000 | | Bacardi Ltd., Sr. Unsecd. Note, Series 144A, 2.75%, 7/15/2026 | 120,305 |
| 290,000 | | Danone SA, Sr. Unsecd. Note, Series 144A, 2.947%, 11/2/2026 | 282,838 |
| 210,000 | | Flowers Foods, Inc., Sr. Unsecd. Note, 3.50%, 10/1/2026 | 206,283 |
| 200,000 | | Grupo Bimbo SAB de CV, Sr. Unsecd. Note, Series 144A, 3.875%, 6/27/2024 | 206,804 |
| 300,000 | | Grupo Bimbo SAB de CV, Sr. Unsecd. Note, Series 144A, 4.50%, 1/25/2022 | 316,975 |
| 150,000 | | Heineken NV, Sr. Unsecd. Note, Series 144A, 4.35%, 3/29/2047 | 165,534 |
| 250,000 | | Kerry Group Financial Services, Sr. Unsecd. Note, Series 144A, 3.20%, 4/9/2023 | 252,027 |
| 475,000 | | Kraft Heinz Foods Co., Sr. Unsecd. Note, 3.00%, 6/1/2026 | 457,800 |
Annual Shareholder Report
Principal
Amount
or Shares | | | Value |
| | | CORPORATE BONDS—continued | |
| | | Consumer Non-Cyclical - Food/Beverage—continued | |
| $330,000 | | Kraft Heinz Foods Co., Sr. Unsecd. Note, 4.375%, 6/1/2046 | $327,907 |
| 250,000 | | McCormick & Co., Inc., Sr. Unsecd. Note, 3.40%, 8/15/2027 | 253,705 |
| 250,000 | | Mead Johnson Nutrition Co., Sr. Unsecd. Note, 4.60%, 6/1/2044 | 279,141 |
| 280,000 | | Mondelez International Holdings Netherlands BV, Sr. Unsecd. Note, Series 144A, 2.00%, 10/28/2021 | 272,620 |
| 140,000 | | Smithfield Foods, Inc., Sr. Unsecd. Note, Series 144A, 2.65%, 10/3/2021 | 138,203 |
| 300,000 | | Smithfield Foods, Inc., Sr. Unsecd. Note, Series 144A, 4.25%, 2/1/2027 | 308,340 |
| 200,000 | | Tyson Foods, Inc., 3.95%, 8/15/2024 | 210,587 |
| 185,000 | | Tyson Foods, Inc., Sr. Unsecd. Note, 3.55%, 6/2/2027 | 189,748 |
| | | TOTAL | 3,988,817 |
| | | Consumer Non-Cyclical - Health Care—1.6% | |
| 120,000 | | Agilent Technologies, Inc., Sr. Unsecd. Note, 3.20%, 10/1/2022 | 121,130 |
| 50,000 | | Agilent Technologies, Inc., Sr. Unsecd. Note, 3.875%, 7/15/2023 | 51,840 |
| 55,000 | | Becton, Dickinson & Co., Sr. Unsecd. Note, 3.734%, 12/15/2024 | 56,402 |
| 300,000 | | Becton, Dickinson & Co., Sr. Unsecd. Note, 4.669%, 6/6/2047 | 325,845 |
| 260,000 | | Becton, Dickinson & Co., Sr. Unsecd. Note, 4.685%, 12/15/2044 | 285,173 |
| 40,000 | | Laboratory Corp. of America Holdings, Sr. Unsecd. Note, 3.75%, 8/23/2022 | 41,521 |
| 250,000 | | Thermo Fisher Scientific, Inc., Sr. Unsecd. Note, 2.95%, 9/19/2026 | 243,322 |
| 250,000 | | Thermo Fisher Scientific, Inc., Sr. Unsecd. Note, 4.10%, 8/15/2047 | 258,406 |
| | | TOTAL | 1,383,639 |
| | | Consumer Non-Cyclical - Pharmaceuticals—3.3% | |
| 400,000 | | Abbott Laboratories, Sr. Unsecd. Note, 3.75%, 11/30/2026 | 411,392 |
| 400,000 | | Abbott Laboratories, Sr. Unsecd. Note, 4.90%, 11/30/2046 | 460,042 |
| 100,000 | | Celgene Corp., Sr. Unsecd. Note, 3.875%, 8/15/2025 | 103,650 |
| 375,000 | | Celgene Corp., Sr. Unsecd. Note, 5.00%, 8/15/2045 | 426,760 |
| 190,000 | | Shire Acquisitions Investments Ireland DAC, Sr. Unsecd. Note, 2.40%, 9/23/2021 | 187,155 |
| 520,000 | | Shire Acquisitions Investments Ireland DAC, Sr. Unsecd. Note, 3.20%, 9/23/2026 | 509,249 |
| 600,000 | | Teva Pharmaceutical Finance III BV, Sr. Unsecd. Note, 3.15%, 10/1/2026 | 496,167 |
| 300,000 | | Teva Pharmaceutical Finance III BV, Sr. Unsecd. Note, 4.10%, 10/1/2046 | 229,116 |
| | | TOTAL | 2,823,531 |
| | | Consumer Non-Cyclical - Products—0.5% | |
| 400,000 | | Hasbro, Inc., Sr. Unsecd. Note, 5.10%, 5/15/2044 | 421,000 |
| | | Consumer Non-Cyclical - Supermarkets—0.5% | |
| 300,000 | | Kroger Co., Bond, 6.90%, 4/15/2038 | 388,729 |
| | | Consumer Non-Cyclical - Tobacco—1.2% | |
| 200,000 | | Bat Capital Corp., Sr. Unsecd. Note, Series 144A, 4.54%, 8/15/2047 | 211,255 |
| 300,000 | | Reynolds American, Inc., Sr. Unsecd. Note, 5.85%, 8/15/2045 | 375,722 |
| 300,000 | | Reynolds American, Inc., Sr. Unsecd. Note, 7.00%, 8/4/2041 | 406,997 |
| | | TOTAL | 993,974 |
| | | Energy - Independent—2.7% | |
| 400,000 | | Anadarko Petroleum Corp., Sr. Unsecd. Note, 3.45%, 7/15/2024 | 398,838 |
| 180,000 | | Anadarko Petroleum Corp., Sr. Unsecd. Note, 5.55%, 3/15/2026 | 202,238 |
| 590,000 | | Canadian Natural Resources Ltd., Sr. Unsecd. Note, 3.80%, 4/15/2024 | 608,299 |
| 140,000 | | Cimarex Energy Co., Sr. Unsecd. Note, 3.90%, 5/15/2027 | 143,386 |
| 400,000 | | EOG Resources, Inc., Sr. Unsecd. Note, 4.15%, 1/15/2026 | 426,325 |
| 500,000 | | Marathon Oil Corp., Sr. Unsecd. Note, 3.85%, 6/1/2025 | 509,665 |
| | | TOTAL | 2,288,751 |
| | | Energy - Integrated—2.7% | |
| 245,000 | | Husky Energy, Inc., Sr. Unsecd. Note, 3.95%, 4/15/2022 | 253,689 |
| 100,000 | | Petro-Canada, Bond, 5.35%, 7/15/2033 | 118,269 |
Annual Shareholder Report
Principal
Amount
or Shares | | | Value |
| | | CORPORATE BONDS—continued | |
| | | Energy - Integrated—continued | |
| $550,000 | | Petroleos Mexicanos, 6.50%, 6/2/2041 | $567,050 |
| 1,140,000 | | Petroleos Mexicanos, Company Guarantee, 6.00%, 3/5/2020 | 1,210,965 |
| 130,000 | | Petroleos Mexicanos, Sr. Unsecd. Note, Series 144A, 6.50%, 3/13/2027 | 142,252 |
| | | TOTAL | 2,292,225 |
| | | Energy - Midstream—6.0% | |
| 80,000 | | Andeavor Logistics LP, Sr. Unsecd. Note, 4.25%, 12/1/2027 | 80,822 |
| 100,000 | | Columbia Pipeline Group, Inc., Sr. Unsecd. Note, 4.50%, 6/1/2025 | 106,613 |
| 100,000 | | Columbia Pipeline Group, Inc., Sr. Unsecd. Note, 5.80%, 6/1/2045 | 125,182 |
| 600,000 | | Energy Transfer Partners LP, Sr. Unsecd. Note, 4.90%, 2/1/2024 | 635,188 |
| 250,000 | | Energy Transfer Partners LP, Sr. Unsecd. Note, 5.30%, 4/15/2047 | 249,146 |
| 250,000 | | Energy Transfer Partners LP, Sr. Unsecd. Note, 6.125%, 12/15/2045 | 272,207 |
| 250,000 | | Enterprise Products Operating LLC, 3.90%, 2/15/2024 | 260,791 |
| 500,000 | | Enterprise Products Operating LLC, Sr. Unsecd. Note, 4.85%, 3/15/2044 | 549,668 |
| 40,000 | | Florida Gas Transmission Co. LLC, Sr. Unsecd. Note, Series 144A, 5.45%, 7/15/2020 | 42,685 |
| 495,000 | | Kinder Morgan Energy Partners LP, Sr. Unsecd. Note, 6.375%, 3/1/2041 | 576,810 |
| 395,000 | | MPLX LP, Sr. Unsecd. Note, 4.125%, 3/1/2027 | 405,216 |
| 500,000 | | ONEOK, Inc., Sr. Unsecd. Note, 4.95%, 7/13/2047 | 521,772 |
| 290,000 | | TC Pipelines, LP, Sr. Unsecd. Note, 3.90%, 5/25/2027 | 291,924 |
| 200,000 | | Texas Eastern Transmission LP, Sr. Unsecd. Note, Series 144A, 2.80%, 10/15/2022 | 198,915 |
| 790,000 | | Williams Partners LP, Sr. Unsecd. Note, 3.90%, 1/15/2025 | 806,169 |
| | | TOTAL | 5,123,108 |
| | | Energy - Oil Field Services—0.7% | |
| 35,000 | | Nabors Industries, Inc., Company Guarantee, 5.00%, 9/15/2020 | 35,088 |
| 100,000 | | Nabors Industries, Inc., Sr. Unsecd. Note, 4.625%, 9/15/2021 | 95,750 |
| 200,000 | | Nabors Industries, Inc., Sr. Unsecd. Note, 5.10%, 9/15/2023 | 188,000 |
| 11,000 | | Noble Holding International Ltd., Company Guarantee, 4.90%, 8/1/2020 | 10,615 |
| 150,000 | | Weatherford International Ltd., 7.00%, 3/15/2038 | 126,750 |
| 165,000 | | Weatherford International Ltd., Sr. Unsecd. Note, 5.95%, 4/15/2042 | 129,525 |
| | | TOTAL | 585,728 |
| | | Energy - Refining—1.0% | |
| 300,000 | | HollyFrontier Corp., Sr. Unsecd. Note, 5.875%, 4/1/2026 | 334,251 |
| 150,000 | | Marathon Petroleum Corp., Sr. Unsecd. Note, 6.50%, 3/1/2041 | 188,483 |
| 190,000 | | Phillips 66, Sr. Unsecd. Note, 4.875%, 11/15/2044 | 218,283 |
| 100,000 | | Valero Energy Corp., Sr. Unsecd. Note, 3.65%, 3/15/2025 | 102,824 |
| | | TOTAL | 843,841 |
| | | Financial Institution - Banking—14.9% | |
| 210,000 | | Associated Banc-Corp., Sub. Note, 4.25%, 1/15/2025 | 216,497 |
| 1,600,000 | 1 | Bank of America Corp., Sr. Unsecd. Note, 3.705%, (3-month USLIBOR +1.512%), 4/24/2028 | 1,643,690 |
| 600,000 | 1 | Bank of America Corp., Sr. Unsecd. Note, Series GMTN, 3.593%, (3-month USLIBOR +1.370%), 7/21/2028 | 610,428 |
| 750,000 | | Bank of America Corp., Sr. Unsecd. Note, Series MTN, 3.248%, 10/21/2027 | 744,942 |
| 200,000 | | Bank of America Corp., Sub. Note, Series L, 3.95%, 4/21/2025 | 206,972 |
| 800,000 | | Bank of America Corp., Sub. Note, Series MTN, 4.00%, 1/22/2025 | 832,868 |
| 520,000 | | Capital One Financial Corp., Sr. Sub. Note, 4.20%, 10/29/2025 | 535,739 |
| 180,000 | | Citigroup, Inc., 4.125%, 7/25/2028 | 185,856 |
| 250,000 | | Citigroup, Inc., 5.50%, 9/13/2025 | 282,018 |
| 400,000 | | Citigroup, Inc., Sr. Unsecd. Note, 2.75%, 4/25/2022 | 399,544 |
| 250,000 | 1 | Citigroup, Inc., Sr. Unsecd. Note, 2.876%, (3-month USLIBOR +0.950%), 7/24/2023 | 248,979 |
| 480,000 | | Citigroup, Inc., Sr. Unsecd. Note, 3.40%, 5/1/2026 | 483,610 |
| 500,000 | 1 | Citigroup, Inc., Sr. Unsecd. Note, 3.668%, (3-month USLIBOR +1.390%), 7/24/2028 | 507,736 |
Annual Shareholder Report
Principal
Amount
or Shares | | | Value |
| | | CORPORATE BONDS—continued | |
| | | Financial Institution - Banking—continued | |
| $350,000 | | Citigroup, Inc., Sr. Unsecd. Note, 3.70%, 1/12/2026 | $360,860 |
| 400,000 | 1 | Citigroup, Inc., Sr. Unsecd. Note, 3.887%, (3-month USLIBOR +1.563%), 1/10/2028 | 414,389 |
| 750,000 | | Citigroup, Inc., Sub. Note, 3.875%, 3/26/2025 | 768,765 |
| 180,000 | | Citizens Financial Group, Inc., Sub. Note, 4.30%, 12/3/2025 | 189,067 |
| 150,000 | | Citizens Financial Group, Inc., Sub. Note, 4.35%, 8/1/2025 | 156,234 |
| 250,000 | | Citizens Financial Group, Inc., Sub. Note, Series 144A, 4.15%, 9/28/2022 | 259,509 |
| 200,000 | | Comerica, Inc., 3.80%, 7/22/2026 | 203,214 |
| 250,000 | | Compass Bank, Birmingham, Sr. Unsecd. Note, Series BKNT, 2.75%, 9/29/2019 | 250,766 |
| 200,000 | | Compass Bank, Birmingham, Sub. Note, Series BKNT, 3.875%, 4/10/2025 | 200,904 |
| 155,000 | | Fifth Third Bancorp, Sr. Unsecd. Note, 2.875%, 7/27/2020 | 156,722 |
| 400,000 | 1 | Goldman Sachs Group, Inc., Sr. Unsecd. Note, 2.905%, (3-month USLIBOR +0.990%), 7/24/2023 | 397,576 |
| 300,000 | | Goldman Sachs Group, Inc., Sr. Unsecd. Note, 3.50%, 11/16/2026 | 301,990 |
| 200,000 | 1 | Goldman Sachs Group, Inc., Sr. Unsecd. Note, 3.691%, (3-month USLIBOR +1.510%), 6/5/2028 | 203,074 |
| 400,000 | | Goldman Sachs Group, Inc., Sub. Note, 4.25%, 10/21/2025 | 418,366 |
| 40,000 | | Huntington Bancshares, Inc., Sub. Note, 7.00%, 12/15/2020 | 44,757 |
| 450,000 | | Morgan Stanley, Sub. Note, 5.00%, 11/24/2025 | 493,099 |
| 175,000 | | Morgan Stanley, Sub. Note, Series MTN, 4.10%, 5/22/2023 | 182,515 |
| 410,000 | | Regions Financial Corp., Sr. Unsecd. Note, 3.20%, 2/8/2021 | 417,421 |
| 200,000 | | SunTrust Bank, Sub. Note, 3.30%, 5/15/2026 | 198,385 |
| 150,000 | | SunTrust Banks, Inc., Sr. Unsecd. Note, 2.90%, 3/3/2021 | 151,777 |
| 50,000 | | Wilmington Trust Corp., Sub. Note, 8.50%, 4/2/2018 | 50,795 |
| | | TOTAL | 12,719,064 |
| | | Financial Institution - Broker/Asset Mgr/Exchange—1.2% | |
| 190,000 | | Cantor Fitzgerald LP, Bond, 7.875%, 10/15/2019 | 205,729 |
| 180,000 | | Jefferies Group LLC, Sr. Unsecd. Note, 5.125%, 1/20/2023 | 195,276 |
| 70,000 | | Jefferies Group LLC, Sr. Unsecd. Note, 6.875%, 4/15/2021 | 78,360 |
| 300,000 | | Stifel Financial Corp., 4.25%, 7/18/2024 | 307,668 |
| 200,000 | | TIAA Asset Management Finance Co. LLC, Sr. Unsecd. Note, Series 144A, 4.125%, 11/1/2024 | 211,340 |
| | | TOTAL | 998,373 |
| | | Financial Institution - Finance Companies—0.7% | |
| 300,000 | | Discover Bank, Sub. Note, Series BKNT, 8.70%, 11/18/2019 | 329,980 |
| 200,000 | | Discover Financial Services, Sr. Unsecd. Note, 4.10%, 2/9/2027 | 205,189 |
| 70,000 | | Macquarie Group Ltd., Sr. Unsecd. Note, Series 144A, 6.00%, 1/14/2020 | 74,608 |
| | | TOTAL | 609,777 |
| | | Financial Institution - Insurance - Life—1.9% | |
| 75,000 | | AXA-UAP, Sub. Note, 8.60%, 12/15/2030 | 108,094 |
| 300,000 | | American International Group, Inc., 4.50%, 7/16/2044 | 324,117 |
| 255,000 | | American International Group, Inc., Sr. Unsecd. Note, 4.125%, 2/15/2024 | 269,745 |
| 100,000 | | American International Group, Inc., Sr. Unsecd. Note, 4.375%, 1/15/2055 | 102,217 |
| 110,000 | | Lincoln National Corp., Sr. Note, 7.00%, 6/15/2040 | 152,011 |
| 200,000 | | Lincoln National Corp., Sr. Unsecd. Note, 6.25%, 2/15/2020 | 215,463 |
| 100,000 | | MetLife, Inc., Jr. Sub. Note, 10.75%, 8/1/2039 | 167,500 |
| 50,000 | | Penn Mutual Life Insurance Co., Sr. Note, Series 144A, 7.625%, 6/15/2040 | 69,934 |
| 250,000 | | Principal Financial Group, Inc., Sr. Unsecd. Note, 3.10%, 11/15/2026 | 247,316 |
| | | TOTAL | 1,656,397 |
| | | Financial Institution - Insurance - P&C—1.9% | |
| 500,000 | | CNA Financial Corp., Sr. Unsecd. Note, 5.875%, 8/15/2020 | 541,131 |
| 120,000 | | Hartford Financial Services Group, Inc., Sr. Unsecd. Note, 5.125%, 4/15/2022 | 131,064 |
| 120,000 | | Hartford Financial Services Group, Inc., Sr. Unsecd. Note, 6.625%, 4/15/2042 | 163,025 |
Annual Shareholder Report
Principal
Amount
or Shares | | | Value |
| | | CORPORATE BONDS—continued | |
| | | Financial Institution - Insurance - P&C—continued | |
| $60,000 | | Liberty Mutual Group, Inc., Company Guarantee, Series 144A, 5.00%, 6/1/2021 | $64,215 |
| 310,000 | | Liberty Mutual Group, Inc., Series 144A, 4.95%, 5/1/2022 | 334,790 |
| 55,000 | | Liberty Mutual Group, Inc., Sr. Unsecd. Note, Series 144A, 4.25%, 6/15/2023 | 58,017 |
| 195,000 | | Nationwide Mutual Insurance Co., Sub. Note, Series 144A, 9.375%, 8/15/2039 | 332,409 |
| | | TOTAL | 1,624,651 |
| | | Financial Institution - REIT - Apartment—1.1% | |
| 160,000 | | Mid-America Apartment Communities LP, 4.00%, 11/15/2025 | 165,959 |
| 150,000 | | Mid-America Apartment Communities LP, Sr. Unsecd. Note, 3.75%, 6/15/2024 | 154,354 |
| 100,000 | | Post Apartment Homes LP, Sr. Unsecd. Note, 3.375%, 12/1/2022 | 101,471 |
| 70,000 | | UDR, Inc., Company Guarantee, Series 0001, 4.625%, 1/10/2022 | 74,299 |
| 250,000 | | UDR, Inc., Series MTN, 3.75%, 7/1/2024 | 257,449 |
| 200,000 | | UDR, Inc., Sr. Unsecd. Note, Series GMTN, 3.50%, 1/15/2028 | 199,979 |
| | | TOTAL | 953,511 |
| | | Financial Institution - REIT - Healthcare—1.2% | |
| 100,000 | | Health Care REIT, Inc., Sr. Unsecd. Note, 4.95%, 1/15/2021 | 106,321 |
| 400,000 | | Healthcare Trust of America, 3.70%, 4/15/2023 | 409,368 |
| 300,000 | | Physicians Realty Trust, Sr. Unsecd. Note, 3.95%, 1/15/2028 | 297,033 |
| 200,000 | | Physicians Realty Trust, Sr. Unsecd. Note, 4.30%, 3/15/2027 | 203,815 |
| | | TOTAL | 1,016,537 |
| | | Financial Institution - REIT - Office—0.4% | |
| 100,000 | | Alexandria Real Estate Equities, Inc., Sr. Unsecd. Note, 3.90%, 6/15/2023 | 103,455 |
| 90,000 | | Alexandria Real Estate Equities, Inc., Sr. Unsecd. Note, 3.95%, 1/15/2027 | 92,083 |
| 100,000 | | Alexandria Real Estate Equities, Inc., Sr. Unsecd. Note, 3.95%, 1/15/2028 | 102,286 |
| 60,000 | | Alexandria Real Estate Equities, Inc., Sr. Unsecd. Note, 4.60%, 4/1/2022 | 63,764 |
| | | TOTAL | 361,588 |
| | | Financial Institution - REIT - Other—0.4% | |
| 300,000 | | WP Carey, Inc., Sr. Unsecd. Note, 4.60%, 4/1/2024 | 313,747 |
| | | Financial Institution - REIT - Retail—0.9% | |
| 140,000 | | Kimco Realty Corp., Sr. Unsecd. Note, 2.80%, 10/1/2026 | 132,367 |
| 80,000 | | Kimco Realty Corp., Sr. Unsecd. Note, 3.40%, 11/1/2022 | 81,661 |
| 290,000 | | Kimco Realty Corp., Sr. Unsecd. Note, 3.80%, 4/1/2027 | 293,370 |
| 200,000 | | Tanger Properties LP, Sr. Unsecd. Note, 3.125%, 9/1/2026 | 190,680 |
| 45,000 | | Tanger Properties LP, Sr. Unsecd. Note, 3.875%, 12/1/2023 | 45,919 |
| | | TOTAL | 743,997 |
| | | Technology—3.8% | |
| 67,000 | | BMC Software, Inc., 7.25%, 6/1/2018 | 68,172 |
| 60,000 | | Diamond 1 Finance Corp./Diamond 2 Finance Corp., Sr. Secd. Note, Series 144A, 4.42%, 6/15/2021 | 62,564 |
| 840,000 | | Diamond 1 Finance Corp./Diamond 2 Finance Corp., Sr. Secd. Note, Series 144A, 6.02%, 6/15/2026 | 927,491 |
| 190,000 | | Equifax, Inc., Sr. Unsecd. Note, 2.30%, 6/1/2021 | 185,592 |
| 550,000 | | Hewlett Packard Enterprise Co., Sr. Unsecd. Note, 3.60%, 10/15/2020 | 561,870 |
| 100,000 | | Ingram Micro, Inc., Sr. Unsecd. Note, 5.00%, 8/10/2022 | 98,128 |
| 70,000 | | Ingram Micro, Inc., Sr. Unsecd. Note, 5.45%, 12/15/2024 | 69,608 |
| 450,000 | | Keysight Technologies, Inc., 4.55%, 10/30/2024 | 477,988 |
| 350,000 | | Molex Electronics Technologies LLC, Unsecd. Note, Series 144A, 3.90%, 4/15/2025 | 357,344 |
| 80,000 | | Total System Services, Inc., Sr. Unsecd. Note, 4.80%, 4/1/2026 | 86,675 |
| 220,000 | | Verisk Analytics, Inc., Sr. Unsecd. Note, 4.125%, 9/12/2022 | 229,892 |
| 75,000 | | Verisk Analytics, Inc., Sr. Unsecd. Note, 4.875%, 1/15/2019 | 76,814 |
| | | TOTAL | 3,202,138 |
Annual Shareholder Report
Principal
Amount
or Shares | | | Value |
| | | CORPORATE BONDS—continued | |
| | | Transportation - Railroads—0.8% | |
| $100,000 | | Canadian Pacific Railway Co., 7.125%, 10/15/2031 | $137,106 |
| 200,000 | | Canadian Pacific Railway Co., Sr. Unsecd. Note, 4.45%, 3/15/2023 | 213,534 |
| 305,000 | | Kansas City Southern Industries, Inc., Sr. Unsecd. Note, 3.00%, 5/15/2023 | 302,684 |
| | | TOTAL | 653,324 |
| | | Transportation - Services—0.9% | |
| 330,000 | | Enterprise Rent-A-Car USA Finance Co., Sr. Unsecd. Note, Series 144A, 5.625%, 3/15/2042 | 390,730 |
| 400,000 | | Penske Truck Leasing Co. LP & PTL Finance Corp., Sr. Unsecd. Note, Series 144A, 3.30%, 4/1/2021 | 407,670 |
| | | TOTAL | 798,400 |
| | | Utility - Electric—6.0% | |
| 130,000 | | AEP Texas, Inc., Sr. Unsecd. Note, 3.85%, 10/1/2025 | 135,943 |
| 80,000 | | Ameren Corp., Sr. Unsecd. Note, 3.65%, 2/15/2026 | 82,102 |
| 95,000 | | American Electric Power Co., Inc., Sr. Unsecd. Note, Series F, 2.95%, 12/15/2022 | 96,444 |
| 200,000 | | Appalachian Power Co., Sr. Unsecd. Note, 7.00%, 4/1/2038 | 285,413 |
| 225,000 | | Cleveland Electric Illuminating Co., Sr. Unsecd. Note, 5.95%, 12/15/2036 | 281,028 |
| 240,000 | | Duke Energy Corp., Sr. Unsecd. Note, 2.65%, 9/1/2026 | 230,336 |
| 300,000 | | EDP Finance BV, Sr. Unsecd. Note, Series 144A, 3.625%, 7/15/2024 | 302,374 |
| 300,000 | 1 | Electricite de France SA, Jr. Sub. Note, Series 144A, 5.625%, 7/22/2066 | 310,875 |
| 390,000 | | Emera US Finance LP, Sr. Unsecd. Note, 4.75%, 6/15/2046 | 428,310 |
| 200,000 | | Enel Finance International NV, Sr. Unsecd. Note, Series 144A, 4.75%, 5/25/2047 | 217,242 |
| 100,000 | | Exelon Corp., Sr. Unsecd. Note, 3.95%, 6/15/2025 | 104,352 |
| 390,000 | | Fortis, Inc., Sr. Unsecd. Note, 3.055%, 10/4/2026 | 377,173 |
| 240,000 | | Kansas City Power and Light Co., Sr. Unsecd. Note, 3.65%, 8/15/2025 | 245,992 |
| 290,000 | 1 | National Rural Utilities Cooperative Finance Corp., Sr. Sub. Note, 5.25%, (3-month USLIBOR +3.630%), 4/20/2046 | 311,976 |
| 200,000 | | NextEra Energy Capital Holdings, Inc., Sr. Unsecd. Note, 3.55%, 5/1/2027 | 204,065 |
| 300,000 | | NiSource Finance Corp., Sr. Unsecd. Note, 3.95%, 3/30/2048 | 308,372 |
| 100,000 | | NiSource Finance Corp., Sr. Unsecd. Note, 4.375%, 5/15/2047 | 109,969 |
| 250,000 | | Northeast Utilities, Sr. Unsecd. Note, Series H, 3.15%, 1/15/2025 | 251,268 |
| 200,000 | | PPL Capital Funding, Inc., Sr. Unsecd. Note, 3.95%, 3/15/2024 | 209,474 |
| 200,000 | | PPL WEM Holdings PLC, Sr. Unsecd. Note, Series 144A, 5.375%, 5/1/2021 | 214,479 |
| 30,000 | | Progress Energy, Inc., 7.05%, 3/15/2019 | 31,677 |
| 80,000 | | TECO Finance, Inc., Company Guarantee, 5.15%, 3/15/2020 | 84,237 |
| 250,000 | | UIL Holdings Corp., Sr. Unsecd. Note, 4.625%, 10/1/2020 | 261,936 |
| | | TOTAL | 5,085,037 |
| | | Utility - Natural Gas—1.2% | |
| 80,000 | | Enbridge Energy Partners LP, Sr. Unsecd. Note, 5.50%, 9/15/2040 | 87,809 |
| 200,000 | | National Fuel Gas Co., Sr. Unsecd. Note, 3.75%, 3/1/2023 | 202,829 |
| 130,000 | | National Fuel Gas Co., Sr. Unsecd. Note, 3.95%, 9/15/2027 | 129,704 |
| 90,000 | | National Fuel Gas Co., Sr. Unsecd. Note, 4.90%, 12/1/2021 | 94,851 |
| 200,000 | | Sempra Energy, Sr. Unsecd. Note, 3.55%, 6/15/2024 | 205,212 |
| 250,000 | | Southern Natural Gas, Sr. Unsecd. Note, Series 144A, 4.80%, 3/15/2047 | 275,794 |
| | | TOTAL | 996,199 |
| | | TOTAL CORPORATE BONDS
(IDENTIFIED COST $77,774,271) | 81,270,409 |
| | | FOREIGN GOVERNMENTS/AGENCIES—2.3% | |
| | | Sovereign—2.3% | |
| 850,000 | | Colombia, Government of, Sr. Unsecd. Note, 4.375%, 7/12/2021 | 896,325 |
| 200,000 | | Mexico, Government of, 4.75%, 3/8/2044 | 202,200 |
| 206,000 | | Mexico, Government of, 6.75%, 9/27/2034 | 267,800 |
| 300,000 | | Mexico, Government of, Sr. Unsecd. Note, 3.60%, 1/30/2025 | 304,050 |
Annual Shareholder Report
Principal
Amount
or Shares | | | Value |
| | | FOREIGN GOVERNMENTS/AGENCIES—continued | |
| | | Sovereign—continued | |
| 190,000 | | Peru, Government of, 6.55%, 3/14/2037 | $256,975 |
| | | TOTAL FOREIGN GOVERNMENTS/AGENCIES
(IDENTIFIED COST $1,797,773) | 1,927,350 |
| | | REPURCHASE AGREEMENT—1.5% | |
| | | Finance - Banking—1.5% | |
| $1,241,000 | | Interest in $950,000,000 joint repurchase agreement 1.42%, dated 12/29/2017 under which Bank of America, N.A. will repurchase securities provided as collateral for $950,149,889 on 1/2/2018. The securities provided as collateral at the end of the period held with BNY Mellon as tri-party agent, were U.S. Government Agency securities maturing on 7/20/2046 and the market value of those underlying securities was $969,152,887.
(AT COST) | 1,241,000 |
| | | TOTAL INVESTMENT IN SECURITIES—99.3%
(IDENTIFIED COST $80,813,044)2 | 84,438,759 |
| | | OTHER ASSETS AND LIABILITIES-NET—0.7%3 | 613,469 |
| | | TOTAL NET ASSETS—100% | $85,052,228 |
At December 31, 2017, the Fund had the following outstanding futures contracts:
| Description | Number of
Contracts | Notional Value | Expiration Date | Value and
Unrealized
Appreciation
(Depreciation) |
| 4U.S. Treasury Notes 5-Year Long Futures | 15 | $1,742,461 | March 2018 | $(8,121) |
| 4U.S. Treasury Notes 10-Year Short Futures | 80 | $9,923,750 | March 2018 | $62,427 |
| NET UNREALIZED APPRECIATION ON FUTURES CONTRACTS | $54,306 |
Net Unrealized Appreciation on Futures Contracts is included in “Other Assets and Liabilities - Net.”
| 1 | Floating/variable note with current rate and current maturity or next reset date shown. Certain variable rate securities are not based on a published reference rate and spread but are determined by the issuer or agent and are based on current market conditions. These securities do not indicate a reference rate and spread in their description above. |
| 2 | Also represents cost for federal tax purposes. |
| 3 | Assets, other than investments in securities, less liabilities. See Statement of Assets and Liabilities. |
| 4 | Non-income-producing security. |
Note: The categories of investments are shown as a percentage of total net assets at December 31, 2017.
Various inputs are used in determining the value of the Fund's investments. These inputs are summarized in the three broad levels listed below:
Level 1—quoted prices in active markets for identical securities.
Level 2—other significant observable inputs (including quoted prices for similar securities, interest rates, prepayment speeds, credit risk, etc.). Also includes securities valued at amortized cost.
Level 3—significant unobservable inputs (including the Fund's own assumptions in determining the fair value of investments).
The inputs or methodology used for valuing securities are not an indication of the risk associated with investing in those securities.
Annual Shareholder Report
The following is a summary of the inputs used, as of December 31, 2017, in valuing the Fund's assets carried at fair value:
| Valuation Inputs | | | | |
| | Level 1—
Quoted
Prices | Level 2—
Other
Significant
Observable
Inputs | Level 3—
Significant
Unobservable
Inputs | Total |
| Debt Securities: | | | | |
| Corporate Bonds | $— | $81,270,409 | $— | $81,270,409 |
| Foreign Governments/Agencies | — | 1,927,350 | — | 1,927,350 |
| Repurchase Agreement | — | 1,241,000 | — | 1,241,000 |
| TOTAL SECURITIES | $— | $84,438,759 | $— | $84,438,759 |
| Other Financial Instruments | | | | |
| Assets | | | | |
| Futures | $62,427 | $— | $— | $62,427 |
| Liabilities | | | | |
| Futures | (8,121) | — | — | (8,121) |
| TOTAL OTHER FINANCIAL INSTRUMENTS | $54,306 | $— | $— | $54,306 |
The following acronyms are used throughout this portfolio:
| BKNT | —Bank Notes |
| GMTN | —Global Medium Term Note |
| LIBOR | —London Interbank Offered Rate |
| MTN | —Medium Term Note |
| REIT | —Real Estate Investment Trust |
See Notes which are an integral part of the Financial Statements
Annual Shareholder Report
Financial Highlights
(For a Share Outstanding Throughout Each Period)
| Year Ended December 31 | 2017 | 2016 | 2015 | 2014 | 2013 |
| Net Asset Value, Beginning of Period | $10.71 | $10.29 | $11.05 | $10.70 | $11.41 |
| Income From Investment Operations: | | | | | |
| Net investment income | 0.45 | 0.46 | 0.47 | 0.49 | 0.50 |
| Net realized and unrealized gain (loss) on investments and futures contracts | 0.39 | 0.42 | (0.76) | 0.37 | (0.62) |
| TOTAL FROM INVESTMENT OPERATIONS | 0.84 | 0.88 | (0.29) | 0.86 | (0.12) |
| Less Distributions: | | | | | |
| Distributions from net investment income | (0.45) | (0.46) | (0.47) | (0.49) | (0.50) |
| Distributions from net realized gain on investments and futures contracts | — | — | — | (0.02) | (0.09) |
| TOTAL DISTRIBUTIONS | (0.45) | (0.46) | (0.47) | (0.51) | (0.59) |
| Net Asset Value, End of Period | $11.10 | $10.71 | $10.29 | $11.05 | $10.70 |
| Total Return1 | 8.01% | 8.61% | (2.71)% | 8.08% | (1.02)% |
| Ratios to Average Net Assets: | | | | | |
| Net expenses2 | 0.00% | 0.00% | 0.00% | 0.00% | 0.00% |
| Net investment income | 4.14% | 4.28% | 4.39% | 4.39% | 4.57% |
| Expense waiver/reimbursement3 | 0.29% | 0.33% | 0.34% | 0.37% | 0.41% |
| Supplemental Data: | | | | | |
| Net assets, end of period (000 omitted) | $85,052 | $78,255 | $72,610 | $67,937 | $49,635 |
| Portfolio turnover | 22% | 25% | 26% | 11% | 31% |
| 1 | Based on net asset value. |
| 2 | The Adviser has contractually agreed to reimburse all operating expenses, excluding extraordinary expenses, incurred by the Fund. |
| 3 | This expense decrease is reflected in both the net expense and the net investment income ratios shown above. |
See Notes which are an integral part of the Financial Statements
Annual Shareholder Report
Statement of Assets and Liabilities
December 31, 2017
| Assets: | | |
| Investment in securities at value (identified cost $80,813,044) | | $84,438,759 |
| Cash | | 921 |
| Restricted cash (Note 2) | | 76,969 |
| Income receivable | | 931,541 |
| Receivable for shares sold | | 409 |
| TOTAL ASSETS | | 85,448,599 |
| Liabilities: | | |
| Payable for shares redeemed | $77 | |
| Payable for daily variation margin on futures contracts | 14,814 | |
| Income distribution payable | 284,895 | |
| Payable to adviser (Note 5) | 3,972 | |
| Payable for administrative fees (Note 5) | 560 | |
| Payable for auditing fees | 30,430 | |
| Payable for portfolio accounting fees | 46,527 | |
| Accrued expenses (Note 5) | 15,096 | |
| TOTAL LIABILITIES | | 396,371 |
| Net assets for 7,664,212 shares outstanding | | $85,052,228 |
| Net Assets Consist of: | | |
| Paid-in capital | | $81,208,141 |
| Net unrealized appreciation of investments and futures contracts | | 3,680,021 |
| Accumulated net realized gain on investments and futures contracts | | 157,023 |
| Undistributed net investment income | | 7,043 |
| TOTAL NET ASSETS | | $85,052,228 |
| Net Asset Value, Offering Price and Redemption Proceeds Per Share: | | |
| $85,052,228 ÷ 7,664,212 shares outstanding, no par value, unlimited shares authorized | | $11.10 |
See Notes which are an integral part of the Financial Statements
Annual Shareholder Report
Statement of Operations
Year Ended December 31, 2017
| Investment Income: | | |
| Interest | | $3,467,163 |
| Expenses: | | |
| Administrative fee (Note 5) | $66,359 | |
| Custodian fees | 6,709 | |
| Transfer agent fee | 8,814 | |
| Directors'/Trustees' fees (Note 5) | 2,102 | |
| Auditing fees | 30,430 | |
| Legal fees | 8,640 | |
| Portfolio accounting fees | 51,557 | |
| Share registration costs | 21,469 | |
| Printing and postage | 16,864 | |
| Commitment fee (Note 7) | 15,490 | |
| Miscellaneous (Note 5) | 11,691 | |
| TOTAL EXPENSES | 240,125 | |
| Reimbursement: | | |
| Reimbursement of other operating expenses (Note 5) | $(240,125) | |
| Net expenses | | — |
| Net investment income | | 3,467,163 |
| Realized and Unrealized Gain (Loss) on Investments and Futures Contracts: | | |
| Net realized gain on investments | | 843,408 |
| Net realized loss on futures contracts | | (97,492) |
| Net change in unrealized appreciation of investments | | 2,140,294 |
| Net change in unrealized appreciation of futures contracts | | 32,534 |
| Net realized and unrealized gain on investments and futures contracts | | 2,918,744 |
| Change in net assets resulting from operations | | $6,385,907 |
See Notes which are an integral part of the Financial Statements
Annual Shareholder Report
Statement of Changes in Net Assets
| Year Ended December 31 | 2017 | 2016 |
| Increase (Decrease) in Net Assets | | |
| Operations: | | |
| Net investment income | $3,467,163 | $3,320,333 |
| Net realized gain on investments and futures contracts | 745,916 | 321,739 |
| Net change in unrealized appreciation/depreciation of investments and futures contracts | 2,172,828 | 2,686,865 |
| CHANGE IN NET ASSETS RESULTING FROM OPERATIONS | 6,385,907 | 6,328,937 |
| Distributions to Shareholders: | | |
| Distributions from net investment income | (3,469,545) | (3,319,859) |
| Share Transactions: | | |
| Proceeds from sale of shares | 16,626,012 | 11,616,324 |
| Net asset value of shares issued to shareholders in payment of distributions declared | 48,429 | 27,765 |
| Cost of shares redeemed | (12,793,855) | (9,007,829) |
| CHANGE IN NET ASSETS RESULTING FROM SHARE TRANSACTIONS | 3,880,586 | 2,636,260 |
| Change in net assets | 6,796,948 | 5,645,338 |
| Net Assets: | | |
| Beginning of period | 78,255,280 | 72,609,942 |
| End of period (including undistributed net investment income of $7,043 and $9,425, respectively) | $85,052,228 | $78,255,280 |
See Notes which are an integral part of the Financial Statements
Annual Shareholder Report
Notes to Financial Statements
December 31, 2017
1. ORGANIZATION
Federated Managed Pool Series (the “Trust”) is registered under the Investment Company Act of 1940, as amended (the “Act”), as an open-end management investment company. The Trust consists of five portfolios. The financial statements included herein are only those of Federated Corporate Bond Strategy Portfolio (the “Fund”), a diversified portfolio. The financial statements of the other portfolios are presented separately. The assets of each portfolio are segregated and a shareholder's interest is limited to the portfolio in which shares are held. Each portfolio pays its own expenses. The investment objective of the Fund is to provide total return.
2. SIGNIFICANT ACCOUNTING POLICIES
The following is a summary of significant accounting policies consistently followed by the Fund in the preparation of its financial statements. These policies are in conformity with U.S. generally accepted accounting principles (GAAP).
Investment Valuation
In calculating its net asset value (NAV), the Fund generally values investments as follows:
| ■ | Fixed-income securities are fair valued using price evaluations provided by a pricing service approved by the Trustees. |
| ■ | Shares of other mutual funds or non-exchange-traded investment companies are valued based upon their reported NAVs. |
| ■ | Derivative contracts listed on exchanges are valued at their reported settlement or closing price, except that options are valued at the mean of closing bid and asked quotations. |
| ■ | Over-the-counter (OTC) derivative contracts are fair valued using price evaluations provided by a pricing service approved by the Trustees. |
| ■ | For securities that are fair valued in accordance with procedures established by and under the general supervision of the Trustees, certain factors may be considered such as: the last traded or purchase price of the security, information obtained by contacting the issuer or dealers, analysis of the issuer's financial statements or other available documents, fundamental analytical data, the nature and duration of restrictions on disposition, the movement of the market in which the security is normally traded, public trading in similar securities or derivative contracts of the issuer or comparable issuers, movement of a relevant index, or other factors including but not limited to industry changes and relevant government actions. |
If any price, quotation, price evaluation or other pricing source is not readily available when the NAV is calculated, if the Fund cannot obtain price evaluations from a pricing service or from more than one dealer for an investment within a reasonable period of time as set forth in the Fund's valuation policies and procedures, or if information furnished by a pricing service, in the opinion of the valuation committee (“Valuation Committee”), is deemed not representative of the fair value of such security, the Fund uses the fair value of the investment determined in accordance with the procedures described below. There can be no assurance that the Fund could obtain the fair value assigned to an investment if it sold the investment at approximately the time at which the Fund determines its NAV per share.
Fair Valuation and Significant Events Procedures
The Trustees have ultimate responsibility for determining the fair value of investments for which market quotations are not readily available. The Trustees have appointed a Valuation Committee comprised of officers of the Fund, Federated Investment Management Company (“Adviser”) and certain of the Adviser's affiliated companies to assist in determining fair value and in overseeing the calculation of the NAV. The Trustees have also authorized the use of pricing services recommended by the Valuation Committee to provide fair value evaluations of the current value of certain investments for purposes of calculating the NAV. The Valuation Committee employs various methods for reviewing third-party pricing-service evaluations including periodic reviews of third-party pricing services' policies, procedures and valuation methods (including key inputs, methods, models and assumptions), transactional back-testing, comparisons of evaluations of different pricing services, and review of price challenges by the Adviser based on recent market activity. In the event that market quotations and price evaluations are not available for an investment, the Valuation Committee determines the fair value of the investment in accordance with procedures adopted by the Trustees. The Trustees periodically review and approve the fair valuations made by the Valuation Committee and any changes made to the procedures.
Factors considered by pricing services in evaluating an investment include the yields or prices of investments of comparable quality, coupon, maturity, call rights and other potential prepayments, terms and type, reported transactions, indications as to values from dealers and general market conditions. Some pricing services provide a single price evaluation reflecting the bid-side of the market for an investment (a “bid” evaluation). Other pricing services offer both bid evaluations and price evaluations indicative of a price between the prices bid and asked for the investment (a “mid” evaluation). The Fund normally uses bid evaluations for any U.S. Treasury and Agency securities, mortgage-backed securities and municipal securities. The Fund normally uses mid evaluations for any other types of fixed-income securities and any OTC derivative contracts. In the event that market quotations and price evaluations are not available for an investment, the fair value of the investment is determined in accordance with procedures adopted by the Trustees.
The Trustees also have adopted procedures requiring an investment to be priced at its fair value whenever the Adviser determines that a significant event affecting the value of the investment has occurred between the time as of which the price of the investment would otherwise be determined and the time as of which the NAV is computed. An event is considered significant if there is both an affirmative expectation that the investment's value will change in response to the event and a reasonable basis for quantifying the resulting change in value. Examples of significant events that may occur after the close of the principal market on which a security is traded, or after the time of a price evaluation provided by a pricing service or a dealer, include:
| ■ | With respect to securities traded principally in foreign markets, significant trends in U.S. equity markets or in the trading of foreign securities index futures contracts; |
| ■ | Political or other developments affecting the economy or markets in which an issuer conducts its operations or its securities are traded; |
Annual Shareholder Report
| ■ | Announcements concerning matters such as acquisitions, recapitalizations, litigation developments, or a natural disaster affecting the issuer's operations or regulatory changes or market developments affecting the issuer's industry. |
The Trustees have adopted procedures whereby the Valuation Committee uses a pricing service to determine the fair value of equity securities traded principally in foreign markets when the Adviser determines that there has been a significant trend in the U.S. equity markets or in index futures trading. For other significant events, the Fund may seek to obtain more current quotations or price evaluations from alternative pricing sources. If a reliable alternative pricing source is not available, the Fund will determine the fair value of the investment in accordance with the fair valuation procedures approved by the Trustees. The Trustees have ultimate responsibility for any fair valuations made in response to a significant event.
Repurchase Agreements
The Fund may invest in repurchase agreements for short-term liquidity purposes. It is the policy of the Fund to require the other party to a repurchase agreement to transfer to the Fund's custodian or sub-custodian eligible securities or cash with a market value (after transaction costs) at least equal to the repurchase price to be paid under the repurchase agreement. The eligible securities are transferred to accounts with the custodian or sub-custodian in which the Fund holds a “securities entitlement” and exercises “control” as those terms are defined in the Uniform Commercial Code. The Fund has established procedures for monitoring the market value of the transferred securities and requiring the transfer of additional eligible securities if necessary to equal at least the repurchase price. These procedures also allow the other party to require securities to be transferred from the account to the extent that their market value exceeds the repurchase price or in exchange for other eligible securities of equivalent market value.
The insolvency of the other party or other failure to repurchase the securities may delay the disposition of the underlying securities or cause the Fund to receive less than the full repurchase price. Under the terms of the repurchase agreement, any amounts received by the Fund in excess of the repurchase price and related transaction costs must be remitted to the other party.
The Fund may enter into repurchase agreements in which eligible securities are transferred into joint trading accounts maintained by the custodian or sub-custodian for investment companies and other clients advised by the Fund's Adviser and its affiliates. The Fund will participate on a pro rata basis with the other investment companies and clients in its share of the securities transferred under such repurchase agreements and in its share of proceeds from any repurchase or other disposition of such securities.
Repurchase agreements are subject to Master Netting Agreements which are agreements between the Fund and its counterparties that provide for the net settlement of all transactions and collateral with the Fund, through a single payment, in the event of default or termination. Amounts presented on the Portfolio of Investments and Statement of Assets and Liabilities are not net settlement amounts but gross. As indicated above, the cash or securities to be repurchased, as shown on the Portfolio of Investments, exceeds the repurchase price to be paid under the agreement reducing the net settlement amount to zero.
Investment Income, Gains and Losses, Expenses and Distributions
Investment transactions are accounted for on a trade-date basis. Realized gains and losses from investment transactions are recorded on an identified-cost basis. Interest income and expenses are accrued daily. Dividend income and distributions to shareholders are recorded on the ex-dividend date. Distributions of net investment income, if any, are declared daily and paid monthly. Non-cash dividends included in dividend income, if any, are recorded at fair value. Amortization/accretion of premium and discount is included in investment income. Gains and losses realized on principal payment of mortgage-backed securities (paydown gains and losses) are classified as part of investment income. The detail of the total fund expense reimbursement of $240,125 is disclosed in various locations in Note 5.
Federal Taxes
It is the Fund's policy to comply with the Subchapter M provision of the Internal Revenue Code (the “Code”) and to distribute to shareholders each year substantially all of its income. Accordingly, no provision for federal income tax is necessary. As of and during the year ended December 31, 2017, the Fund did not have a liability for any uncertain tax positions. The Fund recognizes interest and penalties, if any, related to tax liabilities as income tax expense in the Statement of Operations. As of December 31, 2017, tax years 2014 through 2017 remain subject to examination by the Fund's major tax jurisdictions, which include the United States of America and the Commonwealth of Massachusetts.
When-Issued and Delayed-Delivery Transactions
The Fund may engage in when-issued or delayed-delivery transactions. The Fund records when-issued securities on the trade date and maintains security positions such that sufficient liquid assets will be available to make payment for the securities purchased. Securities purchased on a when-issued or delayed-delivery basis are marked to market daily and begin earning interest on the settlement date. Losses may occur on these transactions due to changes in market conditions or the failure of counterparties to perform under the contract.
Futures Contracts
The Fund purchases and sells financial futures contracts to manage duration risk and yield curve risk. Upon entering into a financial futures contract with a broker, the Fund is required to deposit in a segregated account, either U.S. government securities or a specified amount of Restricted cash, which is shown in the Statement of Assets and Liabilities. Futures contracts are valued daily and unrealized gains or losses are recorded in a “variation margin” account. Daily, the Fund receives from or pays to the broker a specified amount of cash based upon changes in the variation margin account. When a contract is closed, the Fund recognizes a realized gain or loss. Futures contracts have market risks, including the risk that the change in the value of the contract may not correlate with the changes in the value of the underlying securities. There is minimal counterparty risk to the Fund since futures contracts are exchange traded and the exchange's clearing house, as counterparty to all exchange traded futures contracts, guarantees the futures contracts against default.
Futures contracts outstanding at period end are listed after the Fund's Portfolio of Investments.
The average notional value of long and short futures contracts held by the Fund throughout the period was $4,394,748 and $12,283,317, respectively. This is based on amounts held as of each month-end throughout the fiscal period.
Annual Shareholder Report
Restricted Securities
The Fund may purchase securities which are considered restricted. Restricted securities are securities that either: (a) cannot be offered for public sale without first being registered, or being able to take advantage of an exemption from registration, under the Securities Act of 1933; or (b) are subject to contractual restrictions on public sales. In some cases, when a security cannot be offered for public sale without first being registered, the issuer of the restricted security has agreed to register such securities for resale, at the issuer's expense, either upon demand by the Fund or in connection with another registered offering of the securities. Many such restricted securities may be resold in the secondary market in transactions exempt from registration. Restricted securities may be determined to be liquid under criteria established by the Trustees. The Fund will not incur any registration costs upon such resales. The Fund's restricted securities, like other securities, are priced in accordance with procedures established by and under the general supervision of the Trustees.
Additional Disclosure Related to Derivative Instruments
| | Liability |
| | Statement of
Assets and
Liabilities
Location | Fair
Value |
| Derivatives not accounted for as hedging instruments under ASC Topic 815 | | |
| Interest rate contracts | Payable for daily
variation margin on
futures contracts | $(54,306)* |
| * | Includes cumulative appreciation of futures contracts as reported in the footnotes to the Portfolio of Investments. Only the current day's variation margin is reported within the Statement of Assets and Liabilities. |
The Effect of Derivative Instruments on the Statement of Operations for the Year Ended December 31, 2017
| Amount of Realized Gain or (Loss) on Derivatives Recognized in Income |
| | Futures
Contracts |
| Interest rate contracts | $(97,492) |
| Change in Unrealized Appreciation or (Depreciation) on Derivatives Recognized in Income |
| | Futures
Contracts |
| Interest rate contracts | $32,534 |
Other
The preparation of financial statements in conformity with GAAP requires management to make estimates and assumptions that affect the amounts of assets, liabilities, expenses and revenues reported in the financial statements. Actual results could differ from those estimated. The Fund applies investment company accounting and reporting guidance.
3. SHARES OF BENEFICIAL INTEREST
The following table summarizes share activity:
| Year Ended December 31 | 2017 | 2016 |
| Shares sold | 1,519,886 | 1,081,151 |
| Shares issued to shareholders in payment of distributions declared | 4,407 | 2,562 |
| Shares redeemed | (1,166,331) | (833,479) |
| NET CHANGE RESULTING FROM FUND SHARE TRANSACTIONS | 357,962 | 250,234 |
4. FEDERAL TAX INFORMATION
The tax character of distributions as reported on the Statement of Changes in Net Assets for the years ended December 31, 2017 and 2016, was as follows:
| | 2017 | 2016 |
| Ordinary income | $3,469,545 | $3,319,859 |
Annual Shareholder Report
As of December 31, 2017, the components of distributable earnings on a tax-basis were as follows:
| Undistributed ordinary income | $7,043 |
| Net unrealized appreciation | $3,625,715 |
| Undistributed long-term capital gains | $211,329 |
The difference between book-basis and tax-basis net unrealized appreciation/depreciation is attributable to differing treatments for mark-to-market on futures contracts.
At December 31, 2017, the cost of investments for federal tax purposes was $80,813,044. The net unrealized appreciation of investments for federal tax purposes was $3,625,715. This consists of net unrealized appreciation from investments for those securities having an excess of value over cost of $4,096,333 and net unrealized depreciation from investments for those securities having an excess of cost over value of $470,618. The amounts presented are inclusive of derivative contracts.
The Fund used capital loss carryforwards of $567,119 to offset capital gains realized during the year ended December 31, 2017.
5. INVESTMENT ADVISER FEE AND OTHER TRANSACTIONS WITH AFFILIATES
Investment Adviser Fee
The Adviser provides investment adviser services at no fee because all eligible investors are: (1) in separately managed or wrap fee programs, who often pay a single aggregate fee to the wrap program sponsor for all costs and expenses of the wrap-fee programs; or (2) in certain other separately managed accounts and discretionary investment accounts; or (3) to the extent permitted under applicable law, other Federated funds. The Adviser has contractually agreed to reimburse all expenses of the Fund, excluding extraordinary expenses. Acquired fund fees and expenses are not direct obligations of the Fund and are not contractual reimbursements under the investment advisory contract. For the year ended December 31, 2017, the Adviser reimbursed $240,125 of other operating expenses.
Administrative Fee
Federated Administrative Services (FAS), under the Administrative Services Agreement, provides the Fund with administrative personnel and services. For purposes of determining the appropriate rate breakpoint, “Investment Complex” is defined as all of the Federated Funds subject to a fee under the Administrative Services Agreement. The fee paid to FAS is based on the average daily net assets of the Investment Complex as specified below:
| Administrative Fee | Average Daily Net Assets
of the Investment Complex |
| 0.100% | on assets up to $50 billion |
| 0.075% | on assets over $50 billion |
Subject to the terms described in the Expense Limitation note, FAS may voluntarily choose to waive any portion of its fee. For the year ended December 31, 2017, the annualized fee paid to FAS was 0.079% of average daily net assets of the Fund.
Prior to September 1, 2017, the breakpoints of the Administrative Fee paid to FAS, described above, were:
| Administrative Fee | Average Daily Net Assets
of the Investment Complex |
| 0.150% | on the first $5 billion |
| 0.125% | on the next $5 billion |
| 0.100% | on the next $10 billion |
| 0.075% | on assets in excess of $20 billion |
In addition, FAS may charge certain out-of-pocket expenses to the Fund. For the year ended December 31, 2017, the Fund's Adviser reimbursed the Fund for any fee paid to FAS.
Directors'/Trustees' and Miscellaneous Fees
Certain Officers and Trustees of the Fund are Officers and Directors or Trustees of certain of the above companies. To efficiently facilitate payment, Directors'/Trustees' fees and certain expenses related to conducting meetings of the Directors/Trustees and other miscellaneous expenses are paid by an affiliate of the Adviser which in due course are reimbursed by the Fund. These expenses related to conducting meetings of the Directors/Trustees and other miscellaneous expenses may be included in Accrued and Miscellaneous Expenses on the Statement of Assets and Liabilities and Statement of Operations, respectively.
6. INVESTMENT TRANSACTIONS
Purchases and sales of investments, excluding long-term U.S. government securities and short-term obligations, for the year ended December 31, 2017, were as follows:
| Purchases | $23,169,765 |
| Sales | $18,097,997 |
Annual Shareholder Report
7. LINE OF CREDIT
The Fund participates with certain other Federated Funds, on a several basis, in an up to $500,000,000 unsecured, 364-day, committed, revolving line of credit (LOC) agreement. The LOC was made available to finance temporarily the repurchase or redemption of shares of the Fund, failed trades, payment of dividends, settlement of trades and for other short-term, temporary or emergency general business purposes. The Fund cannot borrow under the LOC if an inter-fund loan is outstanding. The Fund's ability to borrow under the LOC also is subject to the limitations of the Act and various conditions precedent that must be satisfied before the Fund can borrow. Loans under the LOC are charged interest at a fluctuating rate per annum equal to the highest, on any day, of (a) (i) the federal funds effective rate, (ii) the one month London Interbank Offered Rate (LIBOR), and (iii) 0.0%, plus (b) a margin. The LOC also requires the Fund to pay, quarterly in arrears and at maturity, its pro rata share of a commitment fee based on the amount of the lenders' commitment that has not been utilized. As of December 31, 2017, the Fund had no outstanding loans. During the year ended December 31, 2017, the Fund did not utilize the LOC.
8. INTERFUND LENDING
Pursuant to an Exemptive Order issued by the Securities and Exchange Commission, the Fund, along with other funds advised by subsidiaries of Federated Investors, Inc., may participate in an interfund lending program. This program provides an alternative credit facility allowing the Fund to borrow from other participating affiliated funds. As of December 31, 2017, there were no outstanding loans. During the year ended December 31, 2017, the program was not utilized.
Annual Shareholder Report
Report of Independent Registered Public Accounting Firm
TO THE SHAREHOLDERS AND THE BOARD OF TRUSTEES OF FEDERATED CORPORATE BOND STRATEGY PORTFOLIO:
Opinion on the Financial Statements
We have audited the accompanying statement of assets and liabilities of Federated Corporate Bond Strategy Portfolio (the “Fund”) (one of the funds constituting the Federated Managed Pool Series (the “Trust”)), including the portfolio of investments, as of December 31, 2017, and the related statement of operations for the year then ended, the statement of changes in net assets for each of the two years in the period then ended, the financial highlights for each of the five years in the period then ended and the related notes (collectively referred to as the “financial statements”). In our opinion, the financial statements present fairly, in all material respects, the financial position of Federated Corporate Bond Strategy Portfolio (one of the funds constituting the Federated Managed Pool Series) at December 31, 2017, the results of its operations for the year then ended, the changes in its net assets for each of the two years in the period then ended and its financial highlights for each of the five years in the period then ended, in conformity with U.S. generally accepted accounting principles.
Basis for Opinion
These financial statements are the responsibility of the Trust's management. Our responsibility is to express an opinion on the Fund's financial statements based on our audits. We are a public accounting firm registered with the Public Company Accounting Oversight Board (United States) (“PCAOB”) and are required to be independent with respect to the Trust in accordance with the U.S. federal securities laws and the applicable rules and regulations of the Securities and Exchange Commission and the PCAOB.
We conducted our audits in accordance with standards of the PCAOB. Those standards require that we plan and perform the audit to obtain reasonable assurance about whether the financial statements are free of material misstatement, whether due to error or fraud. The Trust is not required to have, nor were we engaged to perform, an audit of the Trust's internal control over financial reporting. As part of our audits, we are required to obtain an understanding of internal control over financial reporting, but not for the purpose of expressing an opinion on the effectiveness of the Trust's internal control over financial reporting. Accordingly, we express no such opinion.
Our audits included performing procedures to assess the risks of material misstatement of the financial statements, whether due to error or fraud, and performing procedures that respond to those risks. Such procedures included examining, on a test basis, evidence regarding the amounts and disclosures in the financial statements. Our procedures included confirmation of securities owned as of December 31, 2017, by correspondence with the custodian and others or by other appropriate auditing procedures where replies from others were not received. Our audits also included evaluating the accounting principles used and significant estimates made by management, as well as evaluating the overall presentation of the financial statements. We believe that our audits provide a reasonable basis for our opinion.
We have served as the auditor of one or more Federated investment companies since 1979.
Boston, Massachusetts
February 22, 2018
Annual Shareholder Report
Shareholder Expense Example (unaudited)
As a shareholder of the Fund, you incur ongoing costs, including to the extent applicable, management fees, distribution (12b-1) fees and/or other service fees and other Fund expenses. This Example is intended to help you to understand your ongoing costs (in dollars) of investing in the Fund and to compare these costs with the ongoing costs of investing in other mutual funds. It is based on an investment of $1,000 invested at the beginning of the period and held for the entire period from July 1, 2017 to December 31, 2017.
ACTUAL EXPENSES
The first section of the table below provides information about actual account values and actual expenses. You may use the information in this section, together with the amount you invested, to estimate the expenses that you incurred over the period. Simply divide your account value by $1,000 (for example, an $8,600 account value divided by $1,000 = 8.6), then multiply the result by the number in the first section under the heading entitled “Expenses Paid During Period” to estimate the expenses attributable to your investment during this period.
HYPOTHETICAL EXAMPLE FOR COMPARISON PURPOSES
The second section of the table below provides information about hypothetical account values and hypothetical expenses based on the Fund's actual expense ratio and an assumed rate of return of 5% per year before expenses, which is not the Fund's actual return. Thus, you should not use the hypothetical account values and expenses to estimate the actual ending account balance or your expenses for the period. Rather, these figures are required to be provided to enable you to compare the ongoing costs of investing in the Fund with other funds. To do so, compare this 5% hypothetical example with the 5% hypothetical examples that appear in the shareholder reports of the other funds.
Please note that the expenses shown in the table are meant to highlight your ongoing costs only. Therefore, the second section of the table is useful in comparing ongoing costs only, and will not help you determine the relative total costs of owning different funds.
| | Beginning
Account Value
7/1/2017 | Ending
Account Value
12/31/2017 | Expenses Paid
During Period1 |
| Actual | $1,000 | $1,030.90 | $0.00 |
| Hypothetical (assuming a 5% return before expenses) | $1,000 | $1,025.20 | $0.00 |
| 1 | Expenses are equal to the Fund's annualized net expense ratio of 0.00%, multiplied by the average account value over the period, multiplied by 184/365 (to reflect the one-half-year period). The Adviser has contractually agreed to reimburse all operating expenses, excluding extraordinary expenses, incurred by the Fund.
|
Annual Shareholder Report
In Memoriam
With profound sadness, Federated announces the passing of John F. (“Jack”) Donahue and John W. (“John”) McGonigle. They will be greatly missed.
Jack Donahue
(Former Chairman and President, and Emeritus Director/Trustee, of the Federated Funds, and Founder, Former Chairman, President and Chief Executive Officer, and Chairman Emeritus, of Federated Investors, Inc.)
Jack Donahue, along with Richard B. Fisher, founded Federated in 1955 and served as a leader and member of the Boards of Directors/Trustees of the Federated Funds and the Board of Directors of Federated Investors, Inc. Mr. Donahue was a family man of deep faith with exemplary character and fealty, who served his religion, family, community, and the Federated Funds and Federated, as well as their shareholders, officers and employees, with distinction. His integrity, intelligence, and keen sense of fiduciary duty, coupled with his faith, family and background as a West Point graduate and Strategic Air Command B-29 pilot, served as a foundation for his strong business acumen and leadership. Among his many achievements, Mr. Donahue's steadfast and innovative leadership of the Federated Funds and Federated, as well as within the investment management industry, led to the birth of money market funds in the 1970s and their growth as an innovative, efficient and effective cash management vehicle throughout the 1980s, 1990s, 2000s and beyond. Federated expresses deep gratitude to Mr. Donahue for his inspiring leadership, distinguished service and contributions as a husband, father, founder, Board member and officer, colleague and friend.
John McGonigle
(Former Secretary of the Federated Funds, Former Director, Secretary and Chief Legal Officer of Federated Investors, Inc.)
John McGonigle served the Federated Funds and their respective Boards with distinction for more than 50 years as Fund Secretary and also served as Director for several closed-end funds. Mr. McGonigle was a gifted lawyer and wise counselor with a genial presence, keen intellect and convivial demeanor. A man of deep faith, he was a devoted husband, father and grandfather. A graduate of Duquesne University School of Law, Mr. McGonigle served as an officer in the U.S. Army for two years, achieving the rank of Captain. He also served on the staff of the Securities and Exchange Commission before joining Federated in 1966. Among many professional accomplishments, Mr. McGonigle helped fashion the regulatory foundation for money market funds, established Federated's first offshore funds in Ireland, and represented Federated on the Board of Governors of the Investment Company Institute where he was a member of the Executive Committee. Federated expresses deep gratitude for Mr. McGonigle and his impact on his family, friends, the community, and the mutual fund industry.
Board of Trustees and Trust Officers
The Board of Trustees is responsible for managing the Trust's business affairs and for exercising all the Trust's powers except those reserved for the shareholders. The following tables give information about each Trustee and the senior officers of the Fund. Where required, the tables separately list Trustees who are “interested persons” of the Fund (i.e., “Interested” Trustees) and those who are not (i.e., “Independent” Trustees). Unless otherwise noted, the address of each person listed is Federated Investors Tower, 1001 Liberty Avenue, Pittsburgh, PA 15222. The address of all Independent Trustees listed is 4000 Ericsson Drive, Warrendale, PA 15086-7561; Attention: Mutual Fund Board. As of December 31, 2017, the Trust comprised five portfolio(s), and the Federated Fund Family consisted of 40 investment companies (comprising 108 portfolios). Unless otherwise noted, each Officer is elected annually. Unless otherwise noted, each Trustee oversees all portfolios in the Federated Fund Family and serves for an indefinite term. The Fund's Statement of Additional Information includes additional information about Trust Trustees and is available, without charge and upon request, by calling 1-800-341-7400.
Annual Shareholder Report
Interested Trustees Background
Name
Birth Date
Positions Held with Trust
Date Service Began | Principal Occupation(s) for Past Five Years,
Other Directorships Held and Previous Position(s) |
J. Christopher Donahue*
Birth Date: April 11, 1949
President and Trustee
Indefinite Term
Began serving: October 2005 | Principal Occupations: Principal Executive Officer and President of certain of the Funds in the Federated Fund Family; Director or Trustee of the Funds in the Federated Fund Family; President, Chief Executive Officer and Director, Federated Investors, Inc.; Chairman and Trustee, Federated Investment Management Company; Trustee, Federated Investment Counseling; Chairman and Director, Federated Global Investment Management Corp.; Chairman and Trustee, Federated Equity Management Company of Pennsylvania; Trustee, Federated Shareholder Services Company; Director, Federated Services Company.
Previous Positions: President, Federated Investment Counseling; President and Chief Executive Officer, Federated Investment Management Company, Federated Global Investment Management Corp. and Passport Research, Ltd; Chairman, Passport Research, Ltd. |
John B. Fisher*
Birth Date: May 16, 1956
Trustee
Indefinite Term
Began serving: May 2016 | Principal Occupations: Principal Executive Officer and President of certain of the Funds in the Federated Fund Family; Director or Trustee of certain of the Funds in the Federated Fund Family; Vice President, Federated Investors, Inc.; President, Director/Trustee and CEO, Federated Advisory Services Company, Federated Equity Management Company of Pennsylvania, Federated Global Investment Management Corp., Federated Investment Counseling, Federated Investment Management Company; President of some of the Funds in the Federated Fund Complex and Director, Federated Investors Trust Company.
Previous Positions: President and Director of the Institutional Sales Division of Federated Securities Corp.; President and Director of Federated Investment Counseling; President and CEO of Passport Research, Ltd.; Director, Edgewood Securities Corp.; Director, Federated Services Company; Director, Federated Investors, Inc.; Chairman and Director, Southpointe Distribution Services, Inc. and President, Technology, Federated Services Company. |
| * | Reasons for “interested” status: J. Christopher Donahue and John B. Fisher are interested due to their beneficial ownership of shares of Federated Investors, Inc. and due to positions they hold with Federated and its subsidiaries. |
INDEPENDENT Trustees Background
Name
Birth Date
Positions Held with Trust
Date Service Began | Principal Occupation(s) for Past Five Years,
Other Directorships Held, Previous Position(s) and Qualifications |
John T. Collins
Birth Date: January 24, 1947
Trustee
Indefinite Term
Began serving: October 2013 | Principal Occupations: Director or Trustee of the Federated Fund Family; formerly, Chairman and CEO, The Collins Group, Inc. (a private equity firm) (Retired).
Other Directorships Held: Director, Current Chair of the Compensation Committee, KLX Corp.
Qualifications: Mr. Collins has served in several business and financial management roles and directorship positions throughout his career. Mr. Collins previously served as Chairman and CEO, The Collins Group, Inc. (a private equity firm). Mr. Collins serves as Chairman Emeriti, Bentley University. Mr. Collins previously served as Director and Audit Committee Member, Bank of America Corp.; Director, FleetBoston Financial Corp.; and Director, Beth Israel Deaconess Medical Center (Harvard University Affiliate Hospital). |
G. Thomas Hough
Birth Date: February 28, 1955
Trustee
Indefinite Term
Began serving: August 2015 | Principal Occupations: Director or Trustee of the Federated Fund Family; formerly, Vice Chair, Ernst & Young LLP (public accounting firm) (Retired).
Other Directorships Held: Director, Chair of the Audit Committee, Governance Committee, Publix Super Markets, Inc.; Director, Member of the Audit Committee and Technology Committee of Equifax, Inc.
Qualifications: Mr. Hough has served in accounting, business management and directorship positions throughout his career. Mr. Hough most recently held the position of Americas Vice Chair of Assurance with Ernst & Young LLP (public accounting firm). Mr. Hough is an Executive Committee member of the United States Golf Association, he serves on the President's Cabinet and Business School Board of Visitors for the University of Alabama and is on the Business School Board of Visitors for Wake Forest University. |
Annual Shareholder Report
Name
Birth Date
Positions Held with Trust
Date Service Began | Principal Occupation(s) for Past Five Years,
Other Directorships Held, Previous Position(s) and Qualifications |
Maureen Lally-Green
Birth Date: July 5, 1949
Trustee
Indefinite Term
Began serving: August 2009 | Principal Occupations: Director or Trustee of the Federated Fund Family; Dean of the Duquesne University School of Law; Professor and Adjunct Professor of Law, Duquesne University School of Law; formerly, Interim Dean of the Duquesne University School of Law; Associate General Secretary and Director, Office of Church Relations, Diocese of Pittsburgh.
Other Directorships Held: Director, CNX Resources Corporation (formerly known as CONSOL Energy Inc.).
Qualifications: Judge Lally-Green has served in various legal and business roles and directorship positions throughout her career. Judge Lally-Green previously served as: Associate General Secretary, Diocese of Pittsburgh; a member of the Superior Court of Pennsylvania; and as a Professor of Law, Duquesne University School of Law. Judge Lally-Green also currently holds the positions on either a public or not for profit Board of Directors as follows: Director and Chair, UPMC Mercy Hospital; Director and Vice Chair, Our Campaign for the Church Alive!, Inc.; Director, Saint Vincent College; Member, Pennsylvania State Board of Education (public); and Director CNX Resources Corporation (formerly known as CONSOL Energy Inc.), where she currently serves as a member of the Compensation, Nominating and Corporate Governance Committee (Chair) and the Health, Safety and Environmental Committee. Judge Lally-Green has held the positions of: Director, Auberle; Director, Epilepsy Foundation of Western and Central Pennsylvania; Director, Ireland Institute of Pittsburgh; Director, Saint Thomas More Society; Director and Chair, Catholic High Schools of the Diocese of Pittsburgh, Inc.; Director, Pennsylvania Bar Institute; Regent, St. Vincent Seminary; and Director and Chair, Cardinal Wuerl North Catholic High School, Inc. |
Charles F. Mansfield, Jr.
Birth Date: April 10, 1945
Trustee
Indefinite Term
Began serving: November 2005 | Principal Occupations: Director or Trustee of the Federated Fund Family; Management Consultant.
Other Directorships Held: None.
Qualifications: Mr. Mansfield has served as a Marine Corps officer and in several banking, business management, educational roles and directorship positions throughout his long career. He remains active as a Management Consultant. |
Thomas M. O'Neill
Birth Date: June 14, 1951
Trustee
Indefinite Term
Began serving: August 2006 | Principal Occupations: Director or Trustee, Chair of the Audit Committee of the Federated Fund Family; Sole Proprietor, Navigator Management Company (investment and strategic consulting).
Other Directorships Held: None.
Qualifications: Mr. O'Neill has served in several business, mutual fund and financial management roles and directorship positions throughout his career. Mr. O'Neill serves as Director, Medicines for Humanity and Director, The Golisano Children's Museum of Naples, Florida. Mr. O'Neill previously served as Chief Executive Officer and President, Managing Director and Chief Investment Officer, Fleet Investment Advisors; President and Chief Executive Officer, Aeltus Investment Management, Inc.; General Partner, Hellman, Jordan Management Co., Boston, MA; Chief Investment Officer, The Putnam Companies, Boston, MA; Credit Analyst and Lending Officer, Fleet Bank; Director and Consultant, EZE Castle Software (investment order management software); and Director, Midway Pacific (lumber). |
P. Jerome Richey
Birth Date: February 23, 1949
Trustee
Indefinite Term
Began serving: October 2013 | Principal Occupations: Director or Trustee of the Federated Fund Family; Management Consultant; formerly, Senior Vice Chancellor and Chief Legal Officer, University of Pittsburgh and Executive Vice President and Chief Legal Officer, CNX Resources Corporation (formerly known as CONSOL Energy Inc.)
Other Directorships Held: None.
Qualifications: Mr. Richey has served in several business and legal management roles and directorship positions throughout his career. Mr. Richey most recently held the positions of Senior Vice Chancellor and Chief Legal Officer, University of Pittsburgh. Mr. Richey previously served as Chairman of the Board, Epilepsy Foundation of Western Pennsylvania and Chairman of the Board, World Affairs Council of Pittsburgh. Mr. Richey previously served as Chief Legal Officer and Executive Vice President, CNX Resources Corporation (formerly known as CONSOL Energy Inc.); and Board Member, Ethics Counsel and Shareholder, Buchanan Ingersoll & Rooney PC (a law firm). |
John S. Walsh
Birth Date: November 28, 1957
Trustee
Indefinite Term
Began serving: November 2005 | Principal Occupations: Director or Trustee, and Chair of the Board of Directors or Trustees, of the Federated Fund Family; President and Director, Heat Wagon, Inc. (manufacturer of construction temporary heaters); President and Director, Manufacturers Products, Inc. (distributor of portable construction heaters); President, Portable Heater Parts, a division of Manufacturers Products, Inc.
Other Directorships Held: None.
Qualifications: Mr. Walsh has served in several business management roles and directorship positions throughout his career. Mr. Walsh previously served as Vice President, Walsh & Kelly, Inc. (paving contractors). |
Annual Shareholder Report
OFFICERS
Name
Birth Date
Address
Positions Held with Trust
Date Service Began | Principal Occupation(s) for Past Five Years
and Previous Position(s) |
Lori A. Hensler
Birth Date: January 6, 1967
TREASURER
Officer since: April 2013 | Principal Occupations: Principal Financial Officer and Treasurer of the Federated Fund Family; Senior Vice President, Federated Administrative Services; Financial and Operations Principal for Federated Securities Corp. and Edgewood Services, Inc.; and Assistant Treasurer, Federated Investors Trust Company. Ms. Hensler has received the Certified Public Accountant designation.
Previous Positions: Controller of Federated Investors, Inc.; Senior Vice President and Assistant Treasurer, Federated Investors Management Company; Treasurer, Federated Investors Trust Company; Assistant Treasurer, Federated Administrative Services, Federated Administrative Services, Inc., Federated Securities Corp., Edgewood Services, Inc., Federated Advisory Services Company, Federated Equity Management Company of Pennsylvania, Federated Global Investment Management Corp., Federated Investment Counseling, Federated Investment Management Company, Passport Research, Ltd., and Federated MDTA, LLC; Financial and Operations Principal for Federated Securities Corp., Edgewood Services, Inc. and Southpointe Distribution Services, Inc. |
Peter J. Germain
Birth Date: September 3, 1959
CHIEF LEGAL OFFICER, SECRETARY and EXECUTIVE VICE PRESIDENT
Officer since: October 2005 | Principal Occupations: Mr. Germain is Chief Legal Officer, Secretary and Executive Vice President of the Federated Fund Family. He is General Counsel, Chief Legal Officer, Secretary and Executive Vice President, Federated Investors, Inc.; Trustee and Senior Vice President, Federated Investors Management Company; Trustee and President, Federated Administrative Services; Director and President, Federated Administrative Services, Inc.; Director and Vice President, Federated Securities Corp.; Director and Secretary, Federated Private Asset Management, Inc.; Secretary, Federated Shareholder Services Company; and Secretary, Retirement Plan Service Company of America. Mr. Germain joined Federated in 1984 and is a member of the Pennsylvania Bar Association.
Previous Positions: Deputy General Counsel, Special Counsel, Managing Director of Mutual Fund Services, Federated Investors, Inc.; Senior Vice President, Federated Services Company; and Senior Corporate Counsel, Federated Investors, Inc. |
Richard B. Fisher
Birth Date: May 17, 1923
VICE CHAIRMAN
Officer since: October 2005 | Principal Occupations: Vice Chairman or Vice President of some of the Funds in the Federated Fund Family; Vice Chairman, Federated Investors, Inc.; Chairman, Federated Securities Corp.
Previous Positions: President and Director or Trustee of some of the Funds in the Federated Fund Family; Executive Vice President, Federated Investors, Inc.; Director and Chief Executive Officer, Federated Securities Corp. |
Stephen Van Meter
Birth Date: June 5, 1975
CHIEF COMPLIANCE OFFICER AND SENIOR VICE PRESIDENT
Officer since: July 2015 | Principal Occupations: Senior Vice President and Chief Compliance Officer of the Federated Fund Family; Vice President and Chief Compliance Officer of Federated Investors, Inc. and Chief Compliance Officer of certain of its subsidiaries. Mr. Van Meter joined Federated in October 2011. He holds FINRA licenses under Series 3, 7, 24 and 66.
Previous Positions: Mr. Van Meter previously held the position of Compliance Operating Officer, Federated Investors, Inc. Prior to joining Federated, Mr. Van Meter served at the United States Securities and Exchange Commission in the positions of Senior Counsel, Office of Chief Counsel, Division of Investment Management and Senior Counsel, Division of Enforcement. |
Robert J. Ostrowski
Birth Date: April 26, 1963
Chief Investment Officer
Officer since: September 2006 | Principal Occupations: Robert J. Ostrowski joined Federated in 1987 as an Investment Analyst and became a Portfolio Manager in 1990. He was named Chief Investment Officer of Federated's taxable fixed-income products in 2004 and also serves as a Senior Portfolio Manager. Mr. Ostrowski became an Executive Vice President of the Fund's Adviser in 2009 and served as a Senior Vice President of the Fund's Adviser from 1997 to 2009. Mr. Ostrowski has received the Chartered Financial Analyst designation. He received his M.S. in Industrial Administration from Carnegie Mellon University. |
Annual Shareholder Report
Evaluation and Approval of Advisory Contract–May 2017
Federated Corporate Bond Strategy Portfolio (the “Fund”)
Following a review and recommendation of approval by the Fund's independent trustees, the Fund's Board of Trustees (the “Board”) reviewed and unanimously approved the continuation of the Fund's investment advisory contract for an additional one-year term at its May 2017 meetings. The Board's decision regarding the contract reflects the exercise of its business judgment after considering all of the information received on whether to continue the existing arrangements. The Fund is distinctive in that it is used to implement particular investment strategies that are offered to investors in certain separately managed or wrap fee accounts or programs, or certain other discretionary investment accounts, and may also be offered to other Federated funds.
Federated Investment Management Company (the “Adviser”) does not charge an investment advisory fee for its services, however, it or its affiliates may receive compensation for managing assets invested in the Fund.
The Board had previously appointed a Senior Officer, whose duties include specified responsibilities relating to the process by which advisory fees are to be charged to a Federated fund. The Senior Officer has the authority to retain consultants, experts, or staff as may be reasonably necessary to assist in the performance of his duties, reports directly to the Board, and may be terminated only with the approval of a majority of the independent members of the Board. The Senior Officer prepared and furnished to the Board an independent, written evaluation that covered topics discussed below (the “Senior Officer's Evaluation”). The Board considered the Senior Officer's Evaluation, along with other information, in deciding to approve the investment advisory contract.
As previously noted, the Adviser does not charge an investment advisory fee to this Fund for its services; however, the Board did consider compensation and benefits received by the Adviser, including fees received for services provided to the Fund by Federated Investors, Inc. and its affiliates (“Federated”) and research services received by the Adviser from brokers that execute Federated fund trades. The Board also considered judicial decisions concerning allegedly excessive investment advisory fees in its decision. Using these judicial decisions as a guide, the Board has indicated that the following factors may be relevant to an adviser's fiduciary duty with respect to its receipt of compensation from a fund: (1) the nature and quality of the services provided by an adviser to a fund and its shareholders (including the performance of the Fund and of comparable funds); (2) an adviser's cost of providing the services (including the profitability to an adviser of providing advisory services to a fund); (3) the extent to which an adviser may realize “economies of scale” as a fund grows larger and, if such economies of scale exist, whether they have been shared with a fund and its shareholders or the family of funds; (4) any “fall-out financial benefits” that accrue to an adviser because of its relationship with a fund (including research services received from brokers that execute fund trades and any fees paid to affiliates of an adviser for services rendered to a fund); (5) comparative fee and expense structures (including a comparison of fees paid to an adviser with those paid by similar funds); and (6) the extent of care, conscientiousness and independence with which the Fund's board members perform their duties and their expertise (including whether they are fully informed about all facts the Board deems relevant to its consideration of the Adviser's services and fees). The Board noted that the Securities and Exchange Commission (“SEC”) disclosure requirements regarding the basis for the Board's approval of the Fund's investment advisory contract generally align with the factors listed above. Consistent with the judicial decisions and SEC disclosure requirements, the Board also considered management fees charged to institutional and other clients of the Adviser and its advisory affiliates for what might be viewed as like services. The Board was aware of these factors and was guided by them in its review of the Fund's investment advisory contract to the extent it considered them to be appropriate and relevant, as discussed further below.
The Board considered and weighed these factors in light of its substantial accumulated experience in governing the Fund and working with Federated on matters relating to the Federated funds. The Board was assisted in its deliberations by independent legal counsel. In addition to the extensive materials that comprise and accompany the Senior Officer's Evaluation, the Board received detailed information about the Fund and the Federated organization throughout the year, and in connection with its May meetings. Federated provided much of this information at each regular meeting of the Board, and furnished additional information in connection with the May meetings at which the Board's formal approval of the investment advisory contract occurred. At the May meetings, in addition to meeting in separate sessions of the independent trustees without management present, senior management of the Adviser also met with the independent trustees and their counsel to discuss the materials presented and any other matters thought relevant by the Adviser or the trustees. Between regularly scheduled meetings, the Board also received information on particular matters as the need arose. The Board's consideration of the investment advisory contract included review of the Senior Officer's Evaluation, accompanying data and additional information covering such matters as: the Adviser's investment philosophy, revenue, profitability, personnel and processes; investment and operating strategies; the Fund's short-term and long-term performance (in absolute terms, both on a gross basis and net of expenses, as well as in terms relative to its particular investment program and certain competitor or “peer group” funds and/or other benchmarks, as appropriate) and comments on the reasons for performance; the Fund's investment objectives; the Fund's expenses, including the advisory fee and the overall expense
Annual Shareholder Report
structure of the Fund (both in absolute terms and relative to similar and/or competing funds), with due regard for contractual or voluntary expense limitations; the use and allocation of brokerage commissions derived from trading the Fund's portfolio securities (if any); and the nature, quality and extent of the advisory and other services provided to the Fund by the Adviser and its affiliates. The Board also considered the preferences and expectations of Fund shareholders; the entrepreneurial risk assumed by the Adviser in sponsoring the Fund; the continuing state of competition in the mutual fund industry and market practices; the range of comparable fees for similar funds in the mutual fund industry; the Fund's relationship to the Federated funds which include a comprehensive array of funds with different investment objectives, policies and strategies which are generally available for exchange without the incurrence of additional sales charges; compliance and audit reports concerning the Federated funds and the Federated companies that service them (including communications from regulatory agencies), as well as Federated's responses to any issues raised therein; and relevant developments in the mutual fund industry and how the Federated funds and/or Federated are responding to them. The Board's evaluation process is evolutionary. The criteria considered and the emphasis placed on relevant criteria change in recognition of changing circumstances in the mutual fund marketplace.
The Board considered the nature, extent and quality of the services provided to the Fund by the Adviser and the resources of the Adviser and its affiliates dedicated to the Fund. In this regard, the Board evaluated, among other things, the Adviser's personnel, experience, track record, overall reputation and willingness to invest in personnel and infrastructure that benefit the Fund. In addition, the Board reviewed the qualifications, backgrounds and responsibilities of the portfolio management team primarily responsible for the day-to-day management of the Fund. The Board noted the compliance programs of, and the compliance-related resources provided to, the Fund by the Adviser. The Fund's ability to deliver competitive performance when compared to its benchmark index was also deemed to be relevant by the Board as a useful indicator of how the Adviser is executing the Fund's investment program. The Adviser's ability to execute this program was one of the Board's considerations in reaching a conclusion that the nature, extent and quality of the Adviser's investment management services warrant the continuation of the investment advisory contract.
The Board was informed by the Adviser that, for the periods covered by the Senior Officer's Evaluation, the Fund outperformed its benchmark index for the one-year, three-year and five-year periods.
Following such evaluation, and full deliberations, the Board concluded that the performance of the Fund supported renewal of the Fund's investment advisory contract.
Because the Adviser does not charge the Fund an investment advisory fee, the Board does not consider fee comparisons to other mutual funds or other institutional or separate accounts to be relevant to its deliberations.
The Board also received financial information about Federated, including information regarding the compensation and ancillary (or “fall-out”) benefits Federated derived from its relationships with the Federated funds. As the Adviser does not charge an investment advisory fee for its services, this information generally covered fees received by Federated's subsidiaries for providing other services to the Federated funds under separate contracts (e.g., for serving as the Federated funds' administrator). The information also detailed any indirect benefit Federated may derive from its receipt of research services from brokers who execute Federated fund trades. In addition, the Board considered the fact that, in order for a fund to be competitive in the marketplace, Federated and its affiliates frequently waived fees and/or reimbursed expenses and have disclosed to fund investors and/or indicated to the Board their intention to do so in the future. Moreover, the Board receives regular reporting as to the institution, adjustment or elimination of these voluntary waivers. The Board considered Federated's previous reductions in contractual management fees to certain funds in response to the Senior Officer's recommendations.
The Board and the Senior Officer also reviewed information compiled by Federated comparing its profitability information to other publicly held fund management companies. In this regard, the Senior Officer concluded that Federated's profit margins did not appear to be excessive. The Senior Officer also noted that Federated appeared financially sound, with the resources to fulfill its obligations under its contracts with the Fund.
While the Senior Officer noted certain items for follow-up reporting to the Board and further consideration by management, he stated that his observations and information accompanying the Senior Officer's Evaluation supported a finding by the Board that the management fee for the Fund was reasonable. Under these circumstances, no changes were recommended to, and no objection was raised to, the continuation of the Fund's investment advisory contract.
The Board based its decision to approve the investment advisory contract on the totality of the circumstances and relevant factors and with a view to past and future long-term considerations. Not all of the factors and considerations identified above were necessarily relevant to the Fund, nor did the Board consider any one of them to be determinative. In particular, due to the unusual nature of the Fund as primarily an internal product with no advisory fee, the Board does not consider the assessment of whether economies of scale would be realized if the Fund were to grow to a sufficient size to be particularly relevant. With respect to the factors that were relevant, the Board's decision to approve the continuation of the contract reflects its determination that Federated's performance and actions provided a satisfactory basis to support the decision to continue the existing arrangement.
Annual Shareholder Report
Voting Proxies on Fund Portfolio Securities
A description of the policies and procedures that the Fund uses to determine how to vote proxies, if any, relating to securities held in the Fund's portfolio, as well as a report on “Form N-PX” of how the Fund voted any such proxies during the most recent 12-month period ended June 30, are available, without charge and upon request, by calling 1-800-341-7400. A report on “Form N-PX” of how the Fund voted any such proxies during the most recent 12-month period ended June 30 is available via the Proxy Voting Record (Form N-PX) link associated with the Fund at www.FederatedInvestors.com under the “Managed Accounts” section of the “Products” tab. Click on the appropriate asset class or category under “Find Managed Accounts,” where you will be directed to create a password and login to access this information. After you have logged in, select a product name, then click on the “MAPs” link under “Managed Account Pools,” and select the Fund under “Managed Account Pools Available” to access the “Literature” tab. Form N-PX filings are also available at the SEC's website at www.sec.gov.
Quarterly Portfolio Schedule
The Fund files with the SEC a complete schedule of its portfolio holdings, as of the close of the first and third quarters of its fiscal year, on “Form N-Q.” These filings are available on the SEC's website at www.sec.gov and may be reviewed and copied at the SEC's Public Reference Room in Washington, DC. (Call 1-800-SEC-0330 for information on the operation of the Public Reference Room.) You may also access this information at www.FederatedInvestors.com under the “Managed Accounts” section of the “Products” tab. Click on the appropriate asset class or category under “Find Managed Accounts,” where you will be directed to create a password and login to access this information. After you have logged in, select a product name, then click on the “MAPs” link under “Managed Account Pools,” and select the Fund under “Managed Account Pools Available” to access the “Literature” tab.
Annual Shareholder Report
Mutual funds are not bank deposits or obligations, are not guaranteed by any bank and are not insured or guaranteed by the U.S. government, the Federal Deposit Insurance Corporation, the Federal Reserve Board or any other government agency. Investment in mutual funds involves investment risk, including the possible loss of principal.
This Report is authorized for distribution to prospective investors only when preceded or accompanied by the Fund's Prospectus, which contains facts concerning its objective and policies, management fees, expenses and other information.
Federated Corporate Bond Strategy Portfolio
Federated Investors Funds
4000 Ericsson Drive
Warrendale, PA 15086-7561
Contact us at FederatedInvestors.com
or call 1-800-341-7400.
Federated Securities Corp., Distributor
CUSIP 31421P100
36217 (2/18)
Federated is a registered trademark of Federated Investors, Inc.
2018 ©Federated Investors, Inc.
Annual Shareholder Report
December 31, 2017
Federated High-Yield Strategy Portfolio
A Portfolio of Federated Managed Pool Series
Not FDIC Insured ■ May Lose Value ■ No Bank Guarantee
CONTENTS
| 1 |
| 1 |
| 4 |
| 5 |
| 7 |
| 8 |
| 9 |
| 10 |
| 11 |
| 15 |
| 16 |
| 17 |
| 17 |
| 20 |
| 21 |
| 34 |
| 35 |
| 36 |
| 37 |
| 38 |
| 42 |
| 43 |
| 44 |
| 44 |
| 48 |
| 51 |
| 51 |
Management's Discussion of Fund Performance (unaudited)
The total return of the Federated High-Yield Strategy Portfolio (the “Fund”), based on net asset value for the 12-month reporting period ended December 31, 2017, was 7.50%. The total return of the Fund's shares consisted of 6.28% current income and 1.22% of appreciation in the net asset value of the Fund's shares. The total return of the Bloomberg Barclays U.S. Corporate High Yield 2% Issuer Capped Index (BBHY2%ICI),1 a broad-based securities market index, was 7.50% during the same period. The Fund's total return for the most recently completed fiscal year reflected actual cash flows, transaction costs and other expenses which were not reflected in the total return of the BBHY2%ICI.
During the reporting period, the most significant factors affecting the Fund's performance relative to the BBHY2%ICI were: (1) the allocation among industries; and (2) the selection of individual securities.
MARKET OVERVIEW
The total return for the high-yield2 market for the reporting period was attractive on both an absolute as well as a relative basis. For example, the BBHY2%ICI, which returned 7.50% for the period, substantially outperformed the Bloomberg Barclays U.S. Aggregate Bond Index,3 a measure of high-quality bond4 performance, which returned 3.54% for the period. The high-yield market benefited from a global synchronized economic expansion that appeared to be strengthening as 2017 came to a close. This was driven by a business-friendly administration in Washington, accommodative central bank policy outside the U.S., high levels of employment as well as strong levels of business and consumer confidence. These factors led to strong corporate earnings, high levels of cash generation by high-yield companies and declining default rates which supported high-yield bonds. These positive drivers also led to surging equity markets increasing the overall enterprise value for corporations. From a macro standpoint, the December 2017 passage of tax reform legislation would seem to be another factor to add to the long list of items positively impacting U.S. economic growth and corporate earnings. The impact of these factors can be seen in the spread between high-yield bonds and U.S. Treasury securities with comparable maturities which, according to the Credit Suisse High Yield Bond Index,5 began the reporting period at 472 basis points and ended the reporting period at 394 basis points.
Within the high-yield market, major industry sectors that substantially outperformed the overall BBHY2%ICI during the reporting period included: Pharmaceuticals, Transportation Services, Banking, Electric Utilities and Diversified Manufacturing. Major industry sectors that substantially underperformed the overall BBHY2%ICI during the reporting period included: Wireline Telecommunications, Retail, Consumer Products, Wireless Telecommunications and Media & Entertainment. From a credit quality perspective, the “CCC”-rated sector returned 10.38% while the “BB”-rated and “B”-rated sectors returned 7.32% and 6.48%, respectively, during the reporting period.
Sector Allocation
The Fund was positively affected by its sector allocation during the reporting period. This was mainly a result of its substantial underweight position in the poor-performing Wireline Telecommunications industry sector. However, this was partially offset by the Fund's cash holdings and its underweight position in the strong-performing Banking sector. Additionally, an overweight position in the strong-performing Pharmaceutical sector and an underweight position in the poor-performing Retail sector helped to offset some of the poor security selection in these two sectors.
Annual Shareholder Report
Security Selection
Overall, the Fund was negatively affected by its security selection during the period. This was especially true in the Retail, Consumer Products, Pharmaceutical, Midstream and Chemicals industry sectors. Specific high-yield issuers held by the Fund that negatively impacted performance relative to the BBHY2%ICI included: FGI Operating Co., PetSmart, Mallinckrodt, Northern Oil & Gas and Jaguar Holdings.
Offsetting some of the negative impact of security selection in certain industry sectors, the Fund was positively impacted during the reporting period by security selection in the Healthcare, Cable & Satellite, Automotive, Wireless Telecommunications, Packaging, Metals and the Media & Entertainment industry sectors. Specific high-yield issuers held by the Fund that positively impacted performance relative to the BBHY2%ICI included: Intelsat, Ortho-Clinical Diagnostics, Valeant Pharmaceutical, Digicel Group and Freeport-McMoRan.
| 1 | Please see the footnotes to the line graphs below for definitions of, and further information about, the BBHY2%ICI. |
| 2 | High-yield, lower-rated securities generally entail greater market, credit and liquidity risks than investment-grade securities and may include higher volatility and a higher risk of default. |
| 3 | The Bloomberg Barclays U.S. Aggregate Bond Index is a broad-based index that measures the investment grade, U.S. dollar-denominated, fixed-rate taxable bond market.* |
| 4 | Bond prices are sensitive to changes in interest rates, and a rise in interest rates can cause a decline in their prices. |
| 5 | Credit Suisse High Yield Bond Index serves as a benchmark to evaluate the performance of low-quality bonds. Low-quality is defined as those bonds in the range from “BB” to “CCC” and defaults.* |
| * | The index is unmanaged, and it is not possible to invest directly in an index. |
Annual Shareholder Report
FUND PERFORMANCE AND GROWTH OF A $10,000 INVESTMENT
The graph below illustrates the hypothetical investment of $10,0001 in the Federated High-Yield Strategy Portfolio from December 24, 2008 (start of performance) to December 31, 2017, compared to the Bloomberg Barclays U.S. Corporate High Yield 2% Issuer Capped Index (BBHY2%ICI).2 The Average Annual Total Return table below shows returns averaged over the stated periods.
Growth of a $10,000 Investment
Growth of $10,000 as of December 31, 2017
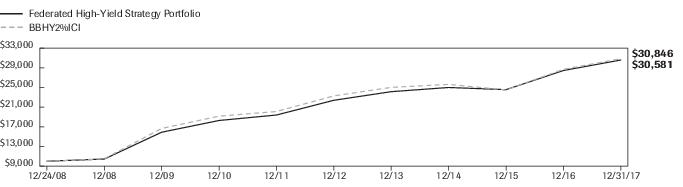
| Federated High-Yield Strategy Portfolio | | NA | BBHY2%ICI |
| F | NA | I |
| 12/24/2008 | 10,000 | | 10,000 |
| 12/31/2008 | 10,448 | | 10,501 |
| 12/31/2009 | 15,901 | | 16,672 |
| 12/31/2010 | 18,285 | | 19,163 |
| 12/31/2011 | 19,399 | | 20,113 |
| 12/31/2012 | 22,393 | | 23,286 |
| 12/31/2013 | 24,145 | | 25,018 |
| 12/31/2014 | 24,996 | | 25,633 |
| 12/31/2015 | 24,555 | | 24,497 |
| 12/31/2016 | 28,448 | | 28,693 |
| 12/31/2017 | 30,581 | | 30,846 |
41 graphic description end -->
Average Annual Total Returns for the Period Ended 12/31/2017
| | 1 Year | 5 Years | Start of
Performance* |
| Fund | 7.50% | 6.43% | 13.19% |
| BBHY2%ICI | 7.50% | 5.78% | 13.31% |
| * | The Fund's start of performance date was December 24, 2008. |
Performance data quoted represents past performance which is no guarantee of future results. Investment return and principal value will fluctuate so that an investor's shares, when redeemed, may be worth more or less than their original cost. Mutual fund performance changes over time and current performance may be lower or higher than what is stated. For current to the most recent month-end performance and after-tax returns, call 1-800-341-7400. Returns shown do not reflect the deduction of taxes that a shareholder would pay on Fund distributions or the redemption of Fund shares. Mutual funds are not obligations of or guaranteed by any bank and are not federally insured.
| 1 | The Fund's performance assumes the reinvestment of all dividends and distributions. The BBHY2%ICI has been adjusted to reflect reinvestment of dividends on securities in the index. |
| 2 | The BBHY2%ICI is an issuer-constrained version of the Bloomberg Barclays U.S. Corporate High-Yield Index that measures the market of USD-denominated, noninvestment-grade, fixed-rate, taxable corporate bonds. The index follows the same rules as the uncapped index but limits the exposure of each issuer to 2% of the total market value and redistributes any excess market value index-wide on a pro-rata basis. The BBHY2%ICI is not adjusted to reflect sales charges, expenses or other fees that the Securities and Exchange Commission requires to be reflected in the Fund's performance. The index is unmanaged and unlike the Fund, is not affected by cash flows. It is not possible to invest directly in an index. |
Annual Shareholder Report
Portfolio of Investments Summary Table (unaudited)
At December 31, 2017, the Fund's index classification1 was as follows:
| Index Classification | Percentage of
Total Net Assets2 |
| Health Care | 10.3% |
| Technology | 9.6% |
| Cable Satellite | 8.2% |
| Packaging | 6.4% |
| Independent Energy | 5.9% |
| Media Entertainment | 5.6% |
| Midstream | 5.4% |
| Wireless Communications | 4.2% |
| Gaming | 3.9% |
| Pharmaceuticals | 3.9% |
| Metals & Mining | 2.5% |
| Other3 | 29.8% |
| Cash Equivalents4 | 4.0% |
| Other Assets and Liabilities—Net5 | 0.3% |
| TOTAL | 100.0% |
| 1 | Index classifications are based upon, and individual portfolio securities are assigned to, the classifications and sub-classifications of the Bloomberg Barclays U.S. Corporate High Yield 2% Issuer Capped Index (BBHY2%ICI). Individual portfolio securities that are not included in the BBHY2%ICI are assigned to an index classification by the Fund's Adviser. |
| 2 | As of the date specified above, the Fund owned shares of an affiliated investment company. For purposes of this table, the affiliated investment company is not treated as a single portfolio security, but rather the Fund is treated as owning a pro rata portion of each security and each other asset and liability owned by the affiliated investment company. Accordingly, the percentages of total net assets shown in the table will differ from those presented on the Portfolio of Investments. |
| 3 | For purposes of this table, index classifications which constitute less than 2.5% of the Fund's total net assets have been aggregated under the designation “Other.” |
| 4 | Cash Equivalents include any investments in money market mutual funds and/or overnight repurchase agreements. |
| 5 | Assets, other than investments in securities, less liabilities. See Statement of Assets and Liabilities. |
Annual Shareholder Report
Portfolio of Investments
December 31, 2017
Principal
Amount
or Shares | | | Value |
| | | INVESTMENT COMPANY—100.2% | |
| | | Diversified—100.2% | |
| 6,541,012 | 1 | High Yield Bond Portfolio
(IDENTIFIED COST $42,816,259) | $41,862,475 |
| | | REPURCHASE AGREEMENT—0.8% | |
| $311,000 | | Interest in $950,000,000 joint repurchase agreement 1.42%, dated 12/29/2017 under which Bank of America, N.A. will repurchase securities provided as collateral for $950,149,889 on 1/2/2018. The securities provided as collateral at the end of the period held with BNY Mellon as tri-party agent, were U.S. Government Agency securities maturing on 7/20/2046 and the market value of those underlying securities was $969,152,887.
(IDENTIFIED COST $311,000) | 311,000 |
| | | TOTAL INVESTMENT IN SECURITIES—101.0%
(IDENTIFIED COST $43,127,259)2 | 42,173,475 |
| | | OTHER ASSETS AND LIABILITIES - NET—(1.0)%3 | (404,803) |
| | | TOTAL NET ASSETS—100% | $41,768,672 |
| 1 | Due to this affiliated holding representing greater than 75% of the Fund's total net assets, a copy of the affiliated holding's most recent Annual Report is included with this Report. |
Affiliated fund holdings are investment companies which are managed by the Federated Investment Management Company (the “Adviser”) or an affiliate of the Adviser. Transactions with affiliated fund holdings during the year ended December 31, 2017, were as follows:
| | High Yield
Bond Portfolio |
| Balance of Shares Held 12/31/2016 | 6,039,739 |
| Purchases/Additions | 1,485,599 |
| Sales/Reductions | (984,326) |
| Balance of Shares Held 12/31/2017 | 6,541,012 |
| Value | $41,862,475 |
| Change in Unrealized Appreciation/Depreciation | $620,841 |
| Net Realized Gain/(Loss) | $(160,827) |
| Dividend Income | $2,501,289 |
The Fund invests in High Yield Bond Portfolio (HYCORE), a portfolio of Federated Core Trust (“Core Trust”) which is managed by the Adviser. Core Trust is an open-end management investment company, registered under the Investment Company Act of 1940, as amended (the “Act”), available only to registered investment companies and other institutional investors. The investment objective of HYCORE is to seek high current income. Federated receives no advisory or administrative fees from HYCORE. Income distributions from HYCORE are declared daily and paid monthly. All income distributions are recorded by the Fund as dividend income. Capital gain distributions of HYCORE, if any, are declared and paid annually, and are recorded by the Fund as capital gains received. At December 31, 2017, HYCORE represents 100.2% of the Fund's net assets. Therefore, the performance of the Fund is directly affected by the performance of HYCORE. To illustrate the security holdings, financial condition, results of operations and changes in net assets of HYCORE, its financial statements are included within this report. The financial statements of HYCORE should be read in conjunction with the Fund's financial statements. The valuation of securities held by HYCORE is discussed in the notes to its financial statements.
| 2 | The cost of investments for federal tax purposes amounts to $43,309,739. |
| 3 | Assets, other than investments in securities, less liabilities. See Statement of Assets and Liabilities. |
Note: The categories of investments are shown as a percentage of total net assets at December 31, 2017.
Annual Shareholder Report
Various inputs are used in determining the value of the Fund's investments. These inputs are summarized in the three broad levels listed below:
Level 1—quoted prices in active markets for identical securities.
Level 2—other significant observable inputs (including quoted prices for similar securities, interest rates, prepayment speeds, credit risk, etc.). Also includes securities valued at amortized cost.
Level 3—significant unobservable inputs (including the Fund's own assumptions in determining the fair value of investments).
The inputs or methodology used for valuing securities are not an indication of the risk associated with investing in those securities.
As of December 31, 2017, all investments of the Fund excluding the Investment Company utilized Level 2 inputs in valuing the Fund's assets carried at fair value. As permitted by U.S. generally accepted accounting principles (GAAP), the Investment Company valued at $41,862,475 is measured at fair value using the net asset value (NAV) per share practical expedient. The price of shares redeemed in this Investment Company is the next determined NAV after receipt of a shareholder redemption request.
See Notes which are an integral part of the Financial Statements
Annual Shareholder Report
Financial Highlights
(For a Share Outstanding Throughout Each Period)
| Year Ended December 31 | 2017 | 2016 | 2015 | 2014 | 2013 |
| Net Asset Value, Beginning of Period | $13.15 | $12.13 | $13.35 | $13.92 | $14.05 |
| Income From Investment Operations: | | | | | |
| Net investment income | 0.80 | 0.83 | 0.86 | 0.93 | 1.06 |
| Net realized and unrealized gain (loss) on investments | 0.16 | 1.04 | (1.06) | (0.44) | 0.001 |
| TOTAL FROM INVESTMENT OPERATIONS | 0.96 | 1.87 | (0.20) | 0.49 | 1.06 |
| Less Distributions: | | | | | |
| Distributions from net investment income | (0.80) | (0.83) | (0.87) | (0.92) | (1.06) |
| Distributions from net realized gain on investments | (0.02) | (0.02) | (0.15) | (0.14) | (0.13) |
| TOTAL DISTRIBUTIONS | (0.82) | (0.85) | (1.02) | (1.06) | (1.19) |
| Net Asset Value, End of Period | $13.29 | $13.15 | $12.13 | $13.35 | $13.92 |
| Total Return2 | 7.50% | 15.85% | (1.76)% | 3.52% | 7.83% |
| Ratios to Average Net Assets: | | | | | |
| Net expenses3 | 0.00% | 0.00% | 0.00% | 0.00% | 0.00% |
| Net investment income | 6.02% | 6.52% | 6.57% | 6.76% | 7.41% |
| Expense waiver/reimbursement4 | 0.41% | 0.46% | 0.49% | 0.61% | 0.77% |
| Supplemental Data: | | | | | |
| Net assets, end of period (000 omitted) | $41,769 | $38,324 | $35,258 | $29,735 | $22,695 |
| Portfolio turnover | 15% | 20% | 25% | 24% | 20% |
| 1 | Represents less than $0.01. |
| 2 | Based on net asset value. |
| 3 | The Adviser has contractually agreed to reimburse all expenses of the Fund, excluding extraordinary expenses. |
| 4 | This expense decrease is reflected in both the net expense and the net investment income ratios shown above. |
See Notes which are an integral part of the Financial Statements
Annual Shareholder Report
Statement of Assets and Liabilities
December 31, 2017
| Assets: | | |
| Investment in securities, at value including $41,862,475 of investment in an affiliated holding (identified cost $43,127,259) | | $42,173,475 |
| Cash | | 952 |
| Income receivable | | 207,462 |
| Receivable for investments sold | | 100,000 |
| Receivable for shares sold | | 1,018 |
| TOTAL ASSETS | | 42,482,907 |
| Liabilities: | | |
| Payable for investments purchased | $207,425 | |
| Payable for shares redeemed | 243,348 | |
| Income distribution payable | 202,316 | |
| Payable to adviser (Note 5) | 343 | |
| Payable for administrative fees (Note 5) | 277 | |
| Payable for auditing fees | 27,740 | |
| Accrued expenses (Note 5) | 32,786 | |
| TOTAL LIABILITIES | | 714,235 |
| Net assets for 3,143,325 shares outstanding | | $41,768,672 |
| Net Assets Consist of: | | |
| Paid-in capital | | $42,967,353 |
| Net unrealized depreciation of investments | | (953,784) |
| Accumulated net realized loss on investments | | (245,455) |
| Undistributed net investment income | | 558 |
| TOTAL NET ASSETS | | $41,768,672 |
| Net Asset Value, Offering Price and Redemption Proceeds Per Share: | | |
| $41,768,672 ÷ 3,143,325 shares outstanding, no par value, unlimited shares authorized | | $13.29 |
See Notes which are an integral part of the Financial Statements
Annual Shareholder Report
Statement of Operations
Year Ended December 31, 2017
| Investment Income: | | |
| Dividends received from an affiliated holding (see footnotes to Portfolio of Investments) | | $2,501,289 |
| Interest | | 2,310 |
| TOTAL INCOME | | 2,503,599 |
| Expenses: | | |
| Administrative fee (Note 5) | $32,955 | |
| Custodian fees | 4,867 | |
| Transfer agent fee | 5,275 | |
| Directors'/Trustees' fees (Note 5) | 1,742 | |
| Auditing fees | 27,740 | |
| Legal fees | 8,584 | |
| Portfolio accounting fees | 44,151 | |
| Share registration costs | 21,440 | |
| Printing and postage | 17,919 | |
| Miscellaneous (Note 5) | 5,074 | |
| TOTAL EXPENSES | 169,747 | |
| Reimbursement of other operating expenses (Notes 2 and 5) | (169,747) | |
| Net expenses | | — |
| Net investment income | | 2,503,599 |
| Realized and Unrealized Gain (Loss) on Investments: | | |
| Net realized loss on investments in an affiliated holding | | (160,827) |
| Net change in unrealized depreciation on investments in an affiliated holding | | 620,841 |
| Net realized and unrealized gain on investments | | 460,014 |
| Change in net assets resulting from operations | | $2,963,613 |
See Notes which are an integral part of the Financial Statements
Annual Shareholder Report
Statement of Changes in Net Assets
| Year Ended December 31 | 2017 | 2016 |
| Increase (Decrease) in Net Assets | | |
| Operations: | | |
| Net investment income | $2,503,599 | $2,326,294 |
| Net realized gain (loss) on investments | (160,827) | 43,157 |
| Net change in unrealized appreciation/depreciation of investments | 620,841 | 2,855,051 |
| CHANGE IN NET ASSETS RESULTING FROM OPERATIONS | 2,963,613 | 5,224,502 |
| Distributions to Shareholders: | | |
| Distributions from net investment income | (2,504,204) | (2,334,649) |
| Distributions from net realized gain on investments | (74,298) | (50,471) |
| CHANGE IN NET ASSETS RESULTING FROM DISTRIBUTIONS TO SHAREHOLDERS | (2,578,502) | (2,385,120) |
| Share Transactions: | | |
| Proceeds from sale of shares | 11,092,990 | 6,965,406 |
| Net asset value of shares issued to shareholders in payment of distributions declared | 47,635 | 28,234 |
| Cost of shares redeemed | (8,081,287) | (6,766,576) |
| CHANGE IN NET ASSETS RESULTING FROM SHARE TRANSACTIONS | 3,059,338 | 227,064 |
| Change in net assets | 3,444,449 | 3,066,446 |
| Net Assets: | | |
| Beginning of period | 38,324,223 | 35,257,777 |
| End of period (including undistributed net investment income of $558 and $1,163, respectively) | $41,768,672 | $38,324,223 |
See Notes which are an integral part of the Financial Statements
Annual Shareholder Report
Notes to Financial Statements
December 31, 2017
1. ORGANIZATION
Federated Managed Pool Series (the “Trust”) is registered under the Act as an open-end management investment company. The Trust consists of five portfolios. The financial statements included herein are only those of Federated High-Yield Strategy Portfolio (the “Fund”), a non-diversified portfolio. The financial statements of the other portfolios are presented separately. The assets of each portfolio are segregated and a shareholder's interest is limited to the portfolio in which shares are held. Each portfolio pays its own expenses. The investment objective of the Fund is to seek high current income, by investing primarily in a high yield bond mutual fund and in a portfolio of fixed-income securities.
2. SIGNIFICANT ACCOUNTING POLICIES
The following is a summary of significant accounting policies consistently followed by the Fund in the preparation of its financial statements. These policies are in conformity with GAAP.
Investment Valuation
In calculating its NAV, the Fund generally values investments as follows:
| ■ | Shares of other mutual funds or non-exchange-traded investment companies are valued based upon their reported NAVs. |
| ■ | Equity securities listed on an exchange or traded through a regulated market system are valued at their last reported sale price or official closing price in their principal exchange or market. |
| ■ | Fixed-income securities are fair valued using price evaluations provided by a pricing service approved by the Fund's Board of Trustees (the “Trustees”). |
| ■ | Derivative contracts listed on exchanges are valued at their reported settlement or closing price, except that options are valued at the mean of closing bid and asked quotations. |
| ■ | Over-the-counter (OTC) derivative contracts are fair valued using price evaluations provided by a pricing service approved by the Trustees. |
| ■ | For securities that are fair valued in accordance with procedures established by and under the general supervision of the Trustees, certain factors may be considered, such as: the last traded or purchase price of the security, information obtained by contacting the issuer or dealers, analysis of the issuer's financial statements or other available documents, fundamental analytical data, the nature and duration of restrictions on disposition, the movement of the market in which the security is normally traded, public trading in similar securities or derivative contracts of the issuer or comparable issuers, movement of a relevant index, or other factors including but not limited to industry changes and relevant government actions. |
If any price, quotation, price evaluation or other pricing source is not readily available when the NAV is calculated, if the Fund cannot obtain price evaluations from a pricing service or from more than one dealer for an investment within a reasonable period of time as set forth in the Fund's valuation policies and procedures, or if information furnished by a pricing service, in the opinion of the valuation committee (“Valuation Committee”), is deemed not representative of the fair value of such security, the Fund uses the fair value of the investment determined in accordance with the procedures described below. There can be no assurance that the Fund could obtain the fair value assigned to an investment if it sold the investment at approximately the time at which the Fund determines its NAV per share.
Fair Valuation and Significant Events Procedures
The Trustees have ultimate responsibility for determining the fair value of investments for which market quotations are not readily available. The Trustees have appointed a Valuation Committee comprised of officers of the Fund, the Adviser and certain of the Adviser's affiliated companies to assist in determining fair value and in overseeing the calculation of the NAV. The Trustees have also authorized the use of pricing services recommended by the Valuation Committee to provide fair value evaluations of the current value of certain investments for purposes of calculating the NAV. The Valuation Committee employs various methods for reviewing third-party pricing-service evaluations including periodic reviews of third-party pricing services' policies, procedures and valuation methods (including key inputs, methods, models and assumptions), transactional back-testing, comparisons of evaluations of different pricing services, and review of price challenges by the Adviser based on recent market activity. In the event that market quotations and price evaluations are not available for an investment, the Valuation Committee determines the fair value of the investment in accordance with procedures adopted by the Trustees. The Trustees periodically review and approve the fair valuations made by the Valuation Committee and any changes made to the procedures.
Factors considered by pricing services in evaluating an investment include the yields or prices of investments of comparable quality, coupon, maturity, call rights and other potential prepayments, terms and type, reported transactions, indications as to values from dealers and general market conditions. Some pricing services provide a single price evaluation reflecting the bid-side of the market for an investment (a “bid” evaluation). Other pricing services offer both bid evaluations and price evaluations indicative of a price between the prices bid and asked for the investment (a “mid” evaluation). The Fund normally uses bid evaluations for any U.S. Treasury and Agency securities, mortgage-backed securities and municipal securities. The Fund normally uses mid evaluations for any other types of fixed-income securities and any OTC derivative contracts. In the event that market quotations and price evaluations are not available for an investment, the fair value of the investment is determined in accordance with procedures adopted by the Trustees.
Annual Shareholder Report
The Trustees also have adopted procedures requiring an investment to be priced at its fair value whenever the Adviser determines that a significant event affecting the value of the investment has occurred between the time as of which the price of the investment would otherwise be determined and the time as of which the NAV is computed. An event is considered significant if there is both an affirmative expectation that the investment's value will change in response to the event and a reasonable basis for quantifying the resulting change in value. Examples of significant events that may occur after the close of the principal market on which a security is traded, or after the time of a price evaluation provided by a pricing service or a dealer, include:
| ■ | With respect to securities traded principally in foreign markets, significant trends in U.S. equity markets or in the trading of foreign securities index futures contracts; |
| ■ | Political or other developments affecting the economy or markets in which an issuer conducts its operations or its securities are traded; |
| ■ | Announcements concerning matters such as acquisitions, recapitalizations, litigation developments, or a natural disaster affecting the issuer's operations or regulatory changes or market developments affecting the issuer's industry. |
The Trustees have adopted procedures whereby the Valuation Committee uses a pricing service to determine the fair value of equity securities traded principally in foreign markets when the Adviser determines that there has been a significant trend in the U.S. equity markets or in index futures trading. For other significant events, the Fund may seek to obtain more current quotations or price evaluations from alternative pricing sources. If a reliable alternative pricing source is not available, the Fund will determine the fair value of the investment in accordance with the fair valuation procedures approved by the Trustees. The Trustees have ultimate responsibility for any fair valuations made in response to a significant event.
Repurchase Agreements
The Fund may invest in repurchase agreements for short-term liquidity purposes. It is the policy of the Fund to require the other party to a repurchase agreement to transfer to the Fund's custodian or sub-custodian eligible securities or cash with a market value (after transaction costs) at least equal to the repurchase price to be paid under the repurchase agreement. The eligible securities are transferred to accounts with the custodian or sub-custodian in which the Fund holds a “securities entitlement” and exercises “control” as those terms are defined in the Uniform Commercial Code. The Fund has established procedures for monitoring the market value of the transferred securities and requiring the transfer of additional eligible securities if necessary to equal at least the repurchase price. These procedures also allow the other party to require securities to be transferred from the account to the extent that their market value exceeds the repurchase price or in exchange for other eligible securities of equivalent market value.
The insolvency of the other party or other failure to repurchase the securities may delay the disposition of the underlying securities or cause the Fund to receive less than the full repurchase price. Under the terms of the repurchase agreement, any amounts received by the Fund in excess of the repurchase price and related transaction costs must be remitted to the other party.
The Fund may enter into repurchase agreements in which eligible securities are transferred into joint trading accounts maintained by the custodian or sub-custodian for investment companies and other clients advised by the Fund's Adviser and its affiliates. The Fund will participate on a pro rata basis with the other investment companies and clients in its share of the securities transferred under such repurchase agreements and in its share of proceeds from any repurchase or other disposition of such securities.
Investment Income, Gains and Losses, Expenses and Distributions
Investment transactions are accounted for on a trade-date basis. Realized gains and losses from investment transactions are recorded on an identified-cost basis. Interest income and expenses are accrued daily. Dividend income and distributions to shareholders are recorded on the ex-dividend date. Distributions of net investment income, if any, are declared daily and paid monthly. Amortization/accretion of premium and discount is included in investment income. The detail of the total fund expense reimbursement of $169,747 is disclosed in Note 5.
Federal Taxes
It is the Fund's policy to comply with the Subchapter M provision of the Internal Revenue Code and to distribute to shareholders each year substantially all of its income. Accordingly, no provision for federal income tax is necessary. As of and during the year ended December 31, 2017, the Fund did not have a liability for any uncertain tax positions. The Fund recognizes interest and penalties, if any, related to tax liabilities as income tax expense in the Statement of Operations. As of December 31, 2017, tax years 2014 through 2017 remain subject to examination by the Fund's major tax jurisdictions, which include the United States of America and the Commonwealth of Massachusetts.
When-Issued and Delayed-Delivery Transactions
The Fund may engage in when-issued or delayed-delivery transactions. The Fund records when-issued securities on the trade date and maintains security positions such that sufficient liquid assets will be available to make payment for the securities purchased. Securities purchased on a when-issued or delayed-delivery basis are marked to market daily and begin earning interest on the settlement date. Losses may occur on these transactions due to changes in market conditions or the failure of counterparties to perform under the contract.
Other
The preparation of financial statements in conformity with GAAP requires management to make estimates and assumptions that affect the amounts of assets, liabilities, expenses and revenues reported in the financial statements. Actual results could differ from those estimated. The Fund applies investment company accounting and reporting guidance.
Annual Shareholder Report
3. SHARES OF BENEFICIAL INTEREST
The following table summarizes share activity:
| Year Ended December 31 | 2017 | 2016 |
| Shares sold | 830,483 | 547,775 |
| Shares issued to shareholders in payment of distributions declared | 3,559 | 2,204 |
| Shares redeemed | (605,966) | (540,700) |
| NET CHANGE RESULTING FROM FUND SHARE TRANSACTIONS | 228,076 | 9,279 |
4. FEDERAL TAX INFORMATION
The tax character of distributions as reported on the Statement of Changes in Net Assets for the years ended December 31, 2017 and 2016, was as follows:
| | 2017 | 2016 |
| Ordinary income1 | $2,534,311 | $2,385,120 |
| Long-term capital gains | $44,191 | $— |
| 1 | For tax purposes, short-term capital gain distributions are considered ordinary income distributions. |
As of December 31, 2017, the components of distributable earnings on a tax-basis were as follows:
| Undistributed ordinary income | $558 |
| Net unrealized depreciation | $(1,136,264) |
| Capital loss deferrals | $(62,975) |
The difference between book-basis and tax-basis net unrealized appreciation/depreciation is attributable to differing treatments for deferral of losses on wash sales.
At December 31, 2017, the cost of investments for federal tax purposes was $43,309,739. The net unrealized depreciation of investments for federal tax purposes was $1,136,264. This consists entirely of net unrealized depreciation from investments for those securities having an excess of cost over value of $1,136,264.
Under current tax rules, capital losses on securities transactions and foreign currency losses realized after October 31 may be deferred, in whole or in part, and treated as occurring on the first day of the following fiscal year. As of December 31, 2017, for federal income tax purposes, post October losses of $62,975 were deferred to January 1, 2018.
5. INVESTMENT ADVISER FEE AND OTHER TRANSACTIONS WITH AFFILIATES
Investment Adviser Fee
The Adviser provides investment adviser services at no fee because all eligible investors are: (1) in separately managed or wrap fee programs, who often pay a single aggregate fee to the wrap program sponsor for all costs and expenses of the wrap fee programs; or (2) in certain other separately managed accounts and discretionary investment accounts. The Adviser has contractually agreed to reimburse all expenses of the Fund, excluding extraordinary expenses. Acquired fund fees and expenses are not direct obligations of the Fund and are not contractual reimbursements under the investment advisory contract. For the year ended December 31, 2017, the Adviser reimbursed $169,747 of other operating expenses.
Administrative Fee
Federated Administrative Services (FAS), under the Administrative Services Agreement, provides the Fund with administrative personnel and services. For purposes of determining the appropriate rate breakpoint, “Investment Complex” is defined as all of the Federated Funds subject to a fee under the Administrative Services Agreement. The fee paid to FAS is based on the average daily net assets of the Investment Complex as specified below:
| Administrative Fee | Average Daily Net Assets
of the Investment Complex |
| 0.100% | on assets up to $50 billion |
| 0.075% | on assets over $50 billion |
Subject to the terms described in the Expense Limitation note, FAS may voluntarily choose to waive any portion of its fee. For the year ended December 31, 2017, the annualized fee paid to FAS was 0.079% of average daily net assets of the Fund.
Annual Shareholder Report
Prior to September 1, 2017, the breakpoints of the Administrative Fee paid to FAS, described above, were:
| Administrative Fee | Average Daily Net Assets
of the Investment Complex |
| 0.150% | on the first $5 billion |
| 0.125% | on the next $5 billion |
| 0.100% | on the next $10 billion |
| 0.075% | on assets in excess of $20 billion |
In addition, FAS may charge certain out-of-pocket expenses to the Fund.
Directors'/Trustees' and Miscellaneous Fees
Certain Officers and Trustees of the Fund are Officers and Directors or Trustees of certain of the above companies. To efficiently facilitate payment, Directors'/Trustees' fees and certain expenses related to conducting meetings of the Directors/Trustees and other miscellaneous expenses are paid by an affiliate of the Adviser which in due course are reimbursed by the Fund. These expenses related to conducting meetings of the Directors/Trustees and other miscellaneous expenses may be included in Accrued and Miscellaneous Expenses on the Statement of Assets and Liabilities and Statement of Operations, respectively.
6. INVESTMENT TRANSACTIONS
Purchases and sales of investments, excluding long-term U.S. government securities and short-term obligations, for the year ended December 31, 2017, were as follows:
| Purchases | $9,544,313 |
| Sales | $6,313,000 |
7. LINE OF CREDIT
The Fund participates with certain other Federated Funds, on a several basis, in an up to $500,000,000 unsecured, 364-day, committed, revolving line of credit (LOC) agreement. The LOC was made available to finance temporarily the repurchase or redemption of shares of the Fund, failed trades, payment of dividends, settlement of trades and for other short-term, temporary or emergency general business purposes. The Fund cannot borrow under the LOC if an inter-fund loan is outstanding. The Fund's ability to borrow under the LOC also is subject to the limitations of the Act and various conditions precedent that must be satisfied before the Fund can borrow. Loans under the LOC are charged interest at a fluctuating rate per annum equal to the highest, on any day, of (a) (i) the federal funds effective rate, (ii) the one month London Interbank Offered Rate (LIBOR), and (iii) 0.0%, plus (b) a margin. The LOC also requires the Fund to pay, quarterly in arrears and at maturity, its pro rata share of a commitment fee based on the amount of the lenders' commitment that has not been utilized. As of December 31, 2017, the Fund had no outstanding loans. During the year ended December 31, 2017, the Fund did not utilize the LOC.
8. INTERFUND LENDING
Pursuant to an Exemptive Order issued by the Securities and Exchange Commission (SEC), the Fund, along with other funds advised by subsidiaries of Federated Investors, Inc., may participate in an interfund lending program. This program provides an alternative credit facility allowing the Fund to borrow from other participating affiliated funds. As of December 31, 2017, the fund had no outstanding loans. During the year ended December 31, 2017, the program was not utilized.
9. FEDERAL TAX INFORMATION (UNAUDITED)
For the year ended December 31, 2017, the amount of long-term capital gains designated by the Fund was $44,191.
Annual Shareholder Report
Report of Independent Registered Public Accounting Firm
TO THE SHAREHOLDERS AND THE BOARD OF TRUSTEES OF FEDERATED HIGH-YIELD STRATEGY PORTFOLIO:
Opinion on the Financial Statements
We have audited the accompanying statement of assets and liabilities of Federated High-Yield Strategy Portfolio (the “Fund”) (one of the funds constituting the Federated Managed Pool Series (the “Trust”)), including the portfolio of investments, as of December 31, 2017, and the related statement of operations for the year then ended, the statement of changes in net assets for each of the two years in the period then ended, the financial highlights for each of the five years in the period then ended and the related notes (collectively referred to as the “financial statements”). In our opinion, the financial statements present fairly, in all material respects, the financial position of Federated High-Yield Strategy Portfolio (one of the funds constituting the Federated Managed Pool Series) at December 31, 2017, the results of its operations for the year then ended, the changes in its net assets for each of the two years in the period then ended and its financial highlights for each of the five years in the period then ended, in conformity with U.S. generally accepted accounting principles.
Basis for Opinion
These financial statements are the responsibility of the Trust's management. Our responsibility is to express an opinion on the Fund's financial statements based on our audits. We are a public accounting firm registered with the Public Company Accounting Oversight Board (United States) (“PCAOB”) and are required to be independent with respect to the Trust in accordance with the U.S. federal securities laws and the applicable rules and regulations of the Securities and Exchange Commission and the PCAOB.
We conducted our audits in accordance with standards of the PCAOB. Those standards require that we plan and perform the audit to obtain reasonable assurance about whether the financial statements are free of material misstatement, whether due to error or fraud. The Trust is not required to have, nor were we engaged to perform, an audit of the Trust's internal control over financial reporting. As part of our audits, we are required to obtain an understanding of internal control over financial reporting, but not for the purpose of expressing an opinion on the effectiveness of the Trust's internal control over financial reporting. Accordingly, we express no such opinion.
Our audits included performing procedures to assess the risks of material misstatement of the financial statements, whether due to error or fraud, and performing procedures that respond to those risks. Such procedures included examining, on a test basis, evidence regarding the amounts and disclosures in the financial statements. Our procedures included confirmation of securities owned as of December 31, 2017, by correspondence with the custodian and others or by other appropriate auditing procedures where replies from others were not received. Our audits also included evaluating the accounting principles used and significant estimates made by management, as well as evaluating the overall presentation of the financial statements. We believe that our audits provide a reasonable basis for our opinion.
We have served as the auditor of one or more Federated investment companies since 1979.
Boston, Massachusetts
February 22, 2018
Annual Shareholder Report
Shareholder Expense Example (unaudited)
As a shareholder of the Fund, you incur ongoing costs, including to the extent applicable, management fees, distribution (12b-1) fees and/or other service fees and other Fund expenses. This Example is intended to help you to understand your ongoing costs (in dollars) of investing in the Fund and to compare these costs with the ongoing costs of investing in other mutual funds. It is based on an investment of $1,000 invested at the beginning of the period and held for the entire period from July 1, 2017 to December 31, 2017.
ACTUAL EXPENSES
The first section of the table below provides information about actual account values and actual expenses. You may use the information in this section, together with the amount you invested, to estimate the expenses that you incurred over the period. Simply divide your account value by $1,000 (for example, an $8,600 account value divided by $1,000 = 8.6), then multiply the result by the number in the first section under the heading entitled “Expenses Paid During Period” to estimate the expenses attributable to your investment during this period.
HYPOTHETICAL EXAMPLE FOR COMPARISON PURPOSES
The second section of the table below provides information about hypothetical account values and hypothetical expenses based on the Fund's actual expense ratio and an assumed rate of return of 5% per year before expenses, which is not the Fund's actual return. Thus, you should not use the hypothetical account values and expenses to estimate the actual ending account balance or your expenses for the period. Rather, these figures are required to be provided to enable you to compare the ongoing costs of investing in the Fund with other funds. To do so, compare this 5% hypothetical example with the 5% hypothetical examples that appear in the shareholder reports of the other funds.
Please note that the expenses shown in the table are meant to highlight your ongoing costs only. Therefore, the second section of the table is useful in comparing ongoing costs only, and will not help you determine the relative total costs of owning different funds.
| | Beginning
Account Value
7/1/2017 | Ending
Account Value
12/31/2017 | Expenses Paid
During Period1 |
| Actual | $1,000 | $1,022.60 | $0.00 |
| Hypothetical (assuming a 5% return before expenses) | $1,000 | $1,025.20 | $0.00 |
| 1 | Expenses are equal to the Fund's annualized net expense ratio of 0.00%, multiplied by the average account value over the period, multiplied by 184/365 (to reflect the one-half-year period). The Adviser has contractually agreed to reimburse all operating expenses, excluding extraordinary expenses incurred by the Fund.
|
Annual Shareholder Report
Management's Discussion of Fund Performance (unaudited)–
High Yield Bond Portfolio
The total return of the High Yield Bond Portfolio (the “Fund”), based on net asset value for the 12-month reporting period ended December 31, 2017, was 7.55%. The total return of the Fund's shares consisted of 6.28% current income and 1.27% of appreciation in the net asset value of the Fund's shares. The total return of the Bloomberg Barclays U.S. Corporate High Yield 2% Issuer Capped Index (BBHY2%ICI),1 a broad-based securities market index, was 7.50% during the same period. The Fund's total return for the most recently completed fiscal year reflected actual cash flows, transaction costs and other expenses which were not reflected in the total return of the BBHY2%ICI.
During the reporting period, the most significant factors affecting the Fund's performance relative to the BBHY2%ICI were: (1) the allocation among industries; and (2) the selection of individual securities.
MARKET OVERVIEW
The total return for the high-yield2 market for the reporting period was attractive on both an absolute as well as a relative basis. For example, the BBHY2%ICI, which returned 7.50% for the period, substantially outperformed the Bloomberg Barclays U.S. Aggregate Bond Index,3 a measure of high-quality bond4 performance, which returned 3.54% for the period. The high-yield market benefited from a global, synchronized economic expansion that appeared to be strengthening as 2017 came to a close. This was driven by a business-friendly administration in Washington, accommodative central bank policy outside the U.S., high levels of employment as well as strong levels of business and consumer confidence. These factors led to strong corporate earnings, high levels of cash generation by high-yield companies and declining default rates which supported high-yield bonds. These positive drivers also led to surging equity markets increasing the overall enterprise value for corporations. From a macro standpoint, the December 2017 passage of tax reform legislation would seem to be another factor to add to the long list of items positively impacting U.S. economic growth and corporate earnings. The impact of these factors can be seen in the spread between high-yield bonds and U.S. Treasury securities with comparable maturities which according to the Credit Suisse High Yield Bond Index,5 began the reporting period at 472 basis points and ended the reporting period at 394 basis points.
Within the high-yield market, major industry sectors that substantially outperformed the overall BBHY2%ICI during the reporting period included: Pharmaceuticals, Transportation Services, Banking, Electric Utilities and Diversified Manufacturing. Major industry sectors that substantially underperformed the overall BBHY2%ICI during the reporting period included: Wireline Telecommunications, Retail, Consumer Products, Wireless Telecommunications and Media & Entertainment. From a credit quality perspective, the “CCC”-rated sector returned 10.38% while the “BB”-rated and “B”-rated sectors returned 7.32% and 6.48%, respectively, during the reporting period.
Sector Allocation
The Fund was positively affected by its sector allocation during the reporting period. This was mainly a result of its substantial underweight to the poor-performing Wireline Telecommunications industry sector. However, this was partially offset by the Fund's cash holdings and its underweight to the strong-performing Banking sector. Additionally, an overweight to the strong-performing Pharmaceutical sector and an underweight to the poor-performing Retail sector helped to offset some of the poor security selection in these two sectors.
Annual Shareholder Report
Security Selection
Overall, the Fund was negatively affected by its security selection during the period. This was especially true in the Retail, Consumer Products, Pharmaceutical, Midstream and Chemicals industry sectors. Specific high-yield issuers held by the Fund that negatively impacted performance relative to the BBHY2%ICI included: FGI Operating Co., PetSmart, Mallinckrodt, Northern Oil & Gas and Jaguar Holdings.
Offsetting some of the negative impact of security selection in certain industry sectors, the Fund was positively impacted during the reporting period by security selection in the Healthcare, Cable & Satellite, Automotive, Wireless Telecommunications, Packaging, Metals and the Media & Entertainment industry sectors. Specific high-yield issuers held by the Fund that positively impacted performance relative to the BBHY2%ICI included: Intelsat, Ortho-Clinical Diagnostics, Valeant Pharmaceutical, Digicel Group and Freeport-McMoRan.
| 1 | Please see the footnotes to the line graphs below for definitions of, and further information about, the BBHY2%ICI. |
| 2 | High-yield, lower-rated securities generally entail greater market, credit and liquidity risks than investment-grade securities and may include higher volatility and a higher risk of default. |
| 3 | The Bloomberg Barclays U.S. Aggregate Bond Index is a broad-based index that measures the investment grade, U.S. dollar-denominated, fixed-rate taxable bond market.* |
| 4 | Bond prices are sensitive to changes in interest rates, and a rise in interest rates can cause a decline in their prices. |
| 5 | Credit Suisse High Yield Bond Index serves as a benchmark to evaluate the performance of low-quality bonds. Low-quality is defined as those bonds in the range from “BB” to “CCC” and defaults.* |
| * | The index is unmanaged, and it is not possible to invest directly in an index. |
Annual Shareholder Report
FUND PERFORMANCE AND GROWTH OF A $10,000 INVESTMENT
The graph below illustrates the hypothetical investment of $10,0001 in the High Yield Bond Portfolio from December 31, 2007 to December 31, 2017, compared to the Bloomberg Barclays U.S. Corporate High Yield 2% Issuer Capped Index (BBHY2%ICI).2 The Average Annual Total Return table below shows returns averaged over the stated periods.
Growth of a $10,000 Investment
Growth of $10,000 as of December 31, 2017
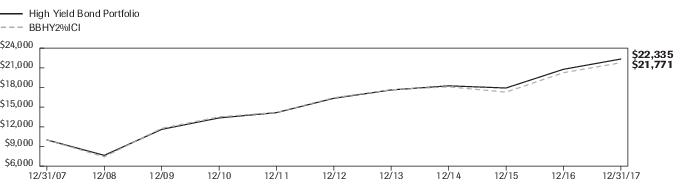
| High Yield Bond Portfolio | | NA | BBHY2%ICI |
| F | NA | I |
| 12/31/2007 | 10,000 | | 10,000 |
| 12/31/2008 | 7,647 | | 7,412 |
| 12/31/2009 | 11,608 | | 11,767 |
| 12/31/2010 | 13,356 | | 13,525 |
| 12/31/2011 | 14,162 | | 14,196 |
| 12/31/2012 | 16,349 | | 16,435 |
| 12/31/2013 | 17,624 | | 17,658 |
| 12/31/2014 | 18,247 | | 18,092 |
| 12/31/2015 | 17,917 | | 17,290 |
| 12/31/2016 | 20,767 | | 20,252 |
| 12/31/2017 | 22,335 | | 21,771 |
41 graphic description end -->
Average Annual Total Returns for the Period Ended 12/31/2017
| | 1 Year | 5 Years | 10 Years |
| Fund | 7.55% | 6.44% | 8.37% |
| BBHY2%ICI | 7.50% | 5.78% | 8.09% |
Performance data quoted represents past performance which is no guarantee of future results. Investment return and principal value will fluctuate so that an investor's shares, when redeemed, may be worth more or less than their original cost. Mutual fund performance changes over time and current performance may be lower or higher than what is stated. For current to the most recent month-end performance and after-tax returns, call 1-800-341-7400. Returns shown do not reflect the deduction of taxes that a shareholder would pay on Fund distributions or the redemption of Fund shares. Mutual funds are not obligations of or guaranteed by any bank and are not federally insured.
| 1 | The Fund's performance assumes the reinvestment of all dividends and distributions. The BBHY2%ICI has been adjusted to reflect reinvestment of dividends on securities in the index. |
| 2 | The BBHY2%ICI is an issuer-constrained version of the Bloomberg Barclays U.S. Corporate High Yield Index that measures the market of USD-denominated, noninvestment-grade, fixed-rate, taxable corporate bonds. The index follows the same rules as the uncapped index but limits the exposure of each issuer to 2% of the total market value and redistributes any excess market value index-wide on a pro-rata basis. The BBHY2%ICI is not adjusted to reflect sales charges, expenses or other fees that the Securities and Exchange Commission requires to be reflected in the Fund's performance. The index is unmanaged and unlike the Fund, is not affected by cash flows. It is not possible to invest directly in an index. |
Annual Shareholder Report
Portfolio of Investments Summary Table (unaudited)–High Yield Bond Portfolio
At December 31, 2017, the Fund's index classification1 was as follows:
| Index Classification | Percentage of
Total Net Assets |
| Health Care | 10.3% |
| Technology | 9.6% |
| Cable Satellite | 8.2% |
| Packaging | 6.4% |
| Independent Energy | 5.9% |
| Media Entertainment | 5.6% |
| Midstream | 5.4% |
| Wireless Communications | 4.2% |
| Gaming | 3.9% |
| Pharmaceuticals | 3.9% |
| Metals & Mining | 2.5% |
| Other2 | 29.8% |
| Cash Equivalents3 | 3.2% |
| Other Assets and Liabilities—Net4 | 1.1% |
| TOTAL | 100.0% |
| 1 | Index classifications are based upon, and individual portfolio securities are assigned to, the classifications and sub-classifications of the Bloomberg Barclays U.S. Corporate High Yield 2% Issuer Capped Index (BBHY2%ICI). Individual portfolio securities that are not included in the BBHY2%ICI are assigned to an index classification by the Fund's Adviser. |
| 2 | For purposes of this table, index classifications which constitute less than 2.5% of the Fund's total net assets have been aggregated under the designation “Other.” |
| 3 | Cash Equivalents include any investments in money market mutual funds and/or overnight repurchase agreements. |
| 4 | Assets, other than investments in securities, less liabilities. See Statement of Assets and Liabilities. |
Annual Shareholder Report
Portfolio of Investments–High Yield Bond Portfolio
December 31, 2017
Principal
Amount
or Shares | | | Value |
| | | CORPORATE BONDS—95.7% | |
| | | Aerospace/Defense—1.1% | |
| $3,750,000 | | Engility Corp., Sr. Unsecd. Note, 8.875%, 9/1/2024 | $4,021,875 |
| 2,950,000 | | TransDigm, Inc., 5.50%, 10/15/2020 | 2,990,563 |
| 8,850,000 | | TransDigm, Inc., Sr. Sub. Note, 6.00%, 7/15/2022 | 9,071,250 |
| 4,475,000 | | TransDigm, Inc., Sr. Sub. Note, 6.50%, 7/15/2024 | 4,598,062 |
| 1,625,000 | | TransDigm, Inc., Sr. Sub. Note, 6.50%, 5/15/2025 | 1,665,625 |
| 1,075,000 | | TransDigm, Inc., Sr. Sub., 6.375%, 6/15/2026 | 1,092,469 |
| | | TOTAL | 23,439,844 |
| | | Automotive—2.2% | |
| 4,825,000 | | Adient Global Holdings Ltd., Sr. Unsecd. Note, Series 144A, 4.875%, 8/15/2026 | 4,981,812 |
| 2,050,000 | | Allison Transmission, Inc., Sr. Unsecd. Note, Series 144A, 5.00%, 10/1/2024 | 2,119,187 |
| 6,125,000 | | American Axle & Manufacturing, Inc., Sr. Unsecd. Note, Series 144A, 6.50%, 4/1/2027 | 6,500,156 |
| 4,350,000 | | BCD Acquisition, Inc., Series 144A, 9.625%, 9/15/2023 | 4,795,875 |
| 5,000,000 | | Dana Financing Lux Sarl, Series 144A, 6.50%, 6/1/2026 | 5,431,250 |
| 1,250,000 | | Dana Financing Lux Sarl, Sr. Unsecd. Note, Series 144A, 5.75%, 4/15/2025 | 1,320,312 |
| 2,400,000 | | Goodyear Tire & Rubber Co., Sr. Unsecd. Note, 4.875%, 3/15/2027 | 2,463,000 |
| 2,600,000 | | Goodyear Tire & Rubber Co., Sr. Unsecd. Note, 5.00%, 5/31/2026 | 2,690,610 |
| 1,000,000 | | Goodyear Tire & Rubber Co., Sr. Unsecd. Note, 5.125%, 11/15/2023 | 1,045,890 |
| 2,025,000 | | J.B. Poindexter & Co., Inc., Sr. Unsecd. Note, Series 144A, 9.00%, 4/1/2022 | 2,106,000 |
| 825,000 | | Schaeffler Verwaltung Zw, Series 144A, 4.50%, 9/15/2023 | 843,051 |
| 6,350,000 | | Schaeffler Verwaltung Zw, Series 144A, 4.75%, 9/15/2026 | 6,461,125 |
| 2,416,000 | | TI Group Auto Systems LLC, Sr. Unsecd. Note, Series 144A, 8.75%, 7/15/2023 | 2,603,240 |
| 575,000 | | Tenneco, Inc., Sr. Unsecd. Note, 5.00%, 7/15/2026 | 590,813 |
| 675,000 | | Tenneco, Inc., Sr. Unsecd. Note, 5.375%, 12/15/2024 | 710,438 |
| 967,000 | | ZF North America Capital, Inc., Series 144A, 4.75%, 4/29/2025 | 1,027,438 |
| | | TOTAL | 45,690,197 |
| | | Banking—0.8% | |
| 7,775,000 | | Ally Financial, Inc., Sr. Sub. Note, 5.75%, 11/20/2025 | 8,503,906 |
| 2,550,000 | | Ally Financial, Inc., Sr. Unsecd. Note, 4.625%, 3/30/2025 | 2,687,063 |
| 4,700,000 | | Ally Financial, Inc., Sr. Unsecd. Note, 5.125%, 9/30/2024 | 5,093,625 |
| | | TOTAL | 16,284,594 |
| | | Building Materials—2.0% | |
| 2,331,000 | | American Builders & Contractors Supply Co., Inc., Series 144A, 5.625%, 4/15/2021 | 2,383,447 |
| 900,000 | | American Builders & Contractors Supply Co., Inc., Sr. Unsecd. Note, Series 144A, 5.75%, 12/15/2023 | 949,500 |
| 2,125,000 | | Beacon Roofing Supply, Inc., 6.375%, 10/1/2023 | 2,271,094 |
| 2,200,000 | | Beacon Roofing Supply, Inc., Sr. Unsecd. Note, Series 144A, 4.875%, 11/1/2025 | 2,219,250 |
| 3,150,000 | | Building Materials Corp. of America, Sr. Unsecd. Note, Series 144A, 6.00%, 10/15/2025 | 3,378,375 |
| 2,275,000 | | CD&R Waterworks Merger Sub LLC, Sr. Unsecd. Note, Series 144A, 6.125%, 8/15/2025 | 2,314,812 |
| 1,800,000 | | HD Supply, Inc., Sr. Unsecd. Note, Series 144A, 5.75%, 4/15/2024 | 1,917,000 |
| 725,000 | | Jeld-Wen, Inc., Sr. Unsecd. Note, Series 144A, 4.625%, 12/15/2025 | 732,250 |
| 675,000 | | Jeld-Wen, Inc., Sr. Unsecd. Note, Series 144A, 4.875%, 12/15/2027 | 683,438 |
| 1,800,000 | | Masonite International Corp., Sr. Unsecd. Note, Series 144A, 5.625%, 3/15/2023 | 1,890,540 |
| 2,375,000 | | NCI Building System, Inc., Sr. Unsecd. Note, Series 144A, 8.25%, 1/15/2023 | 2,520,469 |
| 2,500,000 | | Ply Gem Industries, Inc., 6.50%, 2/1/2022 | 2,593,750 |
| 6,200,000 | | RSI Home Products, Inc., Series 144A, 6.50%, 3/15/2023 | 6,525,500 |
| 7,850,000 | | Standard Industries, Inc., Sr. Unsecd. Note, Series 144A, 5.00%, 2/15/2027 | 8,046,250 |
| 1,425,000 | | USG Corp., Sr. Unsecd. Note, Series 144A, 4.875%, 6/1/2027 | 1,480,646 |
Annual Shareholder Report
Principal
Amount
or Shares | | | Value |
| | | CORPORATE BONDS—continued | |
| | | Building Materials—continued | |
| $1,625,000 | | USG Corp., Sr. Unsecd. Note, Series 144A, 5.50%, 3/1/2025 | $1,732,656 |
| | | TOTAL | 41,638,977 |
| | | Cable Satellite—8.2% | |
| 2,175,000 | | Altice US Finance I Corp., Series 144A, 5.50%, 5/15/2026 | 2,221,219 |
| 5,900,000 | | Altice US Finance I Corp., Sr. Unsecd. Note, Series 144A, 7.75%, 7/15/2025 | 6,342,500 |
| 3,175,000 | | CCO Holdings LLC/Cap Corp., 5.25%, 9/30/2022 | 3,260,328 |
| 5,475,000 | | CCO Holdings LLC/Cap Corp., 5.75%, 9/1/2023 | 5,625,562 |
| 4,450,000 | | CCO Holdings LLC/Cap Corp., Series 144A, 5.375%, 5/1/2025 | 4,596,049 |
| 2,125,000 | | CCO Holdings LLC/Cap Corp., Series 144A, 5.75%, 2/15/2026 | 2,212,656 |
| 1,100,000 | | CCO Holdings LLC/Cap Corp., Sr. Sub. Secd. Note, Series 144A, 5.50%, 5/1/2026 | 1,130,250 |
| 5,850,000 | | CCO Holdings LLC/Cap Corp., Sr. Unsecd. Note, Series 144A, 5.00%, 2/1/2028 | 5,718,375 |
| 1,600,000 | | CCO Holdings LLC/Cap Corp., Sr. Unsecd. Note, Series 144A, 5.125%, 5/1/2027 | 1,580,000 |
| 4,950,000 | | CCO Holdings LLC/Cap Corp., Sr. Unsecd. Note, Series 144A, 5.875%, 5/1/2027 | 5,098,500 |
| 1,925,000 | | CSC Holdings, Inc., Sr. Unsecd. Note, 5.25%, 6/1/2024 | 1,891,313 |
| 4,150,000 | | CSC Holdings, Inc., Sr. Unsecd. Note, Series 144A, 5.50%, 4/15/2027 | 4,243,375 |
| 5,150,000 | | Cablevision Systems Corp., Sr. Unsecd. Note, 5.875%, 9/15/2022 | 5,085,625 |
| 4,675,000 | | Cequel Communications Holdings, Sr. Unsecd. Note, Series 144A, 5.125%, 12/15/2021 | 4,698,375 |
| 2,525,000 | | Cequel Communications Holdings, Sr. Unsecd. Note, Series 144A, 5.125%, 12/15/2021 | 2,537,625 |
| 1,300,000 | | Charter Communications Holdings II, 5.125%, 2/15/2023 | 1,332,500 |
| 2,300,000 | | Charter Communications Holdings II, 5.75%, 1/15/2024 | 2,374,750 |
| 2,425,000 | | DISH DBS Corp., 5.00%, 3/15/2023 | 2,312,844 |
| 6,800,000 | | DISH DBS Corp., 5.875%, 7/15/2022 | 6,859,500 |
| 5,800,000 | | DISH DBS Corp., Sr. Unsecd. Note, 5.875%, 11/15/2024 | 5,662,250 |
| 975,000 | | DISH DBS Corp., Sr. Unsecd. Note, 7.75%, 7/1/2026 | 1,028,625 |
| 275,000 | | Intelsat Jackson Holdings S.A., 7.25%, 10/15/2020 | 259,875 |
| 3,375,000 | | Intelsat Jackson Holdings S.A., Series 144A, 8.00%, 2/15/2024 | 3,560,625 |
| 8,075,000 | | Intelsat Jackson Holdings S.A., Sr. Unsecd. Note, 5.50%, 8/1/2023 | 6,621,500 |
| 7,075,000 | | Intelsat Jackson Holdings S.A., Sr. Unsecd. Note, 7.50%, 4/1/2021 | 6,473,625 |
| 1,975,000 | | Intelsat Jackson Holdings S.A., Sr. Unsecd. Note, Series 144A, 9.75%, 7/15/2025 | 1,905,875 |
| 4,000,000 | | Neptune Finco Corp., Sr. Unsecd. Note, Series 144A, 10.125%, 1/15/2023 | 4,515,000 |
| 4,550,000 | | Neptune Finco Corp., Sr. Unsecd. Note, Series 144A, 6.625%, 10/15/2025 | 4,936,659 |
| 4,525,000 | | Sirius XM Radio, Inc., Series 144A, 4.625%, 5/15/2023 | 4,632,469 |
| 6,950,000 | | Sirius XM Radio, Inc., Series 144A, 6.00%, 7/15/2024 | 7,367,000 |
| 3,250,000 | | Sirius XM Radio, Inc., Sr. Unsecd. Note, Series 144A, 5.375%, 4/15/2025 | 3,392,187 |
| 2,775,000 | | Sirius XM Radio, Inc., Sr. Unsecd. Note, Series 144A, 5.375%, 7/15/2026 | 2,882,531 |
| 8,600,000 | | Telenet Finance Luxembourg, Sec. Fac. Bond, Series 144A, 5.50%, 3/1/2028 | 8,600,000 |
| 8,075,000 | | Unitymedia KabelBW Gmbh, Series 144A, 6.125%, 1/15/2025 | 8,559,500 |
| 7,725,000 | | Virgin Media Secured Finance PLC, Series 144A, 5.25%, 1/15/2026 | 7,831,219 |
| 4,275,000 | | Virgin Media Secured Finance PLC, Series 144A, 6.375%, 4/15/2023 | 4,429,969 |
| 1,250,000 | | Virgin Media, Inc., Sr. Unsecd. Note, Series 144A, 5.75%, 1/15/2025 | 1,279,688 |
| 2,575,000 | | Virgin Media, Inc., Sr. Unsecd. Note, Series 144A, 6.00%, 10/15/2024 | 2,652,250 |
| 6,525,000 | | Ziggo Finance BV, Sec. Fac. Bond, Series 144A, 5.50%, 1/15/2027 | 6,533,156 |
| 2,475,000 | | Ziggo Finance BV, Sr. Unsecd. Note, Series 144A, 5.875%, 1/15/2025 | 2,450,250 |
| 2,625,000 | | Ziggo Finance BV, Sr. Unsecd. Note, Series 144A, 6.00%, 1/15/2027 | 2,565,937 |
| | | TOTAL | 167,261,536 |
| | | Chemicals—2.0% | |
| 5,375,000 | | Alpha 3 BV, Sr. Unsecd. Note, Series 144A, 6.25%, 2/1/2025 | 5,536,250 |
| 5,225,000 | | Compass Minerals International, Inc., Series 144A, 4.875%, 7/15/2024 | 5,172,750 |
| 7,175,000 | | Hexion U.S. Finance Corp., 6.625%, 4/15/2020 | 6,475,437 |
Annual Shareholder Report
Principal
Amount
or Shares | | | Value |
| | | CORPORATE BONDS—continued | |
| | | Chemicals—continued | |
| $2,075,000 | | Koppers, Inc., Sr. Unsecd. Note, Series 144A, 6.00%, 2/15/2025 | $2,204,687 |
| 1,175,000 | | PQ Corp., Series 144A, 6.75%, 11/15/2022 | 1,258,719 |
| 875,000 | | PQ Corp., Sr. Unsecd. Note, Series 144A, 5.75%, 12/15/2025 | 892,500 |
| 1,075,000 | | Platform Specialty Products Corp., Sr. Unsecd. Note, Series 144A, 5.875%, 12/1/2025 | 1,068,281 |
| 15,100,000 | | Platform Specialty Products Corp., Sr. Unsecd. Note, Series 144A, 6.50%, 2/1/2022 | 15,628,500 |
| 1,550,000 | | Versum Materials, Inc., Sr. Unsecd. Note, Series 144A, 5.50%, 9/30/2024 | 1,662,375 |
| 1,125,000 | | WR Grace & Co.- Conn., Sr. Unsecd. Note, Series 144A, 5.625%, 10/1/2024 | 1,217,813 |
| | | TOTAL | 41,117,312 |
| | | Construction Machinery—0.8% | |
| 1,675,000 | | Ritchie Bros. Auctioneers, Inc., Sr. Unsecd. Note, Series 144A, 5.375%, 1/15/2025 | 1,733,625 |
| 5,575,000 | | United Rentals North America, Inc., Sr. Unsecd. Note, 4.875%, 1/15/2028 | 5,616,813 |
| 2,400,000 | | United Rentals, Inc., 4.625%, 7/15/2023 | 2,490,288 |
| 1,600,000 | | United Rentals, Inc., Sr. Unsecd. Note, 5.50%, 5/15/2027 | 1,688,000 |
| 3,000,000 | | United Rentals, Inc., Sr. Unsecd. Note, 5.50%, 7/15/2025 | 3,191,250 |
| 575,000 | | United Rentals, Inc., Sr. Unsecd. Note, 5.875%, 9/15/2026 | 617,406 |
| | | TOTAL | 15,337,382 |
| | | Consumer Cyclical Services—0.7% | |
| 4,325,000 | | GW Honos Security Corp., Sr. Unsecd. Note, Series 144A, 8.75%, 5/15/2025 | 4,660,187 |
| 2,200,000 | | Matthews International Corp., Sr. Unsecd. Note, Series 144A, 5.25%, 12/1/2025 | 2,227,500 |
| 1,775,000 | | ServiceMaster Co. LLC, Sr. Unsecd. Note, 7.10%, 3/1/2018 | 1,796,797 |
| 1,775,000 | | ServiceMaster Co. LLC, Sr. Unsecd. Note, 7.45%, 8/15/2027 | 1,930,313 |
| 4,250,000 | | ServiceMaster Co. LLC, Sr. Unsecd. Note, Series 144A, 5.125%, 11/15/2024 | 4,313,750 |
| | | TOTAL | 14,928,547 |
| | | Consumer Products—1.6% | |
| 3,025,000 | | FGI Operating Co. LLC/FGI Finance, Inc., 7.875%, 5/1/2020 | 688,188 |
| 10,025,000 | | First Quality Finance Co., Inc., Series 144A, 4.625%, 5/15/2021 | 10,150,313 |
| 350,000 | | First Quality Finance Co., Inc., Sr. Unsecd. Note, Series 144A, 5.00%, 7/1/2025 | 357,875 |
| 7,525,000 | | Prestige Brands Holdings, Inc., Series 144A, 5.375%, 12/15/2021 | 7,684,906 |
| 4,300,000 | | Prestige Brands, Inc., Sr. Unsecd. Note, Series 144A, 6.375%, 3/1/2024 | 4,477,375 |
| 400,000 | | Scotts Miracle-Gro Co., Sr. Unsecd. Note, 5.25%, 12/15/2026 | 420,000 |
| 4,400,000 | | Spectrum Brands, Inc., 5.75%, 7/15/2025 | 4,653,000 |
| 1,675,000 | | Spectrum Brands, Inc., 6.125%, 12/15/2024 | 1,781,781 |
| 2,558,000 | | Springs Industries, Inc., 6.25%, 6/1/2021 | 2,615,555 |
| | | TOTAL | 32,828,993 |
| | | Diversified Manufacturing—1.5% | |
| 5,825,000 | | Entegris, Inc., Sr. Unsecd. Note, Series 144A, 4.625%, 2/10/2026 | 5,941,500 |
| 10,625,000 | | Gates Global LLC, Series 144A, 6.00%, 7/15/2022 | 10,917,187 |
| 2,925,000 | | JPW Industries Holding Corp., Sr. Secd. Note, Series 144A, 9.00%, 10/1/2024 | 3,063,938 |
| 10,275,000 | | WESCO Distribution, Inc., Sr. Unsecd. Note, 5.375%, 12/15/2021 | 10,570,406 |
| 550,000 | | WESCO Distribution, Inc., Sr. Unsecd. Note, 5.375%, 6/15/2024 | 567,875 |
| | | TOTAL | 31,060,906 |
| | | Environmental—0.4% | |
| 5,025,000 | | Tervita Escrow Corp., Series 144A, 7.625%, 12/1/2021 | 5,062,688 |
| 2,350,000 | | Wrangler Buyer Corp., Sr. Unsecd. Note, Series 144A, 6.00%, 10/1/2025 | 2,432,250 |
| | | TOTAL | 7,494,938 |
| | | Finance Companies—2.1% | |
| 750,000 | | Navient Corp., Sr. Unsecd. Note, 5.50%, 1/25/2023 | 750,938 |
| 8,025,000 | | Navient Corp., Sr. Unsecd. Note, 5.875%, 10/25/2024 | 8,004,937 |
| 700,000 | | Navient Corp., Sr. Unsecd. Note, 6.50%, 6/15/2022 | 735,175 |
Annual Shareholder Report
Principal
Amount
or Shares | | | Value |
| | | CORPORATE BONDS—continued | |
| | | Finance Companies—continued | |
| $850,000 | | Navient Corp., Sr. Unsecd. Note, 6.75%, 6/25/2025 | $875,500 |
| 3,775,000 | | Navient Corp., Sr. Unsecd. Note, 7.25%, 9/25/2023 | 4,039,250 |
| 1,275,000 | | Navient Corp., Sr. Unsecd. Note, Series MTN, 6.125%, 3/25/2024 | 1,297,313 |
| 1,350,000 | | Park Aerospace Holdings Ltd., Sr. Unsecd. Note, Series 144A, 4.50%, 3/15/2023 | 1,292,625 |
| 1,200,000 | | Park Aerospace Holdings Ltd., Sr. Unsecd. Note, Series 144A, 5.25%, 8/15/2022 | 1,197,000 |
| 12,600,000 | | Park Aerospace Holdings Ltd., Sr. Unsecd. Note, Series 144A, 5.50%, 2/15/2024 | 12,537,000 |
| 10,825,000 | | Quicken Loans, Inc., Series 144A, 5.75%, 5/1/2025 | 11,258,108 |
| 1,550,000 | | Quicken Loans, Inc., Sr. Unsecd. Note, Series 144A, 5.25%, 1/15/2028 | 1,534,035 |
| | | TOTAL | 43,521,881 |
| | | Food & Beverage—2.4% | |
| 7,075,000 | | Anna Merger Sub, Inc., Series 144A, 7.75%, 10/1/2022 | 5,200,125 |
| 50,000 | | Aramark Services, Inc., Sr. Unsecd. Note, 4.75%, 6/1/2026 | 50,875 |
| 4,925,000 | | Aramark Services, Inc., Sr. Unsecd. Note, 5.125%, 1/15/2024 | 5,181,100 |
| 3,125,000 | | Aramark Services, Inc., Sr. Unsecd. Note, Series 144A, 5.00%, 4/1/2025 | 3,308,750 |
| 5,450,000 | | Hearthside Group Holdings LLC, Series 144A, 6.50%, 5/1/2022 | 5,593,062 |
| 3,450,000 | | Lamb Weston Holdings, Inc., Sr. Unsub., Series 144A, 4.875%, 11/1/2026 | 3,613,875 |
| 5,350,000 | | Post Holdings, Inc., Sr. Unsecd. Note, Series 144A, 5.00%, 8/15/2026 | 5,276,437 |
| 1,525,000 | | Post Holdings, Inc., Sr. Unsecd. Note, Series 144A, 5.50%, 3/1/2025 | 1,582,188 |
| 2,325,000 | | Post Holdings, Inc., Sr. Unsecd. Note, Series 144A, 5.625%, 1/15/2028 | 2,336,625 |
| 9,250,000 | | Post Holdings, Inc., Sr. Unsecd. Note, Series 144A, 5.75%, 3/1/2027 | 9,435,000 |
| 6,875,000 | | U.S. Foodservice, Inc., Sr. Unsecd. Note, Series 144A, 5.875%, 6/15/2024 | 7,253,125 |
| | | TOTAL | 48,831,162 |
| | | Gaming—3.9% | |
| 1,025,000 | | Boyd Gaming Corp., Sr. Unsecd. Note, 6.375%, 4/1/2026 | 1,107,000 |
| 5,800,000 | | Boyd Gaming Corp., Sr. Unsecd. Note, 6.875%, 5/15/2023 | 6,169,750 |
| 10,200,000 | | CRC Escrow Issuer LLC, Sr. Unsecd. Note, Series 144A, 5.25%, 10/15/2025 | 10,330,560 |
| 3,150,000 | | Eldorado Resorts, Inc., Sr. Unsecd. Note, 6.00%, 4/1/2025 | 3,307,500 |
| 1,375,000 | | GLP Capital LP/GLP Financing II, Inc., Sr. Unsecd. Note, 5.375%, 4/15/2026 | 1,478,125 |
| 675,000 | | MGM Growth Properties LLC, Sr. Unsecd. Note, 5.625%, 5/1/2024 | 722,250 |
| 3,850,000 | | MGM Mirage, Inc., 7.75%, 3/15/2022 | 4,398,625 |
| 3,200,000 | | MGM Mirage, Inc., Sr. Unsecd. Note, 6.75%, 10/1/2020 | 3,464,000 |
| 2,300,000 | | MGM Resorts International, 6.00%, 3/15/2023 | 2,489,750 |
| 1,575,000 | | MGM Resorts International, Sr. Unsecd. Note, 4.625%, 9/1/2026 | 1,598,625 |
| 5,700,000 | | Mohegan Tribal Gaming Authority, Sr. Unsecd. Note, Series 144A, 7.875%, 10/15/2024 | 5,863,875 |
| 2,375,000 | | Penn National Gaming, Inc., Sr. Unsecd. Note, Series 144A, 5.625%, 1/15/2027 | 2,470,000 |
| 5,800,000 | | Pinnacle Entertainment, Inc., Sr. Unsecd. Note, 5.625%, 5/1/2024 | 6,235,000 |
| 4,975,000 | | Rivers Pittsburgh LP, Series 144A, 6.125%, 8/15/2021 | 4,950,125 |
| 11,725,000 | | Seminole Hard Rock Entertainment, Inc./Seminole Hard Rock International LLC, Series 144A, 5.875%, 5/15/2021 | 11,959,500 |
| 2,385,000 | | Seminole Tribe of Florida, Inc., Bond, Series 144A, 7.804%, 10/1/2020 | 2,420,775 |
| 4,275,000 | | Station Casinos, Inc., Sr. Unsecd. Note, Series 144A, 5.00%, 10/1/2025 | 4,307,062 |
| 3,100,000 | | Sugarhouse HSP Gaming Finance Corp., Sec. Fac. Bond, Series 144A, 5.875%, 5/15/2025 | 2,952,750 |
| 2,250,000 | | Wynn Las Vegas LLC, Sr. Unsecd. Note, Series 144A, 5.25%, 5/15/2027 | 2,283,750 |
| | | TOTAL | 78,509,022 |
| | | Health Care—10.3% | |
| 2,750,000 | | Acadia Healthcare Co., Inc., Sr. Unsecd. Note, 5.625%, 2/15/2023 | 2,805,000 |
| 5,375,000 | | Acadia Healthcare Co., Inc., Sr. Unsecd. Note, 6.50%, 3/1/2024 | 5,616,875 |
| 8,475,000 | | Air Medical Group Holdings, Inc., Sr. Unsecd. Note, Series 144A, 6.375%, 5/15/2023 | 8,178,375 |
| 3,125,000 | | Amsurg Corp., Sr. Unsecd. Note, 5.625%, 7/15/2022 | 3,171,875 |
| 2,100,000 | | Avantor, Inc., Series 144A, 6.00%, 10/1/2024 | 2,097,375 |
Annual Shareholder Report
Principal
Amount
or Shares | | | Value |
| | | CORPORATE BONDS—continued | |
| | | Health Care—continued | |
| $4,800,000 | | Avantor, Inc., Sr. Unsecd. Note, Series 144A, 9.00%, 10/1/2025 | $4,740,000 |
| 2,025,000 | | CHS/Community Health Systems, Inc., 5.125%, 8/1/2021 | 1,832,625 |
| 4,250,000 | | CHS/Community Health Systems, Inc., 6.25%, 3/31/2023 | 3,846,250 |
| 7,525,000 | | CHS/Community Health Systems, Inc., Sr. Unsecd. Note, 6.875%, 2/1/2022 | 4,364,500 |
| 1,950,000 | | DaVita HealthCare Partners, Inc., 5.125%, 7/15/2024 | 1,973,156 |
| 6,025,000 | | Envision Healthcare Holdings, Inc., Series 144A, 5.125%, 7/1/2022 | 5,874,375 |
| 1,925,000 | | HCA, Inc., 4.50%, 2/15/2027 | 1,939,438 |
| 5,100,000 | | HCA, Inc., 4.75%, 5/1/2023 | 5,265,750 |
| 6,025,000 | | HCA, Inc., 5.00%, 3/15/2024 | 6,281,062 |
| 1,325,000 | | HCA, Inc., 5.25%, 6/15/2026 | 1,407,813 |
| 1,925,000 | | HCA, Inc., 5.875%, 2/15/2026 | 2,040,500 |
| 2,300,000 | | HCA, Inc., 5.875%, 5/1/2023 | 2,461,000 |
| 6,675,000 | | HCA, Inc., Sr. Secd. Note, 5.25%, 4/15/2025 | 7,075,500 |
| 10,150,000 | | HCA, Inc., Sr. Unsecd. Note, 5.375%, 2/1/2025 | 10,530,625 |
| 3,600,000 | | HCA, Inc., Sr. Unsecd. Note, 7.50%, 2/15/2022 | 4,059,000 |
| 675,000 | | Hologic, Inc., Sr. Unsecd. Note, Series 144A, 4.375%, 10/15/2025 | 686,813 |
| 3,450,000 | | IMS Health, Inc., Sr. Unsecd. Note, Series 144A, 5.00%, 10/15/2026 | 3,549,187 |
| 1,325,000 | | LifePoint Health, Inc., 5.875%, 12/1/2023 | 1,343,219 |
| 850,000 | | LifePoint Health, Inc., Sr. Unsecd. Note, 5.375%, 5/1/2024 | 846,813 |
| 1,200,000 | | LifePoint Health, Inc., Sr. Unsecd. Note, 5.50%, 12/1/2021 | 1,228,500 |
| 700,000 | | MEDNAX, Inc., Sr. Unsecd. Note, Series 144A, 5.25%, 12/1/2023 | 714,000 |
| 13,525,000 | | MPH Acquisition Holdings LLC, Series 144A, 7.125%, 6/1/2024 | 14,437,937 |
| 4,325,000 | | New Amethyst Corp., Sr. Unsecd. Note, Series 144A, 6.25%, 12/1/2024 | 4,476,375 |
| 19,150,000 | | Ortho-Clinical Diagnostics, Inc., Series 144A, 6.625%, 5/15/2022 | 19,341,500 |
| 5,550,000 | | Polaris Intermediate Corp., Sr. Unsecd. Note, Series 144A, 8.50%, 12/1/2022 | 5,772,000 |
| 10,650,000 | | SteriGenics—Nordion Holdings LLC, Sr. Unsecd. Note, Series 144A, 6.50%, 5/15/2023 | 11,129,250 |
| 5,625,000 | | SteriGenics Nordion Topc, Sr. Unsecd. Note, Series 144A, 8.125%, 11/1/2021 | 5,695,312 |
| 6,275,000 | | Surgery Center Holdings, Inc., Sr. Unsecd. Note, Series 144A, 6.75%, 7/1/2025 | 5,961,250 |
| 12,325,000 | | Team Health Holdings, Inc., Sr. Unsecd. Note, Series 144A, 6.375%, 2/1/2025 | 11,061,687 |
| 1,100,000 | | Teleflex, Inc., Sr. Unsecd. Note, 4.625%, 11/15/2027 | 1,113,530 |
| 775,000 | | Teleflex, Inc., Sr. Unsecd. Note, 4.875%, 6/1/2026 | 804,063 |
| 3,225,000 | | Teleflex, Inc., Sr. Unsecd. Note, 5.25%, 6/15/2024 | 3,378,187 |
| 2,875,000 | | Tenet Healthcare Corp., 8.125%, 4/1/2022 | 2,936,094 |
| 1,125,000 | | Tenet Healthcare Corp., Note, 4.375%, 10/1/2021 | 1,127,813 |
| 4,625,000 | | Tenet Healthcare Corp., Series 144A, 5.125%, 5/1/2025 | 4,526,719 |
| 1,200,000 | | Tenet Healthcare Corp., Series 144A, 7.50%, 1/1/2022 | 1,264,500 |
| 1,450,000 | | Tenet Healthcare Corp., Sr. Secd. Note, 4.50%, 4/1/2021 | 1,464,500 |
| 2,250,000 | | Tenet Healthcare Corp., Sr. Secd. Note, Series 144A, 4.625%, 7/15/2024 | 2,202,188 |
| 5,575,000 | | Tenet Healthcare Corp., Sr. Unsecd. Note, 6.75%, 6/15/2023 | 5,428,656 |
| 2,675,000 | | Tenet Healthcare Corp., Sr. Unsecd. Note, Series 144A, 7.00%, 8/1/2025 | 2,524,531 |
| 6,825,000 | | Vizient, Inc., Sr. Unsecd. Note, Series 144A, 10.375%, 3/1/2024 | 7,695,187 |
| 3,900,000 | | West Street Merger Sub, Inc., Sr. Unsecd. Note, Series 144A, 6.375%, 9/1/2025 | 3,929,250 |
| | | TOTAL | 210,200,155 |
| | | Independent Energy—5.9% | |
| 3,650,000 | | Antero Resources Corp., Sr. Unsecd. Note, 5.00%, 3/1/2025 | 3,741,250 |
| 1,400,000 | | Antero Resources Corp., Sr. Unsecd. Note, 5.625%, 6/1/2023 | 1,463,000 |
| 2,025,000 | | Antero Resources Finance Corp., 5.375%, 11/1/2021 | 2,083,219 |
| 5,175,000 | | Ascent Resources Utica Holdings LLC/ARU Finance Corp., Sr. Unsecd. Note, Series 144A, 10.00%, 4/1/2022 | 5,576,062 |
| 3,962,000 | | Callon Petroleum Corp., Sr. Unsecd. Note, 6.125%, 10/1/2024 | 4,100,670 |
Annual Shareholder Report
Principal
Amount
or Shares | | | Value |
| | | CORPORATE BONDS—continued | |
| | | Independent Energy—continued | |
| $450,000 | | Carrizo Oil & Gas, Inc., 6.25%, 4/15/2023 | $469,125 |
| 2,738,000 | | Carrizo Oil & Gas, Inc., Sr. Unsecd. Note, 7.50%, 9/15/2020 | 2,792,760 |
| 2,950,000 | | Carrizo Oil & Gas, Inc., Sr. Unsecd. Note, 8.25%, 7/15/2025 | 3,256,062 |
| 2,450,000 | | Chesapeake Energy Corp., 5.75%, 3/15/2023 | 2,278,500 |
| 1,908,000 | | Chesapeake Energy Corp., Series 144A, 8.00%, 12/15/2022 | 2,065,410 |
| 1,175,000 | | Chesapeake Energy Corp., Sr. Unsecd. Note, 5.375%, 6/15/2021 | 1,139,750 |
| 1,375,000 | | Chesapeake Energy Corp., Sr. Unsecd. Note, Series 144A, 8.00%, 1/15/2025 | 1,390,469 |
| 3,450,000 | | Chesapeake Energy Corp., Sr. Unsecd. Note, Series 144A, 8.00%, 6/15/2027 | 3,320,625 |
| 3,025,000 | | Continental Resources, Inc., 4.50%, 4/15/2023 | 3,093,063 |
| 6,375,000 | | Crownrock LP/Crownrock F, Series 144A, 5.625%, 10/15/2025 | 6,422,812 |
| 250,000 | | Diamondback Energy, Inc., Sr. Unsecd. Note, 4.75%, 11/1/2024 | 252,188 |
| 1,100,000 | | Diamondback Energy, Inc., Sr. Unsecd. Note, 5.375%, 5/31/2025 | 1,137,125 |
| 3,100,000 | | EP Energy LLC/Everest Acquisition Finance, Inc., Sec. Fac. Bond, Series 144A, 8.00%, 11/29/2024 | 3,216,250 |
| 325,000 | | Endeavor Energy Resources LP, Sr. Unsecd. Note, Series 144A, 5.50%, 1/30/2026 | 331,500 |
| 1,850,000 | | Endeavor Energy Resources LP, Sr. Unsecd. Note, Series 144A, 5.75%, 1/30/2028 | 1,906,888 |
| 2,475,000 | | Gulfport Energy Corp., Sr. Unsecd. Note, 6.00%, 10/15/2024 | 2,487,375 |
| 2,600,000 | | Gulfport Energy Corp., Sr. Unsecd. Note, 6.375%, 5/15/2025 | 2,622,750 |
| 1,225,000 | | Gulfport Energy Corp., Sr. Unsecd. Note, 6.625%, 5/1/2023 | 1,255,625 |
| 1,050,000 | | Gulfport Energy Corp., Sr. Unsecd. Note, Series 144A, 6.375%, 1/15/2026 | 1,060,500 |
| 1,650,000 | | Laredo Petroleum, 5.625%, 1/15/2022 | 1,674,750 |
| 1,400,000 | | Laredo Petroleum, Sr. Unsecd. Note, 6.25%, 3/15/2023 | 1,456,420 |
| 950,000 | | Oasis Petroleum, Inc., 6.875%, 1/15/2023 | 974,938 |
| 975,000 | | Oasis Petroleum, Inc., 6.875%, 3/15/2022 | 1,003,031 |
| 3,300,000 | | Oasis Petroleum, Inc., Company Guarantee, 6.50%, 11/1/2021 | 3,378,375 |
| 975,000 | | PDC Energy, Inc., Sr. Unsecd. Note, 6.125%, 9/15/2024 | 1,014,000 |
| 2,500,000 | | PDC Energy, Inc., Sr. Unsecd. Note, Series 144A, 5.75%, 5/15/2026 | 2,565,625 |
| 400,000 | | Parsley Energy LLC/Parsley Finance Corp., Series 144A, 6.25%, 6/1/2024 | 423,000 |
| 1,050,000 | | Parsley Energy LLC/Parsley Finance Corp., Sr. Unsecd. Note, Series 144A, 5.25%, 8/15/2025 | 1,057,875 |
| 1,275,000 | | Parsley Energy LLC/Parsley Finance Corp., Sr. Unsecd. Note, Series 144A, 5.375%, 1/15/2025 | 1,294,125 |
| 2,875,000 | | Parsley Energy LLC/Parsley Finance Corp., Sr. Unsecd. Note, Series 144A, 5.625%, 10/15/2027 | 2,946,875 |
| 2,250,000 | | QEP Resources, Inc., Sr. Unsecd. Note, 5.25%, 5/1/2023 | 2,287,935 |
| 1,400,000 | | QEP Resources, Inc., Sr. Unsecd. Note, 5.625%, 3/1/2026 | 1,424,500 |
| 800,000 | | RSP Permian, Inc., Sr. Unsecd. Note, 5.25%, 1/15/2025 | 824,000 |
| 2,375,000 | | RSP Permian, Inc., Sr. Unsecd. Note, 6.625%, 10/1/2022 | 2,496,719 |
| 2,900,000 | | Range Resources Corp., Sr. Unsecd. Note, 4.875%, 5/15/2025 | 2,813,000 |
| 1,550,000 | | Range Resources Corp., Sr. Unsecd. Note, 5.00%, 3/15/2023 | 1,550,000 |
| 1,200,000 | | Range Resources Corp., Sr. Unsecd. Note, 5.00%, 8/15/2022 | 1,200,000 |
| 2,250,000 | | SM Energy Co., Sr. Unsecd. Note, 5.625%, 6/1/2025 | 2,193,750 |
| 1,025,000 | | SM Energy Co., Sr. Unsecd. Note, 6.50%, 1/1/2023 | 1,050,625 |
| 1,700,000 | | SM Energy Co., Sr. Unsecd. Note, 6.75%, 9/15/2026 | 1,759,500 |
| 4,475,000 | | SRC Energy, Inc., Sr. Unsecd. Note, Series 144A, 6.25%, 12/1/2025 | 4,598,062 |
| 2,675,000 | | Southwestern Energy Co., Sr. Unsecd. Note, 4.10%, 3/15/2022 | 2,641,563 |
| 725,000 | | Southwestern Energy Co., Sr. Unsecd. Note, 7.50%, 4/1/2026 | 771,219 |
| 4,475,000 | | Southwestern Energy Co., Sr. Unsecd. Note, 7.75%, 10/1/2027 | 4,782,656 |
| 875,000 | | Ultra Resources, Inc., Sr. Unsecd. Note, Series 144A, 6.875%, 4/15/2022 | 880,469 |
| 3,025,000 | | Ultra Resources, Inc., Sr. Unsecd. Note, Series 144A, 7.125%, 4/15/2025 | 3,028,781 |
| 2,200,000 | | WPX Energy, Inc., Sr. Unsecd. Note, 5.25%, 9/15/2024 | 2,203,410 |
| 1,375,000 | | WPX Energy, Inc., Sr. Unsecd. Note, 6.00%, 1/15/2022 | 1,443,750 |
| 252,000 | | WPX Energy, Inc., Sr. Unsecd. Note, 7.50%, 8/1/2020 | 274,050 |
Annual Shareholder Report
Principal
Amount
or Shares | | | Value |
| | | CORPORATE BONDS—continued | |
| | | Independent Energy—continued | |
| $1,050,000 | | WPX Energy, Inc., Sr. Unsecd. Note, 8.25%, 8/1/2023 | $1,197,000 |
| 3,625,000 | | Whiting Petroleum Corp., Sr. Unsecd. Note, 6.25%, 4/1/2023 | 3,724,687 |
| 1,425,000 | | Whiting Petroleum Corp., Sr. Unsecd. Note, Series 144A, 6.625%, 1/15/2026 | 1,455,281 |
| | | TOTAL | 119,852,949 |
| | | Industrial - Other—1.0% | |
| 675,000 | | Anixter, Inc., 5.50%, 3/1/2023 | 729,203 |
| 5,550,000 | | Belden, Inc., Sr. Sub., Series 144A, 5.25%, 7/15/2024 | 5,744,250 |
| 9,225,000 | | Hillman Group, Inc., Unsecd. Note, Series 144A, 6.375%, 7/15/2022 | 9,248,062 |
| 3,775,000 | | KAR Auction Services, Inc., Sr. Unsecd. Note, Series 144A, 5.125%, 6/1/2025 | 3,878,813 |
| | | TOTAL | 19,600,328 |
| | | Insurance - P&C—2.4% | |
| 4,800,000 | | Acrisure LLC, Sr. Unsecd. Note, Series 144A, 7.00%, 11/15/2025 | 4,638,048 |
| 6,400,000 | | AssuredPartners, Inc., Sr. Unsecd. Note, Series 144A, 7.00%, 8/15/2025 | 6,384,000 |
| 5,250,000 | | Hub Holdlings LLC/Hub Hol, Sr. Unsecd. Note, Series 144A, 8.125%, 7/15/2019 | 5,263,125 |
| 12,600,000 | | Hub International Ltd., Sr. Unsecd. Note, Series 144A, 7.875%, 10/1/2021 | 13,135,500 |
| 5,625,000 | | Kirs Midco 3 PLC, Sec. Fac. Bond, Series 144A, 8.625%, 7/15/2023 | 5,850,000 |
| 6,325,000 | | NFP Corp., Sr. Unsecd. Note, Series 144A, 6.875%, 7/15/2025 | 6,388,250 |
| 6,425,000 | | USIS Merger Sub, Inc., Sr. Unsecd. Note, Series 144A, 6.875%, 5/1/2025 | 6,505,312 |
| | | TOTAL | 48,164,235 |
| | | Leisure—1.1% | |
| 1,450,000 | | AMC Entertainment Holdings, Inc., Sr. Sub. Note, 5.875%, 11/15/2026 | 1,435,500 |
| 775,000 | | AMC Entertainment Holdings, Inc., Sr. Sub. Note, 6.125%, 5/15/2027 | 773,063 |
| 1,550,000 | | Cedar Fair LP, Sr. Unsecd. Note, 5.375%, 6/1/2024 | 1,627,500 |
| 1,000,000 | | Cedar Fair LP/Canada's Wonderland Co./Magnum Management Corp./Millennium Op, Sr. Unsecd. Note, Series 144A, 5.375%, 4/15/2027 | 1,052,500 |
| 1,650,000 | | Live Nation Entertainment, Inc., Sr. Unsecd. Note, Series 144A, 4.875%, 11/1/2024 | 1,695,375 |
| 4,600,000 | | Regal Cinemas, Inc., 5.75%, 2/1/2025 | 4,738,000 |
| 2,300,000 | | Six Flags Entertainment Corp., Sr. Unsecd. Note, Series 144A, 4.875%, 7/31/2024 | 2,340,250 |
| 8,625,000 | | Six Flags Entertainment Corp., Sr. Unsecd. Note, Series 144A, 5.50%, 4/15/2027 | 8,948,437 |
| | | TOTAL | 22,610,625 |
| | | Lodging—0.2% | |
| 1,925,000 | | Hilton Domestic Operations, Sr. Unsecd. Note, 4.25%, 9/1/2024 | 1,949,062 |
| 1,250,000 | | Hilton Worldwide Finance LLC, Sr. Unsecd. Note, 4.625%, 4/1/2025 | 1,287,500 |
| 1,175,000 | | RHP Hotel Property/RHP Finance Corp., Sr. Unsecd. Note, 5.00%, 4/15/2023 | 1,207,313 |
| | | TOTAL | 4,443,875 |
| | | Media Entertainment—5.6% | |
| 4,300,000 | | AMC Networks, Inc., Sr. Unsecd. Note, 4.75%, 8/1/2025 | 4,273,125 |
| 3,800,000 | | AMC Networks, Inc., Sr. Unsecd. Note, 5.00%, 4/1/2024 | 3,857,000 |
| 4,025,000 | | CBS Radio, Inc., Sr. Unsecd. Note, Series 144A, 7.25%, 11/1/2024 | 4,263,984 |
| 6,350,000 | | Clear Channel Communications, Inc., Company Guarantee, 9.00%, 3/1/2021 | 4,572,000 |
| 950,000 | | Clear Channel International BV, Sr. Unsecd. Note, Series 144A, 8.75%, 12/15/2020 | 985,625 |
| 2,350,000 | | Clear Channel Worldwide, Series A, 6.50%, 11/15/2022 | 2,385,250 |
| 4,500,000 | | Clear Channel Worldwide, Series B, 6.50%, 11/15/2022 | 4,595,625 |
| 1,025,000 | | E.W. Scripps Co., Sr. Unsecd. Note, Series 144A, 5.125%, 5/15/2025 | 1,022,438 |
| 5,375,000 | | EMI Music Publishing Group North America Holdings, Inc., Series 144A, 7.625%, 6/15/2024 | 5,925,937 |
| 5,150,000 | | Gannett Co., Inc., 6.375%, 10/15/2023 | 5,413,937 |
| 725,000 | | Gannett Co., Inc., Sr. Unsecd. Note, Series 144A, 5.50%, 9/15/2024 | 763,063 |
| 2,250,000 | | Gray Television, Inc., Sr. Unsecd. Note, Series 144A, 5.125%, 10/15/2024 | 2,250,000 |
| 4,675,000 | | Gray Television, Inc., Sr. Unsecd. Note, Series 144A, 5.875%, 7/15/2026 | 4,803,562 |
| 5,225,000 | | Lin Television Corp., Sr. Unsecd. Note, 5.875%, 11/15/2022 | 5,460,125 |
Annual Shareholder Report
Principal
Amount
or Shares | | | Value |
| | | CORPORATE BONDS—continued | |
| | | Media Entertainment—continued | |
| $1,025,000 | | Match Group, Inc., Sr. Unsecd. Note, 6.375%, 6/1/2024 | $1,114,688 |
| 3,850,000 | | Match Group, Inc., Sr. Unsecd. Note, Series 144A, 5.00%, 12/15/2027 | 3,917,375 |
| 4,425,000 | | Nexstar Broadcasting, Inc., Sr. Unsecd. Note, Series 144A, 6.125%, 2/15/2022 | 4,602,000 |
| 2,675,000 | | Nexstar Escrow Corp., Sr. Unsecd. Note, Series 144A, 5.625%, 8/1/2024 | 2,768,625 |
| 10,725,000 | | Nielsen Finance LLC/Nielsen Finance Co., Series 144A, 5.00%, 4/15/2022 | 11,060,156 |
| 2,650,000 | | Nielsen Finance LLC/Nielsen Finance Co., Sr. Unsecd. Note, Series 144A, 5.00%, 2/1/2025 | 2,756,000 |
| 3,600,000 | | Outfront Americas Capital LLC/Outfront Media Capital Corp., Sr. Unsecd. Note, 5.875%, 3/15/2025 | 3,820,500 |
| 5,625,000 | | Sinclair Television Group, Series 144A, 5.625%, 8/1/2024 | 5,814,844 |
| 975,000 | | Sinclair Television Group, Sr. Unsecd. Note, Series 144A, 5.125%, 2/15/2027 | 971,344 |
| 6,250,000 | | Sinclair Television Group, Sr. Unsecd. Note, Series 144A, 5.875%, 3/15/2026 | 6,523,437 |
| 7,850,000 | | Tribune Media Co., Sr. Unsecd. Note, 5.875%, 7/15/2022 | 8,105,125 |
| 4,775,000 | | Urban One, Inc., Series 144A, 7.375%, 4/15/2022 | 4,786,938 |
| 4,675,000 | | Urban One, Inc., Series 144A, 9.25%, 2/15/2020 | 4,417,875 |
| 1,300,000 | | WMG Acquisition Corp., Sec. Fac. Bond, Series 144A, 4.875%, 11/1/2024 | 1,345,500 |
| 750,000 | | WMG Acquisition Corp., Series 144A, 5.00%, 8/1/2023 | 779,063 |
| | | TOTAL | 113,355,141 |
| | | Metals & Mining—2.5% | |
| 3,975,000 | | Alliance Resource Operating Partners LP/Alliance Resource Finance Corp., Sr. Unsecd. Note, Series 144A, 7.50%, 5/1/2025 | 4,238,344 |
| 4,375,000 | | Coeur Mining, Inc., Sr. Unsecd. Note, 5.875%, 6/1/2024 | 4,336,719 |
| 6,350,000 | | Freeport-McMoRan, Inc., Sr. Unsecd. Note, 3.875%, 3/15/2023 | 6,350,000 |
| 9,825,000 | | Freeport-McMoRan, Inc., Sr. Unsecd. Note, 5.40%, 11/14/2034 | 10,046,062 |
| 1,175,000 | | HudBay Minerals, Inc., Sr. Unsecd. Note, Series 144A, 7.25%, 1/15/2023 | 1,251,375 |
| 2,700,000 | | HudBay Minerals, Inc., Sr. Unsecd. Note, Series 144A, 7.625%, 1/15/2025 | 2,970,000 |
| 875,000 | | Peabody Securities Finance Corp., Sec. Fac. Bond, Series 144A, 6.00%, 3/31/2022 | 911,094 |
| 2,975,000 | | Peabody Securities Finance Corp., Sec. Fac. Bond, Series 144A, 6.375%, 3/31/2025 | 3,105,156 |
| 1,600,000 | | Steel Dynamics, Inc., Sr. Unsecd. Note, 5.125%, 10/1/2021 | 1,644,000 |
| 850,000 | | Steel Dynamics, Inc., Sr. Unsecd. Note, 5.25%, 4/15/2023 | 879,750 |
| 5,075,000 | | Steel Dynamics, Inc., Sr. Unsecd. Note, 5.50%, 10/1/2024 | 5,404,875 |
| 2,450,000 | | Teck Resources Ltd., Sr. Unsecd. Note, 6.00%, 8/15/2040 | 2,737,875 |
| 3,475,000 | | Teck Resources Ltd., Sr. Unsecd. Note, 6.125%, 10/1/2035 | 3,909,375 |
| 2,900,000 | | Teck Resources Ltd., Sr. Unsecd. Note, Series 144A, 8.50%, 6/1/2024 | 3,284,250 |
| | | TOTAL | 51,068,875 |
| | | Midstream—5.4% | |
| 625,000 | | AmeriGas Partners LP, Sr. Unsecd. Note, 5.50%, 5/20/2025 | 634,375 |
| 1,975,000 | | AmeriGas Partners LP, Sr. Unsecd. Note, 5.625%, 5/20/2024 | 2,063,875 |
| 1,350,000 | | AmeriGas Partners LP, Sr. Unsecd. Note, 5.75%, 5/20/2027 | 1,370,250 |
| 7,950,000 | | AmeriGas Partners LP, Sr. Unsecd. Note, 5.875%, 8/20/2026 | 8,228,250 |
| 4,100,000 | | Antero Midstream Partners LP, Sr. Unsecd. Note, 5.375%, 9/15/2024 | 4,243,500 |
| 575,000 | | Atlas Pipeline Partners LP, 5.875%, 8/1/2023 | 579,313 |
| 1,650,000 | | Cheniere Corpus Christi Holdings LLC, 5.125%, 6/30/2027 | 1,710,885 |
| 3,800,000 | | Cheniere Corpus Christi Holdings LLC, Sr. Secd. Note, 5.875%, 3/31/2025 | 4,125,375 |
| 2,875,000 | | Cheniere Corpus Christi Holdings LLC, Sr. Secd. Note, 7.00%, 6/30/2024 | 3,277,500 |
| 7,350,000 | | Cheniere Energy Partners, LP, Sr. Unsecd. Note, Series 144A, 5.25%, 10/1/2025 | 7,497,000 |
| 8,350,000 | | Energy Transfer Equity LP, 5.875%, 1/15/2024 | 8,809,250 |
| 4,175,000 | | Ferrellgas LP/Ferrellgas Finance Corp., Sr. Unsecd. Note, 6.75%, 6/15/2023 | 3,851,437 |
| 3,200,000 | | Ferrellgas, L.P., Sr. Unsecd. Note, 6.50%, 5/1/2021 | 3,012,000 |
| 6,250,000 | | Ferrellgas, L.P., Sr. Unsecd. Note, 6.75%, 1/15/2022 | 5,812,500 |
| 6,650,000 | | Holly Energy Partners LP, Series 144A, 6.00%, 8/1/2024 | 6,965,875 |
| 350,000 | | NGPL PipeCo LLC, Sr. Unsecd. Note, Series 144A, 4.875%, 8/15/2027 | 364,438 |
Annual Shareholder Report
Principal
Amount
or Shares | | | Value |
| | | CORPORATE BONDS—continued | |
| | | Midstream—continued | |
| $5,000,000 | | NuStar Logistics, L.P., Sr. Unsecd. Note, 5.625%, 4/28/2027 | $5,100,000 |
| 6,200,000 | | Suburban Propane Partners LP, 5.50%, 6/1/2024 | 6,169,000 |
| 1,275,000 | | Suburban Propane Partners LP, Sr. Unsecd. Note, 5.75%, 3/1/2025 | 1,265,438 |
| 4,075,000 | | Suburban Propane Partners LP, Sr. Unsecd. Note, 5.875%, 3/1/2027 | 4,003,687 |
| 8,325,000 | | Summit Midstream Holdings LLC, 5.50%, 8/15/2022 | 8,366,625 |
| 3,075,000 | | Summit Midstream Holdings LLC, Sr. Unsecd. Note, 5.75%, 4/15/2025 | 3,116,174 |
| 1,275,000 | | Targa Resources Partners LP/Targa Resources Partners Finance Corp., Sr. Unsecd. Note, 5.25%, 5/1/2023 | 1,306,875 |
| 3,350,000 | | Targa Resources Partners LP/Targa Resources Partners Finance Corp., Sr. Unsecd. Note, Series 144A, 5.00%, 1/15/2028 | 3,354,187 |
| 1,625,000 | | Targa Resources Partners LP/Targa Resources Partners Finance Corp., Sr. Unsecd. Note, Series 144A, 5.125%, 2/1/2025 | 1,669,688 |
| 4,450,000 | | Targa Resources Partners LP/Targa Resources Partners Finance Corp., Sr. Unsecd. Note, Series 144A, 5.375%, 2/1/2027 | 4,583,500 |
| 400,000 | | Tesoro Logistics LP, Sr. Unsecd. Note, 5.50%, 10/15/2019 | 415,708 |
| 186,000 | | Tesoro Logistics LP, Sr. Unsecd. Note, 6.25%, 10/15/2022 | 197,573 |
| 3,825,000 | | Tesoro Logistics LP, Sr. Unsecd. Note, 6.375%, 5/1/2024 | 4,154,906 |
| 2,675,000 | | Williams Cos., Inc., Sr. Unsecd. Note, 4.55%, 6/24/2024 | 2,788,687 |
| | | TOTAL | 109,037,871 |
| | | Oil Field Services—0.9% | |
| 321,000 | | Precision Drilling Corp., Sr. Unsecd. Note, 6.50%, 12/15/2021 | 328,624 |
| 2,675,000 | | Precision Drilling Corp., Sr. Unsecd. Note, 7.75%, 12/15/2023 | 2,822,125 |
| 2,025,000 | | Precision Drilling Corp., Sr. Unsecd. Note, Series 144A, 7.125%, 1/15/2026 | 2,070,563 |
| 575,000 | | Sesi LLC, 7.125%, 12/15/2021 | 590,094 |
| 5,150,000 | | Sesi LLC, Sr. Unsecd. Note, Series 144A, 7.75%, 9/15/2024 | 5,484,750 |
| 3,025,000 | | Weatherford International Ltd., 7.00%, 3/15/2038 | 2,556,125 |
| 3,725,000 | | Weatherford International Ltd., Sr. Unsecd. Note, 8.25%, 6/15/2023 | 3,771,562 |
| 1,850,000 | | Weatherford International, Inc., Sr. Unsecd. Note, 6.80%, 6/15/2037 | 1,544,750 |
| | | TOTAL | 19,168,593 |
| | | Packaging—6.4% | |
| 5,825,000 | | ARD Finance SA, Sec. Fac. Bond, 7.125%, 9/15/2023 | 6,101,688 |
| 1,625,000 | | Ardagh Packaging Finance PLC/Ardagh Holdings, Series 144A, 4.625%, 5/15/2023 | 1,663,594 |
| 3,150,000 | | Ardagh Packaging Finance PLC/Ardagh Holdings, Sr. Unsecd. Note, Series 144A, 6.00%, 2/15/2025 | 3,323,250 |
| 2,925,000 | | Ardagh Packaging Finance PLC/Ardagh Holdings, Sr. Unsecd. Note, Series 144A, 6.00%, 6/30/2021 | 3,012,750 |
| 10,375,000 | | Ardagh Packaging Finance PLC/Ardagh Holdings, Sr. Unsecd. Note, Series 144A, 7.25%, 5/15/2024 | 11,334,687 |
| 1,025,000 | | Ball Corp., Sr. Unsecd. Note, 5.25%, 7/1/2025 | 1,118,531 |
| 4,325,000 | | Berry Plastics Corp., 5.125%, 7/15/2023 | 4,514,219 |
| 9,325,000 | | Berry Plastics Corp., 5.50%, 5/15/2022 | 9,616,406 |
| 5,900,000 | | Bway Holding Co., Sec. Fac. Bond, Series 144A, 5.50%, 4/15/2024 | 6,150,750 |
| 11,950,000 | | Bway Holding Co., Sr. Unsecd. Note, Series 144A, 7.25%, 4/15/2025 | 12,368,250 |
| 11,750,000 | | Flex Acquisition Co., Inc., Sr. Unsecd. Note, Series 144A, 6.875%, 1/15/2025 | 12,190,331 |
| 7,800,000 | | Multi-Color Corp., Series 144A, 6.125%, 12/1/2022 | 8,180,250 |
| 1,000,000 | | Multi-Color Corp., Sr. Unsecd. Note, Series 144A, 4.875%, 11/1/2025 | 1,006,250 |
| 4,625,000 | | Owens-Brockway Glass Container, Inc., Series 144A, 5.375%, 1/15/2025 | 4,896,719 |
| 2,800,000 | | Owens-Brockway Glass Container, Inc., Series 144A, 6.375%, 8/15/2025 | 3,134,250 |
| 11,023,600 | | Reynolds Group Issuer, Inc./LLC/LU, 5.75%, 10/15/2020 | 11,202,734 |
| 3,825,000 | | Reynolds Group Issuer, Inc./LLC/LU, Series 144A, 7.00%, 7/15/2024 | 4,103,747 |
| 1,675,000 | | Reynolds Group, Sr. Unsecd. Note, 7.95%, 12/15/2025 | 1,905,313 |
| 575,000 | | Sealed Air Corp., Series 144A, 4.875%, 12/1/2022 | 609,500 |
| 2,800,000 | | Sealed Air Corp., Series 144A, 5.25%, 4/1/2023 | 2,996,000 |
| 3,850,000 | | Sealed Air Corp., Sr. Unsecd. Note, Series 144A, 5.50%, 9/15/2025 | 4,206,125 |
| 12,050,000 | | Signode Industrial Group, Series 144A, 6.375%, 5/1/2022 | 12,637,437 |
Annual Shareholder Report
Principal
Amount
or Shares | | | Value |
| | | CORPORATE BONDS—continued | |
| | | Packaging—continued | |
| $4,275,000 | | Trident Merger Sub, Inc., Sr. Unsecd. Note, Series 144A, 6.625%, 11/1/2025 | $4,275,000 |
| | | TOTAL | 130,547,781 |
| | | Paper—0.4% | |
| 1,400,000 | | Clearwater Paper Corp., Sr. Note, 4.50%, 2/1/2023 | 1,391,250 |
| 7,700,000 | | Clearwater Paper Corp., Sr. Unsecd. Note, Series 144A, 5.375%, 2/1/2025 | 7,777,000 |
| | | TOTAL | 9,168,250 |
| | | Pharmaceuticals—3.9% | |
| 2,375,000 | | Eagle Holding Co., Sr. Unsecd. Note, Series 144A, 7.625%, 5/15/2022 | 2,422,500 |
| 4,975,000 | | Endo Dac/Endo Finance LLC/Endo Finco, Inc., Sr. Unsecd. Note, Series 144A, 6.00%, 7/15/2023 | 3,930,250 |
| 7,350,000 | | Endo Finance LLC/Endo Finco, Inc., Sr. Unsecd. Note, Series 144A, 6.00%, 2/1/2025 | 5,733,000 |
| 16,050,000 | | Jaguar Holding Co. II/Pharmaceutical Product Development LLC, Sr. Unsecd. Note, Series 144A, 6.375%, 8/1/2023 | 16,250,625 |
| 5,825,000 | | Mallinckrodt International Finance SA/Mallinckrodt CB LLC, Sr. Unsecd. Note, 4.75%, 4/15/2023 | 4,601,750 |
| 5,775,000 | | Mallinckrodt International Finance SA/Mallinckrodt CB LLC, Sr. Unsecd. Note, Series 144A, 5.50%, 4/15/2025 | 4,735,500 |
| 5,275,000 | | Mallinckrodt International Finance SA/Mallinckrodt CB LLC, Sr. Unsecd. Note, Series 144A, 5.625%, 10/15/2023 | 4,510,125 |
| 1,750,000 | | Valeant Pharmaceuticals International, Inc., Sec. Fac. Bond, Series 144A, 5.50%, 11/1/2025 | 1,789,375 |
| 4,025,000 | | Valeant Pharmaceuticals International, Inc., Series 144A, 5.625%, 12/1/2021 | 3,949,531 |
| 2,100,000 | | Valeant Pharmaceuticals International, Inc., Series 144A, 7.50%, 7/15/2021 | 2,144,625 |
| 875,000 | | Valeant Pharmaceuticals International, Inc., Sr. Secd. Note, Series 144A, 6.50%, 3/15/2022 | 920,938 |
| 2,225,000 | | Valeant Pharmaceuticals International, Inc., Sr. Secd. Note, Series 144A, 7.00%, 3/15/2024 | 2,386,312 |
| 2,975,000 | | Valeant Pharmaceuticals International, Inc., Sr. Unsecd. Note, Series 144A, 5.50%, 3/1/2023 | 2,737,000 |
| 12,225,000 | | Valeant Pharmaceuticals International, Inc., Sr. Unsecd. Note, Series 144A, 6.125%, 4/15/2025 | 11,231,719 |
| 1,500,000 | | Valeant Pharmaceuticals International, Inc., Sr. Unsecd. Note, Series 144A, 7.25%, 7/15/2022 | 1,522,500 |
| 2,775,000 | | Valeant Pharmaceuticals International, Inc., Sr. Unsecd. Note, Series 144A, 9.00%, 12/15/2025 | 2,899,042 |
| 8,300,000 | | Vrx Escrow Corp, Series 144A, 5.875%, 5/15/2023 | 7,708,625 |
| | | TOTAL | 79,473,417 |
| | | Refining—0.4% | |
| 7,775,000 | | CVR Refining LLC/Coffeyville Finance, Inc., 6.50%, 11/1/2022 | 8,047,125 |
| | | Restaurants—1.0% | |
| 10,025,000 | | 1011778 BC Unltd. Liability Co./New Red Finance, Inc., Series 144A, 5.00%, 10/15/2025 | 10,150,313 |
| 925,000 | | 1011778 BC Unltd. Liability Co./New Red Finance, Inc., Sr. Secd. Note, Series 144A, 4.25%, 5/15/2024 | 925,000 |
| 525,000 | | KFC Holding Co./Pizza Hut Holdings LLC/Taco Bell of America LLC, Sr. Unsecd. Note, Series 144A, 4.75%, 6/1/2027 | 538,125 |
| 925,000 | | Performance Food Group, Inc., Series 144A, 5.50%, 6/1/2024 | 957,375 |
| 2,400,000 | | Yum! Brands, Inc., Sr. Unsecd. Note, Series 144A, 5.00%, 6/1/2024 | 2,481,000 |
| 4,825,000 | | Yum! Brands, Inc., Sr. Unsecd. Note, Series 144A, 5.25%, 6/1/2026 | 5,090,375 |
| | | TOTAL | 20,142,188 |
| | | Retailers—1.6% | |
| 10,475,000 | | Argos Merger Sub, Inc., Sr. Unsecd. Note, Series 144A, 7.125%, 3/15/2023 | 6,258,812 |
| 3,125,000 | | Hanesbrands, Inc., Sr. Unsecd. Note, Series 144A, 4.875%, 5/15/2026 | 3,218,750 |
| 5,500,000 | | Michaels Stores, Inc., Series 144A, 5.875%, 12/15/2020 | 5,582,500 |
| 6,350,000 | | Party City Holdings, Inc., Sr. Unsecd. Note, Series 144A, 6.125%, 8/15/2023 | 6,588,125 |
| 2,350,000 | | PetSmart, Inc., Sr. Unsecd. Note, Series 144A, 8.875%, 6/1/2025 | 1,427,625 |
| 5,350,000 | | Rite Aid Corp., Sr. Unsecd. Note, Series 144A, 6.125%, 4/1/2023 | 4,848,438 |
| 5,100,000 | | Sally Hldgs. LLC/Sally Capital, Inc., 5.625%, 12/1/2025 | 5,100,000 |
| | | TOTAL | 33,024,250 |
| | | Supermarkets—0.5% | |
| 5,900,000 | | Albertsons Cos. LLC/SAFEW, Sr. Unsecd. Note, 5.75%, 3/15/2025 | 5,354,250 |
| 4,250,000 | | Albertsons Cos. LLC/SAFEW, Sr. Unsecd. Note, 6.625%, 6/15/2024 | 4,080,000 |
| | | TOTAL | 9,434,250 |
Annual Shareholder Report
Principal
Amount
or Shares | | | Value |
| | | CORPORATE BONDS—continued | |
| | | Technology—9.6% | |
| $9,475,000 | | BMC Software, Inc., Series 144A, 8.125%, 7/15/2021 | $9,581,594 |
| 900,000 | | CDW LLC/CDW Finance, Sr. Unsecd. Note, 5.00%, 9/1/2025 | 936,000 |
| 6,425,000 | | CDW LLC/CDW Finance, Sr. Unsecd. Note, 5.50%, 12/1/2024 | 7,019,312 |
| 5,700,000 | | CommScope Technologies Finance LLC, Series 144A, 6.00%, 6/15/2025 | 6,084,750 |
| 925,000 | | CommScope, Inc., Series 144A, 5.50%, 6/15/2024 | 965,469 |
| 1,125,000 | | Diamond 1 Finance Corp./Diamond 2 Finance Corp., Sr. Secd. Note, Series 144A, 5.875%, 6/15/2021 | 1,170,000 |
| 8,225,000 | | Diamond 1 Finance Corp./Diamond 2 Finance Corp., Sr. Unsecd. Note, Series 144A, 7.125%, 6/15/2024 | 9,008,366 |
| 8,225,000 | | Ensemble S Merger Sub, Inc., Sr. Unsecd. Note, Series 144A, 9.00%, 9/30/2023 | 8,739,062 |
| 1,900,000 | | First Data Corp., Series 144A, 5.375%, 8/15/2023 | 1,982,460 |
| 20,800,000 | | First Data Corp., Series 144A, 5.75%, 1/15/2024 | 21,678,800 |
| 2,575,000 | | First Data Corp., Sr. Unsecd. Note, Series 144A, 7.00%, 12/1/2023 | 2,729,500 |
| 2,325,000 | | Gartner, Inc., Sr. Unsecd. Note, Series 144A, 5.125%, 4/1/2025 | 2,435,438 |
| 9,825,000 | | Inception Merger Sub, Inc., Sr. Unsecd. Note, Series 144A, 8.625%, 11/15/2024 | 10,512,750 |
| 10,675,000 | | Infor Software Parent, Inc., Series 144A, 7.125%, 5/1/2021 | 10,968,562 |
| 11,300,000 | | Infor US, Inc., 6.50%, 5/15/2022 | 11,752,000 |
| 7,200,000 | | Italics Merger Sub, Inc., Sr. Unsecd. Note, Series 144A, 7.125%, 7/15/2023 | 7,398,000 |
| 7,025,000 | | JDA Escrow LLC/JDA Bond Finance, Inc., Series 144A, 7.375%, 10/15/2024 | 7,376,250 |
| 4,750,000 | | MSCI, Inc., Series 144A, 5.75%, 8/15/2025 | 5,124,062 |
| 2,075,000 | | NCR Corp., 6.375%, 12/15/2023 | 2,178,750 |
| 3,350,000 | | NCR Corp., Sr. Unsecd. Note, 4.625%, 2/15/2021 | 3,387,687 |
| 2,800,000 | | NCR Corp., Sr. Unsecd. Note, 5.00%, 7/15/2022 | 2,863,000 |
| 1,800,000 | | NCR Corp., Sr. Unsecd. Note, 5.875%, 12/15/2021 | 1,851,750 |
| 3,707,000 | | Nuance Communications, Inc., Series 144A, 5.375%, 8/15/2020 | 3,767,239 |
| 5,350,000 | | Nuance Communications, Inc., Sr. Unsecd. Note, 5.625%, 12/15/2026 | 5,597,437 |
| 1,750,000 | | Nuance Communications, Inc., Sr. Unsecd. Note, 6.00%, 7/1/2024 | 1,885,625 |
| 800,000 | | Qorvo, Inc., Sr. Unsecd. Note, 7.00%, 12/1/2025 | 897,000 |
| 6,800,000 | | Riverbed Technology, Inc., Sr. Unsecd. Note, Series 144A, 8.875%, 3/1/2023 | 6,443,000 |
| 3,950,000 | | SS&C Technologies Holdings, Inc., 5.875%, 7/15/2023 | 4,187,000 |
| 3,100,000 | | Sabre GLBL, Inc., Series 144A, 5.375%, 4/15/2023 | 3,208,500 |
| 1,275,000 | | Sensata Technologies B.V., Series 144A, 5.625%, 11/1/2024 | 1,405,688 |
| 1,025,000 | | Sensata Technologies B.V., Sr. Unsecd. Note, Series 144A, 5.00%, 10/1/2025 | 1,089,063 |
| 1,300,000 | | Sensata Technologies UK Financing Co. PLC, Sr. Unsecd. Note, Series 144A, 6.25%, 2/15/2026 | 1,420,250 |
| 8,975,000 | | Solera LLC/Solera Finance, Inc., Series 144A, 10.50%, 3/1/2024 | 10,141,570 |
| 2,575,000 | | Symantec Corp., Sr. Unsecd. Note, Series 144A, 5.00%, 4/15/2025 | 2,684,437 |
| 3,950,000 | | TTM Technologies, Sr. Unsecd. Note, Series 144A, 5.625%, 10/1/2025 | 4,058,625 |
| 9,175,000 | | Tempo Acquisition LLC, Sr. Unsecd. Note, Series 144A, 6.75%, 6/1/2025 | 9,358,500 |
| 825,000 | | Vantiv LLC, Sr. Unsecd. Note, Series 144A, 4.375%, 11/15/2025 | 837,524 |
| 750,000 | | Verisign, Inc., 4.625%, 5/1/2023 | 773,438 |
| 1,025,000 | | Verisign, Inc., Sr. Unsecd. Note, 4.75%, 7/15/2027 | 1,053,188 |
| | | TOTAL | 194,551,646 |
| | | Transportation Services—0.6% | |
| 425,000 | | Avis Budget Group, Inc., Sr. Unsecd. Note, Series 144A, 5.25%, 3/15/2025 | 422,344 |
| 5,450,000 | | Avis Budget Group, Inc., Sr. Unsecd. Note, Series 144A, 6.375%, 4/1/2024 | 5,696,885 |
| 2,900,000 | | HDTFS, Inc., 6.25%, 10/15/2022 | 2,813,000 |
| 3,000,000 | | Hertz Corp., Series 144A, 7.625%, 6/1/2022 | 3,150,000 |
| 1,100,000 | | Hertz Corp., Sr. Unsecd. Note, Series 144A, 5.50%, 10/15/2024 | 998,250 |
| | | TOTAL | 13,080,479 |
Annual Shareholder Report
Principal
Amount
or Shares | | | Value |
| | | CORPORATE BONDS—continued | |
| | | Utility - Electric—2.1% | |
| $9,800,000 | | Calpine Corp., 5.75%, 1/15/2025 | $9,346,750 |
| 500,000 | | Calpine Corp., Bond, Series 144A, 6.00%, 1/15/2022 | 516,875 |
| 900,000 | | Calpine Corp., Series 144A, 5.25%, 6/1/2026 | 885,384 |
| 2,025,000 | | Calpine Corp., Series 144A, 5.875%, 1/15/2024 | 2,065,500 |
| 6,675,000 | | Enviva Partners LP/Enviva Partners Finance Corp., Sr. Unsecd. Note, 8.50%, 11/1/2021 | 7,133,906 |
| 3,850,000 | | NRG Energy, Inc., 6.25%, 5/1/2024 | 4,052,125 |
| 6,075,000 | | NRG Energy, Inc., Sr. Unsecd. Note, 6.625%, 1/15/2027 | 6,454,687 |
| 2,550,000 | | NRG Energy, Inc., Sr. Unsecd. Note, 7.25%, 5/15/2026 | 2,789,037 |
| 950,000 | | NRG Energy, Inc., Sr. Unsecd. Note, Series 144A, 5.75%, 1/15/2028 | 961,875 |
| 425,000 | | TerraForm Power Operating LLC, Sr. Unsecd. Note, Series 144A, 4.25%, 1/31/2023 | 422,344 |
| 4,775,000 | | TerraForm Power Operating LLC, Sr. Unsecd. Note, Series 144A, 5.00%, 1/31/2028 | 4,733,219 |
| 2,675,000 | | TerraForm Power Operating LLC, Sr. Unsecd. Note, Series 144A, 6.625%, 6/15/2025 | 2,925,781 |
| | | TOTAL | 42,287,483 |
| | | Wireless Communications—4.2% | |
| 1,900,000 | | Altice Luxembourg SA, Series 144A, 7.75%, 5/15/2022 | 1,864,375 |
| 7,875,000 | | Altice Luxembourg SA, Sr. Unsecd. Note, Series 144A, 7.625%, 2/15/2025 | 7,569,844 |
| 2,050,000 | | Digicel Ltd., Sr. Unsecd. Note, Series 144A, 8.25%, 9/30/2020 | 2,021,915 |
| 1,125,000 | | Numericable Group SA, Series 144A, 6.00%, 5/15/2022 | 1,140,469 |
| 2,075,000 | | Numericable Group SA, Series 144A, 6.25%, 5/15/2024 | 2,087,969 |
| 12,725,000 | | Numericable-SFR SAS, Series 144A, 7.375%, 5/1/2026 | 13,154,469 |
| 9,850,000 | | Sprint Capital Corp., Company Guarantee, 6.875%, 11/15/2028 | 9,936,187 |
| 8,875,000 | | Sprint Corp., 7.125%, 6/15/2024 | 9,052,500 |
| 8,075,000 | | Sprint Corp., 7.875%, 9/15/2023 | 8,620,062 |
| 2,850,000 | | Sprint Corp., Sr. Unsecd. Note, 7.625%, 2/15/2025 | 2,992,500 |
| 1,350,000 | | Sprint Nextel Corp., Series 144A, 7.00%, 3/1/2020 | 1,447,875 |
| 2,475,000 | | Sprint Nextel Corp., Sr. Unsecd. Note, 6.00%, 11/15/2022 | 2,481,187 |
| 4,075,000 | | T-Mobile USA, Inc., 6.625%, 4/1/2023 | 4,258,375 |
| 5,050,000 | | T-Mobile USA, Inc., Sr. Unsecd. Note, 5.125%, 4/15/2025 | 5,258,312 |
| 1,150,000 | | T-Mobile USA, Inc., Sr. Unsecd. Note, 5.375%, 4/15/2027 | 1,229,063 |
| 1,625,000 | | T-Mobile USA, Inc., Sr. Unsecd. Note, 6.00%, 3/1/2023 | 1,705,438 |
| 3,475,000 | | T-Mobile USA, Inc., Sr. Unsecd. Note, 6.375%, 3/1/2025 | 3,726,937 |
| 4,050,000 | | T-Mobile USA, Inc., Sr. Unsecd. Note, 6.50%, 1/15/2024 | 4,303,125 |
| 1,900,000 | | T-Mobile USA, Inc., Sr. Unsecd. Note, 6.50%, 1/15/2026 | 2,078,125 |
| | | TOTAL | 84,928,727 |
| | | TOTAL CORPORATE BONDS
(IDENTIFIED COST $1,915,225,478) | 1,950,133,534 |
| | | INVESTMENT COMPANY—3.2% | |
| 64,459,132 | 1 | Federated Institutional Prime Value Obligations Fund, Institutional Shares, 1.44%2
(IDENTIFIED COST $64,470,695) | 64,452,686 |
| | | TOTAL INVESTMENT IN SECURITIES—98.9%
(IDENTIFIED COST $1,979,696,173)3 | 2,014,586,220 |
| | | OTHER ASSETS AND LIABILITIES - NET—1.1%4 | 21,956,892 |
| | | TOTAL NET ASSETS—100% | $2,036,543,112 |
Annual Shareholder Report
Affiliated fund holdings are investment companies which are managed by the Adviser or an affiliate of the Adviser. Transactions with affiliated fund holdings during the year ended December 31, 2017, were as follows:
| | Federated Institutional
Prime Value Obligations
Fund, Institutional Shares |
| Balance of Shares Held 12/31/2016 | 31,814,396 |
| Purchases/Additions | 481,226,820 |
| Sales/Reductions | (448,582,084) |
| Balance of Shares Held 12/31/2017 | 64,459,132 |
| Value | $64,452,686 |
| Change in Unrealized Appreciation/Depreciation | $(20,270) |
| Net Realized Gain/(Loss) | $5,155 |
| Dividend Income | $608,789 |
| 2 | 7-day net yield. |
| 3 | The cost of investments for federal tax purposes amounts to $1,980,185,976. |
| 4 | Assets, other than investments in securities, less liabilities. See Statement of Assets and Liabilities. |
Note: The categories of investments are shown as a percentage of total net assets at December 31, 2017.
Various inputs are used in determining the value of the Fund's investments. These inputs are summarized in the three broad levels listed below:
Level 1—quoted prices in active markets for identical securities.
Level 2—other significant observable inputs (including quoted prices for similar securities, interest rates, prepayment speeds, credit risk, etc.). Also includes securities valued at amortized cost.
Level 3—significant unobservable inputs (including the Fund's own assumptions in determining the fair value of investments).
The inputs or methodology used for valuing securities are not an indication of the risk associated with investing in those securities.
The following is a summary of the inputs used, as of December 31, 2017, in valuing the Fund's assets carried at fair value:
| Valuation Inputs | | | | |
| | Level 1—
Quoted
Prices | Level 2—
Other
Significant
Observable
Inputs | Level 3—
Significant
Unobservable
Inputs | Total |
| Debt Securities: | | | | |
| Corporate Bonds | $— | $1,950,133,534 | $— | $1,950,133,534 |
| Investment Company | 64,452,686 | — | — | 64,452,686 |
| TOTAL SECURITIES | $64,452,686 | $1,950,133,534 | $— | $2,014,586,220 |
The following acronym is used throughout this portfolio:
See Notes which are an integral part of the Financial Statements
Annual Shareholder Report
Financial Highlights–High Yield Bond Portfolio
(For a Share Outstanding Throughout Each Period)
| Year Ended December 31 | 2017 | 2016 | 2015 | 2014 | 2013 |
| Net Asset Value, Beginning of Period | $6.32 | $5.82 | $6.34 | $6.62 | $6.68 |
| Income From Investment Operations: | | | | | |
| Net investment income | 0.39 | 0.40 | 0.41 | 0.431 | 0.471 |
| Net realized and unrealized gain (loss) on investments | 0.08 | 0.50 | (0.51) | (0.19) | 0.04 |
| TOTAL FROM INVESTMENT OPERATIONS | 0.47 | 0.90 | (0.10) | 0.24 | 0.51 |
| Less Distributions: | | | | | |
| Distributions from net investment income | (0.39) | (0.40) | (0.41) | (0.45) | (0.50) |
| Distributions from net realized gain on investments | — | — | (0.01) | (0.07) | (0.07) |
| TOTAL DISTRIBUTIONS | (0.39) | (0.40) | (0.42) | (0.52) | (0.57) |
| Net Asset Value, End of Period | $6.40 | $6.32 | $5.82 | $6.34 | $6.62 |
| Total Return2 | 7.55% | 15.90% | (1.81)% | 3.53% | 7.80% |
| Ratios to Average Net Assets: | | | | | |
| Net expenses | 0.02% | 0.02% | 0.02% | 0.01% | 0.00%3 |
| Net investment income | 6.05% | 6.47% | 6.37% | 6.50% | 7.08% |
| Expense waiver/reimbursement4 | 0.00%5 | 0.00%5 | —% | 0.01% | 0.02% |
| Supplemental Data: | | | | | |
| Net assets, end of period (000 omitted) | $2,036,543 | $2,121,645 | $2,379,520 | $2,691,244 | $2,425,364 |
| Portfolio turnover | 28% | 25% | 33% | 29% | 30% |
| 1 | Per share numbers have been calculated using the average shares method. |
| 2 | Based on net asset value |
| 3 | The Adviser reimbursed all operating expenses incurred by the Fund. |
| 4 | This expense decrease is reflected in both the net expense and the net investment income ratios shown above. |
| 5 | Represents less than 0.01%. |
See Notes which are an integral part of the Financial Statements
Annual Shareholder Report
Statement of Assets and Liabilities–High Yield Bond Portfolio
December 31, 2017
| Assets: | | |
| Investment in securities, at value including $64,452,686 of investment in an affiliated holding (identified cost $1,979,696,173) | | $2,014,586,220 |
| Income receivable | | 31,720,935 |
| TOTAL ASSETS | | 2,046,307,155 |
| Liabilities: | | |
| Payable for shares redeemed | $400,000 | |
| Bank overdraft | 7 | |
| Income distribution payable | 9,183,065 | |
| Accrued expenses (Note 5) | 180,971 | |
| TOTAL LIABILITIES | | 9,764,043 |
| Net assets for 318,313,749 shares outstanding | | $2,036,543,112 |
| Net Assets Consist of: | | |
| Paid-in capital | | $2,067,514,633 |
| Net unrealized appreciation of investments | | 34,890,047 |
| Accumulated net realized loss on investments | | (67,154,228) |
| Undistributed net investment income | | 1,292,660 |
| TOTAL NET ASSETS | | $2,036,543,112 |
| Net Asset Value, Offering Price and Redemption Proceeds Per Share: | | |
| $2,036,543,112 ÷ 318,313,749 shares outstanding, no par value, unlimited shares authorized | | $6.40 |
See Notes which are an integral part of the Financial Statements
Annual Shareholder Report
Statement of Operations–High Yield Bond Portfolio
Year Ended December 31, 2017
| Investment Income: | | |
| Interest | | $124,939,221 |
| Dividends received from an affiliated holding (see footnotes to Portfolio of Investments) | | 608,789 |
| TOTAL INCOME | | 125,548,010 |
| Expenses: | | |
| Custodian fees | $71,912 | |
| Transfer agent fee | 148,375 | |
| Directors'/Trustees' fees (Note 5) | 20,326 | |
| Auditing fees | 34,800 | |
| Legal fees | 8,646 | |
| Portfolio accounting fees | 176,914 | |
| Share registration costs | 1,350 | |
| Printing and postage | 16,019 | |
| Insurance fees | 7,240 | |
| Miscellaneous (Note 5) | 24,904 | |
| TOTAL EXPENSES | 510,486 | |
| Reimbursement of other operating expenses (Note 2) | (9,234) | |
| Net expenses | | 501,252 |
| Net investment income | | 125,046,758 |
| Realized and Unrealized Gain (Loss) on Investments: | | |
| Net realized gain on investments (including net realized gain of $5,155 on sales of investments in affiliated holding) | | 11,007,861 |
| Net change in unrealized appreciation of investments (including net change in unrealized appreciation of $(20,270) on investments in an affiliated holding) | | 16,258,666 |
| Net realized and unrealized gain on investments | | 27,266,527 |
| Change in net assets resulting from operations | | $152,313,285 |
See Notes which are an integral part of the Financial Statements
Annual Shareholder Report
Statement of Changes in Net Assets–High Yield Bond Portfolio
| Year Ended December 31 | 2017 | 2016 |
| Increase (Decrease) in Net Assets | | |
| Operations: | | |
| Net investment income | $125,046,758 | $143,819,409 |
| Net realized gain (loss) on investments | 11,007,861 | (56,661,101) |
| Net change in unrealized appreciation/depreciation of investments | 16,258,666 | 240,045,320 |
| CHANGE IN NET ASSETS RESULTING FROM OPERATIONS | 152,313,285 | 327,203,628 |
| Distributions to Shareholders: | | |
| Distributions from net investment income | (125,022,877) | (146,013,790) |
| Share Transactions: | | |
| Proceeds from sale of shares | 115,889,630 | 58,588,924 |
| Net asset value of shares issued to shareholders in payment of distributions declared | 11,548,537 | 14,201,986 |
| Cost of shares redeemed | (239,830,304) | (511,855,888) |
| CHANGE IN NET ASSETS RESULTING FROM SHARE TRANSACTIONS | (112,392,137) | (439,064,978) |
| Change in net assets | (85,101,729) | (257,875,140) |
| Net Assets: | | |
| Beginning of period | 2,121,644,841 | 2,379,519,981 |
| End of period (including undistributed net investment income of $1,292,660 and $287,027, respectively) | $2,036,543,112 | $2,121,644,841 |
See Notes which are an integral part of the Financial Statements
Annual Shareholder Report
Notes to Financial Statements–High Yield Bond Portfolio
December 31, 2017
1. ORGANIZATION
Federated Core Trust (the “Trust”) is registered under the Investment Company Act of 1940, as amended (the “Act”), as a diversified, open-end management investment company. The Trust consists of four portfolios. The financial statements included herein are only those of High Yield Bond Portfolio (the “Fund”). The financial statements of the other portfolios are presented separately. The assets of each portfolio are segregated and a shareholder's interest is limited to the portfolio in which shares are held. Each portfolio pays its own expenses. The investment objective of the Fund is to seek high current income.
The Fund's portfolio consists primarily of lower rated corporate debt obligations. These lower rated debt obligations may be more susceptible to real or perceived adverse economic conditions than investment grade bonds. These lower rated debt obligations are regarded as predominately speculative with respect to each issuer's continuing ability to make interest and principal payments (i.e., the obligations are subject to the risk of default). Currently, shares of the Fund are being offered for investment only to investment companies, insurance company separate accounts, common or commingled trust funds or similar organizations or parties that are “accredited investors” within the meaning of Regulation D of the Securities Act of 1933, as amended (the “1933 Act”).
2. SIGNIFICANT ACCOUNTING POLICIES
The following is a summary of significant accounting policies consistently followed by the Fund in the preparation of its financial statements. These policies are in conformity with U.S. generally accepted accounting principles (GAAP).
Investment Valuation
In calculating its net asset value (NAV), the Fund generally values investments as follows:
| ■ | Fixed-income securities are fair valued using price evaluations provided by a pricing service approved by the Fund's Board of Trustees (the “Trustees”). |
| ■ | Shares of other mutual funds or non-exchange-traded investment companies are valued based upon their reported NAVs. |
| ■ | Derivative contracts listed on exchanges are valued at their reported settlement or closing price, except that options are valued at the mean of closing bid and asked quotations. |
| ■ | Over-the-counter (OTC) derivative contracts are fair valued using price evaluations provided by a pricing service approved by the Trustees. |
| ■ | For securities that are fair valued in accordance with procedures established by and under the general supervision of the Trustees, certain factors may be considered such as: the last traded or purchase price of the security, information obtained by contacting the issuer or dealers, analysis of the issuer's financial statements or other available documents, fundamental analytical data, the nature and duration of restrictions on disposition, the movement of the market in which the security is normally traded, public trading in similar securities or derivative contracts of the issuer or comparable issuers, movement of a relevant index, or other factors including but not limited to industry changes and relevant government actions. |
If any price, quotation, price evaluation or other pricing source is not readily available when the NAV is calculated, if the Fund cannot obtain price evaluations from a pricing service or from more than one dealer for an investment within a reasonable period of time as set forth in the Fund's valuation policies and procedures, or if information furnished by a pricing service, in the opinion of the valuation committee (“Valuation Committee”), is deemed not representative of the fair value of such security, the Fund uses the fair value of the investment determined in accordance with the procedures described below. There can be no assurance that the Fund could obtain the fair value assigned to an investment if it sold the investment at approximately the time at which the Fund determines its NAV per share.
Fair Valuation and Significant Events Procedures
The Trustees have ultimate responsibility for determining the fair value of investments for which market quotations are not readily available. The Trustees have appointed a Valuation Committee comprised of officers of the Fund, Federated Investment Management Company (“Adviser”) and certain of the Adviser's affiliated companies to assist in determining fair value and in overseeing the calculation of the NAV. The Trustees have also authorized the use of pricing services recommended by the Valuation Committee to provide fair value evaluations of the current value of certain investments for purposes of calculating the NAV. The Valuation Committee employs various methods for reviewing third-party pricing-service evaluations including periodic reviews of third-party pricing services' policies, procedures and valuation methods (including key inputs, methods, models and assumptions), transactional back-testing, comparisons of evaluations of different pricing services, and review of price challenges by the Adviser based on recent market activity. In the event that market quotations and price evaluations are not available for an investment, the Valuation Committee determines the fair value of the investment in accordance with procedures adopted by the Trustees. The Trustees periodically review and approve the fair valuations made by the Valuation Committee and any changes made to the procedures.
Factors considered by pricing services in evaluating an investment include the yields or prices of investments of comparable quality, coupon, maturity, call rights and other potential prepayments, terms and type, reported transactions, indications as to values from dealers and general market conditions. Some pricing services provide a single price evaluation reflecting the bid-side of the market for an investment (a “bid” evaluation). Other pricing services offer both bid evaluations and price evaluations indicative of a price between the prices bid and asked for the investment (a “mid” evaluation). The Fund normally uses bid evaluations for any U.S. Treasury and Agency securities, mortgage-backed securities and municipal securities. The Fund normally uses mid evaluations for any other types of fixed-income securities and any OTC derivative contracts. In the event that market quotations and price evaluations are not available for an investment, the fair value of the investment is determined in accordance with procedures adopted by the Trustees.
Annual Shareholder Report
The Trustees also have adopted procedures requiring an investment to be priced at its fair value whenever the Adviser determines that a significant event affecting the value of the investment has occurred between the time as of which the price of the investment would otherwise be determined and the time as of which the NAV is computed. An event is considered significant if there is both an affirmative expectation that the investment's value will change in response to the event and a reasonable basis for quantifying the resulting change in value. Examples of significant events that may occur after the close of the principal market on which a security is traded, or after the time of a price evaluation provided by a pricing service or a dealer, include:
| ■ | With respect to securities traded principally in foreign markets, significant trends in U.S. equity markets or in the trading of foreign securities index futures contracts; |
| ■ | Political or other developments affecting the economy or markets in which an issuer conducts its operations or its securities are traded; |
| ■ | Announcements concerning matters such as acquisitions, recapitalizations, litigation developments, or a natural disaster affecting the issuer's operations or regulatory changes or market developments affecting the issuer's industry. |
The Trustees have adopted procedures whereby the Valuation Committee uses a pricing service to determine the fair value of equity securities traded principally in foreign markets when the Adviser determines that there has been a significant trend in the U.S. equity markets or in index futures trading. For other significant events, the Fund may seek to obtain more current quotations or price evaluations from alternative pricing sources. If a reliable alternative pricing source is not available, the Fund will determine the fair value of the investment in accordance with the fair valuation procedures approved by the Trustees. The Trustees have ultimate responsibility for any fair valuations made in response to a significant event.
Repurchase Agreements
The Fund may invest in repurchase agreements for short-term liquidity purposes. It is the policy of the Fund to require the other party to a repurchase agreement to transfer to the Fund's custodian or sub-custodian eligible securities or cash with a market value (after transaction costs) at least equal to the repurchase price to be paid under the repurchase agreement. The eligible securities are transferred to accounts with the custodian or sub-custodian in which the Fund holds a “securities entitlement” and exercises “control” as those terms are defined in the Uniform Commercial Code. The Fund has established procedures for monitoring the market value of the transferred securities and requiring the transfer of additional eligible securities if necessary to equal at least the repurchase price. These procedures also allow the other party to require securities to be transferred from the account to the extent that their market value exceeds the repurchase price or in exchange for other eligible securities of equivalent market value.
The insolvency of the other party or other failure to repurchase the securities may delay the disposition of the underlying securities or cause the Fund to receive less than the full repurchase price. Under the terms of the repurchase agreement, any amounts received by the Fund in excess of the repurchase price and related transaction costs must be remitted to the other party.
The Fund may enter into repurchase agreements in which eligible securities are transferred into joint trading accounts maintained by the custodian or sub-custodian for investment companies and other clients advised by the Fund's Adviser and its affiliates. The Fund will participate on a pro rata basis with the other investment companies and clients in its share of the securities transferred under such repurchase agreements and in its share of proceeds from any repurchase or other disposition of such securities.
Investment Income, Gains and Losses, Expenses and Distributions
Investment transactions are accounted for on a trade-date basis. Realized gains and losses from investment transactions are recorded on an identified-cost basis. Interest income and expenses are accrued daily. Dividend income and distributions to shareholders are recorded on the ex-dividend date. Foreign dividends are recorded on the ex-dividend date or when the Fund is informed of the ex-dividend date. Distributions of net investment income, if any, are declared daily and paid monthly. Non-cash dividends included in dividend income, if any, are recorded at fair value. Amortization/accretion of premium and discount is included in investment income. The detail of the total fund expense reimbursement of $9,234 is disclosed in this Note 2. For the year ended December 31, 2017, the portfolio accountant reimbursed $9,234 of their fees.
Federal Taxes
It is the Fund's policy to comply with the Subchapter M provision of the Internal Revenue Code (the “Code”) and to distribute to shareholders each year substantially all of its income. Accordingly, no provision for federal income tax is necessary. As of and during the year ended December 31, 2017, the Fund did not have a liability for any uncertain tax positions. The Fund recognizes interest and penalties, if any, related to tax liabilities as income tax expense in the Statement of Operations. As of December 31, 2017, tax years 2014 through 2017 remain subject to examination by the Fund's major tax jurisdictions, which include the United States of America and the Commonwealth of Massachusetts.
When-Issued and Delayed-Delivery Transactions
The Fund may engage in when-issued or delayed-delivery transactions. The Fund records when-issued securities on the trade date and maintains security positions such that sufficient liquid assets will be available to make payment for the securities purchased. Securities purchased on a when-issued or delayed-delivery basis are marked to market daily and begin earning interest on the settlement date. Losses may occur on these transactions due to changes in market conditions or the failure of counterparties to perform under the contract.
Restricted Securities
The Fund may purchase securities which are considered restricted. Restricted securities are securities that either: (a) cannot be offered for public sale without first being registered, or being able to take advantage of an exemption from registration, under the 1933 Act; or (b) are subject to contractual restrictions on public sales. In some cases, when a security cannot be offered for public sale without first being registered, the issuer of the restricted security has agreed to register such securities for resale, at the issuer's expense, either upon demand by the Fund or in connection with another registered offering of the securities. Many such restricted securities may be resold in the secondary market in transactions exempt from registration. Restricted securities may be determined to be liquid under criteria established by the Trustees. The Fund will not incur any registration costs upon such resales. The Fund's restricted securities, like other securities, are priced in accordance with procedures established by and under the general supervision of the Trustees.
Annual Shareholder Report
Other
The preparation of financial statements in conformity with GAAP requires management to make estimates and assumptions that affect the amounts of assets, liabilities, expenses and revenues reported in the financial statements. Actual results could differ from those estimated. The Fund applies investment company accounting and reporting guidance.
3. SHARES OF BENEFICIAL INTEREST
The following table summarizes share activity:
| Year Ended December 31 | 2017 | 2016 |
| Shares sold | 18,074,556 | 9,480,240 |
| Shares issued to shareholders in payment of distributions declared | 1,793,772 | 2,329,849 |
| Shares redeemed | (37,408,198) | (84,799,397) |
| NET CHANGE RESULTING FROM FUND SHARE TRANSACTIONS | (17,539,870) | (72,989,308) |
4. FEDERAL TAX INFORMATION
The timing and character of income and capital gain distributions are determined in accordance with income tax regulations, which may differ from GAAP. These differences are due to differing treatments for regulatory settlement proceeds and discount accretion/premium amortization on debt securities.
For the year ended December 31, 2017, permanent differences identified and reclassified among the components of net assets were as follows:
| Increase (Decrease) |
| Paid-In Capital | Undistributed Net
Investment Income (Loss) | Accumulated Net
Realized Gain (Loss) |
| $(384) | $981,752 | $(981,368) |
Net investment income (loss), net realized gains (losses), and net assets were not affected by this reclassification.
The tax character of distributions as reported on the Statement of Changes in Net Assets for the years ended December 31, 2017 and 2016, was as follows:
| | 2017 | 2016 |
| Ordinary income | $125,022,877 | $146,013,790 |
As of December 31, 2017, the components of distributable earnings on a tax-basis were as follows:
| Undistributed ordinary income | $1,647,787 |
| Unrealized appreciation (depreciation) | $34,400,244 |
| Capital loss carryforwards | $(67,019,552) |
The difference between book-basis and tax-basis net unrealized appreciation/depreciation is attributable to differing treatments for discount accretion/premium amortization on debt securities.
At December 31, 2017, the cost of investments for federal tax purposes was $1,980,185,976. The net unrealized appreciation of investments for federal tax purposes was $34,400,244. This consists of net unrealized appreciation from investments for those securities having an excess of value over cost of $68,704,310 and net unrealized depreciation from investments for those securities having an excess of cost over value of $34,304,066.
At December 31, 2017, the Fund had a capital loss carryforward of $67,019,552 which will reduce the Fund's taxable income arising from future net realized gains on investments, if any, to the extent permitted by the Code, thereby reducing the amount of distributions to shareholders which would otherwise be necessary to relieve the Fund of any liability for federal income tax. Pursuant to the Code, a net capital loss incurred in taxable years beginning after December 22, 2010, retains its character as either short-term or long-term and does not expire. All of the Fund's capital loss carryforwards were incurred in taxable years beginning after December 22, 2010.
The following schedule summarizes the Fund's capital loss carryforwards:
| Short-Term | Long-Term | Total |
| $— | $67,019,552 | $67,019,552 |
The Fund used capital loss carryforwards of $7,545,979 to offset capital gains realized during the year ended December 31, 2017.
Annual Shareholder Report
5. INVESTMENT ADVISER FEE AND OTHER TRANSACTIONS WITH AFFILIATES
Investment Adviser Fee
The Adviser, provides investment adviser services at no fee, because all investors in the Fund are other Federated funds, insurance company separate accounts, common or commingled trust funds or similar organizations or entities that are “accredited investors” within the meaning of Regulation D of the 1933 Act. The Fund pays operating expenses associated with the operation and maintenance of the Fund (excluding fees and expenses that may be charged by the Adviser and its affiliates). Although not contractually obligated to do so, the Adviser intends to initially voluntarily reimburse operating expenses (excluding extraordinary expenses and proxy-related expenses paid by the Fund, if any) such that the Fund will only bear such expenses in an amount of up to 0.15% of the Fund's average daily net assets. The Adviser can modify or terminate this voluntary reimbursement at any time at its sole discretion.
Administrator
Federated Administrative Services (FAS), under the Administrative Services Agreement, provides the Fund with administrative personnel and services. FAS does not charge the Fund a fee but is entitled to certain out-of-pocket expenses.
Interfund Transactions
During the year ended December 31, 2017, the Fund engaged in purchase and sale transactions with funds that have a common investment adviser (or affiliated investment advisers), common Directors/Trustees and/or common Officers. These purchase and sale transactions complied with Rule 17a-7 under the Act and amounted to $381,094 and $802,203, respectively.
Directors'/Trustees' and Miscellaneous Fees
Certain Officers and Trustees of the Fund are Officers and Directors or Trustees of certain of the above companies. To efficiently facilitate payment, Directors'/Trustees' fees and certain expenses related to conducting meetings of the Directors/Trustees and other miscellaneous expenses are paid by an affiliate of the Adviser which in due course are reimbursed by the Fund. These expenses related to conducting meetings of the Directors/Trustees and other miscellaneous expenses may be included in Accrued and Miscellaneous Expenses on the Statement of Assets and Liabilities and Statement of Operations, respectively.
Affiliated Shares of Beneficial Interest
As of December 31, 2017, a majority of the shares of beneficial interest outstanding are owned by other affiliated investment companies.
6. INVESTMENT TRANSACTIONS
Purchases and sales of investments, excluding long-term U.S. government securities and short-term obligations, for the year ended December 31, 2017, were as follows:
| Purchases | $565,812,742 |
| Sales | $711,278,357 |
7. LINE OF CREDIT
The Fund participates with certain other Federated Funds, on a several basis, in an up to $500,000,000 unsecured, 364-day, committed, revolving line of credit (LOC) agreement. The LOC was made available to finance temporarily the repurchase or redemption of shares of the Fund, failed trades, payment of dividends, settlement of trades and for other short-term, temporary or emergency general business purposes. The Fund cannot borrow under the LOC if an inter-fund loan is outstanding. The Fund's ability to borrow under the LOC also is subject to the limitations of the Act and various conditions precedent that must be satisfied before the Fund can borrow. Loans under the LOC are charged interest at a fluctuating rate per annum equal to the highest, on any day, of (a) (i) the federal funds effective rate, (ii) the one month London Interbank Offered Rate (LIBOR), and (iii) 0.0%, plus (b) a margin. The LOC also requires the Fund to pay, quarterly in arrears and at maturity, its pro rata share of a commitment fee based on the amount of the lenders' commitment that has not been utilized. As of December 31, 2017, the Fund had no outstanding loans. During the year ended December 31, 2017, the Fund did not utilize the LOC.
8. INTERFUND LENDING
Pursuant to an Exemptive Order issued by the Securities and Exchange Commission, the Fund, along with other funds advised by subsidiaries of Federated Investors, Inc., may participate in an interfund lending program. This program provides an alternative credit facility allowing the Fund to borrow from other participating affiliated funds. As of December 31, 2017, there were no outstanding loans. During the year ended December 31, 2017, the program was not utilized.
Annual Shareholder Report
Report of Independent Registered Public Accounting Firm
TO THE SHAREHOLDERS AND THE BOARD OF Trustees of High Yield Bond Portfolio:
Opinion on the Financial Statements
We have audited the accompanying statement of assets and liabilities of High Yield Bond Portfolio (the “Fund”) (one of the funds constituting the Federated Core Trust (the “Trust”)), including the portfolio of investments, as of December 31, 2017, and the related statement of operations for the year then ended, the statement of changes in net assets for each of the two years in the period then ended, the financial highlights for each of the five years in the period then ended and the related notes (collectively referred to as the “financial statements”). In our opinion, the financial statements present fairly, in all material respects, the financial position of High Yield Bond Portfolio (one of the funds constituting the Federated Core Trust) at December 31, 2017, the results of its operations for the year then ended, the changes in its net assets for each of the two years in the period then ended and its financial highlights for each of the five years in the period then ended, in conformity with U.S. generally accepted accounting principles.
Basis for Opinion
These financial statements are the responsibility of the Trust's management. Our responsibility is to express an opinion on the Fund's financial statements based on our audits. We are a public accounting firm registered with the Public Company Accounting Oversight Board (United States) (“PCAOB”) and are required to be independent with respect to the Trust in accordance with the U.S. federal securities laws and the applicable rules and regulations of the Securities and Exchange Commission and the PCAOB.
We conducted our audits in accordance with standards of the PCAOB. Those standards require that we plan and perform the audit to obtain reasonable assurance about whether the financial statements are free of material misstatement, whether due to error or fraud. The Trust is not required to have, nor were we engaged to perform, an audit of the Trust's internal control over financial reporting. As part of our audits, we are required to obtain an understanding of internal control over financial reporting, but not for the purpose of expressing an opinion on the effectiveness of the Trust's internal control over financial reporting. Accordingly, we express no such opinion.
Our audits included performing procedures to assess the risks of material misstatement of the financial statements, whether due to error or fraud, and performing procedures that respond to those risks. Such procedures included examining, on a test basis, evidence regarding the amounts and disclosures in the financial statements. Our procedures included confirmation of securities owned as of December 31, 2017, by correspondence with the custodian and others or by other appropriate auditing procedures where replies from others were not received. Our audits also included evaluating the accounting principles used and significant estimates made by management, as well as evaluating the overall presentation of the financial statements. We believe that our audits provide a reasonable basis for our opinion.
We have served as the auditor of one or more Federated investment companies since 1979.
Boston, Massachusetts
February 22, 2018
Annual Shareholder Report
Shareholder Expense Example (unaudited)–High Yield Bond Portfolio
As a shareholder of the Fund, you incur ongoing costs, including to the extent applicable, management fees, distribution (12b-1) fees and/or other service fees and other Fund expenses. This Example is intended to help you to understand your ongoing costs (in dollars) of investing in the Fund and to compare these costs with the ongoing costs of investing in other mutual funds. It is based on an investment of $1,000 invested at the beginning of the period and held for the entire period from July 1, 2017 to December 31, 2017.
ACTUAL EXPENSES
The first section of the table below provides information about actual account values and actual expenses. You may use the information in this section, together with the amount you invested, to estimate the expenses that you incurred over the period. Simply divide your account value by $1,000 (for example, an $8,600 account value divided by $1,000 = 8.6), then multiply the result by the number in the first section under the heading entitled “Expenses Paid During Period” to estimate the expenses attributable to your investment during this period.
HYPOTHETICAL EXAMPLE FOR COMPARISON PURPOSES
The second section of the table below provides information about hypothetical account values and hypothetical expenses based on the Fund's actual expense ratio and an assumed rate of return of 5% per year before expenses, which is not the Fund's actual return. Thus, you should not use the hypothetical account values and expenses to estimate the actual ending account balance or your expenses for the period. Rather, these figures are required to be provided to enable you to compare the ongoing costs of investing in the Fund with other funds. To do so, compare this 5% hypothetical example with the 5% hypothetical examples that appear in the shareholder reports of the other funds.
Please note that the expenses shown in the table are meant to highlight your ongoing costs only. Therefore, the second section of the table is useful in comparing ongoing costs only, and will not help you determine the relative total costs of owning different funds.
| | Beginning
Account Value
7/1/2017 | Ending
Account Value
12/31/2017 | Expenses Paid
During Period1 |
| Actual | $1,000.00 | $1,022.40 | $0.10 |
| Hypothetical (assuming a 5% return before expenses) | $1,000.00 | $1,025.10 | $0.10 |
| 1 | Expenses are equal to the Fund's annualized net expense ratio of 0.02%, multiplied by the average account value over the period, multiplied by 184/365 (to reflect the one-half-year period).
|
Annual Shareholder Report
In Memoriam
With profound sadness, Federated announces the passing of John F. (“Jack”) Donahue and John W. (“John”) McGonigle. They will be greatly missed.
Jack Donahue
(Former Chairman and President, and Emeritus Director/Trustee, of the Federated Funds, and Founder, Former Chairman, President and Chief Executive Officer, and Chairman Emeritus, of Federated Investors, Inc.)
Jack Donahue, along with Richard B. Fisher, founded Federated in 1955 and served as a leader and member of the Boards of Directors/Trustees of the Federated Funds and the Board of Directors of Federated Investors, Inc. Mr. Donahue was a family man of deep faith with exemplary character and fealty, who served his religion, family, community, and the Federated Funds and Federated, as well as their shareholders, officers and employees, with distinction. His integrity, intelligence, and keen sense of fiduciary duty, coupled with his faith, family and background as a West Point graduate and Strategic Air Command B-29 pilot, served as a foundation for his strong business acumen and leadership. Among his many achievements, Mr. Donahue's steadfast and innovative leadership of the Federated Funds and Federated, as well as within the investment management industry, led to the birth of money market funds in the 1970s and their growth as an innovative, efficient and effective cash management vehicle throughout the 1980s, 1990s, 2000s and beyond. Federated expresses deep gratitude to Mr. Donahue for his inspiring leadership, distinguished service and contributions as a husband, father, founder, Board member and officer, colleague and friend.
John McGonigle
(Former Secretary of the Federated Funds, Former Director, Secretary and Chief Legal Officer of Federated Investors, Inc.)
John McGonigle served the Federated Funds and their respective Boards with distinction for more than 50 years as Fund Secretary and also served as Director for several closed-end funds. Mr. McGonigle was a gifted lawyer and wise counselor with a genial presence, keen intellect and convivial demeanor. A man of deep faith, he was a devoted husband, father and grandfather. A graduate of Duquesne University School of Law, Mr. McGonigle served as an officer in the U.S. Army for two years, achieving the rank of Captain. He also served on the staff of the Securities and Exchange Commission before joining Federated in 1966. Among many professional accomplishments, Mr. McGonigle helped fashion the regulatory foundation for money market funds, established Federated's first offshore funds in Ireland, and represented Federated on the Board of Governors of the Investment Company Institute where he was a member of the Executive Committee. Federated expresses deep gratitude for Mr. McGonigle and his impact on his family, friends, the community, and the mutual fund industry.
Board of Trustee and Trust Officers
The Board of Trustee is responsible for managing the Trust's business affairs and for exercising all the Trust's powers except those reserved for the shareholders. The following tables give information about each Trustee and the senior officers of the Fund. Where required, the tables separately list Trustee who are “interested persons” of the Fund (i.e., “Interested” Trustee) and those who are not (i.e., “Independent” Trustee). Unless otherwise noted, the address of each person listed is Federated Investors Tower, 1001 Liberty Avenue, Pittsburgh, PA 15222. The address of all Independent Trustee listed is 4000 Ericsson Drive, Warrendale, PA 15086-7561; Attention: Mutual Fund Board. As of December 31, 2017, the Trust comprised five portfolio(s), and the Federated Fund Family consisted of 40 investment companies (comprising 108 portfolios). Unless otherwise noted, each Officer is elected annually. Unless otherwise noted, each Trustee oversees all portfolios in the Federated Fund Family and serves for an indefinite term. The Fund's Statement of Additional Information includes additional information about Trust Trustee and is available, without charge and upon request, by calling 1-800-341-7400.
Annual Shareholder Report
Interested Trustees Background
Name
Birth Date
Positions Held with Trust
Date Service Began | Principal Occupation(s) for Past Five Years,
Other Directorships Held and Previous Position(s) |
J. Christopher Donahue*
Birth Date: April 11, 1949
President and Trustee
Indefinite Term
Began serving: October 2005 | Principal Occupations: Principal Executive Officer and President of certain of the Funds in the Federated Fund Family; Director or Trustee of the Funds in the Federated Fund Family; President, Chief Executive Officer and Director, Federated Investors, Inc.; Chairman and Trustee, Federated Investment Management Company; Trustee, Federated Investment Counseling; Chairman and Director, Federated Global Investment Management Corp.; Chairman and Trustee, Federated Equity Management Company of Pennsylvania; Trustee, Federated Shareholder Services Company; Director, Federated Services Company.
Previous Positions: President, Federated Investment Counseling; President and Chief Executive Officer, Federated Investment Management Company, Federated Global Investment Management Corp. and Passport Research, Ltd; Chairman, Passport Research, Ltd. |
John B. Fisher*
Birth Date: May 16, 1956
Trustee
Indefinite Term
Began serving: May 2016 | Principal Occupations: Principal Executive Officer and President of certain of the Funds in the Federated Fund Family; Director or Trustee of certain of the Funds in the Federated Fund Family; Vice President, Federated Investors, Inc.; President, Director/Trustee and CEO, Federated Advisory Services Company, Federated Equity Management Company of Pennsylvania, Federated Global Investment Management Corp., Federated Investment Counseling, Federated Investment Management Company; President of some of the Funds in the Federated Fund Complex and Director, Federated Investors Trust Company.
Previous Positions: President and Director of the Institutional Sales Division of Federated Securities Corp.; President and Director of Federated Investment Counseling; President and CEO of Passport Research, Ltd.; Director, Edgewood Securities Corp.; Director, Federated Services Company; Director, Federated Investors, Inc.; Chairman and Director, Southpointe Distribution Services, Inc. and President, Technology, Federated Services Company. |
| * | Reasons for “interested” status: J. Christopher Donahue and John B. Fisher are interested due to their beneficial ownership of shares of Federated Investors, Inc. and due to positions they hold with Federated and its subsidiaries. |
INDEPENDENT Trustees Background
Name
Birth Date
Positions Held with Trust
Date Service Began | Principal Occupation(s) for Past Five Years,
Other Directorships Held, Previous Position(s) and Qualifications |
John T. Collins
Birth Date: January 24, 1947
Trustee
Indefinite Term
Began serving: October 2013 | Principal Occupations: Director or Trustee of the Federated Fund Family; formerly, Chairman and CEO, The Collins Group, Inc. (a private equity firm) (Retired).
Other Directorships Held: Director, Current Chair of the Compensation Committee, KLX Corp.
Qualifications: Mr. Collins has served in several business and financial management roles and directorship positions throughout his career. Mr. Collins previously served as Chairman and CEO, The Collins Group, Inc. (a private equity firm). Mr. Collins serves as Chairman Emeriti, Bentley University. Mr. Collins previously served as Director and Audit Committee Member, Bank of America Corp.; Director, FleetBoston Financial Corp.; and Director, Beth Israel Deaconess Medical Center (Harvard University Affiliate Hospital). |
G. Thomas Hough
Birth Date: February 28, 1955
Trustee
Indefinite Term
Began serving: August 2015 | Principal Occupations: Director or Trustee of the Federated Fund Family; formerly, Vice Chair, Ernst & Young LLP (public accounting firm) (Retired).
Other Directorships Held: Director, Chair of the Audit Committee, Governance Committee, Publix Super Markets, Inc.; Director, Member of the Audit Committee and Technology Committee of Equifax, Inc.
Qualifications: Mr. Hough has served in accounting, business management and directorship positions throughout his career. Mr. Hough most recently held the position of Americas Vice Chair of Assurance with Ernst & Young LLP (public accounting firm). Mr. Hough is an Executive Committee member of the United States Golf Association, he serves on the President's Cabinet and Business School Board of Visitors for the University of Alabama and is on the Business School Board of Visitors for Wake Forest University. |
Annual Shareholder Report
Name
Birth Date
Positions Held with Trust
Date Service Began | Principal Occupation(s) for Past Five Years,
Other Directorships Held, Previous Position(s) and Qualifications |
Maureen Lally-Green
Birth Date: July 5, 1949
Trustee
Indefinite Term
Began serving: August 2009 | Principal Occupations: Director or Trustee of the Federated Fund Family; Dean of the Duquesne University School of Law; Professor and Adjunct Professor of Law, Duquesne University School of Law; formerly, Interim Dean of the Duquesne University School of Law; Associate General Secretary and Director, Office of Church Relations, Diocese of Pittsburgh.
Other Directorships Held: Director, CNX Resources Corporation (formerly known as CONSOL Energy Inc.).
Qualifications: Judge Lally-Green has served in various legal and business roles and directorship positions throughout her career. Judge Lally-Green previously served as: Associate General Secretary, Diocese of Pittsburgh; a member of the Superior Court of Pennsylvania; and as a Professor of Law, Duquesne University School of Law. Judge Lally-Green also currently holds the positions on either a public or not for profit Board of Directors as follows: Director and Chair, UPMC Mercy Hospital; Director and Vice Chair, Our Campaign for the Church Alive!, Inc.; Director, Saint Vincent College; Member, Pennsylvania State Board of Education (public); and Director CNX Resources Corporation (formerly known as CONSOL Energy Inc.), where she currently serves as a member of the Compensation, Nominating and Corporate Governance Committee (Chair) and the Health, Safety and Environmental Committee. Judge Lally-Green has held the positions of: Director, Auberle; Director, Epilepsy Foundation of Western and Central Pennsylvania; Director, Ireland Institute of Pittsburgh; Director, Saint Thomas More Society; Director and Chair, Catholic High Schools of the Diocese of Pittsburgh, Inc.; Director, Pennsylvania Bar Institute; Regent, St. Vincent Seminary; and Director and Chair, Cardinal Wuerl North Catholic High School, Inc. |
Charles F. Mansfield, Jr.
Birth Date: April 10, 1945
Trustee
Indefinite Term
Began serving: November 2005 | Principal Occupations: Director or Trustee of the Federated Fund Family; Management Consultant.
Other Directorships Held: None.
Qualifications: Mr. Mansfield has served as a Marine Corps officer and in several banking, business management, educational roles and directorship positions throughout his long career. He remains active as a Management Consultant. |
Thomas M. O'Neill
Birth Date: June 14, 1951
Trustee
Indefinite Term
Began serving: August 2006 | Principal Occupations: Director or Trustee, Chair of the Audit Committee of the Federated Fund Family; Sole Proprietor, Navigator Management Company (investment and strategic consulting).
Other Directorships Held: None.
Qualifications: Mr. O'Neill has served in several business, mutual fund and financial management roles and directorship positions throughout his career. Mr. O'Neill serves as Director, Medicines for Humanity and Director, The Golisano Children's Museum of Naples, Florida. Mr. O'Neill previously served as Chief Executive Officer and President, Managing Director and Chief Investment Officer, Fleet Investment Advisors; President and Chief Executive Officer, Aeltus Investment Management, Inc.; General Partner, Hellman, Jordan Management Co., Boston, MA; Chief Investment Officer, The Putnam Companies, Boston, MA; Credit Analyst and Lending Officer, Fleet Bank; Director and Consultant, EZE Castle Software (investment order management software); and Director, Midway Pacific (lumber). |
P. Jerome Richey
Birth Date: February 23, 1949
Trustee
Indefinite Term
Began serving: October 2013 | Principal Occupations: Director or Trustee of the Federated Fund Family; Management Consultant; formerly, Senior Vice Chancellor and Chief Legal Officer, University of Pittsburgh and Executive Vice President and Chief Legal Officer, CNX Resources Corporation (formerly known as CONSOL Energy Inc.)
Other Directorships Held: None.
Qualifications: Mr. Richey has served in several business and legal management roles and directorship positions throughout his career. Mr. Richey most recently held the positions of Senior Vice Chancellor and Chief Legal Officer, University of Pittsburgh. Mr. Richey previously served as Chairman of the Board, Epilepsy Foundation of Western Pennsylvania and Chairman of the Board, World Affairs Council of Pittsburgh. Mr. Richey previously served as Chief Legal Officer and Executive Vice President, CNX Resources Corporation (formerly known as CONSOL Energy Inc.); and Board Member, Ethics Counsel and Shareholder, Buchanan Ingersoll & Rooney PC (a law firm). |
John S. Walsh
Birth Date: November 28, 1957
Trustee
Indefinite Term
Began serving: November 2005 | Principal Occupations: Director or Trustee, and Chair of the Board of Directors or Trustees, of the Federated Fund Family; President and Director, Heat Wagon, Inc. (manufacturer of construction temporary heaters); President and Director, Manufacturers Products, Inc. (distributor of portable construction heaters); President, Portable Heater Parts, a division of Manufacturers Products, Inc.
Other Directorships Held: None.
Qualifications: Mr. Walsh has served in several business management roles and directorship positions throughout his career. Mr. Walsh previously served as Vice President, Walsh & Kelly, Inc. (paving contractors). |
Annual Shareholder Report
OFFICERS
Name
Birth Date
Address
Positions Held with Trust
Date Service Began | Principal Occupation(s) for Past Five Years
and Previous Position(s) |
Lori A. Hensler
Birth Date: January 6, 1967
TREASURER
Officer since: April 2013 | Principal Occupations: Principal Financial Officer and Treasurer of the Federated Fund Family; Senior Vice President, Federated Administrative Services; Financial and Operations Principal for Federated Securities Corp. and Edgewood Services, Inc.; and Assistant Treasurer, Federated Investors Trust Company. Ms. Hensler has received the Certified Public Accountant designation.
Previous Positions: Controller of Federated Investors, Inc.; Senior Vice President and Assistant Treasurer, Federated Investors Management Company; Treasurer, Federated Investors Trust Company; Assistant Treasurer, Federated Administrative Services, Federated Administrative Services, Inc., Federated Securities Corp., Edgewood Services, Inc., Federated Advisory Services Company, Federated Equity Management Company of Pennsylvania, Federated Global Investment Management Corp., Federated Investment Counseling, Federated Investment Management Company, Passport Research, Ltd., and Federated MDTA, LLC; Financial and Operations Principal for Federated Securities Corp., Edgewood Services, Inc. and Southpointe Distribution Services, Inc. |
Peter J. Germain
Birth Date: September 3, 1959
CHIEF LEGAL OFFICER, SECRETARY and EXECUTIVE VICE PRESIDENT
Officer since: October 2005 | Principal Occupations: Mr. Germain is Chief Legal Officer, Secretary and Executive Vice President of the Federated Fund Family. He is General Counsel, Chief Legal Officer, Secretary and Executive Vice President, Federated Investors, Inc.; Trustee and Senior Vice President, Federated Investors Management Company; Trustee and President, Federated Administrative Services; Director and President, Federated Administrative Services, Inc.; Director and Vice President, Federated Securities Corp.; Director and Secretary, Federated Private Asset Management, Inc.; Secretary, Federated Shareholder Services Company; and Secretary, Retirement Plan Service Company of America. Mr. Germain joined Federated in 1984 and is a member of the Pennsylvania Bar Association.
Previous Positions: Deputy General Counsel, Special Counsel, Managing Director of Mutual Fund Services, Federated Investors, Inc.; Senior Vice President, Federated Services Company; and Senior Corporate Counsel, Federated Investors, Inc. |
Richard B. Fisher
Birth Date: May 17, 1923
VICE CHAIRMAN
Officer since: October 2005 | Principal Occupations: Vice Chairman or Vice President of some of the Funds in the Federated Fund Family; Vice Chairman, Federated Investors, Inc.; Chairman, Federated Securities Corp.
Previous Positions: President and Director or Trustee of some of the Funds in the Federated Fund Family; Executive Vice President, Federated Investors, Inc.; Director and Chief Executive Officer, Federated Securities Corp. |
Stephen Van Meter
Birth Date: June 5, 1975
CHIEF COMPLIANCE OFFICER AND SENIOR VICE PRESIDENT
Officer since: July 2015 | Principal Occupations: Senior Vice President and Chief Compliance Officer of the Federated Fund Family; Vice President and Chief Compliance Officer of Federated Investors, Inc. and Chief Compliance Officer of certain of its subsidiaries. Mr. Van Meter joined Federated in October 2011. He holds FINRA licenses under Series 3, 7, 24 and 66.
Previous Positions: Mr. Van Meter previously held the position of Compliance Operating Officer, Federated Investors, Inc. Prior to joining Federated, Mr. Van Meter served at the United States Securities and Exchange Commission in the positions of Senior Counsel, Office of Chief Counsel, Division of Investment Management and Senior Counsel, Division of Enforcement. |
Robert J. Ostrowski
Birth Date: April 26, 1963
Chief Investment Officer
Officer since: September 2006 | Principal Occupations: Robert J. Ostrowski joined Federated in 1987 as an Investment Analyst and became a Portfolio Manager in 1990. He was named Chief Investment Officer of Federated's taxable fixed-income products in 2004 and also serves as a Senior Portfolio Manager. Mr. Ostrowski became an Executive Vice President of the Fund's Adviser in 2009 and served as a Senior Vice President of the Fund's Adviser from 1997 to 2009. Mr. Ostrowski has received the Chartered Financial Analyst designation. He received his M.S. in Industrial Administration from Carnegie Mellon University. |
Annual Shareholder Report
Evaluation and Approval of Advisory Contract–May 2017
Federated High-Yield Strategy Portfolio (the “Fund”)
Following a review and recommendation of approval by the Fund's independent trustees, the Fund's Board of Trustees (the “Board”) reviewed and unanimously approved the continuation of the Fund's investment advisory contract for an additional one-year term at its May 2017 meetings. The Board's decision regarding the contract reflects the exercise of its business judgment after considering all of the information received on whether to continue the existing arrangements. The Fund is distinctive in that it is used to implement particular investment strategies that are offered to investors in certain separately managed or wrap fee accounts or programs, or certain other discretionary investments accounts, and may also be offered to other Federated funds.
Federated Investment Management Company (the “Adviser”) does not charge an investment advisory fee for its services, however, it or its affiliates may receive compensation for managing assets invested in the Fund.
The Board had previously appointed a Senior Officer, whose duties include specified responsibilities relating to the process by which advisory fees are to be charged to a Federated fund. The Senior Officer has the authority to retain consultants, experts, or staff as may be reasonably necessary to assist in the performance of his duties, reports directly to the Board, and may be terminated only with the approval of a majority of the independent members of the Board. The Senior Officer prepared and furnished to the Board an independent, written evaluation that covered topics discussed below (the “Senior Officer's Evaluation”). The Board considered the Senior Officer's Evaluation, along with other information, in deciding to approve the investment advisory contract.
As previously noted, the Adviser does not charge an investment advisory fee to this Fund for its services; however, the Board did consider compensation and benefits received by the Adviser, including fees received for services provided to the Fund by Federated Investors, Inc. and its affiliates (“Federated”) and research services received by the Adviser from brokers that execute Federated fund trades. The Board also considered judicial decisions concerning allegedly excessive investment advisory fees in its decision. Using these judicial decisions as a guide, the Board has indicated that the following factors may be relevant to an adviser's fiduciary duty with respect to its receipt of compensation from a fund: (1) the nature and quality of the services provided by an adviser to a fund and its shareholders (including the performance of the Fund and of comparable funds); (2) an adviser's cost of providing the services (including the profitability to an adviser of providing advisory services to a fund); (3) the extent to which an adviser may realize “economies of scale” as a fund grows larger and, if such economies of scale exist, whether they have been shared with a fund and its shareholders or the family of funds; (4) any “fall-out financial benefits” that accrue to an adviser because of its relationship with a fund (including research services received from brokers that execute fund trades and any fees paid to affiliates of an adviser for services rendered to a fund); (5) comparative fee and expense structures (including a comparison of fees paid to an adviser with those paid by similar funds); and (6) the extent of care, conscientiousness and independence with which the Fund's board members perform their duties and their expertise (including whether they are fully informed about all facts the Board deems relevant to its consideration of the Adviser's services and fees). The Board noted that the Securities and Exchange Commission (“SEC”) disclosure requirements regarding the basis for the Board's approval of the Fund's investment advisory contract generally align with the factors listed above. Consistent with the judicial decisions and SEC disclosure requirements, the Board also considered management fees charged to institutional and other clients of the Adviser and its advisory affiliates for what might be viewed as like services. The Board was aware of these factors and was guided by them in its review of the Fund's investment advisory contract to the extent it considered them to be appropriate and relevant, as discussed further below.
The Board considered and weighed these factors in light of its substantial accumulated experience in governing the Fund and working with Federated on matters relating to the Federated funds. The Board was assisted in its deliberations by independent legal counsel. In addition to the extensive materials that comprise and accompany the Senior Officer's Evaluation, the Board received detailed information about the Fund and the Federated organization throughout the year, and in connection with its May meetings. Federated provided much of this information at each regular meeting of the Board, and furnished additional information in connection with the May meetings at which the Board's formal approval of the investment advisory contract occurred. At the May meetings, in addition to meeting in separate sessions of the independent trustees without management present, senior management of the Adviser also met with the independent trustees and their counsel to discuss the materials presented and any other matters thought relevant by the Adviser or the trustees. Between regularly scheduled meetings, the Board also received information on particular matters as the need arose. The Board's consideration of the investment advisory contract included review of the Senior Officer's Evaluation, accompanying data and additional information covering such matters as: the Adviser's investment philosophy, revenue, profitability, personnel and processes; investment and operating strategies; the Fund's short-term and long-term performance (in absolute terms, both on a gross basis and net of expenses, as well as in terms relative to its particular investment program and certain competitor or “peer group” funds and/or other benchmarks, as appropriate) and comments on the reasons for performance; the Fund's investment objectives; the Fund's expenses, including the advisory fee and the overall expense
Annual Shareholder Report
structure of the Fund (both in absolute terms and relative to similar and/or competing funds), with due regard for contractual or voluntary expense limitations; the use and allocation of brokerage commissions derived from trading the Fund's portfolio securities (if any); and the nature, quality and extent of the advisory and other services provided to the Fund by the Adviser and its affiliates. The Board also considered the preferences and expectations of Fund shareholders; the entrepreneurial risk assumed by the Adviser in sponsoring the Fund; the continuing state of competition in the mutual fund industry and market practices; the range of comparable fees for similar funds in the mutual fund industry; the Fund's relationship to the Federated funds which include a comprehensive array of funds with different investment objectives, policies and strategies which are generally available for exchange without the incurrence of additional sales charges; compliance and audit reports concerning the Federated funds and the Federated companies that service them (including communications from regulatory agencies), as well as Federated's responses to any issues raised therein; and relevant developments in the mutual fund industry and how the Federated funds and/or Federated are responding to them. The Board's evaluation process is evolutionary. The criteria considered and the emphasis placed on relevant criteria change in recognition of changing circumstances in the mutual fund marketplace.
The Board considered the nature, extent and quality of the services provided to the Fund by the Adviser and the resources of the Adviser and its affiliates dedicated to the Fund. In this regard, the Board evaluated, among other things, the Adviser's personnel, experience, track record, overall reputation and willingness to invest in personnel and infrastructure that benefit the Fund. In addition, the Board reviewed the qualifications, backgrounds and responsibilities of the portfolio management team primarily responsible for the day-to-day management of the Fund. The Board noted the compliance programs of, and the compliance-related resources provided to, the Fund by the Adviser. The Fund's ability to deliver competitive performance when compared to its benchmark index was also deemed to be relevant by the Board as a useful indicator of how the Adviser is executing the Fund's investment program. The Adviser's ability to execute this program was one of the Board's considerations in reaching a conclusion that the nature, extent and quality of the Adviser's investment management services warrant the continuation of the investment advisory contract.
The Board was informed by the Adviser that, for the periods covered by the Senior Officer's Evaluation, the Fund outperformed its benchmark index for the three-year and five-year periods and underperformed its benchmark index for the one-year period. The Board discussed the Fund's performance with the Adviser and recognized the efforts being taken by the Adviser in the context of other factors considered relevant by the Board.
Following such evaluation, and full deliberations, the Board concluded that the performance of the Fund supported renewal of the Fund's investment advisory contract.
Because the Adviser does not charge the Fund an investment advisory fee, the Board does not consider fee comparisons to other mutual funds or other institutional or separate accounts to be relevant to its deliberations.
The Board also received financial information about Federated, including information regarding the compensation and ancillary (or “fall-out”) benefits Federated derived from its relationships with the Federated funds. As the Adviser does not charge an investment advisory fee for its services, this information generally covered fees received by Federated's subsidiaries for providing other services to the Federated funds under separate contracts (e.g., for serving as the Federated funds' administrator). The information also detailed any indirect benefit Federated may derive from its receipt of research services from brokers who execute Federated fund trades. In addition, the Board considered the fact that, in order for a fund to be competitive in the marketplace, Federated and its affiliates frequently waived fees and/or reimbursed expenses and have disclosed to fund investors and/or indicated to the Board their intention to do so in the future. Moreover, the Board receives regular reporting as to the institution, adjustment or elimination of these voluntary waivers. The Board considered Federated's previous reductions in contractual management fees to certain funds in response to the Senior Officer's recommendations.
The Board and the Senior Officer also reviewed information compiled by Federated comparing its profitability information to other publicly held fund management companies. In this regard, the Senior Officer concluded that Federated's profit margins did not appear to be excessive. The Senior Officer also noted that Federated appeared financially sound, with the resources to fulfill its obligations under its contracts with the Fund.
While the Senior Officer noted certain items for follow-up reporting to the Board and further consideration by management, he stated that his observations and information accompanying the Senior Officer's Evaluation supported a finding by the Board that the management fee for the Fund was reasonable. Under these circumstances, no changes were recommended to, and no objection was raised to, the continuation of the Fund's investment advisory contract.
Annual Shareholder Report
The Board based its decision to approve the investment advisory contract on the totality of the circumstances and relevant factors and with a view to past and future long-term considerations. Not all of the factors and considerations identified above were necessarily relevant to the Fund, nor did the Board consider any one of them to be determinative. In particular, due to the unusual nature of the Fund as primarily an internal product with no advisory fee, the Board does not consider the assessment of whether economies of scale would be realized if the Fund were to grow to a sufficient size to be particularly relevant. With respect to the factors that were relevant, the Board's decision to approve the continuation of the contract reflects its determination that Federated's performance and actions provided a satisfactory basis to support the decision to continue the existing arrangement.
Annual Shareholder Report
Voting Proxies on Fund Portfolio Securities
A description of the policies and procedures that the Fund uses to determine how to vote proxies, if any, relating to securities held in the Fund's portfolio, as well as a report on “Form N-PX” of how the Fund voted any such proxies during the most recent 12-month period ended June 30, are available, without charge and upon request, by calling 1-800-341-7400. A report on “Form N-PX” of how the Fund voted any such proxies during the most recent 12-month period ended June 30 is available via the Proxy Voting Record (Form N-PX) link associated with the Fund at www.FederatedInvestors.com under the “Managed Accounts” section of the “Products” tab. Click on the appropriate asset class or category under “Find Managed Accounts,” where you will be directed to create a password and login to access this information. After you have logged in, select a product name, then click on the “MAPs” link under “Managed Account Pools,” and select the Fund under “Managed Account Pools Available” to access the “Literature” tab. Form N-PX filings are also available at the SEC's website at www.sec.gov.
Quarterly Portfolio Schedule
The Fund files with the SEC a complete schedule of its portfolio holdings, as of the close of the first and third quarters of its fiscal year, on “Form N-Q.” These filings are available on the SEC's website at www.sec.gov and may be reviewed and copied at the SEC's Public Reference Room in Washington, DC. (Call 1-800-SEC-0330 for information on the operation of the Public Reference Room.) You may also access this information at www.FederatedInvestors.com under the “Managed Accounts” section of the “Products” tab. Click on the appropriate asset class or category under “Find Managed Accounts,” where you will be directed to create a password and login to access this information. After you have logged in, select a product name, then click on the “MAPs” link under “Managed Account Pools,” and select the Fund under “Managed Account Pools Available” to access the “Literature” tab.
Annual Shareholder Report
Mutual funds are not bank deposits or obligations, are not guaranteed by any bank and are not insured or guaranteed by the U.S. government, the Federal Deposit Insurance Corporation, the Federal Reserve Board or any other government agency. Investment in mutual funds involves investment risk, including the possible loss of principal.
This Report is authorized for distribution to prospective investors only when preceded or accompanied by the Fund's Prospectus, which contains facts concerning its objective and policies, management fees, expenses and other information.
Federated High-Yield Strategy Portfolio
Federated Investors Funds
4000 Ericsson Drive
Warrendale, PA 15086-7561
Contact us at FederatedInvestors.com
or call 1-800-341-7400.
Federated Securities Corp., Distributor
CUSIP 31421P209
40004 (2/18)
Federated is a registered trademark of Federated Investors, Inc.
2018 ©Federated Investors, Inc.
Annual Shareholder Report
December 31, 2017
Federated Mortgage Strategy Portfolio
A Portfolio of Federated Managed Pool Series
Not FDIC Insured ■ May Lose Value ■ No Bank Guarantee
CONTENTS
| 1 |
| 1 |
| 3 |
| 4 |
| 5 |
| 6 |
| 7 |
| 8 |
| 9 |
| 13 |
| 14 |
| 15 |
| 15 |
| 17 |
| 18 |
| 28 |
| 29 |
| 30 |
| 31 |
| 32 |
| 36 |
| 37 |
| 38 |
| 38 |
| 42 |
| 44 |
| 44 |
Management's Discussion of Fund Performance (unaudited)
The total return of Federated Mortgage Strategy Portfolio (the “Fund”), based on net asset value for the 12-month reporting period ended December 31, 2017, was 2.75%. The Bloomberg Barclays U.S. Mortgage Backed Securities Index (BBMBS),1 the Fund's broad-based securities market index, returned 2.47% during the same period. The Fund's total return for the most recently completed fiscal year reflected actual cash flows, transaction costs and other expenses, which were not reflected in the total return of the BBMBS.
During the reporting period, the Fund's investment strategy focused on: (a) sector allocation; and (b) security selection. These were the most significant factors affecting the Fund's performance relative to the BBMBS.
MARKET OVERVIEW
Policymakers took additional steps towards interest rate normalization with adjustments to the federal funds target rate as well as initiating a reduction of central bank portfolio investments. Rising consumer and business confidence along with over 2 million jobs created during the reporting period provided the Federal Open Market Committee (FOMC) ample evidence that growth was sufficient to support tighter monetary policy. The federal funds target rate was increased three times to a range of 1.25% to 1.50%. Additionally, the Federal Reserve (the “Fed”) commenced a reduction of reinvestment in its mortgage-backed security (MBS)2 and Treasury portfolios in order to slowly shrink its $4.5 trillion portfolio. The combination of a higher federal funds rate and smaller portfolio resulted in tighter monetary policy. Slack demand and tighter monetary policy increased yields for short and intermediate maturity Treasuries, while the bid for higher yielding, non-Treasury sectors was robust.
Investor demand for spread sectors remained strong as positive excess returns were posted across the spectrum of fixed-income sectors including high yield, investment-grade corporate debt,3 and commercial and residential MBS and asset-backed securities (ABS). An environment of steady long-term rates and declining volatility was very supportive of mortgage securities, which posted strong excess returns as mortgage-to-Treasury spreads tightened due to strong buying from real estate investment trusts (REITs) and domestic banks. The Fed reduced MBS and Treasury reinvestment by a monthly maximum of $4 and $6 billion, respectively, beginning in October 2017. While the Fed tightened monetary policy, European and Asian central banks continued to expand balance sheets, flooding the market with increased liquidity in order to support growth. While central bank policies diverged, economic growth converged as growth across developed markets improved. Interest rates remained low in developed markets, supported by easy monetary policy, with the exception of the U.S. where Fed policy led to higher yields for most maturities.
Short and intermediate Treasury yields increased in response to the tightening of monetary policy. Longer-term yields marginally changed, resulting in a flattening of the yield curve that measures the differential between 2- and 10-year yields. 2-year yields increased 70 basis points to 1.88% while 10-year Treasury yields decreased 4 basis points to 2.41%4 during the reporting period.
Sector Allocation
Excess returns posted by commercial mortgages, as well as ABS, exceeded those of government-guaranteed and government-sponsored enterprise (GSE)-issued MBS. With an underweight position in conventional MBS and Ginnie Mae, and allocations to better performing sectors such as agency commercial MBS, private label residential mortgage securities and auto-related asset-backed securities, sector allocation made a positive impact on Fund performance during the reporting period.
Security selection
Within government MBS holdings, a preference for mortgages issued by Fannie Mae and Freddie Mac over Ginnie Mae was advantageous. Ginnie Mae prepayments were notably higher than conventional MBS, reducing demand and negatively impacting value during the reporting period. Security selection made a beneficial impact on Fund performance during the reporting period.
| 1 | Please see the footnotes to the line graph under “Fund Performance and Growth of a $10,000 Investment” below for the definition of, and more information about, the BBMBS. |
| 2 | The value of some mortgage-backed securities may be particularly sensitive to changes in prevailing interest rates, and although the securities are generally supported by some form of government or private insurance, there is no assurance that private guarantors or insurers will meet their obligations. |
| 3 | Investment-grade securities are securities that are rated at least “BBB- (minus)” or unrated securities of a comparable quality. Noninvestment-grade securities are securities that are not rated at least “BBB- (minus)” or unrated securities of a comparable quality. Credit ratings are an indication of the risk that a security will default. They do not protect a security from credit risk. Lower-rated bonds typically offer higher yields to help compensate investors for the increased risk associated with them. Among these risks are lower credit-worthiness, greater price volatility, more risk to principal and income than with higher-rated securities and increased possibilities of default. |
| 4 | Bond prices are sensitive to changes in interest rates, and a rise in interest rates can cause a decline in their prices. |
Annual Shareholder Report
FUND PERFORMANCE AND GROWTH OF A $10,000 INVESTMENT
The graph below illustrates the hypothetical investment of $10,0001 in the Federated Mortgage Strategy Portfolio from December 31, 2007 to December 31, 2017, compared to the Bloomberg Barclays Mortgage Backed Securities Index (BBMBS).2 The Average Annual Total Return table below shows returns averaged over the stated periods.
Growth of a $10,000 Investment
Growth of $10,000 as of December 31, 2017

| Federated Mortgage Strategy Portfolio | | BBMBS |
| F | I |
| 12/31/2007 | 10,000 | 10,000 |
| 12/31/2008 | 10,517 | 10,834 |
| 12/31/2009 | 11,277 | 11,472 |
| 12/31/2010 | 11,858 | 12,088 |
| 12/31/2011 | 12,503 | 12,841 |
| 12/31/2012 | 12,895 | 13,174 |
| 12/31/2013 | 12,626 | 12,988 |
| 12/31/2014 | 13,365 | 13,777 |
| 12/31/2015 | 13,588 | 13,985 |
| 12/31/2016 | 13,900 | 14,219 |
| 12/31/2017 | 14,282 | 14,571 |
41 graphic description end -->
Average Annual Total Returns for the Period Ended 12/31/2017
| | 1 Year | 5 Years | 10 Years |
| Fund | 2.75% | 2.06% | 3.63% |
| BBMBS | 2.47% | 2.04% | 3.84% |
Performance data quoted represents past performance which is no guarantee of future results. Investment return and principal value will fluctuate so that an investor's shares, when redeemed, may be worth more or less than their original cost. Mutual fund performance changes over time and current performance may be lower or higher than what is stated. For current to the most recent month-end performance and after-tax returns, call 1-800-341-7400. Returns shown do not reflect the deduction of taxes that a shareholder would pay on Fund distributions or the redemption of Fund shares. Mutual funds are not obligations of or guaranteed by any bank and are not federally insured.
| 1 | The Fund's performance assumes the reinvestment of all dividends and distributions. The BBMBS has been adjusted to reflect reinvestment of dividends on securities in the index. |
| 2 | The BBMBS covers agency mortgage-backed pass-through securities (both fixed-rate and hybrid ARM) issued by Ginnie Mae (GNMA), Fannie Mae (FNMA) and Freddie Mac (FHLMC). The index is not adjusted to reflect sales loads, expenses or other fees that the Securities and Exchange Commission requires to be reflected in the Fund's performance. The index is unmanaged and, unlike the Fund, is not affected by cash flows. It is not possible to invest directly in an index. |
Annual Shareholder Report
Portfolio of Investments Summary Table (unaudited)
At December 31, 2017, the Fund's portfolio composition1 was as follows:
| Type of Investment | Percentage of
Total Net Assets2 |
| U.S. Government Agency Mortgage-Backed Securities | 81.1% |
| Asset-Backed Securities | 6.8% |
| Non-Agency Mortgage-Backed Securities | 4.5% |
| U.S. Government Agency Commercial Mortgage-Backed Securities | 3.1% |
| Cash Equivalents3 | 5.0% |
| Other Assets and Liabilities—Net4 | (0.5)% |
| TOTAL | 100.0% |
| 1 | See the Fund's Prospectus and Statement of Additional Information for a description of the types of securities in which the Fund invests. |
| 2 | As of the date specified above, the Fund owned shares of one or more affiliated investment companies. For purposes of this table, the affiliated investment company (other than an affiliated money market mutual fund) is not treated as a single portfolio security, but rather the Fund is treated as owning a pro rata portion of each security and each other asset and liability owned by the affiliated investment company. Accordingly, the percentages of total net assets shown in the table will differ from those presented on the Portfolio of Investments. |
| 3 | Cash Equivalents include any investments in money market mutual funds and/or overnight repurchase agreements. |
| 4 | Assets, other than investments in securities, less liabilities. See Statement of Assets and Liabilities. |
Annual Shareholder Report
Portfolio of Investments
December 31, 2017
Shares or
Principal
Amount | | | Value |
| | | INVESTMENT COMPANY—99.7% | |
| 8,443,514 | 1 | Federated Mortgage Core Portfolio
(IDENTIFIED COST $83,244,072) | $82,746,435 |
| | | REPURCHASE AGREEMENT—0.5% | |
| $382,000 | | Interest in $950,000,000 joint repurchase agreement 1.42%, dated 12/29/2017 under which Bank of America, N.A. will repurchase securities provided as collateral for $950,149,889 on 1/2/2018. The securities provided as collateral at the end of the period held with BNY Mellon as tri-party agent, were U.S. Government Agency securities maturing on 7/20/2046 and the market value of those underlying securities was $969,152,887.
(IDENTIFIED COST $382,000) | 382,000 |
| | | TOTAL INVESTMENT IN SECURITIES—100.2%
(IDENTIFIED COST $83,626,072)2 | 83,128,435 |
| | | OTHER ASSETS AND LIABILITIES - NET—(0.2)%3 | (158,560) |
| | | TOTAL NET ASSETS—100% | $82,969,875 |
| 1 | Due to this affiliated holding representing greater than 75% of the Fund's total net assets, a copy of the affiliated holding's most recent Annual Report is included with this Report. |
Affiliated fund holdings are investment companies which are managed by Federated Investment Management Company (the “Adviser”) or an affiliate of the Adviser. Transactions with affiliated fund holdings during the year ended December 31, 2017, were as follows:
| | Federated Mortgage
Core Portfolio |
| Balance of Shares Held 12/31/2016 | 8,512,317 |
| Purchases/Additions | 1,625,904 |
| Sales/Reductions | (1,694,707) |
| Balance of Shares Held 12/31/2017 | 8,443,514 |
| Value | $82,746,435 |
| Change in Unrealized Appreciation/Depreciation | $245,200 |
| Net Realized Gain/(Loss) | $(325,667) |
| Dividend Income | $2,452,075 |
The Fund invests in the Federated Mortgage Core Portfolio (“Mortgage Core”), a portfolio of Federated Core Trust (“Core Trust”), which is managed by the Adviser. Core Trust is an open-end management investment company, registered under the Investment Company Act of 1940, as amended (the “Act”), available only to registered investment companies and other institutional investors. The investment objective of Mortgage Core is to provide total return. Federated Investors, Inc. (“Federated”) receives no advisory or administrative fees from Mortgage Core. Income distributions from Mortgage Core are declared daily and paid monthly. All income distributions are recorded by the Fund as dividend income. Capital gain distributions of Mortgage Core, if any, are declared and paid annually, and are recorded by the Fund as capital gains received. The performance of the Fund is directly affected by the performance of Mortgage Core. The financial statements of Mortgage Core are included within this report to illustrate the security holdings, financial condition, results of operations and changes in net assets of Mortgage Core in which the Fund invested 99.7% of its net assets at December 31, 2017. The financial statements of Mortgage Core should be read in conjunction with the Fund's financial statements. The valuation of securities held by Mortgage Core is discussed in the notes to its financial statements.
| 2 | The cost of investments for federal tax purposes amounts to $84,978,811. |
| 3 | Assets, other than investments in securities, less liabilities. See Statement of Assets and Liabilities. |
Note: The categories of investments are shown as a percentage of total net assets at December 31, 2017.
Various inputs are used in determining the value of the Fund's investments. These inputs are summarized in the three broad levels listed below:
Level 1—quoted prices in active markets for identical securities.
Level 2—other significant observable inputs (including quoted prices for similar securities, interest rates, prepayment speeds, credit risk, etc.). Also includes securities valued at amortized cost.
Level 3—significant unobservable inputs (including the Fund's own assumptions in determining the fair value of investments).
The inputs or methodology used for valuing securities are not an indication of the risk associated with investing in those securities.
As of December 31, 2017, all investments of the Fund, excluding the Investment Company, utilized Level 2 inputs in valuing the Fund's assets carried at fair value. As permitted by U.S. generally accepted accounting principles, the Investment Company valued at $82,746,435 is measured at fair value using the net asset value (NAV) per share practical expedient. The price of shares redeemed in this Investment Company is the next determined NAV after receipt of a shareholder redemption request.
See Notes which are an integral part of the Financial Statements
Annual Shareholder Report
Financial Highlights
(For a Share Outstanding Throughout Each Period)
| Year Ended December 31 | 2017 | 2016 | 2015 | 2014 | 2013 |
| Net Asset Value, Beginning of Period | $9.91 | $9.95 | $10.07 | $9.81 | $10.31 |
| Income From Investment Operations: | | | | | |
| Net investment income | 0.28 | 0.27 | 0.29 | 0.31 | 0.29 |
| Net realized and unrealized gain (loss) on investments | (0.01) | (0.04) | (0.12) | 0.26 | (0.50) |
| TOTAL FROM INVESTMENT OPERATIONS | 0.27 | 0.23 | 0.17 | 0.57 | (0.21) |
| Less Distributions: | | | | | |
| Distributions from net investment income | (0.28) | (0.27) | (0.29) | (0.31) | (0.29) |
| Net Asset Value, End of Period | $9.90 | $9.91 | $9.95 | $10.07 | $9.81 |
| Total Return1 | 2.75% | 2.30% | 1.67% | 5.85% | (2.09)% |
| Ratios to Average Net Assets: | | | | | |
| Net expenses2 | 0.00% | 0.00% | 0.00% | 0.00% | 0.00% |
| Net investment income | 2.82% | 2.67% | 2.86% | 3.07% | 2.86% |
| Expense waiver/reimbursement3 | 0.26% | 0.26% | 0.27% | 0.33% | 0.33% |
| Supplemental Data: | | | | | |
| Net assets, end of period (000 omitted) | $82,970 | $83,685 | $78,397 | $68,304 | $51,429 |
| Portfolio turnover | 18% | 9% | 20% | 16% | 37% |
| 1 | Based on net asset value. |
| 2 | The Adviser has contractually agreed to reimburse all operating expenses, excluding extraordinary expenses, incurred by the Fund. |
| 3 | This expense decrease is reflected in both the net expense and the net investment income ratios shown above. |
See Notes which are an integral part of the Financial Statements
Annual Shareholder Report
Statement of Assets and Liabilities
December 31, 2017
| Assets: | | |
| Investment in securities, at value including $82,746,435 of investment in an affiliated holding (identified cost $83,626,072) | | $83,128,435 |
| Cash | | 650 |
| Income receivable | | 202,951 |
| Receivable for investments sold | | 100,000 |
| Receivable for shares sold | | 22 |
| TOTAL ASSETS | | 83,432,058 |
| Liabilities: | | |
| Payable for investments purchased | $202,905 | |
| Payable for shares redeemed | 74 | |
| Income distribution payable | 199,250 | |
| Payable to adviser (Note 5) | 1,857 | |
| Payable for administrative fees (Note 5) | 546 | |
| Payable for auditing fees | 27,740 | |
| Payable for portfolio accounting fees | 17,906 | |
| Accrued expenses (Note 5) | 11,905 | |
| TOTAL LIABILITIES | | 462,183 |
| Net assets for 8,377,094 shares outstanding | | $82,969,875 |
| Net Assets Consist of: | | |
| Paid-in capital | | $85,133,389 |
| Net unrealized depreciation of investments | | (497,637) |
| Accumulated net realized loss on investments | | (1,667,528) |
| Undistributed net investment income | | 1,651 |
| TOTAL NET ASSETS | | $82,969,875 |
| Net Asset Value, Offering Price and Redemption Proceeds Per Share: | | |
| $82,969,875 ÷ 8,377,094 shares outstanding, no par value, unlimited shares authorized | | $9.90 |
See Notes which are an integral part of the Financial Statements
Annual Shareholder Report
Statement of Operations
Year Ended December 31, 2017
| Investment Income: | | |
| Dividends received from an affiliated holding (see footnotes to Portfolio of Investments) | | $2,452,075 |
| Interest | | 2,231 |
| TOTAL INCOME | | 2,454,306 |
| Expenses: | | |
| Administrative fee (Note 5) | $68,982 | |
| Custodian fees | 6,587 | |
| Transfer agent fee | 8,642 | |
| Directors'/Trustees' fees (Note 5) | 2,141 | |
| Auditing fees | 27,740 | |
| Legal fees | 8,641 | |
| Portfolio accounting fees | 44,280 | |
| Share registration costs | 20,466 | |
| Printing and postage | 16,310 | |
| Commitment fee (Note 7) | 11,276 | |
| Miscellaneous (Note 5) | 10,931 | |
| TOTAL EXPENSES | 225,996 | |
| Reimbursement of other operating expenses (Note 5) | (225,996) | |
| Net investment income | | 2,454,306 |
| Realized and Unrealized Gain (Loss) on Investments: | | |
| Net realized loss on investments in an affiliated holding | | (325,667) |
| Net change in unrealized depreciation of investments in an affiliated fund holding | | 245,200 |
| Net realized and unrealized loss on investments | | (80,467) |
| Change in net assets resulting from operations | | $2,373,839 |
See Notes which are an integral part of the Financial Statements
Annual Shareholder Report
Statement of Changes in Net Assets
| Year Ended December 31 | 2017 | 2016 |
| Increase (Decrease) in Net Assets | | |
| Operations: | | |
| Net investment income | $2,454,306 | $2,176,300 |
| Net realized loss on investments | (325,667) | (83,902) |
| Net change in unrealized appreciation/depreciation of investments | 245,200 | (323,338) |
| CHANGE IN NET ASSETS RESULTING FROM OPERATIONS | 2,373,839 | 1,769,060 |
| Distributions to Shareholders: | | |
| Distributions from net investment income | (2,454,228) | (2,175,973) |
| Share Transactions: | | |
| Proceeds from sale of shares | 20,068,381 | 14,019,047 |
| Net asset value of shares issued to shareholders in payment of distributions declared | 38,594 | 21,247 |
| Cost of shares redeemed | (20,742,138) | (8,345,084) |
| CHANGE IN NET ASSETS RESULTING FROM SHARE TRANSACTIONS | (635,163) | 5,695,210 |
| Change in net assets | (715,552) | 5,288,297 |
| Net Assets: | | |
| Beginning of period | 83,685,427 | 78,397,130 |
| End of period (including undistributed net investment income of $1,651 and $1,573, respectively) | $82,969,875 | $83,685,427 |
See Notes which are an integral part of the Financial Statements
Annual Shareholder Report
Notes to Financial Statements
December 31, 2017
1. ORGANIZATION
Federated Managed Pool Series (the “Trust”) is registered under the Act, as an open-end management investment company. The Trust consists of five portfolios. The financial statements included herein are only those of Federated Mortgage Strategy Portfolio (the “Fund”), a non-diversified portfolio. The financial statements of the other portfolios are presented separately. The assets of each portfolio are segregated and a shareholder's interest is limited to the portfolio in which shares are held. Each portfolio pays its own expenses. The investment objective of the Fund is to provide total return by investing primarily in a mortgage-backed securities mutual fund and individual mortgage-backed securities, including collateralized mortgage obligations.
2. SIGNIFICANT ACCOUNTING POLICIES
The following is a summary of significant accounting policies consistently followed by the Fund in the preparation of its financial statements. These policies are in conformity with U.S. generally accepted accounting principles (GAAP).
Investment Valuation
In calculating its NAV, the Fund generally values investments as follows:
| ■ | Shares of other mutual funds or non-exchange-traded investment companies are valued based upon their reported NAVs. |
| ■ | Fixed-income securities are fair valued using price evaluations provided by a pricing service approved by the Fund's Board of Trustees (the “Trustees”). |
| ■ | Derivative contracts listed on exchanges are valued at their reported settlement or closing price, except that options are valued at the mean of closing bid and asked quotations. |
| ■ | Over-the-counter (OTC) derivative contracts are fair valued using price evaluations provided by a pricing service approved by the Trustees. |
| ■ | For securities that are fair valued in accordance with procedures established by and under the general supervision of the Trustees, certain factors may be considered such as: the last traded or purchase price of the security, information obtained by contacting the issuer or dealers, analysis of the issuer's financial statements or other available documents, fundamental analytical data, the nature and duration of restrictions on disposition, the movement of the market in which the security is normally traded, public trading in similar securities or derivative contracts of the issuer or comparable issuers, movement of a relevant index, or other factors including but not limited to industry changes and relevant government actions. |
If any price, quotation, price evaluation or other pricing source is not readily available when the NAV is calculated, if the Fund cannot obtain price evaluations from a pricing service or from more than one dealer for an investment within a reasonable period of time as set forth in the Fund's valuation policies and procedures, or if information furnished by a pricing service, in the opinion of the valuation committee (“Valuation Committee”), is deemed not representative of the fair value of such security, the Fund uses the fair value of the investment determined in accordance with the procedures described below. There can be no assurance that the Fund could obtain the fair value assigned to an investment if it sold the investment at approximately the time at which the Fund determines its NAV per share.
Fair Valuation Procedures
The Trustees have ultimate responsibility for determining the fair value of investments for which market quotations are not readily available. The Trustees have appointed a Valuation Committee comprised of officers of the Fund, the Adviser and certain of the Adviser's affiliated companies to assist in determining fair value and in overseeing the calculation of the NAV. The Trustees have also authorized the use of pricing services recommended by the Valuation Committee to provide fair value evaluations of the current value of certain investments for purposes of calculating the NAV. The Valuation Committee employs various methods for reviewing third-party pricing-service evaluations including periodic reviews of third-party pricing services' policies, procedures and valuation methods (including key inputs, methods, models and assumptions), transactional back-testing, comparisons of evaluations of different pricing services, and review of price challenges by the Adviser based on recent market activity. In the event that market quotations and price evaluations are not available for an investment, the Valuation Committee determines the fair value of the investment in accordance with procedures adopted by the Trustees. The Trustees periodically review and approve the fair valuations made by the Valuation Committee and any changes made to the procedures.
Factors considered by pricing services in evaluating an investment include the yields or prices of investments of comparable quality, coupon, maturity, call rights and other potential prepayments, terms and type, reported transactions, indications as to values from dealers and general market conditions. Some pricing services provide a single price evaluation reflecting the bid-side of the market for an investment (a “bid” evaluation). Other pricing services offer both bid evaluations and price evaluations indicative of a price between the prices bid and asked for the investment (a “mid” evaluation). The Fund normally uses bid evaluations for any U.S. Treasury and Agency securities, mortgage-backed securities and municipal securities. The Fund normally uses mid evaluations for any other types of fixed-income securities and any OTC derivative contracts. In the event that market quotations and price evaluations are not available for an investment, the fair value of the investment is determined in accordance with procedures adopted by the Trustees.
Repurchase Agreements
The Fund may invest in repurchase agreements for short-term liquidity purposes. It is the policy of the Fund to require the other party to a repurchase agreement to transfer to the Fund's custodian or sub-custodian eligible securities or cash with a market value (after transaction costs) at least equal to the repurchase price to be paid under the repurchase agreement. The eligible securities are transferred to accounts with the custodian or sub-custodian in which the Fund holds a “securities entitlement” and exercises “control” as those terms are defined in the Uniform
Annual Shareholder Report
Commercial Code. The Fund has established procedures for monitoring the market value of the transferred securities and requiring the transfer of additional eligible securities if necessary to equal at least the repurchase price. These procedures also allow the other party to require securities to be transferred from the account to the extent that their market value exceeds the repurchase price or in exchange for other eligible securities of equivalent market value.
The insolvency of the other party or other failure to repurchase the securities may delay the disposition of the underlying securities or cause the Fund to receive less than the full repurchase price. Under the terms of the repurchase agreement, any amounts received by the Fund in excess of the repurchase price and related transaction costs must be remitted to the other party.
The Fund may enter into repurchase agreements in which eligible securities are transferred into joint trading accounts maintained by the custodian or sub-custodian for investment companies and other clients advised by the Fund's Adviser and its affiliates. The Fund will participate on a pro rata basis with the other investment companies and clients in its share of the securities transferred under such repurchase agreements and in its share of proceeds from any repurchase or other disposition of such securities.
Repurchase agreements are subject to Master Netting Agreements which are agreements between the Fund and its counterparties that provide for the net settlement of all transactions and collateral with the Fund, through a single payment, in the event of default or termination. Amounts presented on the Portfolio of Investments and Statement of Assets and Liabilities are not net settlement amounts but gross. As indicated above, the cash or securities to be repurchased, as shown on the Portfolio of Investments, exceeds the repurchase price to be paid under the agreement reducing the net settlement amount to zero.
Investment Income, Gains and Losses, Expenses and Distributions
Investment transactions are accounted for on a trade-date basis. Realized gains and losses from investment transactions are recorded on an identified-cost basis. Interest income and expenses are accrued daily. Dividend income and distributions to shareholders are recorded on the ex-dividend date. Distributions of net investment income, if any, are declared daily and paid monthly. Amortization/accretion of premium and discount is included in investment income. The detail of the total fund expense reimbursement of $225,996 is disclosed in Note 5.
Federal Taxes
It is the Fund's policy to comply with the Subchapter M provision of the Internal Revenue Code (the “Code”) and to distribute to shareholders each year substantially all of its income. Accordingly, no provision for federal income tax is necessary. As of and during the year ended December 31, 2017, the Fund did not have a liability for any uncertain tax positions. The Fund recognizes interest and penalties, if any, related to tax liabilities as income tax expense in the Statement of Operations. As of December 31, 2017, tax years 2014 through 2017 remain subject to examination by the Fund's major tax jurisdictions, which include the United States of America and the Commonwealth of Massachusetts.
When-Issued and Delayed-Delivery Transactions
The Fund may engage in when-issued or delayed-delivery transactions. The Fund records when-issued securities on the trade date and maintains security positions such that sufficient liquid assets will be available to make payment for the securities purchased. Securities purchased on a when-issued or delayed-delivery basis are marked to market daily and begin earning interest on the settlement date. Losses may occur on these transactions due to changes in market conditions or the failure of counterparties to perform under the contract.
Other
The preparation of financial statements in conformity with GAAP requires management to make estimates and assumptions that affect the amounts of assets, liabilities, expenses and revenues reported in the financial statements. Actual results could differ from those estimated. The Fund applies investment company accounting and reporting guidance.
3. SHARES OF BENEFICIAL INTEREST
The following table summarizes share activity:
| Year Ended December 31 | 2017 | 2016 |
| Shares sold | 2,020,856 | 1,390,838 |
| Shares issued to shareholders in payment of distributions declared | 3,886 | 2,107 |
| Shares redeemed | (2,088,738) | (827,967) |
| NET CHANGE RESULTING FROM FUND SHARE TRANSACTIONS | (63,996) | 564,978 |
4. FEDERAL TAX INFORMATION
The tax character of distributions as reported on the Statement of Changes in Net Assets for the years ended December 31, 2017 and 2016, was as follows:
| | 2017 | 2016 |
| Ordinary income | $2,454,228 | $2,175,973 |
As of December 31, 2017, the components of distributable earnings on a tax-basis were as follows:
| Undistributed ordinary income | $1,651 |
| Net unrealized depreciation | $(1,850,376) |
| Capital loss carryforwards | $(314,789) |
Annual Shareholder Report
The difference between book-basis and tax-basis net unrealized appreciation/depreciation is attributable to differing treatments for the deferral of losses on wash sales.
At December 31, 2017, the cost of investments for federal tax purposes was $84,978,811. The net unrealized depreciation of investments for federal tax purposes was $1,850,376. This consists entirely of net unrealized depreciation from investments for those securities having an excess of cost over value of $1,850,376.
At December 31, 2017, the Fund had a capital loss carryforward of $314,789 which will reduce the Fund's taxable income arising from future net realized gains on investments, if any, to the extent permitted by the Code, thereby reducing the amount of distributions to shareholders which would otherwise be necessary to relieve the Fund of any liability for federal income tax. Pursuant to the Code, a net capital loss incurred in taxable years beginning after December 22, 2010, retains its character as either short-term or long-term and does not expire. All of the Fund's capital loss carryforwards were incurred in taxable years beginning after December 22, 2010.
The following schedule summarizes the Fund's capital loss carryforwards:
| Short-Term | Long-Term | Total |
| $— | $(314,789) | $(314,789) |
5. INVESTMENT ADVISER FEE AND OTHER TRANSACTIONS WITH AFFILIATES
Investment Adviser Fee
The Adviser provides investment adviser services at no fee because all eligible investors are: (1) in separately managed or wrap fee programs, who often pay a single aggregate fee to the wrap program sponsor for all costs and expenses of the wrap fee programs; or (2) in certain other separately managed accounts and discretionary investment accounts. The Adviser has contractually agreed to reimburse all expenses of the Fund, excluding extraordinary expenses. Acquired fund fees and expenses are not direct obligations of the Fund and are not contractual reimbursements under the investment advisory contract. For the year ended December 31, 2017, the Adviser reimbursed $225,996 of other operating expenses.
Administrative Fee
Federated Administrative Services (FAS), under the Administrative Services Agreement, provides the Fund with administrative personnel and services. For purposes of determining the appropriate rate breakpoint, “Investment Complex” is defined as all of the Federated Funds subject to a fee under the Administrative Services Agreement. The fee paid to FAS is based on the average daily net assets of the Investment Complex as specified below:
| Administrative Fee | Average Daily Net Assets
of the Investment Complex |
| 0.100% | on assets up to $50 billion |
| 0.075% | on assets over $50 billion |
Subject to the terms described in the Expense Limitation note, FAS may voluntarily choose to waive any portion of its fee. For the year ended December 31, 2017, the annualized fee paid to FAS was 0.079% of average daily net assets of the Fund.
Prior to September 1, 2017, the breakpoints of the Administrative Fee paid to FAS, described above, were:
| Administrative Fee | Average Daily Net Assets
of the Investment Complex |
| 0.150% | on the first $5 billion |
| 0.125% | on the next $5 billion |
| 0.100% | on the next $10 billion |
| 0.075% | on assets in excess of $20 billion |
In addition, FAS may charge certain out-of-pocket expenses to the Fund.
For the year ended December 31, 2017, the Fund's Adviser reimbursed the Fund for any fee paid to FAS.
Directors'/Trustees' and Miscellaneous Fees
Certain Officers and Trustees of the Fund are Officers and Directors or Trustees of certain of the above companies. To efficiently facilitate payment, Directors'/Trustees' fees and certain expenses related to conducting meetings of the Directors/Trustees and other miscellaneous expenses are paid by an affiliate of the Adviser which in due course are reimbursed by the Fund. These expenses related to conducting meetings of the Directors/Trustees and other miscellaneous expenses may be included in Accrued and Miscellaneous Expenses on the Statement of Assets and Liabilities and Statement of Operations, respectively.
6. INVESTMENT TRANSACTIONS
Purchases and sales of investments, excluding long-term U.S. government securities and short-term obligations, for the year ended December 31, 2017, were as follows:
| Purchases | $15,981,075 |
| Sales | $16,660,000 |
Annual Shareholder Report
7. LINE OF CREDIT
The Fund participates with certain other Federated Funds, on a several basis, in an up to $500,000,000 unsecured, 364-day, committed, revolving line of credit (LOC) agreement. The LOC was made available to finance temporarily the repurchase or redemption of shares of the Fund, failed trades, payment of dividends, settlement of trades and for other short-term, temporary or emergency general business purposes. The Fund cannot borrow under the LOC if an inter-fund loan is outstanding. The Fund's ability to borrow under the LOC also is subject to the limitations of the Act and various conditions precedent that must be satisfied before the Fund can borrow. Loans under the LOC are charged interest at a fluctuating rate per annum equal to the highest, on any day, of (a) (i) the federal funds effective rate, (ii) the one month London Interbank Offered Rate (LIBOR), and (iii) 0.0%, plus (b) a margin. The LOC also requires the Fund to pay, quarterly in arrears and at maturity, its pro rata share of a commitment fee based on the amount of the lenders' commitment that has not been utilized. As of December 31, 2017, the Fund had no outstanding loans. During the year ended December 31, 2017, the Fund did not utilize the LOC.
8. INTERFUND LENDING
Pursuant to an Exemptive Order issued by the Securities and Exchange Commission, the Fund, along with other funds advised by subsidiaries of Federated Investors, Inc., may participate in an interfund lending program. This program provides an alternative credit facility allowing the Fund to borrow from other participating affiliated funds. As of December 31, 2017, there were no outstanding loans. During the year ended December 31, 2017, the program was not utilized.
Annual Shareholder Report
Report of Independent Registered Public Accounting Firm
TO THE SHAREHOLDERS AND THE BOARD OF TRUSTEES OF FEDERATED MORTGAGE STRATEGY PORTFOLIO:
Opinion on the Financial Statements
We have audited the accompanying statement of assets and liabilities of Federated Mortgage Strategy Portfolio (the “Fund”) (one of the funds constituting the Federated Managed Pool Series (the “Trust”)), including the portfolio of investments, as of December 31, 2017, and the related statement of operations for the year then ended, the statement of changes in net assets for each of the two years in the period then ended, the financial highlights for each of the five years in the period then ended and the related notes (collectively referred to as the “financial statements”). In our opinion, the financial statements present fairly, in all material respects, the financial position of Federated Mortgage Strategy Portfolio (one of the funds constituting the Federated Managed Pool Series) at December 31, 2017, the results of its operations for the year then ended, the changes in its net assets for each of the two years in the period then ended and its financial highlights for each of the five years in the period then ended, in conformity with U.S. generally accepted accounting principles.
Basis for Opinion
These financial statements are the responsibility of the Trust's management. Our responsibility is to express an opinion on the Fund's financial statements based on our audits. We are a public accounting firm registered with the Public Company Accounting Oversight Board (United States) (“PCAOB”) and are required to be independent with respect to the Trust in accordance with the U.S. federal securities laws and the applicable rules and regulations of the Securities and Exchange Commission and the PCAOB.
We conducted our audits in accordance with standards of the PCAOB. Those standards require that we plan and perform the audit to obtain reasonable assurance about whether the financial statements are free of material misstatement, whether due to error or fraud. The Trust is not required to have, nor were we engaged to perform, an audit of the Trust's internal control over financial reporting. As part of our audits, we are required to obtain an understanding of internal control over financial reporting, but not for the purpose of expressing an opinion on the effectiveness of the Trust's internal control over financial reporting. Accordingly, we express no such opinion.
Our audits included performing procedures to assess the risks of material misstatement of the financial statements, whether due to error or fraud, and performing procedures that respond to those risks. Such procedures included examining, on a test basis, evidence regarding the amounts and disclosures in the financial statements. Our procedures included confirmation of securities owned as of December 31, 2017, by correspondence with the custodian and others or by other appropriate auditing procedures where replies from others were not received. Our audits also included evaluating the accounting principles used and significant estimates made by management, as well as evaluating the overall presentation of the financial statements. We believe that our audits provide a reasonable basis for our opinion.
We have served as the auditor of one or more Federated investment companies since 1979.
Boston, Massachusetts
February 22, 2018
Annual Shareholder Report
Shareholder Expense Example (unaudited)
As a shareholder of the Fund, you incur ongoing costs, including to the extent applicable, management fees, distribution (12b-1) fees and/or other service fees and other Fund expenses. This Example is intended to help you to understand your ongoing costs (in dollars) of investing in the Fund and to compare these costs with the ongoing costs of investing in other mutual funds. It is based on an investment of $1,000 invested at the beginning of the period and held for the entire period from July 1, 2017 to December 31, 2017.
ACTUAL EXPENSES
The first section of the table below provides information about actual account values and actual expenses. You may use the information in this section, together with the amount you invested, to estimate the expenses that you incurred over the period. Simply divide your account value by $1,000 (for example, an $8,600 account value divided by $1,000 = 8.6), then multiply the result by the number in the first section under the heading entitled “Expenses Paid During Period” to estimate the expenses attributable to your investment during this period.
HYPOTHETICAL EXAMPLE FOR COMPARISON PURPOSES
The second section of the table below provides information about hypothetical account values and hypothetical expenses based on the Fund's actual expense ratio and an assumed rate of return of 5% per year before expenses, which is not the Fund's actual return. Thus, you should not use the hypothetical account values and expenses to estimate the actual ending account balance or your expenses for the period. Rather, these figures are required to be provided to enable you to compare the ongoing costs of investing in the Fund with other funds. To do so, compare this 5% hypothetical example with the 5% hypothetical examples that appear in the shareholder reports of the other funds.
Please note that the expenses shown in the table are meant to highlight your ongoing costs only. Therefore, the second section of the table is useful in comparing ongoing costs only, and will not help you determine the relative total costs of owning different funds.
| | Beginning
Account Value
7/1/2017 | Ending
Account Value
12/31/2017 | Expenses Paid
During Period1 |
| Actual | $1,000.00 | $1,011.30 | $0.00 |
| Hypothetical (assuming a 5% return before expenses) | $1,000.00 | $1,025.20 | $0.00 |
| 1 | Expenses are equal to the Fund's annualized net expense ratio of 0.00%, multiplied by the average account value over the period, multiplied by 184/365 (to reflect the one-half-year period). The Adviser has contractually agreed to reimburse all expenses, excluding extraordinary expenses incurred by the Fund. This agreement has no fixed term.
|
Annual Shareholder Report
Management's Discussion of Fund Performance (unaudited)– Federated Mortgage Core Portfolio
The total return of Federated Mortgage Core Portfolio (the “Fund”), based on net asset value for the 12-month reporting period ended December 31, 2017, was 2.75%. The Bloomberg Barclays U.S. Mortgage Backed Securities Index (BBMBS),1 the Fund's broad-based securities market index, returned 2.47% for the same period. The Fund's total return for the most recently completed fiscal year reflected actual cash flows, transaction costs and other expenses, which were not reflected in the total return of the BBMBS.
During the reporting period, the Fund's investment strategy focused on: (a) sector allocation; and (b) security selection. These were the most significant factors affecting the Fund's performance relative to the BBMBS.
MARKET OVERVIEW
Policymakers took additional steps towards interest rate normalization with adjustments to the federal funds target rate as well as initiating a reduction of central bank portfolio investments. Rising consumer and business confidence along with over 2 million jobs created during the reporting period provided the Federal Open Market Committee (FOMC) ample evidence that growth was sufficient to support tighter monetary policy. The federal funds target rate was increased three times to a range of 1.25% to 1.50%. Additionally, the Federal Reserve (the “Fed”) commenced a reduction of reinvestment in its mortgage-backed security (MBS)2 and Treasury portfolios in order to slowly shrink its $4.5 trillion portfolio. The combination of a higher federal funds rate and smaller portfolio resulted in tighter monetary policy. Slack demand and tighter monetary policy increased yields for short and intermediate maturity Treasuries, while the bid for higher yielding, non-Treasury sectors was robust.
Investor demand for spread sectors remained strong as positive excess returns were posted across the spectrum of fixed-income sectors including high yield, investment-grade corporate debt,3 and commercial and residential MBS and asset-backed securities (ABS). An environment of steady long-term rates and declining volatility was very supportive of mortgage securities, which posted strong excess returns as mortgage-to-Treasury spreads tightened due to strong buying from real estate investment trusts (REITs) and domestic banks. The Fed reduced MBS and Treasury reinvestment by a monthly maximum of $4 and $6 billion, respectively, beginning in October 2017. While the Fed tightened monetary policy, European and Asian central banks continued to expand balance sheets, flooding the market with increased liquidity in order to support growth. While central bank policies diverged, economic growth converged as growth across developed markets improved. Interest rates remained low in developed markets, supported by easy monetary policy, with the exception of the U.S. where Fed policy led to higher yields for most maturities.
Short and intermediate Treasury yields increased in response to the tightening of monetary policy. Longer-term yields marginally changed, resulting in a flattening of the yield curve that measures the differential between 2- and 10-year yields. 2-year yields increased 70 basis points to 1.88% while 10-year Treasury yields decreased 4 basis points to 2.41%4 during the reporting period.
Sector Allocation
Excess returns posted by commercial mortgages, as well as ABS, exceeded those of government-guaranteed and government-sponsored enterprise (GSE)-issued MBS. With an underweight position in conventional MBS and Ginnie Mae, and allocations to better performing sectors such as agency commercial MBS, private label residential mortgage securities and auto-related asset-backed securities, sector allocation made a positive impact on Fund performance during the reporting period.
Security selection
Within government MBS holdings, a preference for mortgages issued by Fannie Mae and Freddie Mac over Ginnie Mae was advantageous. Ginnie Mae prepayments were notably higher than conventional MBS, reducing demand and negatively impacting value during the reporting period. Security selection made a beneficial impact on Fund performance during the reporting period.
| 1 | Please see the footnotes to the line graph under “Fund Performance and Growth of a $10,000 Investment” below for the definition of, and more information about, the BBMBS. |
| 2 | The value of some mortgage-backed securities may be particularly sensitive to changes in prevailing interest rates, and although the securities are generally supported by some form of government or private insurance, there is no assurance that private guarantors or insurers will meet their obligations. |
| 3 | Investment-grade securities are securities that are rated at least “BBB- (minus)” or unrated securities of a comparable quality. Noninvestment-grade securities are securities that are not rated at least “BBB- (minus)” or unrated securities of a comparable quality. Credit ratings are an indication of the risk that a security will default. They do not protect a security from credit risk. Lower-rated bonds typically offer higher yields to help compensate investors for the increased risk associated with them. Among these risks are lower credit-worthiness, greater price volatility, more risk to principal and income than with higher-rated securities and increased possibilities of default. |
| 4 | Bond prices are sensitive to changes in interest rates, and a rise in interest rates can cause a decline in their prices. |
Annual Shareholder Report
FUND PERFORMANCE AND GROWTH OF A $10,000 INVESTMENT
The graph below illustrates the hypothetical investment of $10,0001 in the Federated Mortgage Core Portfolio from December 31, 2007 to December 31, 2017, compared to the Bloomberg Barclays U.S. Mortgage Backed Securities Index (BBMBS).2 The Average Annual Total Return table below shows returns averaged over the stated periods.
Growth of a $10,000 Investment
Growth of $10,000 as of December 31, 2017
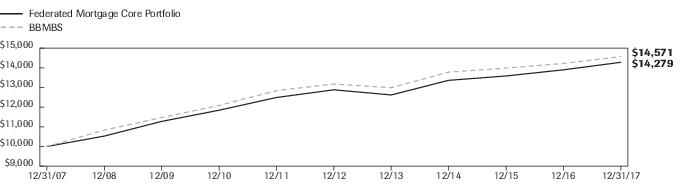
| Federated Mortgage Core Portfolio | | NA | BBMBS |
| F | NA | I |
| 12/31/2007 | 10,000 | | 10,000 |
| 12/31/2008 | 10,528 | | 10,834 |
| 12/31/2009 | 11,275 | | 11,472 |
| 12/31/2010 | 11,843 | | 12,088 |
| 12/31/2011 | 12,489 | | 12,841 |
| 12/31/2012 | 12,881 | | 13,174 |
| 12/31/2013 | 12,619 | | 12,988 |
| 12/31/2014 | 13,362 | | 13,777 |
| 12/31/2015 | 13,584 | | 13,985 |
| 12/31/2016 | 13,896 | | 14,219 |
| 12/31/2017 | 14,279 | | 14,571 |
41 graphic description end -->
Average Annual Total Returns for the Period Ended 12/31/2017
| | 1 Year | 5 Years | 10 Years |
| Fund | 2.75% | 2.08% | 3.63% |
| BBMBS | 2.47% | 2.04% | 3.84% |
Performance data quoted represents past performance which is no guarantee of future results. Investment return and principal value will fluctuate so that an investor's shares, when redeemed, may be worth more or less than their original cost. Mutual fund performance changes over time and current performance may be lower or higher than what is stated. For current to the most recent month-end performance and after-tax returns, call 1-800-341-7400. Returns shown do not reflect the deduction of taxes that a shareholder would pay on Fund distributions or the redemption of Fund shares. Mutual funds are not obligations of or guaranteed by any bank and are not federally insured.
| 1 | The Fund's performance assumes the reinvestment of all dividends and distributions. The BBMBS has been adjusted to reflect reinvestment of dividends on securities in the index. |
| 2 | The BBMBS covers agency mortgage-backed pass-through securities (both fixed-rate and hybrid ARM) issued by Ginnie Mae (GNMA), Fannie Mae (FNMA) and Freddie Mac (FHLMC). The index is not adjusted to reflect sales loads, expenses or other fees that the Securities and Exchange Commission requires to be reflected in the Fund's performance. The index is unmanaged and, unlike the Fund, is not affected by cash flows. It is not possible to invest directly in an index. |
Annual Shareholder Report
Portfolio of Investments Summary Table (unaudited)– Federated Mortgage Core Portfolio
At December 31, 2017, the Fund's portfolio composition1 was as follows:
| Type of Investment | Percentage of
Total Net Assets |
| U.S. Government Agency Mortgage-Backed Securities | 81.1% |
| Asset-Backed Securities | 6.8% |
| Non-Agency Mortgage-Backed Securities | 4.5% |
| U.S. Government Agency Commercial Mortgage-Backed Securities | 3.1% |
| Cash Equivalents2 | 4.5% |
| Other Assets and Liabilities—Net3,4 | (0.0)% |
| TOTAL | 100.0% |
| 1 | See the Fund's Private Offering Memorandum for a description of the principal types of securities in which the Fund invests. |
| 2 | Cash Equivalents include any investments in money market mutual funds and/or overnight repurchase agreements. |
| 3 | Assets, other than investments in securities, less liabilities. See Statement of Assets and Liabilities. |
| 4 | Represents less than 0.1%. |
Annual Shareholder Report
Portfolio of Investments–Federated Mortgage Core Portfolio
December 31, 2017
Principal
Amount
or Shares | | | Value |
| | | ASSET-BACKED SECURITIES—6.8% | |
| | | Auto Receivables—5.7% | |
| $12,960,000 | | AmeriCredit Automobile Receivables Trust 2015-2, Class D, 3.000%, 6/8/2021 | $13,051,445 |
| 15,500,000 | | AmeriCredit Automobile Receivables Trust 2015-3, Class D, 3.340%, 8/8/2021 | 15,592,104 |
| 13,322,000 | | Capital Auto Receivables Asset Trust 2015-2, Class D, 3.160%, 11/20/2020 | 13,446,323 |
| 7,400,000 | | Capital Auto Receivables Asset Trust 2015-3, Class D, 3.340%, 3/22/2021 | 7,493,661 |
| 19,940,000 | | Santander Drive Auto Receivables Trust 2015-1, Class D, 3.240%, 4/15/2021 | 20,062,939 |
| 18,140,000 | | Santander Drive Auto Receivables Trust 2015-2, Class D, 3.020%, 4/15/2021 | 18,326,594 |
| 14,580,000 | | Santander Drive Auto Receivables Trust 2015-3, Class D, 3.490%, 5/17/2021 | 14,711,694 |
| | | TOTAL | 102,684,760 |
| | | Other—1.0% | |
| 5,131,099 | | Sofi Consumer Loan Program Trust 2016-1, Class A, 3.260%, 8/25/2025 | 5,165,709 |
| 7,346,821 | | Sofi Consumer Loan Program Trust 2016-2, Class A, 3.090%, 10/27/2025 | 7,388,146 |
| 5,088,080 | | Sofi Consumer Loan Program Trust 2016-3, Class A, 3.050%, 12/26/2025 | 5,116,117 |
| | | TOTAL | 17,669,972 |
| | | Student Loans—0.1% | |
| 2,046,997 | | Social Professional Loan Program LLC 2014-A, Class A2, 3.020%, 10/25/2027 | 2,055,384 |
| | | TOTAL ASSET-BACKED SECURITIES
(IDENTIFIED COST $121,575,273) | 122,410,116 |
| | | COMMERCIAL MORTGAGE-BACKED SECURITIES—3.1% | |
| | | Agency Commercial Mortgage-Backed Securities—3.1% | |
| 8,544,324 | | FHLMC REMIC K050 A1, 2.802%, 1/25/2025 | 8,588,623 |
| 21,897,385 | | FHLMC REMIC K060 A1, 2.958%, 7/25/2026 | 22,228,425 |
| 24,000,000 | | FNMA REMIC 2015-M4 AV2, 2.509%, 7/25/2022 | 23,974,363 |
| | | TOTAL COMMERCIAL MORTGAGE-BACKED SECURITIES
(IDENTIFIED COST $55,288,473) | 54,791,411 |
| | | COLLATERALIZED MORTGAGE OBLIGATIONS—4.5% | |
| | | Non-Agency Mortgage-Backed Securities—4.5% | |
| 1,053,069 | | Countrywide Home Loans 2005-21, Class A2, 5.500%, 10/25/2035 | 1,028,009 |
| 571,040 | | Credit Suisse Mortgage Trust 2007-4, Class 4A2, 5.500%, 6/25/2037 | 435,116 |
| 3,758,627 | | Credit Suisse Mortgage Trust 2014-WIN2, Class A2, 3.500%, 10/25/2044 | 3,819,453 |
| 8,821,323 | | Credit Suisse Mortgage Trust 2015-WIN1, Class A6, 3.500%, 12/25/2044 | 8,943,154 |
| 569,570 | | Residential Funding Mortgage Securities I 2005-SA3, Class 3A, 3.776%, 8/25/2035 | 555,136 |
| 1,354,896 | | Sequoia Mortgage Trust 2012-1, Class 2A1, 3.474%, 1/25/2042 | 1,376,239 |
| 9,517,646 | | Sequoia Mortgage Trust 2012-6, Class A2, 1.808%, 12/25/2042 | 9,035,123 |
| 9,186,263 | | Sequoia Mortgage Trust 2013-1, Class 2A1, 1.855%, 2/25/2043 | 8,721,856 |
| 17,601,742 | | Sequoia Mortgage Trust 2013-2, Class A, 1.874%, 2/25/2043 | 16,732,845 |
| 12,621,826 | | Sequoia Mortgage Trust 2013-6, Class A2, 3.000%, 5/25/2043 | 12,594,376 |
| 3,617,393 | | Sequoia Mortgage Trust 2014-1, Class 2A5, 4.000%, 4/25/2044 | 3,746,901 |
| 13,574,915 | | Sequoia Mortgage Trust 2014-4, Class A5, 3.500%, 11/25/2044 | 13,804,174 |
| | | TOTAL COLLATERALIZED MORTGAGE OBLIGATIONS
(IDENTIFIED COST $82,827,526) | 80,792,382 |
| | | MORTGAGE-BACKED SECURITIES—81.1% | |
| | | Federal Home Loan Mortgage Corporation—32.7% | |
| 30,318,436 | | 2.500%, 1/1/2031 | 30,325,746 |
| 7,023,686 | | 3.000%, 1/1/2032 | 7,156,623 |
| 44,188,160 | | 3.000%, 10/1/2032 | 45,052,127 |
| 1,826,245 | | 3.000%, 6/1/2045 | 1,830,675 |
| 42,076,198 | | 3.000%, 12/1/2046 | 42,125,663 |
Annual Shareholder Report
Principal
Amount
or Shares | | | Value |
| | | MORTGAGE-BACKED SECURITIES—continued | |
| | | Federal Home Loan Mortgage Corporation—continued | |
| $38,913,316 | | 3.000%, 12/1/2046 | $38,959,063 |
| 54,750,657 | | 3.000%, 1/1/2047 | 54,797,912 |
| 25,213,111 | | 3.000%, 2/1/2047 | 25,234,872 |
| 13,317,188 | | 3.000%, 2/1/2047 | 13,328,682 |
| 474,636 | | 3.500%, 6/1/2026 | 490,855 |
| 1,060,451 | | 3.500%, 6/1/2026 | 1,096,689 |
| 324,140 | | 3.500%, 7/1/2026 | 335,217 |
| 7,021,295 | | 3.500%, 4/1/2042 | 7,260,539 |
| 5,549,956 | | 3.500%, 7/1/2042 | 5,739,066 |
| 11,283,107 | | 3.500%, 8/1/2042 | 11,653,464 |
| 33,483,686 | | 3.500%, 11/1/2045 | 34,499,049 |
| 26,297,479 | | 3.500%, 6/1/2046 | 27,020,965 |
| 29,297,989 | | 3.500%, 10/1/2046 | 30,168,113 |
| 30,000,000 | | 3.500%, 11/1/2047 | 30,831,207 |
| 32,000,000 | | 3.500%, 6/1/2047 | 32,882,871 |
| 101,184 | | 4.000%, 2/1/2020 | 104,050 |
| 465,209 | | 4.000%, 5/1/2024 | 483,125 |
| 2,721,618 | | 4.000%, 8/1/2025 | 2,834,443 |
| 286,874 | | 4.000%, 5/1/2026 | 299,484 |
| 3,992,220 | | 4.000%, 5/1/2026 | 4,167,700 |
| 1,871,145 | | 4.000%, 9/1/2040 | 1,972,636 |
| 2,515,067 | | 4.000%, 12/1/2040 | 2,651,484 |
| 17,198,386 | | 4.000%, 12/1/2041 | 18,125,852 |
| 2,153,193 | | 4.000%, 1/1/2042 | 2,269,309 |
| 9,908,903 | | 4.000%, 8/1/2045 | 10,365,852 |
| 19,528,602 | | 4.000%, 7/1/2045 | 20,447,472 |
| 17,927,604 | | 4.000%, 10/1/2045 | 18,754,335 |
| 194,299 | | 4.500%, 6/1/2019 | 196,842 |
| 57,863 | | 4.500%, 3/1/2021 | 59,319 |
| 721,652 | | 4.500%, 9/1/2021 | 741,806 |
| 330,590 | | 4.500%, 7/1/2024 | 345,911 |
| 352,004 | | 4.500%, 8/1/2024 | 368,628 |
| 1,163,718 | | 4.500%, 9/1/2024 | 1,219,676 |
| 855,983 | | 4.500%, 9/1/2024 | 897,124 |
| 462,513 | | 4.500%, 6/1/2025 | 483,331 |
| 1,626,961 | | 4.500%, 11/1/2039 | 1,746,518 |
| 4,582,941 | | 4.500%, 5/1/2040 | 4,918,283 |
| 450,736 | | 4.500%, 6/1/2040 | 483,577 |
| 1,439,581 | | 4.500%, 8/1/2040 | 1,544,468 |
| 2,933,201 | | 4.500%, 8/1/2040 | 3,146,912 |
| 954,940 | | 4.500%, 7/1/2040 | 1,024,516 |
| 451,203 | | 4.500%, 7/1/2041 | 493,524 |
| 1,938,236 | | 4.500%, 7/1/2041 | 2,078,243 |
| 866,032 | | 4.500%, 7/1/2041 | 928,590 |
| 8,431,291 | | 4.500%, 9/1/2040 | 9,045,591 |
| 41,232 | | 5.000%, 7/1/2019 | 41,783 |
| 297,515 | | 5.000%, 7/1/2020 | 304,332 |
| 38,882 | | 5.000%, 10/1/2021 | 40,338 |
| 127,584 | | 5.000%, 11/1/2021 | 132,549 |
Annual Shareholder Report
Principal
Amount
or Shares | | | Value |
| | | MORTGAGE-BACKED SECURITIES—continued | |
| | | Federal Home Loan Mortgage Corporation—continued | |
| $149,098 | | 5.000%, 12/1/2021 | $155,107 |
| 237,792 | | 5.000%, 6/1/2023 | 249,253 |
| 176,389 | | 5.000%, 7/1/2023 | 185,096 |
| 356,251 | | 5.000%, 7/1/2023 | 374,064 |
| 184,361 | | 5.000%, 7/1/2025 | 193,038 |
| 2,373,390 | | 5.000%, 1/1/2034 | 2,573,821 |
| 724,809 | | 5.000%, 5/1/2034 | 786,138 |
| 3,194 | | 5.000%, 11/1/2035 | 3,466 |
| 203,715 | | 5.000%, 4/1/2036 | 221,405 |
| 1,009 | | 5.000%, 4/1/2036 | 1,097 |
| 11,483 | | 5.000%, 4/1/2036 | 12,461 |
| 1,014,437 | | 5.000%, 4/1/2036 | 1,102,030 |
| 89,033 | | 5.000%, 5/1/2036 | 97,288 |
| 162,969 | | 5.000%, 6/1/2036 | 177,049 |
| 282,513 | | 5.000%, 6/1/2036 | 306,544 |
| 987,375 | | 5.000%, 12/1/2037 | 1,074,362 |
| 141,883 | | 5.000%, 2/1/2038 | 154,294 |
| 170,916 | | 5.000%, 5/1/2038 | 185,867 |
| 77,427 | | 5.000%, 6/1/2038 | 84,151 |
| 165,778 | | 5.000%, 9/1/2038 | 180,279 |
| 486,962 | | 5.000%, 9/1/2038 | 529,559 |
| 157,739 | | 5.000%, 6/1/2039 | 171,316 |
| 4,927,600 | | 5.000%, 10/1/2039 | 5,350,941 |
| 142,186 | | 5.000%, 2/1/2039 | 154,535 |
| 54,470 | | 5.000%, 3/1/2039 | 59,158 |
| 403,843 | | 5.000%, 2/1/2040 | 438,160 |
| 2,094,168 | | 5.000%, 4/1/2040 | 2,272,120 |
| 942,786 | | 5.000%, 8/1/2040 | 1,022,015 |
| 2,503,303 | | 5.000%, 5/1/2041 | 2,709,762 |
| 66,428 | | 5.500%, 3/1/2021 | 68,988 |
| 360,056 | | 5.500%, 4/1/2021 | 373,591 |
| 27,274 | | 5.500%, 1/1/2022 | 28,555 |
| 218,855 | | 5.500%, 1/1/2022 | 229,122 |
| 74,468 | | 5.500%, 1/1/2022 | 77,909 |
| 304,305 | | 5.500%, 2/1/2022 | 318,348 |
| 1,863,486 | | 5.500%, 5/1/2034 | 2,062,171 |
| 44,795 | | 5.500%, 3/1/2036 | 49,800 |
| 153,106 | | 5.500%, 3/1/2036 | 170,033 |
| 119,122 | | 5.500%, 3/1/2036 | 132,409 |
| 140,887 | | 5.500%, 3/1/2036 | 156,303 |
| 186,883 | | 5.500%, 6/1/2036 | 207,258 |
| 138,212 | | 5.500%, 6/1/2036 | 153,396 |
| 346,949 | | 5.500%, 6/1/2036 | 384,596 |
| 132,189 | | 5.500%, 6/1/2036 | 146,335 |
| 112,018 | | 5.500%, 9/1/2037 | 124,367 |
| 456,014 | | 5.500%, 9/1/2037 | 505,812 |
| 189,163 | | 5.500%, 12/1/2037 | 209,958 |
| 35,502 | | 5.500%, 3/1/2038 | 39,416 |
| 597,511 | | 5.500%, 5/1/2038 | 663,007 |
Annual Shareholder Report
Principal
Amount
or Shares | | | Value |
| | | MORTGAGE-BACKED SECURITIES—continued | |
| | | Federal Home Loan Mortgage Corporation—continued | |
| $779,679 | | 5.500%, 9/1/2038 | $865,144 |
| 251,970 | | 5.500%, 9/1/2039 | 279,432 |
| 449,546 | | 5.500%, 5/1/2040 | 498,964 |
| 13,665 | | 6.000%, 7/1/2029 | 15,437 |
| 55,847 | | 6.000%, 2/1/2032 | 62,987 |
| 82,416 | | 6.000%, 5/1/2036 | 93,070 |
| 123,862 | | 6.000%, 8/1/2037 | 139,573 |
| 525,658 | | 6.000%, 9/1/2037 | 592,111 |
| 25,220 | | 6.500%, 3/1/2022 | 27,730 |
| 18,568 | | 6.500%, 6/1/2029 | 21,171 |
| 12,181 | | 6.500%, 6/1/2029 | 13,885 |
| 6,145 | | 6.500%, 7/1/2029 | 6,926 |
| 368,285 | | 6.500%, 11/1/2036 | 420,658 |
| 910,441 | | 6.500%, 10/1/2037 | 1,037,525 |
| 4,812 | | 6.500%, 4/1/2038 | 5,482 |
| 3,526 | | 6.500%, 4/1/2038 | 4,018 |
| 671 | | 7.000%, 10/1/2020 | 701 |
| 45,799 | | 7.000%, 4/1/2032 | 51,036 |
| 271,371 | | 7.000%, 4/1/2032 | 315,875 |
| 74,088 | | 7.000%, 9/1/2037 | 86,232 |
| 26,167 | | 7.500%, 8/1/2029 | 30,433 |
| 37,346 | | 7.500%, 10/1/2029 | 43,278 |
| 17,272 | | 7.500%, 11/1/2029 | 20,028 |
| 20,302 | | 7.500%, 4/1/2031 | 23,067 |
| 17,276 | | 7.500%, 5/1/2031 | 20,189 |
| 4,673 | | 8.000%, 3/1/2030 | 5,529 |
| 39,802 | | 8.000%, 1/1/2031 | 47,503 |
| 65,935 | | 8.000%, 2/1/2031 | 77,736 |
| 64,269 | | 8.000%, 3/1/2031 | 76,451 |
| 890 | | 8.500%, 9/1/2025 | 1,013 |
| 3,674 | | 8.500%, 9/1/2025 | 4,220 |
| | | TOTAL | 585,320,155 |
| | | Federal National Mortgage Association—33.4% | |
| 22,710,670 | | 2.500%, 7/1/2031 | 22,694,854 |
| 18,298,206 | | 2.500%, 1/1/2032 | 18,285,463 |
| 3,309,855 | | 3.000%, 10/1/2027 | 3,381,551 |
| 10,580,898 | | 3.000%, 10/1/2029 | 10,796,869 |
| 3,575,691 | | 3.000%, 12/1/2029 | 3,648,676 |
| 7,425,734 | | 3.000%, 8/1/2043 | 7,468,981 |
| 6,098,505 | | 3.000%, 9/1/2043 | 6,134,023 |
| 7,819,353 | | 3.000%, 12/1/2046 | 7,828,240 |
| 13,846,704 | | 3.000%, 12/1/2046 | 13,862,441 |
| 31,096,350 | | 3.000%, 1/1/2047 | 31,121,974 |
| 12,777,896 | | 3.000%, 4/1/2047 | 12,788,425 |
| 785,879 | | 3.500%, 11/1/2025 | 812,795 |
| 473,738 | | 3.500%, 11/1/2025 | 489,964 |
| 746,677 | | 3.500%, 12/1/2025 | 772,250 |
| 895,848 | | 3.500%, 1/1/2026 | 926,530 |
| 275,868 | | 3.500%, 1/1/2026 | 285,317 |
Annual Shareholder Report
Principal
Amount
or Shares | | | Value |
| | | MORTGAGE-BACKED SECURITIES—continued | |
| | | Federal National Mortgage Association—continued | |
| $3,508,859 | | 3.500%, 12/1/2040 | $3,623,760 |
| 11,220,969 | | 3.500%, 5/1/2042 | 11,591,917 |
| 17,720,813 | | 3.500%, 8/1/2042 | 18,331,557 |
| 9,617,440 | | 3.500%, 9/1/2042 | 9,932,372 |
| 7,661,783 | | 3.500%, 9/1/2042 | 7,950,984 |
| 34,848,406 | | 3.500%, 12/1/2042 | 36,201,911 |
| 6,288,990 | | 3.500%, 12/1/2042 | 6,514,583 |
| 9,313,413 | | 3.500%, 3/1/2043 | 9,678,054 |
| 6,349,962 | | 3.500%, 4/1/2043 | 6,598,578 |
| 6,753,002 | | 3.500%, 5/1/2043 | 6,972,025 |
| 3,591,892 | | 3.500%, 6/1/2043 | 3,717,931 |
| 5,336,481 | | 3.500%, 7/1/2044 | 5,537,079 |
| 9,055,479 | | 3.500%, 7/1/2044 | 9,395,873 |
| 32,724,010 | | 3.500%, 11/1/2045 | 33,708,669 |
| 13,940,201 | | 3.500%, 6/1/2046 | 14,322,630 |
| 38,177,205 | | 3.500%, 2/1/2047 | 39,227,521 |
| 693,896 | | 4.000%, 12/1/2025 | 723,990 |
| 727,223 | | 4.000%, 7/1/2026 | 760,581 |
| 3,848,082 | | 4.000%, 2/1/2041 | 4,056,802 |
| 2,482,836 | | 4.000%, 12/1/2041 | 2,620,609 |
| 10,268,380 | | 4.000%, 12/1/2041 | 10,825,337 |
| 10,142,948 | | 4.000%, 2/1/2042 | 10,832,567 |
| 4,077,049 | | 4.000%, 3/1/2042 | 4,303,285 |
| 8,150,743 | | 4.000%, 4/1/2042 | 8,592,839 |
| 11,345,831 | | 4.000%, 7/1/2042 | 11,975,411 |
| 13,927,935 | | 4.000%, 5/1/2043 | 14,724,736 |
| 11,414,542 | | 4.000%, 1/1/2044 | 12,031,883 |
| 17,029,254 | | 4.000%, 5/1/2044 | 17,990,172 |
| 12,958,592 | | 4.000%, 5/1/2044 | 13,691,838 |
| 5,633,155 | | 4.000%, 9/1/2045 | 5,898,209 |
| 16,734,448 | | 4.000%, 11/1/2045 | 17,521,846 |
| 9,137,651 | | 4.000%, 5/1/2046 | 9,567,600 |
| 178,867 | | 4.500%, 12/1/2019 | 181,265 |
| 288,816 | | 4.500%, 2/1/2039 | 310,164 |
| 1,569,751 | | 4.500%, 5/1/2040 | 1,685,287 |
| 5,429,177 | | 4.500%, 10/1/2040 | 5,827,077 |
| 532,834 | | 4.500%, 11/1/2040 | 571,885 |
| 7,807,119 | | 4.500%, 3/1/2041 | 8,374,417 |
| 5,803,367 | | 4.500%, 4/1/2041 | 6,225,064 |
| 3,079,570 | | 4.500%, 6/1/2041 | 3,302,382 |
| 6,388,916 | | 4.500%, 9/1/2041 | 6,843,179 |
| 2,060,377 | | 4.500%, 12/1/2041 | 2,212,024 |
| 3,463,356 | | 4.500%, 12/1/2041 | 3,718,265 |
| 3,803,765 | | 4.500%, 1/1/2042 | 4,074,219 |
| 9,574,580 | | 4.500%, 6/1/2044 | 10,213,460 |
| 1,023,989 | | 5.000%, 5/1/2023 | 1,073,790 |
| 182,381 | | 5.000%, 8/1/2023 | 191,252 |
| 722,021 | | 5.000%, 11/1/2023 | 758,864 |
| 3,234,936 | | 5.000%, 2/1/2036 | 3,506,982 |
Annual Shareholder Report
Principal
Amount
or Shares | | | Value |
| | | MORTGAGE-BACKED SECURITIES—continued | |
| | | Federal National Mortgage Association—continued | |
| $1,840,962 | | 5.000%, 1/1/2040 | $1,992,175 |
| 1,896,384 | | 5.000%, 7/1/2040 | 2,050,639 |
| 781,735 | | 5.000%, 7/1/2041 | 844,346 |
| 1,796,137 | | 5.000%, 10/1/2041 | 1,939,993 |
| 39,639 | | 5.500%, 1/1/2032 | 43,877 |
| 81,693 | | 5.500%, 1/1/2032 | 90,401 |
| 671,185 | | 5.500%, 9/1/2034 | 743,952 |
| 2,005,764 | | 5.500%, 12/1/2034 | 2,220,874 |
| 88,000 | | 5.500%, 4/1/2035 | 97,432 |
| 444,031 | | 5.500%, 8/1/2035 | 492,390 |
| 718,185 | | 5.500%, 11/1/2035 | 795,443 |
| 493,696 | | 5.500%, 1/1/2036 | 547,133 |
| 174,202 | | 5.500%, 3/1/2036 | 192,988 |
| 576,290 | | 5.500%, 5/1/2036 | 638,397 |
| 757,632 | | 5.500%, 4/1/2036 | 838,972 |
| 1,105,713 | | 5.500%, 4/1/2036 | 1,225,137 |
| 237,121 | | 5.500%, 9/1/2036 | 262,806 |
| 752,333 | | 5.500%, 8/1/2037 | 833,948 |
| 276,106 | | 5.500%, 7/1/2038 | 306,382 |
| 1,036,659 | | 5.500%, 4/1/2041 | 1,146,446 |
| 20,317 | | 6.000%, 1/1/2029 | 22,612 |
| 3,313 | | 6.000%, 1/1/2029 | 3,518 |
| 25,790 | | 6.000%, 2/1/2029 | 28,718 |
| 9,454 | | 6.000%, 2/1/2029 | 10,535 |
| 5,501 | | 6.000%, 4/1/2029 | 6,174 |
| 28,407 | | 6.000%, 5/1/2029 | 31,829 |
| 15,845 | | 6.000%, 5/1/2029 | 17,662 |
| 957,389 | | 6.000%, 7/1/2034 | 1,083,565 |
| 523,707 | | 6.000%, 11/1/2034 | 592,428 |
| 228,638 | | 6.000%, 7/1/2036 | 258,320 |
| 87,778 | | 6.000%, 7/1/2036 | 99,107 |
| 328,172 | | 6.000%, 10/1/2037 | 369,523 |
| 274,021 | | 6.000%, 6/1/2038 | 308,362 |
| 1,407,835 | | 6.000%, 7/1/2038 | 1,587,437 |
| 85,323 | | 6.000%, 9/1/2038 | 96,499 |
| 76,300 | | 6.000%, 10/1/2038 | 86,015 |
| 540,548 | | 6.000%, 2/1/2039 | 610,332 |
| 3,344 | | 6.500%, 4/1/2019 | 3,410 |
| 42,161 | | 6.500%, 9/1/2028 | 46,705 |
| 6,669 | | 6.500%, 8/1/2029 | 7,547 |
| 7,025 | | 6.500%, 6/1/2031 | 7,927 |
| 25,591 | | 6.500%, 6/1/2031 | 29,003 |
| 5,821 | | 6.500%, 6/1/2031 | 6,571 |
| 6,407 | | 6.500%, 6/1/2031 | 7,243 |
| 34,133 | | 6.500%, 12/1/2031 | 38,893 |
| 37,123 | | 6.500%, 12/1/2031 | 42,344 |
| 12,346 | | 6.500%, 1/1/2032 | 14,163 |
| 75,665 | | 6.500%, 3/1/2032 | 86,503 |
| 253,465 | | 6.500%, 4/1/2032 | 290,059 |
Annual Shareholder Report
Principal
Amount
or Shares | | | Value |
| | | MORTGAGE-BACKED SECURITIES—continued | |
| | | Federal National Mortgage Association—continued | |
| $95,268 | | 6.500%, 5/1/2032 | $109,489 |
| 59,894 | | 6.500%, 11/1/2035 | 67,943 |
| 437,923 | | 6.500%, 7/1/2036 | 499,468 |
| 15,115 | | 6.500%, 8/1/2036 | 17,263 |
| 27,669 | | 6.500%, 9/1/2036 | 31,563 |
| 146,787 | | 6.500%, 12/1/2036 | 167,198 |
| 133,847 | | 6.500%, 9/1/2037 | 152,486 |
| 8,840 | | 6.500%, 12/1/2037 | 10,076 |
| 151,247 | | 6.500%, 10/1/2038 | 172,314 |
| 1,796 | | 7.000%, 7/1/2023 | 1,955 |
| 46,993 | | 7.000%, 2/1/2024 | 51,036 |
| 1,538 | | 7.000%, 5/1/2024 | 1,696 |
| 2,901 | | 7.000%, 7/1/2024 | 3,223 |
| 1,564 | | 7.000%, 7/1/2025 | 1,755 |
| 23,063 | | 7.000%, 9/1/2031 | 26,702 |
| 6,723 | | 7.000%, 9/1/2031 | 7,812 |
| 142,873 | | 7.000%, 11/1/2031 | 166,153 |
| 13,077 | | 7.000%, 12/1/2031 | 15,007 |
| 267,327 | | 7.000%, 1/1/2032 | 310,106 |
| 31,894 | | 7.000%, 2/1/2032 | 37,040 |
| 57,060 | | 7.000%, 3/1/2032 | 66,184 |
| 303,933 | | 7.000%, 3/1/2032 | 350,473 |
| 42,497 | | 7.000%, 4/1/2032 | 49,219 |
| 6,240 | | 7.000%, 4/1/2032 | 7,267 |
| 133,723 | | 7.000%, 4/1/2032 | 155,764 |
| 31,884 | | 7.000%, 6/1/2032 | 37,118 |
| 457,705 | | 7.000%, 6/1/2037 | 531,969 |
| 1,118 | | 7.500%, 1/1/2030 | 1,305 |
| 16,268 | | 7.500%, 9/1/2030 | 18,974 |
| 19,509 | | 7.500%, 5/1/2031 | 22,915 |
| 6,498 | | 7.500%, 6/1/2031 | 7,575 |
| 65,777 | | 7.500%, 8/1/2031 | 77,195 |
| 51,855 | | 7.500%, 1/1/2032 | 60,055 |
| 5,518 | | 7.500%, 6/1/2033 | 6,399 |
| 496 | | 8.000%, 7/1/2023 | 542 |
| 5,947 | | 8.000%, 10/1/2026 | 6,906 |
| 6,580 | | 8.000%, 8/1/2027 | 7,409 |
| 3,834 | | 8.000%, 11/1/2029 | 4,542 |
| 20 | | 9.000%, 11/1/2021 | 20 |
| 793 | | 9.000%, 6/1/2025 | 915 |
| | | TOTAL | 596,150,844 |
| | | Government National Mortgage Association—15.0% | |
| 14,737,593 | | 3.000%, 11/20/2045 | 14,895,779 |
| 55,557,160 | | 3.000%, 12/20/2046 | 56,118,759 |
| 7,038,566 | | 3.500%, 12/15/2040 | 7,306,268 |
| 2,316,745 | | 3.500%, 8/15/2043 | 2,404,860 |
| 1,982,880 | | 3.500%, 8/15/2043 | 2,058,296 |
| 27,652,110 | | 3.500%, 5/20/2046 | 28,617,406 |
| 64,460,154 | | 3.500%, 6/20/2046 | 66,710,368 |
Annual Shareholder Report
Principal
Amount
or Shares | | | Value |
| | | MORTGAGE-BACKED SECURITIES—continued | |
| | | Government National Mortgage Association—continued | |
| $2,441,754 | | 4.000%, 9/15/2040 | $2,581,062 |
| 5,770,857 | | 4.000%, 10/15/2040 | 6,100,099 |
| 2,635,561 | | 4.000%, 1/15/2041 | 2,785,926 |
| 3,772,620 | | 4.000%, 10/15/2041 | 3,976,660 |
| 7,477,278 | | 4.000%, 12/20/2046 | 7,801,653 |
| 12,477,769 | | 4.000%, 5/20/2047 | 13,019,070 |
| 15,668,932 | | 4.000%, 8/20/2047 | 16,380,499 |
| 641,061 | | 4.500%, 1/15/2039 | 684,318 |
| 588,334 | | 4.500%, 6/15/2039 | 632,372 |
| 2,076,474 | | 4.500%, 10/15/2039 | 2,231,902 |
| 647,964 | | 4.500%, 1/15/2040 | 696,466 |
| 375,956 | | 4.500%, 6/15/2040 | 404,097 |
| 716,616 | | 4.500%, 9/15/2040 | 772,720 |
| 679,956 | | 4.500%, 2/15/2041 | 730,639 |
| 1,844,603 | | 4.500%, 3/15/2041 | 1,982,675 |
| 193,598 | | 4.500%, 5/15/2041 | 206,563 |
| 6,446,126 | | 4.500%, 6/20/2041 | 6,863,459 |
| 977,115 | | 4.500%, 9/15/2041 | 1,042,551 |
| 1,452,640 | | 4.500%, 9/20/2041 | 1,546,686 |
| 1,046,354 | | 4.500%, 10/15/2043 | 1,116,426 |
| 465,953 | | 4.500%, 11/15/2043 | 497,157 |
| 807,447 | | 5.000%, 1/15/2039 | 882,809 |
| 808,143 | | 5.000%, 5/15/2039 | 883,571 |
| 1,187,548 | | 5.000%, 8/20/2039 | 1,294,211 |
| 6,006,038 | | 5.000%, 5/15/2040 | 6,520,857 |
| 2,597,806 | | 5.000%, 6/15/2040 | 2,820,482 |
| 1,657,531 | | 5.000%, 7/15/2040 | 1,799,610 |
| 333,032 | | 5.500%, 12/15/2038 | 375,821 |
| 255,429 | | 5.500%, 12/20/2038 | 281,292 |
| 490,477 | | 5.500%, 1/15/2039 | 541,386 |
| 533,955 | | 5.500%, 2/15/2039 | 589,377 |
| 13,057 | | 6.000%, 10/15/2028 | 14,695 |
| 14,144 | | 6.000%, 3/15/2029 | 15,927 |
| 13,131 | | 6.000%, 6/15/2029 | 14,717 |
| 205,335 | | 6.000%, 2/15/2036 | 234,463 |
| 211,682 | | 6.000%, 4/15/2036 | 242,152 |
| 265,469 | | 6.000%, 6/15/2037 | 302,659 |
| 22,307 | | 6.500%, 10/15/2028 | 25,509 |
| 9,073 | | 6.500%, 10/15/2028 | 10,113 |
| 12,138 | | 6.500%, 11/15/2028 | 13,745 |
| 22,837 | | 6.500%, 12/15/2028 | 25,878 |
| 8,804 | | 6.500%, 2/15/2029 | 10,039 |
| 16,793 | | 6.500%, 3/15/2029 | 19,159 |
| 31,817 | | 6.500%, 9/15/2031 | 36,874 |
| 69,291 | | 6.500%, 2/15/2032 | 80,113 |
| 27,222 | | 7.000%, 11/15/2027 | 31,235 |
| 17,325 | | 7.000%, 12/15/2027 | 19,997 |
| 16,629 | | 7.000%, 6/15/2028 | 18,679 |
| 26,577 | | 7.000%, 11/15/2028 | 30,282 |
Annual Shareholder Report
Principal
Amount
or Shares | | | Value |
| | | MORTGAGE-BACKED SECURITIES—continued | |
| | | Government National Mortgage Association—continued | |
| $10,156 | | 7.000%, 1/15/2029 | $11,741 |
| 9,245 | | 7.000%, 5/15/2029 | 10,752 |
| 4,885 | | 7.000%, 10/15/2029 | 5,675 |
| 26,824 | | 7.000%, 5/15/2030 | 31,214 |
| 17,794 | | 7.000%, 11/15/2030 | 20,735 |
| 22,818 | | 7.000%, 12/15/2030 | 26,361 |
| 34,520 | | 7.000%, 6/15/2031 | 39,730 |
| 17,447 | | 7.000%, 8/15/2031 | 20,321 |
| 84,279 | | 7.000%, 10/15/2031 | 98,752 |
| 12,607 | | 7.000%, 12/15/2031 | 14,822 |
| 1,068 | | 7.500%, 7/15/2029 | 1,105 |
| 21,762 | | 7.500%, 8/15/2029 | 25,305 |
| 51,087 | | 7.500%, 10/15/2029 | 59,723 |
| 60,996 | | 7.500%, 6/15/2030 | 71,804 |
| 9,773 | | 7.500%, 10/15/2030 | 11,475 |
| 8,142 | | 7.500%, 1/15/2031 | 9,626 |
| 12,214 | | 8.000%, 1/15/2022 | 13,210 |
| 4,688 | | 8.000%, 6/15/2022 | 5,125 |
| 197 | | 8.000%, 7/15/2025 | 207 |
| 4,643 | | 8.000%, 8/15/2029 | 5,558 |
| 3,020 | | 8.000%, 10/15/2029 | 3,630 |
| 10,831 | | 8.000%, 11/15/2029 | 13,027 |
| 11,521 | | 8.000%, 1/15/2030 | 13,711 |
| 8,350 | | 8.000%, 10/15/2030 | 10,002 |
| 87,350 | | 8.000%, 11/15/2030 | 105,722 |
| 4,720 | | 8.500%, 5/15/2029 | 5,663 |
| 688 | | 9.500%, 10/15/2020 | 739 |
| | | TOTAL | 267,936,123 |
| | | TOTAL MORTGAGE-BACKED SECURITIES
(IDENTIFIED COST $1,440,071,041) | 1,449,407,122 |
| | | INVESTMENT COMPANY—4.5% | |
| 80,524,558 | 1 | Federated Government Obligations Fund, Premier Shares, 1.18%2
(AT COST) | 80,524,558 |
| | | TOTAL INVESTMENT IN SECURITIES-100.0%
(IDENTIFIED COST $1,780,286,871)3 | 1,787,925,589 |
| | | OTHER ASSETS AND LIABILITIES-NET—0.0%4 | (507,251) |
| | | TOTAL NET ASSETS—100% | $1,787,418,338 |
Annual Shareholder Report
Affiliated fund holdings are investment companies which are managed by the Adviser or an affiliate of the Adviser. Transactions with affiliated fund holdings during the year ended December 31, 2017, were as follows:
| | Federated Government
Obligations Fund,
Premier Shares |
| Balance of Shares Held 12/31/2016 | 107,203,788 |
| Purchases/Additions | 746,187,820 |
| Sales/Reductions | (772,867,050) |
| Balance of Shares Held 12/31/2017 | 80,524,558 |
| Value | $80,524,558 |
| Change in Unrealized Appreciation/Depreciation | $NA |
| Net Realized Gain/(Loss) | $NA |
| Dividend Income | $1,195,558 |
| 2 | 7-day net yield. |
| 3 | The cost of investments for federal tax purposes amounts to $1,777,604,289. |
| 4 | Assets, other than investments in securities, less liabilities. See Statement of Assets and Liabilities. |
Note: The categories of investments are shown as a percentage of total net assets at December 31, 2017.
Various inputs are used in determining the value of the Fund's investments. These inputs are summarized in the three broad levels listed below:
Level 1—quoted prices in active markets for identical securities.
Level 2—other significant observable inputs (including quoted prices for similar securities, interest rates, prepayment speeds, credit risk, etc.). Also includes securities valued at amortized cost.
Level 3—significant unobservable inputs (including the Fund's own assumptions in determining the fair value of investments).
The inputs or methodology used for valuing securities are not an indication of the risk associated with investing in those securities.
The following is a summary of the inputs used, as of December 31, 2017, in valuing the Fund's assets carried at fair value:
| Valuation Inputs | | | | |
| | Level 1—
Quoted
Prices | Level 2—
Other
Significant
Observable
Inputs | Level 3—
Significant
Unobservable
Inputs | Total |
| Debt Securities: | | | | |
| Asset-Backed Securities | $— | $122,410,116 | $— | $122,410,116 |
| Commercial Mortgage-Backed Securities | — | 54,791,411 | — | 54,791,411 |
| Collateralized Mortgage Obligations | — | 80,792,382 | — | 80,792,382 |
| Mortgage-Backed Securities | — | 1,449,407,122 | — | 1,449,407,122 |
| Investment Company | 80,524,558 | — | — | 80,524,558 |
| TOTAL SECURITIES | $80,524,558 | $1,707,401,031 | $— | $1,787,925,589 |
The following acronyms are used throughout this portfolio:
| FHLMC | —Federal Home Loan Mortgage Corporation |
| FNMA | —Federal National Mortgage Association |
| REMIC | —Real Estate Mortgage Investment Conduit |
See Notes which are an integral part of the Financial Statements
Annual Shareholder Report
Financial Highlights–Federated Mortgage Core Portfolio
(For a Share Outstanding Throughout Each Period)
| Year Ended December 31 | 2017 | 2016 | 2015 | 2014 | 2013 |
| Net Asset Value, Beginning of Period | $9.81 | $9.85 | $9.97 | $9.71 | $10.20 |
| Income From Investment Operations: | | | | | |
| Net investment income | 0.271 | 0.231 | 0.231 | 0.271 | 0.241 |
| Net realized and unrealized gain (loss) on investments and futures contracts | 0.002 | (0.00)2 | (0.07) | 0.29 | (0.45) |
| TOTAL FROM INVESTMENT OPERATIONS | 0.27 | 0.23 | 0.16 | 0.56 | (0.21) |
| Less Distributions: | | | | | |
| Distributions from net investment income | (0.28) | (0.27) | (0.28) | (0.30) | (0.28) |
| Net Asset Value, End of Period | $9.80 | $9.81 | $9.85 | $9.97 | $9.71 |
| Total Return3 | 2.75% | 2.30% | 1.66% | 5.89% | (2.04)% |
| Ratios to Average Net Assets: | | | | | |
| Net expenses | 0.03% | 0.03% | 0.03% | 0.02% | 0.00%4 |
| Net investment income | 2.71% | 2.34% | 2.31% | 2.74% | 2.41% |
| Expense waiver/reimbursement5 | 0.00%6 | 0.00%6 | 0.00% | 0.01% | 0.03% |
| Supplemental Data: | | | | | |
| Net assets, end of period (000 omitted) | $1,787,418 | $2,147,397 | $1,900,395 | $1,864,143 | $1,399,693 |
| Portfolio turnover | 88% | 258% | 307% | 179% | 200% |
| Portfolio turnover (excluding purchases and sales from dollar-roll transactions) | 46% | 42% | 46% | 40% | 67% |
| 1 | Per share numbers have been calculated using the average shares method. |
| 2 | Represents less than $0.01. |
| 3 | Based on net asset value. |
| 4 | The Adviser had voluntarily agreed to reimburse all operating expenses incurred by the Fund. |
| 5 | This expense decrease is reflected in both the net expense and the net investment income ratios shown above. |
| 6 | Represents less than 0.01%. |
See Notes which are an integral part of the Financial Statements
Annual Shareholder Report
Statement of Assets and Liabilities–Federated Mortgage Core Portfolio
December 31, 2017
| Assets: | | |
| Investment in securities, at value including $80,524,558 of investment in an affiliated holding (identified cost $1,780,286,871) | | $1,787,925,589 |
| Income receivable | | 4,720,003 |
| TOTAL ASSETS | | 1,792,645,592 |
| Liabilities: | | |
| Payable for shares redeemed | $980,000 | |
| Income distribution payable | 4,013,018 | |
| Accrued expenses (Note 5) | 234,236 | |
| TOTAL LIABILITIES | | 5,227,254 |
| Net assets for 182,457,319 shares outstanding | | $1,787,418,338 |
| Net Assets Consist of: | | |
| Paid-in capital | | $1,810,052,310 |
| Net unrealized appreciation of investments | | 7,638,718 |
| Accumulated net realized loss on investments | | (30,531,162) |
| Undistributed net investment income | | 258,472 |
| TOTAL NET ASSETS | | $1,787,418,338 |
| Net Asset Value, Offering Price and Redemption Proceeds Per Share: | | |
| $1,787,418,338 ÷ 182,457,319 shares outstanding, no par value, unlimited shares authorized | | $9.80 |
See Notes which are an integral part of the Financial Statements
Annual Shareholder Report
Statement of Operations–Federated Mortgage Core Portfolio
Year Ended December 31, 2017
| Investment Income: | | |
| Interest | | $51,943,676 |
| Dividends received from affiliated holding (see footnotes to Portfolio of Investments) | | 1,195,558 |
| TOTAL INCOME | | 53,139,234 |
| Expenses: | | |
| Custodian fees | $89,393 | |
| Transfer agent fee | 138,447 | |
| Directors'/Trustees' fees (Note 5) | 20,220 | |
| Auditing fees | 31,881 | |
| Legal fees | 8,590 | |
| Portfolio accounting fees | 238,738 | |
| Share registration costs | 1,050 | |
| Printing and postage | 15,219 | |
| Miscellaneous (Note 5) | 28,903 | |
| TOTAL EXPENSES | 572,441 | |
| Reimbursement of other operating expenses (Note 2) | $(4,814) | |
| Net expenses | | 567,627 |
| Net investment income | | 52,571,607 |
| Realized and Unrealized Gain (Loss) on Investments: | | |
| Net realized loss on investments | | (819,475) |
| Net change in unrealized appreciation of investments | | 1,537,084 |
| Net realized and unrealized gain on investments | | 717,609 |
| Change in net assets resulting from operations | | $53,289,216 |
See Notes which are an integral part of the Financial Statements
Annual Shareholder Report
Statement of Changes in Net Assets–Federated Mortgage Core Portfolio
| Year Ended December 31 | 2017 | 2016 |
| Increase (Decrease) in Net Assets | | |
| Operations: | | |
| Net investment income | $52,571,607 | $49,696,048 |
| Net realized gain (loss) on investments and futures contracts | (819,475) | 4,602,512 |
| Net change in unrealized appreciation/depreciation of investments and futures contracts | 1,537,084 | (6,440,447) |
| CHANGE IN NET ASSETS RESULTING FROM OPERATIONS | 53,289,216 | 47,858,113 |
| Distributions to Shareholders: | | |
| Distributions from net investment income | (54,723,938) | (56,860,660) |
| Share Transactions: | | |
| Proceeds from sale of shares | 170,575,250 | 753,528,450 |
| Net asset value of shares issued to shareholders in payment of distributions declared | 4,857,161 | 5,153,184 |
| Cost of shares redeemed | (533,976,592) | (502,677,127) |
| CHANGE IN NET ASSETS RESULTING FROM SHARE TRANSACTIONS | (358,544,181) | 256,004,507 |
| Change in net assets | (359,978,903) | 247,001,960 |
| Net Assets: | | |
| Beginning of period | 2,147,397,241 | 1,900,395,281 |
| End of period (including undistributed net investment income of $258,472 and $483,589, respectively) | $1,787,418,338 | $2,147,397,241 |
See Notes which are an integral part of the Financial Statements
Annual Shareholder Report
Notes to Financial Statements–Federated Mortgage Core Portfolio
December 31, 2017
1. ORGANIZATION
Federated Core Trust (the “Trust”) is registered under the Investment Company Act of 1940, as amended (the “Act”), as an open-end management investment company. The Trust consists of four portfolios. The financial statements included herein are only those of Federated Mortgage Core Portfolio (the “Fund”), a diversified portfolio. The financial statements of the other portfolios are presented separately. The assets of each portfolio are segregated and a shareholder's interest is limited to the portfolio in which shares are held. Each portfolio pays its own expenses. The investment objective of the Fund is to provide total return. The Fund is an investment vehicle used by other Federated funds that invest some of their assets in mortgage-backed securities. Currently, shares of the Fund are being offered for investment only to investment companies, insurance company separate accounts, common or commingled trust funds or similar organizations or parties that are “accredited investors” within the meaning of Regulation D of the Securities Act of 1933, as amended (the “1933 Act”).
2. SIGNIFICANT ACCOUNTING POLICIES
The following is a summary of significant accounting policies consistently followed by the Fund in the preparation of its financial statements. These policies are in conformity with U.S. generally accepted accounting principles (GAAP).
Investment Valuation
In calculating its net asset value (NAV), the Fund generally values investments as follows:
| ■ | Fixed-income securities are fair valued using price evaluations provided by a pricing service approved by the Fund's Board of Trustees (the “Trustees”). |
| ■ | Shares of other mutual funds or non-exchange-traded investment companies are valued based upon their reported NAVs. |
| ■ | Derivative contracts listed on exchanges are valued at their reported settlement or closing price, except that options are valued at the mean of closing bid and asked quotations. |
| ■ | Over-the-counter (OTC) derivative contracts are fair valued using price evaluations provided by a pricing service approved by the Trustees. |
| ■ | For securities that are fair valued in accordance with procedures established by and under the general supervision of the Trustees, certain factors may be considered such as: the last traded or purchase price of the security, information obtained by contacting the issuer or dealers, analysis of the issuer's financial statements or other available documents, fundamental analytical data, the nature and duration of restrictions on disposition, the movement of the market in which the security is normally traded, public trading in similar securities or derivative contracts of the issuer or comparable issuers, movement of a relevant index, or other factors including but not limited to industry changes and relevant government actions. |
If any price, quotation, price evaluation or other pricing source is not readily available when the NAV is calculated, if the Fund cannot obtain price evaluations from a pricing service or from more than one dealer for an investment within a reasonable period of time as set forth in the Fund's valuation policies and procedures, or if information furnished by a pricing service, in the opinion of the valuation committee (“Valuation Committee”), is deemed not representative of the fair value of such security, the Fund uses the fair value of the investment determined in accordance with the procedures described below. There can be no assurance that the Fund could obtain the fair value assigned to an investment if it sold the investment at approximately the time at which the Fund determines its NAV per share.
Fair Valuation Procedures
The Trustees have ultimate responsibility for determining the fair value of investments for which market quotations are not readily available. The Trustees have appointed a Valuation Committee comprised of officers of the Fund, Federated Investment Management Company (“Adviser”) and certain of the Adviser's affiliated companies to assist in determining fair value and in overseeing the calculation of the NAV. The Trustees have also authorized the use of pricing services recommended by the Valuation Committee to provide fair value evaluations of the current value of certain investments for purposes of calculating the NAV. The Valuation Committee employs various methods for reviewing third-party pricing-service evaluations including periodic reviews of third-party pricing services' policies, procedures and valuation methods (including key inputs, methods, models and assumptions), transactional back-testing, comparisons of evaluations of different pricing services, and review of price challenges by the Adviser based on recent market activity. In the event that market quotations and price evaluations are not available for an investment, the Valuation Committee determines the fair value of the investment in accordance with procedures adopted by the Trustees. The Trustees periodically review and approve the fair valuations made by the Valuation Committee and any changes made to the procedures.
Factors considered by pricing services in evaluating an investment include the yields or prices of investments of comparable quality, coupon, maturity, call rights and other potential prepayments, terms and type, reported transactions, indications as to values from dealers and general market conditions. Some pricing services provide a single price evaluation reflecting the bid-side of the market for an investment (a “bid” evaluation). Other pricing services offer both bid evaluations and price evaluations indicative of a price between the prices bid and asked for the investment (a “mid” evaluation). The Fund normally uses bid evaluations for any U.S. Treasury and Agency securities, mortgage-backed securities and municipal securities. The Fund normally uses mid evaluations for any other types of fixed-income securities and any OTC derivative contracts. In the event that market quotations and price evaluations are not available for an investment, the fair value of the investment is determined in accordance with procedures adopted by the Trustees.
Repurchase Agreements
The Fund may invest in repurchase agreements for short-term liquidity purposes. It is the policy of the Fund to require the other party to a repurchase agreement to transfer to the Fund's custodian or sub-custodian eligible securities or cash with a market value (after transaction costs) at least equal to the repurchase price to be paid under the repurchase agreement. The eligible securities are transferred to accounts with the custodian or sub-custodian in which the Fund holds a “securities entitlement” and exercises “control” as those terms are defined in the Uniform
Annual Shareholder Report
Commercial Code. The Fund has established procedures for monitoring the market value of the transferred securities and requiring the transfer of additional eligible securities if necessary to equal at least the repurchase price. These procedures also allow the other party to require securities to be transferred from the account to the extent that their market value exceeds the repurchase price or in exchange for other eligible securities of equivalent market value.
The insolvency of the other party or other failure to repurchase the securities may delay the disposition of the underlying securities or cause the Fund to receive less than the full repurchase price. Under the terms of the repurchase agreement, any amounts received by the Fund in excess of the repurchase price and related transaction costs must be remitted to the other party.
The Fund may enter into repurchase agreements in which eligible securities are transferred into joint trading accounts maintained by the custodian or sub-custodian for investment companies and other clients advised by the Fund's Adviser and its affiliates. The Fund will participate on a pro rata basis with the other investment companies and clients in its share of the securities transferred under such repurchase agreements and in its share of proceeds from any repurchase or other disposition of such securities.
Investment Income, Gains and Losses, Expenses and Distributions
Investment transactions are accounted for on a trade-date basis. Realized gains and losses from investment transactions are recorded on an identified-cost basis. Interest income and expenses are accrued daily. Dividend income and distributions to shareholders are recorded on the ex-dividend date. Distributions of net investment income are declared daily and paid monthly. Non-cash dividends included in dividend income, if any, are recorded at fair value. Amortization/accretion of premium and discount is included in investment income. Gains and losses realized on principal payment of mortgage-backed securities (paydown gains and losses) are classified as part of investment income. For the year ended December 31, 2017, the portfolio accountant reimbursed $4,814 of their fees.
Federal Taxes
It is the Fund's policy to comply with the Subchapter M provision of the Internal Revenue Code (the “Code”) and to distribute to shareholders each year substantially all of its income. Accordingly, no provision for federal income tax is necessary. As of and during the year ended December 31, 2017, the Fund did not have a liability for any uncertain tax positions. The Fund recognizes interest and penalties, if any, related to tax liabilities as income tax expense in the Statement of Operations. As of December 31, 2017, tax years 2014 through 2017 remain subject to examination by the Fund's major tax jurisdictions, which include the United States of America and the Commonwealth of Massachusetts.
When-Issued and Delayed-Delivery Transactions
The Fund may engage in when-issued or delayed-delivery transactions. The Fund records when-issued securities on the trade date and maintains security positions such that sufficient liquid assets will be available to make payment for the securities purchased. Securities purchased on a when-issued or delayed-delivery basis are marked to market daily and begin earning interest on the settlement date. Losses may occur on these transactions due to changes in market conditions or the failure of counterparties to perform under the contract.
The Fund may transact in To Be Announced Securities (TBAs). As with other delayed-delivery transactions, a seller agrees to issue TBAs at a future date. However, the seller does not specify the particular securities to be delivered. Instead, the Fund agrees to accept any security that meets specified terms such as issuer, interest rate and terms of underlying mortgages. The Fund records TBAs on the trade date utilizing information associated with the specified terms of the transaction as opposed to the specific mortgages. TBAs are marked to market daily and begin earning interest on the settlement date. Losses may occur due to the fact that the actual underlying mortgages received may be less favorable than those anticipated by the Fund.
Dollar-Roll Transactions
The Fund engages in dollar-roll transactions in which the Fund sells mortgage-backed securities with a commitment to buy similar (same type, coupon and maturity), but not identical mortgage-backed securities on a future date. Both securities involved are TBA mortgage-backed securities. The Fund treats dollar-roll transactions as purchases and sales. Dollar-rolls are subject to interest rate risks and credit risks.
Futures Contracts
The Fund purchases and sells financial futures contracts to manage duration and yield curve risk. Upon entering into a financial futures contract with a broker, the Fund is required to deposit in a segregated account, either U.S. government securities or a specified amount of Restricted cash, which is shown in the Statement of Assets and Liabilities. Futures contracts are valued daily and unrealized gains or losses are recorded in a “variation margin” account. Daily, the Fund receives from or pays to the broker a specified amount of cash based upon changes in the variation margin account. When a contract is closed, the Fund recognizes a realized gain or loss. Futures contracts have market risks, including the risk that the change in the value of the contract may not correlate with the changes in the value of the underlying securities. There is minimal counterparty risk to the Fund since futures contracts are exchange traded and the exchange's clearing house, as counterparty to all exchange traded futures contracts, guarantees the futures contracts against default.
At December 31, 2017, the Fund had no outstanding futures contracts.
Restricted Securities
The Fund may purchase securities which are considered restricted. Restricted securities are securities that either: (a) cannot be offered for public sale without first being registered, or being able to take advantage of an exemption from registration, under the 1933 Act; or (b) are subject to contractual restrictions on public sales. In some cases, when a security cannot be offered for public sale without first being registered, the issuer of the restricted security has agreed to register such securities for resale, at the issuer's expense, either upon demand by the Fund or in connection with another registered offering of the securities. Many such restricted securities may be resold in the secondary market in transactions exempt from registration. Restricted securities may be determined to be liquid under criteria established by the Trustees. The Fund will not incur any registration costs upon such resales. The Fund's restricted securities, like other securities, are priced in accordance with procedures established by and under the general supervision of the Trustees.
Annual Shareholder Report
Other
The preparation of financial statements in conformity with GAAP requires management to make estimates and assumptions that affect the amounts of assets, liabilities, expenses and revenues reported in the financial statements. Actual results could differ from those estimated. The Fund applies investment company accounting and reporting guidance.
3. SHARES OF BENEFICIAL INTEREST
The following table summarizes share activity:
| Year Ended December 31 | 2017 | 2016 |
| Shares sold | 17,381,790 | 75,595,853 |
| Shares issued to shareholders in payment of distributions declared | 494,089 | 516,123 |
| Shares redeemed | (54,347,672) | (50,184,154) |
| NET CHANGE RESULTING FROM FUND SHARE TRANSACTIONS | (36,471,793) | 25,927,822 |
4. FEDERAL TAX INFORMATION
The timing and character of income and capital gain distributions are determined in accordance with income tax regulations, which may differ from GAAP. These differences are due to differing treatments for dollar-roll transactions and expiration of capital loss carryforwards.
For the year ended December 31, 2017, permanent differences identified and reclassified among the components of net assets were as follows:
| Increase (Decrease) |
| Paid-In Capital | Undistributed
Net Investment
Income (Loss) | Accumulated
Net Realized
Gain (Loss) |
| $(11,277,608) | $1,927,214 | $9,350,394 |
Net investment income (loss), net realized gains (losses), and net assets were not affected by this reclassification.
The tax character of distributions as reported on the Statement of Changes in Net Assets for the years ended December 31, 2017 and 2016, was as follows:
| | 2017 | 2016 |
| Ordinary income | $54,723,938 | $56,860,660 |
As of December 31, 2017, the components of distributable earnings on a tax-basis were as follows:
| Undistributed ordinary income | $258,472 |
| Net unrealized appreciation | $10,321,300 |
| Capital loss carryforwards | $(33,213,744) |
The difference between book-basis and tax-basis net unrealized appreciation/depreciation is attributable to differing treatments for dollar-roll transactions.
At December 31, 2017, the cost of investments for federal tax purposes was $1,777,604,289. The net unrealized appreciation of investments for federal tax purposes was $10,321,300. This consists of net unrealized appreciation from investments for those securities having an excess of value over cost of $17,794,435 and net unrealized depreciation from investments for those securities having an excess of cost over value of $7,473,135.
At December 31, 2017, the Fund had a capital loss carryforward of $33,213,744 which will reduce the Fund's taxable income arising from future net realized gains on investments, if any, to the extent permitted by the Code, thereby reducing the amount of distributions to shareholders which would otherwise be necessary to relieve the Fund of any liability for federal income tax. Pursuant to the Code, a net capital loss incurred in taxable years beginning after December 22, 2010, retains its character as either short-term or long-term and does not expire. All of the Fund's capital loss carryforwards were incurred in taxable years after December 22, 2010.
The following schedule summarizes the Fund's capital loss carryforwards:
| Short-Term | Long-Term | Total |
| $28,178,450 | $5,035,294 | $33,213,744 |
Capital loss carryforwards of $11,277,608 expired during the year ended December 31, 2017.
Annual Shareholder Report
5. INVESTMENT ADVISER FEE AND OTHER TRANSACTIONS WITH AFFILIATES
Investment Adviser Fee
The Adviser, subject to the direction of the Trustees, provides investment adviser services at no fee, because all investors in the Fund are other Federated funds, insurance company separate accounts, common or commingled trust funds or similar organizations or entities that are “accredited investors” within the meaning of Regulation D of the 1933 Act. The Fund pays operating expenses associated with the operation and maintenance of the Fund (excluding fees and expenses that may be charged by the Adviser and its affiliates). Although not contractually obligated to do so, the Adviser intends to voluntarily reimburse operating expenses (excluding extraordinary expenses and proxy-related expenses paid by the Fund, if any) such that the Fund will only bear such expenses in an amount of up to 0.15% of the Fund's average daily net assets. The Adviser can modify or terminate this voluntary reimbursement at any time at its sole discretion.
Administrative Fee
Federated Administrative Services (FAS), under the Administrative Services Agreement, provides the Fund with administrative personnel and services. FAS does not charge the Fund a fee but is entitled to certain out-of-pocket expenses.
Directors'/Trustees' and Miscellaneous Fees
Certain Officers and Trustees of the Fund are Officers and Directors or Trustees of certain of the above companies. To efficiently facilitate payment, Directors'/Trustees' fees and certain expenses related to conducting meetings of the Directors/Trustees and other miscellaneous expenses are paid by an affiliate of the Adviser which in due course are reimbursed by the Fund. These expenses related to conducting meetings of the Directors/Trustees and other miscellaneous expenses, may be included in Accrued and Miscellaneous Expenses on the Statement of Assets and Liabilities, and Statement of Operations, respectively.
Affiliated Shares of Beneficial Interest
As of December 31, 2017, a majority of the shares of beneficial interest outstanding are owned by other affiliated investment companies.
6. INVESTMENT TRANSACTIONS
Purchases and sales of investments, excluding long-term U.S. government securities and short-term obligations, for the year ended December 31, 2017, were as follows:
| Purchases | $20,346,317 |
| Sales | $244,644,687 |
7. LINE OF CREDIT
The Fund participates with certain other Federated Funds, on a several basis, in an up to $500,000,000 unsecured, 364-day, committed, revolving line of credit (LOC) agreement. The LOC was made available to finance temporarily the repurchase or redemption of shares of the Fund, failed trades, payment of dividends, settlement of trades and for other short-term, temporary or emergency general business purposes. The Fund cannot borrow under the LOC if an inter-fund loan is outstanding. The Fund's ability to borrow under the LOC also is subject to the limitations of the Act and various conditions precedent that must be satisfied before the Fund can borrow. Loans under the LOC are charged interest at a fluctuating rate per annum equal to the highest, on any day, of (a) (i) the federal funds effective rate, (ii) the one month London Interbank Offered Rate (LIBOR), and (iii) 0.0%, plus (b) a margin. The LOC also requires the Fund to pay, quarterly in arrears and at maturity, its pro rata share of a commitment fee based on the amount of the lenders' commitment that has not been utilized. As of December 31, 2017, the Fund had no outstanding loans. During the year ended December 31, 2017, the Fund did not utilize the LOC.
8. INTERFUND LENDING
Pursuant to an Exemptive Order issued by the Securities and Exchange Commission, the Fund, along with other funds advised by subsidiaries of Federated Investors, Inc., may participate in an interfund lending program. This program provides an alternative credit facility allowing the Fund to borrow from other participating affiliated funds. As of December 31, 2017, there were no outstanding loans. During the year ended December 31, 2017, the program was not utilized.
Annual Shareholder Report
Report of Independent Registered Public Accounting Firm
TO THE SHAREHOLDERS AND THE BOARD OF TRUSTEES OF federated mortgage core portfolio:
Opinion on the Financial Statements
We have audited the accompanying statement of assets and liabilities of Federated Mortgage Core Portfolio (the “Fund”) (one of the funds constituting the Federated Core Trust (the “Trust”)), including the portfolio of investments, as of December 31, 2017, and the related statement of operations for the year then ended, the statement of changes in net assets for each of the two years in the period then ended, the financial highlights for each of the five years in the period then ended and the related notes (collectively referred to as the “financial statements”). In our opinion, the financial statements present fairly, in all material respects, the financial position of Federated Mortgage Core Portfolio (one of the funds constituting the Federated Core Trust) at December 31, 2017, the results of its operations for the year then ended, the changes in its net assets for each of the two years in the period then ended and its financial highlights for each of the five years in the period then ended, in conformity with U.S. generally accepted accounting principles.
Basis for Opinion
These financial statements are the responsibility of the Trust's management. Our responsibility is to express an opinion on the Fund's financial statements based on our audits. We are a public accounting firm registered with the Public Company Accounting Oversight Board (United States) (“PCAOB”) and are required to be independent with respect to the Trust in accordance with the U.S. federal securities laws and the applicable rules and regulations of the Securities and Exchange Commission and the PCAOB.
We conducted our audits in accordance with standards of the PCAOB. Those standards require that we plan and perform the audit to obtain reasonable assurance about whether the financial statements are free of material misstatement, whether due to error or fraud. The Trust is not required to have, nor were we engaged to perform, an audit of the Trust's internal control over financial reporting. As part of our audits, we are required to obtain an understanding of internal control over financial reporting, but not for the purpose of expressing an opinion on the effectiveness of the Trust's internal control over financial reporting. Accordingly, we express no such opinion.
Our audits included performing procedures to assess the risks of material misstatement of the financial statements, whether due to error or fraud, and performing procedures that respond to those risks. Such procedures included examining, on a test basis, evidence regarding the amounts and disclosures in the financial statements. Our procedures included confirmation of securities owned as of December 31, 2017, by correspondence with the custodian and others or by other appropriate auditing procedures where replies from others were not received. Our audits also included evaluating the accounting principles used and significant estimates made by management, as well as evaluating the overall presentation of the financial statements. We believe that our audits provide a reasonable basis for our opinion.
We have served as the auditor of one or more Federated investment companies since 1979.
Boston, Massachusetts
February 22, 2018
Annual Shareholder Report
Shareholder Expense Example (unaudited)–Federated Mortgage Core Portfolio
As a shareholder of the Fund, you incur ongoing costs, including to the extent applicable, management fees, distribution (12b-1) fees and/or other service fees and other Fund expenses. This Example is intended to help you to understand your ongoing costs (in dollars) of investing in the Fund and to compare these costs with the ongoing costs of investing in other mutual funds. It is based on an investment of $1,000 invested at the beginning of the period and held for the entire period from July 1, 2017 to December 31, 2017.
ACTUAL EXPENSES
The first section of the table below provides information about actual account values and actual expenses. You may use the information in this section, together with the amount you invested, to estimate the expenses that you incurred over the period. Simply divide your account value by $1,000 (for example, an $8,600 account value divided by $1,000 = 8.6), then multiply the result by the number in the first section under the heading entitled “Expenses Paid During Period” to estimate the expenses attributable to your investment during this period.
HYPOTHETICAL EXAMPLE FOR COMPARISON PURPOSES
The second section of the table below provides information about hypothetical account values and hypothetical expenses based on the Fund's actual expense ratio and an assumed rate of return of 5% per year before expenses, which is not the Fund's actual return. Thus, you should not use the hypothetical account values and expenses to estimate the actual ending account balance or your expenses for the period. Rather, these figures are required to be provided to enable you to compare the ongoing costs of investing in the Fund with other funds. To do so, compare this 5% hypothetical example with the 5% hypothetical examples that appear in the shareholder reports of the other funds.
Please note that the expenses shown in the table are meant to highlight your ongoing costs only. Therefore, the second section of the table is useful in comparing ongoing costs only, and will not help you determine the relative total costs of owning different funds.
| | Beginning
Account Value
7/1/2017 | Ending
Account Value
12/31/2017 | Expenses Paid
During Period1 |
| Actual | $1,000.00 | $1,011.30 | $0.15 |
| Hypothetical (assuming a 5% return before expenses) | $1,000.00 | $1,025.00 | $0.15 |
| 1 | Expenses are equal to the Fund's annualized net expense ratio of 0.03%, multiplied by the average account value over the period, multiplied by 184/365 (to reflect the one-half-year period). |
Annual Shareholder Report
In Memoriam
With profound sadness, Federated announces the passing of John F. (“Jack”) Donahue and John W. (“John”) McGonigle. They will be greatly missed.
Jack Donahue
(Former Chairman and President, and Emeritus Director/Trustee, of the Federated Funds, and Founder, Former Chairman, President and Chief Executive Officer, and Chairman Emeritus, of Federated Investors, Inc.)
Jack Donahue, along with Richard B. Fisher, founded Federated in 1955 and served as a leader and member of the Boards of Directors/Trustees of the Federated Funds and the Board of Directors of Federated Investors, Inc. Mr. Donahue was a family man of deep faith with exemplary character and fealty, who served his religion, family, community, and the Federated Funds and Federated, as well as their shareholders, officers and employees, with distinction. His integrity, intelligence, and keen sense of fiduciary duty, coupled with his faith, family and background as a West Point graduate and Strategic Air Command B-29 pilot, served as a foundation for his strong business acumen and leadership. Among his many achievements, Mr. Donahue's steadfast and innovative leadership of the Federated Funds and Federated, as well as within the investment management industry, led to the birth of money market funds in the 1970s and their growth as an innovative, efficient and effective cash management vehicle throughout the 1980s, 1990s, 2000s and beyond. Federated expresses deep gratitude to Mr. Donahue for his inspiring leadership, distinguished service and contributions as a husband, father, founder, Board member and officer, colleague and friend.
John McGonigle
(Former Secretary of the Federated Funds, Former Director, Secretary and Chief Legal Officer of Federated Investors, Inc.)
John McGonigle served the Federated Funds and their respective Boards with distinction for more than 50 years as Fund Secretary and also served as Director for several closed-end funds. Mr. McGonigle was a gifted lawyer and wise counselor with a genial presence, keen intellect and convivial demeanor. A man of deep faith, he was a devoted husband, father and grandfather. A graduate of Duquesne University School of Law, Mr. McGonigle served as an officer in the U.S. Army for two years, achieving the rank of Captain. He also served on the staff of the Securities and Exchange Commission before joining Federated in 1966. Among many professional accomplishments, Mr. McGonigle helped fashion the regulatory foundation for money market funds, established Federated's first offshore funds in Ireland, and represented Federated on the Board of Governors of the Investment Company Institute where he was a member of the Executive Committee. Federated expresses deep gratitude for Mr. McGonigle and his impact on his family, friends, the community, and the mutual fund industry.
Board of Trustees and Trust Officers
The Board of Trustees is responsible for managing the Trust's business affairs and for exercising all the Trust's powers except those reserved for the shareholders. The following tables give information about each Trustee and the senior officers of the Fund. Where required, the tables separately list Trustees who are “interested persons” of the Fund (i.e., “Interested” Trustees) and those who are not (i.e., “Independent” Trustees). Unless otherwise noted, the address of each person listed is Federated Investors Tower, 1001 Liberty Avenue, Pittsburgh, PA 15222. The address of all Independent Trustees listed is 4000 Ericsson Drive, Warrendale, PA 15086-7561; Attention: Mutual Fund Board. As of December 31, 2017, the Trust comprised five portfolio(s), and the Federated Fund Family consisted of 40 investment companies (comprising 108 portfolios). Unless otherwise noted, each Officer is elected annually. Unless otherwise noted, each Trustee oversees all portfolios in the Federated Fund Family and serves for an indefinite term. The Fund's Statement of Additional Information includes additional information about Trust Trustees and is available, without charge and upon request, by calling 1-800-341-7400.
Annual Shareholder Report
Interested Trustees Background
Name
Birth Date
Positions Held with Trust
Date Service Began | Principal Occupation(s) for Past Five Years,
Other Directorships Held and Previous Position(s) |
J. Christopher Donahue*
Birth Date: April 11, 1949
President and Trustee
Indefinite Term
Began serving: October 2005 | Principal Occupations: Principal Executive Officer and President of certain of the Funds in the Federated Fund Family; Director or Trustee of the Funds in the Federated Fund Family; President, Chief Executive Officer and Director, Federated Investors, Inc.; Chairman and Trustee, Federated Investment Management Company; Trustee, Federated Investment Counseling; Chairman and Director, Federated Global Investment Management Corp.; Chairman and Trustee, Federated Equity Management Company of Pennsylvania; Trustee, Federated Shareholder Services Company; Director, Federated Services Company.
Previous Positions: President, Federated Investment Counseling; President and Chief Executive Officer, Federated Investment Management Company, Federated Global Investment Management Corp. and Passport Research, Ltd; Chairman, Passport Research, Ltd. |
John B. Fisher*
Birth Date: May 16, 1956
Trustee
Indefinite Term
Began serving: May 2016 | Principal Occupations: Principal Executive Officer and President of certain of the Funds in the Federated Fund Family; Director or Trustee of certain of the Funds in the Federated Fund Family; Vice President, Federated Investors, Inc.; President, Director/Trustee and CEO, Federated Advisory Services Company, Federated Equity Management Company of Pennsylvania, Federated Global Investment Management Corp., Federated Investment Counseling, Federated Investment Management Company; President of some of the Funds in the Federated Fund Complex and Director, Federated Investors Trust Company.
Previous Positions: President and Director of the Institutional Sales Division of Federated Securities Corp.; President and Director of Federated Investment Counseling; President and CEO of Passport Research, Ltd.; Director, Edgewood Securities Corp.; Director, Federated Services Company; Director, Federated Investors, Inc.; Chairman and Director, Southpointe Distribution Services, Inc. and President, Technology, Federated Services Company. |
| * | Reasons for “interested” status: J. Christopher Donahue and John B. Fisher are interested due to their beneficial ownership of shares of Federated Investors, Inc. and due to positions they hold with Federated and its subsidiaries. |
INDEPENDENT Trustees Background
Name
Birth Date
Positions Held with Trust
Date Service Began | Principal Occupation(s) for Past Five Years,
Other Directorships Held, Previous Position(s) and Qualifications |
John T. Collins
Birth Date: January 24, 1947
Trustee
Indefinite Term
Began serving: October 2013 | Principal Occupations: Director or Trustee of the Federated Fund Family; formerly, Chairman and CEO, The Collins Group, Inc. (a private equity firm) (Retired).
Other Directorships Held: Director, Current Chair of the Compensation Committee, KLX Corp.
Qualifications: Mr. Collins has served in several business and financial management roles and directorship positions throughout his career. Mr. Collins previously served as Chairman and CEO, The Collins Group, Inc. (a private equity firm). Mr. Collins serves as Chairman Emeriti, Bentley University. Mr. Collins previously served as Director and Audit Committee Member, Bank of America Corp.; Director, FleetBoston Financial Corp.; and Director, Beth Israel Deaconess Medical Center (Harvard University Affiliate Hospital). |
G. Thomas Hough
Birth Date: February 28, 1955
Trustee
Indefinite Term
Began serving: August 2015 | Principal Occupations: Director or Trustee of the Federated Fund Family; formerly, Vice Chair, Ernst & Young LLP (public accounting firm) (Retired).
Other Directorships Held: Director, Chair of the Audit Committee, Governance Committee, Publix Super Markets, Inc.; Director, Member of the Audit Committee and Technology Committee of Equifax, Inc.
Qualifications: Mr. Hough has served in accounting, business management and directorship positions throughout his career. Mr. Hough most recently held the position of Americas Vice Chair of Assurance with Ernst & Young LLP (public accounting firm). Mr. Hough is an Executive Committee member of the United States Golf Association, he serves on the President's Cabinet and Business School Board of Visitors for the University of Alabama and is on the Business School Board of Visitors for Wake Forest University. |
Annual Shareholder Report
Name
Birth Date
Positions Held with Trust
Date Service Began | Principal Occupation(s) for Past Five Years,
Other Directorships Held, Previous Position(s) and Qualifications |
Maureen Lally-Green
Birth Date: July 5, 1949
Trustee
Indefinite Term
Began serving: August 2009 | Principal Occupations: Director or Trustee of the Federated Fund Family; Dean of the Duquesne University School of Law; Professor and Adjunct Professor of Law, Duquesne University School of Law; formerly, Interim Dean of the Duquesne University School of Law; Associate General Secretary and Director, Office of Church Relations, Diocese of Pittsburgh.
Other Directorships Held: Director, CNX Resources Corporation (formerly known as CONSOL Energy Inc.).
Qualifications: Judge Lally-Green has served in various legal and business roles and directorship positions throughout her career. Judge Lally-Green previously served as: Associate General Secretary, Diocese of Pittsburgh; a member of the Superior Court of Pennsylvania; and as a Professor of Law, Duquesne University School of Law. Judge Lally-Green also currently holds the positions on either a public or not for profit Board of Directors as follows: Director and Chair, UPMC Mercy Hospital; Director and Vice Chair, Our Campaign for the Church Alive!, Inc.; Director, Saint Vincent College; Member, Pennsylvania State Board of Education (public); and Director CNX Resources Corporation (formerly known as CONSOL Energy Inc.), where she currently serves as a member of the Compensation, Nominating and Corporate Governance Committee (Chair) and the Health, Safety and Environmental Committee. Judge Lally-Green has held the positions of: Director, Auberle; Director, Epilepsy Foundation of Western and Central Pennsylvania; Director, Ireland Institute of Pittsburgh; Director, Saint Thomas More Society; Director and Chair, Catholic High Schools of the Diocese of Pittsburgh, Inc.; Director, Pennsylvania Bar Institute; Regent, St. Vincent Seminary; and Director and Chair, Cardinal Wuerl North Catholic High School, Inc. |
Charles F. Mansfield, Jr.
Birth Date: April 10, 1945
Trustee
Indefinite Term
Began serving: November 2005 | Principal Occupations: Director or Trustee of the Federated Fund Family; Management Consultant.
Other Directorships Held: None.
Qualifications: Mr. Mansfield has served as a Marine Corps officer and in several banking, business management, educational roles and directorship positions throughout his long career. He remains active as a Management Consultant. |
Thomas M. O'Neill
Birth Date: June 14, 1951
Trustee
Indefinite Term
Began serving: August 2006 | Principal Occupations: Director or Trustee, Chair of the Audit Committee of the Federated Fund Family; Sole Proprietor, Navigator Management Company (investment and strategic consulting).
Other Directorships Held: None.
Qualifications: Mr. O'Neill has served in several business, mutual fund and financial management roles and directorship positions throughout his career. Mr. O'Neill serves as Director, Medicines for Humanity and Director, The Golisano Children's Museum of Naples, Florida. Mr. O'Neill previously served as Chief Executive Officer and President, Managing Director and Chief Investment Officer, Fleet Investment Advisors; President and Chief Executive Officer, Aeltus Investment Management, Inc.; General Partner, Hellman, Jordan Management Co., Boston, MA; Chief Investment Officer, The Putnam Companies, Boston, MA; Credit Analyst and Lending Officer, Fleet Bank; Director and Consultant, EZE Castle Software (investment order management software); and Director, Midway Pacific (lumber). |
P. Jerome Richey
Birth Date: February 23, 1949
Trustee
Indefinite Term
Began serving: October 2013 | Principal Occupations: Director or Trustee of the Federated Fund Family; Management Consultant; formerly, Senior Vice Chancellor and Chief Legal Officer, University of Pittsburgh and Executive Vice President and Chief Legal Officer, CNX Resources Corporation (formerly known as CONSOL Energy Inc.)
Other Directorships Held: None.
Qualifications: Mr. Richey has served in several business and legal management roles and directorship positions throughout his career. Mr. Richey most recently held the positions of Senior Vice Chancellor and Chief Legal Officer, University of Pittsburgh. Mr. Richey previously served as Chairman of the Board, Epilepsy Foundation of Western Pennsylvania and Chairman of the Board, World Affairs Council of Pittsburgh. Mr. Richey previously served as Chief Legal Officer and Executive Vice President, CNX Resources Corporation (formerly known as CONSOL Energy Inc.); and Board Member, Ethics Counsel and Shareholder, Buchanan Ingersoll & Rooney PC (a law firm). |
John S. Walsh
Birth Date: November 28, 1957
Trustee
Indefinite Term
Began serving: November 2005 | Principal Occupations: Director or Trustee, and Chair of the Board of Directors or Trustees, of the Federated Fund Family; President and Director, Heat Wagon, Inc. (manufacturer of construction temporary heaters); President and Director, Manufacturers Products, Inc. (distributor of portable construction heaters); President, Portable Heater Parts, a division of Manufacturers Products, Inc.
Other Directorships Held: None.
Qualifications: Mr. Walsh has served in several business management roles and directorship positions throughout his career. Mr. Walsh previously served as Vice President, Walsh & Kelly, Inc. (paving contractors). |
Annual Shareholder Report
OFFICERS
Name
Birth Date
Address
Positions Held with Trust
Date Service Began | Principal Occupation(s) for Past Five Years
and Previous Position(s) |
Lori A. Hensler
Birth Date: January 6, 1967
TREASURER
Officer since: April 2013 | Principal Occupations: Principal Financial Officer and Treasurer of the Federated Fund Family; Senior Vice President, Federated Administrative Services; Financial and Operations Principal for Federated Securities Corp. and Edgewood Services, Inc.; and Assistant Treasurer, Federated Investors Trust Company. Ms. Hensler has received the Certified Public Accountant designation.
Previous Positions: Controller of Federated Investors, Inc.; Senior Vice President and Assistant Treasurer, Federated Investors Management Company; Treasurer, Federated Investors Trust Company; Assistant Treasurer, Federated Administrative Services, Federated Administrative Services, Inc., Federated Securities Corp., Edgewood Services, Inc., Federated Advisory Services Company, Federated Equity Management Company of Pennsylvania, Federated Global Investment Management Corp., Federated Investment Counseling, Federated Investment Management Company, Passport Research, Ltd., and Federated MDTA, LLC; Financial and Operations Principal for Federated Securities Corp., Edgewood Services, Inc. and Southpointe Distribution Services, Inc. |
Peter J. Germain
Birth Date: September 3, 1959
CHIEF LEGAL OFFICER, SECRETARY and EXECUTIVE VICE PRESIDENT
Officer since: October 2005 | Principal Occupations: Mr. Germain is Chief Legal Officer, Secretary and Executive Vice President of the Federated Fund Family. He is General Counsel, Chief Legal Officer, Secretary and Executive Vice President, Federated Investors, Inc.; Trustee and Senior Vice President, Federated Investors Management Company; Trustee and President, Federated Administrative Services; Director and President, Federated Administrative Services, Inc.; Director and Vice President, Federated Securities Corp.; Director and Secretary, Federated Private Asset Management, Inc.; Secretary, Federated Shareholder Services Company; and Secretary, Retirement Plan Service Company of America. Mr. Germain joined Federated in 1984 and is a member of the Pennsylvania Bar Association.
Previous Positions: Deputy General Counsel, Special Counsel, Managing Director of Mutual Fund Services, Federated Investors, Inc.; Senior Vice President, Federated Services Company; and Senior Corporate Counsel, Federated Investors, Inc. |
Richard B. Fisher
Birth Date: May 17, 1923
VICE CHAIRMAN
Officer since: October 2005 | Principal Occupations: Vice Chairman or Vice President of some of the Funds in the Federated Fund Family; Vice Chairman, Federated Investors, Inc.; Chairman, Federated Securities Corp.
Previous Positions: President and Director or Trustee of some of the Funds in the Federated Fund Family; Executive Vice President, Federated Investors, Inc.; Director and Chief Executive Officer, Federated Securities Corp. |
Stephen Van Meter
Birth Date: June 5, 1975
CHIEF COMPLIANCE OFFICER AND SENIOR VICE PRESIDENT
Officer since: July 2015 | Principal Occupations: Senior Vice President and Chief Compliance Officer of the Federated Fund Family; Vice President and Chief Compliance Officer of Federated Investors, Inc. and Chief Compliance Officer of certain of its subsidiaries. Mr. Van Meter joined Federated in October 2011. He holds FINRA licenses under Series 3, 7, 24 and 66.
Previous Positions: Mr. Van Meter previously held the position of Compliance Operating Officer, Federated Investors, Inc. Prior to joining Federated, Mr. Van Meter served at the United States Securities and Exchange Commission in the positions of Senior Counsel, Office of Chief Counsel, Division of Investment Management and Senior Counsel, Division of Enforcement. |
Robert J. Ostrowski
Birth Date: April 26, 1963
Chief Investment Officer
Officer since: September 2006 | Principal Occupations: Robert J. Ostrowski joined Federated in 1987 as an Investment Analyst and became a Portfolio Manager in 1990. He was named Chief Investment Officer of Federated's taxable fixed-income products in 2004 and also serves as a Senior Portfolio Manager. Mr. Ostrowski became an Executive Vice President of the Fund's Adviser in 2009 and served as a Senior Vice President of the Fund's Adviser from 1997 to 2009. Mr. Ostrowski has received the Chartered Financial Analyst designation. He received his M.S. in Industrial Administration from Carnegie Mellon University. |
Stephen F. Auth
Birth Date: September 13, 1956
101 Park Avenue
41st Floor
New York, NY 10178
CHIEF INVESTMENT OFFICER
Officer since: February 2015 | Principal Occupations: Stephen F. Auth is Chief Investment Officer of various Funds in the Federated Fund Family; Executive Vice President, Federated Investment Counseling, Federated Global Investment Management Corp. and Federated Equity Management Company of Pennsylvania.
Previous Positions: Executive Vice President, Federated Investment Management Company and Passport Research, Ltd. (investment advisory subsidiary of Federated); Senior Vice President, Global Portfolio Management Services Division; Senior Vice President, Federated Investment Management Company and Passport Research, Ltd.; Senior Managing Director and Portfolio Manager, Prudential Investments. |
Annual Shareholder Report
Evaluation and Approval of Advisory Contract–May 2017
Federated Mortgage Strategy Portfolio (the “Fund”)
Following a review and recommendation of approval by the Fund's independent trustees, the Fund's Board of Trustees (the “Board”) reviewed and unanimously approved the continuation of the Fund's investment advisory contract for an additional one-year term at its May 2017 meetings. The Board's decision regarding the contract reflects the exercise of its business judgment after considering all of the information received on whether to continue the existing arrangements. The Fund is distinctive in that it is used to implement particular investment strategies that are offered to investors in certain separately managed or wrap fee accounts or programs or certain other discretionary investment accounts, and may also be offered to other Federated funds.
Federated Investment Management Company (the “Adviser”) does not charge an investment advisory fee for its services, however, it or its affiliates may receive compensation for managing assets invested in the Fund.
The Board had previously appointed a Senior Officer, whose duties include specified responsibilities relating to the process by which advisory fees are to be charged to a Federated fund. The Senior Officer has the authority to retain consultants, experts, or staff as may be reasonably necessary to assist in the performance of his duties, reports directly to the Board, and may be terminated only with the approval of a majority of the independent members of the Board. The Senior Officer prepared and furnished to the Board an independent, written evaluation that covered topics discussed below (the “Senior Officer's Evaluation”). The Board considered the Senior Officer's Evaluation, along with other information, in deciding to approve the investment advisory contract.
As previously noted, the Adviser does not charge an investment advisory fee to this Fund for its services; however, the Board did consider compensation and benefits received by the Adviser, including fees received for services provided to the Fund by Federated Investors, Inc. and its affiliates (“Federated”) and research services received by the Adviser from brokers that execute Federated fund trades. The Board also considered judicial decisions concerning allegedly excessive investment advisory fees in its decision. Using these judicial decisions as a guide, the Board has indicated that the following factors may be relevant to an adviser's fiduciary duty with respect to its receipt of compensation from a fund: (1) the nature and quality of the services provided by an adviser to a fund and its shareholders (including the performance of the Fund and of comparable funds); (2) an adviser's cost of providing the services (including the profitability to an adviser of providing advisory services to a fund); (3) the extent to which an adviser may realize “economies of scale” as a fund grows larger and, if such economies of scale exist, whether they have been shared with a fund and its shareholders or the family of funds; (4) any “fall-out financial benefits” that accrue to an adviser because of its relationship with a fund (including research services received from brokers that execute fund trades and any fees paid to affiliates of an adviser for services rendered to a fund); (5) comparative fee and expense structures (including a comparison of fees paid to an adviser with those paid by similar funds); and (6) the extent of care, conscientiousness and independence with which the Fund's board members perform their duties and their expertise (including whether they are fully informed about all facts the Board deems relevant to its consideration of the Adviser's services and fees). The Board noted that the Securities and Exchange Commission (“SEC”) disclosure requirements regarding the basis for the Board's approval of the Fund's investment advisory contract generally align with the factors listed above. Consistent with the judicial decisions and SEC disclosure requirements, the Board also considered management fees charged to institutional and other clients of the Adviser and its advisory affiliates for what might be viewed as like services. The Board was aware of these factors and was guided by them in its review of the Fund's investment advisory contract to the extent it considered them to be appropriate and relevant, as discussed further below.
The Board considered and weighed these factors in light of its substantial accumulated experience in governing the Fund and working with Federated on matters relating to the Federated funds. The Board was assisted in its deliberations by independent legal counsel. In addition to the extensive materials that comprise and accompany the Senior Officer's Evaluation, the Board received detailed information about the Fund and the Federated organization throughout the year, and in connection with its May meetings. Federated provided much of this information at each regular meeting of the Board, and furnished additional information in connection with the May meetings at which the Board's formal approval of the investment advisory contract occurred. At the May meetings, in addition to meeting in separate sessions of the independent trustees without management present, senior management of the Adviser also met with the independent trustees and their counsel to discuss the materials presented and any other matters thought relevant by the Adviser or the trustees. Between regularly scheduled meetings, the Board also received information on particular matters as the need arose. The Board's consideration of the investment advisory contract included review of the Senior Officer's Evaluation, accompanying data and additional information covering such matters as: the Adviser's investment philosophy, revenue, profitability, personnel and processes; investment and operating strategies; the Fund's short-term and long-term performance (in absolute terms, both on a gross basis and net of expenses, as well as in terms relative to its particular investment program and certain competitor or “peer group” funds and/or other benchmarks, as appropriate) and comments on the reasons for performance; the Fund's investment objectives; the Fund's expenses, including the advisory fee and the overall expense
Annual Shareholder Report
structure of the Fund (both in absolute terms and relative to similar and/or competing funds), with due regard for contractual or voluntary expense limitations; the use and allocation of brokerage commissions derived from trading the Fund's portfolio securities (if any); and the nature, quality and extent of the advisory and other services provided to the Fund by the Adviser and its affiliates. The Board also considered the preferences and expectations of Fund shareholders; the entrepreneurial risk assumed by the Adviser in sponsoring the Fund; the continuing state of competition in the mutual fund industry and market practices; the range of comparable fees for similar funds in the mutual fund industry; the Fund's relationship to the Federated funds which include a comprehensive array of funds with different investment objectives, policies and strategies which are generally available for exchange without the incurrence of additional sales charges; compliance and audit reports concerning the Federated funds and the Federated companies that service them (including communications from regulatory agencies), as well as Federated's responses to any issues raised therein; and relevant developments in the mutual fund industry and how the Federated funds and/or Federated are responding to them. The Board's evaluation process is evolutionary. The criteria considered and the emphasis placed on relevant criteria change in recognition of changing circumstances in the mutual fund marketplace.
The Board considered the nature, extent and quality of the services provided to the Fund by the Adviser and the resources of the Adviser and its affiliates dedicated to the Fund. In this regard, the Board evaluated, among other things, the Adviser's personnel, experience, track record, overall reputation and willingness to invest in personnel and infrastructure that benefit the Fund. In addition, the Board reviewed the qualifications, backgrounds and responsibilities of the portfolio management team primarily responsible for the day-to-day management of the Fund. The Board noted the compliance programs of, and the compliance-related resources provided to, the Fund by the Adviser. The Fund's ability to deliver competitive performance when compared to its benchmark index was also deemed to be relevant by the Board as a useful indicator of how the Adviser is executing the Fund's investment program. The Adviser's ability to execute this program was one of the Board's considerations in reaching a conclusion that the nature, extent and quality of the Adviser's investment management services warrant the continuation of the investment advisory contract.
The Board was informed by the Adviser that, for the periods covered by the Senior Officer's Evaluation, the Fund outperformed its benchmark index for the one-year, three-year and five-year periods.
Following such evaluation, and full deliberations, the Board concluded that the performance of the Fund supported renewal of the Fund's investment advisory contract.
Because the Adviser does not charge the Fund an investment advisory fee, the Board does not consider fee comparisons to other mutual funds or other institutional or separate accounts to be relevant to its deliberations.
The Board also received financial information about Federated, including information regarding the compensation and ancillary (or “fall-out”) benefits Federated derived from its relationships with the Federated funds. As the Adviser does not charge an investment advisory fee for its services, this information generally covered fees received by Federated's subsidiaries for providing other services to the Federated funds under separate contracts (e.g., for serving as the Federated funds' administrator). The information also detailed any indirect benefit Federated may derive from its receipt of research services from brokers who execute Federated fund trades. In addition, the Board considered the fact that, in order for a fund to be competitive in the marketplace, Federated and its affiliates frequently waived fees and/or reimbursed expenses and have disclosed to fund investors and/or indicated to the Board their intention to do so in the future. Moreover, the Board receives regular reporting as to the institution, adjustment or elimination of these voluntary waivers. The Board considered Federated's previous reductions in contractual management fees to certain funds in response to the Senior Officer's recommendations.
The Board and the Senior Officer also reviewed information compiled by Federated comparing its profitability information to other publicly held fund management companies. In this regard, the Senior Officer concluded that Federated's profit margins did not appear to be excessive. The Senior Officer also noted that Federated appeared financially sound, with the resources to fulfill its obligations under its contracts with the Fund.
While the Senior Officer noted certain items for follow-up reporting to the Board and further consideration by management, he stated that his observations and information accompanying the Senior Officer's Evaluation supported a finding by the Board that the management fee for the Fund was reasonable. Under these circumstances, no changes were recommended to, and no objection was raised to, the continuation of the Fund's investment advisory contract.
The Board based its decision to approve the investment advisory contract on the totality of the circumstances and relevant factors and with a view to past and future long-term considerations. Not all of the factors and considerations identified above were necessarily relevant to the Fund, nor did the Board consider any one of them to be determinative. In particular, due to the unusual nature of the Fund as primarily an internal product with no advisory fee, the Board does not consider the assessment of whether economies of scale would be realized if the Fund were to grow to a sufficient size to be particularly relevant. With respect to the factors that were relevant, the Board's decision to approve the continuation of the contract reflects its determination that Federated's performance and actions provided a satisfactory basis to support the decision to continue the existing arrangement.
Annual Shareholder Report
Voting Proxies on Fund Portfolio Securities
A description of the policies and procedures that the Fund uses to determine how to vote proxies, if any, relating to securities held in the Fund's portfolio, as well as a report on “Form N-PX” of how the Fund voted any such proxies during the most recent 12-month period ended June 30, are available, without charge and upon request, by calling 1-800-341-7400. A report on “Form N-PX” of how the Fund voted any such proxies during the most recent 12-month period ended June 30 is available via the Proxy Voting Record (Form N-PX) link associated with the Fund at www.FederatedInvestors.com under the “Managed Accounts” section of the “Products” tab. Click on the appropriate asset class or category under “Find Managed Accounts,” where you will be directed to create a password and login to access this information. After you have logged in, select a product name, then click on the “MAPs” link under “Managed Account Pools,” and select the Fund under “Managed Account Pools Available” to access the “Literature” tab. Form N-PX filings are also available at the SEC's website at www.sec.gov.
Quarterly Portfolio Schedule
The Fund files with the SEC a complete schedule of its portfolio holdings, as of the close of the first and third quarters of its fiscal year, on “Form N-Q.” These filings are available on the SEC's website at www.sec.gov and may be reviewed and copied at the SEC's Public Reference Room in Washington, DC. (Call 1-800-SEC-0330 for information on the operation of the Public Reference Room.) You may also access this information at www.FederatedInvestors.com under the “Managed Accounts” section of the “Products” tab. Click on the appropriate asset class or category under “Find Managed Accounts,” where you will be directed to create a password and login to access this information. After you have logged in, select a product name, then click on the “MAPs” link under “Managed Account Pools,” and select the Fund under “Managed Account Pools Available” to access the “Literature” tab.
Annual Shareholder Report
Mutual funds are not bank deposits or obligations, are not guaranteed by any bank and are not insured or guaranteed by the U.S. government, the Federal Deposit Insurance Corporation, the Federal Reserve Board or any other government agency. Investment in mutual funds involves investment risk, including the possible loss of principal.
This Report is authorized for distribution to prospective investors only when preceded or accompanied by the Fund's Prospectus, which contains facts concerning its objective and policies, management fees, expenses and other information.
Federated Mortgage Strategy Portfolio
Federated Investors Funds
4000 Ericsson Drive
Warrendale, PA 15086-7561
Contact us at FederatedInvestors.com
or call 1-800-341-7400.
Federated Securities Corp., Distributor
CUSIP 31421P407
38011 (2/18)
Federated is a registered trademark of Federated Investors, Inc.
2018 ©Federated Investors, Inc.
(a) As of the end of the period covered by this report, the registrant has adopted a code of ethics (the "Section 406 Standards for Investment Companies - Ethical Standards for Principal Executive and Financial Officers") that applies to the registrant's Principal Executive Officer and Principal Financial Officer; the registrant's Principal Financial Officer also serves as the Principal Accounting Officer.
(c) There was no amendment to the registrant’s code of ethics described in Item 2(a) above during the period covered by the report.
(d) There was no waiver granted, either actual or implicit, from a provision to the registrant’s code of ethics described in Item 2(a) above during the period covered by the report.
(e) Not Applicable
(f)(3) The registrant hereby undertakes to provide any person, without charge, upon request, a copy of the code of ethics. To request a copy of the code of ethics, contact the registrant at 1-800-341-7400, and ask for a copy of the Section 406 Standards for Investment Companies - Ethical Standards for Principal Executive and Financial Officers.
Item 3. Audit Committee Financial Expert
The registrant's Board has determined that each of the following members of the Board's Audit Committee is an “audit committee financial expert,” and is "independent," for purposes of this Item: John T. Collins, G. Thomas Hough and Thomas M. O'Neill.
| Item 4. | Principal Accountant Fees and Services |
(a) Audit Fees billed to the registrant for the two most recent fiscal years:
Fiscal year ended 2017 - $145,420
Fiscal year ended 2016 - $166,860
(b) Audit-Related Fees billed to the registrant for the two most recent fiscal years:
Fiscal year ended 2017 - $0
Fiscal year ended 2016 - $0
Amount requiring approval of the registrant’s audit committee pursuant to paragraph (c)(7)(ii) of Rule 2-01 of Regulation S-X, $0 and $0 respectively.
(c) Tax Fees billed to the registrant for the two most recent fiscal years:
Fiscal year ended 2017 - $0
Fiscal year ended 2016 - $0
Amount requiring approval of the registrant’s audit committee pursuant to paragraph (c)(7)(ii) of Rule 2-01 of Regulation S-X, $0 and $0 respectively.
(d) All Other Fees billed to the registrant for the two most recent fiscal years:
Fiscal year ended 2017 - $0
Fiscal year ended 2016 - $0
Amount requiring approval of the registrant’s audit committee pursuant to paragraph (c)(7)(ii) of Rule 2-01 of Regulation S-X, $45,968 and $42,029 respectively. Fiscal year ended 2017- Service fee for analysis of potential Passive Foreign Investment Company holdings. Fiscal year ended 2016- Service fee for analysis of potential Passive Foreign Investment Company holdings.
(e)(1) Audit Committee Policies regarding Pre-approval of Services.
The Audit Committee is required to pre-approve audit and non-audit services performed by the independent auditor in order to assure that the provision of such services do not impair the auditor’s independence. Unless a type of service to be provided by the independent auditor has received general pre-approval, it will require specific pre-approval by the Audit Committee. Any proposed services exceeding pre-approved cost levels will require specific pre-approval by the Audit Committee.
Certain services have the general pre-approval of the Audit Committee. The term of the general pre-approval is 12 months from the date of pre-approval, unless the Audit Committee specifically provides for a different period. The Audit Committee will annually review the services that may be provided by the independent auditor without obtaining specific pre-approval from the Audit Committee and may grant general pre-approval for such services. The Audit Committee will revise the list of general pre-approved services from time to time, based on subsequent determinations. The Audit Committee will not delegate its responsibilities to pre-approve services performed by the independent auditor to management.
The Audit Committee has delegated pre-approval authority to its Chairman. The Chairman will report any pre-approval decisions to the Audit Committee at its next scheduled meeting. The Committee will designate another member with such pre-approval authority when the Chairman is unavailable.
AUDIT SERVICES
The annual Audit services engagement terms and fees will be subject to the specific pre-approval of the Audit Committee. The Audit Committee must approve any changes in terms, conditions and fees resulting from changes in audit scope, registered investment company (RIC) structure or other matters.
In addition to the annual Audit services engagement specifically approved by the Audit Committee, the Audit Committee may grant general pre-approval for other Audit Services, which are those services that only the independent auditor reasonably can provide. The Audit Committee has pre-approved certain Audit services, all other Audit services must be specifically pre-approved by the Audit Committee.
AUDIT-RELATED SERVICES
Audit-related services are assurance and related services that are reasonably related to the performance of the audit or review of the Company’s financial statements or that are traditionally performed by the independent auditor. The Audit Committee believes that the provision of Audit-related services does not impair the independence of the auditor, and has pre-approved certain Audit-related services, all other Audit-related services must be specifically pre-approved by the Audit Committee.
TAX SERVICES
The Audit Committee believes that the independent auditor can provide Tax services to the Company such as tax compliance, tax planning and tax advice without impairing the auditor’s independence. However, the Audit Committee will not permit the retention of the independent auditor in connection with a transaction initially recommended by the independent auditor, the purpose of which may be tax avoidance and the tax treatment of which may not be supported in the Internal Revenue Code and related regulations. The Audit Committee has pre-approved certain Tax services, all Tax services involving large and complex transactions must be specifically pre-approved by the Audit Committee.
ALL OTHER SERVICES
With respect to the provision of services other than audit, review or attest services the pre-approval requirement is waived if:
| (1) | The aggregate amount of all such services provided constitutes no more than five percent of the total amount of revenues paid by the registrant, the registrant’s adviser (not including any sub-adviser whose role is primarily portfolio management and is subcontracted with or overseen by another investment adviser), and any entity controlling, controlled by, or under common control with the investment adviser that provides ongoing services to the registrant to its accountant during the fiscal year in which the services are provided; |
| (2) | Such services were not recognized by the registrant, the registrant’s adviser (not including any sub-adviser whose role is primarily portfolio management and is subcontracted with or overseen by another investment adviser), and any entity controlling, controlled by, or under common control with the investment adviser that provides ongoing services to the registrant at the time of the engagement to be non-audit services; and |
| (3) | Such services are promptly brought to the attention of the Audit Committee of the issuer and approved prior to the completion of the audit by the Audit Committee or by one or more members of the Audit Committee who are members of the board of directors to whom authority to grant such approvals has been delegated by the Audit Committee. |
The Audit Committee may grant general pre-approval to those permissible non-audit services classified as All Other services that it believes are routine and recurring services, and would not impair the independence of the auditor.
The SEC’s rules and relevant guidance should be consulted to determine the precise definitions of prohibited non-audit services and the applicability of exceptions to certain of the prohibitions.
PRE-APPROVAL FEE LEVELS
Pre-approval fee levels for all services to be provided by the independent auditor will be established annually by the Audit Committee. Any proposed services exceeding these levels will require specific pre-approval by the Audit Committee.
PROCEDURES
Requests or applications to provide services that require specific approval by the Audit Committee will be submitted to the Audit Committee by both the independent auditor and the Principal Accounting Officer and/or Internal Auditor, and must include a joint statement as to whether, in their view, the request or application is consistent with the SEC’s rules on auditor independence.
(e)(2) Percentage of services identified in items 4(b) through 4(d) that were approved by the registrants audit committee pursuant to paragraph (c)(7)(i)(C) of Rule 2-01 of Regulation S-X:
4(b)
Fiscal year ended 2017 – 0%
Fiscal year ended 2016 - 0%
Percentage of services provided to the registrants investment adviser and any entity controlling, controlled by, or under common control with the investment adviser that provides ongoing services to the registrant that were approved by the registrants audit committee pursuant to paragraph (c)(7)(i)(C) of Rule 2-01 of Regulation S-X, 0% and 0% respectively.
4(c)
Fiscal year ended 2017 – 0%
Fiscal year ended 2016 – 0%
Percentage of services provided to the registrants investment adviser and any entity controlling, controlled by, or under common control with the investment adviser that provides ongoing services to the registrant that were approved by the registrants audit committee pursuant to paragraph (c)(7)(i)(C) of Rule 2-01 of Regulation S-X, 0% and 0% respectively.
4(d)
Fiscal year ended 2017 – 0%
Fiscal year ended 2016 – 0%
Percentage of services provided to the registrants investment adviser and any entity controlling, controlled by, or under common control with the investment adviser that provides ongoing services to the registrant that were approved by the registrants audit committee pursuant to paragraph (c)(7)(i)(C) of Rule 2-01 of Regulation S-X, 0% and 0% respectively.
| (g) | Non-Audit Fees billed to the registrant, the registrant’s investment adviser, and certain entities controlling, controlled by or under common control with the investment adviser: |
Fiscal year ended 2017 - $908,833
Fiscal year ended 2016 - $301,937
| (h) | The registrant’s Audit Committee has considered that the provision of non-audit services that were rendered to the registrant’s adviser (not including any sub-adviser whose role is primarily portfolio management and is subcontracted with or overseen by another investment adviser), and any entity controlling, controlled by, or under common control with the investment adviser that provides ongoing services to the registrant that were not pre-approved pursuant to paragraph (c)(7)(ii) of Rule 2-01 of Regulation S-X is compatible with maintaining the principal accountant’s independence. |
In their respective required communications to the Audit Committee of the registrant’s Board, Ernst & Young LLP (“EY”) and KPMG LLP (“KPMG”) (as applicable, “EY/KPMG”), the registrant’s independent public accountants, informed the Audit Committee that EY/KPMG and/or covered person professionals within EY/KPMG maintain lending relationships with certain owners of greater than 10% of the shares of the registrant and/or certain investment companies within the “investment company complex” as defined under Rule 2-01(f)(14) of Regulation S-X, which are affiliates of the registrant. EY/KPMG has advised the Audit Committee that these lending relationships implicate Rule 2-01(c)(1)(ii)(A) of Regulation S-X (referred to as the “Loan Rule”). The Loan Rule prohibits an independent public accountant, or covered person professionals at such firm, from having a financial relationship (such as a loan) with a lender that is a record or beneficial owner of more than 10% of an audit client’s equity securities. For purposes of the Loan Rule, audit clients include the registrant, as well as all registered investment companies advised by advisory subsidiaries of Federated Investors, Inc., the Adviser (for which EY serves as independent public accountant), and their respective affiliates (collectively, the “Federated Fund Complex”).
EY/KPMG informed the Audit Committee that EY/KPMG believes that these lending relationships described above do not and will not impair EY/KPMG’s ability to exercise objective and impartial judgment in connection with financial statement audits of their respective funds of the registrant and a reasonable investor with knowledge of all relevant facts and circumstances would conclude that EY/KPMG has been and is capable of objective and impartial judgment on all issues encompassed within EY/KPMG’s audits.
On June 20, 2016, the Division of Investment Management of the Securities and Exchange Commission (“SEC”) issued a no-action letter to another mutual fund complex (see Fidelity Management & Research Company et al., No-Action Letter) related to similar Loan Rule matters as those described above (the “Letter”). In the Letter, the SEC Staff confirmed that it would not recommend enforcement action against an investment company that relied on the audit services performed by an independent public accountant where the Loan Rule was implicated in certain specified circumstances provided that: (1) the auditor has complied with PCAOB Rule 3526(b)(1) and 3526(b)(2); (2) the Loan Rule is implicated because of lending relationships; and (3) notwithstanding such lending relationships that implicate the Loan Rule, the auditor has concluded that it is objective and impartial with respect to the issues encompassed within its engagement as auditor of the funds. The circumstances described in the Letter are substantially similar to the circumstances that implicated the Loan Rule with respect to EY/KPMG and the registrant. On September 22, 2017, the SEC issued another no-action letter to Fidelity Management & Research Company et al extending the expiration of the Letter until the effectiveness of any amendments to the Loan Rule designed to address the concerns in the Letter (the “Letters”).
If it were to be determined that the relief available under the Letters was improperly relied upon, or that the independence requirements under the federal securities laws were not otherwise complied with regarding the registrant, for certain periods, any of the registrant’s filings with the SEC which contain financial statements of the registrant for such periods may not comply with applicable federal securities laws, the registrant’s ability to offer shares under its current registration statement may be impacted, and certain financial reporting and/or other covenants with, and representations and warranties to, the registrant’s lender under its committed line of credit may be impacted. Such events could have a material adverse effect on the registrant and the Federated Fund Complex.
| Item 5. | Audit Committee of Listed Registrants |
Not Applicable
| Item 6. | Schedule of Investments |
(a) The registrant’s Schedule of Investments is included as part of the Report to Stockholders filed under Item 1 of this form.
(b) Not Applicable; Fund had no divestments during the reporting period covered since the previous Form N-CSR filing.
| Item 7. | Disclosure of Proxy Voting Policies and Procedures for Closed-End Management Investment Companies |
Not Applicable
| Item 8. | Portfolio Managers of Closed-End Management Investment Companies |
Not Applicable
| Item 9. | Purchases of Equity Securities by Closed-End Management Investment Company and Affiliated Purchasers |
Not Applicable
| Item 10. | Submission of Matters to a Vote of Security Holders |
No Changes to Report
| Item 11. | Controls and Procedures |
(a) The registrant’s President and Treasurer have concluded that the
registrant’s disclosure controls and procedures (as defined in rule 30a-3(c) under the Act) are effective in design and operation and are sufficient to form the basis of the certifications required by Rule 30a-(2) under the Act, based on their evaluation of these disclosure controls and procedures within 90 days of the filing date of this report on Form N-CSR.
(b) There were no changes in the registrant’s internal control over financial reporting (as defined in rule 30a-3(d) under the Act) during the second fiscal quarter of the period covered by this report that have materially affected, or are reasonably likely to materially affect, the registrant’s internal control over financial reporting.
| Item 12. | Disclosure of Securities Lending Activities for Closed-End Management Investment Companies |
Not Applicable
(a)(1) Code of Ethics- Not Applicable to this Report.
(a)(2) Certifications of Principal Executive Officer and Principal Financial Officer.
(a)(3) Not Applicable.
(b) Certifications pursuant to 18 U.S.C. Section 1350.
SIGNATURES
Pursuant to the requirements of the Securities Exchange Act of 1934 and the Investment Company Act of 1940, the registrant has duly caused this report to be signed on its behalf by the undersigned, thereunto duly authorized.
Registrant Federated Managed Pool Series
By /S/ Lori A. Hensler
Lori A. Hensler, Principal Financial Officer
Date February 22, 2018
Pursuant to the requirements of the Securities Exchange Act of 1934 and the Investment Company Act of 1940, this report has been signed below by the following persons on behalf of the registrant and in the capacities and on the dates indicated.
By /S/ J. Christopher Donahue
J. Christopher Donahue, Principal Executive Officer
Date February 22, 2018
By /S/ Lori A. Hensler
Lori A. Hensler, Principal Financial Officer
Date February 22, 2018