Exhibit 99.1
ANNUAL INFORMATION FORM
For the year ended March 31, 2012

Dated as at June 19, 2012
SILVERCORP METALS INC.
(“Silvercorp” or the “Company”)
Suite 1378 - 200 Granville Street
Vancouver, BC, Canada V6C 1S4
Tel: (604) 669-9397
Fax: (604) 669-9387
Email: corp@silvercorp.ca
Website: www.silvercorp.ca
| | |
| ITEM 1 | GENERAL | 3 |
| 1.1 | Date of Information | 3 |
| 1.2 | Forward Looking Statements | 3 |
| 1.3 | Currency | 6 |
| ITEM 2 | CORPORATE STRUCTURE | 7 |
| 2.1 | Names, Address and Incorporation | 7 |
| 2.2 | Intercorporate Relationships | 7 |
| ITEM 3 | GENERAL DEVELOPMENT OF THE BUSINESS | 9 |
| 3.1 | Business of Silvercorp | 9 |
| 3.2 | The Company’s Strategic Vision | 9 |
| 3.3 | Three Year History of Project Development | 10 |
| 3.4 | Other Matters | 14 |
| ITEM 4 | DESCRIPTION OF THE BUSINESS | 14 |
| 4.1 | General | 14 |
| 4.2 | Chinese Mining Law | 16 |
| 4.3 | Risk Factors | 17 |
| ITEM 5 | MINERAL PROPERTIES | 27 |
| 5.1 | Ying Mine, Henan Province, China. | 27 |
| 5.2 | GC Project | 46 |
| ITEM 6 | DIVIDENDS | 67 |
| ITEM 7 | DESCRIPTION OF CAPITAL STRUCTURE | 67 |
| ITEM 8 | MARKET FOR SECURITIES | 69 |
| ITEM 9 | ESCROWED SECURITIES | 70 |
| ITEM 10 | DIRECTORS & OFFICERS | 70 |
| ITEM 11 | AUDIT COMMITTEE | 73 |
| ITEM 12 | PROMOTERS | 75 |
| ITEM 13 | LEGAL PROCEEDINGS AND REGULATORY ACTIONS | 75 |
| ITEM 14 | INTEREST OF MANAGEMENT AND OTHERS IN MATERIALTRANSACTIONS | 75 |
| ITEM 15 | TRANSFER AGENTS AND REGISTRARS | 75 |
| ITEM 16 | MATERIAL CONTRACTS | 75 |
| ITEM 17 | INTERESTS OF EXPERTS | 75 |
| ITEM 18 | ADDITIONAL INFORMATION | 77 |
| ITEM 19 | SCHEDULE “A” | 78 |
2
ITEM 1 GENERAL
1.1Date of Information
All information in this Annual Information Form is as of March 31, 2012, unless otherwise indicated.
1.2Forward Looking Statements
Certain of the statements and information in this Annual Information Form (“AIF”) for Silvercorp Metals Inc. (“Silvercorp” or the “Company”) constitute “forward-looking statements” within the meaning of the United StatesPrivate Securities Litigation Reform Actof 1995 and “forward-looking information” within the meaning of applicable Canadian provincial securities laws. All statements and information concerning mineral resource and mineral reserve estimates may also be deemed to constitute “forward-looking statements” to the extent that they involve estimates of the mineralization that will be encountered if the property is developed. Any statements or information that express or involve discussions with respect to predictions, expectations, beliefs, plans, projections, objectives, assumptions or future events or performance (often, but not always, using words or phrases such as “expects”, “is expected”, “anticipates”, “believes”, “plans”, “projects”, “estimates”, “assumes”, “intends”, “strategies”, “targets”, “goals”, “forecasts”, “objectives”, “budgets”, “schedules”, “potential” or variations thereof or stating that certain actions, events or results “may”, “could”, “would”, “might” or “will” be taken, occur or be achieved, or the negative of any of these terms and similar expressions) are not statements of historical fact and may be forward-looking statements or information. Forward-looking statements or information relate to, among other things:
the price of silver and other metals;
the accuracy of mineral resource and mineral reserve estimates at the Company’s material properties;
estimated production from the Company’s mines in the Ying Mining District (defined herein);
timing of receipt of regulatory approvals;
availability of funds from production to finance the Company’s operations; and
access to and availability of funding for future construction and development of the Company’s properties.
Forward-looking statements or information are subject to a variety of known and unknown risks, uncertainties and other factors that could cause actual events or results to differ from those reflected in the forward-looking statements or information, including, without limitation, risks relating to:
fluctuating commodity prices;
estimation of mineral resources, reserves and mineralization and precious and base metal recovery;
interpretations and assumptions of mineral resource and mineral reserve estimates;
3
exploration and development programs;
feasibility and engineering reports;
permits and licences;
title to properties;
First Nations title claims and rights;
property interests;
joint venture partners;
acquisition of commercially mineable mineral rights;
financing;
recent market events and conditions;
economic factors affecting the Company;
timing, estimated amount, capital and operating expenditures and economic returns of future production;
integration of future acquisitions into the Company’s existing operations;
competition;
operations and political conditions;
regulatory environment in China and Canada;
environmental risks;
foreign exchange rate fluctuations;
insurance;
risks and hazards of mining operations;
dependence on management and key personnel;
conflicts of interest;
internal control over financial reporting as per the requirements of theSarbanes-Oxley Act; and
bringing actions and enforcing judgments under U.S. securities laws.
4
This list is not exhaustive of the factors that may affect any of the Company’s forward-looking statements or information. Forward-looking statements or information are statements about the future and are inherently uncertain, and actual achievements of the Company or other future events or conditions may differ materially from those reflected in the forward-looking statements or information due to a variety of risks, uncertainties and other factors, including, without limitation, those referred to in this AIF under the heading “Risk Factors” and elsewhere. Although the Company has attempted to identify important factors that could cause actual results to differ materially, there may be other factors that cause results not to be as anticipated, estimated, described or intended. Accordingly, readers should not place undue reliance on forward-looking statements or information.
The Company’s forward-looking statements and information are based on the assumptions, beliefs, expectations and opinions of management as of the date of this AIF, and other than as required by applicable securities laws, the Company does not assume any obligation to update forward-looking statements and information if circumstances or management’s assumptions, beliefs, expectations or opinions should change, or changes in any other events affecting such statements or information. For the reasons set forth above, investors should not place undue reliance on forward-looking statements and information.
Cautionary Note to U.S. Investors – Information Concerning Preparation of Mineral Resource and Mineral Reserve Estimates
This AIF has been prepared in accordance with the requirements of the securities laws in effect in Canada, which differ from the requirements of U.S. securities laws. Unless otherwise indicated, all mineral resource and mineral reserve estimates included in this AIF have been prepared in accordance with National Instrument 43-101Standards of Disclosure for Mineral Projects(“NI 43-101”) and the Canadian Institute of Mining Metallurgy and Petroleum’s “CIM Standards on Mineral Resources and Mineral Reserves” (the “CIM Guidelines”). NI 43-101 is a rule developed by the Canadian Securities Administrators which establishes standards for all public disclosure an issuer makes of scientific and technical information concerning mineral projects.
Canadian standards, including NI 43-101, differ significantly from the requirements of the United States Securities and Exchange Commission (“SEC”), and mineral resource and mineral reserve information contained herein may not be comparable to similar information disclosed by U.S. companies. In particular, and without limiting the generality of the foregoing, the term “resource” does not equate to the term “reserves”. Under U.S. standards, mineralization may not be classified as a “reserve” unless the determination has been made that the mineralization could be economically and legally produced or extracted at the time the reserve determination is made. The SEC’s disclosure standards normally do not permit the inclusion of information concerning “measured mineral resources”, “indicated mineral resources” or “inferred mineral resources” or other descriptions of the amount of mineralization in mineral deposits that do not constitute “reserves” by U.S. standards in documents filed with the SEC. U.S. investors should also understand that “inferred mineral resources” have a great amount of uncertainty as to their existence and great uncertainty as to their economic and legal feasibility. It cannot be assumed that all or any part of an “inferred mineral resource” will ever be upgraded to a higher category. Under Canadian rules, estimated “inferred mineral resources” may not form the basis of feasibility or pre-feasibility studies except in rare cases. Investors are cautioned not to assume that all or any part of an “inferred mineral resource” exists or is economically or legally mineable.
Disclosure of “contained metal” in a resource is permitted disclosure under Canadian regulations; however, the SEC normally only permits issuers to report mineralization that does not constitute “reserves” by SEC standards as in-place tonnage and grade without reference to unit measures. The requirements of NI 43-101 for identification of “reserves” are also not the same as those of the SEC, and reserves reported by the Company in compliance with NI 43-101 may not qualify as “reserves” under
5
SEC standards. Accordingly, information concerning mineral deposits set forth herein may not be comparable with information made public by companies that report in accordance with U.S. standards.
1.3Currency
All sums of money which are referred to herein are expressed in lawful money of the United States, unless otherwise specified. The symbol “C$” denotes lawful money of Canada and “RMB” denotes lawful money of the People’s Republic of China.
The following table sets forth, for each of the periods indicated, the year-end exchange rate, the average noon rate and the high and low noon exchange rates for one Canadian dollar expressed in U.S. dollars, as quoted by the Bank of Canada:
| | | | | | | |
| | Year Ended March 31, | |
| | 2012 | | 2011 | | 2010 | |
| High | 1.0583 | | 1.0324 | | 0.9775 | |
| Low | 0.9430 | | 0.9278 | | 0.8170 | |
| Average | 1.0070 | | 0.9840 | | 0.9171 | |
| Period End | 1.0009 | | 1.0290 | | 0.9775 | |
The exchange rate for one Canadian dollar expressed in U.S. dollars based upon the noon buying rate on June 19, 2012 provided by the Bank of Canada was $0.9825.
The following table sets forth, for each of the periods indicated, the year-end exchange rate, the average noon rate and the high and low noon exchange rates for one Canadian dollar expressed in Chinese Renminbi, as quoted by the Bank of Canada:
| | | | | | | |
| | Year Ended March 31, | |
| | 2012 | | 2011 | | 2010 | |
| High | 6.8681 | | 6.8540 | | 6.6723 | |
| Low | 6.0132 | | 6.3371 | | 5.5808 | |
| Average | 6.4390 | | 6.6004 | | 6.2625 | |
| Period End | 6.3052 | | 6.7340 | | 6.6723 | |
6
The exchange rate for one Canadian dollar expressed in Chinese Renminbi based upon the noon buying rate on June 19, 2012 provided by the Bank of Canada was RMB 6.2422.
ITEM 2 CORPORATE STRUCTURE
2.1Names, Address and Incorporation
Silvercorp was formed as Spokane Resources Ltd. pursuant to an amalgamation of Julia Resources Corporation and MacNeill International Industries Inc. under theCompany Act(British Columbia) on October 31, 1991. By a special resolution dated October 5, 2000, Spokane Resources Ltd. consolidated its share capital on a ten for one basis and altered its Memorandum and Articles of Incorporation by changing its name to “SKN Resources Ltd.” At the Company’s Annual and Special General Meeting held October 20, 2004, the shareholders (a) approved an increase to the Company’s authorized capital to an unlimited number of common shares and adopted new Articles consistent with the transition to theBusiness Corporations Act(British Columbia); and (b) passed a special resolution to change the Company’s name. On May 2, 2005, the Company filed a Notice of Alteration with the British Columbia Registrar of Companies changing its name from “SKN Resources Ltd.” to “Silvercorp Metals Inc.” The head office, principal address and registered and records office of the Company is located at 1378-200 Granville Street, Vancouver, British Columbia, V6C 1S4. The Company’s shares are listed for trading on the Toronto Stock Exchange (the “TSX”) and on the New York Stock Exchange (the “NYSE”), each under the symbol “SVM”, and the Company is a reporting issuer in British Columbia, Alberta, Saskatchewan, Manitoba, Ontario, Quebec, Nova Scotia and New Brunswick.
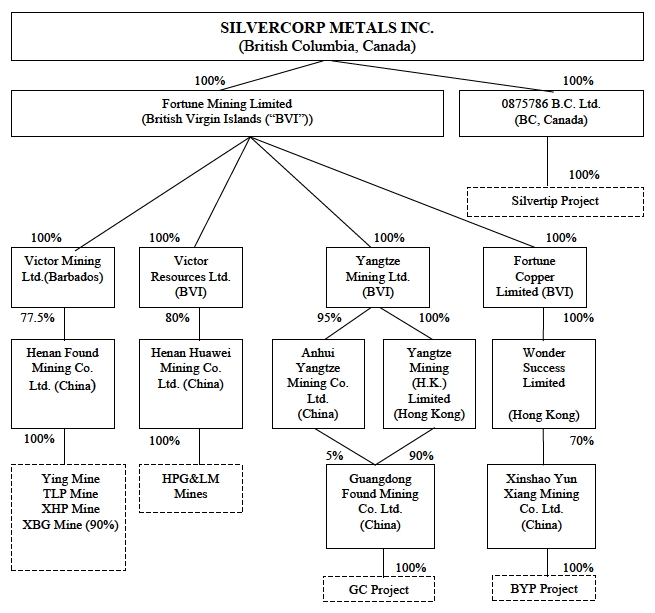
2.2Intercorporate Relationships
The corporate structure of the Company and its subsidiaries as at the date of this AIF is as follows:
7
The Company has acquired a number of mineral property interests in China and one property in British Columbia during the past several years.
The Company is the sole shareholder of Fortune Mining Limited (“Fortune”), which was incorporated on August 23, 2002, to be the holding company of several other subsidiaries which are parties to agreements relating to mineral properties in China. Fortune beneficially owns 100% of the following material subsidiary companies:
| | |
| a) | Victor Mining Ltd. (“Victor Mining”) was incorporated on October 23, 2003, under the laws of the BVI and continued into Barbados on August 27, 2009. Victor Mining is a party to a cooperative agreement under which it has earned a 77.5% interest in Henan Found Mining Co. Ltd. (“Henan Found”), the Chinese company holding, among other assets: (i) the Ying silver, lead and zinc project (the “Ying Mine”); and (ii) the silver and lead project in Tieluping (the “TLP Mine”) and (iii) the XHP and XBG mines (the “X Mines”). |
8
| b) | Victor Resources Ltd. (“Victor Resources”) was incorporated on May 30, 2003, under the laws of the BVI and is a party to a cooperative agreement under which it earned a 70% interest in Henan Huawei Mining Co. Ltd. (“Henan Huawei”), the Chinese company holding the project in Houpinggou and the project in Longmeng (collectively, the “HPG&LM Mines”) in the Henan Province. In May 2010, Victor Resources acquired shares from the minority shareholder of Henan Huawei and increased its ownership interest to 80%. |
| | |
| c) | Yangtze Mining Ltd. (“Yangtze Mining”) was incorporated on February 11, 2002. It holds a 100% interest in Yangtze Mining (H.K.) Ltd. and a 95% interest in Anhui Yangtze Mining Co. Ltd. (“Anhui Yangtze”), the Chinese company that held the silver, lead and zinc exploration permits on the project in Gaocheng (the “GC Project”) in the Guangdong Province. |
| | |
| d) | Fortune Copper Limited was incorporated on August 23, 2002. It holds a 100% interest in Wonder Success Limited, a Hong Kong Company which has a 70% equity interest in Xinshao Yun Xiang Mining Co. Ltd. (“Yunxiang”), which owns the BYP Project in Hunan Province. |
| | |
| e) | Guangdong Found Mining Company Limited (“Guangdong Found”) was incorporated in December 2008 as the designated joint venture operating company of the GC Project. Anhui Yangtze owns 5% of Guangdong Found and Yangtze HK owns 90% of Guangdong Found, respectively. Guangdong Found has a 100% beneficial interest in the GC Project. |
The Company’s operations in China are largely conducted through equity joint ventures, over which the Company has control. See “Item 4 General Description of Business, 4.2 Chinese Mining Law”.
The Company is also the sole shareholder of 0875786 B.C. Ltd. which was incorporated on March 10, 2010, and holds a 100% interest in the Silvertip Project in British Columbia, Canada.
ITEM 3 GENERAL DEVELOPMENT OF THE BUSINESS
3.1Business of Silvercorp
Silvercorp operates, develops, acquires and explores for silver mineral properties in China and Canada. Silvercorp is China’s largest primary silver producer. Currently, the Company is operating and developing four silver, lead and zinc mines in an area encompassing the Ying Mine, the TLP Mine, and the HPG and LM Mines (collectively, the “Ying Mining District”). The Company’s other material property is the GC Project (defined herein) in Guangdong Province, at which the Company is constructing a 1,600 tonne per day operation, with initial production expected to commence in Fiscal 2013. In February, 2010, Silvercorp acquired the advanced exploration-stage Silvertip silver, lead and zinc project in northern British Columbia, Canada. In January, 2011 Silvercorp acquired the BYP gold–lead zinc mine in Hunan Province, China. In August and December, 2011 Silvercorp, through Henan Found, acquired a 90% interest in the XBG Mine, and 100% interest in the XHP mine (collectively, the “X Mines”). Both mines are located approximately a three hour drive from the Ying Mining District.
3.2The Company’s Strategic Vision
Silvercorp has built a record of success by formulating and executing a distinct long-term strategy characterized by three key steps. First, Silvercorp focuses on the acquisition and selective exploration of projects with significant resource and cash flow potential. It seeks out higher grade, underground, precious metals projects that may be too small for large companies and too large for juniors. Second, Silvercorp focuses on quickly developing high-margin operations with reasonable development capital profiles to generate cash flow before the project’s full resource potential is fully drilled. Third, the cash
9
flow Silvercorp generates from its early operations are used to fund further exploration, resource expansion and production growth.
This strategy, with its focus on early production, provides earlier benefits to: (i) local communities through increased employment opportunities, (ii) local governments through payment of taxes, (iii) local joint venture partners through profit sharing, and (iv) Company shareholders through less dilution. The early benefits help build a base of strong stakeholder support necessary for further project growth.
3.3Three Year History of Project Development
Since 2003, when the Company changed its focus to mineral exploration in China, Silvercorp has been actively acquiring mineral properties in China and more recently, has pursued growth opportunities in other jurisdictions. Production at the Ying Mine commenced on April 1, 2006, and since that time, three of the Company’s other properties in Henan Province, China have commenced production.
The year ended March 31, 2012, was Silvercorp’s sixth consecutive year of production growth with annual production of 5.6 million ounces of silver. The Company also produced 72.8 million pounds of lead and 13.7 million pounds of zinc during the same period.
The following table summarizes the total metal production in each period under review.
| | | |
| | | Years Ended March 31, | |
| | 2012 | 2011 | 2010 |
| Silver (‘000s ounces) | 5,618 | 5,300 | 4,624 |
| Gold (‘000s ounces) | 8.8 | 3.2 | 1.6 |
| Lead (‘000s pounds) | 72,804 | 69,011 | 62,374 |
| Zinc (‘000s pounds) | 13,749 | 16,343 | 14,740 |
Henan Found
Ying Mine
In fiscal 2012, the total ore mined was 293,367 tonnes, of which 12,365 tonnes were direct smelting ore, a decrease of 7% compared to total ore production of 316,522 tonnes in fiscal 2011. The decrease was due to labour shortages which impacted our mining contractors at the Ying mine from July 2011 to November 2011. The Company has worked with its mining contractors to introduce new measures to maintain a stable mining labour force and it is also in the process of establishing its own mining crews to carry out mining operations at the Ying mine. As a result, the labour shortages were mostly resolved by the end of 2011, and the average daily mining production at the Ying mine was back to normal thereafter.
In fiscal 2012, silver head grade at the Ying mine was 440 g/t, compared to 470 g/t in fiscal 2011. Head grades for lead and zinc were 8.3% and 2.4%, respectively, comparable to head grades for lead and zinc of 8.1% and 2.8%, respectively, in fiscal 2011. Head grades were changing along with the mining sequence.
In fiscal 2012, the Ying mine produced 3.94 million ounces of silver, 52.2 million pounds of lead and 10.8 million pounds of zinc, a decrease of 7%, 1% and 19%, respectively, compared to 4.2 million ounces
10
of silver, 52.9 million pounds of lead and 13.4 million pounds of zinc produced in fiscal 2011. The decrease was a result of lower ore production and lower head grades.
In fiscal 2012, total mining costs per tonne and cash mining costs per tonne were $69.50 (FY 2011 - $59.14) and $50.52 (FY 2011 - $46.05), respectively. The increase of cash mining costs was mainly due to (i) higher mining contractor costs as the mine paid approximately $1.80 per tonne more as compensation for increases in miners’ salary and benefits, (ii) higher labour costs of approximately $1.00 per tonne due to the Company’s own employees’ pay raises, and (iii) the impact of the US dollar deprecation versus the Chinese RMB of $2.40 per tonne, which was offset by a $1.10 per tonne decrease in mining preparation costs. The increase of non-cash mining costs was a result of higher assets base subject to depletion.
Including by-product credits, in fiscal 2012, Ying mine’s total and cash cost per ounce of silver were negative $6.61 and negative $8.27, respectively, compared to negative $7.20 and negative $8.30 in fiscal 2011. The increase in cost was mainly due to lower by-product credits from lower production and a higher production costs noted above.
In fiscal 2012, the Company completed 464 m of the development of a 5,200 m access ramp at the Ying mine, with dimensions of 4 m by 4.5 m, starting from the 580 m elevation and going down to zero metre elevation. The access ramp will provide access to the S7-1 vein in which resources were expanded by recent drilling, and provide access to future expected mining operations below zero metre elevation. The access ramp is expected to be completed in two and half years. Inclusive of this development work, in fiscal 2012, the Ying mine incurred $15.5 million in exploration and development expenditures (FY 2011 – $11.3 million).
TLP Mine
The TLP Mine is located in Henan Province, China. Silvercorp acquired the TLP Mine in 2007.
In fiscal 2012, the TLP mine produced 1.03 million ounces of silver, 13.1 million pounds of lead and 2.1 million pounds of zinc, an increase of 57%, 34% and a decrease of 15%, respectively compared to 660,000 ounces of silver, 9.8 million pounds of lead and 2.4 million pounds of zinc produced in fiscal 2011.
The increases are attributable to increased production as more ore was mined while mine development progressed. In fiscal 2012, the total ore mined was 275,739 tonnes, of which 52 tonnes were direct smelting ore, an increase of 36% compared to total ore production of 202,417 tonnes in fiscal 2011. In fiscal 2012, silver head grade improved to 147 g/t from 122 g/t a year ago.
In fiscal 2012, total mining costs per tonne and cash mining costs per tonne were $55.82 (FY 2011 - $39.89) and $48.62 (FY 2011 - $35.68), respectively. The increase was mainly due to (i) higher mining contractor costs as the mine paid $4.00 per tonne more for increases in miners’ salaries and benefits, (ii) higher labour costs of approximately $3.70 per tonne due to an increased number of employees and employee pay raises, and (iii) the impact of US dollar depreciation versus the Chinese RMB of $2.30 per tonne. The increase of non-cash mining costs was a result of a higher asset base subject to depletion.
In fiscal 2012, the Company incurred $4.7 million (FY 2011 - $3.9 million) in exploration and development expenditures.
11
X Mines
Since acquisition of the X Mines in fiscal 2012, the Company has mined 3,890 tonnes of ore and processed 11,667 tonnes of existing stockpile ore to yield 5,800 ounces of silver, 100 ounces of gold, and 444,000 pounds of lead.
The Company plans to commence a comprehensive exploration program that includes surface and underground mapping and sampling, and surface and underground diamond drilling to explore the existing veins and discover additional new veins, with a goal of defining a NI 43-101 compliant mineral resource.
In fiscal 2012, the X Mines incurred approximately $2.1 million in exploration and mine development.
Henan Huawei
HPG and LM Mines
The HPG and LM mines are located in Henan Province, China. Silvercorp acquired the HPG and LM mines in 2007.
In fiscal 2012, the total ore mined was 93,466 tonnes, of which 182 tonnes were direct smelting ore, an increase of 27% compared to total ore production of 73,390 tonnes in fiscal 2011.
In fiscal 2012, HPG and LM mines produced 635,000 ounces of silver, 7.0 million pounds of lead and 591,000 pounds of zinc, an increase of 62%, 12% and 9%, respectively, compared to 391,000 ounces of silver, 6.2 million pounds of lead and 544,000 pounds of zinc produced in fiscal 2011.
The increases are attributable to higher grades and higher ore production. In fiscal 2012, silver head grade increased to 227 g/t from 185 g/t a year ago. In addition, in fiscal 2012, ore processed increased by 25% to 93,396 tonnes from 74,478 tonnes a year ago.
In fiscal 2012, total mining costs per tonne and cash mining costs per tonne were $75.81 (FY 2011 - $63.98) and $63.77 (FY 2011 - $55.67), respectively. The increase of cash mining costs was mainly due to (i) higher mining contractor costs as the mine paid approximately $4.20 per tonne more for raises in miners’ salary and benefits, (ii) higher labour costs of approximately $3.50 per tonne due to the increased number of employees and employee pay raises, and (iii) the impact of US dollar depreciation versus the Chinese RMB of $3.00 per tonne. The increase of non-cash mining costs was a result of a higher asset base subject to depletion.
In fiscal 2012, the Company completed 339 m of a 4,800 m access ramp with dimensions of 4 m by 4.5 m at the southwest corner of the TLP Mining Permit, adjacent to the LM Mining Permit, from about 980 m elevation to 500 m elevation. The access ramp will provide access to newly-discovered mineralized veins at the LM mine. Currently, the Company is producing approximately 60,000 tonnes per year from the LM mine. Once the access ramp is completed in two and half years, the mining capacity is expected to increase to approximately 200,000 tonnes per year.
In fiscal 2012, HPG and LM mines incurred $8.5 million (FY 2011 – $4.4 million) in exploration and development expenditures.
12
Guangdong Found
GC Project
The Company acquired the GC Project in 2008. In December 2010, the GC Project received its mining permit. Since then, the Company has been in the project development phase.
As of March 31, 2012, 717 m of the 2,210 m main access ramp, 42 m of the 618 m main shaft and 400 m of a water diversion tunnel were completed. In addition, GC Project also began to develop a new 3.7 m by 4 m, 4,500 m long exploration ramp.
The construction of a 1,600 t/d floatation mill capable of producing silver, lead, zinc, and pyrite floatation concentrates and an optional tin gravity concentrate is underway. Milling equipment was sourced and the final purchase contract was signed. In accordance with plans, the mill should be completed by July 2012 with an estimated cost of approximately RMB 100 million, or US$17 million. The Company is using the same mill contractor for GC as for the two mills at the Ying Mining District.
In fiscal 2012, the drilling program discovered four new high-grade silver, lead, zinc veins and a number of vein structures and isolated mineralized pockets, increasing the total number of mineralized veins at the GC property to 33 veins. The program also successfully extended the existing veins further to down dip and striking directions.
In fiscal 2012, GC incurred approximately $5.9 million (FY 2011 - $0.7 million) in capital expenditures for mine development and exploration.
Yunxiang
BYP Project
In January 2011, the Company completed the acquisition of a 70% equity interest in Xinshao Yunxiang Mining Co., Ltd., which owns a mining permit in the BYP Gold-Lead-Zinc mine in Hunan Province, China.
In fiscal 2012, the BYP mine mined 91,128 tonnes of ore, milled 83,760 tonnes, yielding 5,100 ounces of gold and 249,000 pounds of zinc. Total mining costs per tonne and cash mining costs per tonne were $38.00 and $16.79 respectively. Total and cash cost per ounce of gold was $843.60 and $473.93, respectively.
The Company will continue to utilize the existing 500 t/d floatation mill to mine and process gold mineralization. Construction of an 800 t/d backfill facility to fill up gold mineralization stopes is underway, which will cost approximately $1.5 million and will be completed in July 2012. In fiscal 2012, the Company also started to sink a 180 m deep, 3.5 m diameter shaft from 380 m to 200 m elevations. The shaft will mainly be utilized to mine the #3 gold mineralization body. The cost of the shaft is approximately $1.0 million and is expected to be completed in October 2012.
In fiscal 2012, the BYP mine incurred approximately $4.0 million in exploration and mine development.
0875786 B.C. Ltd.
Silvertip Project
The Silvertip Project was acquired in February 2010. The Company is nearing completion of a Small Mine Permit application which will be submitted to the British Columbia Ministry of Energy and Mines.
13
In fiscal 2012, the Company conducted a drill program. Drilling intersected high grade lower zone mineralization to the north of the Silver Creek zone and indicates that more detailed work may outline additional resources.
In fiscal 2012, the Silvertip project incurred approximately $5.2 million in exploration expenditures (FY 2011 - $7.2 million).
3.4Other Matters
2011 Normal Course Issuer Bid
On June 17, 2011, the Company commenced a normal course issuer bid (the “NCIB”) whereby it intended to acquire up to 10,000,000 of its common shares, being approximately 6% of the common shares then outstanding. Up to March 31, 2012 the Company acquired 4,468,012 common shares at an average cost of $7.90 per share through the combined facilities of the TSX and NYSE. All common shares purchased under the NCIB were cancelled.
Financings
On December 14, 2010, the Company closed a bought deal financing of 9,200,000 common shares at a price of $12.70 per common share, for gross proceeds of $116.8 million to a syndicate of underwriters led by CIBC World Markets and BMO Capital Markets.
ITEM 4 DESCRIPTION OF THE BUSINESS
4.1General
Silvercorp’s principal products and source of sales are silver-bearing lead and zinc concentrates and direct smelting ores. In fiscal 2012, the Ying Mine accounted for 70% of Silvercorp’s production of silver. At present, Silvercorp sells all its products to local smelters or companies in the mineral products trading business.
For each of the Company’s two most recently completed financial years, revenues for each category of products that accounted for 10% or more of total consolidated revenues for the applicable financial year are as follows:
| | | | |
| | Years ended March 31 | |
| In 000s’US$ | 2012 | | 2011 | |
| Silver (Ag) | 156,085 | | 95,834 | |
| Lead (Pb) | 61,526 | | 57,623 | |
Additional information is provided in the Company’s most recent financial statements and the management’s discussion and analysis for its most recently completed fiscal year.
The mining industry is intensely competitive and Silvercorp competes with many companies possessing similar or greater financial and technical resources. Silvercorp’s competitive position is largely dependent on its high profitability, arising from its relatively higher grade resource, particularly at the Ying Mine, and its low production costs in China compared to the costs of other producers outside China. Within China, the Company’s competitive advantage arises from the high grade nature of its concentrates and its proximity to local smelters.
14
During fiscal 2012, the Company revisited the reclamation costs for the existing mines and the timing to settle the reclamation liabilities as a result of new environmental regulations in China and the extension of mine lives due to the revised mining plan and updated reserves and resources at the existing mines. The remaining mine lives range from 8 to 23 years, and the cash outflow is expected to occur each year until the reclamation work is completed instead of at the end of the mine lives as estimated in previous years. Although the ultimate reclamation costs to be incurred for the existing mines are uncertain, the Company has increased the estimated undiscounted future value of these costs to $5.3 million as at March 31, 2012.
For the year ended March 31, 2012, Silvercorp had on average over 1,400 employees and approximately 2,900 contractors. The majority of the employees and contractors were working in the Ying Mining District.
2013 Outlook
Production in China
From the four mines at the Ying Mining District, production is expected to increase to 695,000 tonnes of ore at a grade of 295g/t silver, 0.5g/t gold, 5.1% lead and 1.5% zinc, yielding 5.9 million ounces of silver, 3,350 ounces of gold, and 87 million pounds of lead and zinc. The cash and total production costs are expected to be approximately $68 and $85 per tonne of ore.
The GC Project in Guangdong Province is expected to commence initial production in fiscal 2013. It is expected to mine 160,000 tonnes and to mill 153,000 tonnes of ore, yielding approximately 630,000 ounces of silver and 12 million pounds of lead and zinc. The cash and total production costs are expected to be approximately $40 and $65 per tonne of ore, respectively.
The BYP Project in Hunan Province is expected to mine and mill 175,000 tonnes of ore, yielding approximately 13,590 ounces of gold at cash and total production costs of $35 and $60 per tonne of ore, respectively.
At the newly-acquired X Mines, the Company will focus on exploration during fiscal 2013, with only a minimal amount of by-product ore expected to be produced.
Capital Expenditures Budget
The total capital expenditures for fiscal 2013 is estimated at $79.9 million for mine development, mill construction, and other capital items (e.g. surface infrastructures and facilities, land use rights, reporting and permitting), plus exploration expenditures of $9.8 million to complete a 206,000 m surface and underground drilling program, for a total of $89.7 million. The budget estimate is based on contracts on hand, designs by qualified Chinese engineering firms, and the Company’s past operating experience in China.
Ying Mining District
The capital expenditures for the Ying, TLP, LM and HPG mines and central mills for fiscal 2013 are budgeted at $46.6 million, including 4,900 m ramps ($4.8 million), 4,500 m vertical shafts, declines, and raises ($5.7 million), 100,000 m of horizontal tunnels ($19.3 million), mill equipment, tailing and surface facilities ($11.2 million), and 144,200 m surface and underground drilling program ($5.6 million).
15
GC Project
The capital expenditures for the GC Project for fiscal 2013 are budgeted at $32.2 million, of which $12.8 million is for mine development, $17.5 million is for mill and infrastructure and $1.9 million is for a 26,400 m underground drilling program. A substantial portion of GC mine’s operation will be built in fiscal 2013, including 1500 m ramp ($1.7 million), 800 m vertical shafts ($3.0 million), 9,400 m horizontal tunnels ($6.3 million), 1,600 t/d mill ($7.7 million), land use rights ($3.5 million), and power grid, office, labs and other surface facilities ($8.1 million).
BYP Project
The capital expenditures for the BYP Project for fiscal 2013 are budgeted at $3.4 million, including 180 m shaft ($0.6 million), 3,400 m horizontal tunnels ($1.4 million), backfilling facility ($0.8 million), surface facilities ($0.4 million), and 1,800 m surface drilling program ($0.2 million).
X Mines
During the fiscal 2013, the Company’s focus on these two newly-acquired projects will be a 33,600 m surface and underground drilling program, budgeted at approximately $2.1 million. In addition, $3.9 million of capital expenditures is budgeted for mine development, exploration tunneling and upgrading existing mills. The Company is also planning to prepare an initial NI 43-101 resource report for the properties during fiscal 2013.
Silvertip Project
The Company has budgeted $1.5 million to complete and submit an application for a Small Mine Permit.
In addition to the aggressive exploration program carried out by the Company to grow the resources and reserves in its operating projects, Silvercorp continually seeks acquisition opportunities in China and other jurisdictions.
Growth by Exploration and Acquisition
Silvercorp continues to pursue future growth opportunities by carrying out aggressive exploration programs within existing exploration and mining permit areas at its projects. In addition, the Company continues to pursue in China and other jurisdictions future growth opportunities by evaluating the acquisition of exploration, development or production assets or the acquisition of or merger with other entities. The Company often engages in discussions with respect to such possible opportunities. At any time, discussions and activities can be in progress on a number of initiatives, each at different stages of development. Although the Company may from time to time be a party to a number of letters of intent in respect to certain opportunities and other acquisitions, the Company currently does not have any binding agreements or binding commitments to enter into any such transactions. There is no assurance that any potential transaction will be successfully completed.
4.2Chinese Mining Law
Currently, all of the Company’s producing properties are located in China. Under the laws of China, mineral resources are owned by the State, and in the past, it has been state-owned enterprises which have been the principal force in the development of mineral resources. A new Mineral Resources Law became effective on January 1, 1997, and three regulations were promulgated on February 12, 1998. The new law provides for equal legal status for domestic enterprises and enterprises with foreign investment, security
16
and transferability of mineral titles as well as the exclusivity of mining rights. The right to explore and exploit minerals is granted by way of exploration and mining rights. The holder of an exploration right has the privileged priority to obtain the mining right to the mineral resources in the exploration area provided the holder meets the conditions and requirements specified in the law. The Company’s interests in mineral properties are held though joint venture companies established under and governed by the laws of China. The Company’s joint venture partners in China include state-sector entities and, like other state-sector entities, their actions and priorities may be dictated by government policies instead of purely commercial considerations.
Additionally, companies with a foreign ownership component operating in China may be required to work within a framework which is different from that imposed on domestic Chinese companies. The Chinese government currently allows foreign investment in certain mining projects under central government guidelines.
4.3Risk Factors
An investment in the common shares of the Company involves a significant degree of risk and ought to be considered a highly speculative investment. The following risk factors, as well as risks not currently known to the Company, could materially adversely affect the Company’s future business, operations and financial condition and could cause them to differ materially from the estimates described in the forward-looking statements and information relating to the Company.
Fluctuating commodity prices
The Company’s sales price for lead and zinc pounds is fixed against the Shanghai Metals Exchange as quoted at www.shmet.com, while gold ounces are fixed against the Shanghai Gold Exchange as quoted at www.sge.com.cn and silver ounces are fixed against the Shanghai White Platinum & Silver Exchange as quoted at www.ex-silver.com. These metal prices traditionally move in tandem with and at marginally higher prices than those quoted on the North American and European market places.
The Company’s revenues, if any, are expected to be in large part derived from the mining and sale of silver, lead, zinc, and gold contained in metal concentrates. The prices of those commodities has fluctuated widely, particularly in recent years, and are affected by numerous factors beyond the Company’s control including international and regional economic and political conditions, expectations of inflation; currency exchange fluctuations; interest rates; global or regional supply and demand for jewellery and industrial products containing silver and other metals; sale of silver and other metals by central banks and other holders, speculators and producers of silver and other metals; availability and costs of metal substitutes; and increased production due to new mine developments and improved mining and production methods. The price of base and precious metals may have a significant influence on the market price of the Company’s shares and the value of the properties. The effect of these factors on the price of base and precious metals, and therefore the viability of the Company’s exploration projects, cannot be accurately predicted.
If silver and other metals prices were to decline significantly or for an extended period of time, the Company may be unable to continue operations, develop the properties or fulfil obligations under agreements with the Company’s joint venture partners or under its permits or licenses.
Estimation of mineral resources, reserves and mineralization and metal recovery
There is a degree of uncertainty attributable to the estimation of mineral resources, reserves and mineralization and corresponding grades being mined or dedicated to future production. Until resources, reserves or mineralization are actually mined and processed, quantity of mineralization and grades must be considered as estimates only. In addition, the quantity of resources, reserves and mineralization may
17
vary depending on metal prices. Any material change in quantity of resources, mineralization, or grade may affect the economic viability of the Company’s properties. In addition, there can be no assurance that precious or other metal recoveries in small-scale laboratory tests will be duplicated in larger scale tests under on-site conditions or during production.
Interpretations and assumptions of mineral resource and mineral reserve estimates
Unless otherwise indicated, mineral resource and mineral reserve estimates presented in this AIF and in the Company’s other filings with securities regulatory authorities, press releases and other public statements that may be made from time to time are based upon estimates made by Company personnel and independent geologists/mining engineers. These estimates are imprecise and depend upon geologic interpretation and statistical inferences drawn from drilling and sampling analysis, which may prove to be unreliable. The mineral resource and mineral reserve estimates contained in this AIF have been determined based on assumed future prices, cut-off grades and operating costs that may prove to be inaccurate. There can be no assurance that:
these estimates will be accurate;
mineral reserve, resource or other mineralization figures will be accurate; or
the mineralization could be mined or processed profitably.
The interpretation of drill results, the geology, grade and continuity of the Company’s mineral deposits contains inherent uncertainty. Any material reductions in estimates of mineralization, or of the Company’s ability to extract this mineralization, could have a material adverse effect on its results of operations or financial condition.
Exploration and development programs
The long-term operation of the Company’s business and its profitability is dependent, in part, on the cost and success of its exploration and development programs. Mineral exploration and development involve a high degree of risk and few properties that are explored are ultimately developed into producing mines. There can be no assurance that the Company’s mineral exploration and development programs will result in any discoveries of bodies of commercial mineralization. There can also be no assurance that even if commercial quantities of mineralization are discovered that a mineral property will be brought into commercial production.
Development of the Company’s mineral properties will follow only upon obtaining satisfactory exploration results. Discovery of mineral deposits is dependent upon a number of factors, not the least of which is the technical skill of the exploration personnel involved. The commercial viability of a mineral deposit once discovered is also dependent upon a number of factors, some of which are the particular attributes of the deposit (such as size, grade and proximity to infrastructure), metal prices and government regulations, including regulations relating to royalties, allowable production, importing and exporting of minerals, and environmental protection. Most of the above factors are beyond the control of the Company. As a result, there can be no assurance that the Company’s exploration and development programs will yield reserves to replace or expand current resources. Unsuccessful exploration or development programs could have a material adverse impact on the Company’s operations and profitability.
18
Feasibility and engineering reports
There is a potential for delays in exploration or the completion of feasibility studies that may adversely impact the Company. The Company has received mining permits from the Department of Land and Resources of Henan Province and has commenced mining operations in the Ying Mining District in accordance with the mining permits. While the Company is preparing a feasibility study on the GC Project, to date, the Company has not completed a formal feasibility study of any of its material properties in China, which might otherwise be prepared for a mineral property located in North America.
Permits and licenses
All mineral resources and mineral reserves of the Company are owned by their respective governments, and mineral exploration and mining activities may only be conducted by entities that have obtained or renewed exploration or mining permits and licenses in accordance with the relevant mining laws and regulations. No guarantee can be given that the necessary exploration and mining permits and licenses will be issued to the Company or, if they are issued, that they will be renewed or that the Company will be in a position to comply with all conditions that are imposed.
Nearly all mining projects require government approval. There can be no certainty that approvals necessary to develop and operate mines on the Company’s properties will be granted to the Company in a timely manner, or at all.
Title to properties
While the Company has investigated title to all of its mineral claims and to the best of its knowledge, title to all of its properties is in good standing, the properties may be subject to prior unregistered agreements or transfers and title may be affected by undetected defects. There may be valid challenges to the title of the Company’s properties which, if successful, could impair development and/or operations. The Company cannot give any assurance that title to its properties will not be challenged. Title insurance is generally not available for mineral properties and the Company’s ability to ensure that it has obtained secure claim to individual mineral properties or mining concessions may be severely constrained. The Company’s mineral properties in China have not been surveyed, and the precise location and extent thereof may be in doubt.
First Nations title claims and rights
Governments in many jurisdictions must consult with multiple First Nations and other aboriginal peoples with respect to grants of mineral rights and the issuance or amendment of project authorizations. Consultation and other rights of aboriginal people may require accommodations, including undertakings regarding employment, contracting, profit sharing, and other matters in impact and benefit agreements. This may affect our ability, the timing and costs of developing the Silvertip Project. The risk of unforeseen First Nations title claims also could affect future operations, development projects and future acquisitions. In particular, there can be no guarantee that the unsettled nature of land claims in British Columbia will not create delays in project approval or unexpected interruptions in project progress, or result in additional costs to advance the Silvertip Project. These requirements may affect our ability to expand or transfer existing operations or to develop existing or new projects.
Property interests
The agreements pursuant to which the Company holds its rights in certain of the properties provide that the Company must make a series of cash payments over certain time periods or make certain minimum exploration expenditures. If the Company fails to make such payments or expenditures in a timely manner, the Company may lose interest in those projects.
19
Joint venture partners
The Company’s interests in various properties may, in certain circumstances, pursuant to option agreements currently in place, become subject to the risks normally associated with the conduct of joint ventures. The existence or occurrence of one or more of the following circumstances and events could have a material adverse impact on the Company’s profitability or the viability of its interests held through joint ventures, which could have a material adverse impact on the Company’s business prospects, results of operations and financial conditions: (i) disagreements with joint venture partners on how to conduct exploration; (ii) inability of joint venture partners to meet their obligations to the joint venture or third parties; and (iii) disputes or litigation between joint venture partners regarding budgets, development activities, reporting requirements and other joint venture matters.
Acquisition of commercially mineable mineral rights
Most exploration projects do not result in the discovery of commercially mineable ore deposits and no assurance can be given that any particular level of recovery of mineral reserves will be realized or that any identified mineral deposit will ever qualify as a commercially mineable (or viable) ore body which can be legally and economically exploited.
The Company’s future growth and productivity will depend, in part, on its ability to identify and acquire additional mineral rights, and on the costs and results of continued exploration and development programs. Mineral exploration is highly speculative in nature and is frequently non-productive. Substantial expenditures are required to:
establish mineral reserves through drilling and metallurgical and other testing techniques;
determine metal content and metallurgical recovery processes to extract metal from the ore; and
construct, renovate or expand mining and processing facilities.
In addition, if the Company discovers a mineral deposit, it would take several years from the initial phases of exploration until production is possible. During this time, the economic feasibility of production may change.
The Company’s success at completing any acquisitions will depend on a number of factors, including, but not limited to:
identifying acquisitions that fit the Company’s business strategy;
negotiating acceptable terms with the seller of the business or property to be acquired; and
obtaining approval from regulatory authorities in the jurisdictions of the business or property to be acquired.
As a result of these uncertainties, there can be no assurance that the Company will successfully acquire additional mineral rights.
Financing
The Company has limited financial resources. If the Company’s exploration programs are successful in establishing ore of commercial tonnage and grade, additional funds will be required for the development of the ore body and to place it in commercial production. Therefore, the Company’s ability to continue its
20
exploration and development activities, if any, will depend in part on the Company’s ability to obtain suitable financing.
The Company intends to fund its plan of operations from working capital, proceeds of production, external financing, strategic alliances, sale of property interests and other financing alternatives. The sources of external financing that the Company may use for these purposes include project or bank financing, or public or private offerings of equity or debt. One source of future funds presently available to the Company is through the sale of equity capital. There is no assurance this source of financing will continue to be available, as required or at all. If it is available, future equity financings may result in substantial dilution to shareholders. Another alternative for the financing of further exploration would be the offering by the Company of an interest in the properties to be earned by another party or parties carrying out further exploration or development thereof. There can be no assurance the Company will be able to conclude any such agreements, on favourable terms or at all. The failure to obtain financing could have a material adverse effect on the Company’s growth strategy and results of operations and financial condition.
Recent market events and condition
Over the past several years market events and conditions, including disruptions in the Canadian, United States and international credit markets and other financial systems, along with the uncertainty of the Canadian, United States and global economic conditions, could, among other things, impede access to capital or increase the cost of capital, which would have an adverse effect on the Company’s ability to fund its working capital and other capital requirements.
Over the past several years, worldwide securities markets, particularly those in the United States and Canada, have experienced a high level of price and volume volatility, and the market price of securities of many companies, particularly those considered exploration- or development-stage companies, have experienced unprecedented declines in price which have not necessarily been related to the operating performance, underlying asset values or prospects of such companies. Most significantly, the share prices of natural resource companies have in the past experienced an extraordinary decline in value and in the number of buyers willing to purchase such securities. In addition, significantly higher redemptions by holders of mutual funds has forced many of such funds (including those holding the Company’s securities) to sell such securities at any price.
Therefore, there can be no assurance that significant fluctuations in the trading price of the Company’s common shares will not occur, or that such fluctuations will not materially adversely impact on the Company’s ability to raise equity funding without significant dilution to its existing shareholders, or at all.
Economic factors affecting the Company
The recent unprecedented events in global financial markets have had a profound impact on the global economy. Many industries, including the mining industry, are impacted by these market conditions. Some of the key impacts of the current financial market turmoil include contraction in credit markets resulting in a widening of credit risk, devaluations and high volatility in global equity, commodity, foreign exchange and precious metal markets, and a lack of market liquidity. A continued or worsened slowdown in the financial markets or other economic conditions, including but not limited to, consumer spending, employment rates, business conditions, inflation, fuel and energy costs, consumer debt levels, lack of available credit, the state of the financial markets, interest rates, and tax rates may adversely affect the Company’s growth and profitability. Specifically:
the volatility of silver, lead and zinc prices would impact the Company’s revenues, profits, losses and cash flow;
21
volatile energy prices, commodity and consumables prices and currency exchange rates would impact the Company’s production costs; and
the devaluation and volatility of global stock markets would impact the valuation of the Company’s equity and other securities.
These factors could have a material adverse effect on the Company’s financial condition and results of operations.
Timing, estimated amount, capital and operating expenditures and economic returns of future production
There are no assurances if and when a particular mineral property of the Company can enter into production. The amount of future production is based on the estimates prepared by or for the Company. The capital and operating costs to take the Company’s projects into production may be significantly higher than anticipated. Capital and operating costs of production and economic returns are based on estimates prepared by or for the Company may differ significantly from their actual values. There can be no assurance that the Company’s actual capital and operating costs will not be higher than currently anticipated.
In addition, the construction and development of mines and infrastructure are complex. Resources invested in construction and development may yield outcomes that may differ significantly from those anticipated by the Company.
Integration of future acquisitions into existing operations
The Company acquired the XBG and XHP mines in 2012 and may make selected acquisitions in the future. If the Company does make further acquisitions, any positive effect on the Company’s results will depend on a variety of factors, including, but not limited to:
integrating the operations of an acquired business or property in a timely and efficient manner;
maintaining the Company’s financial and strategic focus while integrating the acquired business or property;
implementing uniform standards, controls, procedures and policies at the acquired business, as appropriate; and
to the extent that the Company makes an acquisition outside of markets in which it has previously operated, conducting and managing operations in a new operating environment.
Acquiring additional businesses or properties could place pressure on the Company’s cash flow if such acquisitions involve cash consideration or existing shareholders may experience dilution if such acquisitions involve share consideration.
The integration of the Company’s existing operations with any acquired business will require significant expenditures of time, attention and funds. Achievement of the benefits expected from consolidation would require the Company to incur significant costs in connection with, among other things, implementing financial and planning systems. The Company may not be able to integrate the operations of a recently acquired business or restructure the Company’s previously existing business operations without encountering difficulties and delays. In addition, this integration may require significant attention
22
from the Company’s management team, which may detract attention from the Company’s day-to-day operations.
Over the short-term, difficulties associated with integration could have a material adverse effect on the Company’s business, operating results, financial condition and the price of the Company’s common shares. In addition, the acquisition of mineral properties may subject the Company to unforeseen liabilities, including environmental liabilities, which could have a material adverse effect on the Company. There can be no assurance that any future acquisitions will be successfully integrated into the Company’s existing operations.
Competition
The mining industry in general is intensely competitive and there is no assurance that, even if commercial quantities of ore are discovered, a ready market will exist for the sale of such ore, or concentrate, by the Company. Marketability of natural resources which may be discovered by the Company will be affected by numerous factors beyond the control of the Company, such as market fluctuations, the proximity and capacity of natural resource markets and processing equipment, government regulations including regulations relating to prices, royalties, land tenure, land use, importing and exporting of minerals and environmental protection. The exact effect of such factors cannot be predicted but they may result in the Company not receiving an adequate return on its capital.
The Company may be at a competitive disadvantage in acquiring additional mining properties because it must compete with other individuals and companies, many of which have greater financial resources, operational experience and technical capabilities than the Company. The Company may also encounter increasing competition from other mining companies in its efforts to hire experienced mining professionals. Competition for exploration resources at all levels is currently very intense, particularly affecting the availability of manpower and drill rigs. Increased competition could adversely affect the Company’s ability to attract necessary capital funding or acquire suitable producing properties or prospects for mineral exploration in the future.
Operations and political conditions
The majority of the properties in which the Company has an interest are located in China, which has different regulatory and legal standards than those in North America. Even if the Company’s mineral properties are proven to host economic reserves of metals, factors such as political instability, terrorism, opposition and harassment from local miners, or governmental expropriation or regulation may prevent or restrict mining of any such deposits or repatriation of profits.
The majority of the Company’s operations are located in China. These operations are subject to the risks normally associated with conducting business in China. Some of these risks are more prevalent in countries which are less developed or have emerging economies, including uncertain political and economic environments, as well as risks of war and civil disturbances or other risks which may limit or disrupt a project, restrict the movement of funds or result in the deprivation of contract rights or the taking of property by nationalization or expropriation without fair compensation, risk of adverse changes in laws or policies, increases in foreign taxation or royalty obligations, delays in obtaining or the inability to obtain necessary governmental permits, limitations on ownership and repatriation of earnings, and foreign exchange controls and currency devaluations.
In addition, the Company may face import and export regulations, including export restrictions, disadvantages of competing against companies from countries that are not subject to similar laws, restrictions on the ability to pay dividends offshore, and risk of loss due to disease and other potential endemic health issues. Although the Company is not currently experiencing any significant or
23
extraordinary problems in China arising from such risks, there can be no assurance that such problems will not arise in the future. The Company currently does not carry political risk in insurance coverage.
The Company’s interests in its mineral properties are held through joint venture companies established under and governed by the laws of China. The Company’s joint venture partners in China include state-sector entities and, like other state-sector entities, their actions and priorities may be dictated by government policies instead of purely commercial considerations. Additionally, companies with a foreign ownership component operating in China may be required to work within a framework which is different from that imposed on domestic Chinese companies. The Chinese government currently allows foreign investment in certain mining projects under central government guidelines. There can be no assurance that these guidelines will not change in the future.
Regulatory environment in China and Canada
The Company conducts operations primarily in China and is developing the Silvertip Project in northern British Columbia, Canada. The laws of China differ significantly from those of Canada and all such laws are subject to change. Mining operations, development and exploration activities are subject to extensive laws and regulations governing prospecting, development, production, exports, taxes, labour standards, occupational health, waste disposal, environmental protection, mine safety, consultation with First Nations in Canada and other matters. Mining is subject to potential risks and liabilities associated with pollution of the environment and disposal of waste products occurring as a result of mineral exploration and production.
Failure to comply with applicable laws and regulations may result in enforcement actions there under and may include corrective measures requiring capital expenditures, installation of additional equipment or remedial actions. Parties engaged in mining operations may be required to compensate those suffering loss or damage by reason of mining activities and may have civil or criminal fines or penalties imposed for violations of applicable laws and regulations.
New laws and regulations, amendments to existing laws and regulations, administrative interpretation of existing laws and regulations, or more stringent enforcement of existing laws and regulations could have a material adverse impact on future cash flow, results of operations and the financial condition of the Company.
Further, all phases of the Company’s operations are subject to environmental regulations in the various jurisdictions in which it operates. Environmental legislation is evolving in a manner which will require stricter standards and enforcement, increased fines and penalties for non-compliance, more stringent environment assessments of proposed projects and a heightened degree of responsibility for companies and their officers, directors and employees. There is no assurance that future changes in environmental regulations, if any, will not adversely affect the Company’s operations.
Environmental risks
The Company’s activities are subject to extensive laws and regulations governing environmental protection and employee health and safety, including environmental laws and regulations in China. These laws address emissions into the air, discharges into water, management of waste, management of hazardous substances, protection of natural resources, antiquities and endangered species, and reclamation of lands disturbed by mining operations. There are also laws and regulations prescribing reclamation activities on some mining properties. Environmental legislation in many countries is evolving and the trend has been toward stricter standards and enforcement, increased fines and penalties for non-compliance, more stringent environmental assessments of proposed projects and increasing responsibility for companies and their officers, directors and employees. Compliance with environmental laws and regulations may require significant capital outlays on behalf of the Company and may cause material
24
changes or delays in the Company’s intended activities. There can be no assurance that the Company has been or will be at all times in complete compliance with current and future environmental and health and safety laws and permits will not materially adversely affect the Company’s business, results of operations or financial condition. It is possible that future changes in these laws or regulations could have a significant adverse impact on some portion of the Company’s business, causing the Company to re-evaluate those activities at that time. The Company’s compliance with environmental laws and regulations entail uncertain costs.
Foreign exchange rate fluctuations
In the past, the Company has raised its equity and maintained its accounts in Canadian dollars but now reports in US dollars. Going forward, operations carried out in non-US currency, including the Canadian dollar or the Chinese Renminbi, could subject the Company to foreign currency fluctuations that may materially and adversely affect the Company’s financial position.
Insurance
The Company’s mining activities are subject to the risks normally inherent in the industry, including, but not limited, to environmental hazards, flooding, fire, periodic or seasonal hazardous climate and weather conditions, unexpected rock formation, industrial accidents and metallurgical and other processing problems. These risks could result in damage to, or destruction of, mineral properties, production facilities or other properties; personal injury; environmental damage; delays in mining; increased production costs; monetary losses; and possible legal liability. The Company may become subject to liability which it cannot insure or against which it may elect not to insure due to high premium costs or other reasons. Where considered practical to do so the Company maintains insurance against risks in the operation of its business in amounts which the Company believes to be reasonable. Such insurance, however, contains exclusions and limitations on coverage. The Company cannot provide any assurance that such insurance will continue to be available, will be available at economically acceptable premiums or will be adequate to cover any resulting liability. In some cases, coverage is not available or considered too expensive relative to the perceived risk.
Risks and hazards of mining operations
Mining is inherently dangerous and the Company’s operations are subject to a number of risks and hazards including, without limitation:
environmental hazards;
discharge of pollutants or hazardous chemicals;
industrial accidents;
failure of processing and mining equipment;
labour disputes;
supply problems and delays;
encountering unusual or unexpected geologic formations or other geological or grade problems;
encountering unanticipated ground or water conditions;
cave-ins, pit wall failures, flooding, rock bursts and fire;
25
periodic interruptions due to inclement or hazardous weather conditions;
equipment breakdown;
other unanticipated difficulties with or interruptions in development, construction or production; and
other acts of God or unfavourable operating conditions.
Such risks could result in damage to, or destruction of, mineral properties or processing facilities, personal injury or death, loss of key employees, environmental damage, delays in mining, monetary losses and possible legal liability. Satisfying such liabilities may be very costly and could have a material adverse effect on the Company’s future cash flow, results of operations and financial condition.
Dependence on management and key personnel
The executive directors and the China operational management team all have extensive experience in the mineral resources industry in China. Most of the non-executive directors also have extensive experience in mining and/or exploration (or as advisors to companies in the field). The Company’s success depends to a significant extent upon its ability to retain, attract and train key management personnel, both in Canada and in China.
The Company depends on the services of a number of key personnel, including its directors and executive officers, the loss of any one of whom could have an adverse effect on the Company’s operations.
The Company’s ability to manage growth effectively will require it to continue to implement and improve management systems and to recruit and train new employees. The Company cannot be assured that it will be successful in attracting and retraining skilled and experienced personnel.
Conflicts of interest
Conflicts of interest may arise as a result of the directors, officers and promoters of the Company also holding positions as directors and/or officers of other companies. Some of those persons who are directors and officers of the Company have and will continue to be engaged in the identification and evaluation of assets and businesses and companies on their own behalf and on behalf of other companies, and situations may arise where the directors and officers may be in direct competition with the Company. Conflicts, if any, will be subject to the procedures and remedies under theBusiness Corporations Act(British Columbia).
Internal control over financial reporting as per the requirements of the Sarbanes-Oxley Act
Management of the Company is responsible for establishing and maintaining an adequate system of internal control over financial reporting, and used the framework issued by the Committee of Sponsoring Organizations of the Treadway Commission (COSO) to evaluate the effectiveness of internal controls in fiscal year 2012. Based on this evaluation, management concluded that our internal control over financial reporting was effective as at March 31, 2012 and provided a reasonable assurance of the reliability of our financial reporting and preparation of the financial statements.
The Company's consolidated audited financial statements for fiscal 2012 included an unqualified report of its independent auditors that the Company had maintained effective internal control over financial reporting as at March 31, 2012. Nonetheless the Company may in the future fail to achieve and maintain the adequacy of its internal control over financial reporting, as such standards are modified, supplemented or amended from time to time, and the Company may not be able to ensure that it can conclude on an ongoing basis that it has effective internal controls over financial reporting in accordance with Section
26
404 of Sarbanes-Oxley Act ("SOX"). The Company’s failure to satisfy the requirements of Section 404 of SOX on an ongoing, timely basis could result in the loss of investor confidence in the reliability of its financial statements, which in turn could harm the Company’s business and negatively impact the trading price of its common shares. In addition, any failure to implement required new or improved controls, or difficulties encountered in their implementation, could harm the Company’s operating results or cause it to fail to meet its reporting obligations. Future acquisitions of companies may provide the Company with challenges in implementing the required processes, procedures and controls in its acquired operations. Acquired companies may not have disclosure control and procedures or internal control over financial reporting that are as thorough or effective as those required by securities laws currently applicable to the Company.
No evaluation can provide complete assurance that the Company’s internal control over financial reporting will detect or uncover all failures of persons within the Company to disclose material information otherwise required to be reported. The effectiveness of the Company’s control and procedures could also be limited by simple errors or faulty judgments. In addition, should the Company expand in the future, the challenges involved in implementing appropriate internal controls over financial reporting will increase and will require that the Company continue to improve its internal controls over financial reporting. Although the Company intends to devote substantial time and incur substantial costs, as necessary, to ensure compliance, the Company cannot be certain that it will be successful in complying with Section 404 on an ongoing basis.
Bringing actions and enforcing judgments under U.S. securities laws
Investors in the U.S. or in other jurisdictions outside of Canada may have difficulty bringing actions and enforcing judgments against the Company, its directors, its executive officers and some of the experts named in this AIF based on civil liabilities provisions of the federal securities laws, other laws in the state(s) in the U.S. or the equivalent laws of other jurisdictions of residence.
ITEM 5 MINERAL PROPERTIES
The Company has interests in mineral properties located in China and Canada. As at March 31, 2012, these properties were carried on the Company’s balance sheet as assets with a book value of approximately $258.5 million. The book value consists of acquisition costs plus cumulative expenditures on properties, net of amortization and impairment charges for which the Company has future exploration plans.
For the purposes of NI 43-101, the following properties have been determined to be material to the Company as of March 31, 2012:
| (a) | the Ying Mine, Ying Mining District, Henan Province, China; and |
| | |
| (b) | the GC Project, Guangdong Province, China. |
5.1 Ying Mine, Henan Province, China.
Except as otherwise stated, the information in this section is based on the technical report titled “Technical Report for Ying Gold-Silver-Lead-Zinc Property, Henan Province, China” (the“Ying Report”) dated May 1, 2012, and prepared by P. R. Stephenson, P.Geo, B. J. O’Connor, P.Geo, H. A. Smith, P.Eng, A. Riles, MAIG, and M. Molavi, P.Eng. of AMC Mining Consultants (Canada) Limited (“AMC”). Portions of the following information are based on the assumptions, qualifications and procedures which are not fully described herein. References should be made to the full text of the Ying Report which is available for review on SEDAR at www.sedar.com.
27
Project Description and Location
The Ying Property is situated in western Henan Province near the town of Luoning in central China. Silvercorp uses the term “Ying District” to describe a 100 sq. km size rectangular area bounded by latitude 34°07’N to 34°12’N and longitude 111°14’E to 111°23’E. Within this district block, Silvercorp has three principal operations comprised of five mining projects. The Ying Mine is covered by exploration and mining permits totalling approximately 58 sq. km.
Silvercorp, through wholly owned subsidiaries, has effective interests of 77.5% in the Ying (SGX) and TLP mines, and 80% in the HPG and LM mines. It has all the exploration and mining permits necessary to cover its mining and exploration activities. There are no known or recognized environmental problems that might preclude or inhibit a mining operation in this area.
Silver-lead-zinc mineralization in the Ying district has been known and intermittently mined for the last several hundred years. Silvercorp acquired an interest in the Ying / SGX mine in 2004, the HPG mine in 2006, and the TLP / LM mines in late 2007. Annual production has ramped up substantially in recent years, reaching 647,000t of ore in 2011.
Silvercorp has all the required permits for its operations on the Ying Property. The existing mining permits cover all the active mining areas and, in conjunction with safety and environmental certificates, give Silvercorp the right to carry out full mining and mineral processing operations. Five safety certificates and five environmental certificates have been issued by the relevant government departments, for each of which there is a related mine development/utilization and soil/water conservation program, and rehabilitation plan.The Ying Project is covered by exploration and mining permits totaling approximately 58 sq. km, as listed in the following Table 1.
Table 1 Exploration and Mining Permits, Ying Project
| | | |
| Permit type | Permit No. | Expiration Date | Sq. km |
| Mining | C4100002009093210038549
Yuelianggou (SGX) | September 2014[1] | 19.83 |
| Exploration | T01120090602030965
Ximiao-Leileisi Au project | June 6, 2012[2] | 12.34 |
| Exploration | T41120080102001028
Luoning County Sidaogou –
Lushi County Lijiagou Ag project | January 29, 2013[3] | 19.70 |
| Exploration | T41120080802013284
Dong Cao Gou Au project | October 1, 2010[4] | 6.39 |
| | Mining Permit total | 19.83 |
| Exploration Permit total | 38.43 |
| Total | 58.26 |
Notes:
| | 1) | Department of Land and Resources of Henan Province approved an application by Henan Found on September 30, 2009 for an integrated mining license to combine three Exploration Permits, namely Exploration Permit No. 4100000740232 (Qiaogoubei Ag Project), Exploration Permit No. 4100000640561 (Qiaogou Ag Project) and Exploration Permit No. 0100000520145 (Shagou Ag Project) with Mining Permit No. 4100000610045 (Yuelianggou Ag Project), to form one larger integrated mining area under one Mining Permit - No. C4100002009093210038549. It allows for mining of 198,000 tonnes/annum (tpa) from 1,060m to 0m. |
28
| 2) | Exploration License was issued to the Licensee by the Department of Land and Resources of Henan Province on January 29, 2011. The Licensee intends to apply for an extension in the Exploration Licence as expiry approaches. |
| | |
| 3) | Exploration License was issued to the Licensee by the Department of Land and Resources of Henan Province on May 18, 2010. |
| | | |
| 4) | The Exploration License is currently expired, but the Licensee received a valid approval letter for designating this as a mining area. The reserved term now extends until the end of October 2012. Key information in the approval letter includes mining from 1,020m to 680m and a planning production capacity of 30,000 tpa. |
Silvercorp has established an environmental protection department consisting of five full time staff, which is responsible for environment / rehabilitation management work in the mining area. Monitoring plans include air and dust emissions and noise and waste water monitoring, and are undertaken by qualified persons and licensed institutes. Results from 2007 to 2011 indicate that surface water, sanitary / process plant waste water and mining water are in compliance with the required standards.
Silvercorp’s production activities are in compliance with Chinese and international labour regulations. In accordance with Chinese national regulatory requirements Silvercorp will complete a site decommissioning plan at least one year before mine closure. Site rehabilitation and closure cost estimates will be made at that time.
China has an established Mining Code which defines the mining rights guaranteed by the government of China. China has a 17% Value Added Tax (“VAT”) on sales of concentrates and on articles such as materials and supplies. The 17% VAT paid on materials purchased for mining is returned to the company as an incentive to mine in China. There is no VAT on labor or services. According to China’s mining law, a 2% resources tax is payable by companies as a royalty to the government. Income tax rate is 25%. In addition the Company pays a VAT surtax which amounts to approximately 1.6% of sales. Other taxes such as Business, City Construction, and school taxes are exempted for foreign invested companies.
Accessibility, Climate, Local Resources, Infrastructure and Physiography
The district lies within rugged, deeply dissected mountainous terrain of the Xionger Mountain Range. Elevations range from 300 m to 1,200 m above sea level. Hill slopes are steep, commonly exceeding 25°, and have good bedrock exposure.
The area is sparsely vegetated, consisting mostly of bushes, shrubs, ferns and small trees. At higher elevations the vegetation is denser and the trees are larger. The local economy is based on agriculture (wheat, corn, tobacco, medicinal herbs) and mining. Agriculture is confined to the bottoms of the larger stream valleys and to the many terraced hillsides.
The Ying Property is about 240 km west-southwest of Zhengzhou (population 7.0 million), the capital city of Henan Province, and 145 km west of Luoyang (population 1.4 million), which is the nearest major city. Zhengzhou, the largest industrial city in the region, offers full service facilities and daily air flights to Beijing, the capital of China, as well as Shanghai and Hong Kong. The nearest small city to the project area is Luoning (population >80,000), about 56 km by paved roads from Silvercorp’s Ying mill site which is located centrally to the projects. The mill site is about 15 km by paved road from the Guxian Reservoir. The SGX exploration-development camp is accessed via a 10 minute ferry ride across the Reservoir. The HPG, TLP and LM mines have good road access.
The area has a continental sub-tropical climate with four distinct seasons. Temperature changes are dependent on elevation, with an annual range of -10°C to 38°C and annual average of 15°C. The annual precipitation averages 900 mm, occurring mostly in the July to September rainy season and supplemented by snow and frost occurring from November to March. The projects operate year round.
29
Silvercorp has sufficient surface rights to operate the projects. There are major power grids adjacent to the properties, including a power line extending to the SGX Area. Adjacent to the Ying Property is a hydropower generating station at the dam that forms the Guxian Reservoir. This reservoir is on the Luo River, a tributary of the Yellow River. Sufficient manpower is available to serve most exploration or mining operations. The steep valleys form natural reservoirs for mine tailings and waste dumps.
History
Silver-lead-zinc mineralization in the Ying district has been known and intermittently mined for the last several hundred years. The first systematic geological prospecting and exploration was initiated in 1956 by the Chinese government. Detailed summaries of the district’s historical activities from 1956 to 2004, when Silvercorp first acquired interests in the area, are described in seven previous NI 43-101 technical reports prepared for Silvercorp (Broili, 2004; Broili, 2005; Broili et al., 2006, 2008; Broili and Klohn, 2007; Xu et al., 2006; Broili, Klohn and Ni, 2010; and Klohn, Ni and Broili, 2011) available on SEDAR at www.sedar.com.
Silvercorp acquired an interest in the Ying / SGX Mine in 2004. Subsequently, Silvercorp acquired the HZG, HPG and LM mines, all of which were previously held and operated by private Chinese companies.
Geological Setting
The Ying Property is situated in the 300 km-long west-northwest trending Qinling orogenic belt, a major structural belt formed by the collision of two large continental tectonic plates in Paleozoic time.
The northern continental plate, the North China Plate, covers all of Henan Province, while the southern plate, the Yangtze Plate, covers the south half of Hubei Province (Henan’s southern neighbor). Rocks along the orogenic belt are severely folded and faulted, offering optimal structural conditions for the emplacement of a myriad of mineral deposits. Several operating silver-lead-zinc mines, including those in the Ying Property, occur along this belt.
The Qinling orogenic belt is comprised largely of Proterozoic- to Paleozoic-age rock sequences consisting of mafic to felsic volcanic rocks with variable amounts of interbedded clastic and carbonate sedimentary rocks. The rocks are weakly metamorphosed to lower greenschist facies, with local areas of strongly metamorphosed lower amphibolite facies. The basement of the belt is comprised of highly metamorphosed Archean-age rocks of the North China plate, dominantly felsic to mafic gneisses with minor amphibolites, intrusive gabbros and diabases. The metamorphosed Qinling belt sequence and the underlying Archean basement rocks are intruded by mafic to felsic dikes and stocks of Proterozoic and Mesozoic ages. They are overlain by non-metamorphosed sedimentary rock sequences of Mesozoic- to Cenozoic-age, primarily marls and carbonaceous argillites, which are in turn overlain locally by sandstone-conglomerate sequences.
The dominant structures in the Qinling orogenic belt are west-northwest trending folds and faults generated during the collision of the two major tectonic plates in Paleozoic time. The faults consist of numerous thrusts having a component of oblique movement with sets of conjugate shear structures trending either northwest or northeast. These conjugate shear zones, which display features of brittle fracturing such as fault gouge, brecciation and well-defined slickensides, are associated with all the important mineralization recognized along the 300 km-long orogenic belt.
Exploration
Silvercorp initiated exploration-development activities in the SGX area including HZG (immediately south of SGX), HPG (northeast of SGX) and LJG, an exploration area covered by the SDG-LJG exploration permit between the SGX-HZG mine area and the TLP-LM mine area, in July 2007, and in the
30
TLP-LM mine areas in December 2007. The past exploration activities, including surface activities, have been detailed in previous technical reports prepared for Ying Property projects (Broili et al., 2006; Xu, 2006; Broili et al., 2008; Broili and Klohn, 2007; Broili et al., 2008; Broili et al. 2010; Klohn et al. 2011).
Other than drilling, the projects have been explored primarily from underground workings. The workings follow the vein structures along strike, on levels spaced approximately 40 m apart. Silvercorp has found this method of underground exploration an effective and efficient way to define the geometry of the mineralized structures, in part due to the discontinuous character of the high-grade mineralization but also the relatively inexpensive development costs. Chip samples across the structures are collected at 5 m intervals. Assay results of samples are documented on underground level maps and longitudinal sections.
In 2011, Silvercorp conducted an exploration program with the objective of upgrading confidence in the Indicated and Inferred Resources, to test the down-dip extension of the major mineralized vein structures, and to explore new target areas in the Ying property. The 2011 exploration program comprised 40,827 m tunnelling, including 25,450 m of drifting tunnels driven along mineralized structures. A total of 10,730 channel/chip samples were collected from different mine areas.
Mineralization
The Ying Property contains multiple mesothermal silver-lead-zinc-rich quartz-carbonate veins in steeply-dipping fault-fissure zones which cut Precambrian gneiss and greenstone. To date, significant mineralization has been defined or developed in at least 131 discrete vein structures, and many other smaller veins have been found but not as yet well explored.
Structurally, the vein systems throughout the district are all somewhat similar in that they occur as sets of veins of generally similar orientation enclosed by fault-fissure zones which trend most commonly northeast-southwest, less commonly north-south, and rarely northwest-southeast. The structures extend for hundreds to a few thousand meters along strike. They are often filled by altered andesite or diabase dikes together with quartz-carbonate veins or as discrete zones of altered bedrock (mainly gneiss) associated with local selvages of quartz-carbonate veinlets. From one-third to one-half of the structures exposed at the surface are conspicuously mineralized as well as altered.
The vein systems consist of narrow, tabular or splayed veins, often occurring as sets of parallel and offset veins. The veins thin and thicken abruptly along the structures in classic “pinch-and-swell” fashion with widths varying from a few centimeters up to a few meters. “Swells” formed in structural dilatant zones along the veins are often sites of rich pockets of mineralization known as “ore shoots.” At the SGX mine, these shoots range from 30 m to more than 60 m in vertical and horizontal dimensions over true vein widths of 0.4 m to 3.0 m. The vertical dimension of the SGX shoots is commonly twice or more the horizontal dimension. Longitudinal sections constructed along the veins indicate that many of the shoots have a steep, non-vertical rake.
The vein systems of the various mine areas in the district are also generally similar in mineralogy, with slight differences between some of the separate mine areas and between the different vein systems within each area. These differences have been attributed to district-scale mineral zonation at different levels of exposure. This subtle zonation is thought to be perhaps analogous to the broad-scale zonation patterns observed in the Coeur d’Alene District (U.S.A.) and characteristic of many other significant mesothermal silver-lead-zinc camps in the world (Broili et al., 2008, Broili et al., 2010).
Drilling
Prior to Silvercorp obtaining the rights to the SGX mine in 2004, there was little drilling work completed on the Ying Property. Drilling programs conducted by previous operators include a 10,736 m surface drilling program in the TLP-LM area by the No. 6 Nonferrous Geological Exploration Team from 1991 to
31
1994 and a test drilling program of two holes in the SGX area by the Henan Nonferrous Geological Exploration Bureau in 2003. Since acquiring the projects, Silvercorp has initiated systematic drilling programs to test the strike and down-dip extensions of the major mineralized vein structures.
A major drilling program was conducted across the Ying Property in 2011. Underground drilling was carried out in mining areas to test the down-dip extension of major mineralized vein structures and infill the Inferred Resource blocks defined in previous drilling programs. Surface drilling was implemented in two exploration permit areas to test the deep exploration potential of some mineralized structures recognized at surface. Most of the underground holes were designed as inclined holes to test multiple vein structures. The general purpose of the drill program was to expand and upgrade the available resource in the major mining areas. The result of the underground drill program was the down-dip extension of some major mineralized veins and the discovery of a number of new high-grade veins in the current mine areas.
Sampling and Analysis
The numerous fault-fissure structures that cut the gneissic bedrock of the Ying Property are not continuously mineralized. Veins occur intermittently along these structures, appearing and disappearing along strike and dip. Silvercorp’s exploration consists of horizontal tunnelling along the veins, in addition to driving raises or declines to access the veins at other levels. Core drilling is designed to intersect the veins in other locations both laterally and vertically. Continuous chip samples are collected from underground tunnels and other workings, and core samples are collected from altered and mineralized drill cores.
Core Samples
NQ-sized drill cores (48 mm in diameter) are recovered from the mineralized zones. Drill core recoveries are influenced by lithology and average 98-99%. The Archean gneissic wall rocks appear competent.
Drill core is logged initially at the drill sites and the mineralized or favourably altered intervals are moved to the surface core shack where they are logged, photographed and sampled in detail. Samples are prepared by cutting the core in half with a diamond saw. One half of the core is marked with sample number and sample boundary and then returned to the core box for archival storage. The other half is placed in a labeled cotton cloth bag with sample number marked on the bag. The bagged sample is then shipped to the laboratory for assaying.
Chip Samples
Chip samples are collected along sample lines perpendicular to the mineralized vein structure in exploration tunnels. Spacing between sampling lines is typically 5 m along strike. Both the mineralized vein and the altered wall rocks are cut with continuous chisel chipping. Sample length ranges from 0.2 m to more than 1 m, depending on the width of the mineralized vein and the mineralization type.
Sample Preparation & Analysis and Security
Core samples are shipped or couriered in securely sealed bags to one of four reputable commercial labs, the Analytical Lab of Henan Non-Ferrous Metals Geological and Exploitation Institute in Zhengzhou (Zhengzhou Lab), the Analytical Lab of the 6th Nonferrous Geo-exploration Team in Luoyang (Luoyang Lab), the ALS-Chemex Lab in Guangzhou, and the SGS lab in Tianjin. All labs are officially accredited in China.
Zhengzhou Lab and Luoyang Lab: Sample preparation consists of drying, crushing and splitting of the sample to 250 grams (g), and then the sample is pulverized to minus 200 mesh. Two-acid digestion and AAS finish are utilized on a 0.5 g sample for lead and zinc assay. Titration is utilized as a modified process for higher grade materials. Silver is also analyzed using a two-acid digestion on a 0.5 g sample and AAS finish.
32
ALS Chemex: Samples are dried, crushed and split to a 250 g sub-sample which is further pulverized to 85% passing 200 mesh. Four-acid digestion and ICP-AES finish are utilized on a 1 g sample for analyzing silver, lead, zinc and copper. For samples containing more than 1,500 g/t silver, fire assay and gravimetric finish is utilized. Titration method is utilized as a modified process for samples with more than 10% Pb.
SGS Lab: Samples are dried, crushed and split to a 250 g sub-sample which is further pulverized to 85% passing 200 mesh. Fire assay and AAS finish are utilized for gold assay. Four-acid digestion and ICP-AES finish are used in analyzing silver, lead, zinc and copper.
Chip samples are prepared and assayed with AAS at Silvercorp’s mine lab located at the mill complex in Luoning County and referred to in Section 11.3. Samples are dried at 100° to 105° C in an oven and are then crushed and pulverized through three procedures, preliminary crushing, intermediate crushing and final pulverizing. Sample splitting is conducted at each procedure. A 200 g sample of minus 150 mesh (0.1 mm) is prepared for assay. A duplicate sample of minus 1 mm is made and kept at the lab for archives. A 0.5 g pulp sample is treated with two-acid digestion and assayed for silver, lead, zinc and copper with AAS at the lab.
Mineral Resource and Mineral Reserve Estimates
Mineral Resource Estimates
The mineral resource categories used in the Ying Report are those established by the Canadian Institute of Mining, Metallurgy and Petroleum (“CIM”) in the CIM Standards on Mineral Resources and Reserves, Definitions and Guidelines (CIM Standards) as adopted by the CIM Council dated December 2005.
The resource estimates reported in the Ying Report were prepared using polygonal estimation techniques by Mr. Housheng Xu, Chief Geologist of Henan Found, and Mr. Ruijin Jiang, P.Geo., Vice President, Exploration of Silvercorp, who is a non-independent Qualified Person, as defined by NI 43-101. B O’Connor of AMC has reviewed Silvercorp’s methodologies and data used to prepare the resource estimates and is satisfied that they comply with reasonable industry practice, subject to a qualification with respect to use of the polygonal method. Although this is a common estimation method in China and its use by Silvercorp therefore accords with common industry practice in that country, the technique tends to produce estimates that are higher in grade and lower in tonnage than interpolation methods in common use in Canada, such as kriging or inverse distance weighting.
The mineral resources include material (approximately 27% of Measured and Indicated Resources) that is below the lower limit of Silvercorp’s current mining permits. However, because of the nature of Chinese regulations governing applications for new or extended mining permits, and because mineral resources have been shown to extend below the current lower limit, AMC is satisfied that there is no material risk of Silvercorp not being granted approval to extend the lower depth limit of its permits to develop these resources as and when required.
The veins in the Ying District are polymetallic veins that contain several potentially payable metals, specifically silver, gold, lead, zinc and copper, although at the time of writing, copper and gold were not recovered from the SGX and HZG operations. Silvercorp uses “silver-equivalent” (AgEq) values as a convenient way to assess cut-off grades and compare the tenor of these polymetallic veins. The AgEq formula is as follows:
AgEq (g/t) = (Ag g/t * Ag recovery) + ((Au g/t * Au price per g * Au recovery) / Ag price per g) + ((Pb% * Pb price * Pb recovery * 22.0462) / Ag price per g) + ((Zn% * Zn price * Zn recovery * 22.0462) / Ag price per g)
33
In calculating AgEq grades, Silvercorp used long-term prices for Ag, Pb and Zn suggested by AMC and the actual mill recoveries for Ag, Au, Pb and Zn of the company’s plants in 2011. Note that copper is not a contributor and gold only contributes when there is a recovery value.
Metal prices used:
Au: US$1,250/troy ounce = US$40.19/g
Ag: US$19.00/troy ounce = US$0.61/g
Pb: US$1.00/pound
Zn: US$1.00/pound
Standard unit conversions used in the resource estimations and reporting are as follows:
1 troy ounce = 31.1035 grams
1 tonne = 2204.62 pounds
The total estimated mineral resources for the SGX, HZG, HPG, TLP and LM mines, reported by category, are summarized in the following Tables 2 and 3. The mineral resource estimates tabled in this section are inclusive of those resources converted to mineral reserves and are exclusive of mine production to December 31, 2011. They are reported to a minimum mining width of 0.3 m and, while they can include dilution to make up to 0.3 m, do not take into account the mining dilution that is discussed in Section 15.4.1 of the Ying Report.
Table 2 Measured and Indicated Mineral Resources in the Ying Property as of December 31, 2011
| | | | | | | | | | | |
Resource
Category | Resource
(Mt) | Average Grades in Resource | Metals contained in Resource |
Au
(g/t) | Ag
(g/t) | Pb
(%) | Zn
(%) | Cu
(%) | Au
(oz) | Ag
(Moz) | Pb
(t) | Zn
(t) | Cu
(t) |
| SGX , Ag Equiv. Grade≥150 g/t |
| Measured | 1.43 | - | 430 | 8.26 | 4.33 | - | - | 19.81 | 118,400 | 62,100 | - |
| Indicated | 2.12 | - | 422 | 7.45 | 3.67 | - | - | 28.78 | 158,100 | 77,800 | - |
| Total | 3.56 | - | 425 | 7.78 | 3.93 | - | - | 48.59 | 276,500 | 139,900 | - |
| HZG(Cu), Ag Equiv. Grade≥100 g/t |
| Measured | 0.13 | - | 473 | 1.25 | 0.36 | 0.61 | - | 2.03 | 1,700 | 500 | 800 |
| Indicated | 0.28 | - | 347 | 1.13 | 0.21 | 0.38 | - | 3.13 | 3,200 | 600 | 1,100 |
| Total | 0.41 | - | 388 | 1.17 | 0.26 | 0.46 | - | 5.16 | 4,800 | 1,100 | 1,900 |
| HPG, Ag Equiv. Grade≥100 g/t |
| Measured | 0.23 | 0.87 | 110 | 5.98 | 1.37 | - | 6,400 | 0.81 | 13,600 | 3,100 | - |
| Indicated | 0.34 | 1.5 | 94 | 3.54 | 2.29 | - | 16,600 | 1.04 | 12,100 | 7,800 | - |
| Total | 0.57 | 1.25 | 101 | 4.51 | 1.92 | - | 23,000 | 1.84 | 25,700 | 11,000 | - |
| TLP, Ag Equiv. Grade≥100 g/t |
| Measured | 0.45 | - | 195 | 4.83 | 0.31 | - | - | 2.85 | 22,000 | 1,400 | - |
| Indicated | 2.17 | - | 189 | 3.65 | 0.29 | - | - | 13.20 | 79,200 | 6,200 | - |
| Total | 2.62 | - | 190 | 3.86 | 0.29 | - | - | 16.05 | 101,200 | 7,600 | - |
| LM, Ag Equiv. Grade≥100 g/t |
| Measured | 0.17 | - | 452 | 3.45 | 0.36 | - | - | 2.52 | 6,000 | 600 | - |
| Indicated | 1.86 | - | 363 | 3.17 | 0.47 | - | - | 21.71 | 58,900 | 8,700 | - |
34
| | | | | | | | | | | |
Resource
Category | Resource
(Mt) | Average Grades in Resource | Metals contained in Resource |
Au
(g/t) | Ag
(g/t) | Pb
(%) | Zn
(%) | Cu
(%) | Au
(oz) | Ag
(Moz) | Pb
(t) | Zn
(t) | Cu
(t) |
| Total | 2.03 | - | 371 | 3.19 | 0.46 | - | - | 24.23 | 64,900 | 9,300 | - |
| LMAu, Ag Equiv. Grade≥100 g/t |
| Indicated | 0.02 | 48.04 | 27 | 0.08 | 0.04 | 2.87 | 23,400 | 0.01 | <100 | <100 | 400 |
| Total | 0.02 | 48.04 | 27 | 0.08 | 0.04 | 2.87 | 23,400 | 0.01 | <100 | <100 | 400 |
| TOTALS |
| Measured | 2.42 | 0.08 | 369 | 6.88 | 3.22 | | 6,400 | 28.02 | 161,600 | 67,700 | 800 |
| Indicated | 6.79 | 0.18 | 311 | 4.59 | 1.49 | | 40,000 | 67.88 | 311,600 | 101,100 | 1,500 |
| Total | 9.21 | 0.16 | 324 | 5.14 | 1.83 | | 46,300 | 95.89 | 473,200 | 168,800 | 2,300 |
Table 3 Inferred Mineral Resource Estimates in the Ying Property
| | | | | | | | | | | |
Resource
Category | Resource
(Mt) | Average Grades in Resource | Metals contained in Resource |
Au
(g/t) | Ag
(g/t) | Pb
(%) | Zn
(%) | Cu
(%) | Au
(oz) | Ag
(Moz) | Pb
(t) | Zn
(t) | Cu
(t) |
| SGX , Ag Equiv. Grade≥150 g/t |
| Inferred | 1.51 | - | 328 | 6.76 | 3.78 | - | - | 15.88 | 101,800 | 57,000 | - |
| HZG(Cu), Ag Equiv. Grade≥100 g/t |
| Inferred | 0.17 | - | 282 | 1.26 | 0.28 | 0.32 | - | 1.57 | 2,200 | 500 | 600 |
| HPG, Ag Equiv. Grade≥100 g/t |
| Inferred | 0.14 | 1.1 | 105 | 3.79 | 1.15 | - | 5,100 | 0.49 | 5,500 | 1,700 | - |
| TLP, Ag Equiv. Grade≥100 g/t |
| Inferred | 1.43 | - | 207 | 3.24 | 0.45 | - | - | 9.53 | 46,500 | 6,500 | - |
| LM, Ag Equiv. Grade≥100 g/t |
| Inferred | 1.49 | - | 365 | 2.31 | 0.52 | - | - | 17.41 | 34,400 | 7,700 | - |
| Total for Ying Property |
| Inferred | 4.74 | 0.11 | 294 | 4.01 | 1.55 | | 5,100 | 44.88 | 190,300 | 73,300 | 600 |
Notes to Tables 2 and 3:
| 1. | Metal prices used: gold US1,250/troy oz, silver US$19.00/troy oz, lead US$1.00/lb, zinc US$1.00/lb |
| 2. | Inclusive of resources converted to mineral reserves |
| 3. | Lower cut-off grade, 150 g/t AgEq for SGX, 100 g/t AgEq for HZG, HPG, LM and TLP |
| 4. | Exclusive of mine production to 31 December 2011 |
| | 5. | Rounding of some figures may lead to minor discrepancies in some totals |
Table 4 below summarizes reconciliation between mineral resource estimates and mill feed for Ying mines for 2009-2011. Because the dilution tonnages in this table are not calculated from first principles, tonnages of expected mine production and reconciled mine production (mill feed) compare exactly. This is not advisable as it assumes that the difference between predicted and milled tonnages is due only to mine dilution, which may not be the case. AMC recommends that reconciliation in future be based on comparisons between mineral reserve estimates, which by definition include anticipated mine dilution, and mill feed.
Table 4 Reconciliation, Mineral Resources to Mine Production, 2009-2011
| | | | | |
| | Mine | Tonnes | Ag (g/t) | Pb (%) | Zn (%) |
| Resource (M+I) | SGX
HPG | 639,312
60,477 | 744
152 | 14.37
7.65 | 5.39
2.05 |
35
| | | | | |
| | Mine | Tonnes | Ag (g/t) | Pb (%) | Zn (%) |
LM
TLP | 74,965
164,710 | 382
141 | 2.17
3.76 | 0.00
0.00 |
| Total | 939,464 | 571 | 11.10 | 3.80 |
| Dilution | SGX
HPG
LM
TLP | 438,428
39,419
33,165
60,359 | 0
0
0
0 | 0
0
0
0 | 0
0
0
0 |
| Total | 571,371 | 0 | 0 | 0 |
| Production Expected Mine | SGX
HPG
LM
TLP | 1,077,740
99,896
108,130
225,069 | 441
92
265
103 | 8.52
4.63
1.50
2.75 | 3.20
1.24
0.00
0.00 |
| Total | 1,510,835 | 355 | 6.90 | 2.36 |
| Production Reconciled Mine | SGX
HPG
LM
TLP | 1,077,740
99,896
108,130
225,069 | 412
133
277
105 | 7.38
6.42
1.93
2.92 | 2.62
1.15
0.00
0.00 |
| Total | 1,510,835 | 338 | 6.26 | 1.94 |
| Difference in % | SGX
HPG
LM
TLP | 0.00%
0.00%
0.00%
0.00% | -6.7
44.5
4.6
1.8 | -13.4
38.6
28.3
6.1 | -18.1
-7.3
0.0
0.0 |
| Total | 0.00% | -4.8 | -9.3 | -17.7 |
Zinc accounts for only around 6% of total net revenue, so reconciliation results for zinc are not of material concern. On the assumption that mine dilution accounts for all the difference between predicted and milled tonnages and that mine dilution has zero grade, there are substantial overcalls (mill greater than predicted) for silver and lead for HPG and LM (although these are the smallest producers), and undercalls for silver and lead for SGX. With SGX accounting for 74% of total production, there is some concern with the undercall for silver and lead. However, AMC does not consider that the differences represent a material risk to the project.
Possible reasons for the undercall at SGX include:
A possible tendency for chip sample grades to be biased high
A possible mill recovery overestimation
Hand-sorting losing some finely disseminated high grade values to waste
Top-cutting values possibly being slightly too high
AMC recommends that the reasons for the undercall of silver and lead grades at SGX be more fully investigated.
Mineral Reserve Estimates
The reserve estimation is based on the assumption that current stoping practices will continue to be predominant at the Ying property, namely cut and fill resuing and shrinkage stoping, using jacklegs and hand-mucking within stopes, and loading to mine cars by rocker-shovel or by hand. The largely sub-vertical veins, generally competent ground, reasonably regular vein width, and hand-mining techniques using short rounds, allows a significant degree of selectivity and control in the stoping process. Minimum
36
extraction widths of 0.3 m for resuing and 0.8 m for shrinkage are assumed, with both methods having a minimum mining width of 0.8 m; again as per current practice at Ying. AMC has observed the mining methods at the Ying property and considers the minimum extraction and mining width assumptions to be reasonable. General dilution assumptions are 0.1 m on each wall of a resuing cut and 0.15 m on each wall of a shrinkage stope.
For the total tonnage estimated as Ying reserves, 41% is associated with resuing and 59% with shrinkage.
Cut-off Grades
Mineral reserves have been estimated by Silvercorp using breakeven cut-off values of 120 g/t AgEq for SGX and 110 g/t for the HZG, HPG, LM and TLP mines. The cut-off grade basis provided by Silvercorp is summarized below and in Table 5.
Cut-off grade AgEq (g/t) = (mining cost + sustaining capital + milling cost + hauling cost + G&A cost + selling cost + mineral resources tax) / Ag price.
Table 5 Mineral Reserve Cut-off Grades and Key Estimation Parameters
| | | | | |
| Item | SGX | HZG | HPG | LM | TLP |
| Foreign Exchange Rate (RMB:US$) | 6.35 | 6.35 | 6.35 | 6.35 | 6.35 |
| Operating Costs | | | | | |
| Sustaining Capital ($/t) | 8.71 | 5.49 | 6.59 | 4.49 | 5.69 |
| Mining Cost ($/t) | 40.68 | 40.67 | 40.50 | 39.88 | 34.75 |
| Hauling cost ($/t) | 3.95 | 4.04 | 4.23 | 3.08 | 3.12 |
| Milling cost ($/t) | 10.68 | 11.20 | 10.67 | 10.59 | 10.56 |
| G&A and Product Selling Cost ($/t) | 3.72 | 3.56 | 4.00 | 5.24 | 5.49 |
| Mineral resources tax ($/t) | 1.95 | 1.95 | 1.95 | 1.95 | 1.95 |
| Total Operating Costs (US$/t) | 69.69 | 66.91 | 67.94 | 65.23 | 61.56 |
| Mill Recoveries | | | | | |
| Au (%) | | | | | 86.2 |
| Ag (%) | 92.4 | 94.6 | 90.4 | 93.4 | 87.0 |
| Pb (%) | 96.3 | 92.1 | 91.3 | 93.4 | 93.2 |
| Zn (%) | 75.7 | | | | 57.9 |
| Cut-off Grades Used (AgEq g/t) | 120 | 110 | 110 | 110 | 110 |
Metal prices used are Ag - $19/oz, Au - $1250/oz, Pb - $1/lb, Zn - $1/lb.
No Zn value has been ascribed to ore from the HZG, HPG and LM sites
Operating costs are derived from 2011 results; for HPG, costs have been normalized to 80,000 tpa from 43,000 tpa.
Lower cut-off grade values have been calculated for vein development operations, where the value of the material being mined has only to bear the cost of hauling, milling, G&A, selling and tax. These values are shown in Table 6.
Table 6 Vein Development Cut-off Grades
| | | | | |
| Vein Development Cut-off Estimates | SGX | HZG | HPG | LM | TLP |
| AgEq Cut-off g/t | 45.00 | 50.00 | 55.00 | 50.00 | 50.00 |
Costs and metal prices as per Table 5 above.
37
Dilution
Minimum stoping extraction widths are 0.3 m and 0.8 m respectively for resuing and shrinkage; minimum mining widths are 0.8 m for both methods. Unplanned dilution has been applied to the actual extraction width for resuing (resource grades already factored to 0.3 m minimum mining width) and to the greater of 0.8 m or actual mining width for shrinkage.
AMC has calculated unplanned dilution based on 0.1 m of waste break on each wall of a resued vein, and 0.15 m of waste break outside the design mining width of a shrinkage stope. A key strategy used at Ying for minimizing floor dilution is the placement of rubber mats and/or conveyor belting over the waste fill floor in resuing stopes immediately before each resuing blast. This effectively serves as a barrier between ore and waste.
The dilution calculation process used for the reserves assumes that the resulting figures represent the overall tonnes and grade delivery to surface. There is a small degree of waste hand sorting, and therefore upgrading, that occurs underground, depending on the mine and mining method. AMC considers that the resulting impact of this hand-sorting on the delivered product is not significant enough to be material.
Table 7 summarizes dilution factors used in the reserve calculations for each of the Ying mines. The lower percentages for shrinkage stoping are a reflection of mining wider veins.
Table 7 Average Dilution by Mine and Method
| | |
| Mine | Dilution % |
| Resuing | Shrinkage |
| HPG | 37 | 28 |
| HZG | 33 | |
| LM | 40 | 23 |
| TLP | 56 | 29 |
| SGX | 43 | 32 |
| Total Ying | 41 | 28 |
Mining Recovery Factors
Mining recovery estimates used in the reserve calculations are based on experience at each of the Ying operations and for each mining method. For resuing stopes, 95% total recovery is assumed; for shrinkage stopes, 92% total recovery is assumed. Minimal pillars are anticipated to remain between adjacent mining blocks in the same vein and partial recovery is anticipated in sill pillars. A 70% recovery factor is applied to irregular ore blocks in remnant areas mined by local miners prior to Silvercorp acquiring the Ying properties.
Mineral Reserve Estimate
To convert mineral resources to mineral reserves, Silvercorp uses the following procedures:
Selection of Measured and Indicated Resource polygons for which the average AgEq grade is greater than the mine cut-off AgEq grade
Application of minimum extraction and mining width criteria and calculation of dilution at zero grade
Estimation of mineral reserve potential by applying relevant mining loss factors
Confirmation as mining reserve by considering any other significant cost factors such as additional waste development required to gain access to the block in question
38
Table 8 summarizes the reserve estimates for each Ying mine and for the Ying operation as a whole. Approximately 27% of the mineral reserve estimate tonnage is categorized as Proven and approximately 73% is categorized as Probable.
Table 8 Ying Mines Mineral Reserve Estimates
| | | | | | | | | | |
| Mines | Categories | Tonnes | Au | Ag | Pb | Zn | Metal Contained in Reserves |
| (Mt) | (g/t) | (g/t) | (%) | (%) | Au | Ag (Moz) | Pb (t) | Zn (t) |
| SGX | Proven | 1.56 | | 332 | 6.37 | 3.35 | | 16.67 | 99,500 | 52,300 |
| Probable | 2.16 | | 354 | 6.26 | 2.74 | | 24.60 | 135,300 | 59,200 |
| Total Proven & Probable | 3.72 | | 345 | 6.31 | 3 | | 41.29 | 234,900 | 111,700 |
| HZG | Proven | 0.13 | | 384 | 0.96 | 0.27 | | 1.66 | 1,300 | 400 |
| Probable | 0.25 | | 297 | 0.95 | 0.19 | | 2.37 | 2,400 | 500 |
| Total Proven & Probable | 0.38 | | 327 | 0.96 | 0.22 | | 4.02 | 3,700 | 800 |
| HPG | Proven | 0.24 | 0.63 | 90 | 5.05 | 1.11 | 4,900 | 0.69 | 12,100 | 2,700 |
| Probable | 0.39 | 1.14 | 73 | 2.83 | 1.87 | 14,300 | 0.92 | 11,000 | 7,300 |
| Total Proven & Probable | 0.63 | 0.95 | 79 | 3.67 | 1.58 | 19,200 | 1.60 | 23,100 | 10,000 |
| TLP | Proven | 0.45 | | 135 | 3.48 | 0.23 | | 1.97 | 15,800 | 1,000 |
| Probable | 2.10 | | 124 | 2.87 | 0.25 | | 8.37 | 60,300 | 5,300 |
| Total Proven & Probable | 2.55 | | 126 | 2.98 | 0.25 | | 10.35 | 76,100 | 6,400 |
| LM | Proven | 0.23 | | 283 | 1.96 | 0.23 | | 2.09 | 4,500 | 500 |
| Probable | 2.27 | | 268 | 2.39 | 0.35 | | 19.59 | 54,300 | 8,000 |
| Total Proven & Probable | 2.50 | | 269 | 2.35 | 0.34 | | 21.65 | 58,800 | 8,500 |
| Ying | Proven | 2.62 | 0.06 | 274 | 5.08 | 2.17 | 4,900 | 23.08 | 133,100 | 56,800 |
| Mine | Probable | 7.17 | 0.06 | 242 | 3.67 | 1.12 | 14,300 | 55.81 | 263,300 | 80,300 |
| TotalProven&Probable | 9.79 | 0.06 | 251 | 4.05 | 1.40 | 19,200 | 78.89 | 396,300 | 137,200 |
Notes to Reserve Statement:
1. Stope Cut-off grades of 120 g/t AgEq for SGX and 110 g/t for all other mines.
2. Vein development cut-off grades of 45 g/t AgEq for SGX, 50 g/t AgEq for HZG, LM and TLP, and 55 g/t AgEq for HPG
3. Operating costs of $61/t other than $56/t for TLP mine
4. Metal prices assumed are Ag - US$19 troy ounce, Au - US$1250 per troy ounce, Pb - US$1 per pound, Zn - $US1 per pound.
5. No value ascribed to Zn at HZG, HPG and LM mines
6. Processing recovery factors as in Table 15.1 in the Ying Report Exclusive of mine production to 31 December 2011
7. Exchange rate assumed is 6.35 RMB : US$1.00
Reserves Sensitivity to Cut-off Grade
AMC has examined the sensitivity of the Ying reserves to variation in cut-off grade by comparing the results of estimation at a COG of 100 g/t AgEq against those of estimation at a COG of 150 g/t AgEq for all mines. The approximate estimated percentage differences in contained AgEq ounces for each of the Ying mines and for the property as a whole are shown in Table 9.
Table 9 Reduction in Contained AgEq Oz, COG 100 g/t to 150 g/t
| | | | | |
| Mine reduction | SGX | HZG | HPG | TLP | LM |
| 0.3% | 2.2% | 3.0% | 5.4% | 3.5% |
| Ying Property reduction | 2.0% |
39
The lowest sensitivity is seen at SGX, where there is only a 0.3% difference between contained AgEq ounces for the two cut-off grades examined. The highest differential is noted for TLP at 5.4%. For Ying as a whole, a 2% difference demonstrates very low overall COG sensitivity. AMC also notes that, assuming a breakeven cut-off scenario and a silver price of $19/oz, cut-off grades of 100 g/t and 150 g/t can be equated to respective operating costs of around $61/t and $92/t. A COG of 150 g/t with an operating cost of $61/t also indicates a breakeven silver price of around $13.
Conversion of Mineral Resources to Reserves
Table 10 compares the respective sums of Measured plus Indicated Resources and Proven plus Probable Reserves for each of the Ying mines and the entire Ying operation.
Table 10 Resources and Reserves Comparison
| | | | | | | | | | |
| Mine | | Tonnes | Au | Ag | Pb | Zn | Au | Ag | Pb | Zn |
| | | t | g/t | g/t | % | % | koz | koz | t | t |
| SGX | Resource | 3,555,559 | | 425 | 7.78 | 3.93 | | 48,588 | 276,523 | 139,870 |
| | Reserve | 3,722,791 | | 345 | 6.31 | 3.00 | | 41,238 | 234,855 | 111,558 |
| Conversion | | | | | | | | | | |
| percentage | | 105 | | 81 | 81 | 76 | | 85 | 85 | 80 |
| HZG | Resource | 413,982 | | 388 | 1.17 | 0.26 | | 5,163 | 4,838 | 1,069 |
| | Reserve | 382,437 | | 327 | 0.96 | 0.22 | | 4,026 | 3,657 | 825 |
| Conversion | | 92 | | 84 | 82 | 83 | | 78 | 76 | 77 |
| percentage | | | | | | | | | | |
| HPG | Resource | 569,978 | 1.3 | 101 | 4.51 | 1.92 | 24 | 1,844 | 25,734 | 10,960 |
| | Reserve | 630,065 | 0.9 | 79 | 3.67 | 1.58 | 19 | 1,609 | 23,155 | 9,957 |
| Conversion | | 111 | 72 | 79 | 81 | 82 | 80 | 87 | 90 | 91 |
| percentage | | | | | �� | | | | | |
| TLP | Resource | 2,622,207 | | 190 | 3.86 | 0.29 | | 16,050 | 101,192 | 7,569 |
| | Reserve | 2,554,243 | | 126 | 2.98 | 0.25 | | 10,349 | 76,011 | 6,390 |
| Conversion | | | | | | | | | | |
| percentage | | 97 | | 66 | 77 | 86 | | 64 | 75 | 84 |
| LM | Resource* | 2,033,669 | | 371 | 3.19 | 0.46 | | 24,234 | 64,932 | 9,293 |
| | Reserve | 2,503,582 | | 269 | 2.35 | 0.34 | | 21,652 | 58,955 | 8,521 |
| Conversion | | 123 | | 73 | 74 | 74 | | 89 | 91 | 92 |
| percentage | | | | | | | | | | |
| Total | Resource | 9,195,395 | 0.08 | 324 | 5.15 | 1.83 | 24 | 95,874 | 473,263 | 168,713 |
| | Reserve | 9,793,118 | 0.06 | 251 | 4.05 | 1.40 | 19 | 78,873 | 396,633 | 137,251 |
| Conversion | | 107 | 74 | 77 | 79 | 76 | 80 | 82 | 84 | 81 |
| percentage | | | | | | | | | | |
*Not including LM Indicated Resource of 15,136 t at 48.04 g/t Au, 27 g/t Ag, 0.08% Pb, 0.04% Zn
40
For the property as a whole, total Reserve tonnes are noted to be 107% of Resource tonnes. Silver, lead and zinc grades show a conversion percentage between 76% and 79%. Metal content conversion for silver, lead and zinc is between 81% and 84%.
Mining Operations
The Ying mine complex is a viable operation with a projected life of mine (LOM) through to 2023 based on Proven and Probable reserves. The potential exists for an extended LOM via further exploration and development, particularly in areas of Inferred Resources.
An increase in annual production of about 50% is planned between 2012 and 2014. Development and infrastructure to allow access to, and mining in, a greater number of working places is either in place, in development or is planned. Consequent with the projected increase in production tonnes will be a gradual reduction in grade as mining activity increases in the lower grade TLP and LM areas.
The generally good ground conditions, and the regularity and sub-vertical nature of the Ying district veins, may provide an opportunity to effectively employ more bulk-mining methods such as long-hole benching, and still with reasonable dilution. AMC recommends that Silvercorp consider the application of such methods.
Summary of Capital Costs
The principal capital requirement in the Ying district is for mine development. An allowance for processing sustaining capital has been included in the economic evaluation, based on 5% of processing operating costs, an industry standard method for estimating sustaining capital costs applied to fixed assets. Mining capital costs are summarized by mine in Table 11, and the processing sustaining capital is also included as the final line in this table.
Table 11 Total Capital Cost – Ying Property
| | | | | | | | | | | | | |
| | Mine | Total | 2012 | 2013 | 2014 | 2015 | 2016 | 2017 | 2018 | 2019 | 2020 | 2021 | 2022 |
| RMB | SGX | 27.22 | 16.72 | 5.52 | 1.86 | 2.57 | 0.55 | 0 | 0 | 0 | 0 | 0 | 0 |
| (M) | HZG | 33.61 | 16.42 | 10.8 | 5.79 | 0.6 | 0 | 0 | 0 | 0 | 0 | 0 | 0 |
| | HPG | 12.49 | 4.26 | 4.51 | 1.95 | 1.73 | 0 | 0 | <0.01 | 0 | 0 | 0 | 0 |
| | TLP | 12.13 | 1.88 | 1.55 | 0.28 | 3.92 | 1.01 | 1.14 | 1.39 | 0.48 | 0.24 | 0.24 | 0 |
| | LM | 50 | 14.69 | 20.2 | 5.13 | 5.56 | 1.45 | 0.37 | 0.22 | 0.15 | 1.73 | 0.48 | 0 |
| | Total Mining | 135.45 | 53.97 | 42.58 | 15.01 | 14.38 | 3.01 | 1.51 | 1.61 | 0.63 | 1.97 | 0.72 | 0 |
| US$ | SGX | 4.29 | 2.63 | 0.87 | 0.29 | 0.4 | 0.09 | 0 | 0 | 0 | 0 | 0 | 0 |
| (M) | HZG | 5.29 | 2.59 | 1.7 | 0.91 | 0.1 | 0 | 0 | 0 | 0 | 0 | 0 | 0 |
| | HPG | 1.97 | 0.67 | 0.71 | 0.31 | 0.27 | 0 | 0 | <0.01 | 0 | 0 | 0 | 0 |
| | TLP | 1.91 | 0.3 | 0.24 | 0.04 | 0.62 | 0.16 | 0.18 | 0.22 | 0.08 | 0.04 | 0.04 | 0 |
| | LM | 7.87 | 2.31 | 3.18 | 0.81 | 0.88 | 0.23 | 0.06 | <0.01 | 0.02 | 0.27 | 0.08 | 0 |
| | Total Mining | 21.33 | 8.5 | 6.7 | 2.36 | 2.27 | 0.48 | 0.24 | 0.22 | 0.1 | 0.31 | 0.12 | 0 |
| | Processing
Sustaining | 0.53 | 0.62 | 0.74 | 0.72 | 0.75 | 0.75 | 0.75 | 0.68 | 0.56 | 0.54 | 0.55 | 0.53 |
41
Summary of Operating Costs
Operating costs are summarized by mine in Table 12.
Table 12 Operating Cost Summary (2012 $)
| | | | | |
| Cost Item (US$/t ore) | SGX | HZG | HPG | LM | TLP |
| Mining Cost | 40.68 | 40.67 | 40.50 | 39.88 | 34.75 |
| Hauling cost | 3.95 | 4.04 | 4.23 | 3.08 | 3.12 |
| Milling cost | 10.68 | 11.20 | 10.67 | 10.59 | 10.56 |
| G&A and Other Cost | 3.72 | 3.56 | 4.00 | 5.24 | 5.49 |
| Mineral resources tax | 1.95 | 1.95 | 1.95 | 1.95 | 1.95 |
The principal components of the milling costs are utilities (power and water), consumables (grinding steel and reagents) and labour in approximate proportion of 40/40/20, respectively.
Economic Analysis
The Ying District is largely a mature operation, and average grades, especially from the SGX mine, would be considered high. Capital requirements are relatively low. The key parameter in producing a cash flow forecast is therefore the metal price forecast. AMC has used for the forecast the same metal prices as in the reserve estimate, namely:
| |
| Gold | US$1,250/oz |
| Silver | US$19/oz |
| Lead | US$1/lb |
| Zinc | US$1/lb |
Operating costs are assumed to be subject to a 5% annual escalation factor, due largely to an expectation of rising labour costs in China. The only tax considered in the cash flow forecast is the Mineral Resources Tax, equivalent to US$1.95/ tonne of ore. As this tax is equivalent to a royalty, the cash flow forecast is essentially pre-tax. An exchange rate of US$ : RMB of 6.3 has been used.
Market Studies and Contracts
AMC understands that the lead and zinc concentrates will be marketed to existing smelter customers in Henan and Shaanxi provinces and appropriate terms have been negotiated. With respect to copper, test work has so far been unsuccessful in producing a saleable copper concentrate, but copper levels in the ore are low and this is not a material commercial issue, nor does it materially impact on lead concentrate quality.
Monthly sales contracts are in place for the lead concentrates with leading smelters mostly located in Henan province, among them are Henan Yuguang Gold and Lead Smelting Co., Ltd, Jiyuan Wanyang Smelting (Group) Co., Ltd, Jiyuan Jinli Smelting (Group) Co., and Luoning Yongning Gold and Lead Smelting Co., Ltd. For the zinc concentrate, sales contracts are in place with Henan Yuguang Zinc Industry Co., Ltd and Shaanxi Shangluo Zinc Smelting Co. Ltd. The contracts are renewed on a monthly basis. All contracts have freight and related expenses to be paid by the smelter customers themselves.
The key elements of the contracts are summarized in Table 13 below:
42
Table 13 Key Elements of Smelter Contracts
| | | | | | | | |
| | | Pb Concentrate & Direct Smelting Ore | Zn Concentrate |
| | % | Deduction | | % | | % | | Deduction |
| | Pb | RMB/T Pb | Ag(g/t) | payable | Au(g/t) | payable | % Zn | RMB/T Zn |
| Minimum | 35 | | 500 | | 1 | | 40 | |
| Quality | | | | | | | | |
| Payment | >=60 | 1800 | >=5000 | 91 | >=20 | 87 | >=45 | Price =<RMB 15000/T:4400 |
| Scales | | | | | | | | |
| | 55-60 | 1900 | 4500-5000 | 90.5 | 15-20 | 86 | | Price > RMB 15000/T:4400+(price-15000)*20% |
| | 50-55 | 2000 | 4000-4500 | 90 | 10-15 | 85 | 40-45 | Price =<RMB 15000/T:4400+45 per % lower than 45% |
| | 45-50 | 2100 | 3500-4000 | 89.5 | 7-10 | 84 | | Price > RMB 15000/T:4400+(price-15000)*20%+45 per % lower than 45% |
| | 40-45 | 2200 | 3000-3500 | 89 | 5-7 | 83 | | |
| | 35-40 | 2700 | 2500-3000 | 88.5 | 3-5 | 82 | | |
| | | | 2000-2500 | 88 | 2-3 | 81 | | |
| | | | 1500-2000 | 87 | 1-2 | 80 | | |
| | | | 1000-1500 | 85 | | | | |
| | | | 500-1000 | 83 | | | | |
With respect to lead and zinc terms, the above deductibles calculate out to 85-90% payable for the lead concentrate and approximately 70% for zinc, at long-term prices.
Commodity Prices
For the purposes of cut-off grade and silver equivalent calculations AMC has used the following long-term prices: Ag $19/oz, Pb $1.00/lb, Zn $1.00/lb.
Annual Production Schedule
Table 14 presents a detailed schedule by tonnes and metal grades and also accounts for the hand-sorted Direct Shipping Ore (DSO) as a mine product because it bypasses the plant flotation process. Also shown are the flotation products from each plant (Pb only from Plant 1, Pb and Zn from Plant 2). Finally the concentrates sold are tabulated and the DSO ore is then added back in with the Pb concentrate.
43
Table 14 Ying Property Production Schedule
| | | | | | | | | | | | | | | | |
| | | Year | 2012 | 2013 | 2014 | 2015 | 2016 | 2017 | 2018 | 2019 | 2020 | 2021 | 2022 | 2023 | Totalt |
| Mine Ore Production |
| for Plant 1 | | | tpa | 0 | 252943 | 280500 | 244874 | 261933 | 250113 | 249674 | 249549 | 0 | 0 | 0 | 0 | 1789586 |
| | | | Ag(g/t | 0 | 223 | 196 | 166 | 140 | 130 | 131 | 128 | 0 | 0 | 0 | 0 | |
| | | | Pb % | 0 | 2.46 | 2.51 | 3.17 | 3.53 | 4.80 | 2.90 | 3.07 | 0 | 0 | 0 | 0 | |
| | | | Zn % | 0 | 0.23 | 0.24 | 0.36 | 0.36 | 0.53 | 0.28 | 0.16 | 0 | 0 | 0 | 0 | |
| |
| for Plant 2 | | | tpa | 698,924 | 564,561 | 689,795 | 683,929 | 713,423 | 714,702 | 714,162 | 621,851 | 714,592 | 690,917 | 703,699 | 329,174 | 7,839,729 |
| | | | Ag(g/t | 276 | 278 | 270 | 266 | 269 | 267 | 266 | 262 | 225 | 226 | 198 | 85 | |
| | | | Pb % | 3.93 | 4.04 | 3.41 | 3.86 | 3.48 | 3.04 | 3.18 | 3.15 | 3.44 | 2.81 | 2.50 | 1.11 | |
| | | | Zn % | 1.90 | 2.62 | 2.00 | 1.73 | 1.96 | 2.17 | 1.83 | 1.56 | 0.78 | 0.64 | 1.02 | 0.12 | |
| |
| Direct Shipping Ore (DSO) | | tpa | 17636 | 17675 | 17617 | 17627 | 17628 | 17645 | 17672 | 13426 | 8566 | 8766 | 9545 | | 163803 |
| | | | Ag(g/t | 1501 | 1456 | 1387 | 1391 | 1387 | 1395 | 1387 | 1383 | 1375 | 1342 | 1477 | | |
| | | | Pb % | 52.00 | 52.00 | 52.00 | 52.00 | 52.00 | 52.00 | 52.00 | 52.00 | 52.00 | 52.00 | 52.00 | | |
| | | | Zn % | 5.00 | 5.00 | 5.00 | 5.00 | 5.00 | 5.00 | 5.00 | 5.00 | 5.00 | 5.00 | 5.00 | | |
| Mill Flotation Products | | | | | | | | | | | | | | |
| Plant 1 | Pb Conc | | tpa | | 12454 | 14086 | 15537 | 18495 | 24011 | 14481 | 15322 | | | | | 114387 |
| | | | Ag (g/t) | | 4196 | 3598 | 2394 | 1801 | 1219 | 2033 | 1876 | | | | | |
| | | | Pb (%) | | 45 | 45 | 45 | 45 | 45 | 45 | 45 | | | | | |
| |
| Plant 2 | Pb Conc | | tpa | 44778 | 35966 | 38749 | 42211 | 40694 | 35965 | 37647 | 33097 | 45245 | 35014 | 30716 | 7463 | 427545 |
| | | | Au (g/t) | 0.31 | 1.10 | 1.19 | 0.95 | 1.65 | 2.54 | 1.73 | 1.54 | 0.00 | 0.00 | 0.00 | 0.00 | |
| | | | Ag (g/t) | 3979 | 4006 | 4426 | 3972 | 4342 | 4885 | 4660 | 4547 | 3294 | 4135 | 4201 | 3510 | |
| | | | Pb (%) | 58.1 | 60.4 | 57.6 | 59.5 | 58.0 | 57.3 | 57.3 | 56.0 | 50.6 | 52.1 | 54.0 | 45.0 | |
| |
| | Zn Conc | | tpa | 19054 | 21776 | 20260 | 17134 | 20256 | 22377 | 18685 | 13784 | 5643 | 5200 | 9501 | | 173670 |
| | | | Zn (%) | 49.1 | 48.8 | 47.8 | 47.7 | 47.6 | 47.3 | 46.8 | 45.0 | 48.7 | 50.0 | 50.0 | | |
| Concentrate Sold |
| Pb Conc (incl DSO) | | tpa | 62414 | 66095 | 70451 | 75375 | 76818 | 77621 | 69800 | 61845 | 53812 | 43780 | 40261 | 7463 | 705734 |
| | | | Au (g/t) | 0.22 | 0.60 | 0.65 | 0.53 | 0.88 | 1.18 | 0.93 | 0.83 | 0.00 | 0.00 | 0.00 | 0.00 | |
| | | | Ag (g/t) | 3279 | 3360 | 3500 | 3043 | 3052 | 2958 | 3286 | 3198 | 2988 | 3576 | 3555 | 3510 | |
| | | | Pb (%) | 56.34 | 55.23 | 53.70 | 54.74 | 53.49 | 52.30 | 53.38 | 52.41 | 50.80 | 52.09 | 53.54 | 45.00 | |
| | | TC | Rmb/t Pb | 1900 | 2000 | 2000 | 2000 | 2000 | 2000 | 2000 | 2000 | 2000 | 2000 | 2000 | 2100 | |
| | | | US$/t Zn | 301.6 | 317.5 | 317.5 | 317.5 | 317.5 | 317.5 | 317.5 | 317.5 | 317.5 | 317.5 | 317.5 | 333.3 | |
| | | Ag % payable | 88.5 | 90 | 89.5 | 89 | 89 | 89 | 89 | 89 | 89 | 89.5 | 89.5 | 89.5 | |
| | | | Ag k oz | 6578.9 | 7140.5 | 7928.2 | 7374.9 | 7537.2 | 7381.0 | 7374.4 | 6359.3 | 5169.7 | 5033.2 | 4601.4 | 842.0 | 73321 |
| | | | Pb mT | 35167 | 36504 | 37833 | 41263 | 41087 | 40597 | 37261 | 32410 | 27334 | 22805 | 21555 | 3358 | 377174 |
| |
| Zn Conc | | | tpa | 19054 | 21776 | 20260 | 17134 | 20256 | 22377 | 18685 | 13784 | 5643 | 5200 | 9501 | 0 | 173670 |
| | | | Zn % | 49.1 | 48.8 | 47.8 | 47.7 | 47.6 | 47.3 | 46.8 | 45.0 | 48.7 | 50.0 | 50.0 | 0.0 | |
| | | TC | Rmb/t Zn | 4400 | 4400 | 4400 | 4400 | 4400 | 4400 | 4400 | 4400 | 4400 | 4400 | 4400 | | |
| | | | US$/t Zn | 698.4 | 698.4 | 698.4 | 698.4 | 698.4 | 698.4 | 698.4 | 698.4 | 698.4 | 698.4 | 698.4 | | |
| | | | Zn mT | 9347.6 | 10630.3 | 9693.3 | 8180.8 | 9634.5 | 10574.9 | 8750.3 | 6204.1 | 2750.2 | 2599.8 | 4750.6 | | 83116 |
44
Cash Flow Forecast
Based on the metal price assumptions and other considerations above, over the life of the mine, 60% of the net revenue comes from silver, 34% from lead and only 6% from zinc. A base case NPV at 8% discount rate is US$896.6 million.
Exploration and Development
As set out in the Ying Report, Silvercorp plans to carry out the following exploration activities:
For SGX and HZG:
A 13,075 m tunneling program to upgrade inferred blocks on major mineralized structures;
56,170 m of underground drilling key vein structures at SGX; and
16,805 m of underground drilling and 4160m surface drilling on key vein structures in the HZG area.
For HPG:
A 6,935 m exploration tunneling program above the 300m elevation; and
15,000 m of underground drilling to infill and extend key vein structures.
For TLP and LM:
A 9,890 m exploration tunneling program at TLP;
2,100 m on key vein structures between 650L and 750L in the LME area, 2290 m on key vein structures between 846L and 916L in the LMW area.
25,000 m of underground drilling on key vein structures at TLP and similar programs of 5,400 m and 22,600 m at LME and LMW respectively.
The above exploration items are accounted for in the Silvercorp 2012 exploration budget, with total costs estimated at $US9.65 million, split between drilling at $US5.6 million and tunnelling at $US4.05 million.
|
Cautionary Note to U.S. Investors Concerning Estimates of Measured and Indicated Resources:
This section uses the terms “measured resources” and “indicated resources”. We advise U.S. investors that theseterms are not recognized by the U.S. Securities and Exchange Commission. The estimation of measured resourcesand indicated resources involves greater uncertainty as to their existence and economic feasibility than theestimation of proven and probable reserves. U.S. investors are cautioned not to assume that mineral resources inthese categories will be converted into reserves. See “Cautionary Note to U.S. Investors – Information ConcerningPreparation of Mineral Resource and Mineral Reserve Estimates”.
Cautionary Note to U.S. Investors Concerning Estimates of Inferred Resources
This section uses the terms “inferred resources”. We advise U.S. investors that this term is not recognized by theU.S. Securities and Exchange Commission. The estimation of inferred resources involves far greater uncertainty asto their existence and economic viability than the estimation of other categories of resources. U.S. investors arecautioned not to assume that estimates of inferred mineral resources exist, are economically minable, or will beupgraded into measured or indicated mineral resources. See “Cautionary Note to U.S. Investors – InformationConcerning Preparation of Mineral Resource and Mineral Reserve Estimates”. |
|
|
45
5.2GC Project
Except as otherwise stated, the information in this section is based on the technical report titled “NI 43-101 Technical Report on the GC Ag-Zn-Pb Project in Guangdong Province, People’s Republic of China” (the “GC Report”) effective January 23, 2012 prepared by AMC Mining Consultants (Canada) Ltd. by Brian O’Connor P.Geo, Peter Mokos MAusIMM (CP), Alan Riles MAIG, Owen Watson MAusIMM (CP), Mo Molavi P.Eng, Patrick Stephenson P.Geo
The following is the summary from the GC Report and is based on the assumptions, qualifications and procedures which are not fully described herein. References are made to the full text of the GC Report which is available for review on SEDAR at www.sedar.com.
Project Description and Location
The GC property is located in Yunfu City, Yun’an County, Guangdong Province, People’s Republic of China.
In 2008, Silvercorp acquired 100% of the shares of Yangtze Gold Ltd. (Yangtze Gold), a private British Virgin Island (BVI) company, which in turn wholly owns Yangtze Mining Ltd. (Yangtze Mining). Yangtze Mining owns a 95% interest in a Sino-Foreign joint venture company, Anhui Yangtze Mining Co. Ltd. (Anhui Yangtze). Anhui Yangtze’s main asset is the GC exploration permit for the GC Project, which was subsequently converted mining permit in November 2010.
The boundaries of the exploration permit have not been surveyed and no boundary markers have been staked in the ground.
On 14 June 2010 Silvercorp announced that it has been issued an Environmental Permit for the project from the Department of Environmental Protection of Guangdong Province, an essential document required for a mining permit application.
A Mining License was issued by the Ministry of Land and Resources of China on November 24, 2010. The license is valid for 30 years to November 24, 2040, covers the entire 5.5238 km2 area of the GC project and permits mining from 315m to minus 530m elevations. The permit was issued on the terms applied for, and allows for the operation of an underground mine to produce silver, lead and zinc. Key information contained in the mining license is as follows:
Table 1 GC Mining Permit owned by Anhui Yangtze
| |
| Permit No. | No. C1000002010113210083333 |
| Owner | Anhui Yangtze Mining Co. Ltd. |
| Owner’s address | #102-21 Building He Tai Xing town, Chizhou city, Anhui Province. |
| Name of the Mine | Anhui Yangtze Mining Co. Ltd GC Lead and Zinc Mine |
| Business Category | Sino-Foreign cooperative enterprises |
| Types of ore mined | Zinc, Lead and Silver ore |
| Mining Method: | Underground mining |
| Production Capacity: | 330,000 tonne/year |
| Mine Area | 5.5238 Km2 |
| Valid Period | 2010-11-24 to 2040-11-24 |
| Issued Date | Nov. 24 2010 |
46
The Licensee is subject to the charge of a Mining-right using fee ($158 /km2), a Mineral-resource compensation fee (2% of sales) and applicable mineral resource taxes ($2/t milled).
The Guangdong Metallurgical & Architectural Design Institute, a qualified Chinese engineering firm finalized the design of a 1,600 tonne per day mechanized underground mine, a flotation mill, and a dry stack tailing facility. The estimated capital cost was about $30 million. With the support of the local County government, Silvercorp has completed the acquisition of surface rights required for the construction of the mine and mill and is preparing the site and hiring contractors for the construction. Initial production of 700 tonnes per day mining capacity is expected to be achieved in 12 months with full capacity of 1,600 tonnes per day to be achieved in 18 months.
AMC is not aware of any additional royalties, back-in rights, payments, agreements, environmental liabilities or encumbrances particular to the property other than those stated above. Yangtze Mining Ltd (Yangtze Mining), which is wholly owned by Yangtze Gold Ltd (Yangtze Gold), acquired the GC property in 2005 through a 95% interest in a Sino-Foreign joint venture company, Anhui Yangtze Mining Co. Ltd (Anhui Yangtze).
Accessibility, Climate, Local Resources, Infrastructure and Physiography
The GC project is located around Gaocheng Village of Gaochun Township, Yun’an County, Guangdong Province, China. Altitudes in the region range from 78.0m to 378.0m above sea level (ASL), usually 150-250m ASL, with relative differences of 50-150m. Vegetation is in the form of secondary forests of pine and hardwoods, bushes and grasses. Top soil covers most of the ground. Outcrops of bedrocks can only be observed in valleys.
The GC project is located west of the metropolitan city of Guangzhou, the capital of Guangdong Province. Guangzhou is located about 120 km northwest of Hong Kong and has a population of almost 12 million registered residents and temporary migrant inhabitants in December of 2007, according to an economic report released by the Guangzhou Academy of Social Science. It is serviced by rail and daily flights from many of China’s larger population centres. Access to the GC project from Guangzhou is via 178 km of four lane express highway to Yunfu, then 48 km of paved road to the project site. A railway connection from Guangzhou to Yunfu is also available.
The region belongs to sub-tropical monsoon climate with average annual temperature of 20-22oC. Rainfall is mainly concentrated in spring and summer from March to August. Winters feature short periods of frosting. The GC project would be able to operate year round Streams are well developed in the area, the Hashui Creek flows in the GC project area. There is a reservoir upstream of the GC project area. Small hydro power stations are developed in the region and are connected to the provincial electrical grid. There is a 10KV power line across through the project area. Silvercorp is also having discussions with a utility company regarding power supply and related facilities.
The economy of Yun’an County mainly relies upon agriculture and some small township industrial enterprises. Labour is locally available, and technical personnel are available in Yunfu and nearby cities. The Gaocheng village is located within the GC project area.
History
Various state-sponsored Chinese Geological Brigades and companies have conducted geological and exploration work in the project area. Systematic regional geological surveys covering the area started in 1959. The following is a brief history of the exploration work in the area:
47
During 1959 to 1960, No. 763 Geological Brigade of Guangdong Bureau of Geology conducted a 1:200,000 regional geological survey and mapping, and regional prospecting of mineral resources in the area. A geological map and geological reports were published.
In 1964-1967, Comprehensive Study Brigade of Guangdong Bureau of Geology conducted general prospecting and 1:50,000 geological mapping in the area including the project area, and submitted a geological report.
In 1983, Geophysical Survey Brigade of Guangdong Bureau of Geology and Mineral Resources conducted a 1:200,000 airborne magnetic survey covering the project area.
In 1988, the Regional Geological Survey Brigade of Guangdong Bureau of Geology and Mineral Resources conducted a 1:200,000 stream sediment survey, which covers the project area.
In 1991, Geophysical Survey Brigade of Guangdong Bureau of Geology and Mineral Resources conducted a 1:200,000 gravity survey covering the project area.
In 1995, Ministry of Geology and Mineral Resources completed the compilation and interpretation of 1:1,000,000 geochemical, geophysical and remote sensing surveys covering the area.
During 1995 and 1996, Geophysical Survey Brigade of Guangdong Bureau of Geology and Mineral Resources conducted a 1:50,000 soil survey, and defined some large and intensive Pb, Zn, Ag, Sn, W and Bi geochemical anomalies, which covers the project area.
During 1990 and 2000, Guangdong Provincial Institute of Geological Survey (GIGS) conducted a 1:50,000 stream sediment survey which covers the project area, and defined several intensive anomalies of Pb-Zn-Ag-Sn-Mn, leading to the discovery of GC deposit.
During 2001 and 2002, and again in 2004 and 2005, GIGS conducted general prospecting at the GC project area, and defined some mineralized bodies and estimated mineral resources for the GC deposit.
During 2006 and 2007, contracted by Yangtze Mining, GIGS conducted a detailed prospecting at the GC project area, completed a 36-hole, 11,470m surface diamond drilling program and 1,964m3of trenching and surface stripping, to update and upgrade the mineral resources of the GC deposit.
History of Mining
Prior to Yangtze Mining acquiring the GC Property, illegal mining activity resulted in the excavation of several tunnels and small scale mining of veins V2, V2-2, V3, V4, V5, V6 and V10. GIGS reported that a total of 1,398 m of excavation comprised of 10 adits and tunnels had been completed on the property through the illegal activity.
In 2002, GIGS developed 66m of tunnel to crosscut veins V5 and V5-1. GIGS sampled and mapped adits ML1 to ML5, ML6, ML7, ML9, and PD12.
Yangtze Mining, after its purchase of the property in 2005, mapped and sampled the accessible tunnels ML5 and ML8. Tunnel ML5 has exposure to vein V10 and tunnel ML8 has exposure to vein V2-2. Assay results of tunnel samples were used in resource estimation.
48
History of Mineral Resources
GIGS prepared a resource estimate for nine mineralized veins for the GC project after the 2004-2005 exploration season. The GIGS has its own classification system of mineral resources / reserves which is different from the CIM Standards. AMC does not believe those resources are material to this report.
Prior to the current report, resource estimates for the GC project were reported in a Technical Report by SRK Consulting (SRK) dated April, 2008 (entitled “Technical Report on Gaocheng Ag-Zn-Pb Project and Shimentou Au-Ag-Zn-Pb Project, Guangdong Province, People’s Republic of China”) and in AMC’s June 2009 Technical Report.
Geological Setting
The GC Project is located in the northeastern margin of the Luoding basin, which is at the middle portion of the Yunkai uplift in the Hua’nan (South China) Fold System. The deposit is located at the intersection between Wuchuan-Sihui Deep Fault zone and Daganshan Arc-ring structural zone. Outcrop in the project area includes the Sinian Daganshan Formation which is composed of quartz sandstone, meta-carbonaceous siltstone, carbonaceous phyllite, calcareous quartzite, argillaceous limestone; the Triassic Xiaoyunwushan Formation which is made up of quartz sandstone and shale; and the Cretaceous Luoding Formation of sandy conglomerate and conglomerate. A series of magmatic events occurred on the GC property. Intrusives include Palaeozoic gneissic, medium-grained biotite granite, and Mesozoic fine- to medium-grained adamellite, brownish, fine-grained, biotite mylonite, granite porphyry, quartz porphyry, diabase, and aplite. The Mesozoic intrusives intruded along the south and southwest contacts of the Palaeozoic granites. The majority of Ag-Zn-Pb mineralization is hosted by the Mesozoic granite.
The granite dips to south and strikes to west northwest, parallel to the majority of mineralized veins on the GC property.
Exploration
Exploration work by Silvercorp on the GC property was carried out in 2008. The program is summarized in Table 2. No material exploration has been carried out on the property since that time.
Table 2 Main Programs Conducted on the GC Property by Silvercorp
| | |
| Program | Unit | Work Completed |
| 2008 |
| 1:10,000 soil profiling | km | 10 |
| Diamond drilling | m | 10,083 |
| Trenching (pitting) | m3 | 740 |
| Soil samples | sample | 535 |
| Chemical analysis samples | sample | 2,139 |
| Metallurgical testing | test | 1 |
The diamond drilling undertaken in 2008 represented 43% of all the diamond drilling on the property.
Soil Geochemical Program
A 1:10,000 scale geochemical survey was done by taking samples from C-layer of top soils and the samples were assayed for Au, Ag, Cu, Pb, Zn, Mo, Sb, and As, etc. The program resulted in outlining significant Ag, Pb, and Zn anomalies, providing targets for surface trenching and pitting. Most of the veins on the property were discovered using the soil geochemical results.
49
In 2008, soil geochemical survey (1:10,000 scale) was carried out by Silvercorp through the collection of 535 samples within a 2.22 km2area in the southern part of the property where no drilling had been previously performed. Three new Ag-Zn-Pb geochemical anomalies observed to be over 500m long and up to 250m wide were identified, providing priority drill targets with the potential to host additional veins.
Anomaly AS1 is located at the east of V4 vein along F4 fault. The anomaly is about 500m in length and 50 to 100m in width. The peak values of Ag, Pb and Zn are 2.1 ppm, 0.19% and 0.03% respectively. Trenching was carried out over the anomaly and mineralization was confirmed by the sample assay result.
AS2 anomaly is located between exploration line 1 and 12. It measures about 500m in length and 20 to 200m in width. The maximum values of Ag, Pb and Zn are 14.5 ppm, 0.11% and 0.02%, respectively.
AS3 anomaly is between exploration lines 28 to 44. Its length is about 500m. The anomaly ranges 20 to 50m in width from exploration lines 36 to 44 and expands to 250 wide at exploration 44.
| (a) | the results of all surveys and investigations and the procedures and parameters relating to surveys and investigations; |
| | |
| (b) | an interpretation of the exploration information; |
| | |
| (c) | whether the surveys and investigations have been carried out by your company or a contractor and if by a contractor, the name of the contractor; and |
| | |
| (d) | a discussion of the reliability or uncertainty of the data obtained in the program. |
Topographic and Geological Mapping
GIGS conducted a 1:10,000, 1:5,000 and 1:2,000 geological mapping programs, and a 1: 2,000 topographic survey covering the GC project area. The geological mapping programs established stratigraphic sequences, size, and distributions of intrusive rocks and faults.
The grid system used for the GC project is BeiYing Geodetic Coordinate System l954. Altitude is referred to Yellow Sea 1956 Elevation System. The project survey control points were generated from three nearby national survey control points. The control points were surveyed using four NGS-9600 GPS receivers. Survey machines used for topographical survey and geological points, trenches, adits, and drillhole collars were Topcon GTS-Serial Total Station Instrument – XJ0747 and one NX2350 and Sokkia SET-230PK Total Station Instrument.
Trenching and Pitting
Based on the soil geochemical and surface mapping, Silvercorp conducted trenching and pitting programs on the GC property. The program exposed the mineralized veins on the surface and at shallow depth. A total of seven pits and one trench were dug by Silvercorp and exposed three veins. Table 3 contains the findings in detail.
Table 3 Trenches and Pits Completed by Silvercorp in 2008
| | | | |
| Trench/pit | Section# | Azimuth | Volume
(m3) | Vein exposed |
| BT08-1 | 40 | 240° | 224 | 0.80m wide V5-1, containing 25 g/t Ag |
| BT08-2 | 44 | 235° | 24 | 0.95m wide V7-0, containing 21 g/t Ag |
50
| | | | |
| Trench/pit | Section# | Azimuth | Volume
(m3) | Vein exposed |
| BT08-3 | 52 | 210° | 32.4 | No vein intersected |
| BT08-4 | 52 | 310° | 24 | No vein intersected |
| BT08-5 | 52 | 340° | 52.8 | 0.80m wide V7-0, containing 61 g/t Ag |
| BT08-6 | 44 | 230° | 33.6 | 0.65m wide V5-1, containing 98 g/t Ag |
| BT08-7 | 30 | 340° | 118.8 | 0.75m wide V5-1, containing 18 g/t Ag |
| TC5201 | 52 | 185° | 230.4 | 1.00m wide V4, containing 0.31% Pb and 0.13% Zn |
The trenches or pits were dug perpendicular to striking direction of a soil geochemical anomaly or alteration zone. The trenching or pitting is completed by digging into bedrock approximately 0.3 to 0.5m.
Mineralization
The mineralized veins in the GC area occur in relatively permeable fault-breccia zones and are extensively oxidized from the surface to depths of about 40m. Within this zone, the veins show many open spaces with boxwork lattice textures resulting from the leaching and oxidation of sulphide minerals. Secondary minerals present in varying amounts in this zone include kaolinite, hematite, and limonite.
The dominant sulphide is pyrite, typically comprising a few percent to 13% of the vein. Other constituents are a few percent of sphalerite, galena, pyrrhotite, arsenopyrite, magnetite and less than a percentage of chalcopyrite and cassiterite. Metallic minerals in much smaller amounts include argentite, native silver, bornite, wolframite, scheelite, and antimonite. The minerals occur in narrow massive bands, veinlets or as disseminations in the gangue. Gangue minerals include chlorite, quartz, fluorite, feldspar, mica, hornblende, etc., with a small amount or trace amount of kaolinite, tremolite, actinolite, chalcedony, garnet, zoisite, apatite and tourmaline, etc.
The Ag-Zn-Pb mineralization in the deposit can be divided into two types: primary and oxidized. The primary mineralization is mainly composed of galena-sphalerite-silver ore minerals which occur sparsely, disseminate, and as veinlets and lumps. The type accounts for 95% of the entire mineral resource. The oxidized mineralization occurs on and near the surface topography as a result of oxidization of the primary mineralization.
The alteration minerals associated the GC vein systems include silica, sericite, pyrite and chlorite, together with clay minerals and limonite. Silicification is common near the center of the veins, chlorite and sericite occur near and slightly beyond the vein margins.
Silica, pyrite, fluorite, and chlorite are closely related to the mineralization.
Drilling
A total of 65 diamond drill holes have been completed on the GC property since 2001 totalling 23,546.34m. During 2008, Silvercorp completed 22 holes, 10,082.6m drilling program, which resulted in the discovery of an additional 15 mineralized veins. The drill hole collar, downhole survey and core recoveries are listed in Appendix VI and VII in AMC’s 2009 Technical Report. A program of surface drilling commenced in the last quarter of 2011 at a budget of $2.5 million. No results of the program were available at the time of the GC Report.
51
Sampling and Analysis
The drill core is logged initially at the drill site and the mineralized or favourably altered intervals are moved to the surface core shack where they are logged, photographed and sampled in detail. Samples are taken prepared by cutting the core in half with a diamond saw. One half of the core is returned to the core box for archival storage, the other half is placed in a labelled cotton bag with the sample number written on the bag. The bagged core sample is then shipped to the laboratory for assaying.
Individual samples from the drill core are from veins that range in width from 0.05m to 12.03m. The veins consist of either massive sulphides or sulphide-bearing materials and can be easily identified and separately sampled from non-mineralized wall rock. Mineralized veins intercepted by drill cores were sampled in 1.5m maximum intervals and the distances cut where warranted by apparent wallrock.
Core recoveries are determined by measuring the actual amount of core recovered versus the length of the drilled interval from which the core was obtained. Core recoveries (calculated as percentage) are documented in the log. In general, the recoveries range from acceptable to excellent; although the recoveries vary somewhat from vein to vein.
Samples appear to have no apparent sampling or recovery difficulties that would affect the reliability of results. The samples appear to be representative and results of check samples show no apparent evidence of sample bias. Rocks sampled trenches, tunnels or in drill core are sulphide-rich veins that follow structures (faults). These veins are easily identified because of their bright metallic sulphides and they can be sampled with little difficulty.
The angle of the vein to core is determined by using the vein to core angles and cross-sectional correlations to determine the dip of the veins. The apparent thickness is then corrected to true thickness using simple trigonometry.
Security of Samples
Drill core samples were taken from sawn half core for every 1.5m or limited by apparent wall rock and mineralization contact. Half of the core was sent to the laboratory for analysis and the other half retained for archive. The samples are individually secured in sample bags and then collectively secured in rice bags for shipment to the laboratory. Employees of Yangtze Mining collect and split the core for sampling. No officer or director of either Silvercorp or Yangtze Mining has contact with any of these samples prior to shipment to the laboratory.
The samples are shipped directly in security sealed bags to ALS Chemex in Guangzhou, China (Certification ISO 9001:2000), located approximately 180 km southeast of the GC property site.
The sample preparation consists of drying, crushing and splitting of the sample with a riffle splitter to 150g then pulverizing the sample to 200 mesh. Ag, Pb and Zn in drill core samples were analyzed by aqua regia digestion and AAS. The prepared sample is digested in aqua regia(HNO3-HCl). After cooling, the resulting solution is diluted with de-ionized water, mixed and then analysed by inductively coupled plasma-atomic emission spectrometry (ICP-AES). Detection ranges for this method are set out Table 4 below:
Table 4 Detection Limits, Aqua Regia / AAS
| | | | |
| Element | Symbol | Units | Lower Limit | Upper Limit |
| Silver | Ag | g/t | 1 | 1500 |
| Lead | Pb | % | 0.01 | 20 |
| Zinc | Zn | % | 0.01 | 60 |
52
Soil samples were analysed by aqua regia digestion and ME-ICP.
Tin was analysed by fusing with peroxide, then leaching the melt and acidifying to precipitate out the tin for AAS finish.
Check samples including field duplicates and sample rejects are routinely sent to Laboratory of the Henan Institute of Geological Survey (the “Henan Laboratory”), located in Zhengzhou, Henan Province, Central China. In the Henan Laboratory, lead, zinc, tin, and silver are all analysed with using AAS after a three-hour hot aqua regia digestion on a 30g split of the pulverized portion. A gravimetric finish is done on samples with silver values in excess of 1,500g/t. On samples containing more than 30% lead, an acid dissolution and titration is used to complete the analysis. Henan Laboratory’s lower detection limits are 3 g/t for silver, 0.03% for lead and zinc.
Silvercorp’s check procedures include (a) inserting purchased standards and blanks that were prepared by Yangtze Mining in the every 40-sample batches submitted to the ALS Chemex Laboratory on a regular basis, (b) submitting duplicate pulps to the ALS Chemex Laboratory on a regular basis, (c) submitting 1/4 core samples as sample duplicates to the ALS Chemex Laboratory for every 40-sample batches, and (d) submitting duplicate pulps to an independent external lab on an intermittent basis.
A total of 62 samples were taken for bulk density measurement. The tests were done using the wax-immersion method by Guangdong Material Test Centre, a Chinese government certified lab located in Guangzhou, Guangdong, China. Samples ranged in size from 470 to 2,690g. Based on a cutoff grade of 100g/t AgEq (no recoveries included), the results of 56 samples were used to calculate the average bulk density for each vein on the GC property. The average bulk density is determined to be 3.57t/m3. Note that one extreme high grade sample, returning a value of 5.51 t/m3and containing 2,793 g/t Ag, 53.04% Pb, 6.44% Zn was excluded from the overall bulk density calculation. Detailed bulk density sample data is listed in Appendix VI.
The average grades for these 56 samples are 176 g/t Ag, 1.99% Pb, and 4.47% Zn. In theory, bulk density is related positively to metal contents, especially lead and zinc. However, bulk density is sometimes high in low grade material if the pyrite content is high and it is noted that the GC deposit is rich in pyrite.
Mineral Resource and Mineral Reserve Estimates
The mineral resource categories used the GC Report are those established by the Canadian Institute of Mining, Metallurgy and Petroleum (CIM) in the CIM Standards on Mineral Resources and Reserves, Definitions and Guidelines (CIM Standards) as adopted by the CIM Council dated December 2005.
Mineralization in the GC project consists of narrow vein type deposits which occur as discrete planes of variable grade and variable thickness. The resources were outlined using polygonal methods on longitudinal sections constructed for each vein. The resource estimates reported herein were prepared using such methods by Mr. Wang Qiang, Chief Geologist of Yangtze, and Mr. Myles J. Gao, P.Geo, President & Chief Operating Officer of Silvercorp, who is a Qualified Person, as defined by NI 43-101. B O’Connor of AMC has reviewed Silvercorp’s methodologies and data used to prepare the resource estimates and is satisfied that they comply with reasonable industry practice, subject to a qualification with respect to use of the polygonal method. Although this is a common estimation method in China and its use by Silvercorp therefore accords with common industry practice in that country, the technique tends to produce estimates that are higher in grade and lower in tonnage than methods in common use in Canada, such as kriging or inverse distance weighting.
53
Following is an explanation with comments regarding the parameters and assumptions used to prepare the resource estimations reported in the GC Report:
A polygonal block model was used in this resource estimation.
The polygonal block model utilizes detailed long-sections constructed for each of the veins. The topographic control for these sections is taken from 1:2,000 topographic map.
Polygonal resource blocks drawn on long-sections of the vein were constructed, and their areas measured, using MapGIS, a MapInfo-like GIS software application widely used in China.
Sulphide resources are estimated using only the assays obtained from drilling and historical tunnelling. A small portion of samples (41 assays) from 17 surface trenches were used for the oxide block resource estimates. Channel samples from tunnels were taken by GIGS from 2003 to 2005. Yangtze Mining performed a check by re-sampling the channels and found the GIGS results were reliable.
The minimum cut-off thickness used for mineralization is 0.20m. Although this is relatively narrow, the resue mining method employed by Silvercorp at the mine makes it feasible to extract veins of this thickness. Also, only around 5% of resource blocks have a thickness between 0.2m and 0,3m (the mineral reserve minimum mining width and Silvercorp has experience at mining to such widths).
The veins are polymetallic containing several payable metals. Although contents of each of the payable metals are separately reported in the resource estimations, Silvercorp uses a “recovered equivalent-silver” (AgEq Recovered) value to assess and compare the vein resources. The formula and metal prices / metallurgical recoveries used are the same as those used for the mineral reserves and are shown in Section 15.3 of the GC Report.
Potentially payable tin and sulphur concentrates have not been included in the silver equivalent calculation.
Refinery costs have not been included in the silver equivalent calculation.
Metal prices used in the GC Report are the median prices from selected technical reports on similar deposit types filed on SEDAR between November 2008 and April 2009 (see footnote).
A top-cut has been applied to silver, zinc, and lead assays. Values of the top-cuts for each of the veins and commodities are listed in Table 5.
Table 5 Top-cuts of different veins
| | | | | | |
| | | | | No. of Assays Exceeding |
| Vein # | | Top cuts | | | Top-cuts | |
| | Ag (g/t) | Pb (%) | Zn (%) | Ag | Pb | Zn |
| V2 | 968 | 10.94 | 22.30 | 1 | 2 | 0 |
| V2-0 | 660 | 9.96 | 18.89 | 0 | 1 | 0 |
| V2-1 | 697 | 3.59 | 9.93 | 1 | 0 | 0 |
| V2-2 | 421 | 5.92 | 18.03 | 1 | 0 | 0 |
| V3 | 1318 | 40.30 | 36.56 | 1 | 0 | 0 |
| V4 | 1444 | 6.49 | 14.43 | 0 | 0 | 0 |
| V5 | 1453 | 8.28 | 21.53 | 0 | 0 | 0 |
| V5-1 | 472 | 3.49 | 14.03 | 0 | 0 | 1 |
| V6 | 840 | 5.32 | 19.17 | 1 | 0 | 1 |
54
| | | | | | |
| | | | | No. of Assays Exceeding |
| Vein # | | Top cuts | | | Top-cuts | |
| | Ag (g/t) | Pb (%) | Zn (%) | Ag | Pb | Zn |
| V6-0 | 1123 | 11.80 | 15.33 | 0 | 0 | 0 |
| V7 | 419 | 6.71 | 20.88 | 0 | 1 | 0 |
| V7-0 | 678 | 5.56 | 21.93 | 0 | 1 | 0 |
| V7-1 | 483 | 5.42 | 16.75 | 1 | 0 | 0 |
| V8 | 669 | 14.88 | 4.25 | 0 | 0 | 0 |
| V8-0 | 3329 | 0.78 | 1.85 | 0 | 0 | 0 |
| V8-1 | 1314 | 5.13 | 3.33 | 0 | 0 | 0 |
| V9 | 675 | 7.54 | 23.91 | 0 | 0 | 0 |
| V9-0 | 353 | 12.89 | 17.50 | 0 | 0 | 0 |
| V9-1 | 927 | 14.30 | 25.74 | 0 | 0 | 0 |
| V10 | 1116 | 10.77 | 8.34 | 0 | 0 | 1 |
| V10-1 | 475 | 7.29 | 44.44 | 1 | 2 | 0 |
| V11 | 790 | 5.66 | 20.17 | 0 | 0 | 0 |
| V13 | 781 | 5.84 | 13.83 | 0 | 0 | 0 |
| V14 | 472 | 19.51 | 9.37 | 0 | 0 | 0 |
| V15 | 396 | 3.53 | 4.69 | 0 | 0 | 0 |
| V15-1 | 2107 | 12.32 | 12.88 | 0 | 0 | 0 |
| Total | | | | 7 | 7 | 3 |
No dilution has been applied with the exception of the 11 individual resource block occurrences below 0.20m in horizontal width in the dataset used for the resource estimate. Those 11 occurrences were diluted at zero grade to 0.20m in horizontal width.
Any interpolations are based upon vein thickness and grade.
The wall rock surrounding the veins is in sharp contact with the veins and commonly silicified.
The data and methods employed are adequate to allow resources to be categorized as Measured, Indicated and Inferred.
Resource blocks categorized as “Measured” are defined by assays from tunnel samples on vein and drill holes samples. These blocks are projected up to 25m above and below a given tunnel where warranted, and along strike from a given tunnel intersection or projected from a drill hole intercept within 50m of a tunnel sample.
Resource blocks categorized as “Indicated” begin either above or below a Measured Resource block or are projected from a drill intercept. For blocks projected from the Measured Resource blocks, the distances are not greater than 50m. For blocks projected from drill holes, the distances are not greater than 50 to 60m. Block boundaries are defined as the midpoint between drill holes.
Resource blocks categorized as “Inferred” use grades and thicknesses derived from the average of all the Measured and Indicated blocks along the vein. For veins intersected by deep holes, the Inferred Resource blocks are projected 100m down-dip from the Indicated blocks.
55
Resource Estimates
The Ag-Zn-Pb metals are reported separately in the resource estimates (see Table 6). The resources at a cut-off grade of 150 AgEq Recovered are also shown to enable a comparison with the June 2009 resources (see Table 6.5 in Section 6 in the GC Report). The reduction in cut-off grade from 150 g/t to 100 g/t AgEq Recovered arises from the application of updated metal prices and metallurgical recoveries. Mineral resources that are not mineral reserves do not have demonstrated economic viability.
Table 6 Mineral Resources at 100g/t and 150 g/t Recovered Silver Equivalent Cut-off Grades
| | | | |
| Measured and Indicated Resources | Tonnes | Ag (g) | Pb % | Zn % |
| 100g/t Recovered AgEq Cut-off | 7,632,000 | 122 | 1.32 | 3.08 |
| 150g/t Recovered AgEq Cut-off | 5,812,400 | 144 | 1.50 | 3.50 |
Rounding of some figures may lead to minor discrepancies in some totals
The estimated mineral resources for the 26 veins of the GC project are summarized in the following Table 7 using the 100 g/t AgEq Recovered cut-off. Note the subtotals have been rounded and may not sum to the totals due to the rounding.
Table 7 Mineral Resources 100g/t Recovered Silver Equivalent Cut-off Grade
| | | | | | | |
Resource
Classification | Tonnes | | Grade | | Contained Metal |
| | | Ag (g/t) | Pb % | Zn % | Ag (kg) | Pb (t) | Zn (t) |
| Measured | 592,800 | 230 | 1.41 | 3.33 | 136,600 | 8,400 | 19,800 |
| Indicated | 7,038,700 | 113 | 1.31 | 3.06 | 797,700 | 92,500 | 215,500 |
| Total | 7,631,500 | 122 | 1.32 | 3.08 | 934,300 | 100,900 | 235,300 |
| Inferred | 7,959,800 | 123 | 1.41 | 2.66 | 976,800 | 112,500 | 211,900 |
Metal prices used: silver US$18.00/troy oz, lead US$1.00/lb, zinc US$1.00/lb
Inclusive of resources converted to mineral reserves
Lower cut-off grade, 100 g/t AgEq Recovered
Rounding of some figures may lead to minor discrepancies in some totals
The differences between the 2011 mineral resources and the 2009 mineral resources are due to updated metal prices and metallurgical recoveries and to a lower cut-off grade in 2011.
Mineral Reserve Estimates
The mineral reserve estimates are the conversion of the mineral resource estimates above a nominated cut-off after applying mining modifying factors such as dilution and losses.
Mineral reserve estimates are based on employing highly-selective stoping methods.
The resource footprint area is approximately 1.2 km west-east and 0.6 km south-north.
Resource Extraction Limits
The underground lease boundary limit for regulatory resource extraction is summarized in Table 8 and is valid for a 30 year term. AMC’s review confirms the mine design is well within the underground extraction limits. The surface mining-lease rights boundaries are negotiated with the various land owners and Silvercorp surface plans show these to cover the appropriate mining areas.
56
Table 8 Resource Extraction Boundary Limits
| | |
| Boundary Point | Easting | Northing |
| 1 | 2,536,958.82 | 37,591,830.45 |
| 2 | 2,536,977.34 | 37,594,822.59 |
| 3 | 2,535,131.42 | 37,594,834.19 |
| 4 | 2,535,112.90 | 37,591,841.69 |
| Depth | -540 mRL |
Cut-off
The mineral reserve has been estimated using a 135 g/t AgEq Recovered cut-off grade, which is equivalent to the operating breakeven. The basis for this is summarized in Table 9. The cut-off used is specified by the following.
| |
| Cut-off grade AgEq (g/t) | = (mining cost |
| | + milling cost |
| + sustaining capital |
| + environmental cost |
| | + G&A cost + selling cost) / (Ag recovery * Ag price) |
Table 9 Mineral Reserve Cut-off Estimate
| | |
| Cut-off Estimate | Unit | Unit Value |
| Foreign Exchange Rate | RMB:US$ | 6.35 |
| Contract Development Cost | US$/t-ore | 12.13 |
| Contract Stoping Cost | US$/t-ore | 7.04 |
| Silvercorp Mine Labour Cost | US$/t-ore | 2.04 |
| Mine Sustaining Capital Cost | US$/t-ore | 0.52 |
| Process Cost | US$/t-ore | 17.83 |
| Process Sustaining Capital Cost | US$/t-ore | 0.72 |
| Tailings & Environmental Cost | US$/t-ore | 0.50 |
| G&A and Product Selling Cost | US$/t-ore | 8.32 |
| Total Costs | US$/t-ore | 49.10 |
| Ag Metal Price | US$/oz | 18.00 |
| Ag Metal Price | US$/gm | 0.58 |
| Ag Recovery (payable) | % | 62.78 |
| Revenue (after recovery) | US$/gm | 0.36 |
| AgEq Cut-off (recovered) | AgEq | 135.1 |
Note: ^ For equipment replacement and/or refurbishment cost only.
Vein development that occurs within the mineral reserve is subjected to 45 g/t AgEq Recovered cut-off to categorize the vein development as either vein ore or vein waste. Vein waste is assigned zero grade. The development cut-off is based on RMB113.56/t-ore process cost, US$12.00/oz silver metal and RMB to US$ exchange rate of 6.45 to 1.00 (February 2011 assumptions).
The derivation for the AgEq Recovered is described in the following.
57
AgEq Recovered = {Ag (g/t) * Ag ($/gm) * Ag (Rec%)} / Ag ($/gm) + {Pb (%) * Pb ($/lb) * Pb (Rec%) * 22.0462} / Ag ($/gm) + {Zn (%) * Zn ($/lb) * Zn (Rec%) * 22.0462} / Ag ($/gm)
The metal prices used for the AgEq Recovered grade estimate are:
Ag – US$18.00/troy oz
Pb – US$1.00/lb
Zn – US$1.00/lb
The recoveries used for the AgEq cut-off are:
Ag – 62.78%
Pb – 84.57%
Zn – 88.42%
The unit conversions used are:
1 troy oz = 31.1035 gm
1 tonne = 2204.62 lb
1 US$ = 6.45 RMB
Bulk Density
Resource estimates use a bulk density of 3.57t/m3which is assumed constant for all veins and areas and is also assumed to not be oxidized. AMC notes that the grade and relative distribution of the three key payable elements; Ag, Pb and Zn, can vary significantly (>10%) from vein to vein, but does not consider the potential impact of varying grade on density to be material (<5%) on the resource tonnage estimates. Waste density is 2.64t/m3.
Mine Dilution and Losses
The minimum stoping extraction and mining widths are:
AMC’s review of dilution, operational losses and mining width is summarized by mine method in Minimum stoping extraction widths are 0.3 m and 0.8 m respectively for resuing and shrinkage; minimum mining widths are 0.8 m for both methods. Unplanned dilution has been applied to the actual extraction width for resuing (resource grades already factored to 0.3 m minimum mining width) and to the greater of 0.8 m or actual mining width for shrinkage.
AMC has calculated unplanned dilution based on 0.1 m of waste break on each wall of a resued vein, and 0.15 m of waste break outside the design mining width of a shrinkage stope. A key strategy used at Ying for minimizing floor dilution is the placement of rubber mats and/or conveyor belting over the waste fill floor in resuing stopes immediately before each resuing blast. This effectively serves as a barrier between ore and waste.
The dilution calculation process used for the reserves assumes that the resulting figures represent the overall tonnes and grade delivery to surface. There is a small degree of waste hand sorting, and therefore
58
upgrading, that occurs underground, depending on the mine and mining method. AMC considers that the resulting impact of this hand-sorting on the delivered product is not significant enough to be material.
Table 10 summarizes dilution factors used in the reserve calculations for each of the Ying mines. The lower percentages for shrinkage stoping are a reflection of mining wider veins.
Table 10 Average Dilution by Mine and Method
| | |
| Mine | Dilution % |
| Resuing | Shrinkage |
| HPG | 37 | 28 |
| HZG | 33 | |
| LM | 40 | 23 |
| TLP | 56 | 29 |
| SGX | 43 | 32 |
| Total Ying | 41 | 28 |
Mining Recovery Factors
Mining recovery estimates used in the reserve calculations are based on experience at each of the Ying operations and for each mining method. For resuing stopes, 95% total recovery is assumed; for shrinkage stopes, 92% total recovery is assumed. Minimal pillars are anticipated to remain between adjacent mining blocks in the same vein and partial recovery is anticipated in sill pillars. A 70% recovery factor is applied to irregular ore blocks in remnant areas mined by local miners prior to Silvercorp acquiring the Ying properties.
Mineral Reserve Estimate
To convert mineral resources to mineral reserves, Silvercorp uses the following procedures:
| 1. | Selection of Measured and Indicated Resource polygons for which the average AgEq grade is greater than the mine cut-off AgEq grade |
| | |
| 2. | Application of minimum extraction and mining width criteria and calculation of dilution at zero grade |
| | |
| 3. | Estimation of mineral reserve potential by applying relevant mining loss factors |
| | |
| 4. | Confirmation as mining reserve by considering any other significant cost factors such as additional waste development required to gain access to the block in question |
Table 11 summarizes the reserve estimates for each Ying mine and for the Ying operation as a whole. Approximately 27% of the mineral reserve estimate tonnage is categorized as Proven and approximately 73% is categorized as Probable. Dilution and recovery are stated as the percentage of the mineable in situ ore tonnes. AMC considers the dilution estimates to be reasonable and commensurate with the stoping methods, which is also assisted by selective hand sorting of waste from ore, a practice conducted at Silvercorp’s Ying Mine, and also proposed at the GC mine.
Table 11 Mine Width, Dilution and Recovery by Stope Method
| | |
| Mine Method | Shrinkage | Resue |
| Mine Width (m) ^ | 4.0 | 0.8 |
59
| | |
| Mine Dilution (%) | 10.3 | 25.0 |
| Mine Recovery (%) | 90.0 | 88.1 |
Note: ^ Average for life-of-mine.
Mineral Reserve Estimate
Table 12 summarizes the mineral reserve estimate from the scheduled mine plan. Approximately 10% of the mineral reserve estimate is categorized as Proven and approximately 88% is categorized as stope extraction with the remainder being development extraction.
The conversion of mineral resource to mineral reserve is described in the following.
Mineral Reserve = {Mineral Resource x Recovery %} / {1 + Dilution %}
Table 12 Mineral Reserve Summary
| | | | | | | | | |
| Category | Mineral
Reserve (t) | Ag
(g/t) | Pb
(%) | Zn
(%) | Ag (kg) | Pb (t) | Zn (t) | AgEq
(g/t)* | Percent
by
Tonnes |
By Reserve
Category | | | | | | | | | |
| Proven | 463,976 | 199 | 1.12 | 3.18 | 92,315 | 5,183 | 14,753 | 268 | 10% |
| Probable | 4,285,689 | 113 | 1.33 | 2.93 | 482,432 | 56,906 | 125,481 | 212 | 90% |
Proven +
Probable# | 4,749,665 | 121 | 1.31 | 2.95 | 574,747 | 62,089 | 140,234 | 218 | 100% |
| By Level | | | | | | | | | |
| +50mRL | 716,614 | 136 | 1.28 | 2.74 | 97,261 | 9,165 | 19,638 | 219 | 15% |
| 0mRL | 889,408 | 126 | 1.22 | 3.04 | 111,706 | 10,824 | 27,039 | 220 | 19% |
| -50mRL | 877,557 | 128 | 1.11 | 2.68 | 112,259 | 9,786 | 23,486 | 206 | 18% |
| -100mRL | 588,095 | 97 | 1.19 | 2.45 | 57,046 | 7,018 | 14,405 | 182 | 12% |
| -150mRL | 452,724 | 119 | 1.58 | 2.85 | 54,009 | 7,171 | 12,902 | 222 | 10% |
| -200mRL | 491,922 | 122 | 1.66 | 3.65 | 60,112 | 8,148 | 17,970 | 253 | 10% |
| -250mRL | 359,349 | 119 | 1.51 | 3.40 | 42,767 | 5,407 | 12,217 | 238 | 8% |
| -300mRL | 373,996 | 106 | 1.22 | 3.36 | 39,587 | 4,570 | 12,577 | 219 | 8% |
| All Levels | 4,749,665 | 121 | 1.31 | 2.95 | 574,747 | 62,089 | 140,234 | 218 | 100% |
| By Vein | | | | | | | | | |
| V2 | 2,389,960 | 144 | 1.32 | 3.20 | 343,420 | 31,477 | 76,506 | 240 | 50.3% |
| V2-0 | 104,348 | 104 | 2.05 | 2.40 | 10,809 | 2,143 | 2,501 | 212 | 2.2% |
| V2-1 | 255,518 | 98 | 0.74 | 2.23 | 25,028 | 1,889 | 5,710 | 161 | 5.4% |
| V2-2 | 104,776 | 59 | 1.49 | 4.39 | 6,209 | 1,558 | 4,600 | 233 | 2.2% |
| V5 | 71,210 | 99 | 0.76 | 2.79 | 7,077 | 543 | 1,984 | 181 | 1.5% |
| V5-1 | 40,876 | 126 | 0.99 | 2.98 | 5,133 | 403 | 1,220 | 211 | 0.9% |
| V6 | 88,584 | 72 | 1.58 | 2.39 | 6,409 | 1,404 | 2,114 | 177 | 1.9% |
| V6-0 | 182,969 | 183 | 2.09 | 2.04 | 33,399 | 3,827 | 3,728 | 251 | 3.9% |
| V7 | 285,166 | 52 | 0.88 | 3.44 | 14,723 | 2,505 | 9,816 | 177 | 6.0% |
| V7-0 | 172,733 | 63 | 0.60 | 2.91 | 10,892 | 1,034 | 5,026 | 157 | 3.6% |
| V7-1 | 131,039 | 103 | 0.83 | 2.62 | 13,499 | 1,087 | 3,438 | 180 | 2.8% |
| | | | | | | | | | |
60
| | | | | | | | | |
| Category | Mineral
Reserve (t) | Ag
(g/t) | Pb
(%) | Zn
(%) | Ag (kg) | Pb (t) | Zn (t) | AgEq
(g/t)* | Percent
by
Tonnes |
| V8 | 44,932 | 88 | 2.90 | 1.00 | 3,934 | 1,304 | 449 | 182 | 0.9% |
| V8-0 | 12,288 | 293 | 0.07 | 0.16 | 3,596 | 8 | 20 | 191 | 0.3% |
| V9 | 313,307 | 77 | 1.15 | 2.62 | 23,984 | 3,611 | 8,212 | 173 | 6.6% |
| V9-0 | 46,439 | 127 | 3.32 | 2.75 | 5,875 | 1,542 | 1,278 | 279 | 1.0% |
| V9-1 | 90,093 | 84 | 1.27 | 3.36 | 7,549 | 1,141 | 3,028 | 207 | 1.9% |
| V10 | 177,804 | 223 | 2.26 | 2.22 | 39,691 | 4,022 | 3,953 | 288 | 3.7% |
| V10-1 | 76,387 | 45 | 0.87 | 4.43 | 3,436 | 664 | 3,383 | 205 | 1.6% |
| V11 | 30,338 | 17 | 0.39 | 4.00 | 506 | 117 | 1,213 | 158 | 0.6% |
| V13 | 80,846 | 84 | 0.79 | 1.86 | 6,779 | 639 | 1,507 | 141 | 1.7% |
| V14 | 50,052 | 56 | 2.34 | 1.09 | 2,799 | 1,171 | 548 | 147 | 1.1% |
| All Veins | 4,749,665 | 121 | 1.31 | 2.95 | 574,747 | 62,089 | 140,234 | 218 | 100% |
By Stope
Method | | | | | | | | | |
| Shrinkage | 4,295,122 | 125 | 1.33 | 2.97 | 537,829 | 56,917 | 127,455 | 221 | 90% |
| Resuing | 454,543 | 81 | 1.14 | 2.81 | 36,918 | 5,172 | 12,779 | 182 | 10% |
| All Methods | 4,749,665 | 121 | 1.31 | 2.95 | 574,747 | 62,089 | 140,234 | 218 | 100% |
Notes:
1) AgEq (g/t) is the recovered silver equivalent. # 135g/t AgEq cut-off for Stope Reserves & 45g/t AgEq for Development Reserves.
2) Rounding of some figures may lead to minor discrepancies in some totals
Mining Operations
As set out in the GC Report, mining will be conducted in two stages. The stages are generally subdivided as follows:
| 1. | Stage 1 - +100 mRL to -50 mRL between local Mine Sections 10 to 36 for development and 12 to 32 for production. West side of project. |
| 2. | Stage 2 - +100 mRL to -50 mRL between Mine Sections 36 to 54 for development and 32 to 54 for production. For -50m RL to -300 mRL between Mine Sections 12 to 50 for both development and production. |
Stage 1 targets fast-tracking the project into production and is developed by mobile rubber-tired diesel-powered equipment (development jumbo, loader and truck) with surface decline access down to -50 mRL. Stage 2 is developed using conventional tracked equipment (electric locomotive, rail cars, electric rocker shovels and pneumatic hand held drills) with shaft access from -50mRL down to -300 mRL. Selective stoping methods such as Shrinkage and Resue are employed with stope production drilling conducted with pneumatic jackleg drilling. In-stope rock movement will be by gravity to draw points or hand-carting to steel lined passes.
Stage 1 production mucking uses load-haul-dump loaders (LHD) with trucks hauling ore to the surface ROM stockpile. Ore is re-handled from the ROM stockpile to the primary crusher feed bin using a ROM front-end-loader (FEL). Stage 2 production mucking uses electric-powered over-throw rail loaders with rail cars and electric locomotives transporting ore to the Main Shaft ore pass. Ore is skip hoisted to surface and conveyed to the surface crusher feed bin.
61
Production Rate
Mine operations will be conducted 365 days of the year but mine production is scheduled on the basis of 330 days per year at approximately 1,500 tpd for approximately 496 ktpa for the first eight years, rising to approximately 1,570 tpd for approximately 518 ktpa for the last four years. The production life is estimated to be 12 years.
Production is expected to be approximately 80 tonnes per day per stope for Shrinkage stopes and 75 tonnes per day per stope for Resue stopes with production per level capped at approximately 25% of the available stopes and up to 20 stopes concurrently over all active levels.
The production rate from each stope is dependent on the vein width, and as such, the production rate and schedule assumes a balance of wide and narrow vein stopes (generally Shrinkage and Resue respectively).
AMC’s high-level review indicates a mineral resource endowment of 12,829 tonnes per vertical metre equating to a vertical advance rate of approximately 42m per year which is within industry performance for like operations.
Mining Methods
Shrinkage stoping and Resue stoping will be the methods employed. To confirm AMC’s understanding of Silvercorp’s application of the stoping methods and also their suitability for the GC mine environment, AMC observed the application of these stoping methods at Silvercorp’s Ying mine operation during May 2011. The Ying mine is located in Luoning County, in the Henan Province, about 10 km South-East of Xiayu and about 60 km South-East of Luoning.
Mine Development
The mine design is based on the mineral resources above a 150 g/t AgEq Recovered with the addition of vein exploration development (which in some part, is also used for stope access). Vein exploration development is categorized as development that occurs outside of the mineral resource categorization. Vein exploration development is reported as development waste and assigned zero grade irrespective of its resource grade. Vein exploration development represents approximately 51% of the total 44.7 km of vein development in the mine plan.
The mine levels will be placed at 50m vertical intervals. Levels will be graded at 0.3% from either the Ramp or Main Shaft access however the mine design provided does not incorporate this feature. AMC does not consider this to be material with respect to estimates for development quantities.
The Hashui Creek diversion tunnel will be developed concurrently from both ends and will be completed early in Stage 1 prior to production commencing.
Market Studies and Contracts
With respect to copper, testwork has so far been unsuccessful in producing a saleable copper concentrate, but copper levels in the ore are low and this is not a material issue for concentrate quality.
In the case of zinc, this is an issue of economic optimization with current silver prices indicating that a lower lead grade (35-40% Pb) concentrate (with higher zinc and silver levels) should be targeted to maximize payable silver recovery to the lead concentrate. This should not pose a problem with concentrate marketing.
62
With respect to the lead and zinc concentrates, AMC has also been advised that the renewed smelter contracts allow up to 1% As before penalties apply which allays AMC’s previous concerns about their marketability.
Smelter Contracts
Initial sales contracts were in place for the lead and pyrite concentrates with Jinan Wanyang Smelting (Group) Co., Ltd and for the zinc concentrate with Henan Yuguang Zinc Industry Co., Ltd. AMC has been advised by Silvercorp that all three contracts have been renewed with a three year term to December 31, 2014, with identical terms to the initial ones apart from the arsenic penalties. All three contracts have freight and related expenses to the smelting company’s account.
Economic Analysis
The economic analysis in this section is based on the following key assumptions:
| | | The mine production schedule developed in Section 16 of the GC Report quickly ramps up to around 500,000 tpa. |
| | | | |
| | | The subsequent mill production schedule to match mine output at a nominal 500,000tpa throughput rate with generous ROM stockpile allowances in the early years to handle any mine development delays and still protect the metal outputs |
| | | | |
| | | Mine development and mill construction take place during 2011 - 2012 with commercial production in 2013. The absolute dates will require adjustment but the relative timing remains valid. |
| | | | |
| | | Recoveries as detailed in Section 13 in the GC Report, and set out below: |
| | | |
| | | o | Ag (to lead concentrate only, not payable in zinc concentrate): 62.8% |
| | | |
| | | o | Pb: 84.7% |
| | | |
| | | o | Zn: 88.2% |
| | | |
| | | o | S: 61.3% |
| | | |
| | | Metal prices as set out in Table 13. |
Table 13 Metal Prices
| | | | | |
| | 2012 | 2013 | 2014 | 2015 | After 2015 |
| Silver (US$/oz) | 40.00 | 30.00 | 25.00 | 18.00 | 18.00 |
| Lead (US$/lb) | 1.11 | 1.16 | 1.14 | 1.15 | 1.00 |
| Zinc (US$/lb) | 1.05 | 1.12 | 1.11 | 1.15 | 1.00 |
Foreign exchange rate was set at the November 2011 value of USD:RMB of 6.35 (Silvercorp had previously advised 6.50 but AMC has updated this with the most recent value in line with the gradually appreciating trend)
Capital and operating costs as estimated in Section 21 of the GC Report.
Key Metrics
Table 14 shows the critical input and output metrics for the GC project including the annual production schedule and the estimated cash flow and key pre-tax economic parameters.
63
Table 14 Project Production Schedule and Cash Flow (Pre-Tax)
| | | | | | | | | | | | | | |
| Base Case | | Total | 2011 | 2012 | 2013 | 2014 | 2015 | 2016 | 2017 | 2018 | 2019 | 2020 | 2021 | 2022 |
| Mine Output | | | | | | | | | | | | | |
| | T | 4,749,665 | 0 | 91,799 | 484,547 | 472,387 | 395,153 | 487,570 | 524,317 | 525,385 | 525,005 | 526,510 | 520,672 | 196,319 |
| Mill Feed | | | | | | | | | | | | | |
| | T | 4,749,665 | | | 450,000 | 475,000 | 500,000 | 500,000 | 500,000 | 500,000 | 500,000 | 500,000 | 500,000 | 324,665 |
| | Ag/g/t | 121 | | | 163 | 152 | 124 | 110 | 121 | 120 | 112 | 110 | 99 | 94 |
| | %Pb | 1.31 | | | 1.00 | 1.15 | 1.31 | 1.42 | 1.50 | 1.35 | 1.38 | 1.31 | 1.36 | 1.22 |
| | %Zn | 2.95 | | | 2.96 | 2.86 | 2.62 | 3.02 | 3.08 | 2.76 | 3.25 | 3.03 | 2.97 | 2.98 |
| (notional) | %S | 9.13 | | | 9.13 | 9.13 | 9.13 | 9.13 | 9.13 | 9.13 | 9.13 | 9.13 | 9.13 | 9.13 |
| Concentrate Production | | | | | | | | | | | | | |
| Pb Conc | T | 113,404 | | | 8245 | 9979 | 11942 | 12973 | 13692 | 12315 | 12581 | 11962 | 12460 | 7255 |
| | Ag g/t | | | | 5586 | 4555 | 3257 | 2673 | 2782 | 3054 | 2802 | 2886 | 2492 | 2644 |
| | Ag % payable | | | | 92.0 | 91.5 | 90.0 | 89.5 | 89.5 | 90.0 | 89.5 | 89.5 | 89.0 | 89.5 |
| | % Pb | | | | 46.35 | 46.35 | 46.35 | 46.35 | 46.35 | 46.35 | 46.35 | 46.35 | 46.35 | 46.35 |
| | % Zn | | | | 12.5 | 10.5 | 8.5 | 9.0 | 8.7 | 8.7 | 10.0 | 9.8 | 9.2 | 10.3 |
| Zn Conc | T | 252,760 | | | 24027 | 24503 | 23657 | 27206 | 27756 | 24834 | 29285 | 27292 | 26754 | 17446 |
| | % Pb | | | | 0.70 | 0.83 | 1.03 | 0.97 | 1.01 | 1.01 | 0.88 | 0.90 | 0.95 | 0.85 |
| | % Zn | | | | 48.95 | 48.95 | 48.95 | 48.95 | 48.95 | 48.95 | 48.95 | 48.95 | 48.95 | 48.95 |
| Py Conc | T | 625,276 | | | 59241 | 62532 | 65823 | 65823 | 65823 | 65823 | 65823 | 65823 | 65823 | 42741 |
| | %S | | | | 42.52 | 42.52 | 42.52 | 42.52 | 42.52 | 42.52 | 42.52 | 42.52 | 42.52 | 42.52 |
| Recovered Metals | | | | | | | | | | | | | |
| | koz Ag | 11,600 | | | 1481 | 1462 | 1251 | 1115 | 1225 | 1209 | 1133 | 1110 | 998 | 617 |
| | T Pb | 52,563 | | | 3822 | 4625 | 5535 | 6013 | 6346 | 5708 | 5831 | 5544 | 5775 | 3363 |
| | T Zn | 123,726 | | | 11761 | 11994 | 11580 | 13317 | 13587 | 12156 | 14335 | 13360 | 13096 | 8540 |
| | T S | 265,867 | | | 25189 | 26589 | 27988 | 27988 | 27988 | 27988 | 27988 | 27988 | 27988 | 18173 |
Continued on next page64
| | | | | | | | | | | | | | |
| Base Case | Total | 2011 | 2012 | 2013 | 2014 | 2015 | 2016 | 2017 | 2018 | 2019 | 2020 | 2021 | 2022 |
| Revenue | | | | | | | | | | | | | | |
| (US$000) | Ag | 186,010 | | | 35540 | 29072 | 17618 | 15616 | 17157 | 17035 | 15879 | 15550 | 13904 | 8641 |
| | Pb | 89,655 | | | 7399 | 8778 | 10611 | 9798 | 10341 | 9301 | 9502 | 9034 | 9411 | 5479 |
| | Zn | 157,650 | | | 16878 | 16982 | 17283 | 16047 | 16371 | 14648 | 17273 | 16098 | 15780 | 10290 |
| | S | 12,449 | | | 1179 | 1245 | 1310 | 1310 | 1310 | 1310 | 1310 | 1310 | 1310 | 851 |
| | Total | 445,764 | | | 60996 | 56077 | 46822 | 42772 | 45179 | 42294 | 43965 | 41993 | 40405 | 25261 |
| Operating Costs US$000 | | | | | | | | | | | | | |
| Mine | 72,150 | All Operating
Costs Capitalized | 9022 | 5969 | 6138 | 7881 | 8586 | 8658 | 9148 | 7622 | 7519 | 1608 |
| Mill | 79,530 | 6745 | 7245 | 7771 | 7981 | 8198 | 8421 | 8650 | 8887 | 9133 | 6499 |
| | | | | | | | | | | | | |
| Other | 40,682 | 4833 | 4321 | 4152 | 3811 | 3964 | 4073 | 4368 | 4018 | 3883 | 3260 |
| | | | | | | | | | | | | |
| Taxes | 16,493 | 2257 | 2075 | 1732 | 1583 | 1672 | 1565 | 1627 | 1554 | 1495 | 935 |
| Total Costs (US$M000) | 208,855 | 22857 | 19609 | 19793 | 21255 | 22419 | 22717 | 23792 | 22080 | 22030 | 12302 |
| Operating Cash Flow | | | | | | | | | | | | | |
| (US$000) | 236,909 | 0 | 0 | 38139 | 36468 | 27029 | 21516 | 22760 | 19577 | 20172 | 19913 | 18376 | 12959 |
| Capital Costs US$000 | | | | | | | | | | | | | |
| Total Capital | 92,673 | 5,639 | 61,713 | 11,839 | 5,071 | 2,986 | 1,991 | 2,622 | 1,688 | 1,657 | 2,230 | 847 | -5,610 |
| Project Cash Flow | | | | | | | | | | | | | |
| (US$000) | | | | | | | | | | | | | |
| | | 144,236 | -5639 | -61713 | 26300 | 31397 | 24043 | 19525 | 20138 | 17889 | 18516 | 17682 | 17529 | 18569 |
| Cumulative Cash Flow | | -5639 | -67352 | -41052 | -9655 | 14387 | 33913 | 54051 | 71940 | 90455 | 108138 | 125667 | 144236 |
| NPV (8%) | $73,712.36 | | | | | | | | | | | | |
| IRR | 32.74% | | | | | | | | | | | | |
| Project | | | | | | | | | | | | | |
| Payback yrs | 2.40 | | | | | | | | | | | | |
65
Note that the Base Case pre-tax economic model shows an NPV of $73.7M using a discount factor of 8%, considered by AMC to be a typical discount factor for a base-metals project. The IRR is 33% and the payback period is 2.4 years.
Taxes and Royalties
Metal prices originally supplied by Silvercorp were net of VAT (17% gross partially offset with a nominal 2% credit for goods purchased) and this has been retained in the economic analysis.
A City Tax equivalent to 10% of the VAT has been applied. A Resource Compensation tax of 2% of revenue (after VAT) has been applied; equivalent to a royalty.
No additional income or corporate taxes have been applied and therefore no depreciation schedule has been developed.
Cash Flow Forecast
As set out in the GC Report, the weighted average economic returns for the GC project are estimated to be:
| | | |
| | • | NPV (at 8% discount) | $52.950M |
| • | IRR(%) | 28% |
| • | Payback (years) | 3.3 |
These probability-weighted average metrics are positive and demonstrate that the project is robust in the face of the possible scenarios that typically impact on a mining operation.
Exploration and Development
As set out in the GC Report, the following tasks are planned: (stated costs are estimated for those recommendations not covered by operational activities).
Undertake variography studies to refine the understanding of the grade distribution and utilize a kriging or inverse distance weighting approach to grade interpolation prior to future resource and reserve estimations
Collect additional detailed geotechnical for mining purposes
Undertake geotechnical investigations of proposed shaft locations
Undertake further hydrogeological assessments. Estimated cost $75,000.
Undertake further investigation of in situ stresses to confirm assumptions made in the mine design and stability assessments.
Install an additional 600 kW of grinding power to address the under-sizing of the comminution circuit. Estimated cost $500,000 installed and this has already been included in the capital cost estimate as it is deemed essential.
Give consideration to a small increase in lead cleaner and filtration capacity to allow for optimization of silver recovery to payable lead concentrates. Estimated cost $100,000 and this hasnotbeen included in the capital cost estimate as further validation is required.
Double the tailings filtration capacity. Estimated cost $580,000 and this has been included in the capital cost estimate as it is also deemed essential.
66
Undertake additional testwork of tailings properties and suitability for dry stacking. Estimated cost $34,000.
Undertake further TMF site investigations. Estimated cost $50,000.
Reassess the factor of TMF safety calculations using standard industry practice finite element numerical modeling
Prepare a more detailed water balance for the TMF on a month-by-month basis.
Provide emergency backup power for essential critical services such as man cage, mine ventilation, mine dewatering pumps and thickeners. Estimated cost $800,000.
| | |
| | Cautionary Note to U.S. Investors Concerning Estimates of Measured and Indicated Resources: | |
| |
This section uses the terms “measured resources” and “indicated resources”. We advise U.S. investorsthat these terms are not recognized by the U.S. Securities and Exchange Commission. The estimation ofmeasured resources and indicated resources involves greater uncertainty as to their existence andeconomic feasibility than the estimation of proven and probable reserves. U.S. investors are cautionednot to assume that mineral resources in these categories will be converted into reserves. See“Cautionary Note to U.S. Investors – Information Concerning Preparation of Mineral Resource and Mineral Reserve Estimates”.
| |
| | Cautionary Note to U.S. Investors Concerning Estimates of Inferred Resources | |
| |
This section uses the terms “inferred resources”. We advise U.S. investors that this term is notrecognized by the U.S. Securities and Exchange Commission. The estimation of inferred resourcesinvolves far greater uncertainty as to their existence and economic viability than the estimation of othercategories of resources. U.S. investors are cautioned not to assume that estimates of inferred mineralresources exist, are economically minable, or will be upgraded into measured or indicated mineralresources. See “Cautionary Note to U.S. Investors – Information Concerning Preparation of MineralResource and Mineral Reserve Estimates”.
| |
ITEM 6 DIVIDENDS
The Company declared its first annual dividend of C$0.05 per share in 2007. In 2008, the Company increased the dividend to C$0.02 per share per quarter, (C$0.08 annually). On November 9, 2011 the Company announced it was increasing its dividend to $0.025 per quarter ($C0.10 annually). The Company believes that the payment of dividends rewards shareholder loyalty and is a validation of the Company’s cash generating capabilities. The declaration and amount of any future dividends will be at the discretion of the Company’s directors.
ITEM 7 DESCRIPTION OF CAPITAL STRUCTURE
General Description of Capital Structure
The Company has an authorized capital of an unlimited number of common shares without par value (the “Common Shares”), of which 170,701,558 Common Shares were issued and outstanding as of June 19, 2012. A further 3,465,669 Common Shares have been reserved for issuance upon the due and proper exercise of certain incentive options and share purchase warrants outstanding as of June 19, 2012.
The following is a summary of the principal attributes of the Common Shares:
67
Voting Rights.The holders of the Common Shares are entitled to receive notice of, attend and vote at any meeting of the shareholders of the Company. The Common Shares carry one vote per share. There are no cumulative voting rights, and directors do not stand for re-election at staggered intervals.
Dividends.The holders of Common Shares are entitled to receive on a pro rata basis such dividends as may be declared by the board of directors, out of available funds. There are no indentures or agreements limiting the payment of dividends.
Profits.Each Common Share is entitled to share pro rata in any profits of the Company to the extent they are distributed either through the declaration of dividends or otherwise distributed to shareholders, or on a winding up or liquidation.
Rights on Dissolution.In the event of the liquidation, dissolution or winding up of the Company, the holders of the Common Shares will be entitled to receive on a pro rata basis all of the assets of the Company remaining after payment of all the Company’s liabilities.
Pre-Emptive, Conversion and Other Rights.No pre-emptive, redemption, sinking fund or conversion rights are attached to the Common Shares, and the Common Shares, when fully paid, will not be liable to further call or assessment. No other class of shares may be created without the approval of the holders of Common Shares. There are no provisions discriminating against any existing or prospective holder of Common Shares as a result of such shareholder owning a substantial number of Common Shares.
The rights of holders of Common Shares may only be changed by a special resolution of holders of 66 2/3% of the issued and outstanding Common Shares, in accordance with the requirements of theBusiness Corporations Act(British Columbia).
Under its Stock Option Plan, the Company may grant options to purchase up to 10% of the issued and outstanding Common Shares outstanding from time to time, to directors, officers, employees and consultants. As of June 19, 2012, the Company has stock options outstanding to purchase 3,415,669 Common Shares at exercise prices from C$2.65 to C$14.96 per share and term of five years, with the last options expiring on March 5, 2017.
Shareholders Rights Plan
At the Company’s annual general meeting held on September 26, 2008, its shareholders adopted a shareholders’ rights plan (the “Rights Plan”) dated August 11, 2008. The Rights Plan was reconfirmed by Company shareholders on September 23, 2011. To remain in full force and effect, the Rights Plan has a term of three years and must be reconfirmed by a resolution passed by a majority of the votes cast by all holders of voting shares who vote in respect of such reconfirmation at the annual general meeting of the Company held in 2014, and at every third annual meeting of the Company thereafter, unless the rights are earlier redeemed or exchanged.
The Rights Plan is designed to encourage the fair treatment of shareholders in the event of any take-over offer for the Company. The Rights Plan provides the board of directors and the shareholders with more time than the 35 days provided by applicable securities laws, to fully consider any unsolicited take-over bid for the Company without undue pressure, to allow the board of directors to pursue, if appropriate, other alternatives to maximize shareholder value and to allow additional time for competing bids to emerge.
The Rights Plan was not proposed in response to, or in anticipation of, any acquisition or take-over offer and is not intended to prevent a take-over of the Company, to secure continuance of current management or the directors in office or to deter fair offers for the common shares of the Company. The initial
68
issuance of the rights is not dilutive and will not affect reported earnings per share or cash flow per share until the rights separate from the underlying common shares and become exercisable.
ITEM 8 MARKET FOR SECURITIES
The Common Shares were initially listed for trading on the TSX Venture Exchange (the “TSX-V”) under the symbol “SVM”. The Company’s shares commenced trading on the TSX under the same symbol and delisted from the TSX-V on October 24, 2005. The Common Shares began trading on the NYSE Amex under the symbol “SVM” on February 17, 2009, and trading moved to the NYSE under the symbol of “SVM” on November 5, 2009.
Standard & Poors Canadian Index operations also added the Company’s Common Shares to the S&P/TSX Composite Index effective December 18, 2006 and to the S&P/TSX Global Gold Index and the S&P/TSX Global Mining Index effective June 12, 2007.
The following table sets forth the high, low and month-end closing prices and average trading volume for the Common Shares on the TSX for the periods indicated (stated in Canadian dollars):
| | | | |
| Date | High | Low | Close | Volume |
| March 2012 | 7.46 | 6.54 | 6.87 | 437,600 |
| February 2012 | 8.45 | 6.86 | 7.27 | 536,600 |
| January 2012 | 8.43 | 6.71 | 8.26 | 351,000 |
| December 2011 | 7.99 | 6.03 | 6.54 | 509,600 |
| November 2011 | 9.92 | 7.22 | 7.81 | 516,900 |
| October 2011 | 10.00 | 7.61 | 9.27 | 909,100 |
| September 2011 | 9.12 | 5.81 | 8.29 | 2,903,500 |
| August 2011 | 10.39 | 7.63 | 8.56 | 1,242,800 |
| July 2011 | 11.63 | 8.98 | 9.92 | 751,400 |
| June 2011 | 11.10 | 7.91 | 9.06 | 995,200 |
| May 2011 | 12.79 | 9.43 | 10.82 | 989,500 |
| April 2011 | 15.60 | 12.42 | 12.88 | 982,200 |
The following table sets forth the high, low and month or period-end closing prices and average trading volume for the Common Shares on the NYSE for the periods indicated (stated in US dollars):
| | | | |
| Date | High | Low | Close | Volume |
| March 2012 | 7.57 | 6.52 | 6.89 | 1,496,300 |
| February 2012 | 8.43 | 6.85 | 7.35 | 2,044,600 |
| January 2012 | 8.45 | 6.59 | 8.24 | 1,701,400 |
| December 2011 | 7.89 | 5.90 | 6.40 | 2,076,000 |
| November 2011 | 9.79 | 6.89 | 7.63 | 2,349,900 |
| October 2011 | 10.08 | 7.14 | 9.45 | 4,167,200 |
| September 2011 | 9.23 | 5.86 | 7.91 | 11,912,700 |
| August 2011 | 10.83 | 7.70 | 8.73 | 5,160,800 |
69
| | | | |
| Date | High | Low | Close | Volume |
| July 2011 | 12.12 | 8.91 | 10.36 | 3,582,200 |
| June 2011 | 11.43 | 8.05 | 9.38 | 3,267,600 |
| May 2011 | 13.48 | 9.62 | 11.15 | 3,942,900 |
| April 2011 | 16.32 | 13.01 | 13.59 | 3,801,700 |
ITEM 9 ESCROWED SECURITIES
The Company has no securities currently held in escrow.
ITEM 10 DIRECTORS & OFFICERS
Name, Occupation and Security Holding
The following table sets out the names of the directors and officers of the Company, the current position and office held, each person’s principal occupation, business or employment during the last five years, the period of time during which each has been a director of the Company and the number of Common Shares beneficially owned by each, directly and indirectly, or over which each exercised control or direction as at the date of this AIF.
| | | | |
Name and
Municipality
of Residence(1) | Current
Positions and
Offices Held | Principal Occupations During the Last
Five Years(1) | Date of
Appointment as a
Director or
Officer | Common
Shares
Beneficially
Owned(3) |
Rui Feng
West Vancouver, BC, Canada | Chairman, Chief Executive Officer and Director | Chairman and CEO of the Company from September 2003 to present; Appointed President of New Pacific Metals Corp. since May 2010 and Director of New Pacific Metals Corp. since May 2004. | September 4, 2003 | 3,989,500 |
Myles JianguoGao,
Vancouver, BC, Canada | President, COO and Director | President and COO of the Company since March 2003. | November 14, 2002 | 803,713 |
S. PaulSimpson(4)(5)
Vancouver, BC, Canada | Director | Solicitor at Armstrong Simpson, Barristers & Solicitors. | June 24, 2003 | 648,005 |
Earl Drake(2)(4)
Vancouver, BC Canada | Director | Vice Chairman Emeritus of the Canada China Business Council; former Project Director of the China Council on Environment & Development; and Honorary Professor in Residence at University of British Columbia. Prior to settling in Vancouver, Mr. Drake spent many years abroad as Canadian Ambassador to China and Indonesia, Executive Director at the World Bank in Washington and as Canadian diplomat at the OECD in Paris and embassies in Malaysia and Pakistan. | July 24, 2006 | 16,899 |
70
| | | | |
Name and
Municipality
of Residence(1) | Current
Positions and
Offices Held | Principal Occupations During the Last
Five Years(1) | Date of
Appointment as a
Director or
Officer | Common
Shares
Beneficially
Owned(3) |
David Kong(2)
Vancouver, BC, Canada | Director | From 1981 to 2004, he was partner of Ellis Foster Chartered Accountants and a partner at Ernst & Young LLP from 2005 to 2010. Currently, Mr. Kong is a director of New Pacific Metals Corp., IDM International Limited , Hana Mining Ltd., Uranium Energy Corp., and Brazil Resources Inc. | November 24, 2011 | 5,000 |
Yikang Liu(4)(5)
Beijing, China | Director | Past Deputy Secretary General of China Mining Association; | July 24, 2006 | 134,500 |
RobertGayton(2)(5)
West Vancouver, BC, Canada | Director | Director of each of Nevsun Resources Ltd., Amerigo Resources Ltd., B2Gold Corp., Quaterra Resources Inc., Eastern Platinum Ltd., LNG Energy Ltd., Copper North Mining Corp., Western Copper and Inc. Gold Inc., and NorthIsle Copper and Gold | September 30, 2008 | 2,000 |
Meng (Maria)Tang
Burnaby, BC Canada | Chief Financial Officer | Prior to joining the Company, Ms. Tang had five years audit experience, most recently with Ernst & Young LLP, where she focused on public company audits with China operations and was in charge of Sarbanes-Oxley audits for US public companies. | October 1, 2008 | 12,200 |
Lorne Waldman
Vancouver, BC Canada | Corporate Secretary | In-house Legal Counsel and Corporate Secretary of Nam Tai Electronics, Inc. from November 1996 to September 2007. | September 10, 2007 | 5,000 |
Shaoyang Shen
Toronto, ON Canada | Vice President, China Operations | Senior Analyst / Accountant at Grant Thornton LLP from October 2005 to December 2007; Accountant at Bennett Gold LLP from November 2004 to October 2005. | January 1, 2008 | 30,833 |
| Total | | | | 5,647,650 |
Notes:
| (1) | The information as to municipality of residence and principal occupation of each nominee has been individually furnished by the respective nominee. |
| | |
| (2) | Member of Audit Committee. |
| |
| (3) | The approximate number of shares of the Company carrying the right to vote in all circumstances beneficially owned directly or indirectly, or over which control or direction is exercised is based upon information furnished to the Company by each proposed nominee as at the date hereof. |
| | |
| (4) | Member of Corporate Governance Committee. |
| | |
| (5) | Member of Compensation Committee |
The term of office of each of the directors expires at the next annual general meeting of shareholders.
71
As of the date hereof, all of the directors and officers of the Company, as a group, beneficially own, directly or indirectly, or exercise control over 5,647,650 Common Shares representing 3.3% of Common Shares issued and outstanding as of June 19, 2012.
Cease Trade Orders, Bankruptcies, Penalties or Sanctions
Except as disclosed below, as at the date of this AIF and within the 10 years before the date of this AIF, no director, executive officer or a shareholder holding sufficient number of securities of the Company to materially affect control of the Company,
(a) is or has been a director or executive officer of any company (including the Company), that:
| 1. | while that person was acting in that capacity, was the subject of a cease trade order or similar order or an order that denied the relevant company access to any exemption under securities legislation, for a period of more than 30 consecutive days; |
| | |
| 2. | that after that person ceased to be a director or executive officer, was subject to an order which resulted from an event that occurred while that person was acting in the capacity as director or executive officer that denied the relevant company access to any exemption under securities legislation, for a period of more than 30 consecutive days; |
| | |
| 3. | while that person was acting in that capacity, or within a year of that person ceasing to act in that capacity, became bankrupt, made a proposal under any legislation relating to bankruptcy or insolvency or was subject to or instituted any proceedings, arrangement or compromise with creditors or had a receiver, receiver manager or trustee appointed to hold its assets; or |
| | |
| | 4. | has within 10 years before the date of the AIF became bankrupt, made a proposal under any legislation relating to bankruptcy or insolvency or was subject to or instituted any proceedings, arrangement or compromise with creditors or had a receiver, receiver manager or trustee appointed to hold the assets of the director, officers or shareholders. |
(b) No director, officer or promoter of the Company or a shareholder holding a sufficient number of securities of the Company to affect materially the control of the Company, has, within the 10 years prior to the date of this AIF, been subject to:
(c) any penalties or sanctions imposed by a court or securities regulatory authority relating to securities legislation or by a securities regulatory authority or has entered into a settlement agreement with a securities regulatory authority; or
(d) any other penalties or sanctions imposed by a court or regulatory body that would likely be considered important to a reasonable investor in making an investment decision.
Mr. Paul Simpson was the Corporate Secretary of Salmon River Resources Ltd., a company listed on the TSX-V, which was the subject of a cease trade order of the Alberta Securities Commission issued on December 2, 2003 for failure to file its Annual Financial Statements for the period ended June 30, 2003. The annual financial statements were filed in February 2004, and the cease trade order subsequently lifted.
Mr. Robert Gayton was a director and officer of Newcoast Silver Mines Ltd. at the date of a cease trade order issued by the British Columbia Securities Commission on September 30, 2003, and by the Alberta Securities Commission on October 31, 2003, for failure to file financial statements. The orders were revoked on October 23, 2003 and March 25, 2004, respectively.
72
Conflicts of Interest
Certain directors and officers of the Company are also directors, officers or shareholders of other companies that are similarly engaged in the business of acquiring and exploiting natural resources properties. These associations to other companies in the resource sector may give rise to conflicts of interest from time to time.
Under the laws of the Province of British Columbia, the directors and senior officers of the Company are required by law to act honestly and in good faith with a view to the best interests of the Company. In the event that such a conflict of interest arises at a meeting of the Company’s directors, a director who has such a conflict will disclose such interest in a contract or transaction and will abstain from voting on any resolution in respect of such contract or transaction. See also “Item 4.3 Risk Factors” and “Item 14 Interest of Management and Others in Material Transactions”.
ITEM 11 AUDIT COMMITTEE
Audit Committee Charter
A copy of the Charter of the Audit Committee is attached hereto as Schedule “A”.
Composition of the Audit Committee
The current members of the Audit Committee are David Kong, Robert Gayton, and Earl Drake, all of whom are considered independent pursuant to National Instrument 52-110 – Audit Committees. All members of the Audit Committee are considered to be financially literate. The Audit Committee will be re-constituted after the 2012 Annual General Meeting.
Relevant Education and Experience
David Kong, Director
Mr. David Kong holds a Bachelor in Business Administration and earned his Chartered Accountant designation in British Columbia in 1978 and U.S CPA (Illinois) designation in 2002. From 1981 to 2004, he was partner of Ellis Foster Chartered Accountants and a partner at Ernst & Young LLP from 2005 to 2010. Currently, Mr. Kong is a director of New Pacific Metals Corp., Hana Mining Ltd., IDM International Limited, Uranium Energy Corp., and Brazil Resources Inc. Mr. Kong is a certified director (ICD.C) of the Institute of Corporate Directors.
Robert Gayton, Director
Dr. Gayton graduated from the University of British Columbia (“UBC”) in 1962 with a Bachelor of Commerce and in 1964 earned the Chartered Accountant (C.A.) designation while at Peat Marwick Mitchell. Dr. Gayton joined the Faculty of Business Administration at UBC in 1965 beginning 10 years in the academic world, including time at the University of California, Berkeley, earning a Ph.D. in Business. Dr. Gayton rejoined Peat Marwick Mitchell in 1974 and became a partner in 1976, providing audit and consulting services to private and public company clients for 11 years. He has directed the accounting and financial matters of public companies in the resource and non-resource fields since 1987. He was CFO of Western Silver Corporation from 1996 to 2004 and was a director of Western Silver Corporation (2004-2005), Bema Gold Corporation (2003-2007), Northern Orion Resources Inc. (2004-2007), and Doublestar Resources (2000-2007), each of which were “taken over”. Mr. Gayton is currently a director Nevsun Resources Ltd., Amerigo Resources Ltd., B2Gold Corp., Quaterra Resources
73
Inc., Eastern Platinum Ltd., LNG Energy Ltd., Copper North Mining Corp., Western Copper and Gold Inc., and NorthIsle Copper and Gold Inc.
Earl Drake, Director
Mr. Earl Drake is Vice Chairman Emeritus of the Canada China Business Council; former Project Director of the China Council on Environment & Development; and Honorary Professor in Residence at University of British Columbia. Prior to settling in Vancouver, Mr. Drake spent many years abroad as Canadian Ambassador to China and Indonesia, Executive Director at the World Bank in Washington and as Canadian diplomat at the OECD in Paris and embassies in Malaysia and Pakistan. In Ottawa, he served as Assistant Deputy Minister at the Department of External Affairs and Vice President at Canadian International Development Agency.
Reliance on Certain Exemptions
At no time since the commencement of the Company’s most recently completed financial year has the Company relied on the exemption in sections 2.4, 3.2, 3.3(2), 3.4, 3.5, 3.6 or 3.8 of NI 52-110, or an exemption from NI 52-110, in whole or in part, granted under Part 8 of NI 52-110.
Audit Committee Oversight
During the last year, recommendations of the Audit Committee to nominate or compensate an external auditor were adopted by the Board.
Pre-Approval Policies and Procedures
The Audit Committee has adopted a specific policy and procedure for the engagement of non-audit services as described in Section IV of the Audit Committee Charter.
External Auditor Services Fees
The Audit Committee has reviewed the nature and amount of the services provided by Ernst & Young LLP to ensure auditor independence. Fees (stated in Canadian dollars) billed by external auditors for audit services in the last two fiscal years are outlined below:
| | |
| Nature of Services | Year Ended March 31, 2012 | Year Ended March 31, 2011 |
| Audit Fees(1) | $850,000 | $755,000 |
| Audit-Related Fees(2) | Nil | $64,000 |
| Tax- Fees(3) | $33,459 | $25,100 |
| All Other Fees(4) | $97,500 | $16,000 |
| Total | $980,959 | $860,100 |
Notes:
| (1) | “Audit Fees” include the aggregate fees billed for each of the last two fiscal years for professional services of the principal accountant for the audit of the Company’s annual financial statements and the audit of the Company's internal control over financial reporting for fiscal 2012 and fiscal 2011, or services that are normally provided by the principal accountant in connection with statutory and regulatory filings or engagements for those fiscal years. |
| | |
| (2) | “Audit-Related Fees” include the aggregate fees billed in each of the last two fiscal years for assurance and related services by the principal accountant that are reasonably related to the performance of the audit or review of the Company’s financial statements and are not reported under above item (1). For fiscal years 2011, audit-related fees were to review financial information contained in public security filings in Canada and the United States related to an equity financing that was completed in December 2010. |
| | |
| (3) | “Tax Fees” include the aggregate fees billed in each of the last two fiscal years for professional services rendered by the principal accountant for tax compliance, tax advice, and tax planning. For fiscal years 2012 and 2011, tax fees were for corporate tax returns and general tax inquiries. |
| | |
| (4) | “All Other Fees” include the aggregate fees billed in each of the last two fiscal years for services provided by the principal accountant, other than the services reported in the above items. For fiscal year 2012, other fees include review of the report from KPMG Forensic Inc. |
74
(“KPMG”), commissioned by Silvercorp’s Special Committee (the “KPMG Report”) to review the allegations issued by two anonymous sources in September 2011 respecting the Company’s financial position and review of comment letters from securities regulators.
No person or company has been a promoter of the Company or a subsidiary of the Company within the two most recently completed financial years or during the current financial year.
| |
| ITEM 13 | LEGAL PROCEEDINGS AND REGULATORY ACTIONS |
Except as disclosed herein, the Company is not aware of any actual or pending material legal proceedings or any regulatory actions to which the Company is or is likely to be party or of which any of its business or property is or is likely to be subject. As announced on September 22, 2011 the Company filed a lawsuit in New York County Supreme Court charging defendants Chinastockwatch.com, Jerry Katz, Alfredlittle.com, Alfred Little, Simon Moore, and several “John Doe” defendants with spreading “false, defamatory and fraudulent” information about Silvercorp on the Internet and in letters to the media and regulators. Silvercorp charged that the defendants did so to drive down the price of Silvercorp’s stock in order to make their short positions in the stock more profitable.
| |
ITEM 14 | INTEREST OF MANAGEMENT AND OTHERS IN MATERIAL TRANSACTIONS |
Except as disclosed below, no director or executive officer, insider, or any associate or affiliate of such insider or director or executive officer, have had any material interest, direct or indirect, in any material transaction of Silvercorp within the Company’s three most recently completed financial years or during the current financial year, which has materially affected or will materially affect Silvercorp.
| |
| ITEM 15 | TRANSFER AGENTS AND REGISTRARS |
The Company’s transfer agent and registrar is Computershare Investor Services Inc. of 510 Burrard Street, 2nd Floor, Vancouver, British Columbia, Canada, V6C 3B9.
| |
| ITEM 16 | MATERIAL CONTRACTS |
There are no other contracts, other than those disclosed in this AIF and other than those entered into in the ordinary course of the Company’s business, that are material to the Company and which were entered into in the most recently completed financial year ended March 31, 2012, or before the most recently completed financial year but are still in effect as of the date of this AIF.
| |
| ITEM 17 | INTERESTS OF EXPERTS |
Names of Experts
Ying Report
AMC Mining Consultants (Canada) Ltd (“AMC”) was commissioned by Silvercorp Metals Inc. (“Silvercorp”) to prepare an updated Technical Report on the Ying gold-silver-lead-zinc property in Henan Province, China, encompassing the SGX, HPG and TLP / LM mines. The previous publicly released Technical Reports were prepared by other parties, were dated 20 May 2011, and covered the SGX, HPG and TLP / LM mines in three separate reports. Persons who prepared, or contributed to, the Ying Report are set out as follows:
75
| | | | | | |
Qualified
Person | Position | Employer | Independent of
Silvercorp? | Date of Last
Site Visit | Professional
Designation | Sections of
Report |
| Mr. P R Stephenson | General Manager | AMC Mining Consultants (Canada) Ltd | Yes | No visit | PGeo, BSc (Hons), FAusIMM (CP), MAIG, MCIM | 1, 25, 26 |
| Mr. H A Smith | Principal Mining Engineer | AMC Mining Consultants (Canada) Ltd | Yes | 16-19 February 2012 | PEng (BC), PEng (Ontario), PEng (Alberta) MSc, BSc | 15, 16, 21, 22 |
| Mr. B O’Connor | Principal Geologist | AMC Mining Consultants (Canada) Ltd | Yes | 16-21 February and 14-20 April 2012 | PGeo, BSc MCIM | 2 to 12, 14, 20, 23, 24 |
| Mr. A Riles | Principal
Metallurgical Consultant | Riles Integrated Resource Management Ltd | Yes | 16-19 February 2012 | B.Met (Hons) Grad Dipl Professional Management, MAIG | 13, 17, 19, 21, 22, part of 18 |
| Mr. M Molavi | Principal Mining Engineer | AMC Mining Consultants (Canada) Ltd | Yes | 16-19 February 2012 | PEng, M Eng, B Eng | Parts of 18, 21, 22 |
GC Report
AMC was commissioned by Silvercorp to review a report titled “Mining and Dressing Project of Gaocheng Lead-Zinc Ore in Yun’an County, Guangdong Province” prepared by the Guangdong Metallurgical & Architectural Design Institute (GMADI) in January 2011, and to prepare an independent Technical Report on the property incorporating its findings on the GMADI report. AMC prepared a previous Technical Report on the GC property in June 2009 titled “NI 43-101 Technical Report Update on the GC Ag-Zn-Pb Project in Guangdong Province, People’s Republic of China” (AMC report number 709003). Persons who prepared, or contributed to, the GC Report are set out as follows:
| | | | | | |
Qualified
Person | Position | Employer | Independent of
Silvercorp? | Date of Last
Site Visit | Professional
Designation | Sections of
Report |
| Mr. B O’Connor | Principal Geologist | AMC Mining Consultants (Canada) Ltd | Yes | 23 – 31 May 2011 | PGeo, BSc MCIM | Sections 2 to 12, 14, 20, 23, 24 |
| Mr. P Mokos | Principal Mining Geologist | AMC Mining Consultants (Canada) Ltd | Yes | 23 – 31 May 2011 | BSc (Eng), DipEng (Mining), MAusIMM (CP) | 15, 16 |
| Mr. A Riles | Principal Metallurgical Consultant | Riles Integrated Resource Management Ltd | Yes | 23 – 31 May 2011 | BSc (Hons) Grad Dipl Business Management, MAIG | 13, 17, 19, 21, 22, part of 18 |
| Mr. O Watson | Senior Geotechnical Engineer | AMC Mining Consultants (Canada) Ltd | Yes | 23 – 31 May 2011 | BEng (Geological) (Hons) MAusIMM (CP), MCIM | Parts of 15, 16 |
| Mr. M Molavi | Principal Mining Engineer | AMC Mining Consultants (Canada) Ltd | Yes | No visit | PEng, M Eng, B Eng | Parts of 18 |
| Mr. P Stephenson | General Manager | AMC Mining Consultants (Canada) Ltd | Yes | No visit | PGeo, BSc (Hons), FAusIMM (CP), MAIG, MCIM | 1, 25, 26 |
76
| | | | | |
| Other Experts upon whose contributions the Qualified Persons have relied |
| Expert | Position | Employer | Independent of
Silvercorp | Visited Site | Sections of Report |
| | | | | | |
| Mr. B Fallaw | Senior Tailings and Backfill Consultant | AMC Consultants Pty Ltd | Yes | No visit | Part of 18 |
| Mr. S Wyllie | Senior Mining Consultant | AMC Mining Consultants (Canada) Ltd | Yes | No visit | Parts of 15, 16 |
Interests of Experts
Other than disclosed in this AIF, none of the independent consulting geologists and “qualified persons” named in the “Item 17.1 Names of Experts”, when or after they prepared the statement, report or valuation, has received any registered or beneficial interests, direct or indirect, in any securities or other property of the Company or of one of the Company’s associates or affiliates or is or is expected to be elected, appointed or employed as a director, officer or employee of the Company or of any associate or affiliate of the Company except as disclosed below. This information has been provided to the Company by the individual experts.
The qualified persons who were responsible for the preparation of the Ying and GC technical reports beneficially owned, directly or indirectly, less than 1% of the Common Shares.
ITEM 18 ADDITIONAL INFORMATION
Additional information on the Company can be found on the Company’s website at www.silvercorp.ca or on SEDAR at www.sedar.com.
Additional information, including directors’ and officers’ remuneration and indebtedness, principal holders of the Company’s securities and securities authorized for issuance under equity compensation plans, if applicable, is contained in the Company’s information circular for its most recent annual meeting of shareholders that involved the election of directors.
Additional information is provided in the Company’s most recent financial statements and the management’s discussion and analysis for its most recently completed financial year.
77
ITEM 19 SCHEDULE “A”
SILVERCORP METALS INC.
AUDIT COMMITTEE CHARTER
I. Purpose
The main objective of the Audit Committee is to act as a liaison between the Board and the Company’s independent auditors (the “Auditors”) and to assist the Board in fulfilling its oversight responsibilities with respect to (a) the financial statements and other financial information provided by the Company to its shareholders, the public and others, (b) the Company’s compliance with legal and regulatory requirements, (c) the qualification, independence and performance of the Auditors and (d) the Company’s risk management and internal financial and accounting controls, and management information systems.
Although the Committee has the powers and responsibilities set forth in this Charter, the role of the Committee is oversight. The members of the Committee are not full-time employees of the Company and may or may not be accountants or auditors by profession or experts in the fields of accounting or auditing and, in any event, do not serve in such capacity. Consequently, it is not the duty of the Committee to conduct audits or to determine that the Company’s financial statements and disclosures are complete and accurate and are in accordance with generally accepted accounting principles and applicable rules and regulations.
II. Organization
The Committee shall consist of three or more directors and shall satisfy the laws governing the Company and the independence, financial literacy, expertise and experience requirements under applicable securities law, stock exchange and any other regulatory requirements applicable to the Company.
The members of the Committee and the Chair of the Committee shall be appointed by the Board. A majority of the members of the Committee shall constitute a quorum. A majority of the members of the Committee shall be empowered to act on behalf of the Committee. Matters decided by the Committee shall be decided by majority votes.
Any member of the Committee may be removed or replaced at any time by the Board and shall cease to be a member of the Committee as soon as such member ceases to be a director.
The Committee may form and delegate authority to subcommittees when appropriate.
III. Meetings
The Committee shall meet as frequently as circumstances require, but not less frequently than four times per year. The Committee shall meet at least quarterly.
The Committee may invite, from time to time, such persons as it may see fit to attend its meetings and to take part in discussion and consideration of the affairs of the Committee.
78
The Company’s accounting and financial officer(s) and the Auditors shall attend any meeting when requested to do so by the Chair of the Committee.
IV. Responsibilities
The Committee shall recommend to the Board of directors: the external auditor to be nominated for the purpose of preparing or issuing an auditor’s report or performing other audit, review or attest services for the Company; and the compensation of the external auditor.
The Committee shall be directly responsible for overseeing the work of the external auditor engaged for the purpose of preparing or issuing an auditor’s report or performing other audit, review or attest services for the Company, including the resolution of disagreements between management and the external auditor regarding financial reporting.
The Committee must pre-approve all non-audit services to be provided to the Company or its subsidiary entities by the Company’s external auditor.
The Committee must review the Company’s financial statements, MD&A and annual and interim earnings press releases before the Company publicly discloses this information.
The Committee must be satisfied that adequate procedures are in place for the review of the Company’s public disclosure of financial information extracted or derived from the Company’s financial statements, other than the public disclosure referred to in subsection (4), and must periodically assess the adequacy of those procedures.
The Committee must establish procedures for:
the receipt, retention and treatment of complaints received by the Company regarding accounting, internal accounting controls, or auditing matters; and
the confidential, anonymous submission by employees of the Company of concerns regarding questionable accounting or auditing matters.
An audit committee must review and approve the Company’s hiring policies regarding partners, employees and former partners and employees of the present and former external auditor of the issuer.
V. Authority
The Committee shall have the following authority:
| (a) | to engage independent counsel and other advisors as it determines necessary to carry out its duties, |
| | |
| (b) | to set and pay the compensation for any advisors employed by the Committee, and |
| | |
| | (c) | to communicate directly with the internal and external auditors. |
79