UNITED STATES
SECURITIES AND EXCHANGE COMMISSION
Washington, D.C. 20549
FORM N-CSR
CERTIFIED SHAREHOLDER REPORT OF REGISTERED
MANAGEMENT INVESTMENT COMPANIES
Investment Company Act file number | 811-21820 |
|
Eaton Vance Credit Opportunities Fund |
(Exact name of registrant as specified in charter) |
|
The Eaton Vance Building, 255 State Street, Boston, Massachusetts | | 02109 |
(Address of principal executive offices) | | (Zip code) |
|
Alan R. Dynner |
The Eaton Vance Building, 255 State Street, Boston, Massachusetts 02109 |
(Name and address of agent for service) |
|
Registrant’s telephone number, including area code: | (617) 482-8260 | |
|
Date of fiscal year end: | April 30 | |
|
Date of reporting period: | October 31, 2006 | |
| | | | | | |
Item 1. Reports to Stockholders

Semiannual Report October 31, 2006


EATON VANCE
CREDIT
OPPORTUNITIES
FUND
IMPORTANT NOTICES REGARDING PRIVACY,
DELIVERY OF SHAREHOLDER DOCUMENTS,
PORTFOLIO HOLDINGS AND PROXY VOTING
Privacy. The Eaton Vance organization is committed to ensuring your financial privacy. Each of the financial institutions identified below has in effect the following policy ("Privacy Policy") with respect to nonpublic personal information about its customers:
• Only such information received from you, through application forms or otherwise, and information about your Eaton Vance fund transactions will be collected. This may include information such as name, address, social security number, tax status, account balances and transactions.
• None of such information about you (or former customers) will be disclosed to anyone, except as permitted by law (which includes disclosure to employees necessary to service your account). In the normal course of servicing a customer's account, Eaton Vance may share information with unaffiliated third parties that perform various required services such as transfer agents, custodians and broker/dealers.
• Policies and procedures (including physical, electronic and procedural safeguards) are in place that are designed to protect the confidentiality of such information.
• We reserve the right to change our Privacy Policy at any time upon proper notification to you. Customers may want to review our Policy periodically for changes by accessing the link on our homepage: www.eatonvance.com.
Our pledge of privacy applies to the following entities within the Eaton Vance organization: the Eaton Vance Family of Funds, Eaton Vance Management, Eaton Vance Investment Counsel, Boston Management and Research, and Eaton Vance Distributors, Inc.
In addition, our Privacy Policy only applies to those Eaton Vance customers who are individuals and who have a direct relationship with us. If a customer's account (i.e., fund shares) is held in the name of a third-party financial adviser/broker-dealer, it is likely that only such adviser's privacy policies apply to the customer. This notice supersedes all previously issued privacy disclosures.
For more information about Eaton Vance's Privacy Policy, please call 1-800-262-1122.
Delivery of Shareholder Documents. The Securities and Exchange Commission (the "SEC") permits funds to deliver only one copy of shareholder documents, including prospectuses, proxy statements and shareholder reports, to fund investors with multiple accounts at the same residential or post office box address. This practice is often called "householding" and it helps eliminate duplicate mailings to shareholders.
Eaton Vance, or your financial adviser, may household the mailing of your documents indefinitely unless you instruct Eaton Vance, or your financial adviser, otherwise.
If you would prefer that your Eaton Vance documents not be householded, please contact Eaton Vance at 1-800-262-1122, or contact your financial adviser.
Your instructions that householding not apply to delivery of your Eaton Vance documents will be effective within 30 days of receipt by Eaton Vance or your financial adviser.
Portfolio Holdings. Each Eaton Vance Fund and its underlying Portfolio (if applicable) will file a schedule of its portfolio holdings on Form N-Q with the SEC for the first and third quarters of each fiscal year. The Form N-Q will be available on the Eaton Vance website www.eatonvance.com, by calling Eaton Vance at 1-800-262-1122 or in the EDGAR database on the SEC's website at www.sec.gov. Form N-Q may also be reviewed and copied at the SEC's public reference room in Washington, D.C. (call 1-800-732-0330 for information on the operation of the public reference room).
Proxy Voting. From time to time, funds are required to vote proxies related to the securities held by the funds. The Eaton Vance Funds or their underlying Portfolios (if applicable) vote proxies according to a set of policies and procedures approved by the Funds' and Portfolios' Boards. You may obtain a description of these policies and procedures and information on how the Funds or Portfolios voted proxies relating to portfolio securities during the most recent 12 month period ended June 30, without charge, upon request, by calling 1-800-262-1122. This description is also available on the SEC's website at www.sec.gov.
Eaton Vance Credit Opportunities Fund as of October 31, 2006
I N V E S T M E N T U P D A T E
The Fund
Performance for the Period
· Based on share price, Eaton Vance Credit Opportunities Fund, a closed-end fund traded on the New York Stock Exchange, had a total return of 7.18% for the period from inception on May 31, 2006, through October 31, 2006. That return was the result of an increase in share price to $19.80 on October 31, 2006, from $19.10 (offering price of $20 per share, less all commissions) on May 31, 2006 and the reinvestment of $0.638 in dividends.(1)
· Based on net asset value (NAV), the Fund had a total return of 3.07% for the period from inception on May 31, 2006, through October 31, 2006. That return was the result of a decrease in NAV to $19.04 on October 31, 2006, from $19.10 (offering price of $20 per share, less all commissions) on May 31, 2006, and the reinvestment of all distributions.(1)
· Based on its October 2006 monthly dividend payment of $0.16 and a closing share price of $19.80, the Fund had a market yield of 9.70%.(2)
· For performance comparison, the S&P/LSTA Leveraged Loan Index – an unmanaged index of U.S. dollar-denominated leveraged loans – had a total return of 2.70% for the period from the Fund’s inception on May 31, 2006, through October 31, 2006.(3) The Lipper High Current Yield Funds Classification – the Fund’s peer group – had an average total return of 4.89% for the same period.(3)
The Fund’s Investments
· The Fund’s loan investments included 141 borrowers at October 31, 2006, with no industry constituting more than 8.0% of the Fund’s total investments. Automotive, cable and satellite television, healthcare, leisure goods/activities/movies and business equipment and services were the largest industry weightings.(4)
· The loan market enjoyed relatively stable fundamentals during the period. Technical factors have come more into balance, as record new issuance from strong merger activity has met robust investor demand. As a result, credit spreads have stabilized after a period during which they had narrowed. The Fund also benefited from an increase in the London Inter-Bank Offered Rate (LIBOR) – the benchmark over which loan interest rates are typically set – which rose in response to a rate hike in late June from the Federal Reserve.
· In its initial months of operation, the Fund maintained a somewhat defensive credit posture. Accordingly, the Fund limited its high yield bond exposure in favor of second lien loans – senior floating-rate loans that, in the event of bankruptcy, are paid after first lien lenders but before bondholders and general creditors. Given a slighted inverted yield curve environment, second lien loans offered a yield advantage over high-yield bonds, because LIBOR rates were higher than 10-year Treasury bonds rates, over which most high-yield bonds are quoted.
· The Fund had an 18% exposure to European loans at October 31, 2006. The European loans increased the Fund’s investment universe, presenting further opportunities for diversification. In addition, because European spreads were slightly wider than the U.S.market’s, European exposure provided selected opportunities for yield enhancement. All of the Fund’s foreign loans were either dollar-denominated or hedged to help protect against foreign currency risk.
· At October 31, 2006, the Fund had leverage in the amount of approximately 39.4% of the Fund’s total assets. The Fund employs leverage though the issuance of Auction Preferred Shares (“APS”) and participation in a line of credit.(5) Use of financial leverage creates an opportunity for increased income but, at the same time, creates special risks (including the likelihood of greater volatility of net asset value and market price of common shares). The cost of the Fund’s APS and borrowings rises and falls with changes in short-term interest rates. Such increases/decreases in cost of the Fund’s APS and borrowings may be offset by increased/decreased income from the Fund’s senior loan investments.
The views expressed in this report are those of the portfolio managers and are current only through the end of the period of the report as stated on the cover. These views are subject to change at any time based upon market or other conditions, and Eaton Vance disclaims any responsibility to update such views. These views may not be relied on as investment advice and, because investment decisions for an Eaton Vance fund are based on many factors, may not be relied on as an indication of trading intent on behalf of any Eaton Vance fund.
Past performance is no guarantee of future results. Returns are historical and are calculated by determining the percentage change in net asset value or share price (as applicable) with all distributions reinvested. Investment return and principal value will fluctuate so that shares, when sold, may be worth more or less than their original cost. Performance is for the stated time period only; due to market volatility, the Fund’s current performance may be lower or higher than the quoted return. For performance as of the most recent month end, please refer to www.eatonvance.com.
(1) Performance results reflect the effect of leverage resulting from the Fund’s issuance of Auction Preferred Shares and its participation in a line of credit.
(2) The Fund’s market yield is calculated by dividing the most recent dividend per share by the share price at the end of the period and annualizing the result.
(3) It is not possible to invest directly in an Index or a Lipper Classification. The Index’s total return does not reflect the commissions or expenses that would have been incurred if an investor individually purchased or sold the loans represented in the Index. Unlike the Fund, the Index’s return does not reflect the effect of leverage, such as the issuance of Auction Preferred Shares. The Lipper average is the average total return, at net asset value, of the funds that are in the same Lipper Classification as the Fund. Lipper Classifications may include leveraged and unleveraged funds.
(4) Holdings and industry weightings are subject to change due to active management.
(5) In the event of a rise in long-term interest rates, the value of the Fund’s investment portfolio could decline, which would reduce the asset coverage for its Auction Preferred Shares.
Fund shares are not insured by the FDIC and are not deposits or other obligations of, or guaranteed by, any depository institution. Shares are subject to investment risks, including possible loss of principal invested.
1
Eaton Vance Credit Opportunities Fund as of October 31, 2006
P E R F O R M A N C E
Performance(1)
Average Annual Total Return (by share price, NYSE) | | | |
Life of Fund (5/31/06) | | 7.18 | % |
| | | |
Average Annual Total Return (at net asset value) | | | |
Life of Fund (5/31/06) | | 3.07 | % |
(1) Returns are historical and are calculated by determining the percentage change in share price or net asset value with all distributions reinvested. The Fund’s performance at market share price will differ from its results at NAV. Although share price performance generally reflects investment results over time, during shorter periods, returns at share price can also be affected by factors such as changing perceptions about the Fund, market conditions, fluctuations in supply and demand for the Fund’s shares, or changes in Fund distributions. Performance results reflect the effect of leverage resulting from the Fund’s issuance of Auction Preferred Shares and its participation in a line of credit. In the event of a rise in long-term interest rates, the value of the Fund’s investment portfolio could decline, which would reduce the asset coverage for its Auction Preferred Shares.
Past performance is no guarantee of future results. Returns are historical and are calculated by determining the percentage change in net asset value or share price (as applicable) with all distributions reinvested. Investment return and principal value will fluctuate so that shares, when sold, may be worth more or less than their original cost. Performance is for the stated time period only; due to market volatility, the Fund’s current performance may be lower or higher than the quoted return. For performance as of the most recent month end, please refer to www.eatonvance.com.
Diversification by Industries(2)
By total investments
Automotive | | 7.1 | % |
Cable & Satellite Television | | 7.0 | |
Health Care | | 6.4 | |
Leisure Goods/Activities/Movies | | 6.4 | |
Business Equip. & Services | | 6.1 | |
Electronics/Electrical | | 5.3 | |
Oil & Gas | | 5.2 | |
Telecommunications | | 5.2 | |
Lodging & Casinos | | 4.2 | |
Radio & Television | | 4.0 | |
Chemicals & Plastics | | 3.9 | |
Food Products | | 3.6 | |
Building & Development | | 3.5 | |
Retailers (Except Food & Drug) | | 3.2 | |
Industrial Equipment | | 2.9 | |
Financial Intermediaries | | 2.5 | |
Containers & Glass Products | | 2.5 | |
Air Transport | | 2.3 | |
Conglomerates | | 2.2 | |
Publishing | | 2.2 | |
Utilities | | 2.0 | |
Clothing/Textiles | | 1.5 | |
Food Service | | 1.5 | |
Forest Products | | 1.5 | |
Food/Drug Retailers | | 1.0 | |
Nonferrous Metals/Minerals | | 1.0 | |
Aerospace & Defense | | 0.9 | |
Ecological Services & Equip. | | 0.9 | |
Surface Transport | | 0.8 | |
Beverage & Tobacco | | 0.8 | |
Home Furnishings | | 0.7 | |
Cosmetics/Toiletries | | 0.7 | |
Insurance | | 0.5 | |
Equipment Leasing | | 0.4 | |
Drugs | | 0.3 | |
(2) Reflects the Fund’s investments as of October 31, 2006. Industries are shown as a percentage of the Fund’s total loan and corporate bond and note investments. Portfolio information may not be representative of current or future investments and may change due to active management.
Diversification by Sectors(3)
By total investments
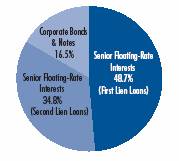
(3) Diversification by Sectors reflects the Fund’s investments as of October 31, 2006. Sectors are shown as a pecentage of the Fund’s total investments. Fund statistics may not be representative of the Fund’s current or future investments and may change due to active management.
2
Eaton Vance Credit Opportunities Fund as of October 31, 2006
PORTFOLIO OF INVESTMENTS (Unaudited)
| Senior, Floating Rate Interests — 136.2%(1) | | | |
Principal
Amount | |
Borrower/Tranche Description | |
Value | |
| Aerospace and Defense — 1.5% | | | |
| Forgins International Holdings | | | |
| $ | 951,950 | | | Term Loan, 9.71%, Maturing February 11, 2015 | | $ | 960,677 | | |
| Wesco Aircraft Hardware Corp. | | | |
| | 1,000,000 | | | Term Loan, 11.13%, Maturing September 29, 2014 | | | 1,015,000 | | |
| | | | | | | $ | 1,975,677 | | |
| Air Transport — 3.7% | | | |
| Airport Development and Investment | | | |
| GBP | 1,000,000 | | | Term Loan, 9.12%, Maturing April 7, 2011 | | $ | 1,911,833 | | |
| Delta Air Lines, Inc. | | | |
| | 1,000,000 | | | Term Loan, 10.02%, Maturing March 16, 2008 | | | 1,021,019 | | |
| Northwest Airlines, Inc. | | | |
| | 1,000,000 | | | DIP Loan, 7.90%, Maturing August 21, 2008 | | | 1,004,375 | | |
| United Airlines, Inc. | | | |
| | 124,375 | | | Term Loan, 9.13%, Maturing February 1, 2012 | | | 126,552 | | |
| | 870,625 | | | Term Loan, 9.25%, Maturing February 1, 2012 | | | 885,861 | | |
| | | | | | | $ | 4,949,640 | | |
| Automotive — 8.0% | | | |
| Axletech International Holding, Inc. | | | |
| $ | 909,091 | | | Term Loan, 11.87%, Maturing April 21, 2013 | | $ | 917,425 | | |
| Collins & Aikman Products Co. | | | |
| | 1,903,861 | | | Term Loan, 11.75%, Maturing August 31, 2009(5) | | | 692,529 | | |
| | 593,278 | | | Revolving Loan, 11.75%, Maturing August 31, 2009(5) | | | 217,288 | | |
| Dana Corp. | | | |
| | 1,000,000 | | | DIP Loan, 7.65%, Maturing April 13, 2008 | | | 1,001,500 | | |
| Dayco Products, LLC | | | |
| | 2,000,000 | | | Term Loan, 11.28%, Maturing December 31, 2011 | | | 2,046,666 | | |
| Goodyear Tire & Rubber Co. | | | |
| | 2,000,000 | | | Term Loan, 8.89%, Maturing March 1, 2011 | | | 2,029,166 | | |
| Insurance Auto Auctions, Inc. | | | |
| | 445,652 | | | Term Loan, 7.54%, Maturing May 19, 2012(2) | | | 448,437 | | |
| R.J. Tower Corp. | | | |
| | 1,000,000 | | | DIP Revolving Loan, 8.94%, Maturing February 2, 2007 | | | 970,625 | | |
| Trimas Corp. | | | |
| | 281,250 | | | Term Loan, 8.13%, Maturing August 2, 2011 | | | 283,359 | | |
| | 1,218,750 | | | Term Loan, 8.25%, Maturing August 2, 2013 | | | 1,227,891 | | |
| Vanguard Car Rental USA | | | |
| | 935,000 | | | Term Loan, 8.35%, Maturing June 14, 2013 | | | 942,947 | | |
| | | | | | | $ | 10,777,833 | | |
Principal
Amount | |
Borrower/Tranche Description | |
Value | |
| Beverage and Tobacco — 1.3% | | | |
| Le-Nature's, Inc. | | | |
| $ | 1,000,000 | | | Term Loan, 9.39%, Maturing March 1, 2011(3) | | $ | 850,000 | | |
| Sunny Delight Beverages Co. | | | |
| | 957,447 | | | Term Loan, 11.39%, Maturing August 20, 2010 | | | 946,975 | | |
| | | | | | | $ | 1,796,975 | | |
| Building and Development — 5.4% | | | |
| LNR Property Corp. | | | |
| $ | 1,000,000 | | | Term Loan, 8.22%, Maturing July 3, 2011 | | $ | 1,004,896 | | |
| Panolam Industries Holdings, Inc. | | | |
| | 1,544,130 | | | Term Loan, 8.12%, Maturing September 30, 2012 | | | 1,551,851 | | |
| Rubicon GSA II, LLC | | | |
| | 1,000,000 | | | Term Loan, 8.07%, Maturing July 31, 2008 | | | 1,000,000 | | |
| TE / Tousa Senior, LLC | | | |
| | 1,000,000 | | | Term Loan, 8.25%, Maturing August 1, 2008 | | | 769,500 | | |
| TRU 2005 RE Holding Co. | | | |
| | 2,000,000 | | | Term Loan, 8.32%, Maturing December 9, 2008 | | | 2,006,250 | | |
| United Subcontractors, Inc. | | | |
| | 1,000,000 | | | Term Loan, 12.86%, Maturing June 27, 2013 | | | 970,000 | | |
| | | | | | | $ | 7,302,497 | | |
| Business Equipment and Services — 8.6% | | | |
| Affinion Group, Inc. | | | |
| $ | 1,950,000 | | | Term Loan, 8.17%, Maturing October 17, 2012 | | $ | 1,963,102 | | |
| Allied Security Holdings, LLC | | | |
| | 995,455 | | | Term Loan, 8.37%, Maturing June 30, 2010 | | | 1,004,165 | | |
| Audatex North America, Inc. | | | |
| EUR | 1,000,000 | | | Term Loan, 9.13%, Maturing January 13, 2013 | | | 1,307,063 | | |
| Language Line, Inc. | | | |
| | 555,079 | | | Term Loan, 9.63%, Maturing June 11, 2011 | | | 559,156 | | |
| N.E.W. Holdings I, LLC | | | |
| | 200,000 | | | Term Loan, 12.35%, Maturing February 8, 2014 | | | 204,000 | | |
| Nielsen Finance, LLC | | | |
| | 1,000,000 | | | Term Loan, 8.19%, Maturing August 9, 2013 | | | 1,004,766 | | |
| Quantum Corp. | | | |
| | 500,000 | | | Term Loan, 12.94%, Maturing August 22, 2013 | | | 498,125 | | |
| Quintiles Transnational Corp. | | | |
| | 2,000,000 | | | Term Loan, 9.37%, Maturing March 31, 2014 | | | 2,036,562 | | |
| Sungard Data Systems, Inc. | | | |
| | 989,924 | | | Term Loan, 8.00%, Maturing February 11, 2013 | | | 1,000,401 | | |
| TDS Investor Corp. | | | |
| | 910,778 | | | Term Loan, 8.37%, Maturing August 23, 2013 | | | 914,682 | | |
| | 89,222 | | | Term Loan, 8.37%, Maturing August 23, 2013 | | | 89,604 | | |
See notes to financial statements
3
Eaton Vance Credit Opportunities Fund as of October 31, 2006
PORTFOLIO OF INVESTMENTS (Unaudited) CONT'D
Principal
Amount | |
Borrower/Tranche Description | |
Value | |
| Business Equipment and Services (continued) | | | |
| Western Inventory Services | | | |
| $ | 975,016 | | | Term Loan, 7.82%, Maturing March 31, 2011 | | $ | 979,891 | | |
| | | | | | | $ | 11,561,517 | | |
| Cable and Satellite Television — 9.7% | | | |
| Atlantic Broadband Finance, LLC | | | |
| $ | 750,000 | | | Term Loan, 0.00%, Maturing February 10, 2011(2) | | $ | 760,312 | | |
| Cequel Communications, LLC | | | |
| | 2,010,089 | | | Term Loan, 11.49%, Maturing May 5, 2014 | | | 1,997,944 | | |
| Charter Communications Operating, LLC | | | |
| | 1,006,209 | | | Term Loan, 8.01%, Maturing April 28, 2013 | | | 1,016,019 | | |
| Insight Midwest Holdings, LLC | | | |
| | 312,500 | | | Term Loan, 0.00%, Maturing April 6, 2014(2) | | | 314,966 | | |
| | 937,500 | | | Term Loan, 7.57%, Maturing April 6, 2014 | | | 944,897 | | |
| NTL Investment Holdings, Ltd. | | | |
| GBP | 1,000,000 | | | Term Loan, 7.64%, Maturing March 30, 2013 | | | 1,933,475 | | |
| Persona Communications Corp. | | | |
| | 1,000,000 | | | Term Loan, 11.37%, Maturing April 12, 2014 | | | 1,006,250 | | |
| PKS Media (Netherlands) B.V. | | | |
| EUR | 1,000,000 | | | Term Loan, 5.74%, Maturing October 5, 2013 | | | 1,294,570 | | |
| EUR | 1,000,000 | | | Term Loan, 6.24%, Maturing October 5, 2014 | | | 1,300,654 | | |
| UPC Broadband Holding B.V. | | | |
| EUR | 441,667 | | | Term Loan, 5.51%, Maturing March 31, 2013 | | | 564,337 | | |
| EUR | 500,000 | | | Term Loan, 5.51%, Maturing December 31, 2013 | | | 638,968 | | |
| Ypso Holding S.A. | | | |
| EUR | 320,000 | | | Term Loan, 8.09%, Maturing July 28, 2014 | | | 400,373 | | |
| EUR | 680,000 | | | Term Loan, 8.09%, Maturing July 28, 2015 | | | 850,792 | | |
| | | | | | | $ | 13,023,557 | | |
| Chemicals and Plastics — 5.9% | | | |
| Brenntag Holding GmbH and Co. KG | | | |
| $ | 2,000,000 | | | Term Loan, 12.08%, Maturing December 23, 2015 | | $ | 2,049,062 | | |
| Cognis Deutschland Eins GmbH | | | |
| | 500,000 | | | Term Loan, 10.03%, Maturing November 11, 2009 | | | 512,500 | | |
| Ineos Group | | | |
| EUR | 2,000,000 | | | Term Loan, 7.28%, Maturing December 14, 2012 | | | 2,598,490 | | |
| Lucite International Group Holdings | | | |
| | 259,542 | | | Term Loan, 0.00%, Maturing July 7, 2013(2) | | | 261,735 | | |
| | 738,607 | | | Term Loan, 8.07%, Maturing July 7, 2013 | | | 744,848 | | |
| Solo Cup Co. | | | |
| | 750,000 | | | Term Loan, 11.37%, Maturing March 31, 2012 | | | 769,687 | | |
| Solutia, Inc. | | | |
| | 1,000,000 | | | DIP Loan, 8.96%, Maturing March 31, 2007 | | | 1,003,750 | | |
| | | | | | | $ | 7,940,072 | | |
Principal
Amount | |
Borrower/Tranche Description | |
Value | |
| Clothing / Textiles — 1.5% | | | |
| Hanesbrands, Inc. | | | |
| $ | 2,000,000 | | | Term Loan, 9.19%, Maturing March 5, 2014 | | $ | 2,052,858 | | |
| | | | | | | $ | 2,052,858 | | |
| Conglomerates — 3.5% | | | |
| Euramax International, Inc. | | | |
| $ | 1,000,000 | | | Term Loan, 12.37%, Maturing June 28, 2013 | | $ | 1,007,500 | | |
| Johnson Diversey, Inc. | | | |
| | 455,341 | | | Term Loan, 7.97%, Maturing December 16, 2011 | | | 459,539 | | |
| Polymer Group, Inc. | | | |
| | 994,987 | | | Term Loan, 7.61%, Maturing November 22, 2012 | | | 997,060 | | |
| PP Acquisition Corp. | | | |
| EUR | 1,000,000 | | | Term Loan, 6.37%, Maturing November 12, 2011 | | | 1,281,136 | | |
| RGIS Holdings, LLC | | | |
| | 995,065 | | | Term Loan, 7.87%, Maturing February 15, 2013 | | | 994,755 | | |
| | | | | | | $ | 4,739,990 | | |
| Containers and Glass Products — 3.0% | | | |
| Bluegrass Container Co. | | | |
| $ | 484,848 | | | Term Loan, 10.32%, Maturing December 30, 2013 | | $ | 491,440 | | |
| | 1,515,152 | | | Term Loan, 10.32%, Maturing December 30, 2013 | | | 1,535,748 | | |
| JSG Acquisitions | | | |
| EUR | 500,000 | | | Term Loan, 5.96%, Maturing December 31, 2014 | | | 642,658 | | |
| EUR | 500,000 | | | Term Loan, 6.46%, Maturing December 31, 2014 | | | 645,514 | | |
| Kranson Industries, Inc. | | | |
| | 700,000 | | | Term Loan, 8.17%, Maturing July 31, 2013 | | | 703,937 | | |
| | | | | | | $ | 4,019,297 | | |
| Cosmetics / Toiletries — 1.0% | | | |
| American Safety Razor Co. | | | |
| $ | 1,000,000 | | | Term Loan, 11.72%, Maturing July 31, 2014 | | $ | 1,020,000 | | |
| Revlon Consumer Products Corp. | | | |
| | 334,867 | | | Term Loan, 11.44%, Maturing July 9, 2010 | | | 343,796 | | |
| | | | | | | $ | 1,363,796 | | |
| Drugs — 0.6% | | | |
| Warner Chilcott Corp. | | | |
| $ | 128,049 | | | Term Loan, 7.87%, Maturing January 18, 2012 | | $ | 128,872 | | |
| | 121,324 | | | Term Loan, 7.87%, Maturing January 18, 2012 | | | 121,840 | | |
| | 24,265 | | | Term Loan, 7.87%, Maturing January 18, 2012 | | | 24,368 | | |
| | 466,396 | | | Term Loan, 7.93%, Maturing January 18, 2012 | | | 469,394 | | |
| | | | | | | $ | 744,474 | | |
See notes to financial statements
4
Eaton Vance Credit Opportunities Fund as of October 31, 2006
PORTFOLIO OF INVESTMENTS (Unaudited) CONT'D
Principal
Amount | |
Borrower/Tranche Description | |
Value | |
| Ecological Services and Equipment — 1.4% | | | |
| PHS Group PIC | | | |
| GBP | 500,000 | | | Term Loan, 7.69%, Maturing July 5, 2010 | | $ | 958,393 | | |
| GBP | 500,000 | | | Term Loan, 8.19%, Maturing July 5, 2011 | | | 963,876 | | |
| | | | | | | $ | 1,922,269 | | |
| Electronics / Electrical — 8.4% | | | |
| Advanced Micro Devices, Inc. | | | |
| $ | 625,000 | | | Term Loan, 7.57%, Maturing December 31, 2013 | | $ | 625,000 | | |
| Aspect Software, Inc. | | | |
| | 2,000,000 | | | Term Loan, 12.38%, Maturing July 11, 2013 | | | 2,008,334 | | |
| Infor Enterprise Solutions Holdings | | | |
| | 1,314,286 | | | Term Loan, 9.12%, Maturing July 28, 2012 | | | 1,326,059 | | |
| | 685,714 | | | Term Loan, 9.12%, Maturing July 28, 2012 | | | 691,857 | | |
| Network Solutions, LLC | | | |
| | 1,989,975 | | | Term Loan, 10.37%, Maturing January 9, 2012 | | | 2,014,850 | | |
| Open Solutions, Inc. | | | |
| | 900,000 | | | Term Loan, 11.90%, Maturing March 3, 2012 | | | 922,500 | | |
| Rayovac Corp. | | | |
| | 1,828,974 | | | Term Loan, 8.39%, Maturing February 7, 2012 | | | 1,836,486 | | |
| Telcordia Technologies, Inc. | | | |
| | 1,989,899 | | | Term Loan, 8.15%, Maturing September 15, 2012 | | | 1,919,009 | | |
| | | | | | | $ | 11,344,095 | | |
| Equipment Leasing — 0.7% | | | |
| Awas Capital, Inc. | | | |
| $ | 974,235 | | | Term Loan, 11.44%, Maturing March 22, 2013 | | $ | 983,978 | | |
| | | | | | | $ | 983,978 | | |
| Financial Intermediaries — 2.6% | | | |
| Citgo III, Ltd. | | | |
| $ | 500,000 | | | Term Loan, 8.14%, Maturing August 3, 2013 | | $ | 503,906 | | |
| | 500,000 | | | Term Loan, 8.64%, Maturing August 3, 2014 | | | 505,781 | | |
| E.A. Viner International Co. | | | |
| | 1,496,250 | | | Term Loan, 8.12%, Maturing July 31, 2013 | | | 1,511,212 | | |
| LPL Holdings, Inc. | | | |
| | 1,000,000 | | | Term Loan, 8.30%, Maturing June 30, 2013 | | | 1,012,656 | | |
| | | | | | | $ | 3,533,555 | | |
| Food Products — 5.2% | | | |
| Acosta, Inc. | | | |
| $ | 997,500 | | | Term Loan, 8.08%, Maturing July 28, 2013 | | $ | 1,007,682 | | |
| Black Lion Beverages III B.V. | | | |
| EUR | 2,000,000 | | | Term Loan, 8.31%, Maturing January 24, 2016 | | | 2,606,679 | | |
Principal
Amount | |
Borrower/Tranche Description | |
Value | |
| Food Products (continued) | | | |
| Picard Surgeles S.A. | | | |
| EUR | 500,000 | | | Term Loan, 5.44%, Maturing June 4, 2014 | | $ | 643,440 | | |
| QCE Finance, LLC | | | |
| | 2,000,000 | | | Term Loan, 11.12%, Maturing November 5, 2013 | | $ | 2,033,000 | | |
| Ruby Acquisitions Ltd. | | | |
| EUR | 500,000 | | | Term Loan, 8.82%, Maturing July 5, 2015 | | | 650,938 | | |
| | | | | | | $ | 6,941,739 | | |
| Food Service — 1.6% | | | |
| SSP Financing, Ltd. | | | |
| EUR | 660,290 | | | Term Loan, 5.93%, Maturing June 15, 2014 | | | 849,784 | | |
| EUR | 145,182 | | | Term Loan, 5.93%, Maturing June 15, 2014 | | | 186,693 | | |
| EUR | 660,290 | | | Term Loan, 6.43%, Maturing June 15, 2015 | | | 853,647 | | |
| EUR | 145,182 | | | Term Loan, 6.43%, Maturing June 15, 2015 | | | 187,388 | | |
| | | | | | | $ | 2,077,512 | | |
| Food / Drug Retailers — 1.5% | | | |
| Roundy's Supermarkets, Inc. | | | |
| $ | 994,987 | | | Term Loan, 8.42%, Maturing November 3, 2011 | | $ | 1,004,067 | | |
| The Jean Coutu Group (PJC), Inc. | | | |
| | 994,472 | | | Term Loan, 7.94%, Maturing July 30, 2011 | | | 998,967 | | |
| | | | | | | $ | 2,003,034 | | |
| Forest Products — 2.2% | | | |
| Georgia-Pacific Corp. | | | |
| $ | 2,000,000 | | | Term Loan, 8.39%, Maturing December 23, 2013 | | $ | 2,028,046 | | |
| NewPage Corp. | | | |
| | 901,983 | | | Term Loan, 8.36%, Maturing May 2, 2011 | | | 913,258 | | |
| | | | | | | $ | 2,941,304 | | |
| Healthcare — 8.4% | | | |
| FHC Health Systems, Inc. | | | |
| $ | 2,000,000 | | | Term Loan, 11.40%, Maturing June 27, 2008 | | $ | 2,075,000 | | |
| HealthSouth Corp. | | | |
| | 1,995,000 | | | Term Loan, 8.62%, Maturing March 10, 2013 | | | 2,005,530 | | |
| Matria Healthcare, Inc. | | | |
| | 2,000,000 | | | Term Loan, 12.15%, Maturing January 19, 2007 | | | 2,040,000 | | |
| Medassets Inc. | | | |
| | 500,000 | | | Term Loan, 7.82%, Maturing October 23, 2013 | | | 500,000 | | |
| Moon Acquisition Co. AB | | | |
| EUR | 500,000 | | | Term Loan, 5.88%, Maturing November 4, 2013 | | | 647,023 | | |
| EUR | 1,000,000 | | | Term Loan, 5.88%, Maturing November 4, 2013 | | | 1,292,304 | | |
| EUR | 500,000 | | | Term Loan, 6.38%, Maturing November 4, 2014 | | | 649,755 | | |
See notes to financial statements
5
Eaton Vance Credit Opportunities Fund as of October 31, 2006
PORTFOLIO OF INVESTMENTS (Unaudited) CONT'D
Principal
Amount | |
Borrower/Tranche Description | |
Value | |
| Healthcare (continued) | | | |
| National Mentor Holdings, Inc. | | | |
| $ | 56,000 | | | Term Loan, 5.32%, Maturing June 29, 2013 | | $ | 56,280 | | |
| | 941,640 | | | Term Loan, 7.87%, Maturing June 29, 2013 | | | 946,348 | | |
| Sheridan Healthcare, Inc. | | | |
| | 1,000,000 | | | Term Loan, 12.37%, Maturing November 9, 2012 | | | 1,008,750 | | |
| | | | | | | $ | 11,220,990 | | |
| Home Furnishings — 1.1% | | | |
| National Bedding Co., LLC | | | |
| $ | 1,500,000 | | | Term Loan, 10.37%, Maturing August 31, 2012 | | $ | 1,514,063 | | |
| | | | | | | $ | 1,514,063 | | |
| Industrial Equipment — 4.7% | | | |
| Aearo Technologies, Inc. | | | |
| $ | 2,000,000 | | | Term Loan, 11.87%, Maturing September 24, 2013 | | $ | 2,030,000 | | |
| Gleason Corp. | | | |
| | 2,000,000 | | | Term Loan, 10.94%, Maturing December 31, 2013 | | | 2,025,000 | | |
| Prysmian S.R.L | | | |
| EUR | 500,000 | | | Term Loan, 7.88%, Maturing August 22, 2014 | | | 641,188 | | |
| EUR | 500,000 | | | Term Loan, 6.29%, Maturing August 22, 2015 | | | 644,025 | | |
| TFS Acquisition Corp. | | | |
| | 1,000,000 | | | Term Loan, 8.92%, Maturing August 11, 2013 | | | 1,007,500 | | |
| | | | | | | $ | 6,347,713 | | |
| Insurance — 0.8% | | | |
| CCC Information Services Group | | | |
| $ | 1,000,000 | | | Term Loan, 7.87%, Maturing February 10, 2013 | | $ | 1,005,625 | | |
| | | | | | | $ | 1,005,625 | | |
| Leisure Goods / Activities / Movies — 8.5% | | | |
| Bombardier Recreational Product | | | |
| $ | 2,000,000 | | | Term Loan, 8.13%, Maturing June 28, 2013 | | $ | 2,000,000 | | |
| Butterfly Wendel US, Inc. | | | |
| | 250,000 | | | Term Loan, 8.15%, Maturing June 22, 2013 | | | 253,477 | | |
| | 250,000 | | | Term Loan, 7.90%, Maturing June 22, 2014 | | | 252,227 | | |
| Carmike Cinemas, Inc. | | | |
| | 1,989,925 | | | Term Loan, 8.65%, Maturing May 19, 2012 | | | 2,011,482 | | |
| Cedar Fair, L.P. | | | |
| | 1,000,000 | | | Term Loan, 7.87%, Maturing August 30, 2012 | | | 1,012,109 | | |
| Fender Musical Instruments Co. | | | |
| | 2,000,000 | | | Term Loan, 11.38%, Maturing October 1, 2012 | | | 2,020,000 | | |
| Red Football Ltd. | | | |
| GBP | 1,500,000 | | | Term Loan, 10.08%, Maturing August 16, 2016 | | | 2,923,457 | | |
Principal
Amount | |
Borrower/Tranche Description | |
Value | |
| Leisure Goods / Activities / Movies (continued) | | | |
| Six Flags Theme Parks, Inc. | | | |
| $ | 994,911 | | | Term Loan, 8.66%, Maturing June 30, 2009 | | $ | 1,007,115 | | |
| | | | | | | $ | 11,479,867 | | |
| Lodging and Casinos — 4.5% | | | |
| Bally Technologies, Inc. | | | |
| $ | 1,988,791 | | | Term Loan, 9.33%, Maturing September 5, 2009 | | $ | 1,995,836 | | |
| Fairmont Hotels and Resorts, Inc. | | | |
| | 1,153,464 | | | Term Loan, 8.57%, Maturing May 12, 2011 | | | 1,163,557 | | |
| Gala Electric Casinos, Ltd. | | | |
| GBP | 1,000,000 | | | Term Loan, 8.05%, Maturing December 12, 2014 | | | 1,933,755 | | |
| VML US Finance, LLC | | | |
| | 1,000,000 | | | Term Loan, 8.12%, Maturing May 25, 2013 | | | 1,007,734 | | |
| | | | | | | $ | 6,100,882 | | |
| Nonferrous Metals / Minerals — 1.5% | | | |
| Magnum Coal Co. | | | |
| $ | 90,909 | | | Term Loan, 8.57%, Maturing March 15, 2013 | | $ | 91,250 | | |
| | 904,545 | | | Term Loan, 8.62%, Maturing March 15, 2013 | | | 907,937 | | |
| Murray Energy Corp. | | | |
| | 1,000,000 | | | Term Loan, 13.90%, Maturing August 9, 2011 | | | 1,025,000 | | |
| | | | | | | $ | 2,024,187 | | |
| Oil and Gas — 5.5% | | | |
| Coffeyville Resources, LLC | | | |
| $ | 2,000,000 | | | Term Loan, 12.13%, Maturing June 24, 2013 | | $ | 2,063,750 | | |
| Concho Resources, Inc. | | | |
| | 1,995,000 | | | Term Loan, 9.37%, Maturing July 6, 2011(3) | | | 1,988,816 | | |
| El Paso Corp. | | | |
| | 325,000 | | | Term Loan, 5.33%, Maturing July 31, 2011(4) | | | 327,582 | | |
| Primary Natural Resources, Inc. | | | |
| | 1,990,000 | | | Term Loan, 9.35%, Maturing July 28, 2010(3) | | | 1,983,831 | | |
| Targa Resources, Inc. | | | |
| | 194,332 | | | Term Loan, 7.62%, Maturing October 31, 2012 | | | 195,547 | | |
| | 801,619 | | | Term Loan, 7.63%, Maturing October 31, 2012 | | | 806,630 | | |
| | | | | | | $ | 7,366,156 | | |
| Publishing — 3.4% | | | |
| Gatehouse Media Operating, Inc. | | | |
| $ | 391,579 | | | Term Loan, 7.57%, Maturing June 6, 2013 | | $ | 392,558 | | |
| Philadelphia Newspapers, LLC | | | |
| | 997,500 | | | Term Loan, 8.12%, Maturing June 29, 2013 | | | 993,759 | | |
See notes to financial statements
6
Eaton Vance Credit Opportunities Fund as of October 31, 2006
PORTFOLIO OF INVESTMENTS (Unaudited) CONT'D
Principal
Amount | |
Borrower/Tranche Description | |
Value | |
| Publishing (continued) | | | |
| Springer Science+Business Media | | | |
| EUR | 536,240 | | | Term Loan, 5.63%, Maturing May 5, 2011 | | | 691,369 | | |
| EUR | 231,880 | | | Term Loan, 6.00%, Maturing May 5, 2012 | | | 300,338 | | |
| EUR | 231,880 | | | Term Loan, 6.00%, Maturing May 5, 2012 | | | 300,347 | | |
| Xsys, Inc. | | | |
| EUR | 1,500,000 | | | Term Loan, 9.31%, Maturing September 27, 2015 | | | 1,949,825 | | |
| | | | | | | $ | 4,628,196 | | |
| Radio and Television — 4.9% | | | |
| CMP Susquehanna Corp. | | | |
| $ | 1,000,000 | | | Term Loan, 0.00%, Maturing May 5, 2011(2) | | $ | 950,000 | | |
| HEI Acquisition, LLC | | | |
| | 1,000,000 | | | Term Loan, 8.38%, Maturing December 31, 2011 | | | 1,000,000 | | |
| P7S1 Holding II S.A.R.L. | | | |
| EUR | 2,000,000 | | | Term Loan, 7.26%, Maturing July 18, 2011 | | | 2,563,868 | | |
| PanAmSat Corp. | | | |
| | 1,000,000 | | | Term Loan, 7.87%, Maturing January 3, 2014 | | | 1,009,514 | | |
| Patriot Media and Communications CNJ, LLC | | | |
| | 1,000,000 | | | Term Loan, 10.50%, Maturing October 6, 2013 | | | 1,017,188 | | |
| | | | | | | $ | 6,540,570 | | |
| Retailers (Except Food and Drug) — 3.9% | | | |
| La Petite Academy, Inc. | | | |
| $ | 1,000,000 | | | Term Loan, 12.61%, Maturing February 21, 2013 | | $ | 1,012,500 | | |
| Neiman Marcus Group, Inc. | | | |
| | 500,000 | | | Term Loan, 7.64%, Maturing April 5, 2013 | | | 504,532 | | |
| Oriental Trading Co., Inc. | | | |
| | 750,000 | | | Term Loan, 11.47%, Maturing January 31, 2013 | | | 753,125 | | |
| Pep Boys - Manny, Moe, & Jack, (The) | | | |
| | 1,990,000 | | | Term Loan, 8.07%, Maturing January 27, 2011 | | | 2,014,875 | | |
| Savers, Inc. | | | |
| | 456,853 | | | Term Loan, 8.16%, Maturing August 11, 2012 | | | 459,994 | | |
| | 543,147 | | | Term Loan, 8.16%, Maturing August 11, 2012 | | | 546,881 | | |
| | | | | | | $ | 5,291,907 | | |
| Surface Transport — 1.4% | | | |
| Ozburn-Hessey Holding Co., LLC | | | |
| $ | 997,052 | | | Term Loan, 8.78%, Maturing August 9, 2012 | | $ | 998,299 | | |
| Sirva Worldwide, Inc. | | | |
| | 908,863 | | | Term Loan, 11.61%, Maturing December 1, 2010 | | | 840,415 | | |
| | | | | | | $ | 1,838,714 | | |
Principal
Amount | |
Borrower/Tranche Description | |
Value | |
| Telecommunications — 7.2% | | | |
| American Cellular Corp. | | | |
| $ | 500,000 | | | Term Loan, 7.63%, Maturing August 7, 2013 | | $ | 503,125 | | |
| | 500,000 | | | Term Loan, 7.63%, Maturing August 7, 2013(2) | | | 501,875 | | |
| Asurion Corp. | | | |
| | 2,000,000 | | | Term Loan, 11.58%, Maturing January 13, 2013 | | | 2,026,250 | | |
| BCM Luxembourg Ltd. | | | |
| EUR | 1,000,000 | | | Term Loan, 7.81%, Maturing March 31, 2016 | | | 1,313,159 | | |
| IPC Acquisition Corp. | | | |
| | 1,000,000 | | | Term Loan, 11.87%, Maturing September 29, 2014 | | | 1,007,500 | | |
| NTelos, Inc. | | | |
| | 994,960 | | | Term Loan, 7.57%, Maturing August 24, 2011 | | | 999,438 | | |
| TDC AS (Nordic Telephone Company) | | | |
| EUR | 500,000 | | | Term Loan, 5.54%, Maturing April 10, 2014 | | | 644,424 | | |
| EUR | 500,000 | | | Term Loan, 6.04%, Maturing April 10, 2015 | | | 647,136 | | |
| Triton PCS, Inc. | | | |
| | 994,937 | | | Term Loan, 8.57%, Maturing November 18, 2009 | | | 1,004,471 | | |
| Westcom Corp. | | | |
| | 1,000,000 | | | Term Loan, 12.54%, Maturing May 17, 2011 | | | 1,006,875 | | |
| | | | | | | $ | 9,654,253 | | |
| Utilities — 3.1% | | | |
| Astoria Generating Co. | | | |
| $ | 2,000,000 | | | Term Loan, 9.14%, Maturing August 23, 2013 | | $ | 2,032,916 | | |
| BRSP, LLC | | | |
| | 1,000,000 | | | Term Loan, 8.58%, Maturing July 13, 2009 | | | 1,005,000 | | |
| Calpine Corp. | | | |
| | 1,095,745 | | | DIP Loan, 9.37%, Maturing February 27, 2008 | | | 1,117,203 | | |
| | | | | | | $ | 4,155,119 | | |
| | | Total Senior, Floating Rate Interests
(identified cost $182,956,706) | | $ | 183,163,911 | | |
| Corporate Bonds & Notes — 26.9% | | | |
Principal Amount
(000's omitted) | | Security | | Value | |
| Aerospace and Defense — 0.0% | | | |
| Argo Tech Corp., Sr. Notes | | | |
| $ | 20 | | | 9.25%, 6/1/11 | | $ | 20,850 | | |
| | | | | | | $ | 20,850 | | |
See notes to financial statements
7
Eaton Vance Credit Opportunities Fund as of October 31, 2006
PORTFOLIO OF INVESTMENTS (Unaudited) CONT'D
Principal Amount
(000's omitted) | | Security | | Value | |
| Automotive — 3.5% | | | |
| Altra Industrial Motion, Inc. | | | |
| $ | 1,000 | | | 9.00%, 12/1/11 | | $ | 1,025,000 | | |
| Ford Motor Credit Co. | | | |
| | 2,000 | | | 6.625%, 6/16/08 | | | 1,962,980 | | |
| Ford Motor Credit Co., Sr. Notes | | | |
| | 375 | | | 9.875%, 8/10/11 | | | 387,859 | | |
| General Motors Acceptance Corp. | | | |
| | 255 | | | 8.00%, 11/1/31 | | | 273,990 | | |
| Tenneco Automotive, Inc., Series B | | | |
| | 1,000 | | | 10.25%, 7/15/13 | | | 1,100,000 | | |
| | | | | | | $ | 4,749,829 | | |
| Building and Development — 0.3% | | | |
| Goodman Global Holdings, Inc., Sr. Notes, Variable Rate | | | |
| $ | 155 | | | 8.329%, 6/15/12 | | $ | 157,712 | | |
| Interline Brands, Inc., Sr. Sub. Notes | | | |
| | 50 | | | 8.125%, 6/15/14 | | | 51,375 | | |
| Nortek, Inc., Sr. Sub. Notes | | | |
| | 150 | | | 8.50%, 9/1/14 | | | 144,000 | | |
| Panolam Industries International, Sr. Sub. Notes | | | |
| | 10 | | | 10.75%, 10/1/13(4) | | | 10,250 | | |
| | | | | | | $ | 363,337 | | |
| Business Equipment and Services — 1.3% | | | |
| Education Management, LLC, Sr. Sub. Notes | | | |
| $ | 1,045 | | | 10.25%, 6/1/16(4) | | $ | 1,089,412 | | |
| Hertz Corp., Sr. Sub. Notes | | | |
| | 595 | | | 8.875%, 1/1/14(4) | | | 624,750 | | |
| Lamar Media Corp., Sr. Sub. Notes | | | |
| | 70 | | | 6.625%, 8/15/15(4) | | | 67,725 | | |
| Sungard Data Systems, Inc. | | | |
| | 6 | | | 10.25%, 8/15/15 | | | 6,315 | | |
| | | | | | | $ | 1,788,202 | | |
| Cable and Satellite Television — 1.7% | | | |
| Cablevision Systems Corp., Sr. Notes, Series B, Variable Rate | | | |
| $ | 180 | | | 9.87%, 4/1/09 | | $ | 189,450 | | |
| CCH I, LLC/CCH I Capital Co. | | | |
| | 50 | | | 11.00%, 10/1/15 | | | 48,437 | | |
| CCO Holdings, LLC / CCO Capital Corp., Sr. Notes | | | |
| | 700 | | | 8.75%, 11/15/13 | | | 715,750 | | |
| CSC Holdings, Inc., Series B | | | |
| | 70 | | | 8.125%, 8/15/09 | | | 72,537 | | |
Principal Amount
(000's omitted) | | Security | | Value | |
| Cable and Satellite Television (continued) | | | |
| CSC Holdings, Inc., Sr. Notes, Seriers B | | | |
| $ | 10 | | | 8.125%, 7/15/09 | | $ | 10,362 | | |
| Mediacom Broadband Corp., LLC, Sr. Notes | | | |
| | 125 | | | 8.50%, 10/15/15(4) | | | 125,469 | | |
| National Cable, PLC | | | |
| | 1,070 | | | 8.75%, 4/15/14 | | | 1,130,187 | | |
| | | | | | | $ | 2,292,192 | | |
| Chemicals and Plastics — 0.4% | | | |
| Equistar Chemical, Sr. Notes | | | |
| $ | 40 | | | 10.625%, 5/1/11 | | $ | 43,000 | | |
| Hexion U.S. Finance/Nova Scotia Finance | | | |
| | 25 | | | 9.00%, 7/15/14 | | | 28,250 | | |
| Ineos Group Holdings PLC | | | |
| | 440 | | | 8.50%, 2/15/16(4) | | | 425,700 | | |
| Reichhold Industries, Inc., Sr. Notes | | | |
| | 70 | | | 9.00%, 8/15/14(4) | | | 70,000 | | |
| | | | | | | $ | 566,950 | | |
| Clothing / Textiles — 1.0% | | | |
| Levi Strauss & Co., Sr. Notes | | | |
| $ | 50 | | | 9.75%, 1/15/15 | | $ | 53,250 | | |
| | 200 | | | 8.875%, 4/1/16 | | | 206,500 | | |
| Oxford Industries, Inc., Sr. Notes | | | |
| | 1,000 | | | 8.875%, 6/1/11 | | | 1,031,250 | | |
| Perry Ellis International, Inc., Sr. Sub. Notes | | | |
| | 15 | | | 8.875%, 9/15/13 | | | 15,112 | | |
| | | | | | | $ | 1,306,112 | | |
| Conglomerates — 0.0% | | | |
| Mueller Holdings, Inc., (0.00%) until 4/15/09) | | | |
| $ | 5 | | | 14.75%, 4/15/14 | | $ | 4,425 | | |
| | | | | | | $ | 4,425 | | |
| Containers and Glass Products — 1.0% | | | |
| Berry Plastics Holding Corp. | | | |
| $ | 80 | | | 8.875%, 9/15/14(4) | | $ | 81,200 | | |
| Berry Plastics Holding Corp., Variable Rate | | | |
| | 60 | | | 9.265%, 9/15/14(4) | | | 60,975 | | |
| Intertape Polymer US, Inc., Sr. Sub. Notes | | | |
| | 20 | | | 8.50%, 8/1/14 | | | 18,100 | | |
| Pliant Corp. (PIK) | | | |
| | 1,100 | | | 11.85%, 6/15/09 | | | 1,200,265 | | |
| | | | | | | $ | 1,360,540 | | |
See notes to financial statements
8
Eaton Vance Credit Opportunities Fund as of October 31, 2006
PORTFOLIO OF INVESTMENTS (Unaudited) CONT'D
Principal Amount
(000's omitted) | | Security | | Value | |
| Cosmetics / Toiletries — 0.1% | | | |
| Amscan Holdings, Inc., Sr. Sub. Notes | | | |
| $ | 85 | | | 8.75%, 5/1/14 | | $ | 80,750 | | |
| | | | | | | $ | 80,750 | | |
| Ecological Services and Equipment — 0.0% | | | |
| Waste Services, Inc., Sr. Sub. Notes | | | |
| $ | 25 | | | 9.50%, 4/15/14 | | $ | 25,750 | | |
| | | | | | | $ | 25,750 | | |
| Electronics / Electrical — 0.2% | | | |
| Avago Technologies Finance PTE, Sr. Notes | | | |
| $ | 50 | | | 10.125%, 12/1/13(4) | | $ | 53,250 | | |
| NXP BV/NXP Funding, LLC, Sr. Notes | | | |
| | 240 | | | 9.50%, 10/15/15(4) | | | 243,300 | | |
| | | | | | | $ | 296,550 | | |
| Financial Intermediaries — 1.5% | | | |
| Gmac LLC | | | |
| $ | 1,000 | | | 6.125%, 1/22/08 | | $ | 995,381 | | |
| Sonata Securities S.A., Series 2006-5 | | | |
| | 500 | | | 8.999%, 6/27/07 | | | 503,550 | | |
| Sonata Securities S.A., Series 2006-6 | | | |
| | 500 | | | 8.999%, 6/27/07 | | | 503,455 | | |
| | | | | | | $ | 2,002,386 | | |
| Food Products — 0.8% | | | |
| Nutro Products, Inc., Sr. Notes, Variable Rate | | | |
| $ | 1,000 | | | 9.40%, 10/15/13(4) | | $ | 1,032,500 | | |
| | | | | | | $ | 1,032,500 | | |
| Food Service — 0.9% | | | |
| Buffets, Inc. | | | |
| $ | 115 | | | 12.50%, 11/1/14(4) | | $ | 116,150 | | |
| NPC International, Inc., Sr. Sub. Notes | | | |
| | 1,070 | | | 9.50%, 5/1/14(4) | | | 1,088,725 | | |
| | | | | | | $ | 1,204,875 | | |
| Food / Drug Retailers — 0.1% | | | |
| Rite Aid Corp. | | | |
| $ | 145 | | | 6.125%, 12/15/08(4) | | $ | 142,100 | | |
| | 50 | | | 8.125%, 5/1/10 | | | 50,750 | | |
| | | | | | | $ | 192,850 | | |
Principal Amount
(000's omitted) | | Security | | Value | |
| Forest Products — 0.2% | | | |
| Domtar, Inc. | | | |
| $ | 175 | | | 7.125%, 8/1/15 | | $ | 168,000 | | |
| NewPage Corp. | | | |
| | 35 | | | 10.00%, 5/1/12 | | | 36,837 | | |
| Stone Container Corp. | | | |
| | 100 | | | 7.375%, 7/15/14 | | | 92,375 | | |
| | | | | | | $ | 297,212 | | |
| Healthcare — 2.2% | | | |
| AMR HoldCo, Inc./EmCare HoldCo, Inc., Sr. Sub. Notes | | | |
| $ | 15 | | | 10.00%, 2/15/15 | | $ | 16,162 | | |
| HCA, Inc. | | | |
| | 20 | | | 8.75%, 9/1/10 | | | 20,250 | | |
| Multiplan, Inc., Sr. Sub. Notes | | | |
| | 1,020 | | | 10.375%, 4/15/16(4) | | | 1,025,100 | | |
| National Mentor Holdings, Inc., Sr. Sub. Notes | | | |
| | 70 | | | 11.25%, 7/1/14(4) | | | 73,850 | | |
| Service Corp. International, Sr. Notes | | | |
| | 195 | | | 7.625%, 10/1/18(4) | | | 201,337 | | |
| Triad Hospitals, Inc., Sr. Notes | | | |
| | 70 | | | 7.00%, 5/15/12 | | | 69,825 | | |
| Triad Hospitals, Inc., Sr. Sub. Notes | | | |
| | 85 | | | 7.00%, 11/15/13 | | | 83,087 | | |
| US Oncology, Inc. | | | |
| | 335 | | | 10.75%, 8/15/14 | | | 370,175 | | |
| VWR International, Inc., Sr. Sub. Notes | | | |
| | 1,000 | | | 8.00%, 4/15/14 | | | 1,032,500 | | |
| | | | | | | $ | 2,892,286 | | |
| Leisure Goods / Activities / Movies — 1.9% | | | |
| Marquee Holdings, Inc., Sr. Disc. Notes, (0.00% until 2009) | | | |
| $ | 2,000 | | | 12.00%, 8/15/14 | | $ | 1,575,000 | | |
| Six Flags Theme Parks, Inc., Sr. Notes | | | |
| | 1,020 | | | 9.625%, 6/1/14 | | | 938,400 | | |
| Universal City Florida Holdings, Sr. Notes, Variable Rate | | | |
| | 70 | | | 10.12%, 5/1/10 | | | 72,362 | | |
| | | | | | | $ | 2,585,762 | | |
| Lodging and Casinos — 2.3% | | | |
| CCM Merger, Inc. | | | |
| $ | 45 | | | 8.00%, 8/1/13(4) | | $ | 43,594 | | |
| Host Hotels & Resorts L.P., Sr. Notes | | | |
| | 95 | | | 6.875%, 11/1/14(4) | | | 95,712 | | |
See notes to financial statements
9
Eaton Vance Credit Opportunities Fund as of October 31, 2006
PORTFOLIO OF INVESTMENTS (Unaudited) CONT'D
Principal Amount
(000's omitted) | | Security | | Value | |
| Lodging and Casinos (continued) | | | |
| Inn of the Mountain Gods, Sr. Notes | | | |
| $ | 10 | | | 12.00%, 11/15/10 | | $ | 10,750 | | |
| Las Vegas Sands Corp. | | | |
| | 150 | | | 6.375%, 2/15/15 | | | 141,750 | | |
| Station Casinos, Inc. | | | |
| | 30 | | | 7.75%, 8/15/16 | | | 30,975 | | |
| Station Casinos, Inc., Sr. Notes | | | |
| | 50 | | | 6.00%, 4/1/12 | | | 47,937 | | |
| Trump Entertainment Resorts, Inc. | | | |
| | 2,190 | | | 8.50%, 6/1/15 | | | 2,154,413 | | |
| Tunica-Biloxi Gaming Authority, Sr. Notes | | | |
| | 160 | | | 9.00%, 11/15/15 | | | 166,000 | | |
| Turning Stone Resort Casinos, Sr. Notes | | | |
| | 40 | | | 9.125%, 9/15/14(4) | | | 40,900 | | |
| Waterford Gaming, LLC, Sr. Notes | | | |
| | 318 | | | 8.625%, 9/15/12(4) | | | 338,670 | | |
| | | | | | | $ | 3,070,701 | | |
| Metals and Mining — 0.1% | | | |
| AK Steel Corp. | | | |
| $ | 120 | | | 7.875%, 2/15/09 | | $ | 121,050 | | |
| | | | | | | $ | 121,050 | | |
| Nonferrous Metals / Minerals — 0.1% | | | |
| FMG Finance PTY, Ltd. | | | |
| $ | 100 | | | 10.625%, 9/1/16(4) | | $ | 99,000 | | |
| | | | | | | $ | 99,000 | | |
| Oil and Gas — 3.0% | | | |
| Allis-Chalmers Energy, Inc., Sr. Notes | | | |
| $ | 1,090 | | | 9.00%, 1/15/14(4) | | $ | 1,092,725 | | |
| Kinder Morgan Finance Co. | | | |
| | 145 | | | 5.35%, 1/5/11 | | | 141,746 | | |
| Ocean Rig Norway AS, Sr. Notes | | | |
| | 50 | | | 8.375%, 7/1/13(4) | | | 52,938 | | |
| Petrohawk Energy Corp., Sr. Notes | | | |
| | 1,320 | | | 9.125%, 7/15/13(4) | | | 1,353,000 | | |
| Quicksilver Resources, Inc. | | | |
| | 115 | | | 7.125%, 4/1/16 | | | 109,250 | | |
| Semgroup L.P., Sr. Notes | | | |
| | 145 | | | 8.75%, 11/15/15(4) | | | 146,813 | | |
| SESI, LLC, Sr. Notes | | | |
| | 30 | | | 6.875%, 6/1/14(4) | | | 29,925 | | |
Principal Amount
(000's omitted) | | Security | | Value | |
| Oil and Gas (continued) | | | |
| Stewart & Stevenson, LLC, Sr. Notes | | | |
| $ | 95 | | | 10.00%, 7/15/14(4) | | $ | 96,663 | | |
| United Refining Co., Sr. Notes | | | |
| | 1,000 | | | 10.50%, 8/15/12 | | | 1,045,000 | | |
| | | | | | | $ | 4,068,060 | | |
| Publishing — 0.1% | | | |
| Houghton Mifflin Co., Sr. Sub. Notes | | | |
| $ | 85 | | | 9.875%, 2/1/13 | | $ | 91,481 | | |
| | | | | | | $ | 91,481 | | |
| Radio and Television — 1.6% | | | |
| Advanstar Communications, Inc. | | | |
| $ | 2,010 | | | 10.75%, 8/15/10 | | $ | 2,173,313 | | |
| XM Satellite Radio, Inc. | | | |
| | 20 | | | 9.75%, 5/1/14 | | | 19,100 | | |
| | | | | | | $ | 2,192,413 | | |
| Rail Industries — 0.0% | | | |
| Kansas City Southern Railway Co. | | | |
| $ | 35 | | | 9.50%, 10/1/08 | | $ | 36,969 | | |
| | | | | | | $ | 36,969 | | |
| Retailers (Except Food and Drug) — 1.2% | | | |
| Bon-Ton Department Stores, Inc. | | | |
| $ | 170 | | | 10.25%, 3/15/14 | | $ | 173,188 | | |
| GameStop Corp. | | | |
| | 105 | | | 8.00%, 10/1/12 | | | 109,463 | | |
| Michaels Stores, Inc., Sr. Notes | | | |
| | 115 | | | 10.00%, 11/1/14(4) | | | 115,863 | | |
| Michaels Stores, Inc., Sr. Sub. Notes | | | |
| | 95 | | | 11.375%, 11/1/16 | | | 95,831 | | |
| Neiman Marcus Group, Inc. | | | |
| | 1,000 | | | 9.00%, 10/15/15 | | | 1,077,500 | | |
| | 20 | | | 10.375%, 10/15/15 | | | 21,975 | | |
| Toys "R" Us | | | |
| | 50 | | | 7.375%, 10/15/18 | | | 37,625 | | |
| | | | | | | $ | 1,631,445 | | |
| Telecommunications — 1.3% | | | |
| Digicel Ltd., Sr. Notes | | | |
| $ | 40 | | | 9.25%, 9/1/12(4) | | $ | 41,700 | | |
| Intelsat Bermuda Ltd. | | | |
| | 120 | | | 9.25%, 6/15/16(4) | | | 128,700 | | |
See notes to financial statements
10
Eaton Vance Credit Opportunities Fund as of October 31, 2006
PORTFOLIO OF INVESTMENTS (Unaudited) CONT'D
Principal Amount
(000's omitted) | | Security | | Value | |
| Telecommunications (continued) | | | |
| Intelsat Ltd., Sr. Notes | | | |
| $ | 1,050 | | | 5.25%, 11/1/08 | | $ | 1,021,125 | | |
| Qwest Capital Funding, Inc. | | | |
| | 40 | | | 7.00%, 8/3/09 | | | 40,650 | | |
| Qwest Communications International, Inc., Sr. Notes | | | |
| | 25 | | | 7.50%, 11/1/08 | | | 25,500 | | |
| West Corp., Sr. Notes | | | |
| | 235 | | | 9.50%, 10/15/14(4) | | | 235,588 | | |
| West Corp., Sr. Sub. Notes | | | |
| | 25 | | | 11.00%, 10/15/16(4) | | | 25,188 | | |
| Windstream Corp., Sr. Notes | | | |
| | 145 | | | 8.125%, 8/1/13(4) | | | 155,513 | | |
| | 30 | | | 8.625%, 8/1/16(4) | | | 32,513 | | |
| | | | | | | $ | 1,706,477 | | |
| Utilities — 0.1% | | | |
| NRG Energy, Inc. | | | |
| $ | 50 | | | 7.25%, 2/1/14 | | $ | 50,688 | | |
| NRG Energy, Inc., Sr. Notes | | | |
| | 25 | | | 7.375%, 2/1/16 | | | 25,344 | | |
| Reliant Energy, Inc. | | | |
| | 85 | | | 9.25%, 7/15/10 | | | 88,400 | | |
| | | | | | | $ | 164,432 | | |
| | | Total Corporate Bonds & Notes
(identified cost $35,711,166) | | $ | 36,245,386 | | |
| | | Gross Investments — 163.1%
(identified cost $218,667,872) | | $ | 219,409,297 | | |
| | Less Unfunded Loan
Commitments — (2.0)% | | | | | $ | (2,718,781 | ) | |
| | | Net Investments — 161.1%
(identified cost $215,949,091) | | $ | 216,690,516 | | |
| | Other Assets, Less Liabilities — (0.7)% | | | | | $ | (875,880 | ) | |
| | Auction Preferred Shares Plus
Cumulative Unpaid
Dividends — (60.4)% | | | | | $ | (81,308,686 | ) | |
| | | Net Assets Applicable to Common
Shares — 100.0% | | $ | 134,505,950 | | |
EUR - Euro
GBP - British Pound
PIK - Payment In Kind.
(1) Senior floating-rate interests often require prepayments from excess cash flows or permit the borrower to repay at its election. The degree to which borrowers repay, whether as a contractual requirement or at their election, cannot be predicted with accuracy. As a result, the actual remaining maturity may be substantially less than the stated maturities shown. However, it is anticipated that the senior floating-rate interests will have an expected average life of approximately two to three years. The stated interest rate represents the weighted average interest rate of all contracts within the senior loan facility. Senior Loans typically have rates of interest which are redetermined either daily, monthly, quarterly or semi-annually by reference to a base lending rate, plus a premium. These base lending rates are primarily the London - -Interbank Offered Rate ("LIBOR"), and secondarily the prime rate offered by one or more major United States banks (the "Prime Rate") and the certificate of deposit ("CD") rate or other base lending rates used by commercial lenders.
(2) Unfunded loan commitments. See Note 1G for description.
(3) Security valued at fair value using methods determined in good faith by or at the direction of the Trustees.
(4) Security exempt from registration under Rule 144A of the Securities Act of 1933. These securities may be sold in transactions exempt from registration, normally to qualified institutional buyers. At October 31, 2006, the aggregate value of the securities is $10,984,380 or 8.2% of the net assets.
(5) Defaulted Security. Currently the issuer is in default with respect to interest payments.
See notes to financial statements
11
Eaton Vance Credit Opportunities Fund as of October 31, 2006
FINANCIAL STATEMENTS (Unaudited)
Statement of Assets and Liabilities
As of October 31, 2006
| Assets | |
| Investments, at value (identified cost, $215,949,091) | | $ | 216,690,516 | | |
| Cash | | | 1,311,197 | | |
| Foreign currency, at value (identified cost, $38,870) | | | 41,184 | | |
| Receivable for investments sold | | | 1,909,746 | | |
| Receivable from the Investment Adviser | | | 15,500 | | |
| Interest receivable | | | 2,803,871 | | |
| Prepaid expenses | | | 6,606 | | |
| Total assets | | $ | 222,778,620 | | |
| Liabilities | |
| Demand note payable | | $ | 5,900,000 | | |
| Payable for investments purchased | | | 487,440 | | |
| Payable to affiliate for investment advisory fees | | | 102,825 | | |
| Payable for open forward foreign currency contracts | | | 230,736 | | |
| Accrued expenses | | | 242,983 | | |
| Total liabilities | | $ | 6,963,984 | | |
Auction preferred shares (3,250 shares outstanding) at
liquidation value plus cumulative unpaid dividends | | $ | 81,308,686 | | |
| Net assets applicable to common shares | | $ | 134,505,950 | | |
| Sources of Net Assets | |
Common Shares, $0.01 par value, unlimited number of shares
authorized, 7,062,982 shares issued and outstanding | | $ | 70,630 | | |
| Additional paid-in capital | | | 133,467,309 | | |
Accumulated undistributed net realized gain (computed on the basis
of identified cost) | | | 76,374 | | |
| Accumulated undistributed net investment income | | | 378,432 | | |
| Net unrealized appreciation (computed on the basis of identified cost) | | | 513,205 | | |
| Net assets applicable to common shares | | $ | 134,505,950 | | |
| Net Asset Value Per Common Share | |
| ($134,505,950 ÷ 7,062,982 shares of beneficial interest outstanding) | | $ | 19.04 | | |
Statement of Operations
For the Period Ended
October 31, 2006(1)
| Investment Income | |
| Interest | | $ | 6,510,216 | | |
| Dividends | | | 52,190 | | |
| Total investment income | | $ | 6,562,406 | | |
| Expenses | |
| Investment adviser fee | | $ | 574,978 | | |
| Legal and accounting services | | | 53,202 | | |
| Preferred shares remarketing agent fee | | | 45,634 | | |
| Custodian fee | | | 35,473 | | |
| Transfer and dividend disbursing agent fees | | | 25,012 | | |
| Organization expenses | | | 15,500 | | |
| Printing and postage | | | 7,896 | | |
| Interest expense | | | 114,707 | | |
| Miscellaneous | | | 27,969 | | |
| Total expenses | | $ | 900,371 | | |
Deduct —
Reduction of Investment Adviser fee | | $ | 153,334 | | |
| Expense reimbursement | | | 15,500 | | |
| Total expense reductions | | $ | 168,834 | | |
| Net expenses | | $ | 731,537 | | |
| Net investment income | | $ | 5,830,869 | | |
| Realized and Unrealized Gain (Loss) | |
Net realized gain (loss) —
Investment transactions (identified cost basis) | | $ | 8,050 | | |
| Foreign currency and forward foreign currency exchange contract transactions | | | 68,324 | | |
| Net realized gain | | $ | 76,374 | | |
Change in unrealized appreciation (depreciation) —
Investments (identified cost basis) | | $ | 741,425 | | |
| Foreign currency and forward foreign currency exchange contracts | | | (228,220 | ) | |
| Net change in unrealized appreciation (depreciation) | | $ | 513,205 | | |
| Net realized and unrealized gain | | $ | 589,579 | | |
| Distributions to preferred shareholders from net investment income | | $ | (962,576 | ) | |
| Net increase in net assets from operations | | $ | 5,457,872 | | |
(1) For the period from the start of business, May 31, 2006, to October 31, 2006.
See notes to financial statements
12
Eaton Vance Credit Opportunities Fund as of October 31, 2006
FINANCIAL STATEMENTS (Unaudited) CONT'D
Statements of Changes in Net Assets
Increase (Decrease)
in Net Assets | | Period Ended
October 31, 2006(1) | |
| From operations — | |
| Net investment income | | $ | 5,830,869 | | |
Net realized gain from investment transactions, foreign currency
and forward foreign currency exchange contract transactions | | | 76,374 | | |
Net change in unrealized appreciation (depreciation) from investments,
foreign currency and forward foreign currency exchange contracts | | | 513,205 | | |
Distributions to preferred shareholders —
From net investment income | | | (962,576 | ) | |
| Net increase in net assets from operations | | $ | 5,457,872 | | |
Distributions to common shareholders —
From net investment income | | $ | (4,489,861 | ) | |
| Total distributions to common shareholders | | $ | (4,489,861 | ) | |
Capital share transactions —
Proceeds from sale of common shares (2) | | $ | 133,700,000 | | |
| Reinvestment of distributions to common shareholders | | | 1,104,633 | | |
| Offering costs and preferred shares underwriting discounts | | | (1,366,694 | ) | |
| Total increase in net assets from capital share transactions | | $ | 133,437,939 | | |
| Net increase in net assets | | $ | 134,405,950 | | |
| Net Assets Applicable to Common Shares | |
| At beginning of period | | $ | 100,000 | | |
| At end of period | | $ | 134,505,950 | | |
Accumulated undistributed net
investment income included in
net assets applicable to common shares | |
| At end of period | | $ | 378,432 | | |
(1) For the period from the start of business, May 31, 2006, to October 31, 2006.
(2) Proceeds from sales of shares net of sales load paid of $6,300,000.
See notes to financial statements
13
Eaton Vance Credit Opportunities Fund as of October 31, 2006
FINANCIAL STATEMENTS CONT'D
Financial Highlights
Selected data for a common share outstanding during the periods stated
| | | Period Ended
October 31, 2006
(Unaudited)(1)(2) | |
| Net asset value — Beginning of period | | $ | 19.100 | (3) | |
| Income (loss) from operations | |
| Net investment income | | $ | 0.830 | | |
| Net realized and unrealized gain | | | 0.080 | | |
| Distributions to preferred shareholders from net investment income | | | (0.137 | ) | |
| Total income from operations | | $ | 0.773 | | |
| Less distributions to common shareholders | |
| From net investment income | | $ | (0.638 | ) | |
| Total distributions to common shareholders | | $ | (0.638 | ) | |
| Preferred and Common shares offering costs charged to paid-in capital | | $ | (0.079 | ) | |
| Preferred Shares underwriting discounts | | $ | (0.116 | ) | |
| Net asset value — End of period (Common shares) | | $ | 19.040 | | |
| Market value — End of period (Common shares) | | $ | 19.800 | | |
| Total Investment Return on Net Asset Value(4) | | | 3.07 | % | |
| Total Investment Return on Market Value(4) | | | 7.18 | % | |
See notes to financial statements
14
Eaton Vance Credit Opportunities Fund as of October 31, 2006
FINANCIAL STATEMENTS CONT'D
Financial Highlights
Selected data for a common share outstanding during the periods stated
| | | Period Ended
October 31, 2006
(Unaudited)(1)(2) | |
| Ratios/Supplemental Data† | |
| Net assets applicable to common shares, end of period (000's omitted) | | $ | 134,506 | | |
| Ratios (As a percentage of average net assets appicable to common shares): | |
| Net expenses(6) | | | 1.30 | %(5) | |
| Net investment income(6) | | | 10.33 | %(5) | |
| Portfolio Turnover | | | 22 | % | |
† The ratios reported are based on net assets applicable solely to common shares. The ratios based on net assets, including amounts related to preferred shares,
are as follows:
| Ratios (As a percentage of average total net assets applicable to common and preferred shares): | |
| Net expenses(6) | | | 0.81 | % | |
| Net investment income(6) | | | 6.43 | % | |
| Senior Securities: | |
| Total preferred shares outstanding | | | 81,250 | | |
| Asset coverage per preferred share(7) | | $ | 66,405 | | |
| Involuntary liquidation preference per preferred share(8) | | $ | 25,000 | | |
| Approximate market value per preferred share(8) | | $ | 25,000 | | |
(1) For the period from the start of business May 31, 2006, to October 31, 2006.
(2) Net investment income per share was computed using average common shares outstanding.
(3) Net asset value at beginning of period reflects the deduction of the sales load of $0.900 per share paid by the shareholder from the $20.000 offering price.
(4) Total investment return on net asset value is calculated assuming a purchase at the offering price of $20.00 less the sales load of $0.90 per share paid by the shareholder on the first day and a sale at the net asset value on the last day of the period reported. Total investment return on market value is calculated assuming a purchase at the offering price of $20.00 less the sales load of $0.90 per share by the shareholder on the first day and a sale at the current market price on the last day of the period reported. Total investment return on net asset value and total investment return on market value are not computed on an annualized basis.
(5) Annualized.
(6) Ratios do not reflect the effect of dividend payments to preferred shareholders.
(7) Calculated by subtracting the Fund's total liabilities (not including the preferred shares) from the Fund's total assets, and dividing this by the number of preferred shares outstanding.
(8) Plus accumulated and unpaid dividends.
See notes to financial statements
15
Eaton Vance Credit Opportunities Fund as of October 31, 2006
NOTES TO FINANCIAL STATEMENTS (Unaudited)
1 Significant Accounting Policies
Eaton Vance Credit Opportunities Fund (the "Fund") is registered under the Investment Company Act of 1940 (the 1940 Act), as amended, as a diversified, closed-end management investment company. The Fund was organized as a Massachusetts business trust on October 5, 2005. The Fund's primary investment objective is to provide a high level of current income. The Fund will, as a secondary objective, also seek capital appreciation. The Fund pursues its objectives primarily by investing opportunistically in various credit-related investments. The following is a summary of significant accounting policies of the Fund. The policies are in conformity with accounting principles generally accepted in the United States of America.
A Investment Valuation — The Fund's investments include interests in senior floating rate loans (Senior Loans). Certain Senior Loans are deemed to be liquid because reliable market quotations are readily available for them. Liquid Senior Loans are valued on the basis of prices furnished by a pricing service. Other Senior Loans are valued at fair value by the Fund's investment adviser, Eaton Vance Management (EVM), under procedures approved by the Trustees. In connection with determining the fair value of a Senior Loan, the investment adviser makes an assessment of the likelihood that the borrower will make a full repayment of the Senior Loan. The primary factors considered by the investment adviser when making this assessment are (i) the creditworthiness of the borrower, (ii) the value of the collateral backing the Senior Loan, and (iii) the priority of the Senior Loan versus other creditors of the borrower. If, based on its assessment, the investment adviser believes there is a reasonable likelihood that the borrower will make a full repayment of the Senior Loan, the investment adviser will determine the fair value of the Senior Loan using a matrix pricing approach that considers the yield on the Senior Loan relative to yields on other loan interests issued by companies of comparable credit quality. If, based on its assessment, the investment adviser believes there is not a reasonable likelihood that the borrower will make a full repayment of the Senior Loan, the investment adviser will determine the fair value of the Senior Loan using analyses that include, but are not limited to (i) a comparison of the value of the borrower's outstanding equity and debt to that of comparable public companies; (ii) a discounted cash flow analysis; or (iii) when the investment adviser belie ves it is likely that a borrower will be liquidated or sold, an analysis of the terms of such liquidation or sale. In certain cases, the investment adviser will use a combination of analytical methods to determine fair value, such as when only a portion of a borrower's assets are likely to be sold. In conducting its assessment and analyses for purposes of determining fair value of a Senior Loan, the investment adviser will use its discretion and judgment in considering and appraising such factors, data and information and the relative weight to be given thereto as it deems relevant, including without limitation, some or all of the following: (i) the fundamental characteristics of and fundamental analytical data relating to the Senior Loan, including the cost, size, current interest rate, maturity and base lending rate of the Senior Loan, the terms and conditions of the Senior Loan and any related agreements, and the position of the Senio r Loan in the borrower's debt structure; (ii) the nature, adequacy and value of the collateral securing the Senior Loan, including the Fund's rights, remedies and interests with respect to the collateral; (iii) the creditworthiness of the borrower, based on an evaluation of, among other things, its financial condition, financial statements and information about the borrower's business, cash flows, capital structure and future prospects; (iv) information relating to the market for the Senior Loan, including price quotations for and trading in the Senior Loan and interests in similar Senior Loans and the market environment and investor attitudes towards the Senior Loan and interests in similar Senior Loans; (v) the experience, reputation, stability and financial condition of the agent and any intermediate participants in the Senior Loan; and (vi) general economic and market conditions affecting the fair value of the Senior Loan. Fair value determinations are made by the portfolio managers of a Fund based on in formation available to such managers. The portfolio managers of other funds managed by Eaton Vance that invest in Senior Loans may not possess the same information about a Senior Loan borrower as the portfolio managers of Credit Opportunities Fund. At times, the fair value of a Senior Loan determined by the portfolio managers of other funds managed by Eaton Vance that invest in Senior Loans may vary from the fair value of the same Senior Loan determined by the portfolio managers of Credit Opportunities Fund. The fair value of each Senior Loan is periodically reviewed and approved by the investment adviser's Valuation Committee and by the Trustees based upon procedures approved by the Trustees. Junior Loans are valued in the same manner as Senior Loans.
Non-loan porfolio holdings (other than short-term obligations maturing in sixty days or less), including
16
Eaton Vance Credit Opportunities Fund as of October 31, 2006
NOTES TO FINANCIAL STATEMENTS (Unaudited) CONT'D
listed securities and securities for which price quotations are available and forward contracts, will normally be valued on the basis of market valuations furnished by dealers or pricing services. Financial futures contracts listed on commodity exchanges and exchange-traded options are valued at closing settlement prices. Over-the-counter options are valued at the mean between the bid and asked prices provided by dealers. Marketable securities listed on the NASDAQ National Market System are valued at the NASDAQ official closing price. The value of interest rate swaps will be based upon a dealer quotation. Short-term obligations and money market securities maturing in sixty days or less are valued at amortized cost which approximates value. Investments for which reliable market quotations are unavailable and investments for which the price of the security is not believed to represent its fair market value, are valued at fair valu e using methods determined in good faith by or at the direction of the Trustees of the Fund.
Occasionally, events affecting the value of foreign securities may occur between the time trading is completed abroad and the close of the Exchange which will not be reflected in the computation of the Trust's net asset value (unless the Trust deems that such event would materially affect its net asset value in which case an adjustment would be made and reflected in such computation). The Trust may rely on an independent fair valuation service in making any such adjustment.
B Income — Interest income is recorded on the basis of interest accrued, adjusted for amortization of premium or accretion of discount. Fees associated with loan amendments are recognized immediately. Dividend income is recorded on the ex-dividend date for dividends received in cash and/or securities.
C Federal Taxes — The Fund's policy is to comply with the provisions of the Internal Revenue Code applicable to regulated investment companies and to distribute to shareholders each year all of its taxable income, including any net realized gain on investments. Accordingly, no provision for federal income or excise tax is necessary.
D Foreign Currency Translation — Investment valuations, other assets, and liabilities initially expressed in foreign currencies are converted each business day into U.S. dollars based upon current exchange rates. Purchases and sales of foreign investment securities and income and expenses are converted into U.S. dollars based upon currency exchange rates prevailing on the respective dates of such transactions. Recognized gains or losses on investment transactions attributable to changes in foreign currency exchange rates are recorded for financial statement purposes as net realized gains and losses on investments. That portion of unrealized gains and losses on investments that results from fluctuation s in foreign currency exchange rates is not separately disclosed.
E Forward Foreign Currency Exchange Contracts — The Fund may enter into forward foreign currency exchange contracts for the purchase or sale of a specific foreign currency at a fixed price on a future date. Risks may arise upon entering these contracts from the potential inability of counterparties to meet the terms of their contracts and from movements in the value of a foreign currency relative to the U.S. dollar. The Fund will enter into forward contracts for hedging purposes as well as non-hedging purposes. The forward foreign currency exchange contracts are adjusted by the daily exchange rate of the underlying currency and any gains or losses are recorded for financial statement purposes as unrealized until such time as the contracts have been closed.
F When Issued and Delayed Delivery Transactions — The Fund may engage in when-issued and delayed delivery transactions. The Fund records when-issued securities on trade date and maintain security positions such that sufficient liquid assets will be available to make payments for the securities purchased. Securities purchased on a when-issued or delayed delivery basis are marked-to-market daily and begin earning interest on settlement date.
G Unfunded Loan Commitments — The Fund may enter into certain credit agreements all or a portion of which may be unfunded. The Fund is obligated to fund these commitments at the borrower's discretion. These commitments are disclosed in the accompanying Portfolio of Investments.
H Offering Costs — Costs incurred by the Fund in connection with the offering of the common shares and preferred shares were recorded as a reduction of capital paid in excess of par applicable to common shares.
I Expense Reduction — Investors Bank & Trust Company (IBT) serves as custodian of the Fund. Pursuant to the custodian agreement, IBT receives a fee reduced by credits which are determined based on the average daily cash balance the Fund maintains with IBT. All credit balances used to reduce the Fund's custodian
17
Eaton Vance Credit Opportunities Fund as of October 31, 2006
NOTES TO FINANCIAL STATEMENTS (Unaudited) CONT'D
fees are reported as a reduction of expenses in the Statement of Operations.
J Written Options — Upon the writing of a call or a put option, an amount equal to the premium received by the Fund is included in the Statement of Assets and Liabilities as a liability. The amount of the liability is subsequently marked-to-market to reflect the current value of the option written in accordance with the Fund's policies on investment valuations discussed above. Premiums received from writing options which expire are treated as realized gains. Premiums received from writing options which are exercised or are closed are added to or offset against the proceeds or amount paid on the transaction to determine the realized gain or loss. If a put option is exercised, the premium reduces the cost basis of the securities purchased by the Fund. The Fund, as writer of an option, may have no control over whether the underlying securities may be sold (call) or purchased (put) and, as a result, bears the market risk of an unfavorable change in the price of the securities underlying the written option.
K Purchased Options — Upon the purchase of a call or put option, the premium paid by the Fund is included in the Statement of Assets and Liabilities as an investment. The amount of the investment is subsequently marked-to-market to reflect the current market value of the option purchased, in accordance with the Fund's policies on investment valuations discussed above. If an option which the Fund has purchased expires on the stipulated expiration date, the Fund will realize a loss in the amount of the cost of the option. If the Fund enters into a closing sale transaction, the Fund will realize a gain or loss, depending on whether the sales proceeds from the closing sale transaction are greater or less than the cost of the option. If the Fund exercises a put option, it wil l realize a gain or loss from the sale of the underlying security, and the proceeds from such sale will be decreased by the premium originally paid. If the Fund exercises a call option, the cost of the security which the Fund purchases upon exercise will be increased by the premium originally paid.
L Financial Futures Contracts — Upon entering into a financial futures contract, the Fund is required to deposit an amount (initial margin) either in cash or securities equal to a certain percentage of the purchase price indicated in the financial futures contract. Subsequent payments are made or received by the Fund (margin maintenance) each day, dependent on the daily fluctuations in the value of the underlying securities, and are recorded for book purposes as unrealized gains or losses by the Fund.
If the Fund enters into a closing transaction, the Fund will realize, for book purposes, a gain or loss equal to the difference between the value of the financial futures contract to sell and the financial futures contract to buy. The Fund's investment in financial futures contracts is designed only to hedge against anticipated future changes in interest rates. Should interest rates move unexpectedly, the Fund may not achieve the anticipated benefits of the financial futures contracts and may realize a loss.
M Reverse Repurchase Agreements — The Fund may enter into reverse repurchase agreements. Under such an agreement, the Fund temporarily transfers possession, but not ownership, of a security to a counterparty, in return for cash. At the same time, the Fund agrees to repurchase the security at an agreed-upon price and time in the future. The Fund may enter into reverse repurchase agreements for temporary purposes, such as to Fund withdrawals, or for use as hedging instruments where the underlying security is denominated in a foreign currency. As a form of leverage, reverse repurchase agreements may increase the risk of fluctuation in the market value of the Fund's assets or in its yield. Liabilities to counterparties under reverse repurchase agreements are recognized in the Statement of Assets and Liabilities at the same time at which cash is received by the Fund. The securities underlying such agreements continue to be treated as owned by the Fund and remain in the Portfolio of Investments. Interest charged on amounts borrowed by the Fund under reverse repurchase agreements is accrued daily.
N Total Return Swaps — The Fund may enter into swap agreements to hedge against fluctuations in securities prices, currencies, interest rates or market conditions, to change the duration of the overall portfolio or to mitigate default risk. In a total return swap, the Fund makes monthly payments at a rate equal to a predetermined spread to the one or three-month LIBOR. In exchange, the Fund receives payments based on the rate of return of a benchmark industry index or basket of securities. During the term of the outstanding swap agreement, changes in the underlying value of the swap are recorded as unrealized gains and losses. Periodic payments received or made at the end of the measurement period are recorded as realized gains and
18
Eaton Vance Credit Opportunities Fund as of October 31, 2006
NOTES TO FINANCIAL STATEMENTS (Unaudited) CONT'D
losses. The value of the swap is determined by changes in the relationship between the rate of interest and the benchmark industry index or basket of securities. The Fund is exposed to credit loss in the event of nonperformance by the swap counterparty. However, the Fund does not anticipate nonperformance by the counterparty. Risk may also arise from the unanticipated movements in value of interest rates or the index.
O Credit Default Swaps — The Fund may enter into credit default swap contracts for risk management purposes, including diversification. When the Fund is the buyer of a credit default swap contract, the Fund is entitled to receive the par (or other agreed-upon) value of a referenced debt obligation from the counterparty to the contract in the event of a default by a third party, such as a U.S. or foreign corporate issuer, on the debt obligation. In return, the Fund would pay the counterparty a periodic stream of payments over the term of the contract provided that no event of default has occurred. If no default occurs, the Fund would have spent the stream of payments and received no benefit from the contract. When the Fund is the seller of a credit default swap contract, i t receives the stream of payments, but is obligated to pay upon default of the referenced debt obligation. As the seller, the Fund would effectively add leverage to its portfolio because, in addition to its total net assets, the Fund would be subject to investment exposure on the notional amount of the swap. The Fund will segregate assets in the form of cash and cash equivalents in an amount equal to the aggregate market value of the credit default swaps of which it is the seller, marked to market on a daily basis. These transactions involve certain risks, including the risk that the counterparty may be unable to fulfill the transaction.
P Use of Estimates — The preparation of the financial statements in conformity with accounting principles generally accepted in the United States of America requires management to make estimates and assumptions that affect the reported amounts of assets and liabilities at the date of the financial statements and the reported amounts of income and expense during the reporting period. Actual results could differ from those estimates.
Q Indemnifications — Under the Fund's organizational documents, its officers and Trustees may be indemnified against certain liabilities and expenses arising out of the performance of their duties to the Fund, and shareholders are indemnified against personal liability for obligations of the Fund. Additionally, in the normal course of business, the Fund enters into agreements with service providers that may contain indemnification clauses. The Fund's maximum exposure under these arrangements is unknown as this would involve future claims that may be made against the Fund that have not yet occurred.
R Other — Investment transactions are accounted for on the date the securities are purchased or sold. Realized gains and losses on securities sold are determined on the basis of identified cost.
S Interim Financial Statements — The interim financial statements relating to October 31, 2006 and for the period then ended have not been audited by an independent registered public accounting firm, but in the opinion of the Fund's management reflect all adjustments, consisting only of normal recurring adjustments, necessary for the fair presentation of the financial statements.
2 Auction Preferred Shares (APS)
The Fund issued 3,250 shares of Series A Auction Preferred Shares on August 11, 2006 in a public offering. The underwriting discount and other offering costs were recorded as a reduction of the capital of the common shares. Dividends on the APS, which accrue daily, are cumulative at a rate which was established at the offering of the APS and generally have been reset every 7 days thereafter by an auction unless a special dividend period has been set. Prior to August 25, 2006, an intial dividend period of 14 days was in effect for the APS shares. Dividend rates ranged from 5.18% to 5.25% during the period from the date of issuance, August 11, 2006 to October 31, 2006.
The APS are redeemable at the option of the Fund, at a redemption price equal to $25,000 per share, plus accumulated and unpaid dividends on any dividend payment date. The APS are also subject to mandatory redemption at a redemption price equal to $25,000 per share, plus accumulated and unpaid dividends, if the Fund is in default for an extended period on its asset maintenance requirements with respect to the APS. If the dividends on the APS shall remain unpaid in an amount equal to two full years' dividends, the holders of the APS as a class have the right to elect a majority of the Board of Trustees. In general, the holders of the APS and the common shares have equal voting rights of one vote per share, except that the holders of the APS, as a separate class, have the right to elect at least two members of the Board of Trustees. The APS have a
19
Eaton Vance Credit Opportunities Fund as of October 31, 2006
NOTES TO FINANCIAL STATEMENTS (Unaudited) CONT'D
liquidation preference of $25,000 per share, plus accumulated and unpaid dividends. The Fund is required to maintain certain asset coverage with respect to the APS as defined in the Fund's By-Laws and the 1940 Act. The Fund pays an annual fee equivalent to 0.25% of the preferred share's liquidation value for the remarketing efforts associated with the preferred auctions.
3 Distribution to Shareholders
The Fund intends to make monthly distributions of net investment income, after payment of any dividends on any outstanding Auction Preferred Shares. In addition, at least annually, the Fund intends to distribute net capital gain, if any. Distributions are recorded on the ex-dividend date. Distributions to preferred shareholders are recorded daily and are payable at the end of each dividend period. Each dividend payment period for the Auction Preferred Shares is generally seven days. The applicable dividend rate for the Auction Preferred Shares on October 31, 2006 was 5.20%. For the period from the date of issuance August 11, 2006 to October 31, 2006, the Fund paid dividends to Auction Preferred shareholders amounting to $962,576, representing an average APS dividend rate for such period of 5.273%.
The Fund distinguishes between distribution on a tax basis and a financial reporting basis. Accounting principles generally accepted in the United States of America require that only distributions in excess of tax basis earnings and profits be reported in the financial statements as a return of capital. Permanent differences between book and tax accounting relating to distributions are reclassified to paid in capital. These differences relate primarily to the method for amortizing premiums.
4 Investment Adviser Fee and Other Transactions with Affiliates
EVM serves as the investment adviser and administrator of the Fund. EVM currently receives no compensation for providing administrative services to the Fund. The investment adviser fee is earned by EVM, as compensation for management and investment advisory services rendered to the Fund. Under the advisory agreement, EVM receives a monthly advisory fee in the amount equal to 0.75% annually of average daily gross assets of the Fund. For the period from the start of business, May 31, 2006 to October 31, 2006, the advisory fee amounted to $574,978.
In addition, the Adviser has contractually agreed to reimburse the Fund for fees and other expenses in the amount of 0.20% of the average daily gross assets of the Fund for the first five full years of the Fund's operations, 0.15% of average daily gross assets in year six, 0.10% in year seven and 0.05% in year eight. Pursuant to this agreement. The Investment Adviser waived $153,334 of its advisory fee for the period from the start of business, May 31, 2006 to October 31, 2006. In addition, the Adviser has agreed to reimburse the Fund for all organizational costs, estimated at $15,500.
Certain officers and Trustees of the Fund are officers of the above organization.
5 Purchases and Sales of Investments
Purchases and sales of investments, other than short-term obligations and including paydowns, aggregated $251,649,436 and $32,881,266, respectively, for the period from the start of business, May 31, 2006 to October 31, 2006.
6 Federal Income Tax Basis of Unrealized Appreciation (Depreciation)
The cost and unrealized appreciation (depreciation) in value of investments owned by the Fund at October 31, 2006, as determined on a federal income tax basis, were as follows:
| Aggregate cost | | $ | 216,086,724 | | |
| Gross unrealized appreciation | | $ | 1,982,319 | | |
| Gross unrealized depreciation | | | (1,378,527 | ) | |
| Net unrealized appreciation | | $ | 603,792 | | |
The net unrealized depreciation on foreign currency and foreign currency exchange contracts at October 31, 2006 was $228,220.
20
Eaton Vance Credit Opportunities Fund as of October 31, 2006
NOTES TO FINANCIAL STATEMENTS (Unaudited) CONT'D
7 Common Shares of Beneficial Interest
The Agreement and Declaration of Fund permits the Trustees to issue an unlimited number of full and fractional $0.01 par value common shares of beneficial interest. Transactions in common shares were as follows:
| | | Period Ended
October 31, 2006(1) | |
| Sales | | | 7,005,000 | | |
Issued to shareholders electing to receive payments of distributions in
Fund shares | | | 57,982 | | |
| Net increase | | | 7,062,982 | | |
(1) For the period from the start of business, May 31, 2006 to October 31, 2006.
8 Line of Credit
The Fund participates with other portfolios and funds managed by EVM and its affiliates in a $150 million unsecured line of credit with a group of banks. Interest is charged to each participating portfolio or fund based on its borrowings at an amount above either the Eurodollar rate or federal funds rate. In addition, a fee computed at an annual rate of 0.10% on the daily unused portion of the line of credit is allocated among the participating portfolios and funds at the end of each quarter. At October 31, 2006, the Fund had a balance outstanding pursuant to this line of credit of $5,900,000. The average daily loan balance for the period ended October 31, 2006 was $4,762,208 and the average interest rate was 5.71%.
9 Financial Instruments
The Fund may trade in financial instruments with off-balance sheet risk in the normal course of its investing activities to assist in managing exposure to various market risks. These financial instruments include written options, forward foreign currency exchange contracts, financial futures contracts, and swap contracts and may involve, to a varying degree, elements of risk in excess of the amounts recognized for financial statement purposes. The notional or contractual amounts of these instruments represent the investment the Fund has in particular classes of financial instruments and does not necessarily represent the amounts potentially subject to risk. The measurement of the risks associated with these instruments is meaningful only when all related and offsetting transactions are considered.
A summary of obligations under these financial instruments at October 31, 2006 is as follows:
Forward Foreign Currency Exchange Contracts
Sales
| Settlement Date | | Deliver | | In exchange for | | Net Unrealized
Depreciation | |
| 11/30/06 | | Euro
23,335,708 | | United States Dollar
29,661,127 | | $ | (168,324 | ) | |
| 11/30/06 | | British Pound
5,570,050 | | United States Dollar
10,563,599 | | | (62,412 | ) | |
| | | | | | | $ | (230,736 | ) | |
At October 31, 2006, the Fund had sufficient cash and/or securities segregated to cover potential obligations arising from forward foreign currency exchange contracts.
10 Recently Issued Accounting Pronouncements
In June 2006, the Financial Accounting Standards Board ("FASB") issued FASB Interpretation No. 48, ("FIN" 48) "Accounting for Uncertainty in Income Taxes – an interpretation of FASB Statement No. 109". FIN 48 clarifies the accounting for uncertainty in income taxes recognized in accordance with FASB Statement No. 109, "Accounting for Income Taxes." This interpretation prescribes a recognition threshold and measurement attribute for the financial statement recognition and measurement of a tax position taken or expected to be taken in a tax return. It also provides guidance on de-recognition, classification, interest and penalties, accounting in interim periods, disclosure and transition. FIN 48 is effective for fiscal years beginning after December 15, 2006. Management is currently evaluating the impact of applying the various provisions of FIN 48.
In September 2006, the Financial Accounting Standards Board ("FASB") issued Statement of Financial Accounting Standards No. 157, ("FAS 157") "Fair Value Measurements". FAS 157 defines fair value, establishes a framework for measuring fair value in accordance with generally accepted accounting principles and expands disclosure about fair value measurements. FAS 157 is effective for fiscal years beginning after November 15, 2007. Management is currently evaluating the impact the adoption of FAS 157 will have on the Fund's financial statement disclosures.
21
Eaton Vance Credit Opportunities Fund
DIVIDEND REINVESTMENT PLAN
The Fund offers a dividend reinvestment plan (the Plan) pursuant to which shareholders automatically have dividends and capital gains distributions reinvested in common shares (the Shares) of the Fund unless they elect otherwise through their investment dealer. On the distribution payment date, if the net asset value per Share is equal to or less than the market price per Share plus estimated brokerage commissions then new Shares will be issued. The number of Shares shall be determined by the greater of the net asset value per Share or 95% of the market price. Otherwise, Shares generally will be purchased on the open market by the Plan Agent. Distributions subject to income tax (if any) are taxable whether or not shares are reinvested.
If your shares are in the name of a brokerage firm, bank, or other nominee, you can ask the firm or nominee to participate in the Plan on your behalf. If the nominee does not offer the Plan, you will need to request that your shares be re-registered in your name with the Fund's transfer agent, PFPC, Inc., or you will not be able to participate.
The Plan Agent's service fee for handling distributions will be paid by the Fund. Each participant will be charged their pro rata share of brokerage commissions on all open-market purchases.
Plan participants may withdraw from the Plan at any time by writing to the Plan Agent at the address noted on the following page. If you withdraw, you will receive shares in your name for all Shares credited to your account under the Plan. If a participant elects by written notice to the Plan Agent to have the Plan Agent sell part or all of his or her Shares and remit the proceeds, the Plan Agent is authorized to deduct a $5.00 fee plus brokerage commissions from the proceeds.
If you wish to participate in the Plan and your shares are held in your own name, you may complete the form on the following page and deliver it to the Plan Agent.
Any inquiries regarding the Plan can be directed to the Plan Agent, PFPC, Inc., at 1-800-331-1710.
22
Eaton Vance Credit Opportunities Fund
APPLICATION FOR PARTICIPATION IN DIVIDEND REINVESTMENT PLAN
This form is for shareholders who hold their common shares in their own names. If your common shares are held in the name of a brokerage firm, bank, or other nominee, you should contact your nominee to see if it will participate in the Plan on your behalf. If you wish to participate in the Plan, but your brokerage firm, bank, or nominee is unable to participate on your behalf, you should request that your common shares be re-registered in your own name which will enable your participation in the Plan.
The following authorization and appointment is given with the understanding that I may terminate it at any time by terminating my participation in the Plan as provided in the terms and conditions of the Plan.
Please print exact name on account:
Shareholder signature Date
Shareholder signature Date
Please sign exactly as your common shares are registered. All persons whose names appear on the share certificate must sign.
YOU SHOULD NOT RETURN THIS FORM IF YOU WISH TO RECEIVE YOUR DIVIDENDS AND DISTRIBUTIONS IN CASH. THIS IS NOT A PROXY.
This authorization form, when signed, should be mailed to the following address:
Eaton Vance Credit Opportunities Fund
c/o PFPC, Inc.
P.O. Box 43027
Providence, RI 02940-3027
800-331-1710
Number of Employees
The Fund is organized as a Massachusetts business trust and is registered under the Investment Company Act of 1940, as amended, as a diversified closed-end management investment company and has no employees.
Number of Shareholders
As of October 31, 2006, our records indicate that there are 6 registered shareholders and approximately 55,041 shareholders owning the Fund shares in street name, such as through brokers, banks, and financial intermediaries.
If you are a street name shareholder and wish to receive our reports directly, which contain important information about the Fund, please write or call:
Eaton Vance Distributors, Inc.
The Eaton Vance Building
255 State Street
Boston, MA 02109
1-800-225-6265
New York Stock Exchange symbol
The New York Stock Exchange symbol is EOE.
23
Eaton Vance Credit Opportunities Fund
CONSIDERATIONS RELATING TO APPROVAL OF ADVISORY AGREEMENT
When considering approval of the Investment Advisory Agreement between Eaton Vance Credit Opportunities Fund (the "Fund") and Eaton Vance Management ("EVM"), the Independent Trustees considered, among other things, the following:
• A report comparing the fees and expenses of the Fund and certain profitability analyses prepared by EVM;
• Information on the relevant peer group(s) of funds;
• The economic outlook and the general investment outlook in the relevant investment markets;
• EVM's results and financial condition and the overall organization of EVM;
• Arrangements regarding the distribution of Fund shares;
• The procedures used to determine the fair value of the Fund's assets;
• The allocation of brokerage and the benefits received by EVM as the result of brokerage allocation; including allocations to soft dollar brokerage and allocations to firms that sell Eaton Vance fund shares;
• EVM's management of the relationship with the custodian, subcustodians and fund accountants;
• The resources devoted to EVM's compliance efforts undertaken on behalf of the funds it manages and the record of compliance with the investment policies and restrictions and with policies on personal securities transactions;
• The quality, nature, cost and character of the administrative and other non-investment management services provided by EVM and its affiliates;
• The terms of the Advisory Agreement, and the reasonableness and appropriateness of the particular fee paid by the Fund for the services described therein;
• Operating expenses (including transfer agency expenses) to be paid to third parties; and
• Information to be provided to investors, including the Fund's shareholders.
In evaluating the Advisory Agreement between the Fund and EVM, the Independent Trustees reviewed material furnished by EVM and including the above-referenced considerations and information from prior recently offered closed-end funds relating to the education, experience and number of investment professionals and other personnel who would provide services under the Advisory Agreement. The Independent Trustees also took into account the time and attention to be devoted by senior management to the Fund and the other funds in the complex. The Independent Trustees evaluated the level of skill required to manage the Fund and concluded that the human resources available at EVM were appropriate to fulfill effectively the duties of the investment adviser on behalf of the Fund. The Independent Trustees also considered the business reputation of EVM, its financial resources and professional liability insurance coverage and concluded that EVM would be able to meet any reasonably foreseeable obligations under the Advisory Agreement.
The Independent Trustees received information concerning the investment philosophy and investment process to be applied by EVM in managing the Fund. In this regard, the Independent Trustees considered EVM's in-house research capabilities as well as other resources available to EVM personnel, including research services that may be available to EVM as a result of securities transactions effected for the Fund and other investment advisory clients. The Independent Trustees concluded that EVM's investment process, research capabilities and philosophy were well suited to the Fund, given the Fund's investment objectives and policies.
The Independent Trustees also reviewed the level of EVM's profits in respect of the management of the Eaton Vance funds, including the anticipated profits from management of the Fund. The Independent Trustees considered the other profits realized by Eaton Vance and its affiliates in connection with the operation of the Fund. The Independent Trustees also considered profit margins of EVM in comparison with available industry data. In addition, the Independent Trustees considered the fiduciary duty assumed by EVM in connection with the service rendered to the Fund and the business reputation of EVM, its financial resources and its professional liability insurance coverage.
In assessing the information provided by EVM and its affiliates, the Independent Trustees also took into consideration the benefits to shareholders of investment in a fund that is part of a large family of funds which provides a large variety of shareholder services. The Independent Trustees also considered that EVM would enter into a shareholder services (or similar) agreement with the Fund's underwriter whereby EVM (and not the Fund) would pay the underwriter to provide upon request certain market data and reports to support shareholder services pursuant to the agreement.
24
Eaton Vance Credit Opportunities Fund
INVESTMENT MANAGEMENT
Eaton Vance Credit Opportunities Fund
Officers
Scott H. Page
President and Chief Executive Officer
Thomas E. Faust Jr.
Vice President
James B. Hawkes
Vice President and Trustee
Payson F. Swaffield
Vice President
Michael W. Weilheimer
Vice Preside nt
Barbara E. Campbell
Treasurer and Principal Financial Accounting Officer
Alan R. Dynner
Secretary
Paul M. O'Neil
Chief Compliance Officer | | Trustees
Samuel L. Hayes, III
Chairman
Benjamin C. Esty
William H. Park
Ronald A. Pearlman
Norton H. Reamer
Lynn A. Stout
Ralph F. Verni | |
|
25
This Page Intentionally Left Blank
This Page Intentionally Left Blank
This Page Intentionally Left Blank
Investment Adviser and Administrator of Eaton Vance Credit Opportunities Fund
Eaton Vance Management
The Eaton Vance Building
255 State Street
Boston, MA 02109
Custodian
Investors Bank & Trust Company
200 Clarendon Street
Boston, MA 02116
Transfer Agent
PFPC Inc.
Attn: Eaton Vance Funds
P.O. Box 43027
Providence, RI 02940-3027
(800) 262-1122
Independent Registered Public Accounting Firm
Deloitte & Touche LLP
200 Berkeley Street
Boston, MA 02116-5022
Eaton Vance Credit Opportunities Fund
The Eaton Vance Building
255 State Street
Boston, MA 02109
This report must be preceded or accompanied by a current prospectus. Before investing, investors should consider carefully the Fund's investment objective(s), risks, and charges and expenses. The Fund's current prospectus contains this and other information about the Fund and is available through your financial advisor. Please read the prospectus carefully before you invest or send money. For further information please call 800-225-6265.
2613-12/06 CE-COFSRC
Item 2. Code of Ethics
The registrant has adopted a code of ethics applicable to its Principal Executive Officer, Principal Financial Officer and Principal Accounting Officer. The registrant undertakes to provide a copy of such code of ethics to any person upon request, without charge, by calling 1-800-262-1122.
Item 3. Audit Committee Financial Expert
The registrant’s Board has designated William H. Park, Samuel L. Hayes, III and Norton H. Reamer, each an independent trustee, as its audit committee financial experts. Mr. Park is a certified public accountant who is the Vice Chairman of Commercial Industrial Finance Corp (specialty finance company). Previously, he served as President and Chief Executive Officer of Prizm Capital Management, LLC (investment management firm) and as Executive Vice President and Chief Financial Officer of United Asset Management Corporation (“UAM”) (a holding company owning institutional investment management firms). Mr. Hayes is the Jacob H. Schiff Professor of Investment Banking Emeritus of the Harvard University Graduate School of Business Administration. Mr. Reamer is the President, Chief Executive Officer and a Director of Asset Management Finance Corp. (a specialty finance company serving the investment management industry) and is President of Unicorn Corporation (an investment and financial advisory services company). Formerly, Mr. Reamer was Chairman and Chief Operating Officer of Hellman, Jordan Management Co., Inc. (an investment management company) and Advisory Director of Berkshire Capital Corporation (an investment banking firm), Chairman of the Board of UAM and Chairman, President and Director of the UAM Funds (mutual funds).
Item 4. Principal Accountant Fees and Services
Not required in this filing
Item 5. Audit Committee of Listed registrants
Not required in this filing.
Item 6. Schedule of Investments
Please see schedule of investments contained in the Report to Stockholders included under Item 1 of this Form N-CSR.
Item 7. Disclosure of Proxy Voting Policies and Procedures for Closed-End Management Investment Companies
Not required in this filing.
Item 8. Portfolio Managers of Closed-End Management Investment Companies
Not required in this filing.
Item 9. Purchases of Equity Securities by Closed-End Management Investment Company and Affiliated Purchasers.
Not required in this filing.
Item 10. Submission of Matters to a Vote of Security Holders.
No Material Changes.
Item 11. Controls and Procedures
(a) It is the conclusion of the registrant’s principal executive officer and principal financial officer that the effectiveness of the registrant’s current disclosure controls and procedures (such disclosure controls and procedures having been evaluated within 90 days of the date of this filing) provide reasonable assurance that the information required to be disclosed by the registrant has been recorded, processed, summarized and reported within the time period specified in the Commission’s rules and forms and that the information required to be disclosed by the registrant has been accumulated and communicated to the registrant’s principal executive officer and principal financial officer in order to allow timely decisions regarding required disclosure.
(b) There have been no changes in the registrant’s internal controls over financial reporting during the second fiscal quarter of the period covered by this report that has materially affected, or is reasonably likely to materially affect, the registrant’s internal control over financial reporting.
Item 12. Exhibits
(a)(1) Registrant’s Code of Ethics – Not applicable (please see Item 2).
(a)(2)(i) Treasurer’s Section 302 certification.
(a)(2)(ii) President’s Section 302 certification.
(b) Combined Section 906 certification.
Signatures
Pursuant to the requirements of the Securities Exchange Act of 1934 and the Investment Company Act of 1940, the registrant has duly caused this report to be signed on its behalf by the undersigned, thereunto duly authorized.
Eaton Vance Credit Opportunities Fund
By: | | /s/Scott H. Page | |
| | Scott H. Page |
| | President |
| | |
| | |
Date: | | December 14, 2006 |
Pursuant to the requirements of the Securities Exchange Act of 1934 and the Investment Company Act of 1940, this report has been signed below by the following persons on behalf of the registrant and in the capacities and on the dates indicated.
By: | | /s/Barbara E. Campbell | |
| | Barbara E. Campbell |
| | Treasurer |
| | |
| | |
Date: | | December 14, 2006 |
By: | | /s/Scott H. Page | |
| | Scott H. Page |
| | President |
| | |
| | |
Date: | | December 14, 2006 |