UNITED STATES
SECURITIES AND EXCHANGE COMMISSION
Washington, D.C. 20549
FormN-CSR
CERTIFIED SHAREHOLDER REPORT OF REGISTERED
MANAGEMENT INVESTMENT COMPANIES
Investment Company Act File Number:811-21832
Eaton VanceTax-Managed Diversified Equity Income Fund
(Exact Name of Registrant as Specified in Charter)
Two International Place, Boston, Massachusetts 02110
(Address of Principal Executive Offices)
Maureen A. Gemma
Two International Place, Boston, Massachusetts 02110
(Name and Address of Agent for Services)
(617)482-8260
(Registrant’s Telephone Number)
October 31
Date of Fiscal Year End
October 31, 2019
Date of Reporting Period
Item 1. Reports to Stockholders

Eaton Vance
Tax-Managed Diversified Equity Income Fund(ETY)
Annual Report
October 31, 2019
Important Note. Beginning on January 1, 2021, as permitted by regulations adopted by the Securities and Exchange Commission, paper copies of the Fund’s annual and semi-annual shareholder reports will no longer be sent by mail unless you specifically request paper copies of the reports. Instead, the reports will be made available on the Fund’s website (funds.eatonvance.com/closed-end-fund-and-term-trust-documents.php), and you will be notified by mail each time a report is posted and provided with a website address to access the report.
If you already elected to receive shareholder reports electronically, you will not be affected by this change and you need not take any action. If you hold shares at the Fund’s transfer agent, American Stock Transfer & Trust Company, LLC (“AST”), you may elect to receive shareholder reports and other communications from the Fund electronically by contacting AST. If you own your shares through a financial intermediary (such as a broker-dealer or bank), you must contact your financial intermediary to sign up.
You may elect to receive all future Fund shareholder reports in paper free of charge. If you hold shares at AST, you can inform AST that you wish to continue receiving paper copies of your shareholder reports by calling 1-866-439-6787. If you own these shares through a financial intermediary, you must contact your financial intermediary or follow instructions included with this disclosure, if applicable, to elect to continue to receive paper copies of your shareholder reports. Your election to receive reports in paper will apply to all funds held with AST or to all funds held through your financial intermediary, as applicable.

Commodity Futures Trading Commission Registration. Effective December 31, 2012, the Commodity Futures Trading Commission (“CFTC”) adopted certain regulatory changes that subject registered investment companies and advisers to regulation by the CFTC if a fund invests more than a prescribed level of its assets in certain CFTC-regulated instruments (including futures, certain options and swap agreements) or markets itself as providing investment exposure to such instruments. The Fund has claimed an exclusion from the definition of the term “commodity pool operator” under the Commodity Exchange Act. Accordingly, neither the Fund nor the adviser with respect to the operation of the Fund is subject to CFTC regulation. Because of its management of other strategies, the Fund’s adviser is registered with the CFTC as a commodity pool operator and a commodity trading advisor.
Managed Distribution Plan. Pursuant to an exemptive order issued by the Securities and Exchange Commission (Order), the Fund is authorized to distribute long-term capital gains to shareholders more frequently than once per year. Pursuant to the Order, the Fund’s Board of Trustees approved a Managed Distribution Plan (MDP) pursuant to which the Fund makes monthly cash distributions to common shareholders, stated in terms of a fixed amount per common share.
The Fund currently distributes monthly cash distributions equal to $0.0843 per share in accordance with the MDP. You should not draw any conclusions about the Fund’s investment performance from the amount of these distributions or from the terms of the MDP. The MDP will be subject to regular periodic review by the Fund’s Board of Trustees and the Board may amend or terminate the MDP at any time without prior notice to Fund shareholders. However, at this time there are no reasonably foreseeable circumstances that might cause the termination of the MDP.
The Fund may distribute more than its net investment income and net realized capital gains and, therefore, a distribution may include a return of capital. A return of capital distribution does not necessarily reflect the Fund’s investment performance and should not be confused with “yield” or “income.” With each distribution, the Fund will issue a notice to shareholders and a press release containing information about the amount and sources of the distribution and other related information. The amounts and sources of distributions contained in the notice and press release are only estimates and are not provided for tax purposes. The amounts and sources of the Fund’s distributions for tax purposes will be reported to shareholders on Form1099-DIV for each calendar year.
Fund shares are not insured by the FDIC and are not deposits or other obligations of, or guaranteed by, any depository institution. Shares are subject to investment risks, including possible loss of principal invested.
Annual ReportOctober 31, 2019
Eaton Vance
Tax-Managed Diversified Equity Income Fund
Table of Contents
| | | | |
Management’s Discussion of Fund Performance | | | 2 | |
| |
Performance | | | 3 | |
| |
Fund Profile | | | 3 | |
| |
Fund Snapshot | | | 4 | |
| |
Endnotes and Additional Disclosures | | | 5 | |
| |
Financial Statements | | | 6 | |
| |
Report of Independent Registered Public Accounting Firm | | | 18 | |
| |
Federal Tax Information | | | 19 | |
| |
Annual Meeting of Shareholders | | | 20 | |
| |
Dividend Reinvestment Plan | | | 21 | |
| |
Management and Organization | | | 23 | |
| |
Important Notices | | | 26 | |
Eaton Vance
Tax-Managed Diversified Equity Income Fund
October 31, 2019
Management’s Discussion of Fund Performance1
Economic and Market Conditions
Boosted by a strong late-period rally, U.S. stocks delivered solid double-digit returns during the12-month period ended October 31, 2019.
U.S. stocks opened the period on the downside as investors worried that President Trump’s imposition of broad import tariffs might provoke a wider trade dispute with China, the world’s second-largest economy behind the U.S.
With U.S. economic data largely positive throughout 2018, the U.S. Federal Reserve Board (the Fed) raised its benchmark federal funds rate four times — from a low range of 1.50%-1.75% to2.25%-2.50% — with the last quarter-point increase on December 19, 2018.
U.S. stocks turned higher in early 2019 as trade fears eased and interest rates remained stable after the Fed signaled a slower pace for future rate hikes. However, around the same time, U.S. economic indicators began sending mixed signals. While the U.S. job market was robust during the period with the unemployment rate dipping below 4%, retail sales fell, raising concerns about consumer spending. Factory output also declined, dragged down by a large drop in automobile production.
The U.S. equity market fluctuated through the spring of 2019. Heightened trade-conflict rhetoric drove stocks lower in May before easing tensions helped equities recover in June. Key economic indicators continued to be mixed, with job creation decelerating sharply in May.
After holding interest rates steady through the first half of 2019, the Fed cut its benchmark interest rate to 2.00%-2.25% on July 31 — its first reduction in over a decade — followed by two more quarter-point interest rate drops in September and October to a range of1.50%-1.75%. Lower rates are intended to help stimulate economic activity by making borrowing costs relatively more affordable.
During the12-month period ended October 31, 2019, the blue-chip Dow Jones Industrial Average2 returned 10.32%, while the broader U.S. equity market represented by the S&P 500® Index returned 14.33%. The technology-laden Nasdaq Composite Index returned 14.77% during the period.Large-cap U.S. stocks, as measured by the S&P 500® Index, generally outperformed theirsmall-cap counterparts, as measured by the Russell 2000® Index, during the period. As a group, growth stocks outpaced value stocks in both large- andsmall-cap categories, as measured by the Russell growth and value indexes.
Fund Performance
For the12-month period ended October 31, 2019, Eaton VanceTax-Managed Diversified Equity Income Fund (the Fund)
returned 9.24% at net asset value (NAV), underperforming its primary benchmark, the S&P 500® Index (the Index), which returned 14.33% for the period; but outperforming its secondary benchmark, the Cboe S&P 500 BuyWrite IndexSM, which returned 6.76% for the period.
The Fund’s strategy of writing covered index call options was the largest detractor from returns relative to the Index, as might generally be expected during a period of strong equity market performance. The options strategy, which is designed to help limit the Fund’s exposure to market volatility and provide current income, may be beneficial during periods of market weakness, but may detract from Fund performance versus the Index during periods of market strength. As the market trended upward for much of the period, the Fund’s options strategy detracted from returns relative to the Index, as premium income was relatively low and written calls, overall, ended in losses during the period.
The Fund’s common stock portfolio also detracted from performance relative to the Index. In particular, stock selection in the information technology (IT), industrials, and communication services sectors hurt relative performance. Within IT, the Fund’s overweight position in copier and machine learning company Xerox Corp. (Xerox) dragged on returns relative to the Index. Xerox’s stock price declined as the company’s turnaround efforts fell short of investor expectations.
The Fund’s overweight position in FedEx Corp. (FedEx), an express delivery provider in the industrials sector, declined in price after its announcement of third-quarter 2018 earnings and 2019 guidance that fell short of analyst expectations. FedEx cited the cause as slowing business in its international markets, particularly in Europe and China. Concerns about decreased business with Amazon.com, Inc., which is in the process of building its own direct delivery operation, also weighed on FedEx’s stock price. Byperiod-end, Xerox and FedEx were sold from the Fund.
In contrast, stock selections in the health care, utilities, and consumer staples sectors helped returns relative to the Index. In health care, the Fund’s overweight position in Danaher Corp. (Danaher) — an international conglomerate with an emphasis on life sciences, health care diagnostics, and environmental solutions firms — contributed to returns relative to the Index. Danaher’s stock price rose as the firm reported accelerating revenue growth driven by execution of its growth strategies and ongoing acquisitions.
Within the utilities sector, an overweight position in NextEra Energy, Inc. (NextEra) helped returns relative to the Index. Aided by a focus on renewable energy sources, including wind and solar, NextEra reported steady revenue streams and profit growth during the period.
See Endnotes and Additional Disclosures in this report.
Past performance is no guarantee of future results. Returns are historical and are calculated net of management fees and other expenses by determining the percentage change in net asset value (NAV) or market price (as applicable) with all distributions reinvested in accordance with the Fund’s Dividend Reinvestment Plan. Performance at market price will differ from performance at NAV due to variations in the Fund’s market price versus NAV, which may reflect factors such as fluctuations in supply and demand for Fund shares, changes in Fund distributions, shifting market expectations for the Fund’s future returns and distribution rates, and other considerations affecting the trading prices ofclosed-end funds. Investment return and principal value will fluctuate so that shares, when sold, may be worth more or less than their original cost. Performance for periods less than or equal to one year is cumulative. Performance is for the stated time period only; due to market volatility, current Fund performance may be lower or higher than the quoted return. For performance as of the most recentmonth-end, please refer to eatonvance.com.
Eaton Vance
Tax-Managed Diversified Equity Income Fund
October 31, 2019
Performance2
Portfolio ManagersMichael A. Allison, CFA and G.R. Nelson
| | | | | | | | | | | | | | | | |
% Average Annual Total Returns | | Inception Date | | | One Year | | | Five Years | | | Ten Years | |
Fund at NAV | | | 11/30/2006 | | | | 9.24 | % | | | 8.45 | % | | | 9.80 | % |
Fund at Market Price | | | — | | | | 13.53 | | | | 9.68 | | | | 10.14 | |
S&P 500® Index | | | — | | | | 14.33 | % | | | 10.77 | % | | | 13.69 | % |
Cboe S&P 500 BuyWrite IndexSM | | | — | | | | 6.76 | | | | 6.72 | | | | 7.70 | |
| | | | |
| | | | | | | | | | | | | | | | |
| % Premium/Discount to NAV3 | | | | | | | | | | | | |
| | | | | | | | | | | | | | | 0.42 | % |
| | | | |
| | | | | | | | | | | | | | | | |
| Distributions4 | | | | | | | | | | | | |
Total Distributions per share for the period | | | | | | | | | | | | | | | $1.012 | |
Distribution Rate at NAV | | | | | | | | | | | | | | | 8.52 | % |
Distribution Rate at Market Price | | | | | | | | | | | | | | | 8.49 | % |
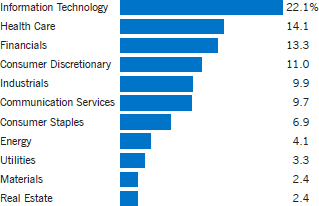
Fund Profile
Sector Allocation (% of total investments)5
Top 10 Holdings (% of total investments)5
| | | | |
Microsoft Corp. | | | 5.6 | % |
| |
Apple, Inc. | | | 4.4 | |
| |
JPMorgan Chase & Co. | | | 3.8 | |
| |
Amazon.com, Inc. | | | 3.3 | |
| |
Verizon Communications, Inc. | | | 3.1 | |
| |
Bank of America Corp. | | | 3.0 | |
| |
Visa, Inc., Class A | | | 2.7 | |
| |
Caterpillar, Inc. | | | 2.6 | |
| |
Abbott Laboratories | | | 2.3 | |
| |
Texas Instruments, Inc. | | | 2.3 | |
| |
Total | | | 33.1 | % |
See Endnotes and Additional Disclosures in this report.
Past performance is no guarantee of future results. Returns are historical and are calculated net of management fees and other expenses by determining the percentage change in net asset value (NAV) or market price (as applicable) with all distributions reinvested in accordance with the Fund’s Dividend Reinvestment Plan. Performance at market price will differ from performance at NAV due to variations in the Fund’s market price versus NAV, which may reflect factors such as fluctuations in supply and demand for Fund shares, changes in Fund distributions, shifting market expectations for the Fund’s future returns and distribution rates, and other considerations affecting the trading prices ofclosed-end funds. Investment return and principal value will fluctuate so that shares, when sold, may be worth more or less than their original cost. Performance for periods less than or equal to one year is cumulative. Performance is for the stated time period only; due to market volatility, current Fund performance may be lower or higher than the quoted return. For performance as of the most recentmonth-end, please refer to eatonvance.com.
Eaton Vance
Tax-Managed Diversified Equity Income Fund
October 31, 2019
Fund Snapshot
| | |
| |
Objective | | The primary investment objective is to provide current income and gains, with a secondary objective of capital appreciation. |
| |
Strategy | | The Fund invests in a diversified portfolio of domestic and foreign common stocks with an emphasis on dividend paying stocks and writes (sells) S&P 500® Index call options with respect to a portion of the value of its common stock portfolio to generate current cash flow from the options premium received. The Fund evaluates returns on an after tax basis and seeks to minimize and defer federal income taxes incurred by shareholders in connection with their investment in the Fund. |
| | | | |
| | |
Options Strategy | | Write Index Covered Calls | | |
| | |
Equity Benchmark2 | | S&P 500® Index | | |
| | |
Morningstar Category | | Option Writing | | |
| | |
Distribution Frequency | | Monthly | | |
| | |
Common Stock Portfolio | | | | |
| | |
Positions Held | | 55 | | |
| | |
% US /Non-US | | 99.2/0.8 | | |
| | |
Average Market Cap | | $267.2 Billion | | |
| | |
Call Options Written | | | | |
| | |
% of Stock Portfolio | | 48% | | |
| | |
Average Days to Expiration | | 14 days | | |
| | |
% In the Money | | –1.0% | | |
The following terms as used in the Fund snapshot:
Average Market Cap:An indicator of the size of the companies in which the Fund invests and is the sum of each security’s weight in the portfolio multiplied by its market cap. Market Cap is determined by multiplying the price of a share of a company’s common stock by the number of shares outstanding.
Call Option:For an index call option, the buyer has the right to receive from the seller (or writer) a cash payment at the option expiration date equal to any positive difference between the value of the index at contract expiration and the exercise price. The buyer of a call option makes a cash payment (premium) to the seller (writer) of the option upon entering into the option contract.
Covered Call Strategy:A strategy of owning a portfolio of common stocks and writing call options on all or a portion of such stocks to generate current earnings from option premium.
In the Money: For a call option on an index, the extent to which the current price of the index exceeds the exercise price of the option.
See Endnotes and Additional Disclosures in this report.
Eaton Vance
Tax-Managed Diversified Equity Income Fund
October 31, 2019
Endnotes and Additional Disclosures
| 1 | The views expressed in this report are those of the portfolio manager(s) and are current only through the date stated at the top of this page. These views are subject to change at any time based upon market or other conditions, and Eaton Vance and the Fund(s) disclaim any responsibility to update such views. These views may not be relied upon as investment advice and, because investment decisions are based on many factors, may not be relied upon as an indication of trading intent on behalf of any Eaton Vance fund. This commentary may contain statements that are not historical facts, referred to as “forward looking statements.” The Fund’s actual future results may differ significantly from those stated in any forward looking statement, depending on factors such as changes in securities or financial markets or general economic conditions, the volume of sales and purchases of Fund shares, the continuation of investment advisory, administrative and service contracts, and other risks discussed from time to time in the Fund’s filings with the Securities and Exchange Commission. |
| 2 | Dow Jones Industrial Average® is a price-weighted average of 30 blue-chip stocks that are generally the leaders in their industry. S&P 500® Index is an unmanaged index of large- cap stocks commonly used as a measure of U.S. stock market performance. S&P Dow Jones Indices are a product of S&P Dow Jones Indices LLC (“S&P DJI”) and have been licensed for use. S&P® and S&P 500® are registered trademarks of S&P DJI; Dow Jones® is a registered trademark of Dow Jones Trademark Holdings LLC (“Dow Jones”); S&P DJI, Dow Jones and their respective affiliates do not sponsor, endorse, sell or promote the Fund, will not have any liability with respect thereto and do not have any liability for any errors, omissions, or interruptions of the S&P Dow Jones Indices. Nasdaq Composite Index is a market capitalization-weighted index of all domestic and international securities listed on Nasdaq. Source: Nasdaq, Inc. The information is provided by Nasdaq (with its affiliates, are referred to as the “Corporations”) and Nasdaq’s third party licensors on an “as is” basis and the Corporations make no guarantees and bear no liability of any kind with respect to the information or the Fund. Russell 2000® Index is an unmanaged index of 2,000 U.S.small-cap stocks. Cboe S&P 500 BuyWrite IndexSMmeasures the performance of a hypotheticalbuy-write strategy on the S&P 500® Index. Unless otherwise stated, index returns do not reflect the effect of any applicable sales charges, commissions, expenses, taxes or leverage, as applicable. It is not possible to invest directly in an index. Performance since inception for an index, if presented, is the performance since the Fund’s or oldest share class’ inception, as applicable. |
| 3 | The shares of the Fund often trade at a discount or premium to their net asset value. The discount or premium may vary over time and may be higher or lower than what is quoted in this report. Forup-to-date premium/discount information, please refer tohttps://funds.eatonvance.com/closed-end-fund-prices.php. |
| 4 | The Distribution Rate is based on the Fund’s last regular distribution per share in the period (annualized) divided by the Fund’s NAV or market price at the end of the period. The Fund’s distributions may be comprised of amounts characterized for federal income tax purposes as qualified andnon-qualified ordinary dividends, capital gains and nondividend distributions, also known as return of capital. For additional information about nondividend distributions, please refer to Eaton Vance Closed-End Fund Distribution Notices (19a) posted on our website, eatonvance.com. The Fund will determine the federal income tax character of distributions paid to a shareholder after the end of the calendar year. This is reported on the IRS form 1099- DIV and provided to the shareholder shortly after each year-end. For information about the tax character of distributions made in prior calendar years, please refer toPerformance-Tax Character of Distributions on the Fund’s webpage available at eatonvance.com. In recent years, a significant portion of the Fund’s distributions has been characterized as a return of capital. The Fund’s distributions are determined by the investment adviser based on its current assessment of the Fund’s long-term return potential. Fund distributions may be affected by numerous factors including changes in Fund performance, the cost of financing for leverage, portfolio holdings, realized and projected returns, and other factors. As portfolio and market conditions change, the rate of distributions paid by the Fund could change. |
| 5 | Depictions do not reflect the Fund’s option positions. Excludes cash and cash equivalents. |
| | Fund snapshot and profile subject to change due to active management. |
Important Notice to Shareholders
| | Effective December 1, 2019, the Fund is managed by Michael A. Allison and G.R. Nelson. |
Eaton Vance
Tax-Managed Diversified Equity Income Fund
October 31, 2019
Portfolio of Investments
| | | | | | | | |
| Common Stocks — 99.7% | |
| Security | | Shares | | | Value | |
|
| Aerospace & Defense — 1.5% | |
| | |
Airbus SE | | | 93,126 | | | $ | 13,359,692 | |
| | |
Textron, Inc. | | | 284,922 | | | | 13,132,055 | |
| | |
| | | | | | | $ | 26,491,747 | |
|
| Banks — 8.2% | |
| | |
Bank of America Corp.(1) | | | 1,723,877 | | | $ | 53,905,634 | |
| | |
JPMorgan Chase & Co.(1) | | | 543,446 | | | | 67,887,274 | |
| | |
PNC Financial Services Group, Inc. (The) | | | 160,361 | | | | 23,524,959 | |
| | |
| | | | | | | $ | 145,317,867 | |
|
| Beverages — 3.0% | |
| | |
Constellation Brands, Inc., Class A(1) | | | 142,543 | | | $ | 27,130,209 | |
| | |
PepsiCo, Inc.(1) | | | 195,997 | | | | 26,884,909 | |
| | |
| | | | | | | $ | 54,015,118 | |
|
| Biotechnology — 3.5% | |
| | |
Gilead Sciences, Inc.(1) | | | 360,810 | | | $ | 22,987,205 | |
| | |
Vertex Pharmaceuticals, Inc.(1)(2) | | | 204,906 | | | | 40,055,025 | |
| | |
| | | | | | | $ | 63,042,230 | |
|
| Capital Markets — 1.3% | |
| | |
Goldman Sachs Group, Inc. (The) | | | 108,325 | | | $ | 23,114,388 | |
| | |
| | | | | | | $ | 23,114,388 | |
|
| Chemicals — 1.2% | |
| | |
DuPont de Nemours, Inc. | | | 311,811 | | | $ | 20,551,463 | |
| | |
| | | | | | | $ | 20,551,463 | |
|
| Commercial Services & Supplies — 1.6% | |
| | |
Waste Management, Inc.(1) | | | 253,906 | | | $ | 28,490,792 | |
| | |
| | | | | | | $ | 28,490,792 | |
|
| Consumer Finance — 2.0% | |
| | |
American Express Co.(1) | | | 307,358 | | | $ | 36,046,946 | |
| | |
| | | | | | | $ | 36,046,946 | |
|
| Diversified Telecommunication Services — 4.5% | |
| | |
AT&T, Inc. | | | 639,947 | | | $ | 24,631,560 | |
| | |
Verizon Communications, Inc.(1) | | | 926,529 | | | | 56,027,209 | |
| | |
| | | | | | | $ | 80,658,769 | |
| | | | | | | | |
| Security | | Shares | | | Value | |
|
| Electric Utilities — 1.9% | |
| | |
NextEra Energy, Inc.(1) | | | 138,089 | | | $ | 32,912,132 | |
| | |
| | | | | | | $ | 32,912,132 | |
|
| Electrical Equipment — 2.2% | |
| | |
Eaton Corp. PLC(1) | | | 458,809 | | | $ | 39,966,852 | |
| | |
| | | | | | | $ | 39,966,852 | |
|
| Entertainment — 3.7% | |
| | |
Live Nation Entertainment, Inc.(2) | | | 391,018 | | | $ | 27,566,769 | |
| | |
Walt Disney Co. (The)(1) | | | 289,541 | | | | 37,617,167 | |
| | |
| | | | | | | $ | 65,183,936 | |
|
| Equity Real Estate Investment Trusts (REITs) — 2.4% | |
| | |
American Tower Corp.(1) | | | 93,613 | | | $ | 20,415,123 | |
| | |
CubeSmart | | | 699,508 | | | | 22,174,404 | |
| | |
| | | | | | | $ | 42,589,527 | |
|
| Food Products — 1.7% | |
| | |
Mondelez International, Inc., Class A(1) | | | 577,472 | | | $ | 30,288,406 | |
| | |
| | | | | | | $ | 30,288,406 | |
|
| Health Care Equipment & Supplies — 4.4% | |
| | |
Abbott Laboratories(1) | | | 503,354 | | | $ | 42,085,428 | |
| | |
Danaher Corp.(1) | | | 264,816 | | | | 36,496,941 | |
| | |
| | | | | | | $ | 78,582,369 | |
|
| Health Care Providers & Services — 1.6% | |
| | |
Anthem, Inc. | | | 106,907 | | | $ | 28,766,536 | |
| | |
| | | | | | | $ | 28,766,536 | |
|
| Hotels, Restaurants & Leisure — 1.5% | |
| | |
Marriott International, Inc., Class A(1) | | | 213,815 | | | $ | 27,058,288 | |
| | |
| | | | | | | $ | 27,058,288 | |
|
| Household Durables — 1.1% | |
| | |
D.R. Horton, Inc. | | | 360,750 | | | $ | 18,892,477 | |
| | |
| | | | | | | $ | 18,892,477 | |
|
| Household Products — 2.3% | |
| | |
Procter & Gamble Co. (The)(1) | | | 324,004 | | | $ | 40,341,738 | |
| | |
| | | | | | | $ | 40,341,738 | |
| | | | |
| | 6 | | See Notes to Financial Statements. |
Eaton Vance
Tax-Managed Diversified Equity Income Fund
October 31, 2019
Portfolio of Investments — continued
| | | | | | | | |
| Security | | Shares | | | Value | |
|
| Insurance — 1.9% | |
| | |
Progressive Corp. (The)(1) | | | 476,627 | | | $ | 33,220,902 | |
| | |
| | | | | | | $ | 33,220,902 | |
|
| Interactive Media & Services — 1.6% | |
| | |
Alphabet, Inc., Class C(1)(2) | | | 22,150 | | | $ | 27,911,436 | |
| | |
| | | | | | | $ | 27,911,436 | |
|
| Internet & Direct Marketing Retail — 3.3% | |
| | |
Amazon.com, Inc.(1)(2) | | | 33,418 | | | $ | 59,372,424 | |
| | |
| | | | | | | $ | 59,372,424 | |
|
| IT Services — 7.0% | |
| | |
Accenture PLC, Class A(1) | | | 187,088 | | | $ | 34,689,857 | |
| | |
Cognizant Technology Solutions Corp., Class A | | | 391,992 | | | | 23,887,993 | |
| | |
GoDaddy, Inc., Class A(2) | | | 273,813 | | | | 17,806,059 | |
| | |
Visa, Inc., Class A(1) | | | 271,723 | | | | 48,600,376 | |
| | |
| | | | | | | $ | 124,984,285 | |
|
| Machinery — 2.6% | |
| | |
Caterpillar, Inc.(1) | | | 334,049 | | | $ | 46,031,952 | |
| | |
| | | | | | | $ | 46,031,952 | |
|
| Metals & Mining — 1.3% | |
| | |
Steel Dynamics, Inc. | | | 769,532 | | | $ | 23,362,991 | |
| | |
| | | | | | | $ | 23,362,991 | |
|
| Multi-Utilities — 1.4% | |
| | |
Sempra Energy(1) | | | 178,179 | | | $ | 25,748,647 | |
| | |
| | | | | | | $ | 25,748,647 | |
|
| Oil, Gas & Consumable Fuels — 4.1% | |
| | |
ConocoPhillips | | | 262,812 | | | $ | 14,507,222 | |
| | |
EOG Resources, Inc. | | | 173,724 | | | | 12,040,811 | |
| | |
Exxon Mobil Corp.(1) | | | 445,446 | | | | 30,098,786 | |
| | |
Phillips 66 | | | 142,544 | | | | 16,651,990 | |
| | |
| | | | | | | $ | 73,298,809 | |
|
| Pharmaceuticals — 4.6% | |
| | |
Bristol-Myers Squibb Co.(1) | | | 507,808 | | | $ | 29,132,945 | |
| | |
Johnson & Johnson(1) | | | 48,832 | | | | 6,447,777 | |
| | |
Pfizer, Inc. | | | 516,181 | | | | 19,805,865 | |
| | |
Zoetis, Inc.(1) | | | 207,692 | | | | 26,567,961 | |
| | |
| | | | | | | $ | 81,954,548 | |
| | | | | | | | |
| Security | | Shares | | | Value | |
|
| Road & Rail — 2.0% | |
| | |
CSX Corp.(1) | | | 516,718 | | | $ | 36,309,774 | |
| | |
| | | | | | | $ | 36,309,774 | |
|
| Semiconductors & Semiconductor Equipment — 3.5% | |
| | |
Intel Corp. | | | 396,462 | | | $ | 22,411,997 | |
| | |
Texas Instruments, Inc.(1) | | | 342,994 | | | | 40,469,862 | |
| | |
| | | | | | | $ | 62,881,859 | |
|
| Software — 7.3% | |
| | |
Intuit, Inc.(1) | | | 111,361 | | | $ | 28,675,458 | |
| | |
Microsoft Corp.(1) | | | 703,806 | | | | 100,904,666 | |
| | |
| | | | | | | $ | 129,580,124 | |
|
| Specialty Retail — 3.7% | |
| | |
Best Buy Co., Inc.(1) | | | 396,447 | | | $ | 28,476,788 | |
| | |
Lowe’s Cos., Inc.(1) | | | 336,932 | | | | 37,604,981 | |
| | |
| | | | | | | $ | 66,081,769 | |
|
| Technology Hardware, Storage & Peripherals — 4.4% | |
| | |
Apple, Inc.(1) | | | 316,267 | | | $ | 78,674,579 | |
| | |
| | | | | | | $ | 78,674,579 | |
|
| Textiles, Apparel & Luxury Goods — 1.4% | |
| | |
NIKE, Inc., Class B(1) | | | 285,087 | | | $ | 25,529,541 | |
| | |
| | | | | | | $ | 25,529,541 | |
| |
Total Common Stocks
(identified cost $1,331,048,823) | | | $ | 1,777,255,221 | |
|
| Short-Term Investments — 0.9% | |
| Description | | Units | | | Value | |
| | |
Eaton Vance Cash Reserves Fund, LLC,
1.97%(3) | | | 15,233,398 | | | $ | 15,233,398 | |
| |
Total Short-Term Investments
(identified cost $15,232,777) | | | $ | 15,233,398 | |
| |
Total Investments — 100.6%
(identified cost $1,346,281,600) | | | $ | 1,792,488,619 | |
| |
Total Written Call Options — (0.7)%
(premiums received $7,911,230) | | | $ | (12,767,375 | ) |
| |
Other Assets, Less Liabilities — 0.1% | | | $ | 2,642,503 | |
| |
Net Assets — 100.0% | | | $ | 1,782,363,747 | |
| | | | |
| | 7 | | See Notes to Financial Statements. |
Eaton Vance
Tax-Managed Diversified Equity Income Fund
October 31, 2019
Portfolio of Investments — continued
The percentage shown for each investment category in the Portfolio of Investments is based on net assets.
| (1) | Security (or a portion thereof) has been pledged as collateral for written options. |
| (2) | Non-income producing security. |
| (3) | Affiliated investment company, available to Eaton Vance portfolios and funds, which invests in high quality, U.S. dollar denominated money market instruments. The rate shown is the annualizedseven-day yield as of October 31, 2019. |
| | | | | | | | | | | | | | | | | | | | |
| Written Call Options — (0.7)% | |
| |
| Exchange-Traded Options — (0.7)% | | | | | |
| |
| | | | | |
| Description | | Number of Contracts | | | Notional Amount | | | Exercise Price | | | Expiration Date | | | Value | |
| | | | | |
S&P 500 Index | | | 235 | | | $ | 71,382,660 | | | $ | 2,975 | | | | 11/1/19 | | | $ | (1,506,350 | ) |
| | | | | |
S&P 500 Index | | | 235 | | | | 71,382,660 | | | | 2,985 | | | | 11/4/19 | | | | (1,283,100 | ) |
| | | | | |
S&P 500 Index | | | 236 | | | | 71,686,416 | | | | 2,975 | | | | 11/6/19 | | | | (1,551,700 | ) |
| | | | | |
S&P 500 Index | | | 235 | | | | 71,382,660 | | | | 2,975 | | | | 11/8/19 | | | | (1,579,200 | ) |
| | | | | |
S&P 500 Index | | | 235 | | | | 71,382,660 | | | | 2,990 | | | | 11/11/19 | | | | (1,296,025 | ) |
| | | | | |
S&P 500 Index | | | 235 | | | | 71,382,660 | | | | 3,015 | | | | 11/13/19 | | | | (833,075 | ) |
| | | | | |
S&P 500 Index | | | 235 | | | | 71,382,660 | | | | 3,025 | | | | 11/15/19 | | | | (767,275 | ) |
| | | | | |
S&P 500 Index | | | 234 | | | | 71,078,904 | | | | 3,045 | | | | 11/18/19 | | | | (532,350 | ) |
| | | | | |
S&P 500 Index | | | 236 | | | | 71,686,416 | | | | 3,015 | | | | 11/20/19 | | | | (998,280 | ) |
| | | | | |
S&P 500 Index | | | 233 | | | | 70,775,148 | | | | 3,015 | | | | 11/22/19 | | | | (1,091,605 | ) |
| | | | | |
S&P 500 Index | | | 233 | | | | 70,775,148 | | | | 3,050 | | | | 11/25/19 | | | | (590,655 | ) |
| | | | | |
S&P 500 Index | | | 232 | | | | 70,471,392 | | | | 3,040 | | | | 11/27/19 | | | | (737,760 | ) |
| |
Total | | | $ | (12,767,375 | ) |
| | | | |
| | 8 | | See Notes to Financial Statements. |
Eaton Vance
Tax-Managed Diversified Equity Income Fund
October 31, 2019
Statement of Assets and Liabilities
| | | | |
| Assets | | October 31, 2019 | |
| |
Unaffiliated investments, at value (identified cost, $1,331,048,823) | | $ | 1,777,255,221 | |
| |
Affiliated investment, at value (identified cost, $15,232,777) | | | 15,233,398 | |
| |
Dividends receivable | | | 3,349,034 | |
| |
Dividends receivable from affiliated investment | | | 53,300 | |
| |
Receivable for investments sold | | | 13,913,281 | |
| |
Receivable from the transfer agent | | | 633,324 | |
| |
Tax reclaims receivable | | | 24,973 | |
| |
Total assets | | $ | 1,810,462,531 | |
|
| Liabilities | |
| |
Written options outstanding, at value (premiums received, $7,911,230) | | $ | 12,767,375 | |
| |
Payable for investments purchased | | | 13,376,668 | |
| |
Payable to affiliates: | | | | |
| |
Investment adviser fee | | | 1,492,382 | |
| |
Trustees’ fees | | | 7,423 | |
| |
Accrued expenses | | | 454,936 | |
| |
Total liabilities | | $ | 28,098,784 | |
| |
Net Assets | | $ | 1,782,363,747 | |
|
| Sources of Net Assets | |
| |
Common shares, $0.01 par value, unlimited number of shares authorized, 150,168,862 shares issued and outstanding | | $ | 1,501,689 | |
| |
Additionalpaid-in capital | | | 1,338,252,514 | |
| |
Distributable earnings | | | 442,609,544 | |
| |
Net Assets | | $ | 1,782,363,747 | |
|
| Net Asset Value | |
| |
($1,782,363,747 ÷ 150,168,862 common shares issued and outstanding) | | $ | 11.87 | |
| | | | |
| | 9 | | See Notes to Financial Statements. |
Eaton Vance
Tax-Managed Diversified Equity Income Fund
October 31, 2019
Statement of Operations
| | | | |
| Investment Income | | Year Ended October 31, 2019 | |
| |
Dividends | | $ | 33,404,691 | |
| |
Dividends from affiliated investment | | | 465,011 | |
| |
Total investment income | | $ | 33,869,702 | |
| |
| Expenses | | | | |
| |
Investment adviser fee | | $ | 17,473,232 | |
| |
Trustees’ fees and expenses | | | 91,182 | |
| |
Custodian fee | | | 427,139 | |
| |
Transfer and dividend disbursing agent fees | | | 19,083 | |
| |
Legal and accounting services | | | 81,122 | |
| |
Printing and postage | | | 564,526 | |
| |
Miscellaneous | | | 147,990 | |
| |
Total expenses | | $ | 18,804,274 | |
| |
Net investment income | | $ | 15,065,428 | |
| |
| Realized and Unrealized Gain (Loss) | | | | |
|
Net realized gain (loss) — | |
| |
Investment transactions | | $ | 127,304,214 | |
| |
Investment transactions — affiliated investment | | | 4,609 | |
| |
Written options | | | (37,053,165 | ) |
| |
Foreign currency transactions | | | (18,622 | ) |
| |
Net realized gain | | $ | 90,237,036 | |
|
Change in unrealized appreciation (depreciation) — | |
| |
Investments | | $ | 56,774,897 | |
| |
Investments — affiliated investment | | | 1,015 | |
| |
Written options | | | (8,741,778 | ) |
| |
Foreign currency | | | 28,003 | |
| |
Net change in unrealized appreciation (depreciation) | | $ | 48,062,137 | |
| |
Net realized and unrealized gain | | $ | 138,299,173 | |
| |
Net increase in net assets from operations | | $ | 153,364,601 | |
| | | | |
| | 10 | | See Notes to Financial Statements. |
Eaton Vance
Tax-Managed Diversified Equity Income Fund
October 31, 2019
Statements of Changes in Net Assets
| | | | | | | | |
| | | Year Ended October 31, | |
| Increase (Decrease) in Net Assets | | 2019 | | | 2018 | |
| | |
From operations — | | | | | | | | |
| | |
Net investment income | | $ | 15,065,428 | | | $ | 12,231,880 | |
| | |
Net realized gain | | | 90,237,036 | | | | 70,375,585 | |
| | |
Net change in unrealized appreciation (depreciation) | | | 48,062,137 | | | | 52,611,501 | |
| | |
Net increase in net assets from operations | | $ | 153,364,601 | | | $ | 135,218,966 | |
| | |
Distributions to shareholders | | $ | (97,061,994 | ) | | $ | (84,779,086 | ) |
| | |
Tax return of capital to shareholders | | $ | (54,494,528 | ) | | $ | (66,490,334 | ) |
| | |
Capital share transactions — | | | | | | | | |
| | |
Proceeds from shelf offering, net of offering costs (see Note 5) | | $ | 1,882,126 | | | $ | — | |
| | |
Reinvestment of distributions | | | 3,118,883 | | | | 3,759,024 | |
| | |
Net increase in net assets from capital share transactions | | $ | 5,001,009 | | | $ | 3,759,024 | |
| | |
Net increase (decrease) in net assets | | $ | 6,809,088 | | | $ | (12,291,430 | ) |
| | |
| Net Assets | | | | | | | | |
| | |
At beginning of year | | $ | 1,775,554,659 | | | $ | 1,787,846,089 | |
| | |
At end of year | | $ | 1,782,363,747 | | | $ | 1,775,554,659 | |
| | | | |
| | 11 | | See Notes to Financial Statements. |
Eaton Vance
Tax-Managed Diversified Equity Income Fund
October 31, 2019
Financial Highlights
| | | | | | | | | | | | | | | | | | | | |
| |
| | | Year Ended October 31, | |
| | | 2019 | | | 2018 | | | 2017 | | | 2016 | | | 2015 | |
| | | | | |
Net asset value — Beginning of year | | $ | 11.860 | | | $ | 11.960 | | | $ | 11.140 | | | $ | 12.010 | | | $ | 12.340 | |
| | | | | |
| Income (Loss) From Operations | | | | | | | | | | | | | | | | | | | | |
| | | | | |
Net investment income(1) | | $ | 0.101 | | | $ | 0.082 | | | $ | 0.100 | | | $ | 0.119 | | | $ | 0.211 | |
| | | | | |
Net realized and unrealized gain (loss) | | | 0.921 | | | | 0.830 | | | | 1.732 | | | | 0.023 | | | | 0.471 | |
| | | | | |
Total income from operations | | $ | 1.022 | | | $ | 0.912 | | | $ | 1.832 | | | $ | 0.142 | | | $ | 0.682 | |
| | | | | |
| Less Distributions | | | | | | | | | | | | | | | | | | | | |
| | | | | |
From net investment income | | $ | (0.100 | ) | | $ | (0.081 | ) | | $ | (0.096 | ) | | $ | (0.095 | ) | | $ | (0.212 | ) |
| | | | | |
From net realized gain | | | (0.548 | ) | | | (0.486 | ) | | | (0.285 | ) | | | (0.071 | ) | | | (0.800 | ) |
| | | | | |
Tax return of capital | | | (0.364 | ) | | | (0.445 | ) | | | (0.631 | ) | | | (0.846 | ) | | | — | |
| | | | | |
Total distributions | | $ | (1.012 | ) | | $ | (1.012 | ) | | $ | (1.012 | ) | | $ | (1.012 | ) | | $ | (1.012 | ) |
| | | | | |
Premium from common shares sold through shelf offering (see Note 5)(1) | | $ | 0.000 | (2) | | $ | — | | | $ | — | | | $ | — | | | $ | — | |
| | | | | |
Net asset value — End of year | | $ | 11.870 | | | $ | 11.860 | | | $ | 11.960 | | | $ | 11.140 | | | $ | 12.010 | |
| | | | | |
Market value — End of year | | $ | 11.920 | | | $ | 11.460 | | | $ | 11.640 | | | $ | 10.290 | | | $ | 11.310 | |
| | | | | |
Total Investment Return on Net Asset Value(3) | | | 9.24 | % | | | 7.75 | % | | | 17.51 | % | | | 1.98 | % | | | 6.38 | % |
| | | | | |
Total Investment Return on Market Value(3) | | | 13.53 | % | | | 6.98 | % | | | 23.81 | % | | | 0.04 | % | | | 5.57 | % |
| | | | | |
| Ratios/Supplemental Data | | | | | | | | | | | | | | | | | | | | |
| | | | | |
Net assets, end of year (000’s omitted) | | $ | 1,782,364 | | | $ | 1,775,555 | | | $ | 1,787,846 | | | $ | 1,665,148 | | | $ | 1,795,490 | |
| | | | | |
Ratios (as a percentage of average daily net assets): | | | | | | | | | | | | | | | | | | | | |
| | | | | |
Expenses(4) | | | 1.07 | % | | | 1.07 | % | | | 1.08 | % | | | 1.08 | % | | | 1.07 | % |
| | | | | |
Net investment income | | | 0.86 | % | | | 0.66 | % | | | 0.86 | % | | | 1.05 | % | | | 1.72 | % |
| | | | | |
Portfolio Turnover | | | 57 | % | | | 48 | % | | | 75 | % | | | 86 | % | | | 85 | % |
| (1) | Computed using average shares outstanding. |
| (2) | Amount is less than $0.0005. |
| (3) | Returns are historical and are calculated by determining the percentage change in net asset value or market value with all distributions reinvested. Distributions are assumed to be reinvested at prices obtained under the Fund’s dividend reinvestment plan. |
| (4) | Excludes the effect of custody fee credits, if any, of less than 0.005%. Effective September 1, 2015, custody fee credits, which were earned on cash deposit balances, were discontinued by the custodian. |
| | | | |
| | 12 | | See Notes to Financial Statements. |
Eaton Vance
Tax-Managed Diversified Equity Income Fund
October 31, 2019
Notes to Financial Statements
1 Significant Accounting Policies
Eaton VanceTax-Managed Diversified Equity Income Fund (the Fund) is a Massachusetts business trust registered under the Investment Company Act of 1940, as amended (the 1940 Act), as a diversified,closed-end management investment company. The Fund’s primary investment objective is to provide current income and gains, with a secondary objective of capital appreciation.
The following is a summary of significant accounting policies of the Fund. The policies are in conformity with accounting principles generally accepted in the United States of America (U.S. GAAP). The Fund is an investment company and follows accounting and reporting guidance in the Financial Accounting Standards Board (FASB) Accounting Standards Codification Topic 946.
A Investment Valuation — The following methodologies are used to determine the market value or fair value of investments.
Equity Securities.Equity securities listed on a U.S. securities exchange generally are valued at the last sale or closing price on the day of valuation or, if no sales took place on such date, at the mean between the closing bid and ask prices on the exchange where such securities are principally traded. Equity securities listed on the NASDAQ Global or Global Select Market generally are valued at the NASDAQ official closing price. Unlisted or listed securities for which closing sales prices or closing quotations are not available are valued at the mean between the latest available bid and ask prices.
Derivatives. U.S. exchange-traded options are valued at the mean between the bid and ask prices at valuation time as reported by the Options Price Reporting Authority. Non U.S. exchange-traded options andover-the-counter options are valued by a third party pricing service using techniques that consider factors including the value of the underlying instrument, the volatility of the underlying instrument and the period of time until option expiration.
Foreign Securities and Currencies.Foreign securities and currencies are valued in U.S. dollars, based on foreign currency exchange rate quotations supplied by a third party pricing service. The pricing service uses a proprietary model to determine the exchange rate. Inputs to the model include reported trades and implied bid/ask spreads. The daily valuation of exchange-traded foreign securities generally is determined as of the close of trading on the principal exchange on which such securities trade. Events occurring after the close of trading on foreign exchanges may result in adjustments to the valuation of foreign securities to more accurately reflect their fair value as of the close of regular trading on the New York Stock Exchange. When valuing foreign equity securities that meet certain criteria, the Fund’s Trustees have approved the use of a fair value service that values such securities to reflect market trading that occurs after the close of the applicable foreign markets of comparable securities or other instruments that have a strong correlation to the fair-valued securities.
Affiliated Fund.The Fund may invest in Eaton Vance Cash Reserves Fund, LLC (Cash Reserves Fund), an affiliated investment company managed by Eaton Vance Management (EVM). While Cash Reserves Fund is not a registered money market mutual fund, it conducts all of its investment activities in accordance with the requirements of Rule2a-7 under the 1940 Act. Investments in Cash Reserves Fund are valued at the closing net asset value per unit on the valuation day. Cash Reserves Fund generally values its investment securities based on available market quotations provided by a third party pricing service.
Fair Valuation.Investments for which valuations or market quotations are not readily available or are deemed unreliable are valued at fair value using methods determined in good faith by or at the direction of the Trustees of the Fund in a manner that most fairly reflects the security’s “fair value”, which is the amount that the Fund might reasonably expect to receive for the security upon its current sale in the ordinary course. Each such determination is based on a consideration of relevant factors, which are likely to vary from one pricing context to another. These factors may include, but are not limited to, the type of security, the existence of any contractual restrictions on the security’s disposition, the price and extent of public trading in similar securities of the issuer or of comparable companies or entities, quotations or relevant information obtained from broker/dealers or other market participants, information obtained from the issuer, analysts, and/or the appropriate stock exchange (for exchange-traded securities), an analysis of the company’s or entity’s financial statements, and an evaluation of the forces that influence the issuer and the market(s) in which the security is purchased and sold.
B Investment Transactions — Investment transactions for financial statement purposes are accounted for on a trade date basis. Realized gains and losses on investments sold are determined on the basis of identified cost.
C Income — Dividend income is recorded on theex-dividend date for dividends received in cash and/or securities. However, if theex-dividend date has passed, certain dividends from foreign securities are recorded as the Fund is informed of theex-dividend date. Withholding taxes on foreign dividends and capital gains have been provided for in accordance with the Fund’s understanding of the applicable countries’ tax rules and rates. In consideration of recent decisions rendered by European courts, the Fund has filed additional tax reclaims for previously withheld taxes on dividends earned in certain European Union countries. These filings are subject to various administrative and judicial proceedings within these countries. Due to the uncertainty as to the ultimate resolution of these proceedings, the likelihood of receipt of these reclaims, and the potential timing of payment, no amounts are reflected in the financial statements for such outstanding reclaims.
D Federal Taxes — The Fund’s policy is to comply with the provisions of the Internal Revenue Code applicable to regulated investment companies and to distribute to shareholders each year substantially all of its net investment income, and all or substantially all of its net realized capital gains. Accordingly, no provision for federal income or excise tax is necessary.
As of October 31, 2019, the Fund had no uncertain tax positions that would require financial statement recognition,de-recognition, or disclosure. The Fund files a U.S. federal income tax return annually after its fiscalyear-end, which is subject to examination by the Internal Revenue Service for a period of three years from the date of filing.
Eaton Vance
Tax-Managed Diversified Equity Income Fund
October 31, 2019
Notes to Financial Statements — continued
E Foreign Currency Translation — Investment valuations, other assets, and liabilities initially expressed in foreign currencies are translated each business day into U.S. dollars based upon current exchange rates. Purchases and sales of foreign investment securities and income and expenses denominated in foreign currencies are translated into U.S. dollars based upon currency exchange rates in effect on the respective dates of such transactions. Recognized gains or losses on investment transactions attributable to changes in foreign currency exchange rates are recorded for financial statement purposes as net realized gains and losses on investments. That portion of unrealized gains and losses on investments that results from fluctuations in foreign currency exchange rates is not separately disclosed.
F Use of Estimates — The preparation of the financial statements in conformity with U.S. GAAP requires management to make estimates and assumptions that affect the reported amounts of assets and liabilities at the date of the financial statements and the reported amounts of income and expense during the reporting period. Actual results could differ from those estimates.
G Indemnifications — Under the Fund’s organizational documents, its officers and Trustees may be indemnified against certain liabilities and expenses arising out of the performance of their duties to the Fund. Under Massachusetts law, if certain conditions prevail, shareholders of a Massachusetts business trust (such as the Fund) could be deemed to have personal liability for the obligations of the Fund. However, the Fund’s Declaration of Trust contains an express disclaimer of liability on the part of Fund shareholders and theBy-laws provide that the Fund shall assume, upon request by the shareholder, the defense on behalf of any Fund shareholders. Moreover, theBy-laws also provide for indemnification out of Fund property of any shareholder held personally liable solely by reason of being or having been a shareholder for all loss or expense arising from such liability. Additionally, in the normal course of business, the Fund enters into agreements with service providers that may contain indemnification clauses. The Fund’s maximum exposure under these arrangements is unknown as this would involve future claims that may be made against the Fund that have not yet occurred.
H Written Options — Upon the writing of a call or a put option, the premium received by the Fund is included in the Statement of Assets and Liabilities as a liability. The amount of the liability is subsequentlymarked-to-market to reflect the current market value of the option written, in accordance with the Fund’s policies on investment valuations discussed above. Premiums received from writing options which expire are treated as realized gains. Premiums received from writing options which are exercised or are closed are added to or offset against the proceeds or amount paid on the transaction to determine the realized gain or loss. When an index option is exercised, the Fund is required to deliver an amount of cash determined by the excess of the exercise price of the option over the value of the index (in the case of a put) or the excess of the value of the index over the exercise price of the option (in the case of a call) at contract termination. If a put option on a security is exercised, the premium reduces the cost basis of the securities purchased by the Fund. The Fund, as a writer of an option, may have no control over whether the underlying securities or other assets may be sold (call) or purchased (put) and, as a result, bears the market risk of an unfavorable change in the price of the securities or other assets underlying the written option. The Fund may also bear the risk of not being able to enter into a closing transaction if a liquid secondary market does not exist.
2 Distributions to Shareholders and Income Tax Information
Subject to its Managed Distribution Plan, the Fund makes monthly distributions from its cash available for distribution, which consists of the Fund’s dividends and interest income after payment of Fund expenses, net option premiums and net realized and unrealized gains on stock investments. The Fund intends to distribute all or substantially all of its net realized capital gains. Distributions are recorded on theex-dividend date. Distributions to shareholders are determined in accordance with income tax regulations, which may differ from U.S. GAAP. As required by U.S. GAAP, only distributions in excess of tax basis earnings and profits are reported in the financial statements as a return of capital. Permanent differences between book and tax accounting relating to distributions are reclassified topaid-in capital. For tax purposes, distributions from short-term capital gains are considered to be from ordinary income. Distributions in any year may include a substantial return of capital component.
The tax character of distributions declared for the years ended October 31, 2019 and October 31, 2018 was as follows:
| | | | | | | | |
| | | Year Ended October 31, | |
| | | 2019 | | | 2018 | |
| | |
Ordinary income | | $ | 14,918,353 | | | $ | 12,167,878 | |
| | |
Long-term capital gains | | $ | 82,143,641 | | | $ | 72,611,208 | |
| | |
Tax return of capital | | $ | 54,494,528 | | | $ | 66,490,334 | |
During the year ended October 31, 2019, distributable earnings was increased by $2,609 andpaid-in capital was decreased by $2,609 due to differences between book and tax accounting. These reclassifications had no effect on the net assets or net asset value per share of the Fund.
As of October 31, 2019, the components of distributable earnings (accumulated loss) on a tax basis were as follows:
| | | | |
| | |
Net unrealized appreciation | | $ | 442,609,544 | |
Eaton Vance
Tax-Managed Diversified Equity Income Fund
October 31, 2019
Notes to Financial Statements — continued
The cost and unrealized appreciation (depreciation) of investments, including open derivative contracts, of the Fund at October 31, 2019, as determined on a federal income tax basis, were as follows:
| | | | |
| |
Aggregate cost | | $ | 1,349,879,726 | |
| |
Gross unrealized appreciation | | $ | 464,076,038 | |
| |
Gross unrealized depreciation | | | (21,467,145 | ) |
| |
Net unrealized appreciation | | $ | 442,608,893 | |
3 Investment Adviser Fee and Other Transactions with Affiliates
The investment adviser fee is earned by EVM as compensation for management and investment advisory services rendered to the Fund. Pursuant to the investment advisory agreement and subsequent fee reduction agreement, the fee is computed at an annual rate of 1.00% of the Fund’s average daily gross assets up to and including $1.5 billion, 0.98% over $1.5 billion up to and including $3 billion and at reduced rates on daily gross assets over $3 billion, and is payable monthly. Gross assets as referred to herein represent net assets plus obligations attributable to investment leverage, if any. The fee reduction cannot be terminated without the consent of a majority of Trustees and a majority of shareholders. For the year ended October 31, 2019, the Fund’s investment adviser fee amounted to $17,473,232 or 1.00% of the Fund’s average daily gross assets. The Fund invests its cash in Cash Reserves Fund. EVM does not currently receive a fee for advisory services provided to Cash Reserves Fund. EVM also serves as administrator of the Fund, but receives no compensation.
Trustees and officers of the Fund who are members of EVM’s organization receive remuneration for their services to the Fund out of the investment adviser fee. Trustees of the Fund who are not affiliated with EVM may elect to defer receipt of all or a percentage of their annual fees in accordance with the terms of the Trustees Deferred Compensation Plan. For the year ended October 31, 2019, no significant amounts have been deferred. Certain officers and Trustees of the Fund are officers of EVM.
4 Purchases and Sales of Investments
Purchases and sales of investments, other than short-term obligations, aggregated $994,015,367 and $1,170,928,893, respectively, for the year ended October 31, 2019.
5 Common Shares of Beneficial Interest and Shelf Offering
Common shares issued by the Fund pursuant to its dividend reinvestment plan for the years ended October 31, 2019 and October 31, 2018 were 262,676 and 303,904, respectively.
In August 2012, the Board of Trustees initially approved a share repurchase program for the Fund. Pursuant to the reauthorization of the share repurchase program by the Board of Trustees in March 2019, the Fund is authorized to repurchase up to 10% of its common shares outstanding as of the last day of the prior calendar year at market prices when shares are trading at a discount to net asset value. The share repurchase program does not obligate the Fund to purchase a specific amount of shares. There were no repurchases of common shares by the Fund for the years ended October 31, 2019 and October 31, 2018.
Pursuant to a registration statement filed with and declared effective on May 9, 2019 by the SEC, the Fund is authorized to issue up to an additional 22,462,218 common shares through an equity shelf offering program (the “shelf offering”). Under the shelf offering, the Fund, subject to market conditions, may raise additional capital from time to time and in varying amounts and offering methods at a net price at or above the Fund’s net asset value per common share.
During the year ended October 31, 2019, the Fund sold 158,062 common shares and received proceeds (net of offering costs) of $1,882,126through its shelf offering. The net proceeds in excess of the net asset value of the shares sold were $15,939. Offering costs (other than the applicable sales commissions) incurred in connection with the shelf offering were borne directly by EVM. Eaton Vance Distributors, Inc. (EVD), an affiliate of EVM, is the distributor of the Fund’s shares and is entitled to receive a sales commission from the Fund of 1.00% of the gross sales price per share, a portion of which isre-allowed to sales agents. The Fund was informed that the sales commissions retained by EVD during the year ended October 31, 2019 were $3,802.
6 Financial Instruments
The Fund may trade in financial instruments withoff-balance sheet risk in the normal course of its investing activities. These financial instruments may include written options and may involve, to a varying degree, elements of risk in excess of the amounts recognized for financial statement purposes. The notional or contractual amounts of these instruments represent the investment the Fund has in particular classes of financial instruments and do not
Eaton Vance
Tax-Managed Diversified Equity Income Fund
October 31, 2019
Notes to Financial Statements — continued
necessarily represent the amounts potentially subject to risk. The measurement of the risks associated with these instruments is meaningful only when all related and offsetting transactions are considered. A summary of obligations under these financial instruments at October 31, 2019 is included in the Portfolio of Investments. At October 31, 2019, the Fund had sufficient cash and/or securities to cover commitments under these contracts.
The Fund is subject to equity price risk in the normal course of pursuing its investment objectives. The Fund writes index call options above the current value of the index to generate premium income. In writing index call options, the Fund in effect, sells potential appreciation in the value of the applicable index above the exercise price in exchange for the option premium received. The Fund retains the risk of loss, minus the premium received, should the value of the underlying index decline.
The fair value of open derivative instruments (not considered to be hedging instruments for accounting disclosure purposes) and whose primary underlying risk exposure is equity price risk at October 31, 2019 was as follows:
| | | | | | | | |
| | | Fair Value | |
| Derivative | | Asset Derivative | | | Liability Derivative(1) | |
| | |
Written options | | $ | — | | | $ | (12,767,375 | ) |
| (1) | Statement of Assets and Liabilities location: Written options outstanding, at value. |
The effect of derivative instruments (not considered to be hedging instruments for accounting disclosure purposes) on the Statement of Operations and whose primary underlying risk exposure is equity price risk for the year ended October 31, 2019 was as follows:
| | | | | | | | |
| Derivative | | Realized Gain (Loss)
on Derivatives Recognized
in Income(1) | | | Change in Unrealized
Appreciation (Depreciation) on
Derivatives Recognized in Income(2) | |
| | |
Written options | | $ | (37,053,165 | ) | | $ | (8,741,778 | ) |
| (1) | Statement of Operations location: Net realized gain (loss) – Written options. |
| (2) | Statement of Operations location: Change in unrealized appreciation (depreciation) – Written options. |
The average number of written options contracts outstanding during the year ended October 31, 2019, which is indicative of the volume of this derivative type, was 2,945 contracts.
7 Investments in Affiliated Funds
At October 31, 2019, the value of the Fund’s investment in affiliated funds was $15,233,398, which represents 0.9% of the Fund’s net assets. Transactions in affiliated funds by the Fund for the year ended October 31, 2019 were as follows:
| | | | | | | | | | | | | | | | | | | | | | | | | | | | | | | | |
Name of affiliated fund | | Value,
beginning of
period | | | Purchases | | | Sales proceeds | | | Net
realized
gain (loss) | | | Change in
unrealized
appreciation
(depreciation) | | | Value,
end of
period | | | Dividend
income | | | Units,
end of
period | |
|
Short-Term Investments | |
| | | | | | | | |
Eaton Vance Cash Reserves Fund, LLC, 1.97% | | $ | 12,203,730 | | | $ | 451,955,570 | | | $ | (448,931,526 | ) | | $ | 4,609 | | | $ | 1,015 | | | $ | 15,233,398 | | | $ | 465,011 | | | | 15,233,398 | |
Eaton Vance
Tax-Managed Diversified Equity Income Fund
October 31, 2019
Notes to Financial Statements — continued
8 Fair Value Measurements
Under generally accepted accounting principles for fair value measurements, a three-tier hierarchy to prioritize the assumptions, referred to as inputs, is used in valuation techniques to measure fair value. The three-tier hierarchy of inputs is summarized in the three broad levels listed below.
| • | | Level 1 – quoted prices in active markets for identical investments |
| • | | Level 2 – other significant observable inputs (including quoted prices for similar investments, interest rates, prepayment speeds, credit risk, etc.) |
| • | | Level 3 – significant unobservable inputs (including a fund’s own assumptions in determining the fair value of investments) |
In cases where the inputs used to measure fair value fall in different levels of the fair value hierarchy, the level disclosed is determined based on the lowest level input that is significant to the fair value measurement in its entirety. The inputs or methodology used for valuing securities are not necessarily an indication of the risk associated with investing in those securities.
At October 31, 2019, the hierarchy of inputs used in valuing the Fund’s investments and open derivative instruments, which are carried at value, were as follows:
| | | | | | | | | | | | | | | | |
| Asset Description | | Level 1 | | | Level 2 | | | Level 3 | | | Total | |
| | | | |
Common Stocks | | | | | | | | | | | | | | | | |
| | | | |
Communication Services | | $ | 173,754,141 | | | $ | — | | | $ | — | | | $ | 173,754,141 | |
| | | | |
Consumer Discretionary | | | 196,934,499 | | | | — | | | | — | | | | 196,934,499 | |
| | | | |
Consumer Staples | | | 124,645,262 | | | | — | | | | — | | | | 124,645,262 | |
| | | | |
Energy | | | 73,298,809 | | | | — | | | | — | | | | 73,298,809 | |
| | | | |
Financials | | | 237,700,103 | | | | — | | | | — | | | | 237,700,103 | |
| | | | |
Health Care | | | 252,345,683 | | | | — | | | | — | | | | 252,345,683 | |
| | | | |
Industrials | | | 163,931,425 | | | | 13,359,692 | | | | — | | | | 177,291,117 | |
| | | | |
Information Technology | | | 396,120,847 | | | | — | | | | — | | | | 396,120,847 | |
| | | | |
Materials | | | 43,914,454 | | | | — | | | | — | | | | 43,914,454 | |
| | | | |
Real Estate | | | 42,589,527 | | | | — | | | | — | | | | 42,589,527 | |
| | | | |
Utilities | | | 58,660,779 | | | | — | | | | — | | | | 58,660,779 | |
| | | | |
Total Common Stocks | | $ | 1,763,895,529 | | | $ | 13,359,692 | * | | $ | — | | | $ | 1,777,255,221 | |
| | | | |
Short-Term Investments | | $ | — | | | $ | 15,233,398 | | | $ | — | | | $ | 15,233,398 | |
| | | | |
Total Investments | | $ | 1,763,895,529 | | | $ | 28,593,090 | | | $ | — | | | $ | 1,792,488,619 | |
| | | | |
Liability Description | | | | | | | | | | | | | | | | |
| | | | |
Written Call Options | | $ | (12,767,375 | ) | | $ | — | | | $ | — | | | $ | (12,767,375 | ) |
| | | | |
Total | | $ | (12,767,375 | ) | | $ | — | | | $ | — | | | $ | (12,767,375 | ) |
| * | Includes foreign equity securities whose values were adjusted to reflect market trading of comparable securities or other correlated instruments that occurred after the close of trading in their applicable foreign markets. |
Eaton Vance
Tax-Managed Diversified Equity Income Fund
October 31, 2019
Report of Independent Registered Public Accounting Firm
To the Trustees and Shareholders of Eaton VanceTax-Managed Diversified Equity Income Fund:
Opinion on the Financial Statements and Financial Highlights
We have audited the accompanying statement of assets and liabilities of Eaton VanceTax-Managed Diversified Equity Income Fund (the “Fund”), including the portfolio of investments, as of October 31, 2019, the related statement of operations for the year then ended, the statements of changes in net assets for each of the two years in the period then ended, the financial highlights for each of the five years in the period then ended, and the related notes. In our opinion, the financial statements and financial highlights present fairly, in all material respects, the financial position of the Fund as of October 31, 2019, and the results of its operations for the year then ended, the changes in its net assets for each of the two years in the period then ended, and the financial highlights for each of the five years in the period then ended, in conformity with accounting principles generally accepted in the United States of America.
Basis for Opinion
These financial statements and financial highlights are the responsibility of the Fund’s management. Our responsibility is to express an opinion on the Fund’s financial statements and financial highlights based on our audits. We are a public accounting firm registered with the Public Company Accounting Oversight Board (United States) (PCAOB) and are required to be independent with respect to the Fund in accordance with the U.S. federal securities laws and the applicable rules and regulations of the Securities and Exchange Commission and the PCAOB.
We conducted our audits in accordance with the standards of the PCAOB. Those standards require that we plan and perform the audit to obtain reasonable assurance about whether the financial statements and financial highlights are free of material misstatement, whether due to error or fraud. The Fund is not required to have, nor were we engaged to perform, an audit of its internal control over financial reporting. As part of our audits we are required to obtain an understanding of internal control over financial reporting but not for the purpose of expressing an opinion on the effectiveness of the Fund’s internal control over financial reporting. Accordingly, we express no such opinion.
Our audits included performing procedures to assess the risks of material misstatement of the financial statements and financial highlights, whether due to error or fraud, and performing procedures that respond to those risks. Such procedures included examining, on a test basis, evidence regarding the amounts and disclosures in the financial statements and financial highlights. Our audits also included evaluating the accounting principles used and significant estimates made by management, as well as evaluating the overall presentation of the financial statements and financial highlights. Our procedures included confirmation of securities owned as of October 31, 2019, by correspondence with the custodian and brokers; when replies were not received from brokers, we performed other auditing procedures. We believe that our audits provide a reasonable basis for our opinion.
/s/ Deloitte & Touche LLP
Boston, Massachusetts
December 17, 2019
We have served as the auditor of one or more Eaton Vance investment companies since 1959.
Eaton Vance
Tax-Managed Diversified Equity Income Fund
October 31, 2019
Federal Tax Information (Unaudited)
The Form1099-DIV you receive in February 2020 will show the tax status of all distributions paid to your account in calendar year 2019. Shareholders are advised to consult their own tax adviser with respect to the tax consequences of their investment in the Fund. As required by the Internal Revenue Code and/or regulations, shareholders must be notified regarding the status of qualified dividend income for individuals, the dividends received deduction for corporations and capital gains dividends.
Qualified Dividend Income. For the fiscal year ended October 31, 2019, the Fund designates approximately $31,332,832, or up to the maximum amount of such dividends allowable pursuant to the Internal Revenue Code, as qualified dividend income eligible for the reduced tax rate of 15%.
Dividends Received Deduction. Corporate shareholders are generally entitled to take the dividends received deduction on the portion of the Fund’s dividend distribution that qualifies under tax law. For the Fund’s fiscal 2019 ordinary income dividends, 100% qualifies for the corporate dividends received deduction.
Capital Gains Dividends. The Fund hereby designates as a capital gain dividend with respect to the taxable year ended October 31, 2019, $82,143,641 or, if subsequently determined to be different, the net capital gain of such year.
Eaton Vance
Tax-Managed Diversified Equity Income Fund
October 31, 2019
Annual Meeting of Shareholders (Unaudited)
The Fund held its Annual Meeting of Shareholders on August 15, 2019. The following action was taken by the shareholders:
Item 1: The election of Thomas E. Faust Jr., Cynthia E. Frost and Scott E. Wennerholm as Class I Trustees of the Fund for a three-year term expiring in 2022.
| | | | | | | | |
Nominee for Trustee Elected by All Shareholders | | Number of Shares | |
| | For | | | Withheld | |
| | |
Thomas E. Faust Jr. | | | 138,519,658 | | | | 2,828,804 | |
| | |
Cynthia E. Frost | | | 138,497,207 | | | | 2,851,255 | |
| | |
Scott E. Wennerholm | | | 138,508,965 | | | | 2,839,497 | |
Eaton Vance
Tax-Managed Diversified Equity Income Fund
October 31, 2019
Dividend Reinvestment Plan
The Fund offers a dividend reinvestment plan (Plan) pursuant to which shareholders automatically have distributions reinvested in common shares (Shares) of the Fund unless they elect otherwise through their investment dealer. On the distribution payment date, if the NAV per Share is equal to or less than the market price per Share plus estimated brokerage commissions, then new Shares will be issued. The number of Shares shall be determined by the greater of the NAV per Share or 95% of the market price. Otherwise, Shares generally will be purchased on the open market by American Stock Transfer & Trust Company, LLC, the Plan agent (Agent). Distributions subject to income tax (if any) are taxable whether or not Shares are reinvested.
If your Shares are in the name of a brokerage firm, bank, or other nominee, you can ask the firm or nominee to participate in the Plan on your behalf. If the nominee does not offer the Plan, you will need to request that the Fund’s transfer agentre-register your Shares in your name or you will not be able to participate.
The Agent’s service fee for handling distributions will be paid by the Fund. Plan participants will be charged their pro rata share of brokerage commissions on all open-market purchases.
Plan participants may withdraw from the Plan at any time by writing to the Agent at the address noted on the following page. If you withdraw, you will receive Shares in your name for all Shares credited to your account under the Plan. If a participant elects by written notice to the Agent to sell part or all of his or her Shares and remit the proceeds, the Agent is authorized to deduct a $5.00 fee plus brokerage commissions from the proceeds.
If you wish to participate in the Plan and your Shares are held in your own name, you may complete the form on the following page and deliver it to the Agent. Any inquiries regarding the Plan can be directed to the Agent at1-866-439-6787.
Eaton Vance
Tax-Managed Diversified Equity Income Fund
October 31, 2019
Application for Participation in Dividend Reinvestment Plan
This form is for shareholders who hold their common shares in their own names. If your common shares are held in the name of a brokerage firm, bank, or other nominee, you should contact your nominee to see if it will participate in the Plan on your behalf. If you wish to participate in the Plan, but your brokerage firm, bank, or nominee is unable to participate on your behalf, you should request that your common shares bere-registered in your own name which will enable your participation in the Plan.
The following authorization and appointment is given with the understanding that I may terminate it at any time by terminating my participation in the Plan as provided in the terms and conditions of the Plan.
Please print exact name on account
Shareholder signature Date
Shareholder signature Date
Please sign exactly as your common shares are registered. All persons whose names appear on the share certificate must sign.
YOU SHOULD NOT RETURN THIS FORM IF YOU WISH TO RECEIVE YOUR DISTRIBUTIONS IN CASH. THIS IS NOT A PROXY.
This authorization form, when signed, should be mailed to the following address:
Eaton Vance Tax-Managed Diversified Equity Income Fund
c/o American Stock Transfer & Trust Company, LLC
P.O. Box 922
Wall Street Station
New York, NY 10269-0560
Eaton Vance
Tax-Managed Diversified Equity Income Fund
October 31, 2019
Management and Organization
Fund Management. The Trustees of Eaton VanceTax-Managed Diversified Equity Income Fund (the Fund) are responsible for the overall management and supervision of the Fund’s affairs. The Trustees and officers of the Fund are listed below. Except as indicated, each individual has held the office shown or other offices in the same company for the last five years. The “Noninterested Trustees” consist of those Trustees who are not “interested persons” of the Fund, as that term is defined under the 1940 Act. The business address of each Trustee and officer is Two International Place, Boston, Massachusetts 02110. As used below, “EVC” refers to Eaton Vance Corp., “EV” refers to Eaton Vance, Inc., “EVM” refers to Eaton Vance Management, “BMR” refers to Boston Management and Research and “EVD” refers to Eaton Vance Distributors, Inc. EVC and EV are the corporate parent and trustee, respectively, of EVM and BMR. EVD is a wholly-owned subsidiary of EVC. Each officer affiliated with Eaton Vance may hold a position with other Eaton Vance affiliates that is comparable to his or her position with EVM listed below. Each Trustee oversees 159 portfolios in the Eaton Vance Complex (including all master and feeder funds in a master feeder structure). Each officer serves as an officer of certain other Eaton Vance funds.
| | | | | | |
| Name and Year of Birth | | Fund Position(s) | | Term Expiring. Trustee
Since(1) | | Principal Occupation(s) and Other Directorships
During Past Five Years and Other Relevant Experience |
|
| Interested Trustee |
| | | |
Thomas E. Faust Jr. 1958 | | Class I Trustee | | Until 2022. Trustee since 2007. | | Chairman, Chief Executive Officer and President of EVC, Director and President of EV, Chief Executive Officer and President of EVM and BMR, and Director of EVD. Trustee and/or officer of 159 registered investment companies. Mr. Faust is an interested person because of his positions with EVM, BMR, EVD, EVC and EV, which are affiliates of the Fund. Other Directorships in the Last Five Years.Director of EVC and Hexavest Inc. (investment management firm). |
|
| Noninterested Trustees |
| | | |
Mark R. Fetting 1954 | | Class III Trustee | | Until 2021. Trustee since 2016. | | Private investor. Formerly held various positions at Legg Mason, Inc. (investment management firm) (2000-2012), including President, Chief Executive Officer, Director and Chairman (2008-2012), Senior Executive Vice President (2004-2008) and Executive Vice President (2001-2004). Formerly, President of Legg Mason family of funds (2001-2008). Formerly, Division President and Senior Officer of Prudential Financial Group, Inc. and related companies (investment management firm) (1991-2000). Other Directorships in the Last Five Years. None. |
| | | |
Cynthia E. Frost 1961 | | Class I Trustee | | Until 2022. Trustee since 2014. | | Private investor. Formerly, Chief Investment Officer of Brown University (university endowment) (2000-2012). Formerly, Portfolio Strategist for Duke Management Company (university endowment manager) (1995-2000). Formerly, Managing Director, Cambridge Associates (investment consulting company) (1989-1995). Formerly, Consultant, Bain and Company (management consulting firm)(1987-1989). Formerly, Senior Equity Analyst, BA Investment Management Company (1983-1985). Other Directorships in the Last Five Years.None. |
| | | |
George J. Gorman 1952 | | Class II Trustee | | Until 2020. Trustee since 2014. | | Principal at George J. Gorman LLC (consulting firm). Formerly, Senior Partner at Ernst & Young LLP (a registered public accounting firm) (1974-2009). Other Directorships in the Last Five Years.Formerly, Trustee of the BofA Funds Series Trust (11 funds) (2011-2014) and of the Ashmore Funds (9 funds)(2010-2014). |
| | | |
Valerie A. Mosley 1960 | | Class III Trustee | | Until 2021. Trustee since 2014. | | Chairwoman and Chief Executive Officer of Valmo Ventures (a consulting and investment firm). Former Partner and Senior Vice President, Portfolio Manager and Investment Strategist at Wellington Management Company, LLP (investment management firm) (1992-2012). Former Chief Investment Officer, PG Corbin Asset Management (1990-1992). Formerly worked in institutional corporate bond sales at Kidder Peabody (1986-1990). Other Directorships in the Last Five Years.Director of Envestnet, Inc. (provider of intelligent systems for wealth management and financial wellness) (since 2018). Director of Dynex Capital, Inc. (mortgage REIT) (since 2013). |
Eaton Vance
Tax-Managed Diversified Equity Income Fund
October 31, 2019
Management and Organization — continued
| | | | | | |
| Name and Year of Birth | | Fund Position(s) | | Term Expiring. Trustee
Since(1) | | Principal Occupation(s) and Other Directorships
During Past Five Years and Other Relevant Experience |
|
| Noninterested Trustees (continued) |
| | | |
William H. Park 1947 | | Chairperson of the Board and Class II Trustee | | Until 2020. Chairperson of the Board since 2016 and Trustee since 2003. | | Private investor. Formerly, Consultant (management and transactional) (2012-2014). Formerly, Chief Financial Officer, Aveon Group L.P. (investment management firm) (2010-2011). Formerly, Vice Chairman, Commercial Industrial Finance Corp. (specialty finance company) (2006-2010). Formerly, President and Chief Executive Officer, Prizm Capital Management, LLC (investment management firm)(2002-2005). Formerly, Executive Vice President and Chief Financial Officer, United Asset Management Corporation (investment management firm) (1982-2001). Formerly, Senior Manager, Price Waterhouse (now PricewaterhouseCoopers) (a registered public accounting firm) (1972-1981). Other Directorships in the Last Five Years.None. |
| | | |
Helen Frame Peters 1948 | | Class III Trustee | | Until 2021. Trustee since 2008. | | Professor of Finance, Carroll School of Management, Boston College. Formerly, Dean, Carroll School of Management, Boston College (2000-2002). Formerly, Chief Investment Officer, Fixed Income, Scudder Kemper Investments (investment management firm) (1998-1999). Formerly, Chief Investment Officer, Equity and Fixed Income, Colonial Management Associates (investment management firm) (1991-1998). Other Directorships in the Last Five Years. None. |
| | | |
Keith Quinton 1958 | | Class II Trustee | | Until 2020. Trustee since 2018. | | Independent Investment Committee Member at New Hampshire Retirement System (since 2017). Advisory Committee member at Northfield Information Services, Inc. (risk management analytics provider) (since 2016). Formerly, Portfolio Manager and Senior Quantitative Analyst at Fidelity Investments (investment management firm) (2001-2014). Other Directorships in the Last Five Years. Director of New Hampshire Municipal Bond Bank (since 2016). |
| | | |
Marcus L. Smith 1966 | | Class III Trustee | | Until 2021. Trustee since 2018. | | Member of Posse Boston Advisory Board (foundation) (since 2015). Trustee at University of Mount Union (since 2008). Formerly, Portfolio Manager at MFS Investment Management (investment management firm) (1994-2017). Other Directorships in the Last Five Years. Director of MSCI Inc. (global provider of investment decision support tools) (since 2017). Formerly, Director of DCT Industrial Trust Inc. (logistics real estate company) (2017-2018). |
| | | |
Susan J. Sutherland 1957 | | Class II Trustee | | Until 2020. Trustee since 2015. | | Private investor. Formerly, Associate, Counsel and Partner at Skadden, Arps, Slate, Meagher & Flom LLP (law firm) (1982-2013). Other Directorships in the Last Five Years. Formerly, Director of Montpelier Re Holdings Ltd. (global provider of customized insurance and reinsurance products) (2013-2015). |
| | | |
Scott E. Wennerholm 1959 | | Class I Trustee | | Until 2022. Trustee since 2016. | | Formerly, Trustee at Wheelock College (postsecondary institution) (2012-2018). Formerly, Consultant at GF Parish Group (executive recruiting firm) (2016-2017). Formerly, Chief Operating Officer and Executive Vice President at BNY Mellon Asset Management (investment management firm) (2005-2011). Formerly, Chief Operating Officer and Chief Financial Officer at Natixis Global Asset Management (investment management firm) (1997-2004). Formerly, Vice President at Fidelity Investments Institutional Services (investment management firm) (1994-1997). Other Directorships in the Last Five Years. None. |
| | | | | | |
| Name and Year of Birth | | Fund Position(s) | | Officer
Since(2) | | Principal Occupation(s)
During Past Five Years |
|
| Principal Officers who are not Trustees |
| | | |
Edward J. Perkin 1972 | | President | | 2014 | | Chief Equity Investment Officer and Vice President of EVM and BMR since 2014. Formerly, Chief Investment Officer, International and Emerging Markets Equity, and Managing Director, Portfolio Manager, Europe, EAFE and Global at Goldman Sachs Asset Management(2002-2014). Also Vice President of Calvert Research and Management (“CRM”) since 2016. |
| | | |
Maureen A. Gemma 1960 | | Vice President, Secretary and Chief Legal Officer | | 2005 | | Vice President of EVM and BMR. Also Vice President of CRM since 2016. |
Eaton Vance
Tax-Managed Diversified Equity Income Fund
October 31, 2019
Management and Organization — continued
| | | | | | |
| Name and Year of Birth | | Fund Position(s) | | Officer
Since(2) | | Principal Occupation(s)
During Past Five Years |
|
| Principal Officers who are not Trustees (continued) |
| | | |
James F. Kirchner 1967 | | Treasurer | | 2007 | | Vice President of EVM and BMR. Also Vice President of CRM since 2016. |
| | | |
Richard F. Froio 1968 | | Chief Compliance Officer | | 2017 | | Vice President of EVM and BMR since 2017. Formerly, Deputy Chief Compliance Officer (Adviser/Funds) and Chief Compliance Officer (Distribution) at PIMCO(2012-2017) and Managing Director at BlackRock/Barclays Global Investors(2009-2012). |
| (1) | Year first appointed to serve as Trustee for a fund in the Eaton Vance family of funds. Each Trustee has served continuously since appointment unless indicated otherwise. Each Trustee holds office until the annual meeting for the year in which his or her term expires and until his or her successor is elected and qualified, subject to a prior death, resignation, retirement, disqualification or removal. |
| (2) | Year first elected to serve as officer of a fund in the Eaton Vance family of funds when the officer has served continuously. Otherwise, year of most recent election as an officer of a fund in the Eaton Vance family of funds. Titles may have changed since initial election. Each officer serves until his or her successor is elected. |
Eaton Vance Funds
IMPORTANT NOTICES
Privacy. The Eaton Vance organization is committed to ensuring your financial privacy. Each of the financial institutions identified below has in effect the following policy (“Privacy Policy”) with respect to nonpublic personal information about its customers:
| • | | Only such information received from you, through application forms or otherwise, and information about your Eaton Vance fund transactions will be collected. This may include information such as name, address, social security number, tax status, account balances and transactions. |
| • | | None of such information about you (or former customers) will be disclosed to anyone, except as permitted by law (which includes disclosure to employees necessary to service your account). In the normal course of servicing a customer’s account, Eaton Vance may share information with unaffiliated third parties that perform various required services such as transfer agents, custodians and broker-dealers. |
| • | | Policies and procedures (including physical, electronic and procedural safeguards) are in place that are designed to protect the confidentiality of such information. |
| • | | We reserve the right to change our Privacy Policy at any time upon proper notification to you. Customers may want to review our Privacy Policy periodically for changes by accessing the link on our homepage: www.eatonvance.com. |
Our pledge of privacy applies to the following entities within the Eaton Vance organization: the Eaton Vance Family of Funds, Eaton Vance Management, Eaton Vance Investment Counsel, Eaton Vance Distributors, Inc., Eaton Vance Trust Company, Eaton Vance Management (International) Limited, Eaton Vance Advisers International Ltd., Eaton Vance Management’s Real Estate Investment Group and Boston Management and Research. In addition, our Privacy Policy applies only to those Eaton Vance customers who are individuals and who have a direct relationship with us. If a customer’s account (i.e., fund shares) is held in the name of a third-party financial advisor/broker-dealer, it is likely that only such advisor’s privacy policies apply to the customer. This notice supersedes all previously issued privacy disclosures. For more information about Eaton Vance’s Privacy Policy, please call1-800-262-1122.
Delivery of Shareholder Documents. The Securities and Exchange Commission (SEC) permits funds to deliver only one copy of shareholder documents, including prospectuses, proxy statements and shareholder reports, to fund investors with multiple accounts at the same residential or post office box address. This practice is often called “householding” and it helps eliminate duplicate mailings to shareholders. American Stock Transfer & Trust Company, LLC (“AST”), theclosed-end funds transfer agent, or your financial intermediary, may household the mailing of your documents indefinitely unless you instruct AST, or your financial intermediary, otherwise. If you would prefer that your Eaton Vance documents not be householded, please contact AST or your financial intermediary. Your instructions that householding not apply to delivery of your Eaton Vance documents will typically be effective within 30 days of receipt by AST or your financial intermediary.
Portfolio Holdings. Each Eaton Vance Fund and its underlying Portfolio(s) (if applicable) files a schedule of portfolio holdings on Part F toForm N-PORT with the SEC for the first and third quarters of each fiscal year. The FormN-PORT will be available on the Eaton Vance website at www.eatonvance.com, by calling Eaton Vance at1-800-262-1122 or in the EDGAR database on the SEC’s website at www.sec.gov.
Proxy Voting. From time to time, funds are required to vote proxies related to the securities held by the funds. The Eaton Vance Funds or their underlying Portfolios (if applicable) vote proxies according to a set of policies and procedures approved by the Funds’ and Portfolios’ Boards. You may obtain a description of these policies and procedures and information on how the Funds or Portfolios voted proxies relating to portfolio securities during the most recent12-month period ended June 30, without charge, upon request, by calling1-800-262-1122 and by accessing the SEC’s website at www.sec.gov.
Share Repurchase Program. The Fund’s Board of Trustees has approved a share repurchase program authorizing the Fund to repurchase up to 10% of its common shares outstanding as of the last day of the prior calendar year in open-market transactions at a discount to net asset value. The repurchase program does not obligate the Fund to purchase a specific amount of shares. The Fund’s repurchase activity, including the number of shares purchased, average price and average discount to net asset value, is disclosed in the Fund’s annual and semi-annual reports to shareholders.
Additional Notice to Shareholders. If applicable, a Fund may also redeem or purchase its outstanding preferred shares in order to maintain compliance with regulatory requirements, borrowing or rating agency requirements or for other purposes as it deems appropriate or necessary.
Closed-End Fund Information. Eaton Vanceclosed-end funds make fund performance data and certain information about portfolio characteristics available on the Eaton Vance website shortly after the end of each month. Other information about the funds is available on the website. The funds’ net asset value per share is readily accessible on the Eaton Vance website. Portfolio holdings for the most recentmonth-end are also posted to the website approximately 30 days following the end of the month. This information is available at www.eatonvance.com on the fund information pages under “Individual Investors —Closed-End Funds”.
This Page Intentionally Left Blank
This Page Intentionally Left Blank
Investment Adviser and Administrator
Eaton Vance Management
Two International Place
Boston, MA 02110
Custodian
State Street Bank and Trust Company
State Street Financial Center, One Lincoln Street
Boston, MA 02111
Transfer Agent
American Stock Transfer & Trust Company, LLC
6201 15th Avenue
Brooklyn, NY 11219
Independent Registered Public Accounting Firm
Deloitte & Touche LLP
200 Berkeley Street
Boston, MA 02116-5022
Fund Offices
Two International Place
Boston, MA 02110

2897 10.31.19
Item 2. Code of Ethics
The registrant has adopted a code of ethics applicable to its Principal Executive Officer, Principal Financial Officer and Principal Accounting Officer. The registrant undertakes to provide a copy of such code of ethics to any person upon request, without charge, by calling1-800-262-1122. The registrant has not amended the code of ethics as described in FormN-CSR during the period covered by this report. The registrant has not granted any waiver, including an implicit waiver, from a provision of the code of ethics as described in FormN-CSR during the period covered by this report.
Item 3. Audit Committee Financial Expert
The registrant’s Board has designated George J. Gorman and William H. Park, each an independent trustee, as audit committee financial experts. Mr. Gorman is a certified public accountant who is the Principal at George J. Gorman LLC (a consulting firm). Previously, Mr. Gorman served in various capacities at Ernst & Young LLP (a registered public accounting firm), including as Senior Partner. Mr. Gorman also has experience serving as an independent trustee and audit committee financial expert of other mutual fund complexes. Mr. Park is a certified public accountant who is a private investor. Previously, he served as a consultant, as the Chief Financial Officer of Aveon Group, L.P. (an investment management firm), as the Vice Chairman of Commercial Industrial Finance Corp. (specialty finance company), as President and Chief Executive Officer of Prizm Capital Management, LLC (investment management firm), as Executive Vice President and Chief Financial Officer of United Asset Management Corporation (an institutional investment management firm) and as a Senior Manager at Price Waterhouse (now PricewaterhouseCoopers) (a registered public accounting firm).
Item 4. Principal Accountant Fees and Services
(a) –(d)
The following table presents the aggregate fees billed to the registrant for the registrant’s fiscal years ended October 31, 2018 and October 31, 2019 by the registrant’s principal accountant, Deloitte & Touche LLP (“D&T”), for professional services rendered for the audit of the registrant’s annual financial statements and fees billed for other services rendered by D&T during such periods.
| | | | | | | | |
Fiscal Years Ended | | 10/31/18 | | | 10/31/19 | |
Audit Fees | | $ | 49,420 | | | $ | 52,250 | |
Audit-Related Fees(1) | | $ | 0 | | | $ | 0 | |
Tax Fees(2) | | $ | 13,230 | | | $ | 13,306 | |
All Other Fees(3) | | $ | 0 | | | $ | 0 | |
| | | | | | | | |
Total | | $ | 62,650 | | | $ | 65,556 | |
| | | | | | | | |
| (1) | Audit-related fees consist of the aggregate fees billed for assurance and related services that are reasonably related to the performance of the audit of the registrant’s financial statements and are not reported under the category of audit fees. |
| (2) | Tax fees consist of the aggregate fees billed for professional services rendered by the principal accountant relating to tax compliance, tax advice, and tax planning and specifically include fees for tax return preparation and other related tax compliance/planning matters. |
| (3) | All other fees consist of the aggregate fees billed for products and services provided by the principal accountant other than audit, audit-related, and tax services. |
(e)(1) The registrant’s audit committee has adopted policies and procedures relating to thepre-approval of services provided by the registrant’s principal accountant (the“Pre-Approval Policies”). ThePre-Approval Policies establish a framework intended to assist the audit committee in the proper discharge of itspre-approval responsibilities. As a general matter, thePre-Approval Policies (i) specify certain types of audit, audit-related, tax, and other services determined to bepre-approved by the audit committee; and (ii) delineate specific procedures governing the mechanics of thepre-approval process, including the approval and monitoring of audit andnon-audit service fees. Unless a service is specificallypre-approved under thePre-Approval Policies, it must be separatelypre-approved by the audit committee.
ThePre-Approval Policies and the types of audit andnon-audit servicespre-approved therein must be reviewed and ratified by the registrant’s audit committee at least annually. The registrant’s audit committee maintains full responsibility for the appointment, compensation, and oversight of the work of the registrant’s principal accountant.
(e)(2) No services described in paragraphs (b)-(d) above were approved by the registrant’s audit committee pursuant to the “de minimis exception” set forth in Rule2-01 (c)(7)(i)(C) of RegulationS-X.
(f) Not applicable.
(g) The following table presents (i) the aggregatenon-audit fees (i.e., fees for audit-related, tax, and other services) billed to the registrant by D&T for the registrant’s fiscal years ended October 31, 2018 and October 31, 2019; and (ii) the aggregatenon-audit fees (i.e., fees for audit-related, tax, and other services) billed to the Eaton Vance organization by D&T for the same time periods.
| | | | | | | | |
Fiscal Years Ended | | 10/31/18 | | | 10/31/19 | |
Registrant | | $ | 13,230 | | | $ | 13,306 | |
Eaton Vance(1) | | $ | 126,485 | | | $ | 59,903 | |
| (1) | The investment adviser to the registrant, as well as any of its affiliates that provide ongoing services to the registrant, are subsidiaries of Eaton Vance Corp. |
(h) The registrant’s audit committee has considered whether the provision by the registrant’s principal accountant ofnon-audit services to the registrant’s investment adviser and any entity controlling, controlled by, or under common control with the adviser that provides ongoing services to the registrant that were notpre-approved pursuant to Rule2-01(c)(7)(ii) of RegulationS-X is compatible with maintaining the principal accountant’s independence.
Item 5. Audit Committee of Listed Registrants
The registrant has a separately-designated standing audit committee established in accordance with Section 3(a)(58)(A) of the Securities and Exchange Act of 1934, as amended. George J. Gorman (Chair), William H. Park, Helen Frame Peters and Scott E. Wennerholm are the members of the registrant’s audit committee.
Item 6. Schedule of Investments
Please see schedule of investments contained in the Report to Stockholders included under Item 1 of this FormN-CSR.
Item 7. Disclosure of Proxy Voting Policies and Procedures forClosed-End Management Investment Companies
The Board of Trustees of the Trust has adopted a proxy voting policy and procedure (the “Fund Policy”), pursuant to which the Trustees have delegated proxy voting responsibility to the Fund’s investment adviser and adopted the investment adviser’s proxy voting policies and procedures (the “Policies”) which are described below. The Trustees will review the Fund’s proxy voting records from time to time and will annually consider approving the Policies for the upcoming year. In the event that a conflict of interest arises between the Fund’s shareholders and the investment adviser, the administrator, or any of their affiliates or any affiliate of the Fund, the investment adviser will generally refrain from voting the proxies related to the companies giving rise to such conflict until it consults with the Board’s Special Committee except as contemplated under the Fund Policy. The Board’s Special Committee will instruct the investment adviser on the appropriate course of action.
The Policies are designed to promote accountability of a company’s management to its shareholders and to align the interests of management with those shareholders. An independent proxy voting service (“Agent”), currently Institutional Shareholder Services, Inc., has been retained to assist in the voting of proxies through the provision of vote analysis, implementation and recordkeeping and disclosure services. The investment adviser will generally vote proxies through the Agent. The Agent is required to vote all proxies and/or refer them back to the investment adviser pursuant to the Policies. It is generally the policy of the investment adviser to vote in accordance with the recommendation of the Agent. The Agent shall refer to the investment adviser proxies relating to mergers and restructurings, and the disposition of assets, termination, liquidation and mergers contained in mutual fund proxies. The investment adviser will normally vote against anti-takeover measures and other proposals designed to limit the ability of shareholders to act on possible transactions, except in the case ofclosed-end management investment companies. The investment adviser generally supports management on social and environmental proposals. The investment adviser may abstain from voting from time to time where it determines that the costs associated with voting a proxy outweighs the benefits derived from exercising the right to vote or the economic effect on shareholders interests or the value of the portfolio holding is indeterminable or insignificant.
In addition, the investment adviser will monitor situations that may result in a conflict of interest between the Fund’s shareholders and the investment adviser, the administrator, or any of their affiliates or any affiliate of the Fund by maintaining a list of significant existing and prospective corporate clients. The investment adviser’s personnel responsible for reviewing and voting proxies on behalf of the Fund will report any proxy received or expected to be received from a company included on that list to the personnel of the investment adviser identified in the Policies. If such personnel expects to instruct the Agent to vote such proxies in a manner inconsistent with the guidelines of the Policies or the recommendation of the Agent, the personnel will consult with members of senior management of the investment adviser to determine if a material conflict of interests exists. If it is determined that a material conflict does exist, the investment adviser will seek instruction on how to vote from the Special Committee.
Information on how the Fund voted proxies relating to portfolio securities during the most recent 12 month period ended June 30 is available (1) without charge, upon request, by calling1-800-262-1122, and (2) on the Securities and Exchange Commission’s website athttp://www.sec.gov.
Item 8. Portfolio Managers ofClosed-End Management Investment Companies
Eaton Vance Management (“EVM” or “Eaton Vance”) is the investment adviser of the Fund. Michael A. Allison is responsible for the overall andday-to-day management of the Fund’s investments. Mr. Allison is a Vice President of EVM, is a member of EVM’s Equity Strategy Committee and has been a portfolio manager of the Fund since November 2006. He has managed other Eaton Vance portfolios for more than five years. This information is provided as of the date of filing this report.
The following table shows, as of the Fund’s most recent fiscal year end, the number of accounts the portfolio manager managed in each of the listed categories and the total assets (in millions of dollars) in the accounts managed within each category. The table also shows the number of accounts with respect to which the advisory fee is based on the performance of the account, if any, and the total assets (in millions of dollars) in those accounts.
| | | | | | | | | | | | | | | | |
| | | Number of All
Accounts | | | Total Assets of
All Accounts | | | Number of
Accounts
Paying a
Performance Fee | | | Total Assets of
Accounts
Paying a
Performance
Fee | |
Michael A. Allison | | | | | | | | | | | | | | | | |
Registered Investment Companies | | | 17 | | | $ | 35,073.3 | | | | 0 | | | $ | 0 | |
Other Pooled Investment Vehicles | | | 14 | | | $ | 24,416.1 | (1) | | | 0 | | | $ | 0 | |
Other Accounts | | | 1 | | | $ | 0.4 | | | | 0 | | | $ | 0 | |
| (1) | Certain of these “Other Pooled Investment Vehicles” invest a substantial portion of their assets in a registered investment company in the Eaton Vance family of funds and/or in a separate pooled investment vehicle sponsored by Eaton Vance which may be managed by this portfolio manager or another portfolio manager. |
The following table shows the dollar range of Fund shares beneficially owned by the portfolio manager as of the Fund’s most recent fiscal year end.
| | | | |
Portfolio Manager | | Dollar Range of Equity Securities
Beneficially Owned in the Fund | |
Michael A. Allison | | $ | 50,001 - $100,000 | |
Potential for Conflicts of Interest. It is possible that conflicts of interest may arise in connection with a portfolio manager’s management of the Fund’s investments on the one hand and the investments of other accounts for which a portfolio manager is responsible on the other. For example, a portfolio manager may have conflicts of interest in allocating management time, resources and investment opportunities among the Fund and other accounts he advises. In addition, due to differences in the investment strategies or restrictions between the Fund and the other accounts, the portfolio manager may take action with respect to another account that differs from the action taken with respect to the Fund. In some cases, another account managed by a portfolio manager may compensate the investment adviser based on the performance of the securities held by that account. The existence of such a performance based fee may create additional conflicts of interest for the portfolio manager in the allocation of management time, resources and investment opportunities. Whenever conflicts of interest arise, the portfolio manager will endeavor to exercise his or her discretion in a manner that he believes is equitable to all interested persons. EVM has adopted several policies and procedures designed to address these potential conflicts including a code of ethics and policies that govern the investment adviser’s trading practices, including among other things the aggregation and allocation of trades among clients, brokerage allocations, cross trades and best execution.
Compensation Structure for EVM
Compensation of EVM’s portfolio managers and other investment professionals has the following primary components: (1) a base salary, (2) an annual cash bonus, (3) annualnon-cash compensation consisting of options to purchase shares of EVC nonvoting common stock and/or restricted shares of EVC nonvoting common stock that generally are subject to a vesting schedule and (4) (for equity portfolio managers) a Deferred Alpha Incentive Plan, which pays a deferred cash award tied to future excess returns in certain equity
strategy portfolios. EVM’s investment professionals also receive certain retirement, insurance and other benefits that are broadly available to EVM’s employees. Compensation of EVM’s investment professionals is reviewed primarily on an annual basis. Cash bonuses, stock-based compensation awards, and adjustments in base salary are typically paid or put into effect at or shortly after the October 31st fiscal year end of EVC.
Method to Determine Compensation. EVM compensates its portfolio managers based primarily on the scale and complexity of their portfolio responsibilities and the total return performance of managed funds and accounts versus the benchmark(s) stated in the prospectus, as well as an appropriate peer group (as described below). In addition to rankings within peer groups of funds on the basis of absolute performance, consideration may also be given to relative risk-adjusted performance. Risk-adjusted performance measures include, but are not limited to, the Sharpe Ratio (Sharpe Ratio uses standard deviation and excess return to determine reward per unit of risk). Performance is normally based on periods ending on the September 30th preceding fiscal year end. Fund performance is normally evaluated primarily versus peer groups of funds as determined by Lipper Inc. and/or Morningstar, Inc. When a fund’s peer group as determined by Lipper or Morningstar is deemed by EVM’s management not to provide a fair comparison, performance may instead be evaluated primarily against a custom peer group or market index. In evaluating the performance of a fund and its manager, primary emphasis is normally placed on three-year performance, with secondary consideration of performance over longer and shorter periods. For funds that aretax-managed or otherwise have an objective ofafter-tax returns, performance is measured net of taxes. For other funds, performance is evaluated on apre-tax basis. For funds with an investment objective other than total return (such as current income), consideration will also be given to the fund’s success in achieving its objective. For managers responsible for multiple funds and accounts, investment performance is evaluated on an aggregate basis, based on averages or weighted averages among managed funds and accounts. Funds and accounts that have performance-based advisory fees are not accorded disproportionate weightings in measuring aggregate portfolio manager performance. A portion of the compensation payable to equity portfolio managers and investment professionals will be determined based on the ability of one or more accounts managed by such manager, that are not advised by Calvert Management and Research to achieve a specified target average annual gross return over a three year period in excess of the account benchmark. The cash award to be payable at the end of the three year term will be established at the inception of the term and will be adjusted positively or negatively to the extent that the average annual gross return varies from the specified target return.
The compensation of portfolio managers with other job responsibilities (such as heading an investment group or providing analytical support to other portfolios) will include consideration of the scope of such responsibilities and the managers’ performance in meeting them.
EVM seeks to compensate portfolio managers commensurate with their responsibilities and performance, and competitive with other firms within the investment management industry. EVM participates in investment-industry compensation surveys and utilizes survey data as a factor in determining salary, bonus and stock-based compensation levels for portfolio managers and other investment professionals. Salaries, bonuses and stock-based compensation are also influenced by the operating performance of EVM and its parent company. The overall annual cash bonus pool is generally based on a substantially fixed percentage ofpre-bonus adjusted operating income. While the salaries of EVM’s portfolio managers are comparatively fixed, cash bonuses and stock-based compensation may fluctuate significantly from year to year, based on changes in manager performance and other factors as described herein. For a high performing portfolio manager, cash bonuses and stock-based compensation may represent a substantial portion of total compensation.
Item 9. Purchases of Equity Securities byClosed-End Management Investment Company and Affiliated Purchasers
No such purchases this period.
Item 10. Submission of Matters to a Vote of Security Holders
No material changes.
Item 11. Controls and Procedures
(a) It is the conclusion of the registrant’s principal executive officer and principal financial officer that the effectiveness of the registrant’s current disclosure controls and procedures (such disclosure controls and procedures having been evaluated within 90 days of the date of this filing) provide reasonable assurance that the information required to be disclosed by the registrant has been recorded, processed, summarized and reported within the time period specified in the Commission’s rules and forms and that the information required to be disclosed by the registrant has been accumulated and communicated to the registrant’s principal executive officer and principal financial officer in order to allow timely decisions regarding required disclosure.
(b) There have been no changes in the registrant’s internal controls over financial reporting during the period covered by this report that has materially affected, or is reasonably likely to materially affect, the registrant’s internal control over financial reporting.
Item 12. Disclosure of Securities Lending Activities forClosed-End Management Investment Companies
No activity to report for the registrant’s most recent fiscal year end.
Item 13. Exhibits
| | |
| (a)(1) | | Registrant’s Code of Ethics – Not applicable (please see Item 2). |
| |
| (a)(2)(i) | | Treasurer’s Section 302 certification. |
| |
| (a)(2)(ii) | | President’s Section 302 certification. |
| |
| (b) | | Combined Section 906 certification. |
| |
| (c) | | Registrant’s notices to shareholders pursuant to Registrant’s exemptive order granting an exemption from Section 19(b) of the 1940 Act and Rule19b-1 thereunder regarding distributions paid pursuant to the Registrant’s Managed Distribution Plan. |
Signatures
Pursuant to the requirements of the Securities Exchange Act of 1934 and the Investment Company Act of 1940, the registrant has duly caused this report to be signed on its behalf by the undersigned, thereunto duly authorized.
Eaton VanceTax-Managed Diversified Equity Income Fund
| | |
| By: | | /s/ Edward J. Perkin |
| | Edward J. Perkin |
| | President |
| Date: | | December 23, 2019 |
Pursuant to the requirements of the Securities Exchange Act of 1934 and the Investment Company Act of 1940, this report has been signed below by the following persons on behalf of the registrant and in the capacities and on the dates indicated.
| | |
| By: | | /s/ James F. Kirchner |
| | James F. Kirchner |
| | Treasurer |
| Date: | | December 23, 2019 |
By: | | /s/ Edward J. Perkin |
| | Edward J. Perkin |
| | President |
| Date: | | December 23, 2019 |