Exhibit (c)-(2)
Vimicro International Corporation Fairness Analysis Presented to the Special Committee of Independent Directors September 15, 2015 The information contained herein is of a confidential nature and is intended for the use of the persons or firm to whom it is furnished by us. Reproduction, publication, or dissemination of portions hereof may not be made without prior approval of Duff & Phelps, LLC and its affiliates.
2 CONFIDENTIAL Duff & Phelps Disclaimer • The following pages contain materials that are being provided by Duff & Phelps, LLC (“ Duff & Phelps ”) to the special committee of independent directors (the “ Special Committee ”) of the board of directors (the “ Board of Directors ”) of Vimicro International Corporation (the “ Company ”) in the context of a meeting of the Special Committee held to consider the Proposed Transaction (as defined herein) . • The accompanying materials are, and any Opinion (as defined herein) will be, compiled and presented on a confidential basis, solely for the use and benefit of the Special Committee in connection with their evaluation of the Proposed Transaction and may not be distributed to any other party, publicly disclosed, or relied upon for any other purpose without the prior written consent of Duff & Phelps . • Because these materials were prepared for use in the context of an oral presentation to the Special Committee, whose members are familiar with the business and affairs of the Company, neither the Company nor Duff & Phelps, nor any of their respective legal or financial advisors or accountants, take any responsibility for the accuracy or completeness of any of the materials if used by persons other than the Special Committee . • These materials are not intended to represent an Opinion but rather to serve as discussion materials for the Special Committee and as a summary of the basis upon which Duff & Phelps may render an Opinion . • The accompanying material does not, and any Opinion provided by Duff & Phelps would not : (i) address the merits of the underlying business decision of the Special Committee, the Board of Directors or the Company or any other party to the Proposed Transaction to enter into the Proposed Transaction versus any alternative strategy or transaction ; (ii) constitute a recommendation to the Special Committee, the Board of Directors, the Company or any other person including security holders of the Company as to how such person should vote or as to any other specific action that should be taken in connection with the Proposed Transaction ; or (iii) create any fiduciary duty on Duff & Phelps’ part to any party . • The information utilized in preparing this presentation was obtained from the Company and from public sources . Any estimates and forecasts contained herein have been prepared by or are based on discussions with the senior management of the Company and involve numerous and significant subjective determinations, which may or may not prove to be correct . No representation or warranty, expressed or implied, is made as to the accuracy or completeness of such information and nothing contained herein is, or shall be relied upon as, a representation, whether as to the past or the future . Duff & Phelps did not independently verify such information . • No selected company or selected transaction used in our analysis is directly comparable to the Company or the Proposed Transaction . • Duff & Phelps’ affiliate, Duff & Phelps Securities, LLC (“ DPS ”), has acted as financial advisor to the Special Committee providing such financial and market related advice and assistance as requested by the Special Committee in connection with the Proposed Transaction, and will receive a fee for certain investment banking services if requested by the Special Committee .

3 CONFIDENTIAL Table of Contents 1. Introduction and Transaction Overview 2. Valuation Analysis – Discounted Cash Flow Analysis – Selected Public Companies / M&A Transactions Analysis Appendix 1. Assumptions, Qualifications, and Limiting Conditions 2. Summary of Premiums Paid – Supplemental

Introduction and Transaction Overview Section 01

5 CONFIDENTIAL Introduction and Transaction Overview The Engagement • Duff & Phelps was retained by the Special Committee and the Company to serve as independent financial advisor to the Special Committee (solely in its capacity as such) . • Specifically , Duff & Phelps has been asked to provide an opinion (the “ Opinion ”) to the Special Committee as to the fairness, from a financial point of view, to (i) the holders of ordinary shares, par value US $ 0 . 0001 per share, of the Company (each, a “ Share ” and collectively, the “ Shares ” ), other than the Excluded Shares (as defined below), and (ii) the holders of American Depositary Shares of the Company, each representing four Shares (each, an “ ADS ” and collectively, “ ADSs ”), other than the ADSs representing the Excluded Shares, of the Merger Consideration (as defined below) to be received by such holders in the Proposed Transaction (as defined below) (without giving effect to any impact of the Proposed Transaction on any particular holder of the Shares or ADSs other than in their capacity as holders of Shares or ADSs ) . The Proposed Transaction • It is Duff & Phelps’ understanding that the Company, Vimicro China (Parent) Limited, an exempted company with limited liability incorporated under the laws of the Cayman Islands (“ Parent ”), and Vimicro China Acquisition Limited, an exempted company with limited liability incorporated under the laws of the Cayman Islands and a wholly owned subsidiary of Parent (“ Merger Sub ”), propose to enter into an Agreement and Plan of Merger (the “ Merger Agreement ”), dated as of the date hereof, the latest draft of which Duff & Phelps has reviewed is dated September 14 , 2015 . Pursuant to the Merger Agreement, among other things, Merger Sub will merge with and into the Company, whereupon the separate existence of Merger Sub will cease and the Company will be the surviving company, and in connection with such merger each issued and outstanding Share (other than the Excluded Shares) will be cancelled in exchange for the right to receive US $ 3 . 375 in cash per Share without interest (the “ Per Share Merger Consideration ”) and each issued and outstanding ADS (other than ADSs representing the Excluded Shares) will be cancelled in exchange for the right to receive US $ 13 . 50 in cash per ADS without interest (the “ Per ADS Merger Consideration ”, and together with the Per Share Merger Consideration, the “ Merger Consideration ”) (collectively, the “ Proposed Transaction ”) . The terms and conditions of the Proposed Transaction are more fully set forth in the Merger Agreement . • For the purposes of the Opinion, (i) “ Excluded Shares ” shall mean (i) Shares (including Shares represented by ADSs) owned by Parent, Merger Sub or the Company (as treasury shares, if any), or by any direct or indirect wholly owned subsidiary of Parent, Merger Sub or the Company, in each case immediately prior to the Effective Time (as defined in the Merger Agreement ) ( ii) Shares (including Shares represented by ADSs) reserved (but not yet allocated) by the Company for settlement upon exercise of any Company options, (iii) Rollover Shares (as defined in the Merger Agreement) and/or (iv) Dissenting Shares (as defined in the Merger Agreement) .
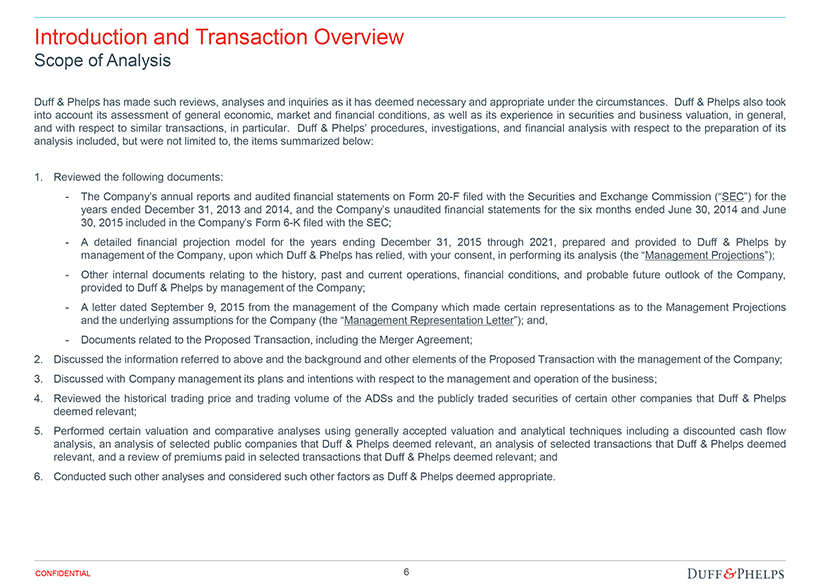
6 CONFIDENTIAL Introduction and Transaction Overview Scope of Analysis Duff & Phelps has made such reviews, analyses and inquiries as it has deemed necessary and appropriate under the circumstances . Duff & Phelps also took into account its assessment of general economic, market and financial conditions, as well as its experience in securities and business valuation, in general, and with respect to similar transactions, in particular . Duff & Phelps’ procedures, investigations, and financial analysis with respect to the preparation of its analysis included , but were not limited to, the items summarized below : 1. Reviewed the following documents : - The Company’s annual reports and audited financial statements on Form 20 - F filed with the Securities and Exchange Commission (“ SEC ”) for the years ended December 31 , 2013 and 2014 , and the Company’s unaudited financial statements for the six months ended June 30 , 2014 and June 30 , 2015 included in the Company’s Form 6 - K filed with the SEC ; - A detailed financial projection model for the years ending December 31 , 2015 through 2021 , prepared and provided to Duff & Phelps by management of the Company, upon which Duff & Phelps has relied, with your consent, in performing its analysis (the “ Management Projections ”) ; - Other internal documents relating to the history, past and current operations, financial conditions, and probable future outlook of the Company, provided to Duff & Phelps by management of the Company ; - A letter dated September 9 , 2015 from the management of the Company which made certain representations as to the Management Projections and the underlying assumptions for the Company (the “ Management Representation Letter ”) ; and, - Documents related to the Proposed Transaction, including the Merger Agreement ; 2. Discussed the information referred to above and the background and other elements of the Proposed Transaction with the management of the Company ; 3. Discussed with Company management its plans and intentions with respect to the management and operation of the business ; 4. Reviewed the historical trading price and trading volume of the ADSs and the publicly traded securities of certain other companies that Duff & Phelps deemed relevant ; 5. Performed certain valuation and comparative analyses using generally accepted valuation and analytical techniques including a discounted cash flow analysis, an analysis of selected public companies that Duff & Phelps deemed relevant, an analysis of selected transactions that Duff & Phelps deemed relevant, and a review of premiums paid in selected transactions that Duff & Phelps deemed relevant ; and 6. Conducted such other analyses and considered such other factors as Duff & Phelps deemed appropriate .

7 CONFIDENTIAL Introduction and Transaction Overview Ownership Summary Source : Company filings, Capital IQ, Company provided . (1) Includes 31,250,000 Ordinary Shares held by Alpha Spring Limited (“Alpha Spring”); and 4,280,000 Ordinary Shares in form of 1,070,000 ADSs directly held by Alpha Spring. Alpha Spring is wholly - owned by Nantong Zongyi Investment Co., Ltd ., per 13 - D dated August 5, 2015. (2) Includes 10,253,961 ordinary shares, per 20 - F dated April 30, 2015. (3) I ncludes 4,453,192 ordinary shares and 15,000 ADSs, representing 60,000 ordinary shares, per 13 - D dated August 5, 2015. (4) Includes 1,391,851 ordinary shares and 100,000 ADSs, representing 400,000 ordinary shares, per 13 - D dated August 5, 2015. (5) 123,679,294 Ordinary Shares outstanding as of June 30, 2015, per 13 - D dated August 5, 2015. Options 16.8% Public & Other Shareholders 41.5% Institutional Investors 5.5% Other Management / Director 1.2% Buyer Consortium 35.0% Vimicro International Corp. - Ownership % of Fully Diluted Current Shareholders ADSs Ownership Buyer Consortium Nantong Zongyi Investment Co., Ltd. (1) 8,882,500 23.9% Xiaodong Yang (Co-Founder) (2) 2,563,490 6.9% Zhonghan Deng (Founder, Chairman and CEO) (3) 1,128,298 3.0% Zhaowei Jin (Co-Founder, Co-CEO) (4) 447,963 1.2% Buyer Consortium 13,022,251 35.0% Other Management / Director Yundong Zhang (CTO) 328,868 0.9% Robert Chen (Independent Director) 117,500 0.3% Other Management / Director 446,368 1.2% Institutional Investors Nomura Holdings Inc, Securities & Investment Arm 1,160,440 3.1% UBS Global Asset Management 262,741 0.7% Group One Trading LP, Asset Management Arm 193,896 0.5% Societe Generale, Securities Investments 140,000 0.4% Susquehanna International Group, LLP, Asset Management Arm 60,656 0.2% Stuyvesant Capital Management Corporation 55,300 0.1% Spot Trading L.L.C., Asset Management Arm 38,238 0.1% Dorsey Wright & Associates, Inc. 27,035 0.1% California Public Employees' Retirement System 25,070 0.1% Citadel LLC 19,174 0.1% Parametric Portfolio Associates LLC 16,767 0.0% George Weiss Associates Inc. 11,900 0.0% Global X Management Company LLC 7,616 0.0% Simplex Trading, LLC, Asset Management Arm 7,140 0.0% Meyers Capital Management LLC 6,000 0.0% Other Institutional Investors 8,388 0.0% Institutional Investors 2,040,361 5.5% Public & Other Shareholders 15,410,844 41.5% Total ADSs Outstanding (5) 30,919,824 83.2% Options In-the-Money at Offer Price 6,240,836 16.8% Fully Diluted ADSs Outstanding at Offer Price 37,160,660 100.0%
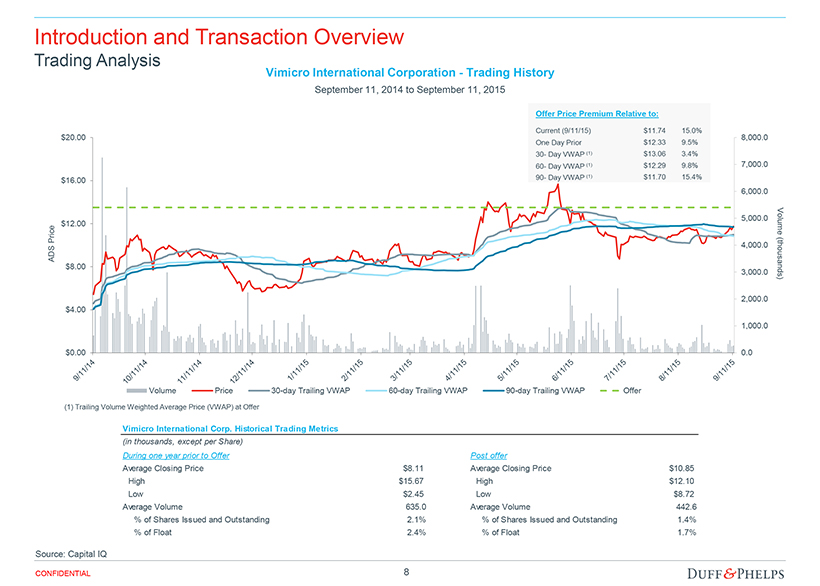
8 CONFIDENTIAL Introduction and Transaction Overview Trading Analysis Source: Capital IQ Vimicro International Corporation - Trading History September 11 , 2014 to September 11 , 2015 Vimicro International Corp. Historical Trading Metrics (in thousands, except per Share) During one year prior to Offer Post offer Average Closing Price $8.11 Average Closing Price $10.85 High $15.67 High $12.10 Low $2.45 Low $8.72 Average Volume 635.0 Average Volume 442.6 % of Shares Issued and Outstanding 2.1% % of Shares Issued and Outstanding 1.4% % of Float 2.4% % of Float 1.7% 0.0 1,000.0 2,000.0 3,000.0 4,000.0 5,000.0 6,000.0 7,000.0 8,000.0 $0.00 $4.00 $8.00 $12.00 $16.00 $20.00 Volume (thousands) ADS Price Volume Price 30-day Trailing VWAP 60-day Trailing VWAP 90-day Trailing VWAP Offer (1) Trailing Volume Weighted Average Price (VWAP) at Offer Current (9/11/15) Offer Price Premium Relative to: 15.0% 30 - Day VWAP (1) 3.4% 9.8% 15.4% 60 - Day VWAP (1) 90 - Day VWAP (1) One Day Prior 9.5% $11.74 $13.06 $12.29 $11.70 $12.33
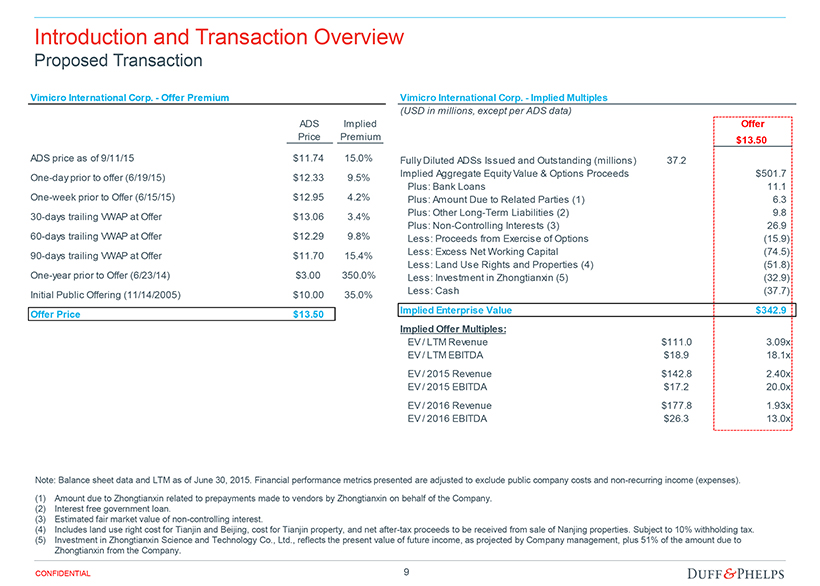
9 CONFIDENTIAL Introduction and Transaction Overview Proposed Transaction Note: Balance sheet data and LTM as of June 30, 2015. Financial p erformance metrics presented are adjusted to exclude public company costs and non - recurring income (expenses). (1) Amount due to Zhongtianxin related to prepayments made to vendors by Zhongtianxin on behalf of the Company. (2) Interest free government loan. (3) Estimated fair market value of non - controlling interest. (4) Includes land use right cost for Tianjin and Beijing, cost for Tianjin property, and net after - tax proceeds to be received from sale of Nanjing properties. Subject to 10% withholding tax. (5) Investment in Zhongtianxin Science and Technology Co., Ltd., reflects the present value of future income, as projected by Com pan y management, plus 51% of the amount due to Zhongtianxin from the Company. Vimicro International Corp. - Offer Premium ADS Implied Price Premium ADS price as of 9/11/15 $11.74 15.0% One-day prior to offer (6/19/15) $12.33 9.5% One-week prior to Offer (6/15/15) $12.95 4.2% 30-days trailing VWAP at Offer $13.06 3.4% 60-days trailing VWAP at Offer $12.29 9.8% 90-days trailing VWAP at Offer $11.70 15.4% One-year prior to Offer (6/23/14) $3.00 350.0% Initial Public Offering (11/14/2005) $10.00 35.0% Offer Price $13.50 Vimicro International Corp. - Implied Multiples (USD in millions, except per ADS data) Offer $13.50 Fully Diluted ADSs Issued and Outstanding (millions) 37.2 37.16 Implied Aggregate Equity Value & Options Proceeds $501.7 Plus: Bank Loans $11.1 11.1 Plus: Amount Due to Related Parties (1) $6.3 6.3 Plus: Other Long-Term Liabilities (2) $9.8 9.8 Plus: Non-Controlling Interests (3) $26.9 26.9 Less: Proceeds from Exercise of Options ($15.9) (15.9) Less: Excess Net Working Capital ($74.5) (74.5) Less: Land Use Rights and Properties (4) ($51.8) (51.8) Less: Investment in Zhongtianxin (5) ($32.9) (32.9) Less: Cash ($37.7) (37.7) Implied Enterprise Value $342.9 Implied Offer Multiples: EV / LTM Revenue $111.0 3.09x EV / LTM EBITDA $18.9 18.1x EV / 2015 Revenue $142.8 2.40x EV / 2015 EBITDA $17.2 20.0x EV / 2016 Revenue $177.8 1.93x EV / 2016 EBITDA $26.3 13.0x
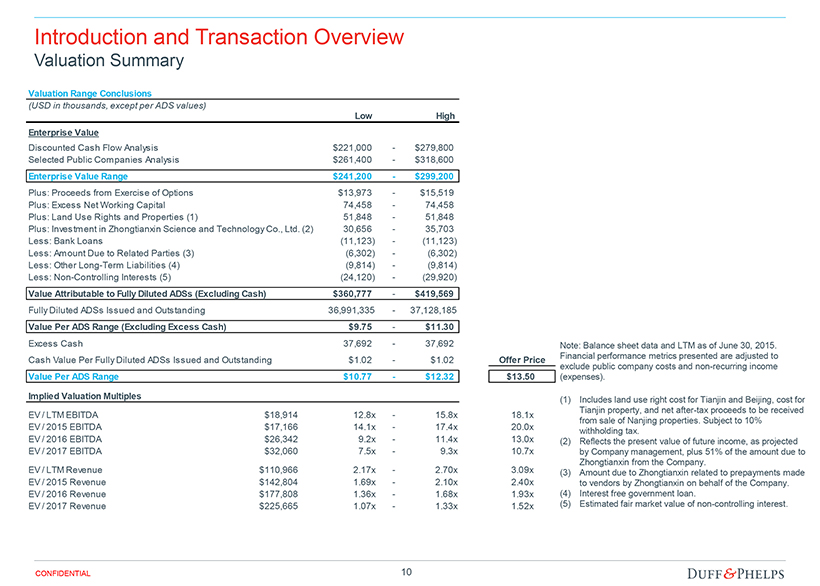
10 CONFIDENTIAL Introduction and Transaction Overview Valuation Summary Note: Balance sheet data and LTM as of June 30 , 2015 . Financial p erformance metrics presented are adjusted to exclude public company costs and non - recurring income (expenses). (1) Includes land use right cost for Tianjin and Beijing, cost for Tianjin property, and net after - tax proceeds to be received from sale of Nanjing properties. Subject to 10% withholding tax. (2) Reflects the present value of future income, as projected by Company management, plus 51% of the amount due to Zhongtianxin from the Company. (3) Amount due to Zhongtianxin related to prepayments made to vendors by Zhongtianxin on behalf of the Company. (4) Interest free government loan. (5) Estimated fair market value of non - controlling interest. Valuation Range Conclusions (USD in thousands, except per ADS values) Low High Enterprise Value Discounted Cash Flow Analysis $221,000 - $279,800 Selected Public Companies Analysis $261,400 - $318,600 Enterprise Value Range $241,200 - $299,200 Plus: Proceeds from Exercise of Options $13,973 - $15,519 Plus: Excess Net Working Capital 74,458 - 74,458 Plus: Land Use Rights and Properties (1) 51,848 - 51,848 Plus: Investment in Zhongtianxin Science and Technology Co., Ltd. (2) 30,656 - 35,703 Less: Bank Loans (11,123) - (11,123) Less: Amount Due to Related Parties (3) (6,302) - (6,302) Less: Other Long-Term Liabilities (4) (9,814) - (9,814) Less: Non-Controlling Interests (5) (24,120) - (29,920) Value Attributable to Fully Diluted ADSs (Excluding Cash) $360,777 - $419,569 Fully Diluted ADSs Issued and Outstanding 36,991,335 - 37,128,185 - Value Per ADS Range (Excluding Excess Cash) $9.75 - $11.30 Excess Cash 37,692 - 37,692 - Cash Value Per Fully Diluted ADSs Issued and Outstanding $1.02 - $1.02 Offer Price Value Per ADS Range $10.77 - $12.32 $13.50 Implied Valuation Multiples EV / LTM EBITDA $18,914 12.8x - 15.8x 18.1x EV / 2015 EBITDA $17,166 14.1x - 17.4x 20.0x EV / 2016 EBITDA $26,342 9.2x - 11.4x 13.0x EV / 2017 EBITDA $32,060 7.5x - 9.3x 10.7x EV / LTM Revenue $110,966 2.17x - 2.70x 3.09x EV / 2015 Revenue $142,804 1.69x - 2.10x 2.40x EV / 2016 Revenue $177,808 1.36x - 1.68x 1.93x EV / 2017 Revenue $225,665 1.07x - 1.33x 1.52x

11 CONFIDENTIAL Introduction and Transaction Overview ADS Valuation Range $10.77 $11.32 $10.23 $12.32 $12.84 $11.79 $8.50 $9.50 $10.50 $11.50 $12.50 $13.50 $14.50 Concluded Range Selected Public Companies / M&A Transactions Analysis Discounted Cash Flow Analysis Value Per ADS (USD) $13.50 Offer Price
Valuation Analysis Section 02

13 CONFIDENTIAL Valuation Analysis Financial Performance Historical and Projected Financial Performance (USD in thousands) YTD YTD LTM Management Projections '11-'14 '14-'21 2011A 2012A 2013A 2014A 6/30/14 6/30/15 6/30/15 2015P 2016P 2017P 2018P 2019P 2020P 2021P CAGR CAGR Video Surveillance Solutions $12,083 $17,760 $43,791 $85,084 $31,939 $47,052 $100,197 $129,742 $168,665 $219,265 $285,044 $342,053 $376,258 $395,071 91.7% 24.5% Growth 47.0% 146.6% 94.3% 194.2% 47.3% 54.4% 52.5% 30.0% 30.0% 30.0% 20.0% 10.0% 5.0% Video Processors $47,857 $53,435 $22,078 $16,905 $9,235 $4,301 $11,971 $13,062 $9,143 $6,400 $5,120 $4,608 $4,608 $4,608 (29.3%)(16.9%) Growth 11.7% (58.7%) (23.4%) 11.9% (53.4%) (48.1%) (22.7%) (30.0%) (30.0%) (20.0%) (10.0%) 0.0% 0.0% Net Revenue $58,972 $71,187 $64,525 $100,443 $40,441 $50,964 $110,966 $142,804 $177,808 $225,665 $290,164 $346,661 $380,866 $399,679 19.4% 21.8% Growth 20.7% (9.4%) 55.7% 113.5% 26.0% 29.0% 42.2% 24.5% 26.9% 28.6% 19.5% 9.9% 4.9% Gross Profit $20,513 $26,468 $22,529 $39,093 $14,615 $22,988 $47,467 $49,719 $61,876 $78,763 $101,401 $121,201 $133,173 $139,757 24.0% 20.0% Margin % 34.8% 37.2% 34.9% 38.9% 36.1% 45.1% 42.8% 34.8% 34.8% 34.9% 34.9% 35.0% 35.0% 35.0% EBITDA $3,116 ($11) ($7,218) $7,899 ($2,964) $8,050 $18,914 $17,166 $26,342 $32,060 $41,299 $52,144 $57,961 $61,028 36.4% 33.9% Margin % 5.3% (0.0%) (11.2%) 7.9% (7.3%) 15.8% 17.0% 12.0% 14.8% 14.2% 14.2% 15.0% 15.2% 15.3% Growth NM NM NM NM NM NM 117.3% 53.5% 21.7% 28.8% 26.3% 11.2% 5.3% Capital Expenditures $4,880 $6,989 $5,352 $1,366 $342 $128 $1,152 $1,000 $1,000 $1,000 $1,000 $1,000 $1,000 $1,000 % of Net Revenue 8.3% 9.8% 8.3% 1.4% 0.8% 0.3% 1.0% 0.7% 0.6% 0.4% 0.3% 0.3% 0.3% 0.3% % of EBITDA NM NM NM 17.3% NM 1.6% 6.1% 5.8% 3.8% 3.1% 2.4% 1.9% 1.7% 1.6% Note: Financial performance metrics presented are adjusted to exclude public company costs and non-recurring income (expenses). Source: Company filings, Company management

14 CONFIDENTIAL Valuation Analysis Discounted Cash Flow Analysis – Methodology and Key Assumptions Discounted Cash Flow Methodology • Duff & Phelps performed a discounted cash flow analysis of the projected unlevered free cash flows . • Unlevered free cash flow is defined as cash generated by the business that is available to either reinvest or to distribute to security holders . • Projected free cash flows are discounted to the present using a discount rate which reflects their relative risk . • The discount rate is equivalent to the rate of return that security holders could expect to realize on alternative investment opportunities with similar risk profiles . Discounted Cash Flow Key Assumptions • Duff & Phelps utilized and relied upon the Management Projections for the fiscal years ending December 31 , 2015 - 2021 (excluding public company expenses, as provided by Company management) as well as discussions with Company management, a review of the Company’s historical performance and other factors to develop the DCF analysis . • Beyond the projection period, Duff & Phelps estimated the “terminal value” using a perpetuity formula . • Duff & Phelps discounted the resulting free cash flows and terminal value using a weighted average cost of capital range of 13 . 00 % to 15 . 00 % , derived from the Capital Asset Pricing Model . • The following is a summary of the Management Projections utilized in the discounted cash flow analysis : - The Company’s net revenue increases at a compound annual growth rate (“ CAGR ”) of 21 . 8 % over the seven - year period ending 2021 . - EBITDA increases at a CAGR of 33 . 9 % over the seven - year period ending 2021 . - The Company’s EBITDA margin averages 14 . 4 % over the seven - year period ending 2021 . - Capital expenditures average 0 . 4 % of revenue over the seven - year period ending 2021 .

15 CONFIDENTIAL Valuation Analysis DCF Analysis Summary Discounted Cash Flow Analysis (USD in thousands) LTM 2015P 2016P 2017P 2018P 2019P 2020P 2021P Net Revenue $110,966 $142,804 $177,808 $225,665 $290,164 $346,661 $380,866 $399,679 Growth 29.0% 42.2% 24.5% 26.9% 28.6% 19.5% 9.9% 4.9% EBITDA $18,914 $17,166 $26,342 $32,060 $41,299 $52,144 $57,961 $61,028 Margin 17.0% 12.0% 14.8% 14.2% 14.2% 15.0% 15.2% 15.3% Growth NM 117.3% 53.5% 21.7% 28.8% 26.3% 11.2% 5.3% Q3-Q4 2015 Earnings Before Interest and Taxes $8,405 $25,007 $30,970 $40,208 $51,053 $56,871 $59,937 Pro Forma Taxes @ 8.0% (81) (2,001) (2,478) (3,217) (4,084) (4,550) (4,795) Net Operating Profit After Tax 8,323 23,007 28,492 36,992 46,969 52,321 55,142 Depreciation 711 1,335 1,090 1,090 1,090 1,090 1,090 Capital Expenditures (1,000) (1,000) (1,000) (1,000) (1,000) (1,000) (1,000) Increase / (Decrease) in Deferred Government Grant 1,504 (8,213) (4,945) 0 0 0 0 (Increase) / Decrease in Working Capital (1) (13,506) (12,233) (16,454) (18,812) (14,815) (7,332) (5,738) Free Cash Flow (2) ($3,967) $2,896 $7,183 $18,270 $32,244 $45,080 $49,495 Exchange Rate Used in Management Projections (3) 6.179 6.179 6.179 6.179 6.179 6.179 6.179 Forward Exchange Rate (4) 6.417 6.570 6.714 6.867 6.978 7.081 7.118 Forward Exchange Rate Effect (5) 1.039 1.063 1.087 1.111 1.129 1.146 1.152 Adjusted Free Cash Flow (2) ($3,820) $2,723 $6,610 $16,440 $28,551 $39,338 $42,967 Enterprise Value Range Low High Terminal Growth Rate 3.50% 3.50% Weighted Average Cost of Capital 15.00% 13.00% Concluded Enterprise Value $221,000 $279,800 Implied Per ADS Range $10.23 $11.79 Implied Valuation Multiples EV / LTM EBITDA $18,914 11.7x 14.8x EV / 2015 EBITDA $17,166 12.9x 16.3x EV / 2016 EBITDA $26,342 8.4x 10.6x EV / 2017 EBITDA $32,060 6.9x 8.7x EV / LTM Revenue $110,966 1.99x 2.52x EV / 2015 Revenue $142,804 1.55x 1.96x EV / 2016 Revenue $177,808 1.24x 1.57x EV / 2017 Revenue $225,665 0.98x 1.24x (1) Working capital change in 2015 reflects normalized level. (2) Prior to application of a 10% dividend withholding tax, which is calculated based on levered cash flows and discounted separately at the cost of equity derived in the WACC calculation and included in the concluded enterprise value range . (3) RMB/USD exchange rate used in the Management Projections, per Company management. (4) Forward RMB/USD exchange rate, per Bloomberg. (5) Reflects the effect of the forward RMB/USD exchange rate on projected free cash flows in USD. Note: Balance sheet data and LTM as of June 30, 2015. Financial performance metrics presented are adjusted to exclude public company costs and non - recurring income (expenses).

16 CONFIDENTIAL Valuation Analysis Selected Public Companies / M&A Transactions Analysis Methodology Selected Public Companies Analysis • Duff & Phelps selected seven publicly traded companies in the video surveillance industry that were deemed relevant to its analysis . • Duff & Phelps analyzed the financial performance of each of the publicly traded companies . Duff & Phelps then analyzed the selected public companies’ trading multiples of enterprise value to revenue, enterprise value to EBITDA, enterprise value to EBIT, and price to earnings per share . Selected M&A Transactions Analysis • Duff & Phelps selected precedent transactions within the video surveillance and security industry that it determined to be relevant to its analysis . Duff & Phelps computed the LTM revenue and EBITDA for each of the target companies (where publicly disclosed) . Duff & Phelps then calculated the implied enterprise value to revenue and enterprise value to EBITDA multiples for each transaction . Duff & Phelps analyzed a number of factors in comparing the Company to the selected public companies and the targets in the selected M&A transactions, including historical and forecasted growth in revenue and profits, profit margins and other characteristics that we deemed relevant . Rather than applying the average or median multiple from the public company set, Duff & Phelps selected multiples that reflect the Company’s size, growth outlook, capital requirements, profit margins, revenue mix, and other characteristics relative to the group . None of the companies utilized for comparative purposes in the following analysis are directly comparable to the Company, and none of the transactions utilized for comparative purposes in the following analysis are directly comparable to the Proposed Transaction . Duff & Phelps does not have access to non - public information of any of the companies used for comparative purposes . Accordingly, a complete valuation analysis of the Company and the Proposed Transaction cannot rely solely upon a quantitative review of the selected companies and selected transactions, and involves complex considerations and judgments concerning differences in financial and operating characteristics of such companies and targets, as well as other factors that could affect their value relative to that of the Company . Therefore, the Selected Public Companies / Selected M&A Transactions Analysis is subject to certain limitations .
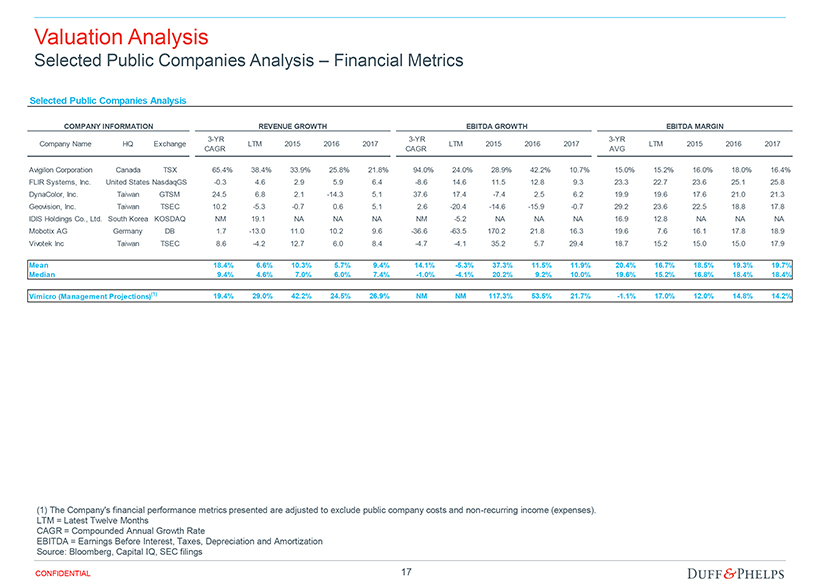
17 CONFIDENTIAL Valuation Analysis Selected Public Companies Analysis – Financial Metrics (1) The Company's financial performance metrics presented are adjusted to exclude public company costs and non - recurring income (expense s ). LTM = Latest Twelve Months CAGR = Compounded Annual Growth Rate EBITDA = Earnings Before Interest, Taxes, Depreciation and Amortization Source: Bloomberg, Capital IQ, SEC filings Selected Public Companies Analysis ($ in millions, except per share data) COMPANY INFORMATION REVENUE GROWTH EBITDA GROWTH EBITDA MARGIN Company Name HQ Exchange 3-YR CAGR LTM 2015 2016 2017 3-YR CAGR LTM 2015 2016 2017 3-YR AVG LTM 2015 2016 2017 Avigilon Corporation Canada TSX 65.4% 38.4% 33.9% 25.8% 21.8% 94.0% 24.0% 28.9% 42.2% 10.7% 15.0% 15.2% 16.0% 18.0% 16.4% FLIR Systems, Inc. United StatesNasdaqGS -0.3 4.6 2.9 5.9 6.4 -8.6 14.6 11.5 12.8 9.3 23.3 22.7 23.6 25.1 25.8 DynaColor, Inc. Taiwan GTSM 24.5 6.8 2.1 -14.3 5.1 37.6 17.4 -7.4 2.5 6.2 19.9 19.6 17.6 21.0 21.3 Geovision, Inc. Taiwan TSEC 10.2 -5.3 -0.7 0.6 5.1 2.6 -20.4 -14.6 -15.9 -0.7 29.2 23.6 22.5 18.8 17.8 IDIS Holdings Co., Ltd. South Korea KOSDAQ NM 19.1 NA NA NA NM -5.2 NA NA NA 16.9 12.8 NA NA NA Mobotix AG Germany DB 1.7 -13.0 11.0 10.2 9.6 -36.6 -63.5 170.2 21.8 16.3 19.6 7.6 16.1 17.8 18.9 Vivotek Inc Taiwan TSEC 8.6 -4.2 12.7 6.0 8.4 -4.7 -4.1 35.2 5.7 29.4 18.7 15.2 15.0 15.0 17.9 Mean 18.4% 6.6% 10.3% 5.7% 9.4% 14.1% -5.3% 37.3% 11.5% 11.9% 20.4% 16.7% 18.5% 19.3% 19.7% Median 9.4% 4.6% 7.0% 6.0% 7.4% -1.0% -4.1% 20.2% 9.2% 10.0% 19.6% 15.2% 16.8% 18.4% 18.4% Vimicro (Management Projections) (1) 19.4% 29.0% 42.2% 24.5% 26.9% NM NM 117.3% 53.5% 21.7% -1.1% 17.0% 12.0% 14.8% 14.2%
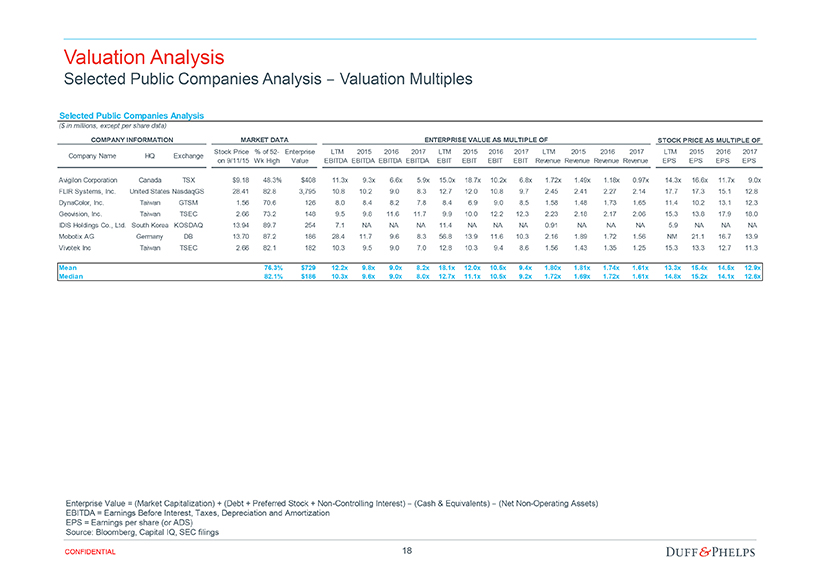
18 CONFIDENTIAL Valuation Analysis Selected Public Companies Analysis – Valuation Multiples Enterprise Value = (Market Capitalization) + (Debt + Preferred Stock + Non - Controlling Interest) – (Cash & Equivalents) – (Net Non - Operatin g Assets) EBITDA = Earnings Before Interest, Taxes, Depreciation and Amortization EPS = Earnings per share (or ADS) Source: Bloomberg, Capital IQ, SEC filings Selected Public Companies Analysis ($ in millions, except per share data) COMPANY INFORMATION MARKET DATA ENTERPRISE VALUE AS MULTIPLE OF STOCK PRICE AS MULTIPLE OF Company Name HQ Exchange Stock Price on 9/11/15 % of 52- Wk High Enterprise Value LTM EBITDA 2015 EBITDA 2016 EBITDA 2017 EBITDA LTM EBIT 2015 EBIT 2016 EBIT 2017 EBIT LTM Revenue 2015 Revenue 2016 Revenue 2017 Revenue LTM EPS 2015 EPS 2016 EPS 2017 EPS Avigilon Corporation Canada TSX $9.18 48.3% $408 11.3x 9.3x 6.6x 5.9x 15.0x 18.7x 10.2x 6.8x 1.72x 1.49x 1.18x 0.97x 14.3x 16.6x 11.7x 9.0x FLIR Systems, Inc. United StatesNasdaqGS 28.41 82.8 3,795 10.8 10.2 9.0 8.3 12.7 12.0 10.8 9.7 2.45 2.41 2.27 2.14 17.7 17.3 15.1 12.8 DynaColor, Inc. Taiwan GTSM 1.56 70.6 126 8.0 8.4 8.2 7.8 8.4 6.9 9.0 8.5 1.58 1.48 1.73 1.65 11.4 10.2 13.1 12.3 Geovision, Inc. Taiwan TSEC 2.66 73.2 148 9.5 9.8 11.6 11.7 9.9 10.0 12.2 12.3 2.23 2.18 2.17 2.06 15.3 13.8 17.9 18.0 IDIS Holdings Co., Ltd. South Korea KOSDAQ 13.94 89.7 254 7.1 NA NA NA 11.4 NA NA NA 0.91 NA NA NA 5.9 NA NA NA Mobotix AG Germany DB 13.70 87.2 186 28.4 11.7 9.6 8.3 56.8 13.9 11.6 10.3 2.16 1.89 1.72 1.56 NM 21.1 16.7 13.9 Vivotek Inc Taiwan TSEC 2.66 82.1 182 10.3 9.5 9.0 7.0 12.8 10.3 9.4 8.6 1.56 1.43 1.35 1.25 15.3 13.3 12.7 11.3 Mean 76.3% $729 12.2x 9.8x 9.0x 8.2x 18.1x 12.0x 10.5x 9.4x 1.80x 1.81x 1.74x 1.61x 13.3x 15.4x 14.5x 12.9x Median 82.1% $186 10.3x 9.6x 9.0x 8.0x 12.7x 11.1x 10.5x 9.2x 1.72x 1.69x 1.72x 1.61x 14.8x 15.2x 14.1x 12.6x

19 CONFIDENTIAL Valuation Analysis Selected M&A Transactions Analysis Source: Capital IQ, company filings, press releases Selected M&A Transactions Analysis ($ in millions) Announced Status Target Name Target Business Description Acquirer Name Enterprise Value LTM Revenue LTM EBITDA EBITDA Margin EV / EBITDA EV / Revenue 4/9/2015 Closed Alpha Imaging Technology Corp. (GTSM:3538) Provides image signal processing (ISP) technologies and multimedia processors (MMP) for portable devices and consumer markets worldwide MStar Semiconductor, Inc. $55.0 $23.9 NA NA NA 2.31x 2/10/2015 Closed Axis AB (publ) (OM:AXIS) Provides network video solutions for professional installations in Europe, the Middle East, Africa, the Americas, and Asia; products and solutions focus on security surveillance and remote monitoring Canon Inc. (TSE:7751) $2,799.6 $690.1 $107.5 15.6% 26.0x 4.06x 8/12/2014 Pending OmniVision Technologies, Inc. (NasdaqGS:OVTI) Manufactures semiconductor image-sensor devices worldwide Hua Capital Management Co., Ltd.; CITIC Capital Partners; GoldStone Investment Co., Ltd. $1,361.1 $1,378.8 $115.1 8.3% 11.8x 0.99x 4/2/2014 Closed Sensor Holding Corporation Manufactures image sensor devices Semiconductor Components Industries LLC $95.7 $79.0 NA NA NA 1.21x 10/10/2013 Closed CNB Technology, Inc. (KOSDAQ:A086200) Develops and manufactures security cameras E& Business Investment Fund $50.8 $70.2 ($4.5) NM NM 0.72x 10/24/2012 Closed LOREX Technology Inc. Provides video surveillance security solutions to businesses and consumers under the LOREX and Digimerge brands primarily in North America and the United Kingdom FLIR Systems, Inc. (NasdaqGS:FLIR) $44.9 $77.3 $8.8 11.3% 5.1x 0.58x 8/7/2012 Closed Hamilton Safe Co. Manufactures physical security products, pneumatic tube systems, and audio/video systems in the United States Gunnebo AB (OM:GUNN) $65.0 $70.0 NA NA NA 0.93x 7/26/2012 Closed AuthenTec, Inc. Provides mobile and network security solutions for enterprise, government, and consumer markets worldwide Apple Inc. (NasdaqGS:AAPL) $378.3 $76.1 $3.6 4.7% NM 4.97x 4/2/2012 Closed Optech Incorporated Manufactures lidar and camera survey instruments Teledyne DALSA Inc. $87.2 $54.9 NA NA NA 1.59x Mean 14.3x 1.93x Median 11.8x 1.21x

20 CONFIDENTIAL Valuation Analysis Selected Public Companies / M&A Transactions Analysis Summary (1) Excludes China - listed selected public companies group Note: Balance sheet data and LTM as of June 30, 2015. Financial performance metrics presented are adjusted to exclude public co mpany costs and non - recurring income (expenses). Selected Public Companies / M&A Transactions Analysis Summary (USD in thousands) Enterprise Valuation Multiples Valuation Summary Metric Public Company Median Transaction Median Selected Multiple Range Company Performance Enterprise Value Range EV / 2016 EBITDA 6.6x - 11.6x 9.0x NA 10.0x - 12.0x $26,342 $263,422 - $316,106 EV / 2017 EBITDA 5.9x - 11.7x 8.0x NA 8.0x - 10.0x $32,060 $256,483 - $320,604 EV / 2016 EBIT 9.0x - 12.2x 10.5x NA 10.5x - 12.5x $25,007 $262,576 - $312,591 EV / 2017 EBIT 6.8x - 12.3x 9.2x NA 8.5x - 10.5x $30,970 $263,245 - $325,184 Concluded Enterprise Value Range $261,400 - $318,600 Implied Per ADS Range $11.32 - $12.84 Implied Multiples EV / LTM EBITDA 7.1x - 28.4x 10.3x 11.8x $18,914 13.8x - 16.8x EV / 2015 EBITDA 8.4x - 11.7x 9.6x NA $17,166 15.2x - 18.6x EV / LTM EBIT 8.4x - 56.8x 12.7x NA $17,555 14.9x - 18.1x EV / 2015 EBIT 6.9x - 18.7x 11.1x NA $15,699 16.7x - 20.3x EV / LTM Revenue 0.91x - 2.45x 1.72x 1.21x $110,966 2.36x - 2.87x EV / 2015 Revenue 1.43x - 2.41x 1.69x NA $142,804 1.83x - 2.23x EV / 2016 Revenue 1.18x - 2.27x 1.72x NA $177,808 1.47x - 1.79x EV / 2017 Revenue 0.97x - 2.14x 1.61x NA $225,665 1.16x - 1.41x Public Company Range

Assumptions, Qualifications, and Limiting Conditions Appendix 01

22 CONFIDENTIAL Assumptions, Qualifications, and Limiting Conditions If issued, our Opinion letter will include assumptions, qualifications and limiting conditions similar to the following . This is not meant to be a complete list of the assumptions, qualifications and limiting conditions which will be included in our Opinion letter, if rendered . Assumptions and Reliance – In performing its analyses with respect to the Proposed Transaction, Duff & Phelps, with the Company’s and the Special Committee’s consent : • Relied upon the accuracy, completeness, and fair presentation of all information, data, advice, opinions and representations obtaine d f rom public sources or provided to it from private sources, including Company management, and did not independently verify such information; • Relied upon the fact that the Special Committee, the Board of Directors and the Company have been advised by counsel as to all legal ma tters with respect to the Proposed Transaction, including whether all procedures required by law to be taken in connection with the Prop ose d Transaction have been duly, validly and timely taken; • Assumed that any estimates, evaluations, forecasts and projections including, without limitation, the Management Projections, furnish ed to Duff & Phelps were reasonably prepared and based upon the best currently available information and good faith judgment of the person furnis hin g the same, and Duff & Phelps expresses no view or opinion with respect to such estimates, evaluations, forecasts or projections or the underlying a ssu mptions; • Assumed that the information relating to the Company and the Proposed Transaction supplied by the Company to Duff & Phelps and the re pre sentations made by Company management regarding the Company and the Proposed Transaction in the Management Representation Letter are acc ura te in all material respects, did not and does not omit to state a material fact in respect of the Company and the Proposed Transaction nec essary to make the information not misleading in light of the circumstances under which the information was provided ; • Assumed that the representations and warranties made by all parties in the Merger Agreement and in the Management Representation Lett er are true and correct and that each party to the Merger Agreement will fully and timely perform all covenants and agreements required to be pe rformed by such party; • Assumed that the final versions of all documents reviewed by Duff & Phelps in draft form, including the Merger Agreement, conform in all material respects to the drafts reviewed; • Assumed that there has been no material change in the assets, liabilities, financial condition, results of operations, business, or p ros pects of the Company since the date of the most recent financial statements and other information made available to Duff & Phelps, and that there is no information or facts that would make the information reviewed by Duff & Phelps incomplete or misleading; • Assumed that all of the conditions required to implement the Proposed Transaction will be satisfied and that the Proposed Transaction wi ll be completed in accordance with the Merger Agreement without any amendments thereto or any waivers of any terms or conditions thereof, and in a manner that complies in all material respects with all applicable laws; and • Assumed that all governmental, regulatory or other consents and approvals necessary for the consummation of the Proposed Transaction wil l be obtained without any undue delay, limitation, restriction or condition that would have a material effect on the Company or the contemp lat ed benefits expected to be derived in the Proposed Transaction. To the extent that any of the foregoing assumptions or any of the facts on which the Opinion is based prove to be untrue in any material respect, the Opinion cannot and should not be relied upon for any purpose . Furthermore, in Duff & Phelps’ analysis and in connection with the preparation of the Opinion, Duff & Phelps has made numerous assumptions with respect to industry performance, general business, market and economic conditions and other matters, many of which are beyond the control of any party involved in the Proposed Transaction and as to which Duff & Phelps does not express any view or opinion in the Opinion, including as to the reasonableness of such assumptions .

23 CONFIDENTIAL Assumptions, Qualifications, and Limiting Conditions Qualifications – If issued, our Opinion will be qualified by the following: • Duff & Phelps has prepared the Opinion effective as of the date thereof . The Opinion is necessarily based upon market, economic, financial and other conditions as they exist and can be evaluated as of the date thereof , and Duff & Phelps disclaims any undertaking or obligation to (i) advise any person of any change in any fact or matter affecting the Opinion which may come or be brought to the attention of Duff & Phelps after the date thereof or (ii) update, revise or reaffirm the Opinion after the date thereof . • Duff & Phelps did not evaluate the Company’s solvency or conduct an independent appraisal or physical inspection of any specific assets or liabilities (contingent or otherwise) of the Company . • Duff & Phelps has not been requested to, and did not, (i) initiate any discussions with, or solicit any indications of interest from, third parties with respect to the Proposed Transaction, the assets, businesses or operations of the Company, or any alternatives to the Proposed Transaction, (ii) negotiate the terms of the Proposed Transaction, and therefore, Duff & Phelps has assumed that such terms are the most beneficial terms, from the Company’s perspective, that could, under the circumstances, reasonably be negotiated among the parties to the Merger Agreement and the Proposed Transaction, or (iii) advise the Special Committee or any other party with respect to alternatives to the Proposed Transaction . • Duff & Phelps is not expressing any opinion as to the market price or value of the Shares or ADSs (or anything else) after the announcement or the consummation of the Proposed Transaction (or any other time) . The Opinion should not be construed as a valuation opinion, credit rating, solvency opinion, an analysis of the Company’s credit worthiness, as tax advice, or as accounting advice . Duff & Phelps has not made, and assumes no responsibility to make, any representation, or render any opinion, as to any legal matter . • In rendering the Opinion, Duff & Phelps is not expressing any opinion with respect to the amount or nature of any compensation payable to or to be received by the Company’s officers, directors, or employees, or any class of such persons, relative to the Merger Consideration, or with respect to the fairness of any such compensation .

24 CONFIDENTIAL Assumptions, Qualifications, and Limiting Conditions Limiting Conditions – If issued, the use of our Opinion will be strictly limited and will state: • The Opinion is furnished solely for the use and benefit of the Special Committee in connection with its consideration of the Proposed Transaction and is not intended to, and does not, confer any rights or remedies upon any other person, and is not intended to be used, and may not be used, by any other person or for any other purpose, without Duff & Phelps’ written consent . • The Opinion (i) does not address the merits of the underlying business decision to enter into the Proposed Transaction versus any alternative strategy or transaction ; (ii) does not address any transaction related to the Proposed Transaction ; (iii) is not a recommendation as to how the Special Committee or any stockholder should vote or act with respect to any matters relating to the Proposed Transaction, or whether to proceed with the Proposed Transaction or any related transaction, and (iv) does not indicate that the Merger Consideration is the best possibly attainable under any circumstances ; instead, it merely states whether the Merger Consideration is within a range suggested by certain financial analyses . The decision as to whether to proceed with the Proposed Transaction or any related transaction may depend on an assessment of factors unrelated to the financial analysis on which the Opinion is based . • The Opinion should not be construed as creating any fiduciary duty on the part of Duff & Phelps to any party . • The Opinion is solely that of Duff & Phelps, and Duff & Phelps’ liability in connection with the Opinion shall be limited in accordance with the terms set forth in the engagement letter among Duff & Phelps, DPS, the Company, and the Special Committee dated July 2 , 2015 (the “ Engagement Letter ”) . • The Opinion is confidential, and its use and disclosure is strictly limited in accordance with the terms set forth in the Engagement Letter .

Summary of Premiums Paid Appendix 02
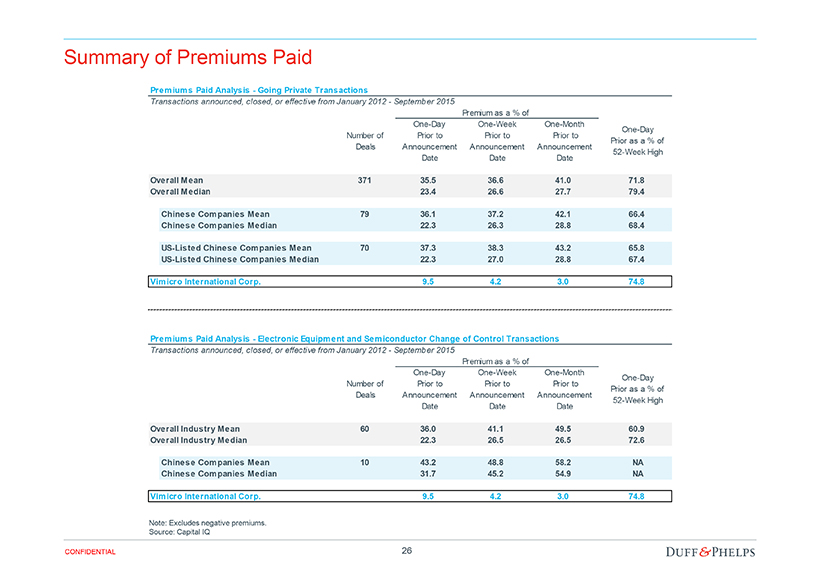
26 CONFIDENTIAL Summary of Premiums Paid Note: Excludes negative premiums . Source: Capital IQ Premiums Paid Analysis - Going Private Transactions Transactions announced, closed, or effective from January 2012 - September 2015 Premium as a % of Number of Deals One-Day Prior to Announcement Date One-Week Prior to Announcement Date One-Month Prior to Announcement Date One-Day Prior as a % of 52-Week High Overall Mean 371 35.5 36.6 41.0 71.8 Overall Median 23.4 26.6 27.7 79.4 Chinese Companies Mean 79 36.1 37.2 42.1 66.4 Chinese Companies Median 22.3 26.3 28.8 68.4 US-Listed Chinese Companies Mean 70 37.3 38.3 43.2 65.8 US-Listed Chinese Companies Median 22.3 27.0 28.8 67.4 Vimicro International Corp. 9.5 4.2 3.0 74.8 Premiums Paid Analysis - Electronic Equipment and Semiconductor Change of Control Transactions Transactions announced, closed, or effective from January 2012 - September 2015 Premium as a % of Number of Deals One-Day Prior to Announcement Date One-Week Prior to Announcement Date One-Month Prior to Announcement Date One-Day Prior as a % of 52-Week High Overall Industry Mean 60 36.0 41.1 49.5 60.9 Overall Industry Median 22.3 26.5 26.5 72.6 Chinese Companies Mean 10 43.2 48.8 58.2 NA Chinese Companies Median 31.7 45.2 54.9 NA Vimicro International Corp. 9.5 4.2 3.0 74.8