
1 CatchMark Timber Trust N Y S E : C T T M a y 2 0 1 6 C A T C H M A R K (NYSE: CTT) F O U R T H Q U A R T E R 2 0 1 6
F O R WA R D - L O O K I N G S TAT E M E N T S COMPANY UPDATE | FOURTH QUARTER 2016 2 This presentation contains certain forward-looking statements within the meaning of the safe harbor from civil liability provided for such statements by the Private Securities Litigation Reform Act of 1995 (as set forth in Section 27A of the Securities Act of 1933, as amended, and Section 21E of the Securities Exchange Act of 1934, as amended) that are subject to risks and uncertainties. Such forward-looking statements can generally be identified by use of forward-looking terminology such as "may," "will," "expect," "intend," "anticipate," "estimate," "believe," "continue," or other similar words. These forward-looking statements are based on certain assumptions, discuss future expectations, describe future plans and strategies, contain financial and operating projections or state other forward-looking information. The Company's ability to predict results or the actual effect of future events, actions, plans or strategies is inherently uncertain. Although the Company believes that the expectations reflected in such forward-looking statements are based on reasonable assumptions, the Company's actual results and performance could differ materially from those set forth in, or implied by, the forward-looking statements. You should be aware that there are various factors that could cause actual results to differ materially from any forward-looking statements made in this presentation. Factors that could cause or contribute to such differences include, but are not limited to, (i) we may not generate the harvest volumes or the harvest mix from our timberlands that we currently anticipate; (ii) the demand for our timber may not increase at the rate we currently anticipate or at all due to changes in general economic and business conditions in the geographic regions where our timberlands are located; (iii) the cyclical nature of the real estate market generally, including fluctuations in demand and valuations, may adversely impact our ability to generate income and cash flow from sales of higher-and-better use properties; (iv) housing starts and timber prices may not increase at the rate we currently anticipate or could decline, which would negatively impact our revenues; (v) the supply of timberlands available for acquisition that meet our investment criteria may be less than we currently anticipate; (vi) we may be unsuccessful in winning bids for timberland that are sold through an auction process; (vii) we may not be able to access external sources of capital at attractive rates or at all; (viii) potential increases in interest rates could have a negative impact on our business; (ix) our share repurchase program may not be successful in improving shareholder value over the long-term; (x) our cash dividends are not guaranteed and may fluctuate; and (xi) the factors described in Item 1A. of our Annual Report on Form 10-K for the fiscal year ended December 31, 2016, under the heading “Risk Factors” and our other filings with Securities and Exchange Commission. You are cautioned not to place undue reliance on any of these forward-looking statements, which reflect the Company's views only as of this date. Furthermore, except as required by law, the Company is under no duty to, and does not intend to, update any of our forward-looking statements after this date, whether as a result of new information, future events or otherwise.

3 CatchMark Overview

CatchMark is a public company that strives to deliver superior risk-adjusted returns for all stakeholders through disciplined acquisitions, sustainable harvests, and well-timed sales. COMPANY UPDATE | FOURTH QUARTER 2016 4
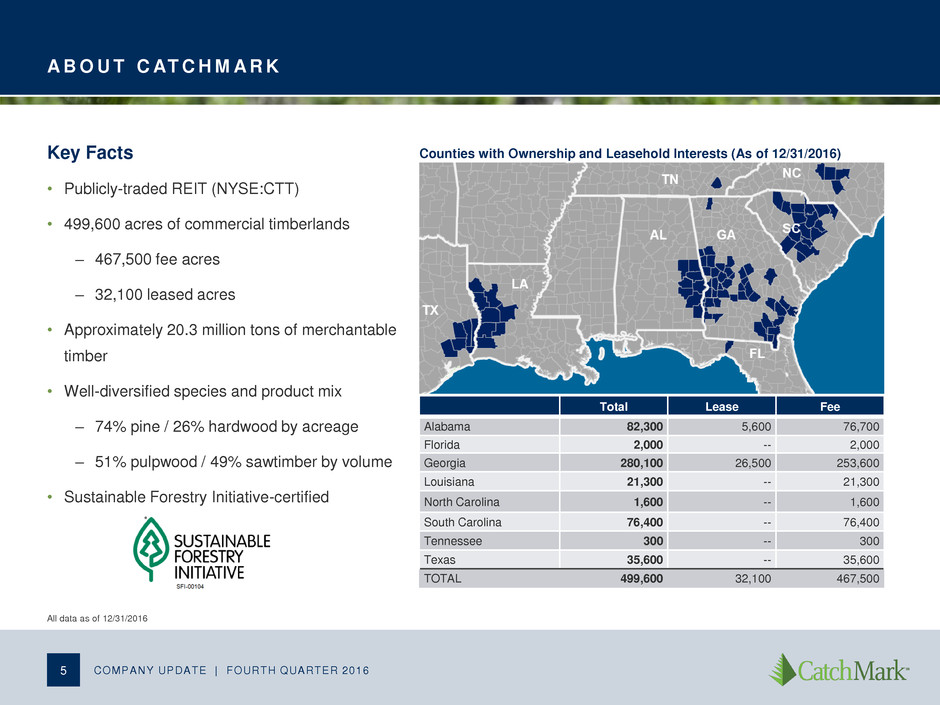
A B O U T C AT C H M A R K Key Facts • Publicly-traded REIT (NYSE:CTT) • 499,600 acres of commercial timberlands – 467,500 fee acres – 32,100 leased acres • Approximately 20.3 million tons of merchantable timber • Well-diversified species and product mix – 74% pine / 26% hardwood by acreage – 51% pulpwood / 49% sawtimber by volume • Sustainable Forestry Initiative-certified 5 Counties with Ownership and Leasehold Interests (As of 12/31/2016) All data as of 12/31/2016 COMPANY UPDATE | FOURTH QUARTER 2016 Total Lease Fee Alabama 82,300 5,600 76,700 Florida 2,000 -- 2,000 Georgia 280,100 26,500 253,600 Louisiana 21,300 -- 21,300 North Carolina 1,600 -- 1,600 South Carolina 76,400 -- 76,400 Tennessee 300 -- 300 Texas 35,600 -- 35,600 TOTAL 499,600 32,100 467,500

E X P E R I E N C E D M A N A G E M E N T T E A M 6 CatchMark’s seasoned leadership provides significant industry experience and capability to help realize company objectives and growth plan. Jerry Barag, President and CEO (31 years of industry experience) • Managing Director and Founder TimberStar Advisors and TimberStar • Chief Investment Officer at Lend Lease Real Estate Investments • Executive Vice President, Equitable Real Estate Brian Davis, Chief Financial Officer (26 years) • Senior Vice President and Chief Financial Officer of Wells Timberland • Various executive finance roles with SunTrust Bank and CoBank, delivering capital market solutions – advisory, capital raising, and financial risk management to public and private companies. John Rasor, Chief Operating Officer (46 years) • Managing Director and Founder TimberStar Advisors and TimberStar • Executive Vice President of Georgia Pacific, responsible for timber and timberlands, building product businesses, and wood and fiber procurement for wood products, pulp and paper CEO Barag and COO Rasor have worked together since 2004, completing $1.4 billion in timberland acquisitions and $1.9 billion dispositions prior to joining CatchMark. These transactions generated investor returns of 2.0x equity and 1.4x total capital in the first and only timberland securitization (TimberStar). COMPANY UPDATE | FOURTH QUARTER 2016
CATCHMARK ’ S I NVESTMENT DR I VERS • Deliver recurring dividends from sustainable harvests on prime timberlands and opportunistic land sales, taking advantage of the current housing recovery • Acquire highly-productive and well-located timberlands in high demand fiber basket markets through disciplined capital allocations • Grow stable and predictable cash flows and enhance NAV through active forest management and concerted environmental stewardship COMPANY UPDATE | FOURTH QUARTER 2016 7 CatchMark drives superior risk-adjusted performance through a focus on higher quality assets in select mill markets and seeks to: INVESTMENT DRIVERS 1. Prime Timberland Assets 2. High Demand Markets 3. Active Forest Management 4. Environmental Stewardship

Q U A L I T Y E A R N I N G S F R O M L O W E R - R I S K O P E R AT I O N S M O D E L COMPANY UPDATE | FOURTH QUARTER 2016 8 CatchMark’s business model focuses on harvest operations of owned and leased timberlands to secure durable earnings and does not include more volatile land development and manufacturing. Timber Operations Land Sales (<2% of fee acres) Land Sales (>2% of fee acres) Commercial/ Residential Land Development Manufacturing CTT 70%1 30%1, 2 --- --- --- WY PCH RYN Risk Lower Higher 1. Based on % of Adjusted EBITDA. Adjusted EBITDA is a non-GAAP measure. See Appendix for our reconciliation from net income (losses) to Adjusted EBITDA. 2. Average for 2014 – 2016. See Appendix for reconciliation.
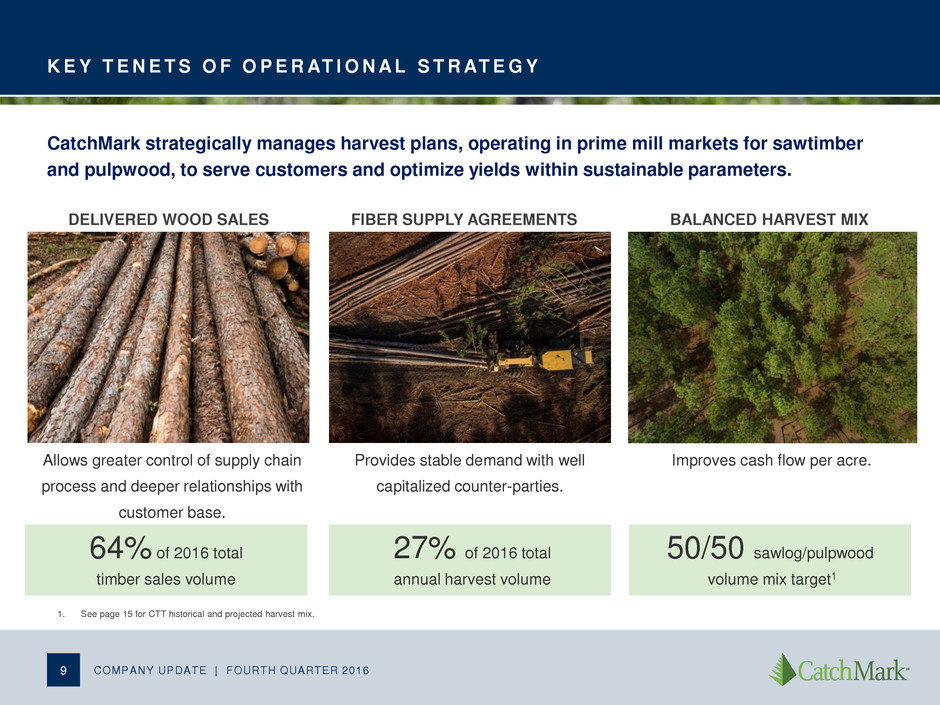
K E Y T E N E T S O F O P E R AT I O N A L S T R AT E G Y Allows greater control of supply chain process and deeper relationships with customer base. COMPANY UPDATE | FOURTH QUARTER 2016 9 CatchMark strategically manages harvest plans, operating in prime mill markets for sawtimber and pulpwood, to serve customers and optimize yields within sustainable parameters. Provides stable demand with well capitalized counter-parties. Improves cash flow per acre. DELIVERED WOOD SALES FIBER SUPPLY AGREEMENTS BALANCED HARVEST MIX 64% of 2016 total timber sales volume 27% of 2016 total annual harvest volume 50/50 sawlog/pulpwood volume mix target1 1. See page 15 for CTT historical and projected harvest mix.

S U S TA I N A B L E H A R V E S T P R O D U C T I O N D R I V E S C A S H F L O W A N D VA L U E 10 COMPANY UPDATE | FOURTH QUARTER 2016 1. 4Q 2016 TimberMart-South: Southwide averages. This pricing does not necessarily reflect the pricing realized by CatchMark. 2. Management estimates based on U.S. South stumpage prices published by TimberMart-South from 1981-2016. 3. Leasing/Ancillary Revenue estimated to be approximately $10 per acre on average. 4. Forest Management/Taxes estimated to be approximately $16 per acre on average. Harvest Assumptions % Pine (tons) 87.5% % Hardwood (tons) 12.5% Sustainable harvest production growth can yield significantly increased cash flow, particularly when factoring in a price recovery. Illustrative per Acre Example: 3.50 Tons per Acre 5.00 Tons per Acre Pricing Pricing Product Tons / Revenue Revenue Tons / Revenue Revenue Product Category 12/31/20161 (Trendline)2 Mix Acre (Current) (Trendline) Acre (Current) (Trendline) Pine Pulpwood $9.60 $10.00 50.0% 1.52 $14.70 $15.31 2.19 $21.03 $21.90 Pine CNS $16.92 $21.00 25.0% 0.77 12.95 16.08 1.09 18.44 22.89 Pine Sawtimber $24.13 $35.00 25.0% 0.77 18.48 26.80 1.09 26.30 38.15 Subtotal Pine 100.0% 3.06 $46.13 $58.19 4.37 $65.77 $82.94 Hardwood Pulpwood $8.53 $10.00 66.7% 0.29 $2.49 $2.92 0.42 $3.58 $4.20 Hardwood Sawtimber $32.68 $29.00 33.3% 0.15 4.76 4.22 0.21 6.86 6.09 Subtotal Hardwood 100.0% 0.44 $7.25 $7.14 0.63 $10.44 $10.29 Total Revenues 3.50 $53.38 $65.33 5.00 $76.21 $93.23 (+) Leasing / Ancillary Revenue3 10.00 10.00 10.00 10.00 (–) Forest Management / Taxes4 (16.00) (16.00) (16.00) (16.00) Adjusted per Acre Revenue $47.38 $59.33 $70.21 $87.23 % Δ versus 3.5 Tons per Acre @ Current Pricing 25.00% 48.00% 84.00%

11 Acquisitions and Sales Strategy
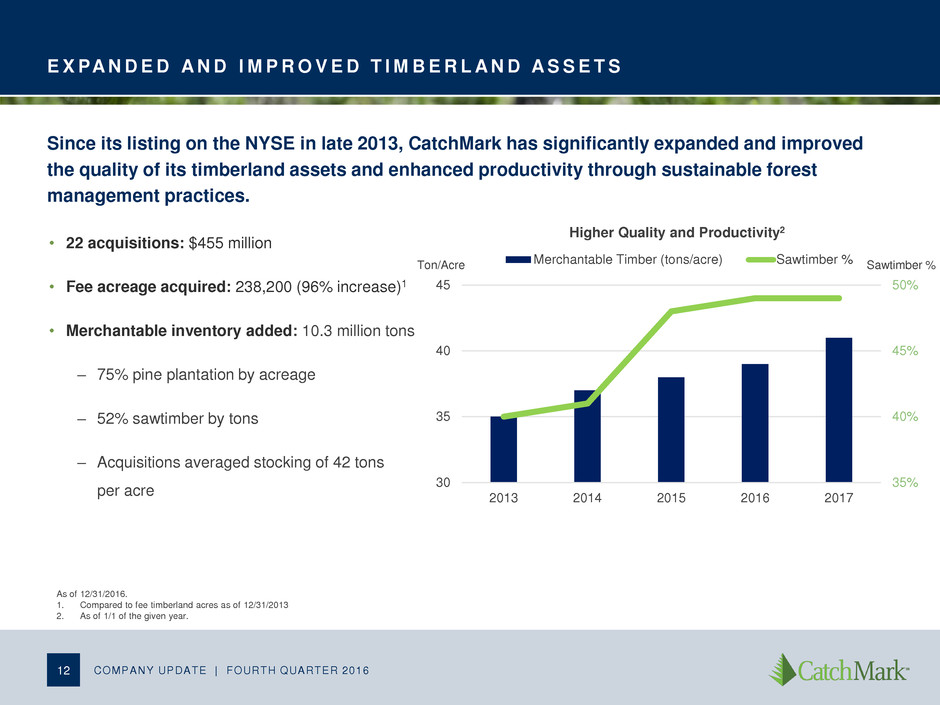
E X PA N D E D A N D I M P R O V E D T I M B E R L A N D A S S E T S COMPANY UPDATE | FOURTH QUARTER 2016 12 Since its listing on the NYSE in late 2013, CatchMark has significantly expanded and improved the quality of its timberland assets and enhanced productivity through sustainable forest management practices. Higher Quality and Productivity2 As of 12/31/2016. 1. Compared to fee timberland acres as of 12/31/2013 2. As of 1/1 of the given year. • 22 acquisitions: $455 million • Fee acreage acquired: 238,200 (96% increase)1 • Merchantable inventory added: 10.3 million tons – 75% pine plantation by acreage – 52% sawtimber by tons – Acquisitions averaged stocking of 42 tons per acre 35% 40% 45% 50% 30 35 40 45 2013 2014 2015 2016 2017 Merchantable Timber (tons/acre) Sawtimber %Ton/Acre Sawtimber %

S U P E R I O R H A R V E S T P R O D U C T I V I T Y COMPANY UPDATE | FOURTH QUARTER 2016 13 As of 12/31 or for the year ended on 12/31 of each year. Source: Company 10-K filings. Southern timberland only. CatchMark, Weyerhaeuser, and Rayonier use the same definition of merchantable age on Southern timber. CatchMark delivers the highest productivity per acre among its peers, while steadily improving its per acre stocking through prime acquisitions and sustainable forest management. CatchMark 30 35 40 45 50 55 2014 2015 2016 2.5 3.0 3.5 4.0 4.5 5.0 5.5 Stocking Harvest Productivity Tons / Acre Tons / Acre Weyerhaeuser 30 35 40 45 50 55 2014 2015 2016 2.5 3.0 3.5 4.0 4.5 5.0 5.5 Stocking Harvest Productivity Tons / Acre Tons / Acre Rayonier 30 35 40 45 50 55 2014 2015 2016 2.5 3.0 3.5 4.0 4.5 5.0 5.5 Stocking Harvest Productivity Tons / Acre Tons / Acre Potlatch Tons / Acre Tons / Acre 30 35 40 45 50 55 2014 2015 2017 2.5 3.0 3.5 4.0 4.5 5.0 5.5 Stocking Harvest Productivity
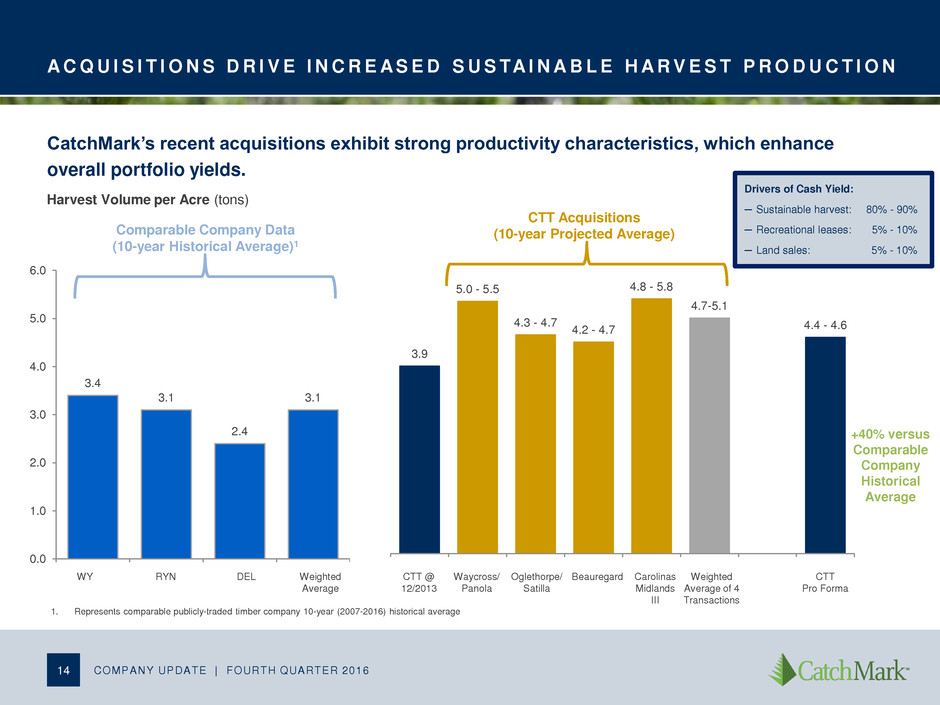
A C Q U I S I T I O N S D R I V E I N C R E A S E D S U S TA I N A B L E H A R V E S T P R O D U C T I O N 14 3.4 3.1 2.4 3.1 0.0 1.0 2.0 3.0 4.0 5.0 6.0 1. Represents comparable publicly-traded timber company 10-year (2007-2016) historical average Drivers of Cash Yield: ─ Sustainable harvest: 80% - 90% ─ Recreational leases: 5% - 10% ─ Land sales: 5% - 10% +40% versus Comparable Company Historical Average Comparable Company Data (10-year Historical Average)1 CTT Acquisitions (10-year Projected Average) WY RYN DEL Weighted Average Waycross/ Panola Oglethorpe/ Satilla Weighted Average of 4 Transactions CTT Pro Forma CatchMark’s recent acquisitions exhibit strong productivity characteristics, which enhance overall portfolio yields. Harvest Volume per Acre (tons) COMPANY UPDATE | FOURTH QUARTER 2016 Beauregard CTT @ 12/2013 Carolinas Midlands III 3.9 5.0 - 5.5 4.3 - 4.7 4.2 - 4.7 4.8 - 5.8 4.7-5.1 4.4 - 4.6

R E P O S I T I O N I N G S T R AT E G Y E N H A N C E S F U T U R E VA L U E COMPANY UPDATE | FOURTH QUARTER 2016 15 CatchMark’s evolving harvest mix to an increased share of sawtimber highlights the improved quality of the company’s assets and enhanced prospects for future revenue growth. Pulpwood 70% Sawtimber 30% 2011 - 2013 Pulpwood 62% Sawtimber 38% 2014 – 2016 Average Harvest Mix Pulpwood 50% Sawtimber 50% 2017 – 2021 (Near-Term Target)
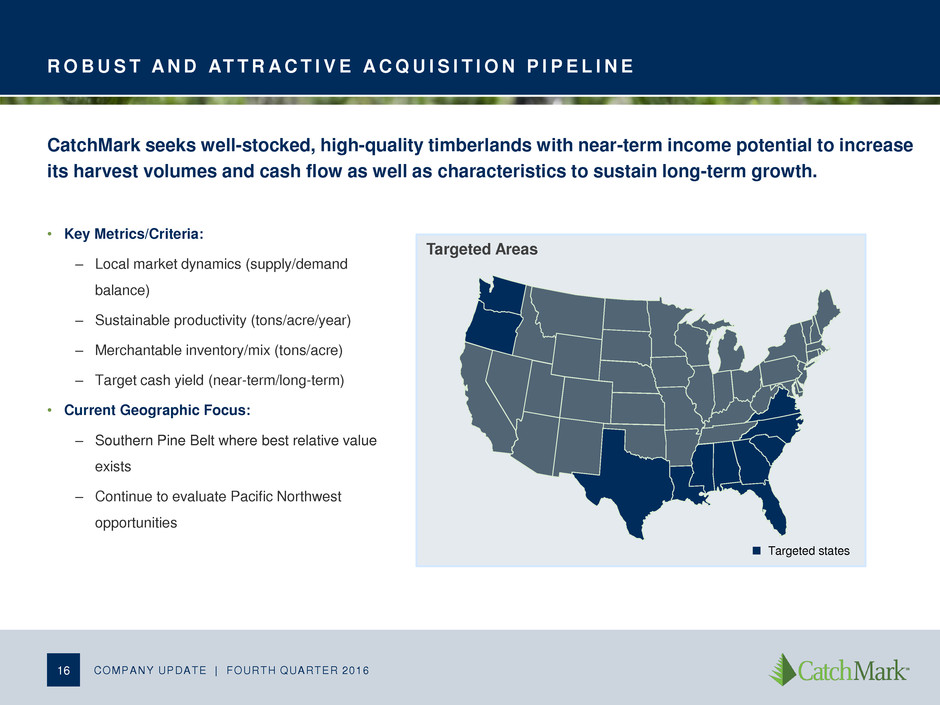
Targeted Areas Targeted states R O B U S T A N D AT T R A C T I V E A C Q U I S I T I O N P I P E L I N E • Key Metrics/Criteria: – Local market dynamics (supply/demand balance) – Sustainable productivity (tons/acre/year) – Merchantable inventory/mix (tons/acre) – Target cash yield (near-term/long-term) • Current Geographic Focus: – Southern Pine Belt where best relative value exists – Continue to evaluate Pacific Northwest opportunities CatchMark seeks well-stocked, high-quality timberlands with near-term income potential to increase its harvest volumes and cash flow as well as characteristics to sustain long-term growth. 16 COMPANY UPDATE | FOURTH QUARTER 2016
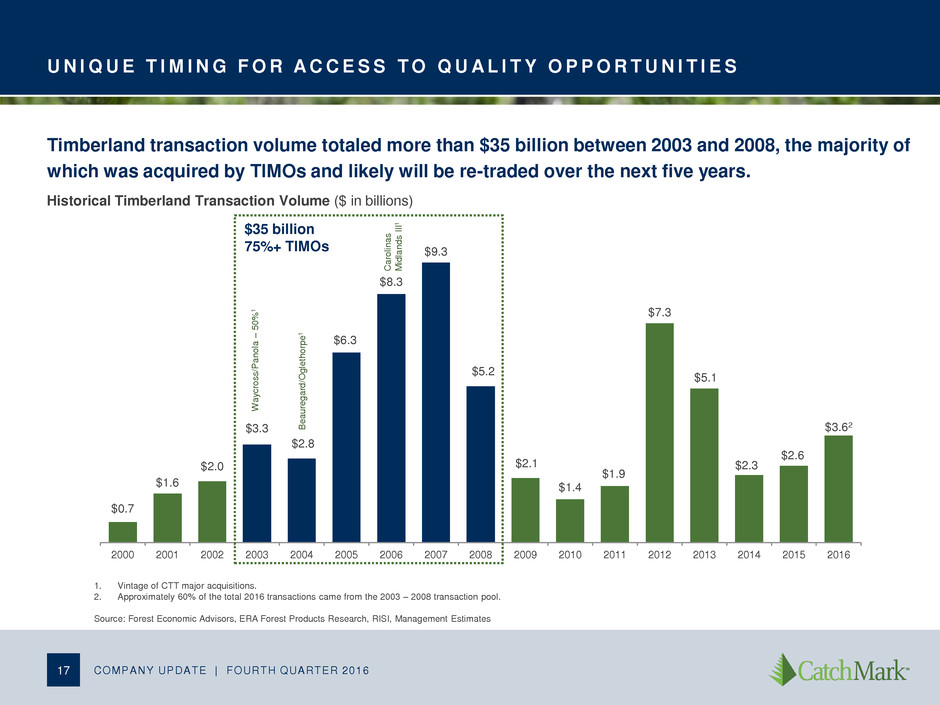
$0.7 $1.6 $2.0 $3.3 $2.8 $6.3 $8.3 $9.3 $5.2 $2.1 $1.4 $1.9 $7.3 $5.1 $2.3 $2.6 $3.62 2000 2001 2002 2003 2004 2005 2006 2007 2008 2009 2010 2011 2012 2013 2014 2015 2016 Ca ro lin a s M idl a n d s I II 1 $35 billion 75%+ TIMOs U N I Q U E T I M I N G F O R A C C E S S T O Q U A L I T Y O P P O R T U N I T I E S 17 1. Vintage of CTT major acquisitions. 2. Approximately 60% of the total 2016 transactions came from the 2003 – 2008 transaction pool. Source: Forest Economic Advisors, ERA Forest Products Research, RISI, Management Estimates Historical Timberland Transaction Volume ($ in billions) Timberland transaction volume totaled more than $35 billion between 2003 and 2008, the majority of which was acquired by TIMOs and likely will be re-traded over the next five years. COMPANY UPDATE | FOURTH QUARTER 2016 W a yc ro ss/ P a n o la – 5 0 % 1 B e a u re g a rd /O g le th o rp e 1
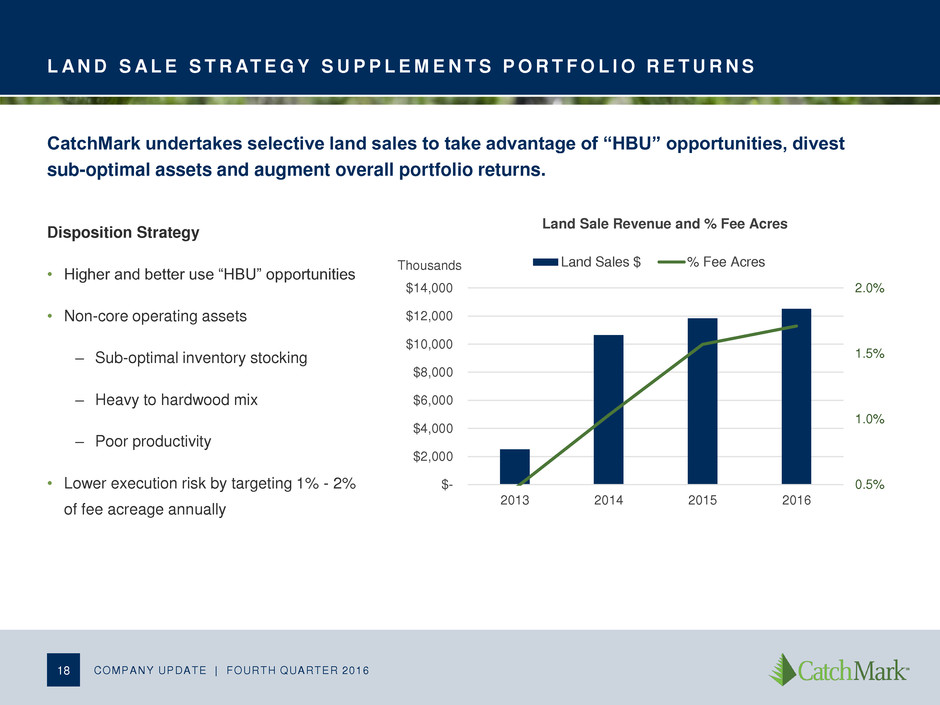
L A N D S A L E S T R AT E G Y S U P P L E M E N T S P O R T F O L I O R E T U R N S Disposition Strategy • Higher and better use “HBU” opportunities • Non-core operating assets – Sub-optimal inventory stocking – Heavy to hardwood mix – Poor productivity • Lower execution risk by targeting 1% - 2% of fee acreage annually COMPANY UPDATE | FOURTH QUARTER 2016 18 0.5% 1.0% 1.5% 2.0% $- $2,000 $4,000 $6,000 $8,000 $10,000 $12,000 $14,000 2013 2014 2015 2016 Land Sales $ % Fee Acres CatchMark undertakes selective land sales to take advantage of “HBU” opportunities, divest sub-optimal assets and augment overall portfolio returns. Land Sale Revenue and % Fee Acres Thousands

19 CatchMark’s Markets
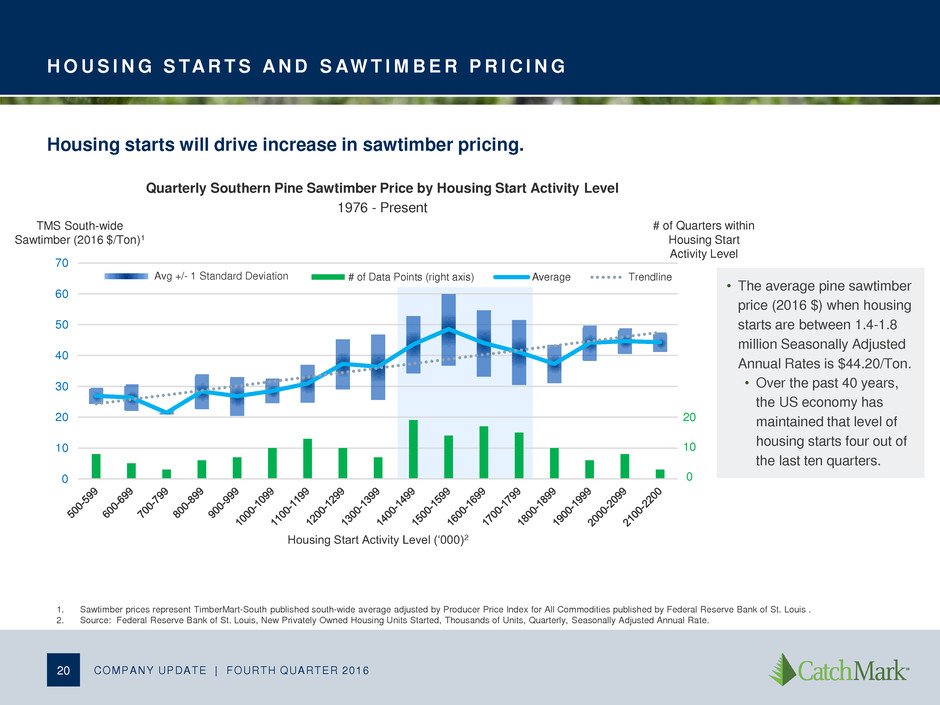
H O U S I N G S TA R T S A N D S AW T I M B E R P R I C I N G 20 COMPANY UPDATE | FOURTH QUARTER 2016 1. Sawtimber prices represent TimberMart-South published south-wide average adjusted by Producer Price Index for All Commodities published by Federal Reserve Bank of St. Louis . 2. Source: Federal Reserve Bank of St. Louis, New Privately Owned Housing Units Started, Thousands of Units, Quarterly, Seasonally Adjusted Annual Rate. 0 10 20 30 40 50 60 70 Housing Start Activity Level (‘000)2 # of Data Points (right axis) Average Trendline # of Quarters within Housing Start Activity Level TMS South-wide Sawtimber (2016 $/Ton)1 Avg +/- 1 Standard Deviation • The average pine sawtimber price (2016 $) when housing starts are between 1.4-1.8 million Seasonally Adjusted Annual Rates is $44.20/Ton. • Over the past 40 years, the US economy has maintained that level of housing starts four out of the last ten quarters. Quarterly Southern Pine Sawtimber Price by Housing Start Activity Level 1976 - Present 20 10 0 Housing starts will drive increase in sawtimber pricing.

M A C R O D E M A N D D R I V E R – H O U S I N G S TA R T S 21 COMPANY UPDATE | FOURTH QUARTER 2016 0.0 0.5 1.0 1.5 2.0 2.5 00 02 04 06 08 10 12 14 16 18 20 Historical and Projected U.S. Housing Starts S tart s i n m ill io n s 30 40 50 60 70 80 00 02 04 06 08 10 12 14 16 18 20 Projected North America Lumber Consumption B B F Source: Forest Economic Advisors January 2017, U.S. Census Bureau 0.0 0.5 1.0 1.5 2.0 2.5 00 01 02 04 05 06 07 08 09 10 11 12 13 14 15 16 Single Family and Multifamily Starts Single Family Multifamily CatchMark anticipates to capitalize on increasing housing starts which should lead to higher lumber consumption and better sawtimber pricing. S tart s i n m ill io n s
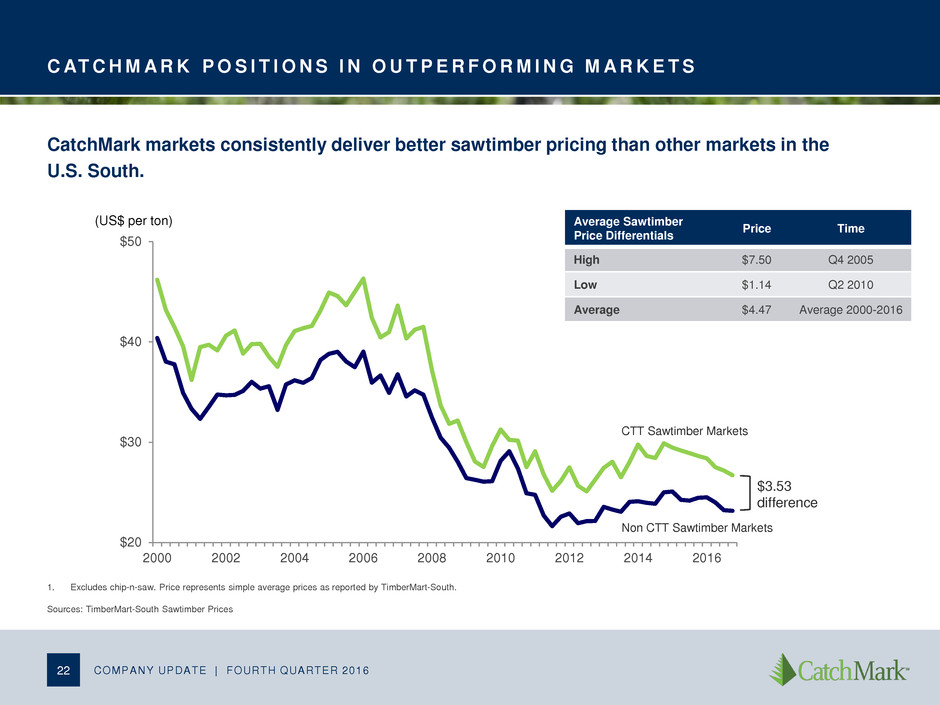
C AT C H M A R K P O S I T I O N S I N O U T P E R F O R M I N G M A R K E T S 22 COMPANY UPDATE | FOURTH QUARTER 2016 1. Excludes chip-n-saw. Price represents simple average prices as reported by TimberMart-South. Sources: TimberMart-South Sawtimber Prices (US$ per ton) $20 $30 $40 $50 2000 2002 2004 2006 2008 2010 2012 2014 2016 CatchMark markets consistently deliver better sawtimber pricing than other markets in the U.S. South. $3.53 difference Non CTT Sawtimber Markets CTT Sawtimber Markets Average Sawtimber Price Differentials Price Time High $7.50 Q4 2005 Low $1.14 Q2 2010 Average $4.47 Average 2000-2016
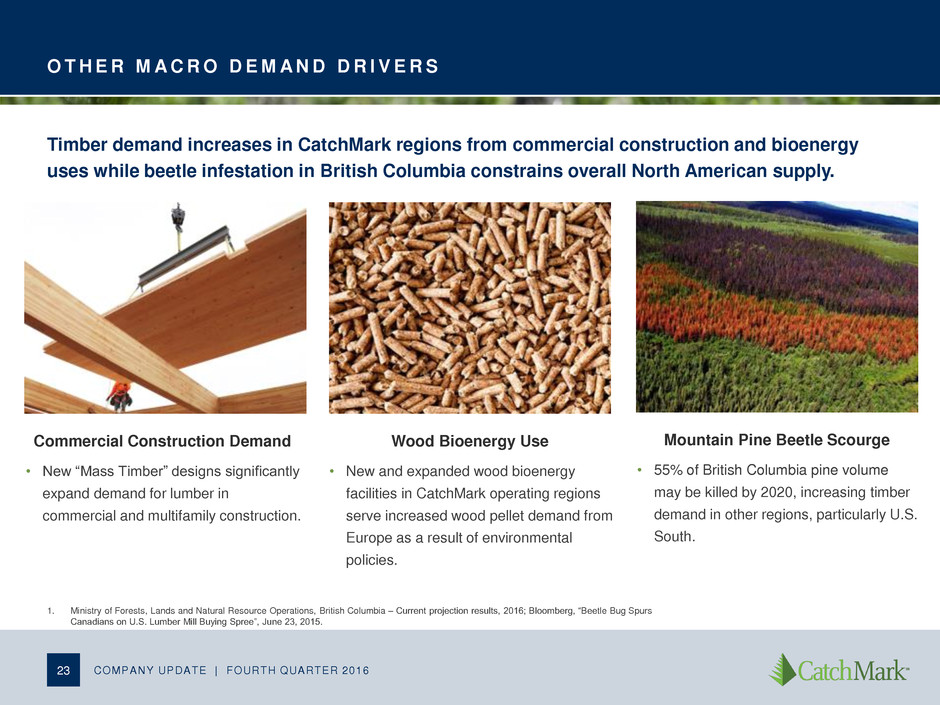
O T H E R M A C R O D E M A N D D R I V E R S COMPANY UPDATE | FOURTH QUARTER 2016 23 1. Ministry of Forests, Lands and Natural Resource Operations, British Columbia – Current projection results, 2016; Bloomberg, “Beetle Bug Spurs Canadians on U.S. Lumber Mill Buying Spree”, June 23, 2015. Commercial Construction Demand • 55% of British Columbia pine volume may be killed by 2020, increasing timber demand in other regions, particularly U.S. South. • New “Mass Timber” designs significantly expand demand for lumber in commercial and multifamily construction. • New and expanded wood bioenergy facilities in CatchMark operating regions serve increased wood pellet demand from Europe as a result of environmental policies. Wood Bioenergy Use Mountain Pine Beetle Scourge Timber demand increases in CatchMark regions from commercial construction and bioenergy uses while beetle infestation in British Columbia constrains overall North American supply.
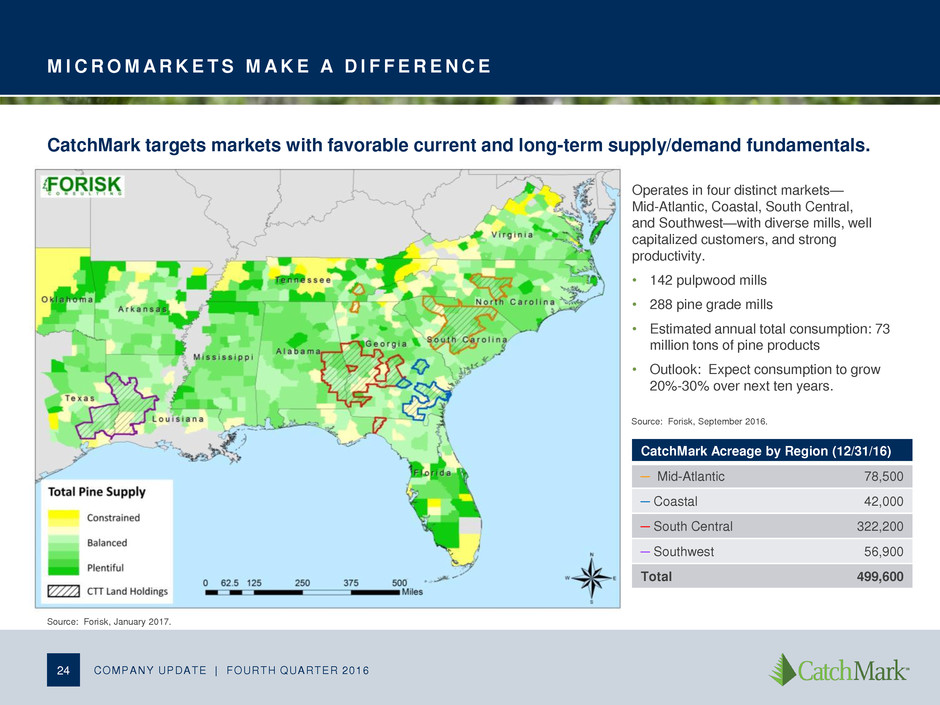
M I C R O M A R K E T S M A K E A D I F F E R E N C E 24 CatchMark targets markets with favorable current and long-term supply/demand fundamentals. COMPANY UPDATE | FOURTH QUARTER 2016 Source: Forisk, January 2017. Source: Forisk, September 2016. Operates in four distinct markets— Mid-Atlantic, Coastal, South Central, and Southwest—with diverse mills, well capitalized customers, and strong productivity. • 142 pulpwood mills • 288 pine grade mills • Estimated annual total consumption: 73 million tons of pine products • Outlook: Expect consumption to grow 20%-30% over next ten years. CatchMark Acreage by Region (12/31/16) ─ Mid-Atlantic 78,500 ─ Coastal 42,000 ─ South Central 322,200 ─ Southwest 56,900 Total 499,600

O P E R AT I N G I N M A R K E T S W I T H S T R O N G P R O D U C T I V I T Y A N D C U S T O M E R S COMPANY UPDATE | FOURTH QUARTER 2016 25 CatchMark markets outperform TimberMart-South averages. $15 $17 $19 $21 $23 1Q15 2Q15 3Q15 4Q15 1Q16 2Q16 3Q16 4Q16 Pine Pulpwood Prices $8 $10 $12 $14 $16 $18 1Q15 2Q15 3Q15 4Q15 1Q16 2Q16 3Q16 4Q16 Pine Chip-n-Saw Prices $24 $26 $28 $30 $32 1Q15 2Q15 3Q15 4Q15 1Q16 2Q16 3Q16 4Q16 Pine Sawtimber Prices • Timber prices driven by local supply and demand. • Prices can vary greatly from market to market. TimberMart-South Published Prices:

M I D - AT L A N T I C – 7 8 , 5 0 0 A C R E S 26 COMPANY UPDATE | FOURTH QUARTER 2016 NC SC # of Mills Consumption (millions tons) Pulpwood 53 10.6 Pine grade 109 7.7 Total 162 18.3 ANNUAL CONSUMPTION Source: Forisk, September 2016. As of 6/30/2016. 0 5 10 15 20 25 Q315 - Q216 2025 Base 2025 High Million Tons Pulpwood Pine Grade Forecast Scenarios Current DEMAND Market Overview • Deep and diversified mills • Ability to capture export pricing • Tight supply produces greater price movement as housing demand improves
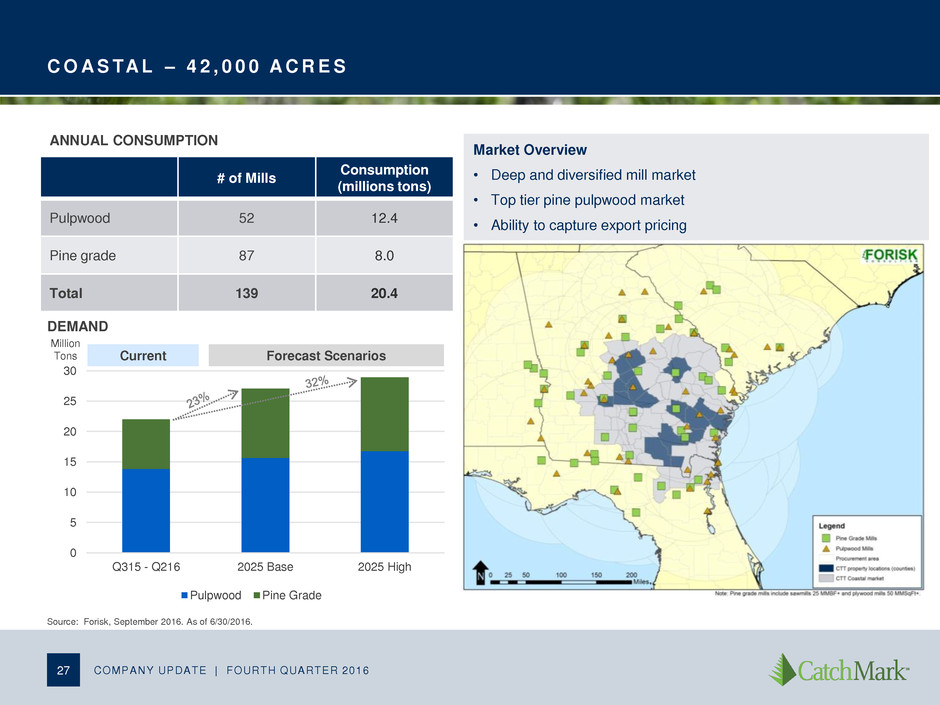
C O A S TA L – 4 2 , 0 0 0 A C R E S 27 COMPANY UPDATE | FOURTH QUARTER 2016 NC SC # of Mills Consumption (millions tons) Pulpwood 52 12.4 Pine grade 87 8.0 Total 139 20.4 ANNUAL CONSUMPTION Source: Forisk, September 2016. As of 6/30/2016. 0 5 10 15 20 25 30 Q315 - Q216 2025 Base 2025 High Pulpwood Pine Grade Forecast Scenarios Current DEMAND Market Overview • Deep and diversified mill market • Top tier pine pulpwood market • Ability to capture export pricing Million Tons

S O U T H C E N T R A L – 3 2 2 , 2 0 0 A C R E S 28 COMPANY UPDATE | FOURTH QUARTER 2016 NC SC # of Mills Consumption (millions tons) Pulpwood 52 7.0 Pine grade 94 6.1 Total 146 13.1 ANNUAL CONSUMPTION Source: Forisk, September 2016. As of 6/30/2016. 0 2 4 6 8 10 12 14 16 18 Q315 - Q216 2025 Base 2025 High Pulpwood Pine Grade Forecast Scenarios Current DEMAND Market Overview • Well capitalized mills • Exposure to high value pulp/paper end-use products • CatchMark has significant market presence Million Tons

S O U T H W E S T – 5 6 , 9 0 0 A C R E S 29 COMPANY UPDATE | FOURTH QUARTER 2016 NC SC # of Mills Consumption (millions tons) Pulpwood 34 11.7 Pine grade 82 9.3 Total 116 21.0 ANNUAL CONSUMPTION Source: Forisk, September 2016. As of 6/30/2016. 0 5 10 15 20 25 30 Q315 - Q216 2025 Base 2025 High Pulpwood Pine Grade Million Tons Forecast Scenarios Current DEMAND Market Overview • Low volatility • Steady price/demand growth • Strong upside in pricing driven by consumption growth

30 Capital Position
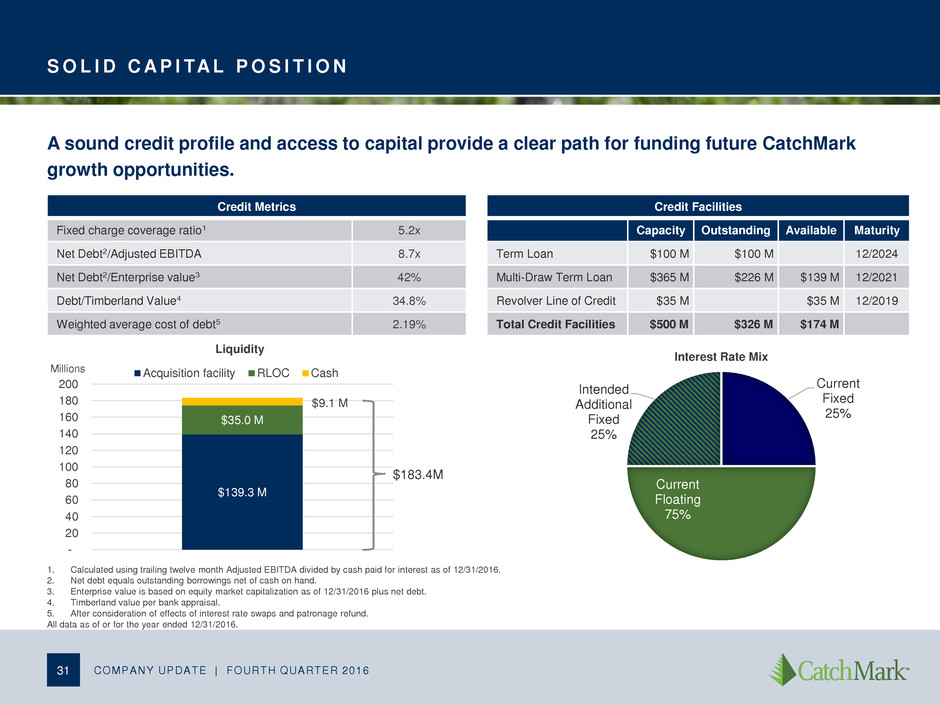
S O L I D C A P I TA L P O S I T I O N COMPANY UPDATE | FOURTH QUARTER 2016 31 Credit Metrics Fixed charge coverage ratio1 5.2x Net Debt2/Adjusted EBITDA 8.7x Net Debt2/Enterprise value3 42% Debt/Timberland Value4 34.8% Weighted average cost of debt5 2.19% A sound credit profile and access to capital provide a clear path for funding future CatchMark growth opportunities. 1. Calculated using trailing twelve month Adjusted EBITDA divided by cash paid for interest as of 12/31/2016. 2. Net debt equals outstanding borrowings net of cash on hand. 3. Enterprise value is based on equity market capitalization as of 12/31/2016 plus net debt. 4. Timberland value per bank appraisal. 5. After consideration of effects of interest rate swaps and patronage refund. All data as of or for the year ended 12/31/2016. Current Fixed 25% Current Floating 75% Intended Additional Fixed 25% Interest Rate Mix Credit Facilities Capacity Outstanding Available Maturity Term Loan $100 M $100 M 12/2024 Multi-Draw Term Loan $365 M $226 M $139 M 12/2021 Revolver Line of Credit $35 M $35 M 12/2019 Total Credit Facilities $500 M $326 M $174 M $139.3 M $35.0 M $9.1 M - 20 40 60 80 100 120 140 160 180 200 Acquisition facility RLOC CashMillions Liquidity $183.4M

H I G H E S T D I V I D E N D Y I E L D I N S E C T O R W I T H S U P E R I O R R I S K - A D J U S T E D C O V E R A G E • CatchMark’s dividend distributions consistently have been covered by cash available for distributions2 since its IPO. • Dividends from timber REITs generally receive capital gains treatment. • 100% of CatchMark’s dividends were treated as return of capital for 2016, largely due to non-cash depletion expense deduction. • Sustainable harvest volumes from acquisitions and/or lasting product price appreciations support dividend growth. 32 COMPANY UPDATE | FOURTH QUARTER 2016 2016 Tax Treatment CTT RYN2 PCH WY Dividend Yield (before tax)1 4.8% 3.8% 3.6% 4.1% % Return of Capital 100% 0% 0% 0% % Capital Gain 0% 100% 100% 100% % Ordinary Income 0% 0% 0% 0% Dividend Yield (after tax)1 4.8% 3.0% 2.9% 3.3% 1. Calculated with close price on 12/30/2016. 2. Cash Available for Distributions (CAD) is a non-GAAP measure. See Appendix for our reconciliation to CAD. CatchMark registered the highest dividend yield among timber REITs. Coupled with tax advantages, the dividend yields outpaced the company’s peers by over 45%. CAD2 Payout Ratio 2014 2015 2016 CTT 73% 74% 74% RYN 276% 106% 85% WY 66% 105% 275% PCH 58% 132% 63%
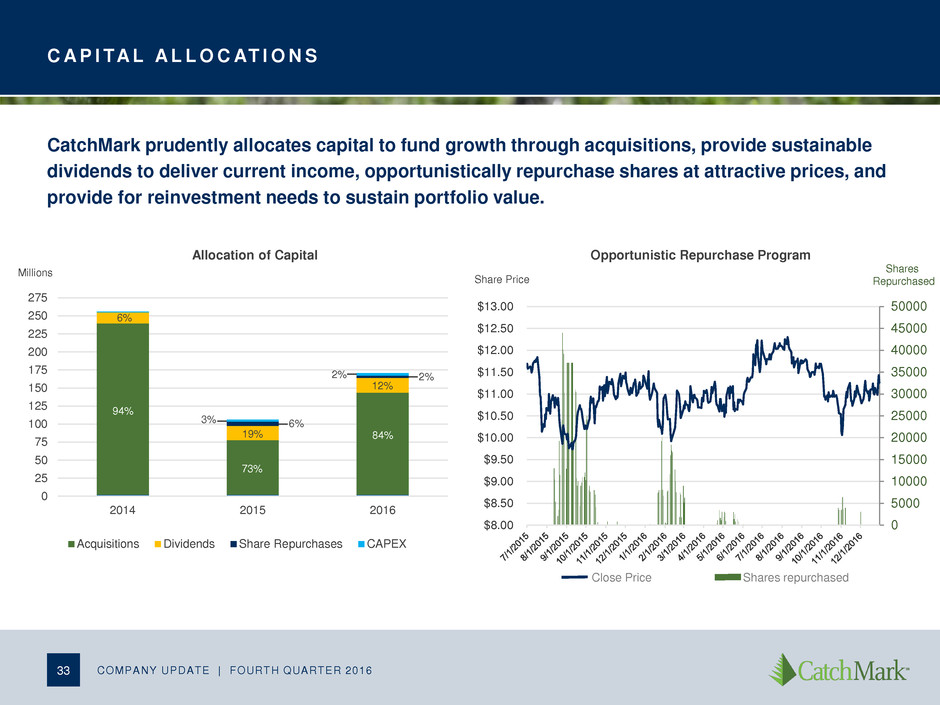
Share Price C A P I TA L A L L O C AT I O N S 33 COMPANY UPDATE | FOURTH QUARTER 2016 0 25 50 75 100 125 150 175 200 225 250 275 2014 2015 2016 Acquisitions Dividends Share Repurchases CAPEX Millions Allocation of Capital 94% 6% 73% 19% 6% 3% 2% 2% 84% 12% Opportunistic Repurchase Program Shares Repurchased CatchMark prudently allocates capital to fund growth through acquisitions, provide sustainable dividends to deliver current income, opportunistically repurchase shares at attractive prices, and provide for reinvestment needs to sustain portfolio value. 0 5000 10000 15000 20000 25000 30000 35000 40000 45000 50000 $8.00 $8.50 $9.00 $9.50 $10.00 $10.50 $11.00 $11.50 $12.00 $12.50 $13.00 Close Price Shares repurchased
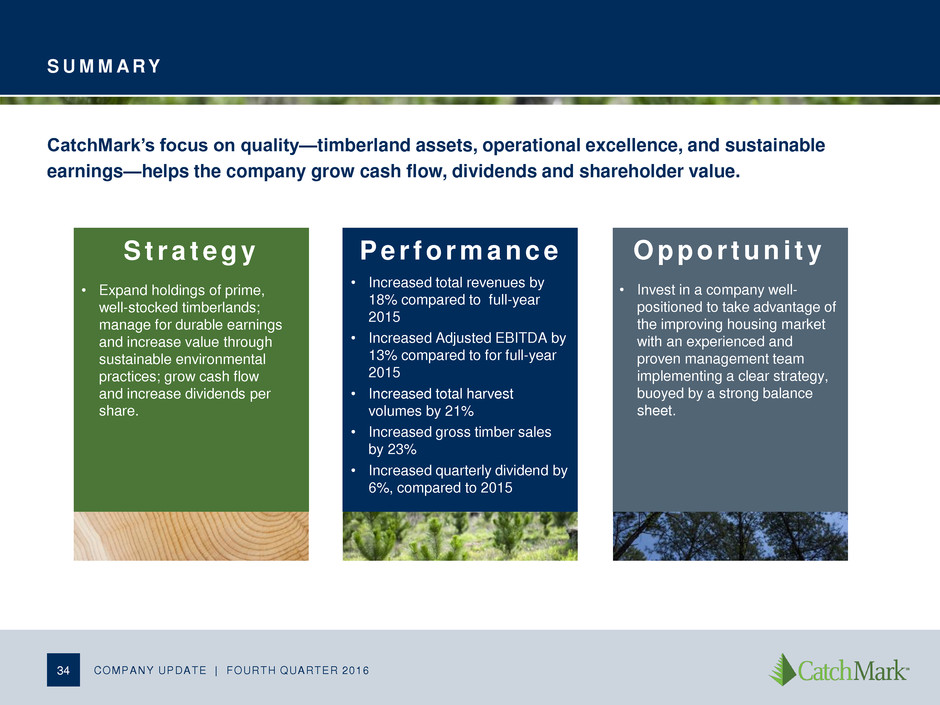
S U M M A R Y CatchMark’s focus on quality—timberland assets, operational excellence, and sustainable earnings—helps the company grow cash flow, dividends and shareholder value. S t r a t e g y • Expand holdings of prime, well-stocked timberlands; manage for durable earnings and increase value through sustainable environmental practices; grow cash flow and increase dividends per share. P e r f o r m a n c e • Increased total revenues by 18% compared to full-year 2015 • Increased Adjusted EBITDA by 13% compared to for full-year 2015 • Increased total harvest volumes by 21% • Increased gross timber sales by 23% • Increased quarterly dividend by 6%, compared to 2015 O p p o r t u n i t y • Invest in a company well- positioned to take advantage of the improving housing market with an experienced and proven management team implementing a clear strategy, buoyed by a strong balance sheet. 34 COMPANY UPDATE | FOURTH QUARTER 2016
35 Appendix

S U S TA I N A B L E F O R E S T R Y I N I T I AT I V E C E R T I F I C AT I O N CatchMark SFI Implementation Program • Forest management planning • Forest health and productivity • Protection and maintenance of water resources • Conservation and biological diversity • Management of visual quality and recreational benefits • Protection of special sites • Efficient use of fiber resources • Recognize and respect indigenous people’s rights • Legal and regulatory compliance • Forestry research, science, and technology • Training and education • Community involvement and landowner outreach • Public land management responsibilities • Communications and public reporting • Management review 36 COMPANY UPDATE | FOURTH QUARTER 2016 * SFI Re-certification Audit (2015) and Surveillance Audit (2016) “CatchMark has developed a program that continues to meet the requirements of the SFIS 2015-2019 Forest Management Edition” *
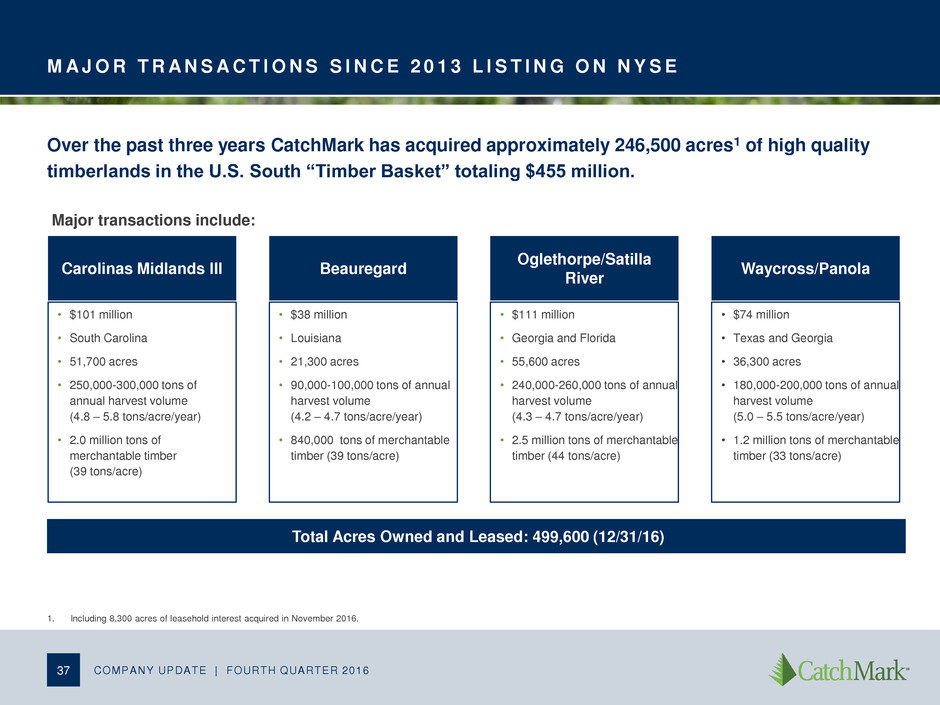
M A J O R T R A N S A C T I O N S S I N C E 2 0 1 3 L I S T I N G O N N Y S E 37 COMPANY UPDATE | FOURTH QUARTER 2016 Over the past three years CatchMark has acquired approximately 246,500 acres1 of high quality timberlands in the U.S. South “Timber Basket” totaling $455 million. Carolinas Midlands III • $101 million • South Carolina • 51,700 acres • 250,000-300,000 tons of annual harvest volume (4.8 – 5.8 tons/acre/year) • 2.0 million tons of merchantable timber (39 tons/acre) Beauregard • $38 million • Louisiana • 21,300 acres • 90,000-100,000 tons of annual harvest volume (4.2 – 4.7 tons/acre/year) • 840,000 tons of merchantable timber (39 tons/acre) Oglethorpe/Satilla River • $111 million • Georgia and Florida • 55,600 acres • 240,000-260,000 tons of annual harvest volume (4.3 – 4.7 tons/acre/year) • 2.5 million tons of merchantable timber (44 tons/acre) Waycross/Panola • $74 million • Texas and Georgia • 36,300 acres • 180,000-200,000 tons of annual harvest volume (5.0 – 5.5 tons/acre/year) • 1.2 million tons of merchantable timber (33 tons/acre) Total Acres Owned and Leased: 499,600 (12/31/16) Major transactions include: 1. Including 8,300 acres of leasehold interest acquired in November 2016.

A D J U S T E D E B I T D A COMPANY UPDATE | FOURTH QUARTER 2016 38 Earnings from Continuing Operations before Interest, Taxes, Depletion, and Amortization (“EBITDA”) is a non-GAAP measure of operating performance. EBITDA is defined by the SEC; however, we have excluded certain other expenses due to their non-cash nature, and we refer to this measure as Adjusted EBITDA. As such, our Adjusted EBITDA may not be comparable to similarly titled measures reported by other companies and should not be viewed as an alternative to net income or cash from operations as measurements of our operating performance. Due to the significant amount of timber assets subject to depletion and the significant amount of financing subject to interest and amortization expense, management considers Adjusted EBITDA to be an important measure of our financial condition and performance. Our credit agreements contain a minimum debt service coverage ratio based, in part, on Adjusted EBITDA since this measure is representative of adjusted income available for interest payments.
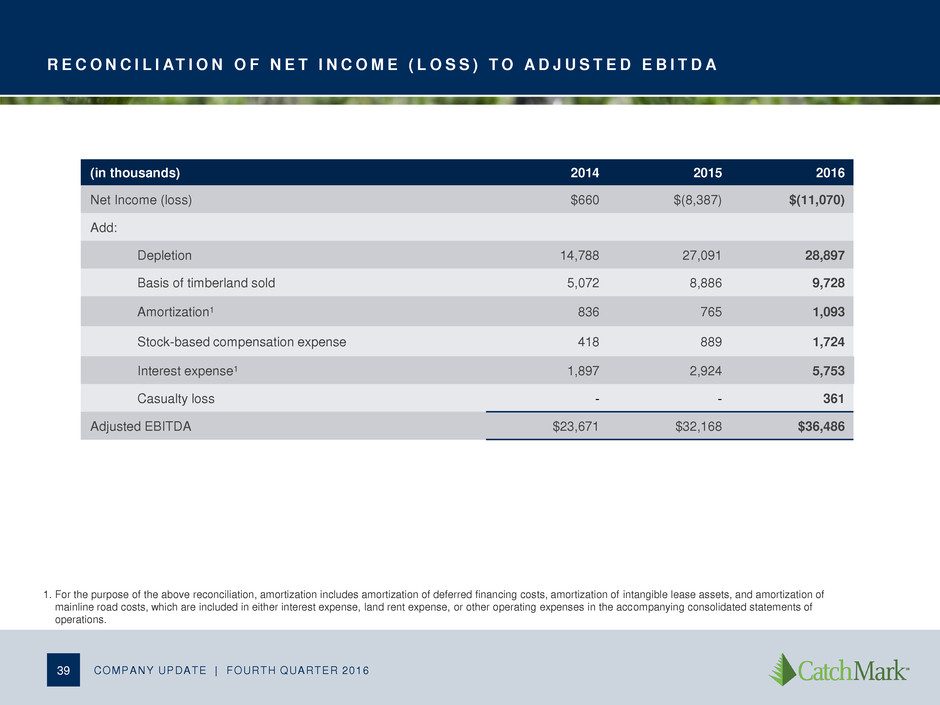
R E C O N C I L I AT I O N O F N E T I N C O M E ( L O S S ) T O A D J U S T E D E B I T D A COMPANY UPDATE | FOURTH QUARTER 2016 39 1. For the purpose of the above reconciliation, amortization includes amortization of deferred financing costs, amortization of intangible lease assets, and amortization of mainline road costs, which are included in either interest expense, land rent expense, or other operating expenses in the accompanying consolidated statements of operations. (in thousands) 2014 2015 2016 Net Income (loss) $660 $(8,387) $(11,070) Add: Depletion 14,788 27,091 28,897 Basis of timberland sold 5,072 8,886 9,728 Amortization1 836 765 1,093 Stock-based compensation expense 418 889 1,724 Interest expense1 1,897 2,924 5,753 Casualty loss - - 361 Adjusted EBITDA $23,671 $32,168 $36,486
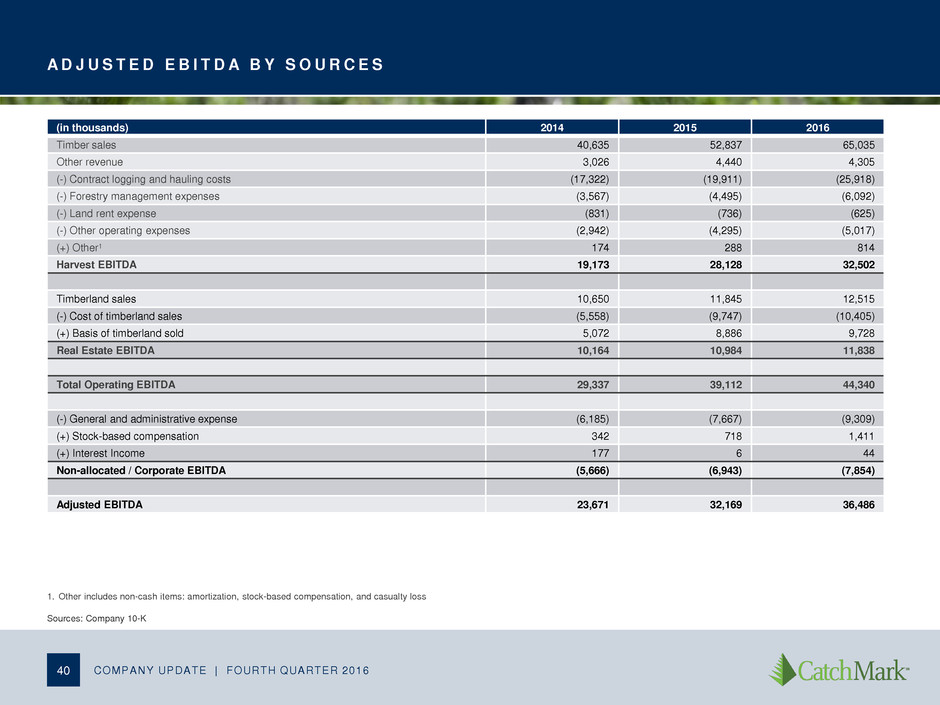
A D J U S T E D E B I T D A B Y S O U R C E S COMPANY UPDATE | FOURTH QUARTER 2016 40 (in thousands) 2014 2015 2016 Timber sales 40,635 52,837 65,035 Other revenue 3,026 4,440 4,305 (-) Contract logging and hauling costs (17,322) (19,911) (25,918) (-) Forestry management expenses (3,567) (4,495) (6,092) (-) Land rent expense (831) (736) (625) (-) Other operating expenses (2,942) (4,295) (5,017) (+) Other1 174 288 814 Harvest EBITDA 19,173 28,128 32,502 Timberland sales 10,650 11,845 12,515 (-) Cost of timberland sales (5,558) (9,747) (10,405) (+) Basis of timberland sold 5,072 8,886 9,728 Real Estate EBITDA 10,164 10,984 11,838 Total Operating EBITDA 29,337 39,112 44,340 (-) General and administrative expense (6,185) (7,667) (9,309) (+) Stock-based compensation 342 718 1,411 (+) Interest Income 177 6 44 Non-allocated / Corporate EBITDA (5,666) (6,943) (7,854) Adjusted EBITDA 23,671 32,169 36,486 1. Other includes non-cash items: amortization, stock-based compensation, and casualty loss Sources: Company 10-K
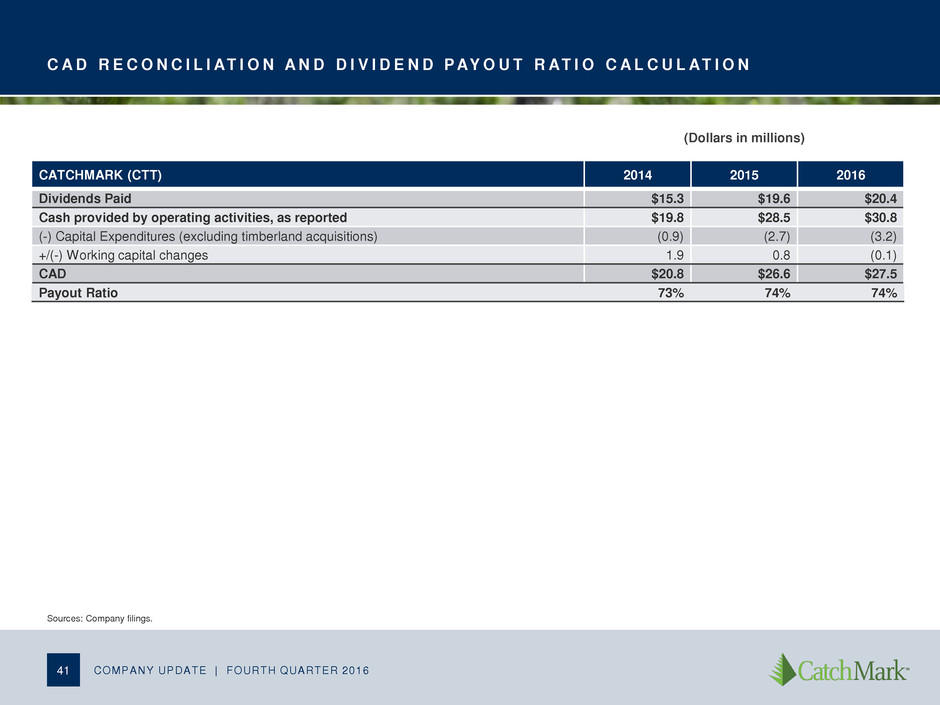
C A D R E C O N C I L I AT I O N A N D D I V I D E N D P AY O U T R AT I O C A L C U L AT I O N COMPANY UPDATE | FOURTH QUARTER 2016 41 Sources: Company filings. (Dollars in millions) CATCHMARK (CTT) 2014 2015 2016 Dividends Paid $15.3 $19.6 $20.4 Cash provided by operating activities, as reported $19.8 $28.5 $30.8 (-) Capital Expenditures (excluding timberland acquisitions) (0.9) (2.7) (3.2) +/(-) Working capital changes 1.9 0.8 (0.1) CAD $20.8 $26.6 $27.5 Payout Ratio 73% 74% 74%

C A D R E C O N C I L I AT I O N A N D D I V I D E N D P AY O U T R AT I O C A L C U L AT I O N COMPANY UPDATE | FOURTH QUARTER 2016 42 1. Weyerhaeuser's 2014 and 2015 numbers were calculate from its Form 10-K filed in 2015. 2. For 2014, Other includes $21.4M adjustment for large dispositions and $102.4M adjustment for cash flows from discontinued operations, as reported in Rayonier’s 2016 Form 10K. Sources: Company filings (Dollars in millions) WEYERHAEUSER (WY) 20141 20151 2016 Dividends Paid $563 $619 $932 Cash provided by operating activities, as reported $1,088 $1,064 $735 (-) Capital Expenditures (excluding timberland acquisitions) (395) (483) (510) +/(-) Working capital changes 160 10 (129) (+) Incomes taxes paid for discontinued operations - - 243 CAD $853 $591 $339 Payout Ratio 66% 105% 275% RAYONIER (RYN) 2014 2015 2016 Dividends Paid $257.5 $124.9 $122.8 Cash provided by operating activities, as reported $320.4 $177.2 $203.8 (-) Capital Expenditures (excluding timberland acquisitions) (63.7) (57.3) (58.7) (-) Working capital changes (39.5) (2.5) (0.8) (-) Other2 (123.8) - - CAD $93.4 $117.4 $144.2 Payout Ratio 276% 106% 85% POTLATCH (PCH) 2014 2015 2016 Dividends Paid $57.8 $61.0 $60.8 Cash provided by operating activities, as reported $131.4 $74.0 $102.1 (-) Capital Expenditures (excluding timberland acquisitions) (24.2) (32.7) (19.3) +/(-) Working capital changes (7.2) 4.8 13.8 CAD $100.0 $46.1 $96.6 Payout Ratio 58% 132% 63%