PRIME TIMBERLANDS HIGH-DEMAND MILL MARKETS SUPERIOR MANAGEMENT GROWTH STRATEGY October 15, 2021
FORWARD-LOOKING STATEMENTS This presentation contains forward-looking statements within the meaning of Section 27A of the Securities Act of 1933 and Section 21E of the Securities Exchange Act of 1934, as amended. Such forward-looking statements can generally be identified by our use of forward-looking terminology such as "may," "will," "expect," "intend," “should,” "anticipate," "estimate," "believe," "continue," or other similar words. However, the absence of these or similar words or expressions does not mean that a statement is not forward-looking. Forward-looking statements are not guarantees of performance and are based on certain assumptions, discuss future expectations, describe plans and strategies, contain projections of results of operations or of financial condition or state other forward-looking information. Forward-looking statements in this presentation include, but are not limited to, our expectations about future growth of Adjusted EBITDA and net asset value, acquisition strategies, land sale strategies, and sources of Adjusted EBITDA including environmental initiatives, non-GAAP reconciliations, and projections of our liquidity, leverage and balance sheet. Risks and uncertainties that could cause our actual results to differ from these forward-looking statements include, but are not limited to, that (i) the supply of timberlands available for acquisition that meet our investment criteria may be less than we currently anticipate; (ii) we may be unsuccessful in winning bids for timberland that are sold through an auction process; (iii) we may not be able to access external sources of capital at attractive rates or at all; (iv) potential increases in interest rates could have a negative impact on our business; (v) timber prices may not increase at the rate we currently anticipate or could decline, which would negatively impact our revenues; (vi) we may not generate the harvest volumes from our timberlands that we currently anticipate; (vii) the demand for our timber may not increase at the rate we currently anticipate or could decline due to changes in general economic and business conditions in the geographic regions where our timberlands are located, including as a result of the COVID-19 pandemic and the measures taken as a response thereto; (viii) a downturn in the real estate market, including decreases in demand and valuations, may adversely impact our ability to generate income and cash flow from sales of higher-and-better use properties; (ix) we may not be able to make large dispositions of timberland in capital recycling transactions at prices that are attractive to us or at all; (x) our dividends are not guaranteed and are subject to change; (xi) the markets for carbon sequestration credits, wetlands mitigation banking and solar projects are still developing and we maybe unsuccessful in generating the revenues from environmental initiatives that we currently expect or in the timeframe anticipated; (xii) our share repurchase program may not be successful in improving stockholder value over the long-term; (xiii) our joint venture strategy may not enable us to access non-dilutive capital and enhance our ability to make acquisitions; and (xiv) the factors described in Part I, Item 1A. Risk Factors of our Annual Report on Form 10-K for the year ended December 31, 2020 and our other filings with the Securities and Exchange Commission. Accordingly, readers are cautioned not to place undue reliance on these forward-looking statements, which speak only as of the date of this press release. We undertake no obligation to update our forward- looking statements, except as required by law. 2
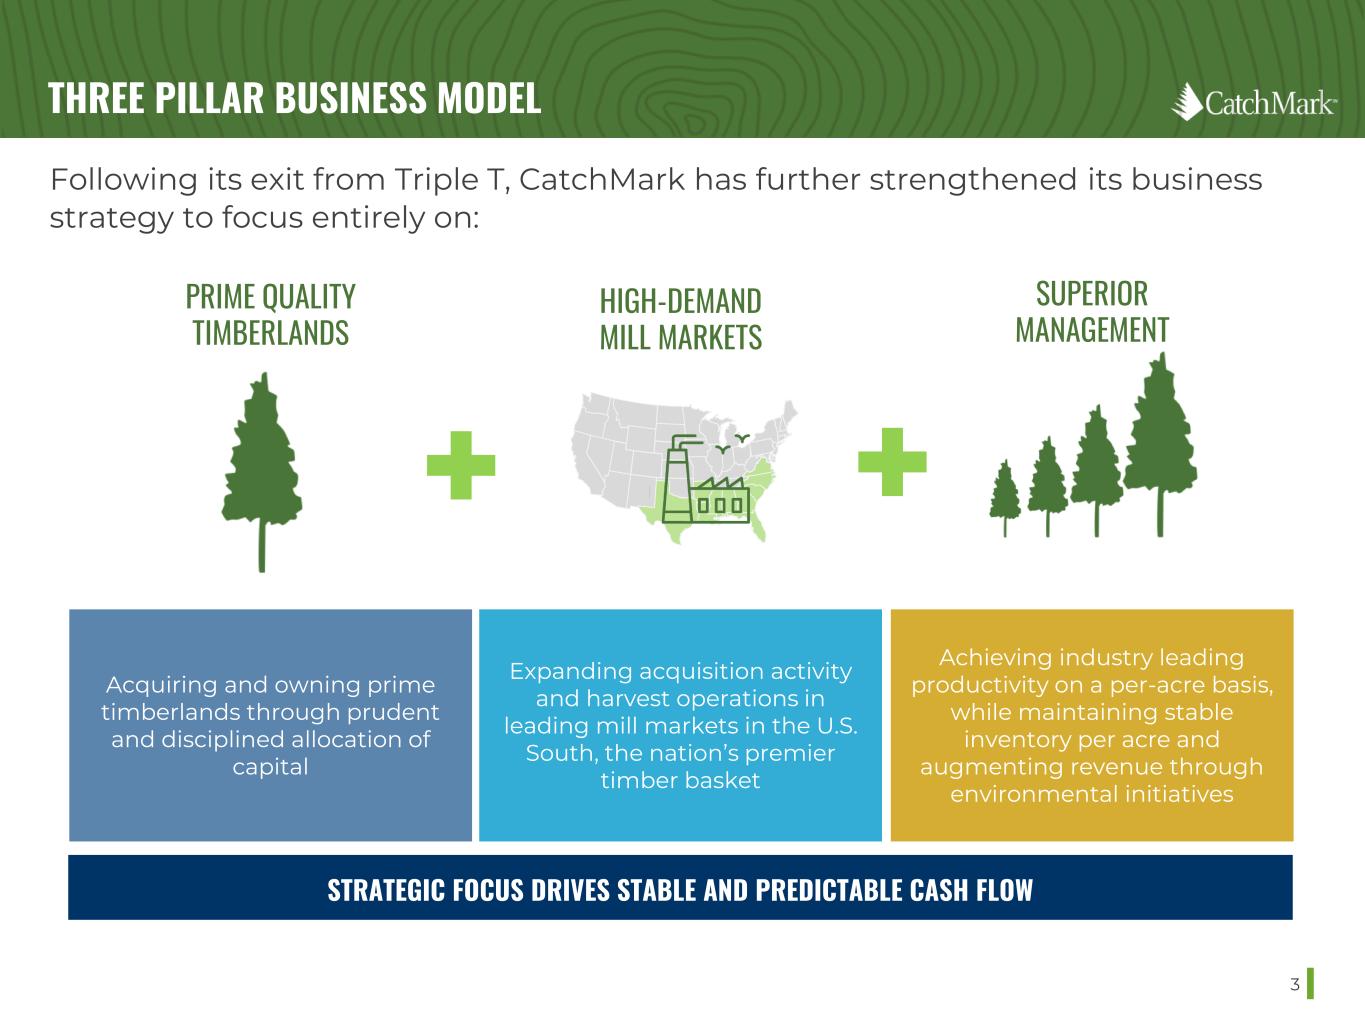
THREE PILLAR BUSINESS MODEL 3 Following its exit from Triple T, CatchMark has further strengthened its business strategy to focus entirely on: PRIME QUALITY TIMBERLANDS HIGH-DEMAND MILL MARKETS SUPERIOR MANAGEMENT Acquiring and owning prime timberlands through prudent and disciplined allocation of capital Expanding acquisition activity and harvest operations in leading mill markets in the U.S. South, the nation’s premier timber basket Achieving industry leading productivity on a per-acre basis, while maintaining stable inventory per acre and augmenting revenue through environmental initiatives STRATEGIC FOCUS DRIVES STABLE AND PREDICTABLE CASH FLOW
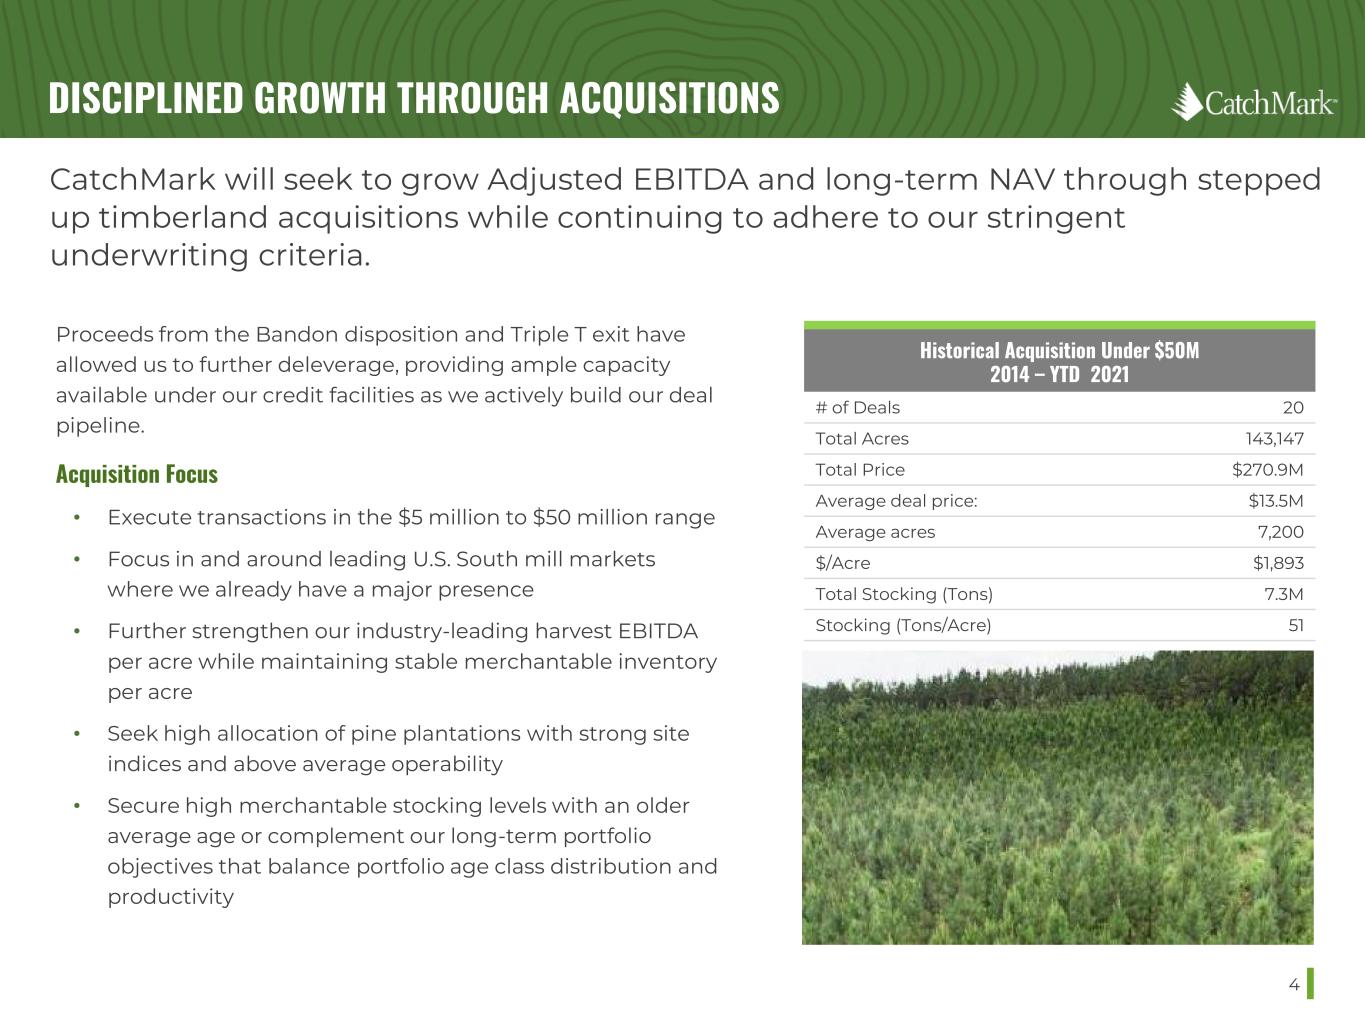
DISCIPLINED GROWTH THROUGH ACQUISITIONS Acquisition Focus • Execute transactions in the $5 million to $50 million range • Focus in and around leading U.S. South mill markets where we already have a major presence • Further strengthen our industry-leading harvest EBITDA per acre while maintaining stable merchantable inventory per acre • Seek high allocation of pine plantations with strong site indices and above average operability • Secure high merchantable stocking levels with an older average age or complement our long-term portfolio objectives that balance portfolio age class distribution and productivity 4 CatchMark will seek to grow Adjusted EBITDA and long-term NAV through stepped up timberland acquisitions while continuing to adhere to our stringent underwriting criteria. Historical Acquisition Under $50M 2014 – YTD 2021 # of Deals 20 Total Acres 143,147 Total Price $270.9M Average deal price: $13.5M Average acres 7,200 $/Acre $1,893 Total Stocking (Tons) 7.3M Stocking (Tons/Acre) 51 Proceeds from the Bandon disposition and Triple T exit have allowed us to further deleverage, providing ample capacity available under our credit facilities as we actively build our deal pipeline.
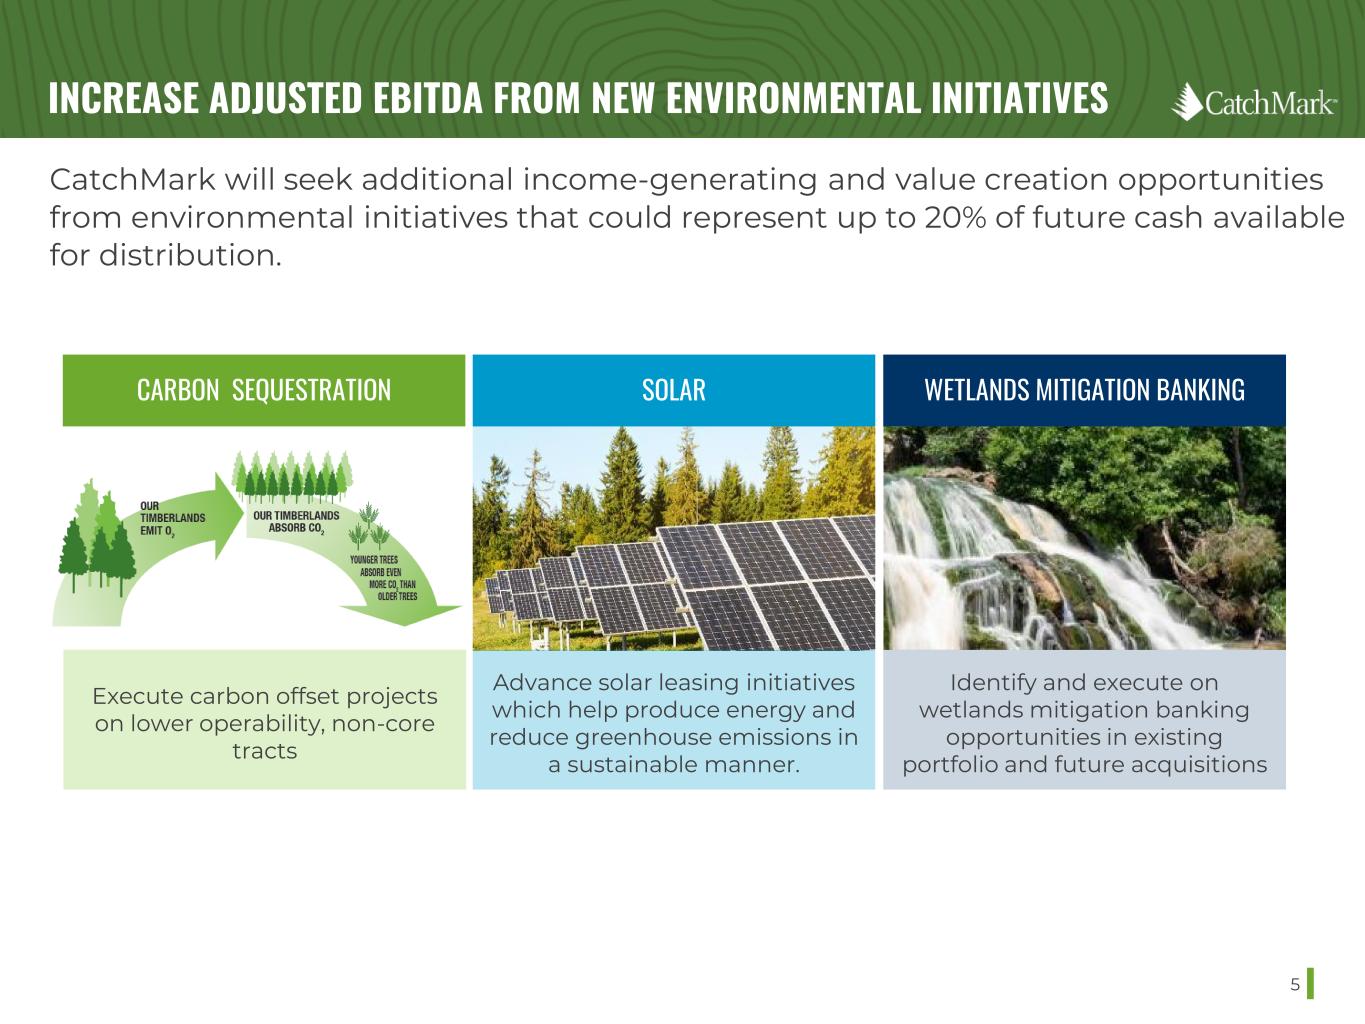
INCREASE ADJUSTED EBITDA FROM NEW ENVIRONMENTAL INITIATIVES 5 CatchMark will seek additional income-generating and value creation opportunities from environmental initiatives that could represent up to 20% of future cash available for distribution. CARBON SEQUESTRATION SOLAR WETLANDS MITIGATION BANKING Execute carbon offset projects on lower operability, non-core tracts Advance solar leasing initiatives which help produce energy and reduce greenhouse emissions in a sustainable manner. Identify and execute on wetlands mitigation banking opportunities in existing portfolio and future acquisitions
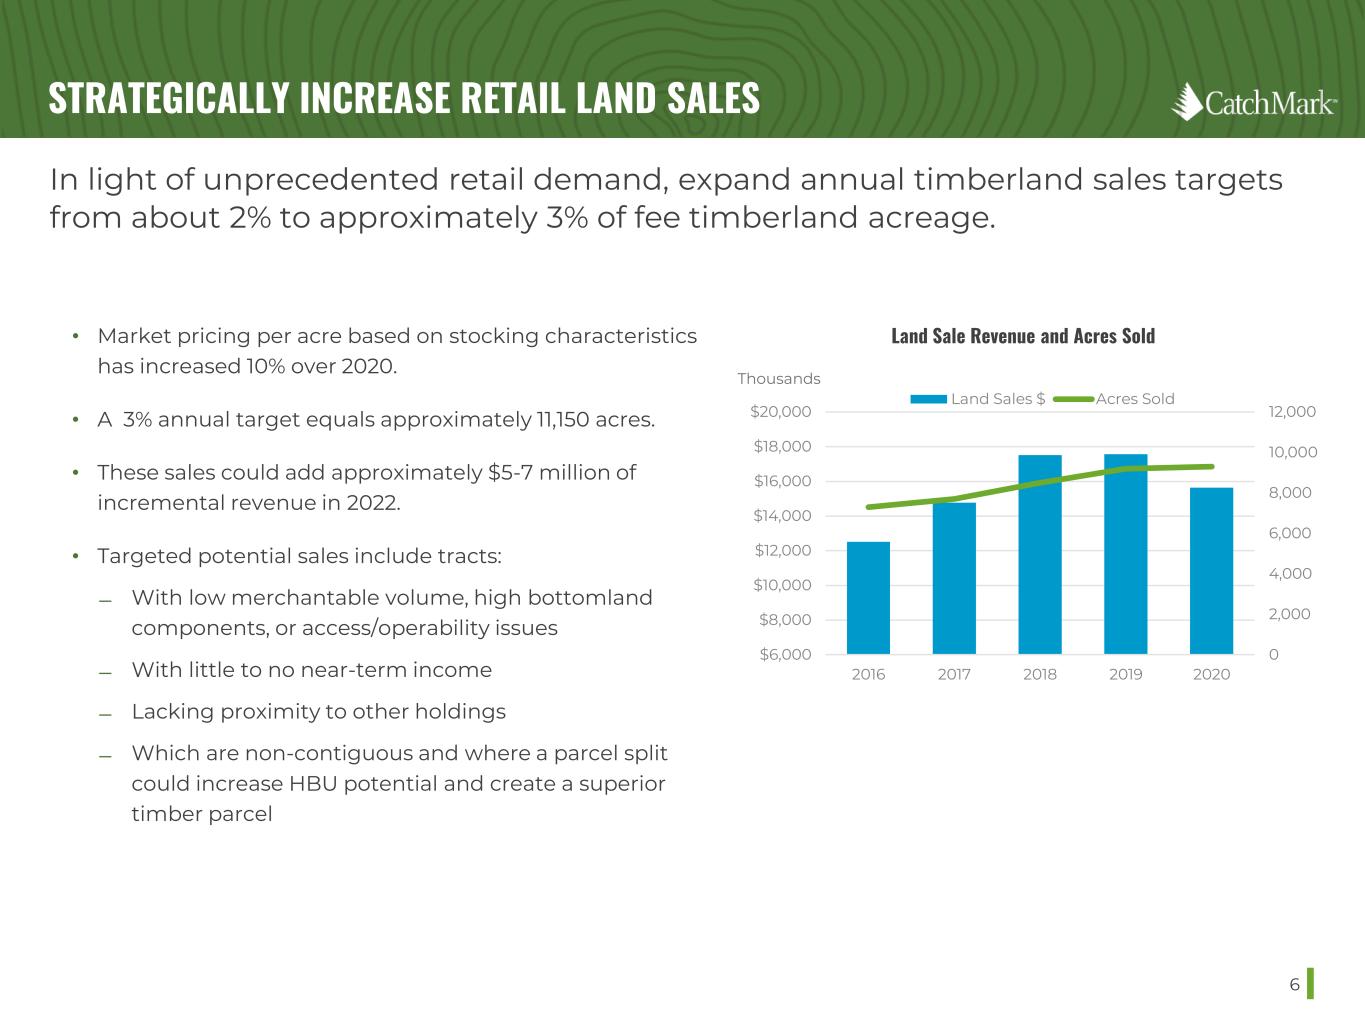
STRATEGICALLY INCREASE RETAIL LAND SALES 6 • Market pricing per acre based on stocking characteristics has increased 10% over 2020. • A 3% annual target equals approximately 11,150 acres. • These sales could add approximately $5-7 million of incremental revenue in 2022. • Targeted potential sales include tracts: ̶ With low merchantable volume, high bottomland components, or access/operability issues ̶ With little to no near-term income ̶ Lacking proximity to other holdings ̶ Which are non-contiguous and where a parcel split could increase HBU potential and create a superior timber parcel In light of unprecedented retail demand, expand annual timberland sales targets from about 2% to approximately 3% of fee timberland acreage. 0 2,000 4,000 6,000 8,000 10,000 12,000 $6,000 $8,000 $10,000 $12,000 $14,000 $16,000 $18,000 $20,000 2016 2017 2018 2019 2020 Land Sales $ Acres Sold Land Sale Revenue and Acres Sold Thousands
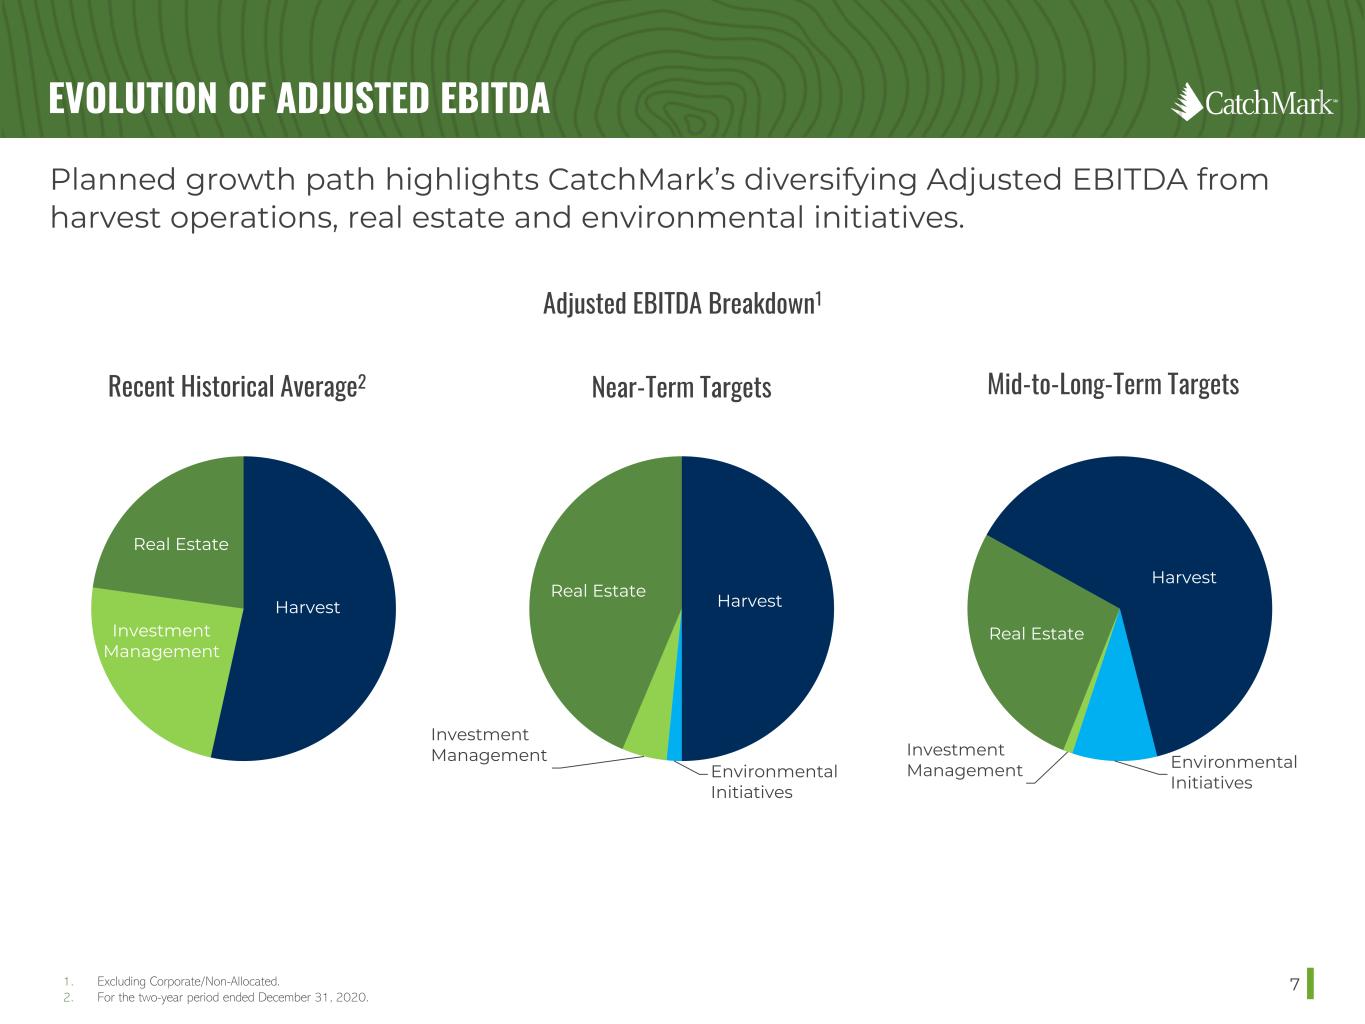
EVOLUTION OF ADJUSTED EBITDA 7 Planned growth path highlights CatchMark’s diversifying Adjusted EBITDA from harvest operations, real estate and environmental initiatives. 1. Excluding Corporate/Non-Allocated. 2. For the two-year period ended December 31, 2020. Adjusted EBITDA Breakdown1 Harvest Investment Management Real Estate Harvest Environmental Initiatives Investment Management Real Estate Recent Historical Average2 Near-Term Targets Mid-to-Long-Term Targets Harvest Environmental Initiatives Investment Management Real Estate

SOLID CAPITAL POSITION 8 CatchMark’s stronger balance sheet, solid capital position, ample liquidity and significantly lower leverage support ongoing operations and growth initiatives. $0 $50 $100 $150 $200 $250 $300 Acquisition facilities LOC Cash $275.9M Millions Liquidity $218.6M $35M $22.3M Credit Facilities and Maturity Schedule7 Total Credit Facilities of $553.6 Million Weighted-Average Life of Outstanding Debt is 4.1 YearsMillions $150M Acquisition Facility $35M LOC $68.6M Term Loan $84.7M Term Loan $125.6M Term Loan $89.7M Term Loan $0 $50 $100 $150 $200 2021 2022 2023 2024 2025 2026 2027 Debt Available Outstanding No debt maturities until late 2024. Well-laddered maturity schedule. 1. Calculated using trailing twelve-month Adjusted EBITDA divided by trailing twelve-month cash paid for interest as of 6/30/2021. This calculation differs from the calculation of the fixed charge ratio covenant under our credit facilities and should not be viewed as an indication of compliance with such covenant. 2. Net debt equals outstanding borrowings as of 10/15/2021 net of cash on hand as of 6/30/2021. 3. Trailing twelve-month Adjusted EBITDA as of 6/30/2021. 4. Adjusted EBITDA is a non-GAAP measure. See page 9 for the reconciliation of net income (loss) to Adjusted EBITDA. 5. Enterprise value is based on equity market capitalization as of 6/30/2021 plus net debt as of 10/15/2021. 6. After consideration of effects of interest rate swaps and patronage refund, as of 10/15/2021. 7. As of 10/15/2021. Credit Metrics Fixed charge coverage ratio1 5.1x Net Debt2/Adjusted EBITDA3,4 4.6x Net Debt2/Enterprise value5 33% Weighted average cost of debt6 2.92% Interest rate mix7 Fixed: 92% / Floating: 8% $0 $100 $200 $300 $400 $500 $600 9/30/18 12/31/2018 12/31/2019 12/31/2020 10/xx/21 Millions Southwest capital recycling disposition GA/AL capital recycling disposition GA capital recycling disposition Bandon and Oglethorpe capital recycling dispositions and TTT exit Significant Reduction in Leverage Reduced leverage by $260M or 45% since TTT and Bandon initial investments Post-TTT/ Bandon Investments
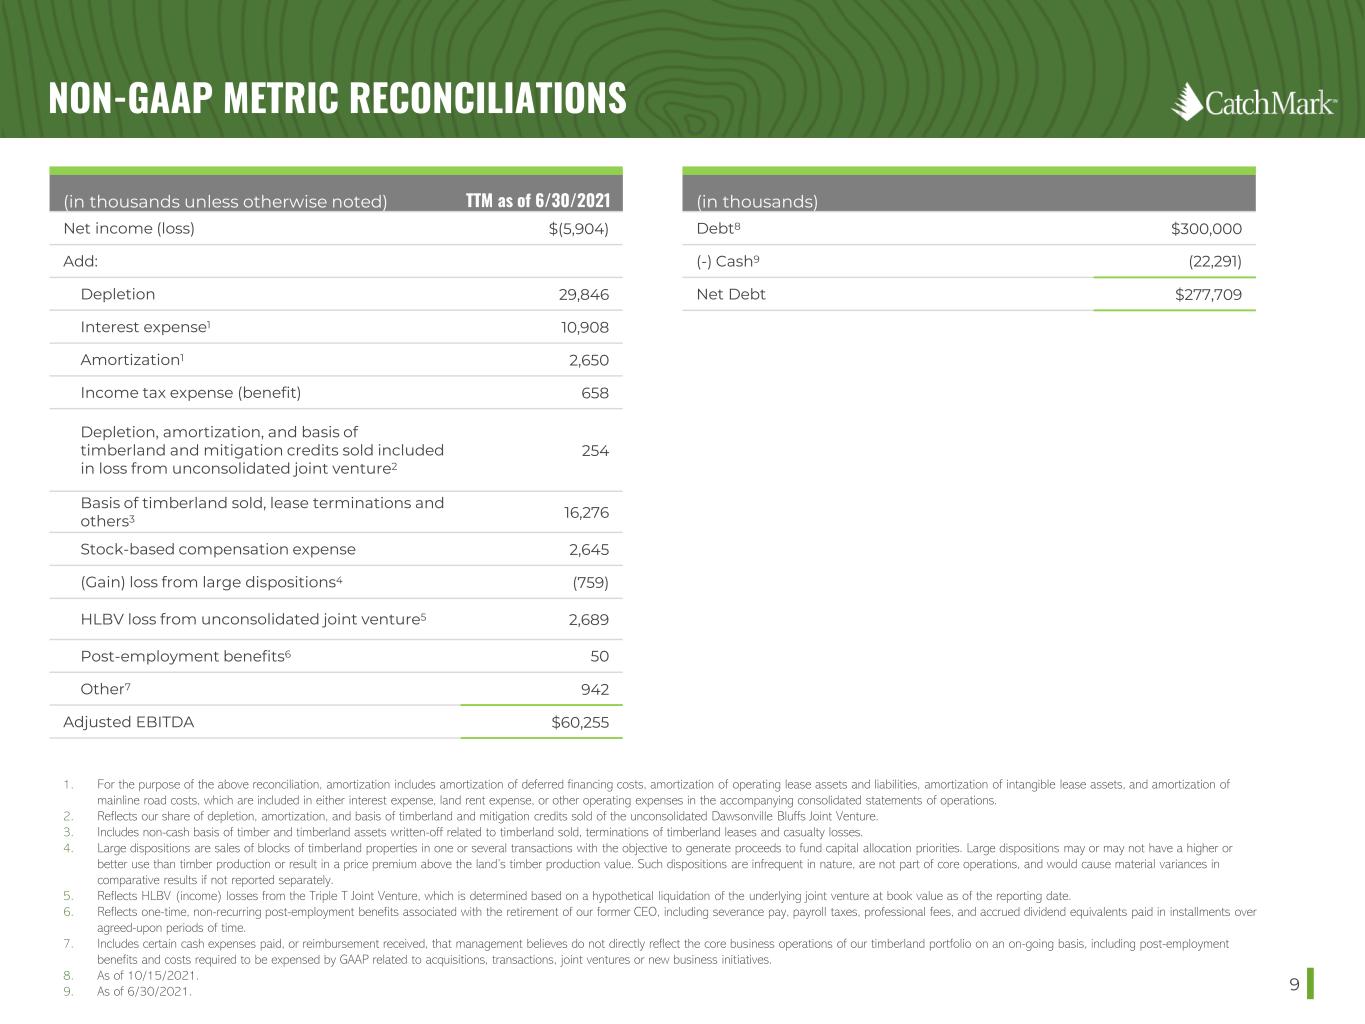
NON-GAAP METRIC RECONCILIATIONS 9 1. For the purpose of the above reconciliation, amortization includes amortization of deferred financing costs, amortization of operating lease assets and liabilities, amortization of intangible lease assets, and amortization of mainline road costs, which are included in either interest expense, land rent expense, or other operating expenses in the accompanying consolidated statements of operations. 2. Reflects our share of depletion, amortization, and basis of timberland and mitigation credits sold of the unconsolidated Dawsonville Bluffs Joint Venture. 3. Includes non-cash basis of timber and timberland assets written-off related to timberland sold, terminations of timberland leases and casualty losses. 4. Large dispositions are sales of blocks of timberland properties in one or several transactions with the objective to generate proceeds to fund capital allocation priorities. Large dispositions may or may not have a higher or better use than timber production or result in a price premium above the land’s timber production value. Such dispositions are infrequent in nature, are not part of core operations, and would cause material variances in comparative results if not reported separately. 5. Reflects HLBV (income) losses from the Triple T Joint Venture, which is determined based on a hypothetical liquidation of the underlying joint venture at book value as of the reporting date. 6. Reflects one-time, non-recurring post-employment benefits associated with the retirement of our former CEO, including severance pay, payroll taxes, professional fees, and accrued dividend equivalents paid in installments over agreed-upon periods of time. 7. Includes certain cash expenses paid, or reimbursement received, that management believes do not directly reflect the core business operations of our timberland portfolio on an on-going basis, including post-employment benefits and costs required to be expensed by GAAP related to acquisitions, transactions, joint ventures or new business initiatives. 8. As of 10/15/2021. 9. As of 6/30/2021. (in thousands unless otherwise noted) TTM as of 6/30/2021 Net income (loss) $(5,904) Add: Depletion 29,846 Interest expense1 10,908 Amortization1 2,650 Income tax expense (benefit) 658 Depletion, amortization, and basis of timberland and mitigation credits sold included in loss from unconsolidated joint venture2 254 Basis of timberland sold, lease terminations and others3 16,276 Stock-based compensation expense 2,645 (Gain) loss from large dispositions4 (759) HLBV loss from unconsolidated joint venture5 2,689 Post-employment benefits6 50 Other7 942 Adjusted EBITDA $60,255 (in thousands) Debt8 $300,000 (-) Cash9 (22,291) Net Debt $277,709


