Exhibit 99.2
| Investor Presentation Fourth Quarter 2019 |
| 2 Why Bridgewater Bank? Disclaimer Forward-Looking Statements This presentation contains “forward-looking statements” within the meaning of the safe harbor provisions of the U.S. Private Securities Litigation Reform Act of 1995. Forward-looking statements include, without limitation, statements concerning plans, estimates, calculations, forecasts and projections with respect to the anticipated future performance of Bridgewater Bancshares, Inc. (the “Company”). These statements are often, but not always, identified by words such as “may”, “might”, “should”, “could”, “predict”, “potential”, “believe”, “expect”, “continue”, “will”, “anticipate”, “seek”, “estimate”, “intend”, “plan”, “projection”, “would”, “annualized”, “target” and “outlook”, or the negative version of those words or other comparable words of a future or forward-looking nature. Forward-looking statements are neither historical facts nor assurances of future performance. Instead, they are based only on our current beliefs, expectations and assumptions regarding our business, future plans and strategies, projections, anticipated events and trends, the economy and other future conditions. Because forward-looking statements relate to the future, they are subject to inherent uncertainties, risks and changes in circumstances that are difficult to predict and many of which are outside of our control. Our actual results and financial condition may differ materially from those indicated in the forward-looking statements. Therefore, you should not rely on any of these forward-looking statements. Important factors that could cause our actual results and financial condition to differ materially from those indicated in the forward-looking statements include, among others, the following: the negative effects of the COVID-19 pandemic, including its effects on the economic environment, our clients and our operations, as well as any changes to federal, state or local government laws, regulations or orders in connection with the pandemic; loan concentrations in our portfolio; the overall health of the local and national real estate market; our ability to successfully manage credit risk; business and economic conditions generally and in the financial services industry, nationally and within our market area; our ability to maintain an adequate level of allowance for loan losses; new or revised accounting standards, including as a result of the future implementation of the Current Expected Credit Loss Standard; our high concentration of large loans to certain borrowers; our concentration of large deposits from certain clients; our ability to successfully manage liquidity risk; our dependence on non-core funding sources and our cost of funds; our ability to raise additional capital to implement our business plan; our ability to implement our growth strategy and manage costs effectively; developments and uncertainty related to the future use and availability of some reference rates; such as the London Interbank Offered Rate; as well as other alternative reference rates; the composition of our senior leadership team and our ability to attract and retain key personnel; the occurrence of fraudulent activity, breaches or failures of our information security controls or cybersecurity-related incidents; interruptions involving our information technology and telecommunications systems or third-party servicers; competition in the financial services industry; the effectiveness of our risk management framework; the commencement and outcome of litigation and other legal proceedings and regulatory actions against us; the impact of recent and future legislative and regulatory changes; interest rate risk; fluctuations in the values of the securities held in our securities portfolio; the imposition of tariffs or other governmental policies impacting the value of products produced by our commercial borrowers; severe weather, natural disasters, wide spread disease or pandemics (including the COVID-19 pandemic), acts of war or terrorism or other adverse external events; potential impairment to the goodwill we recorded in connection with our past acquisition; and any other risks described in the “Risk Factors” sections of reports and other documents filed by the Company with the Securities and Exchange Commission. Any forward-looking statement made by us in this presentation is based only on information currently available to us and speaks only as of the date on which it is made. We undertake no obligation to publicly update any forward-looking statement, whether written or oral, that may be made from time to time, whether as a result of new information, future developments or otherwise. Certain of the information contained in this presentation is derived from information provided by industry sources. Although we believe that such information is accurate and that the sources from which it has been obtained are reliable, we cannot guarantee the accuracy of, and have not independently verified, such information. Use of Non-GAAP financial measures In addition to the results presented in accordance with U.S. General Accepted Accounting Principles (“GAAP”), the Company routinely supplements its evaluation with an analysis of certain non-GAAP financial measures. The Company believes these non-GAAP financial measures, in addition to the related GAAP measures, provide meaningful information to investors to help them understand the Company’s operating performance and trends, and to facilitate comparisons with the performance of peers. These disclosures should not be viewed as a substitute for operating results determined in accordance with GAAP, nor are they necessarily comparable to non-GAAP performance measures that may be presented by other companies. Reconciliations of non-GAAP disclosures to the comparable GAAP measures are provided in this presentation. |
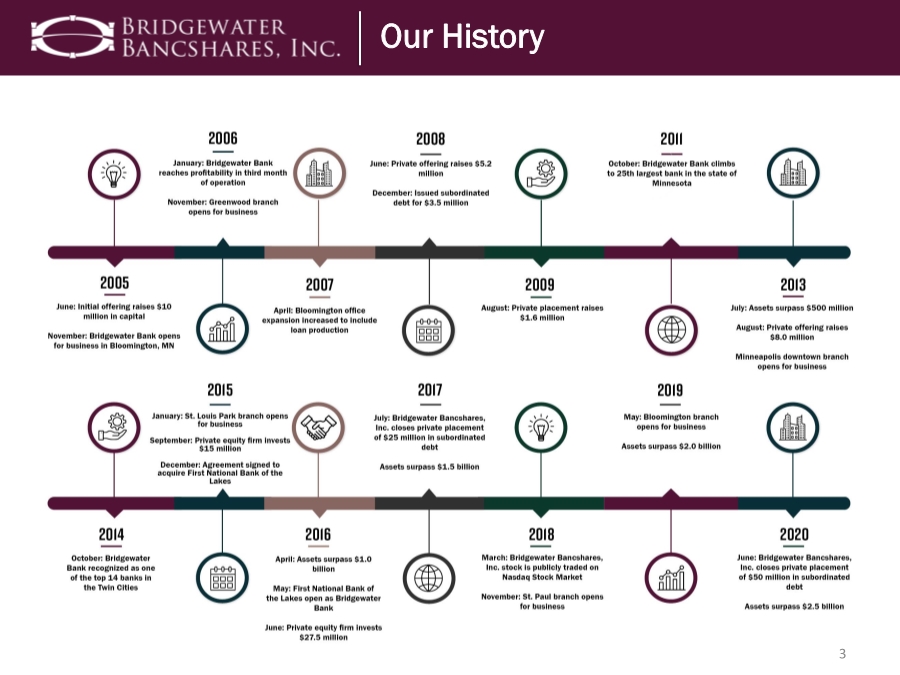
| 3 Our History |
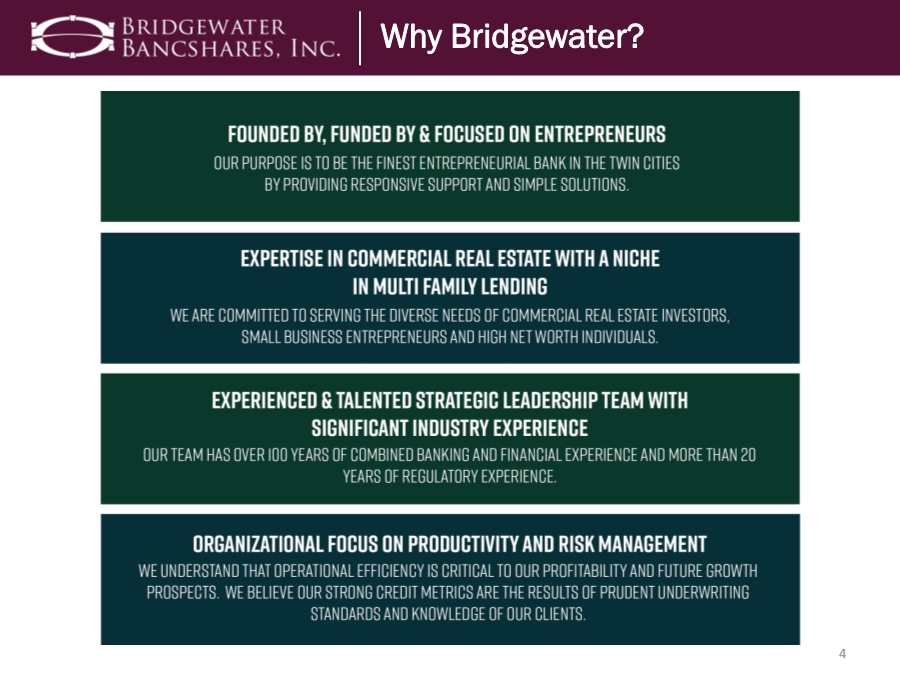
| 4 Why Bridgewater Bank? Why Bridgewater? |
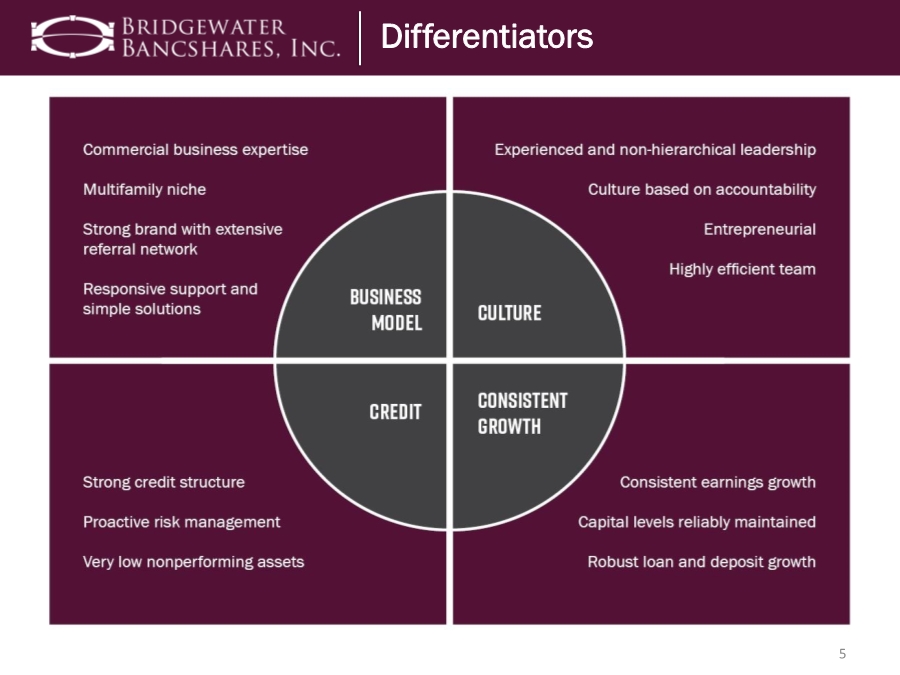
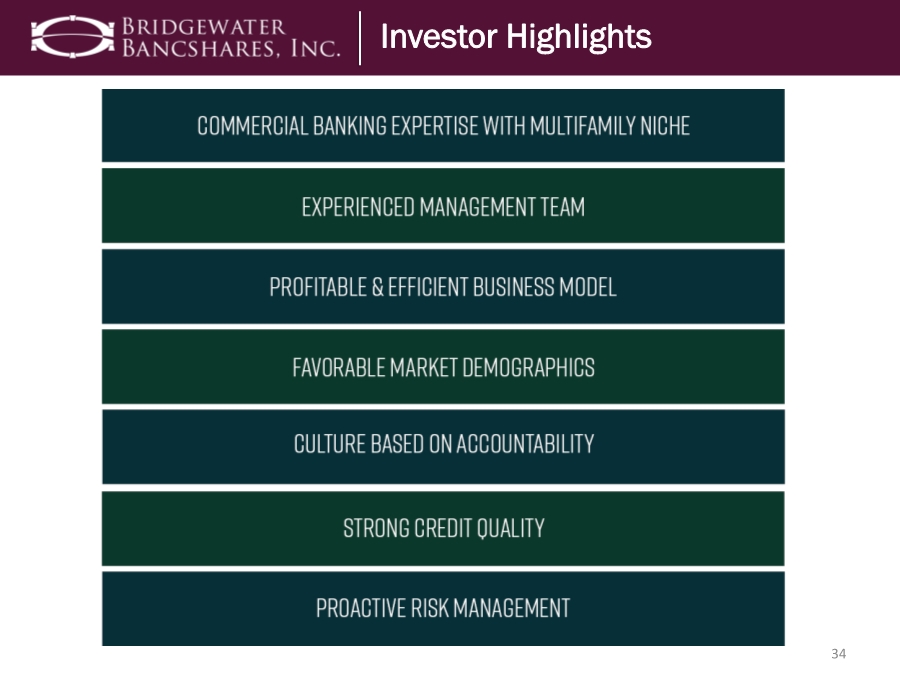
| Commercial business expertise Multifamily niche Efficient branch footprint Strong brand with extensive referral network Responsive support and simple solutions Experienced and non-hierarchical leadership Culture based on accountability Entrepreneurial Highly efficient team Very low nonperforming assets Strong credit culture Proactive risk management Robust loan and deposit growth Capital levels reliably maintained Consistent earnings growth 5 Differentiators Differentiators |
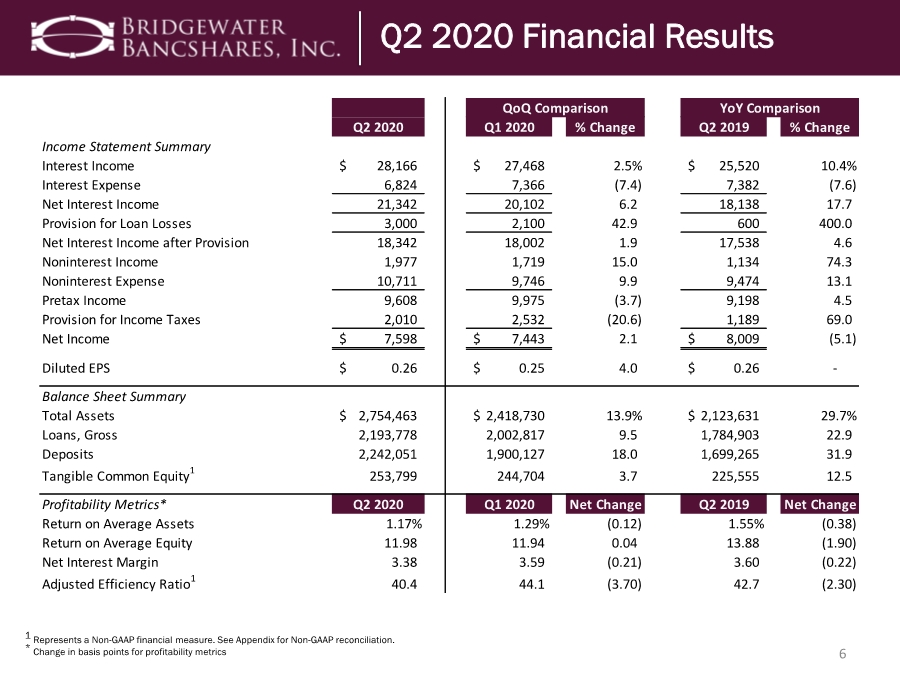
| 6 1 Represents a Non-GAAP financial measure. See Appendix for Non-GAAP reconciliation. * Change in basis points for profitability metrics Second Quarter 2020 Financial Results Q2 2020 Financial Results Q2 2020 Q1 2020 % Change Q2 2019 % Change Income Statement Summary Interest Income 28,166 $ 27,468 $ 2.5% 25,520 $ 10.4% Interest Expense 6,824 7,366 (7.4) 7,382 (7.6) Net Interest Income 21,342 20,102 6.2 18,138 17.7 Provision for Loan Losses 3,000 2,100 42.9 600 400.0 Net Interest Income after Provision 18,342 18,002 1.9 17,538 4.6 Noninterest Income 1,977 1,719 15.0 1,134 74.3 Noninterest Expense 10,711 9,746 9.9 9,474 13.1 Pretax Income 9,608 9,975 (3.7) 9,198 4.5 Provision for Income Taxes 2,010 2,532 (20.6) 1,189 69.0 Net Income 7,598 $ 7,443 $ 2.1 8,009 $ (5.1) Diluted EPS 0.26 $ 0.25 $ 4.0 0.26 $ - Balance Sheet Summary Total Assets 2,754,463 $ 2,418,730 $ 13.9% 2,123,631 $ 29.7% Loans, Gross 2,193,778 2,002,817 9.5 1,784,903 22.9 Deposits 2,242,051 1,900,127 18.0 1,699,265 31.9 Tangible Common Equity1 253,799 244,704 3.7 225,555 12.5 Profitability Metrics* Q2 2020 Q1 2020 Net Change Q2 2019 Net Change Return on Average Assets 1.17% 1.29% (0.12) 1.55% (0.38) Return on Average Equity 11.98 11.94 0.04 13.88 (1.90) Net Interest Margin 3.38 3.59 (0.21) 3.60 (0.22) Adjusted Efficiency Ratio1 40.4 44.1 (3.70) 42.7 (2.30) QoQ Comparison YoY Comparison |
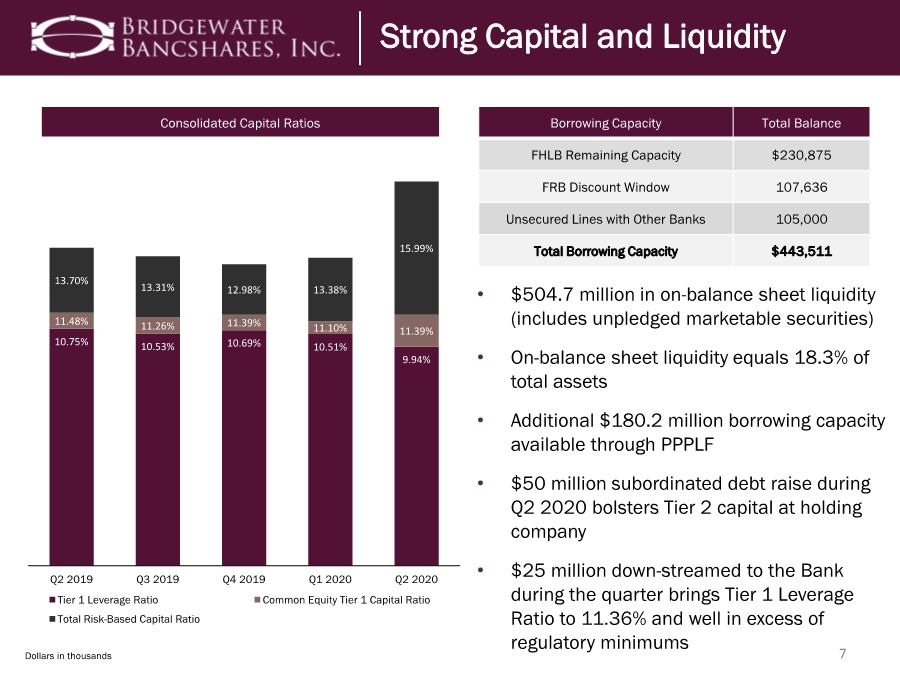
| 7 Strong Capital and Liquidity • $504.7 million in on-balance sheet liquidity (includes unpledged marketable securities) • On-balance sheet liquidity equals 18.3% of total assets • Additional $180.2 million borrowing capacity available through PPPLF • $50 million subordinated debt raise during Q2 2020 bolsters Tier 2 capital at holding company • $25 million down-streamed to the Bank during the quarter brings Tier 1 Leverage Ratio to 11.36% and well in excess of regulatory minimums Dollars in thousands Strong Capital and Liquidity 10.75% 10.53% 10.69% 10.51% 9.94% 11.48% 11.26% 11.39% 11.10% 11.39% 13.70% 13.31% 12.98% 13.38% 15.99% Q2 2019 Q3 2019 Q4 2019 Q1 2020 Q2 2020 Tier 1 Leverage Ratio Common Equity Tier 1 Capital Ratio Total Risk-Based Capital Ratio Consolidated Capital Ratios Borrowing Capacity Total Balance FHLB Remaining Capacity $230,875 FRB Discount Window 107,636 Unsecured Lines with Other Banks 105,000 Total Borrowing Capacity $443,511 |
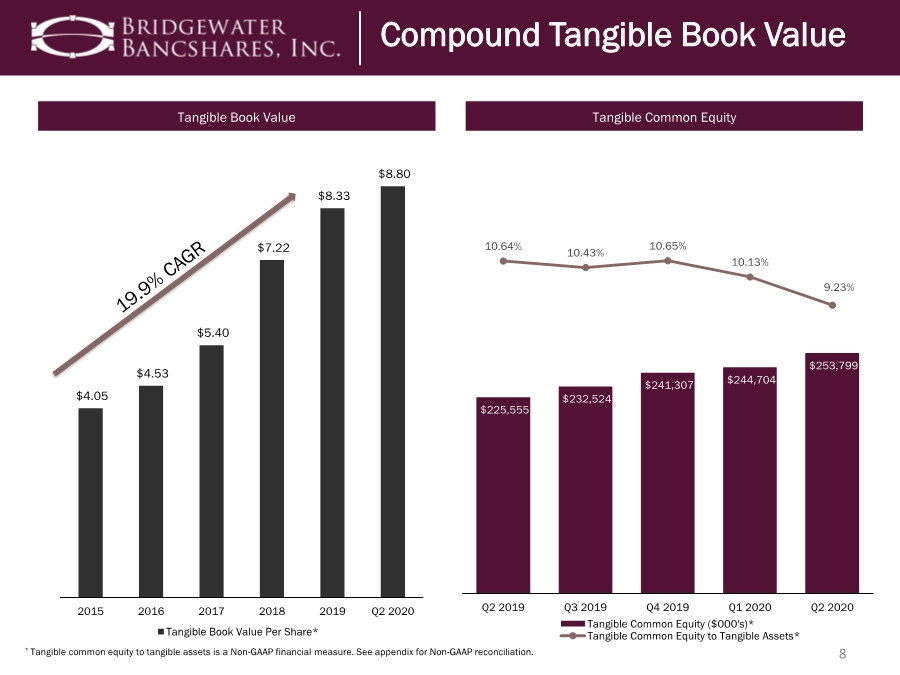
| 8 * Tangible common equity to tangible assets is a Non-GAAP financial measure. See appendix for Non-GAAP reconciliation. Compound Tangible Book Value Strong Capital and Liquidity Compound Tangible Book Value $225,555 $232,524 $241,307 $244,704 $253,799 10.64% 10.43% 10.65% 10.13% 9.23% Q2 2019 Q3 2019 Q4 2019 Q1 2020 Q2 2020 Tangible Common Equity ($000's)* Tangible Common Equity to Tangible Assets* Tangible Book Value Tangible Common Equity $4.05 $4.53 $5.40 $7.22 $8.33 $8.80 2015 2016 2017 2018 2019 Q2 2020 Tangible Book Value Per Share* |
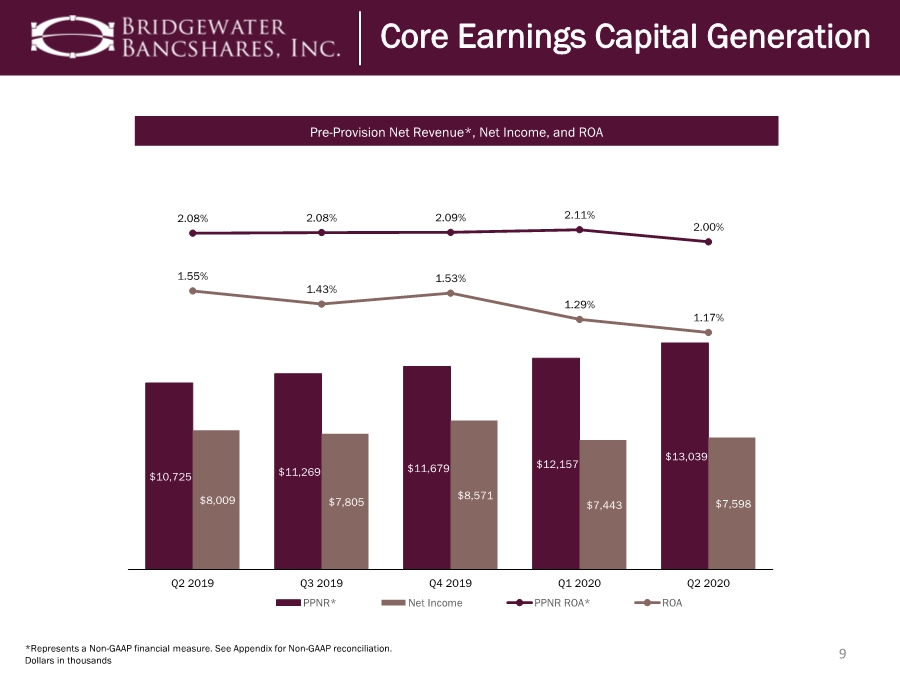
| 9 *Represents a Non-GAAP financial measure. See Appendix for Non-GAAP reconciliation. Dollars in thousands Core Earnings Capital Generation Core Earnings Capital Generation Pre-Provision Net Revenue*, Net Income, and ROA $10,725 $11,269 $11,679 $12,157 $13,039 $8,009 $7,805 $8,571 $7,443 $7,598 2.08% 2.08% 2.09% 2.11% 2.00% 1.55% 1.43% 1.53% 1.29% 1.17% Q2 2019 Q3 2019 Q4 2019 Q1 2020 Q2 2020 PPNR* Net Income PPNR ROA* ROA |
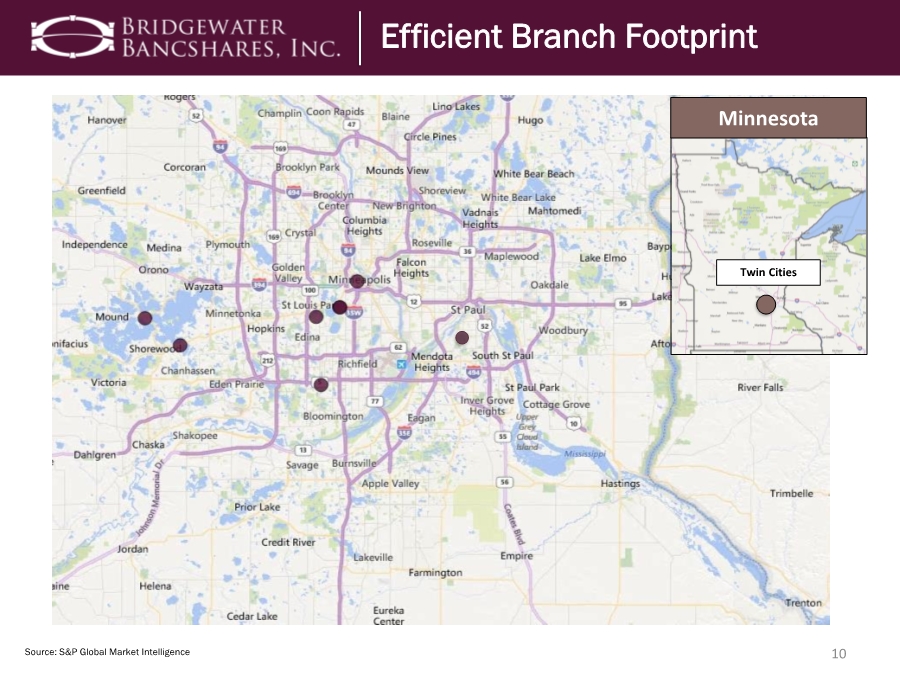
| Twin Cities Minnesota 10 Source: S&P Global Market Intelligence Efficient Branch Footprint Efficient Branch Footprint |
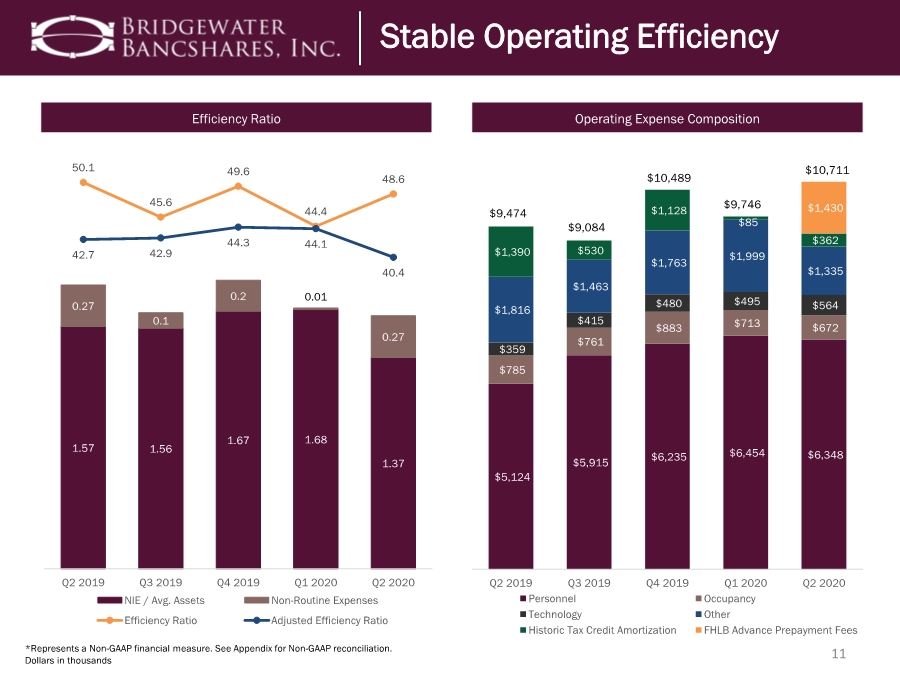
| 11 *Represents a Non-GAAP financial measure. See Appendix for Non-GAAP reconciliation. Dollars in thousands Stable Operating Efficiency Efficiency Ratio Operating Expense Composition 1.57 1.56 1.67 1.68 1.37 0.27 0.1 0.2 0.01 0.27 50.1 45.6 49.6 44.4 48.6 42.7 42.9 44.3 44.1 40.4 Q2 2019 Q3 2019 Q4 2019 Q1 2020 Q2 2020 NIE / Avg. Assets Non-Routine Expenses Efficiency Ratio Adjusted Efficiency Ratio $5,124 $5,915 $6,235 $6,454 $6,348 $785 $761 $883 $713 $672 $359 $415 $480 $495 $564 $1,816 $1,463 $1,763 $1,999 $1,335 $1,390 $530 $1,128 $85 $362 $- $1,430 Q2 2019 Q3 2019 Q4 2019 Q1 2020 Q2 2020 Personnel Occupancy Technology Other Historic Tax Credit Amortization FHLB Advance Prepayment Fees $9,474 $9,084 $10,489 $9,746 $10,711 |
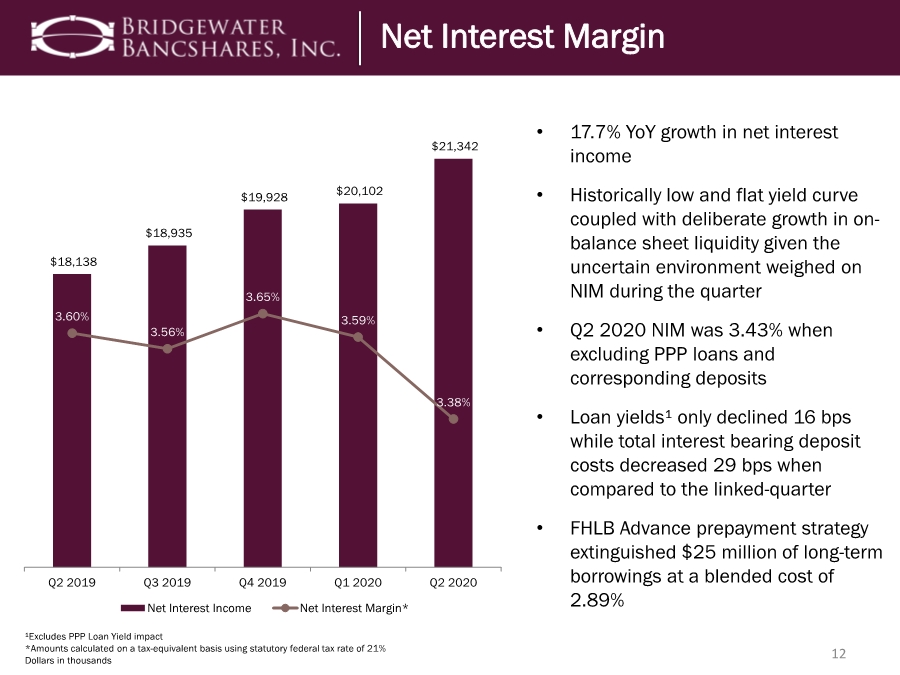
| 12 ¹Excludes PPP Loan Yield impact *Amounts calculated on a tax-equivalent basis using statutory federal tax rate of 21% Dollars in thousands Net Interest Margin • 17.7% YoY growth in net interest income • Historically low and flat yield curve coupled with deliberate growth in on- balance sheet liquidity given the uncertain environment weighed on NIM during the quarter • Q2 2020 NIM was 3.43% when excluding PPP loans and corresponding deposits • Loan yields¹ only declined 16 bps while total interest bearing deposit costs decreased 29 bps when compared to the linked-quarter • FHLB Advance prepayment strategy extinguished $25 million of long-term borrowings at a blended cost of 2.89% Net Interest Margin $18,138 $18,935 $19,928 $20,102 $21,342 3.60% 3.56% 3.65% 3.59% 3.38% Q2 2019 Q3 2019 Q4 2019 Q1 2020 Q2 2020 Net Interest Income Net Interest Margin* |
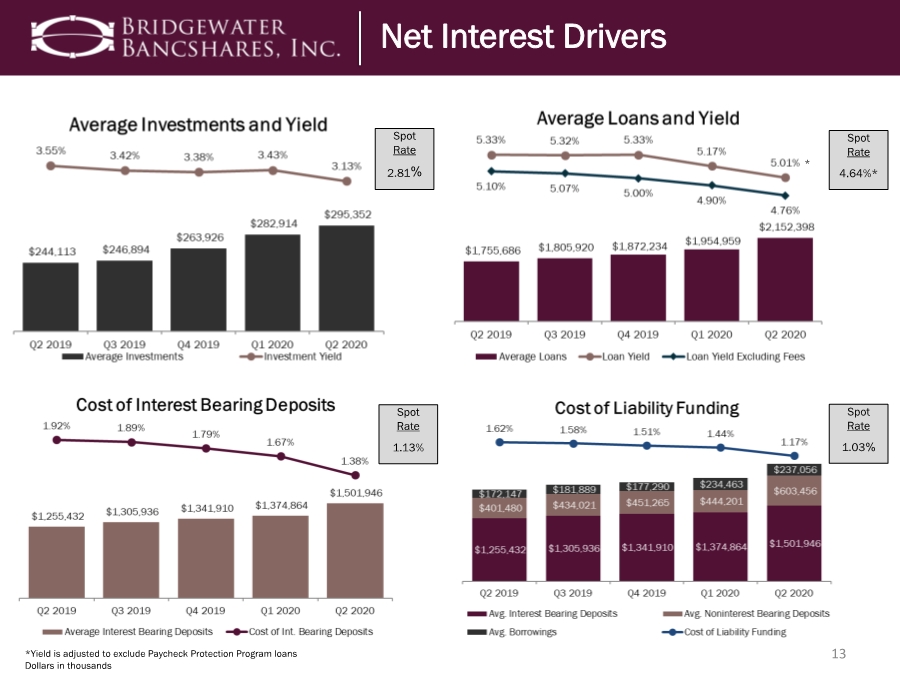
| 13 *Yield is adjusted to exclude Paycheck Protection Program loans Dollars in thousands Spot Rate 2.81% Spot Rate 4.64%* Spot Rate 1.13% Spot Rate 1.03% Net Interest Drivers * |
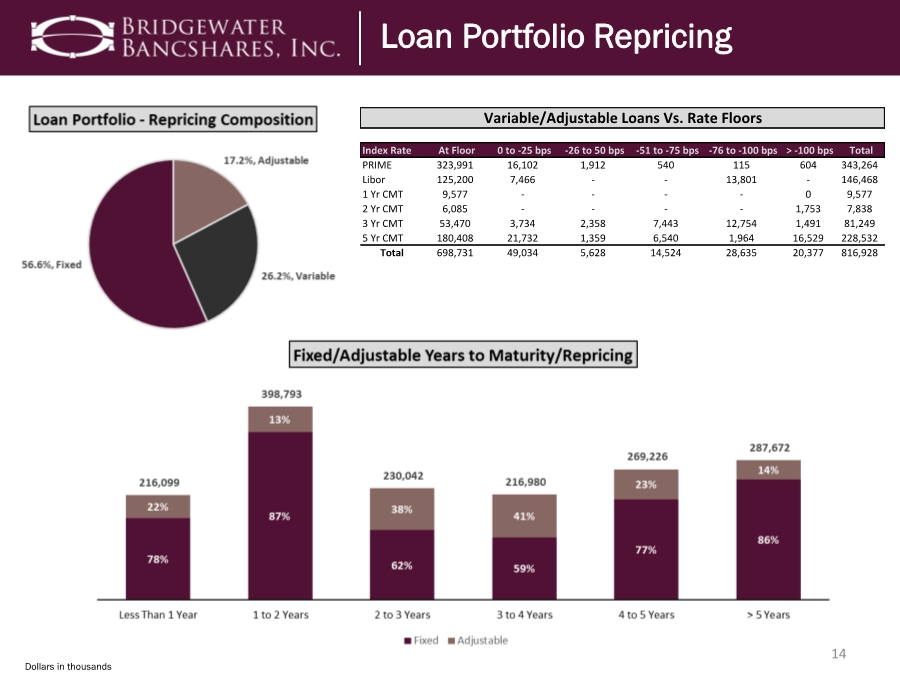
| 14 Dollars in thousands Index Rate At Floor 0 to -25 bps -26 to 50 bps -51 to -75 bps -76 to -100 bps > -100 bps Total PRIME 323,991 16,102 1,912 540 115 604 343,264 Libor 125,200 7,466 -- 13,801 - 146,468 1 Yr CMT 9,577 ---- 0 9,577 2 Yr CMT 6,085 ---- 1,753 7,838 3 Yr CMT 53,470 3,734 2,358 7,443 12,754 1,491 81,249 5 Yr CMT 180,408 21,732 1,359 6,540 1,964 16,529 228,532 Total 698,731 49,034 5,628 14,524 28,635 20,377 816,928 Variable/Adjustable Loans Vs. Rate Floors Loan Portfolio Repricing |
| 15 Dollars in thousands • $420 million in time deposits maturing in the next 5 quarters at a blended cost of 1.69% • $193 million, or 12%, of non-maturity deposit portfolio still earning a rate >1.00% as of 6/30/20 Deposit Repricing Opportunities Time Deposit Maturities Nonmaturity Deposit Composition by Rate Paid $46,314 $44,290 $46,969 $36,044 $9,799 $125,719 $41,924 $24,943 $34,491 $9,759 $172,033 $86,213 $71,912 $70,535 $19,558 Q2 2020 Q3 2020 Q4 2020 Q1 2021 Q2 2021 Retail Time Deposit Maturities Brokered Time Deposit Maturities 60% 62% 58% 66% 74% 9% 7% 8% 11% 14% 2% 2% 6% 13% 7% 4% 10% 18% 6% 1% 26% 21% 11% 4% 4% $1,098,471 $1,195,562 $1,231,365 $1,300,461 $1,595,808 Q2 2019 Q3 2019 Q4 2019 Q1 2020 Q2 2020 0% to .50% .51% to 1.00% 1.01% to 1.50% 1.51% to 2.00% > 2.00% |

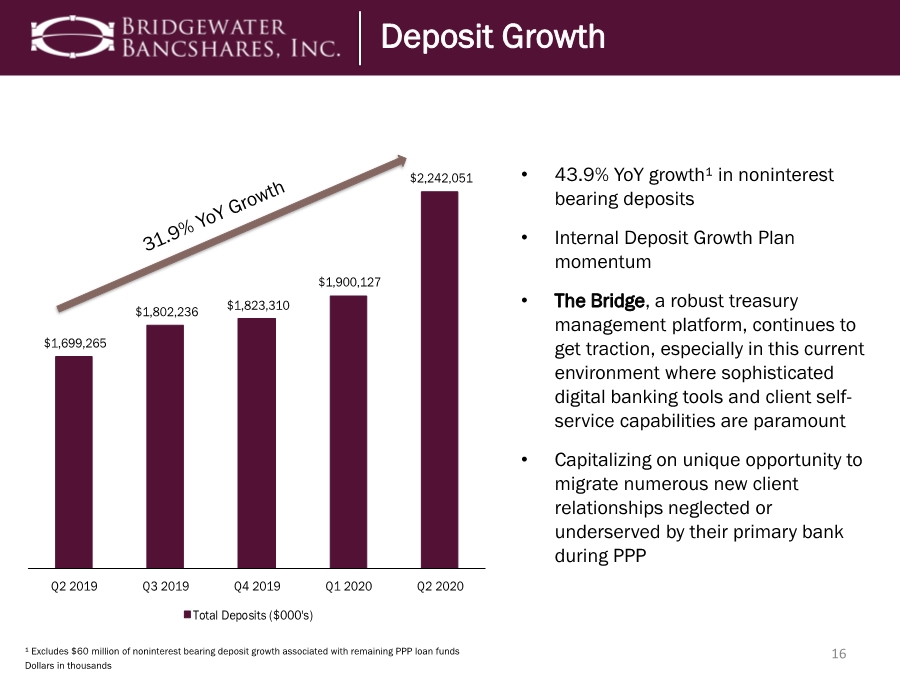
| $1,699,265 $1,802,236 $1,823,310 $1,900,127 $2,242,051 Q2 2019 Q3 2019 Q4 2019 Q1 2020 Q2 2020 Total Deposits ($000's) 16 Deposit Growth • 43.9% YoY growth¹ in noninterest bearing deposits • Internal Deposit Growth Plan momentum • The Bridge, a robust treasury management platform, continues to get traction, especially in this current environment where sophisticated digital banking tools and client self- service capabilities are paramount • Capitalizing on unique opportunity to migrate numerous new client relationships neglected or underserved by their primary bank during PPP Deposit Growth ¹ Excludes $60 million of noninterest bearing deposit growth associated with remaining PPP loan funds Dollars in thousands |
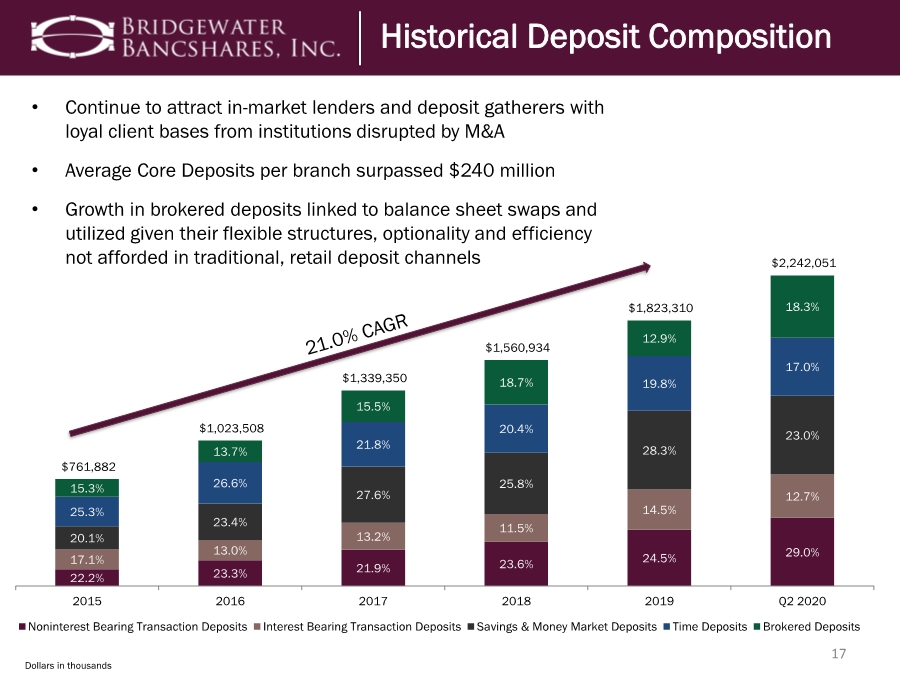
| 17 Dollars in thousands Historical Deposit Composition Historical Deposit Composition 22.2% 23.3% 21.9% 23.6% 24.5% 29.0% 17.1% 13.0% 13.2% 11.5% 14.5% 12.7% 20.1% 23.4% 27.6% 25.8% 28.3% 23.0% 25.3% 26.6% 21.8% 20.4% 19.8% 17.0% 15.3% 13.7% 15.5% 18.7% 12.9% 18.3% $761,882 $1,023,508 $1,339,350 $1,560,934 $1,823,310 $2,242,051 2015 2016 2017 2018 2019 Q2 2020 Noninterest Bearing Transaction Deposits Interest Bearing Transaction Deposits Savings & Money Market Deposits Time Deposits Brokered Deposits • Continue to attract in-market lenders and deposit gatherers with loyal client bases from institutions disrupted by M&A • Average Core Deposits per branch surpassed $240 million • Growth in brokered deposits linked to balance sheet swaps and utilized given their flexible structures, optionality and efficiency not afforded in traditional, retail deposit channels |
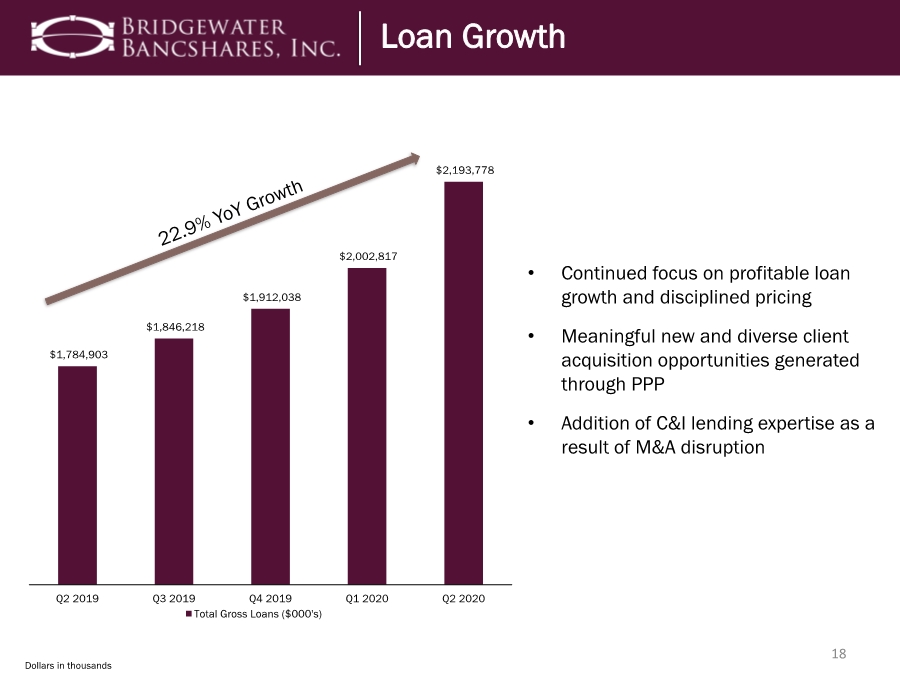
| $1,784,903 $1,846,218 $1,912,038 $2,002,817 $2,193,778 Q2 2019 Q3 2019 Q4 2019 Q1 2020 Q2 2020 Total Gross Loans ($000's) 18 Loan Growth • Continued focus on profitable loan growth and disciplined pricing • Meaningful new and diverse client acquisition opportunities generated through PPP • Addition of C&I lending expertise as a result of M&A disruption Loan Growth Dollars in thousands |
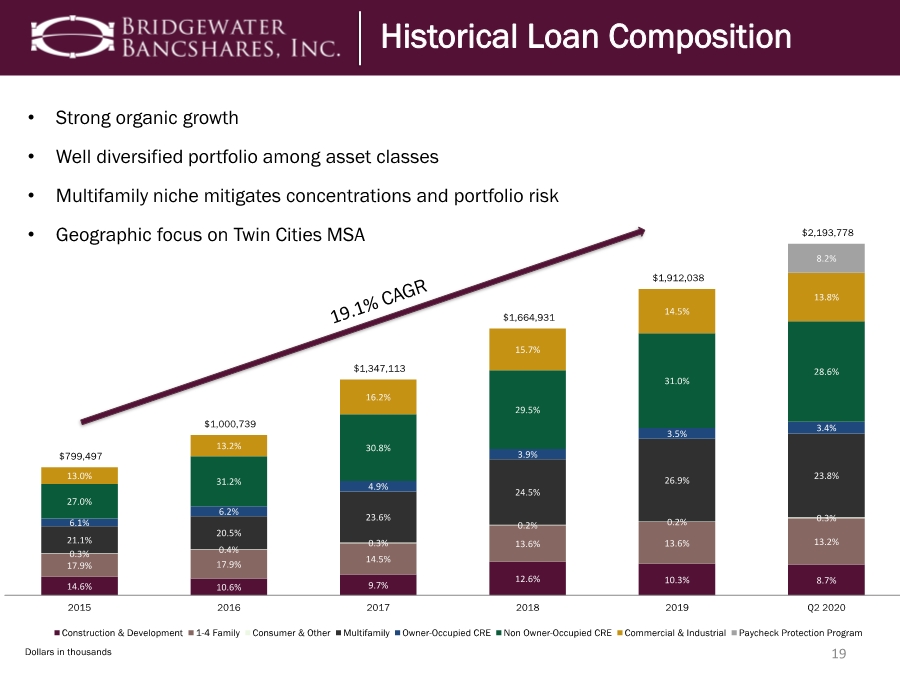
| 19 Dollars in thousands Historical Loan Composition 14.6% 10.6% 9.7% 12.6% 10.3% 8.7% 17.9% 17.9% 14.5% 13.6% 13.6% 13.2% 0.3% 0.4% 0.3% 0.2% 0.2% 0.3% 21.1% 20.5% 23.6% 24.5% 26.9% 23.8% 6.1% 6.2% 4.9% 3.9% 3.5% 3.4% 27.0% 31.2% 30.8% 29.5% 31.0% 28.6% 13.0% 13.2% 16.2% 15.7% 14.5% 13.8% 8.2% $799,497 $1,000,739 $1,347,113 $1,664,931 $1,912,038 $2,193,778 2015 2016 2017 2018 2019 Q2 2020 Construction & Development 1-4 Family Consumer & Other Multifamily Owner-Occupied CRE Non Owner-Occupied CRE Commercial & Industrial Paycheck Protection Program Historical Loan Composition • Strong organic growth • Well diversified portfolio among asset classes • Multifamily niche mitigates concentrations and portfolio risk • Geographic focus on Twin Cities MSA |
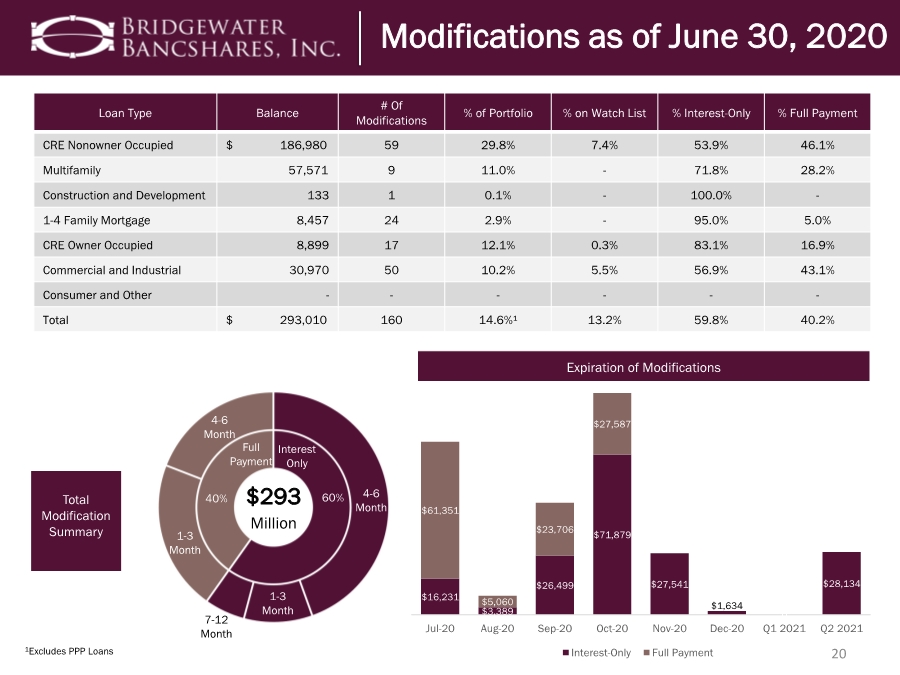
| 20 Investor Real Estate Secured: CRE Nonowner Occupied (“NOO”) Total Modification Summary Loan Type Balance # Of Modifications % of Portfolio % on Watch List % Interest-Only % Full Payment CRE Nonowner Occupied $ 186,980 59 29.8% 7.4% 53.9% 46.1% Multifamily 57,571 9 11.0% - 71.8% 28.2% Construction and Development 133 1 0.1% - 100.0% - 1-4 Family Mortgage 8,457 24 2.9% - 95.0% 5.0% CRE Owner Occupied 8,899 17 12.1% 0.3% 83.1% 16.9% Commercial and Industrial 30,970 50 10.2% 5.5% 56.9% 43.1% Consumer and Other ------ Total $ 293,010 160 14.6%¹ 13.2% 59.8% 40.2% Expiration of Modifications $293 Million Full Payment Interest Only 40% 60% 1-3 Month 7-12 Month 1-3 Month 4-6 Month 4-6 Month 1Excludes PPP Loans Modifications as of June 30, 2020 $16,231 $3,389 $26,499 $71,879 $27,541 $1,634 0 $28,134 $61,351 $5,060 $23,706 $27,587 0 Jul-20 Aug-20 Sep-20 Oct-20 Nov-20 Dec-20 Q1 2021 Q2 2021 Interest-Only Full Payment |
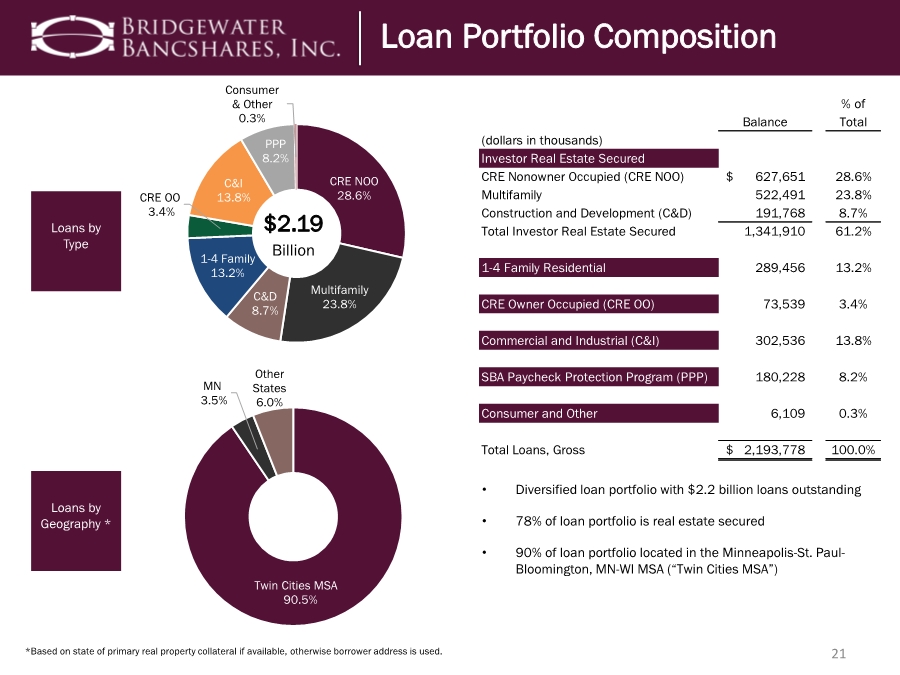
| 21 *Based on state of primary real property collateral if available, otherwise borrower address is used. Loan Portfolio Composition Loans by Type Loans by Geography * • Diversified loan portfolio with $2.2 billion loans outstanding • 78% of loan portfolio is real estate secured • 90% of loan portfolio located in the Minneapolis-St. Paul- Bloomington, MN-WI MSA (“Twin Cities MSA”) Loan Portfolio Composition Balance % of Total (dollars in thousands) Investor Real Estate Secured CRE Nonowner Occupied (CRE NOO) 627,651 $ 28.6% Multifamily 522,491 23.8% Construction and Development (C&D) 191,768 8.7% Total Investor Real Estate Secured 1,341,910 61.2% 1-4 Family Residential 289,456 13.2% CRE Owner Occupied (CRE OO) 73,539 3.4% Commercial and Industrial (C&I) 302,536 13.8% SBA Paycheck Protection Program (PPP) 180,228 8.2% Consumer and Other 6,109 0.3% Total Loans, Gross 2,193,778 $ 100.0% Twin Cities MSA 90.5% MN 3.5% Other States 6.0% CRE NOO 28.6% Multifamily 23.8% C&D 8.7% 1-4 Family 13.2% CRE OO 3.4% C&I 13.8% PPP 8.2% Consumer & Other 0.3% $2.19 Billion |
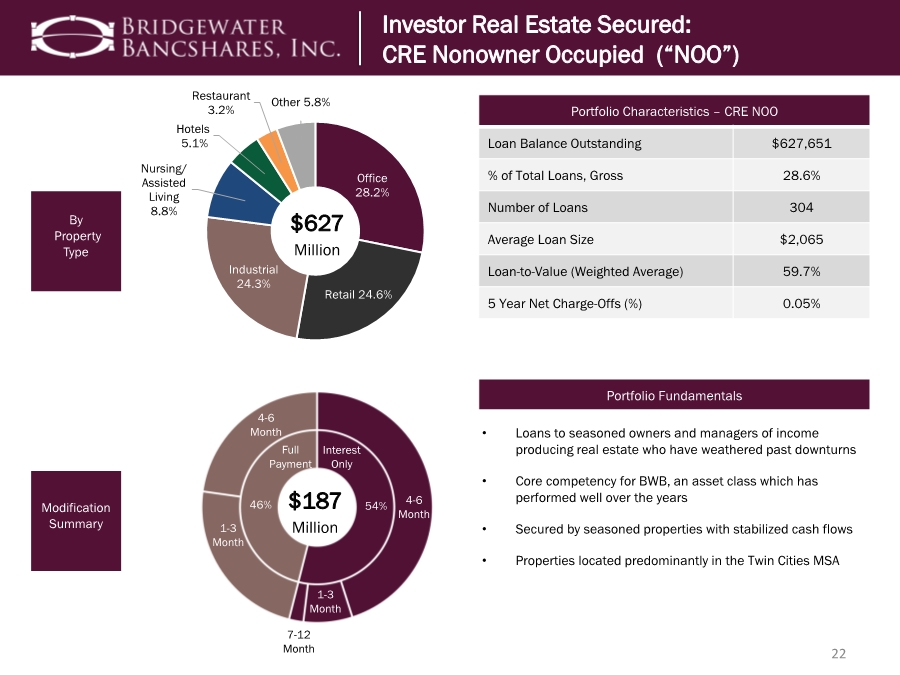
| 22 Investor Real Estate Secured: CRE Nonowner Occupied (“NOO”) By Property Type Modification Summary Portfolio Characteristics – CRE NOO Loan Balance Outstanding $627,651 % of Total Loans, Gross 28.6% Number of Loans 304 Average Loan Size $2,065 Loan-to-Value (Weighted Average) 59.7% 5 Year Net Charge-Offs (%) 0.05% Portfolio Fundamentals • Loans to seasoned owners and managers of income producing real estate who have weathered past downturns • Core competency for BWB, an asset class which has performed well over the years • Secured by seasoned properties with stabilized cash flows • Properties located predominantly in the Twin Cities MSA Office 28.2% Retail 24.6% Industrial 24.3% Nursing/ Assisted Living 8.8% Hotels 5.1% Restaurant 3.2% Other 5.8% Investor Real Estate Secured: CRE Nonowner Occupied (“NOO”) $627 Million $187 Million Full Payment Interest Only 46% 54% 1-3 Month 7-12 Month 1-3 Month 4-6 Month 4-6 Month |
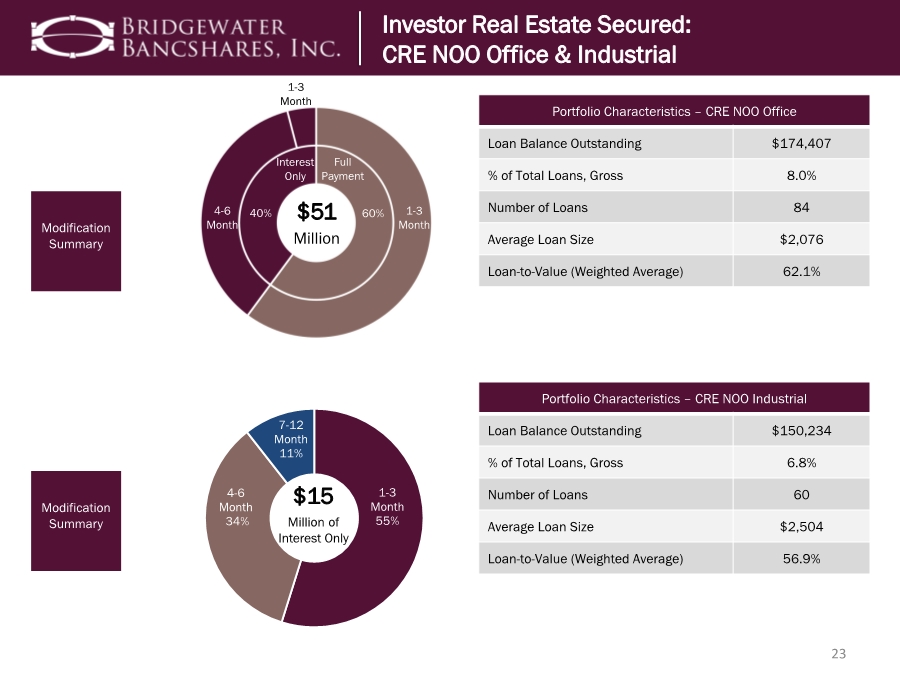
| 23 Investor Real Estate Secured: CRE Nonowner Occupied (“NOO”) Modification Summary Modification Summary Portfolio Characteristics – CRE NOO Office Loan Balance Outstanding $174,407 % of Total Loans, Gross 8.0% Number of Loans 84 Average Loan Size $2,076 Loan-to-Value (Weighted Average) 62.1% Investor Real Estate Secured: CRE NOO Office & Industrial $51 Million Full Payment Interest Only 40% 60% 1-3 Month 1-3 Month 4-6 Month Portfolio Characteristics – CRE NOO Industrial Loan Balance Outstanding $150,234 % of Total Loans, Gross 6.8% Number of Loans 60 Average Loan Size $2,504 Loan-to-Value (Weighted Average) 56.9% 1-3 Month 55% 4-6 Month 34% 7-12 Month 11% $15 Million of Interest Only |
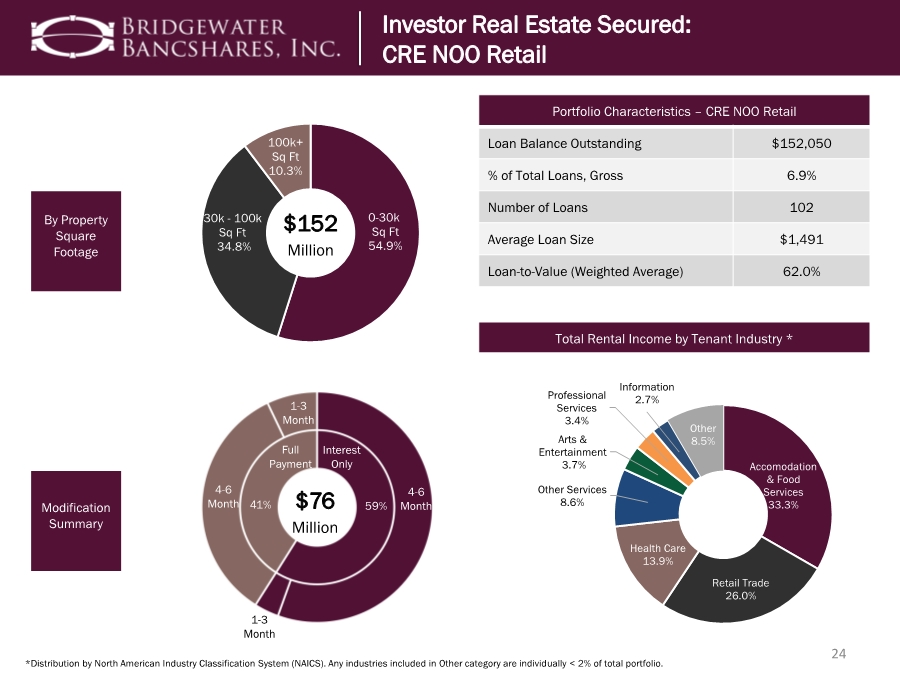
| 24 *Distribution by North American Industry Classification System (NAICS). Any industries included in Other category are individually < 2% of total portfolio. By Property Square Footage Modification Summary Portfolio Characteristics – CRE NOO Retail Loan Balance Outstanding $152,050 % of Total Loans, Gross 6.9% Number of Loans 102 Average Loan Size $1,491 Loan-to-Value (Weighted Average) 62.0% Total Rental Income by Tenant Industry * Accomodation & Food Services 33.3% Retail Trade 26.0% Health Care 13.9% Other Services 8.6% Arts & Entertainment 3.7% Professional Services 3.4% Information 2.7% Other 8.5% Investor Real Estate Secured: CRE NOO Retail Investor Real Estate Secured: CRE NOO Retail 1-3 Month Interest Only 4-6 Month 1-3 Month 4-6 Month Full Payment 41% 59% $76 Million 0-30k Sq Ft 54.9% 30k - 100k Sq Ft 34.8% 100k+ Sq Ft 10.3% $152 Million |
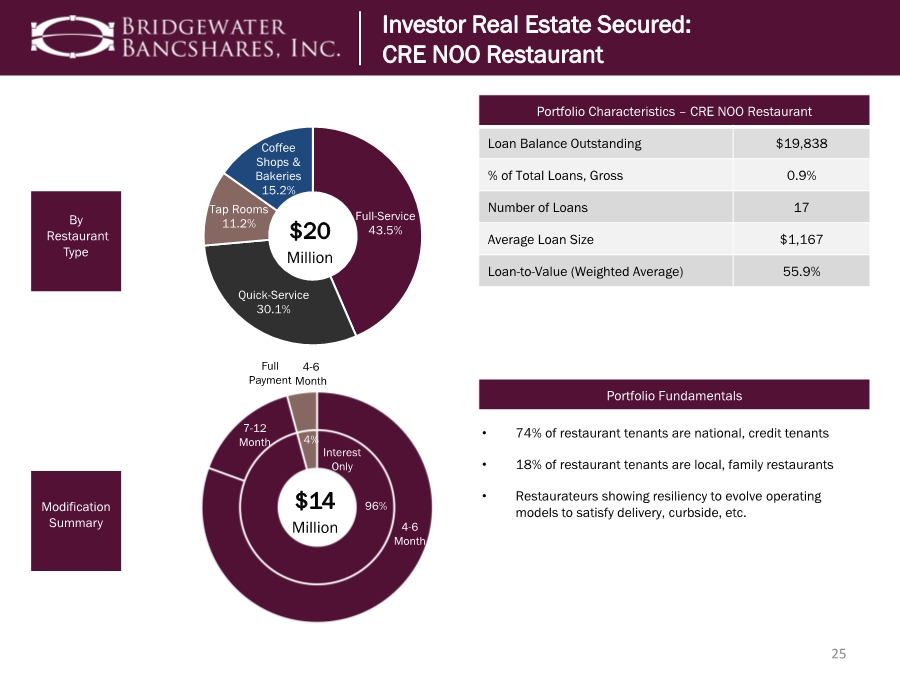
| 25 By Restaurant Type Modification Summary Portfolio Characteristics – CRE NOO Restaurant Loan Balance Outstanding $19,838 % of Total Loans, Gross 0.9% Number of Loans 17 Average Loan Size $1,167 Loan-to-Value (Weighted Average) 55.9% Portfolio Fundamentals • 74% of restaurant tenants are national, credit tenants • 18% of restaurant tenants are local, family restaurants • Restaurateurs showing resiliency to evolve operating models to satisfy delivery, curbside, etc. Investor Real Estate Secured: CRE NOO Restaurant Investor Real Estate Secured: CRE NOO Restaurant Full-Service 43.5% Quick-Service 30.1% Tap Rooms 11.2% Coffee Shops & Bakeries 15.2% $20 Million $14 Million Full Payment Interest Only 96% 4% 4-6 Month 7-12 Month 4-6 Month |
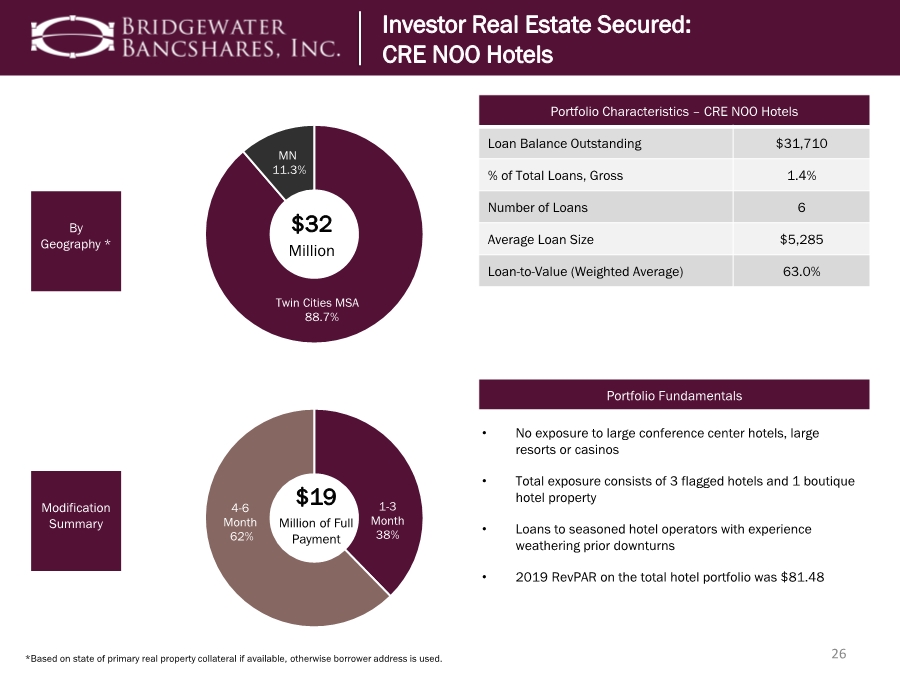
| 26 *Based on state of primary real property collateral if available, otherwise borrower address is used. Investor Real Estate Secured: CRE NOO Hotels By Geography * Modification Summary Portfolio Characteristics – CRE NOO Hotels Loan Balance Outstanding $31,710 % of Total Loans, Gross 1.4% Number of Loans 6 Average Loan Size $5,285 Loan-to-Value (Weighted Average) 63.0% Portfolio Fundamentals • No exposure to large conference center hotels, large resorts or casinos • Total exposure consists of 3 flagged hotels and 1 boutique hotel property • Loans to seasoned hotel operators with experience weathering prior downturns • 2019 RevPAR on the total hotel portfolio was $81.48 Twin Cities MSA 88.7% MN 11.3% $32 Million Investor Real Estate Secured: CRE NOO Hotels 4-6 Month 1-3 Month Full Payment 100% 1-3 Month 38% 4-6 Month 62% $19 Million of Full Payment |
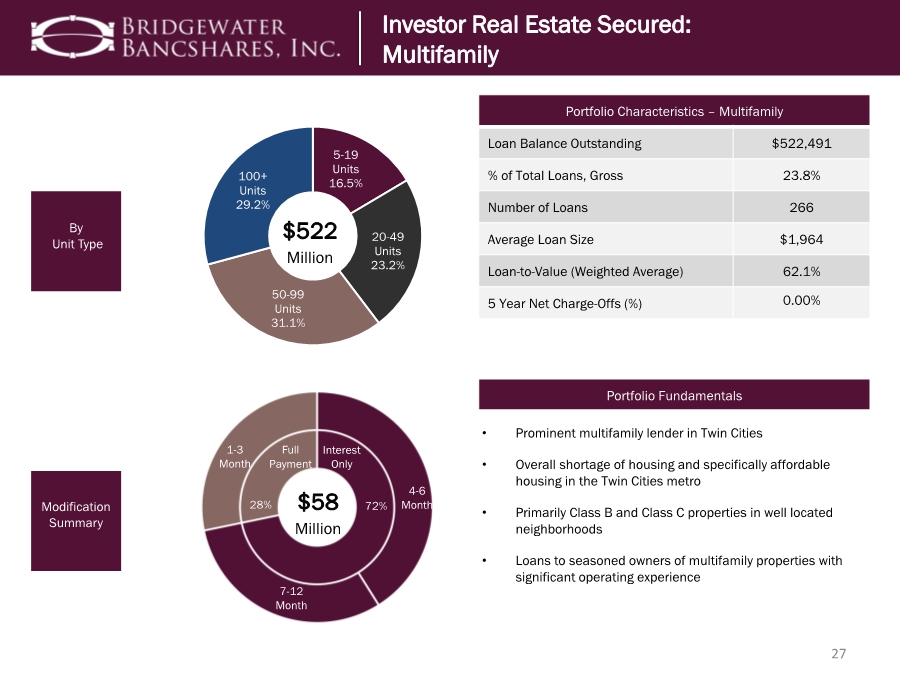
| 27 By Unit Type Modification Summary Portfolio Characteristics – Multifamily Loan Balance Outstanding $522,491 % of Total Loans, Gross 23.8% Number of Loans 266 Average Loan Size $1,964 Loan-to-Value (Weighted Average) 62.1% 5 Year Net Charge-Offs (%) 0.00% Portfolio Fundamentals • Prominent multifamily lender in Twin Cities • Overall shortage of housing and specifically affordable housing in the Twin Cities metro • Primarily Class B and Class C properties in well located neighborhoods • Loans to seasoned owners of multifamily properties with significant operating experience Investor Real Estate Secured: CRE NOO Restaurant Investor Real Estate Secured: Multifamily 5-19 Units 16.5% 20-49 Units 23.2% 50-99 Units 31.1% 100+ Units 29.2% $522 Million $58 Million Full Payment Interest Only 28% 72% 7-12 Month 4-6 Month 1-3 Month |
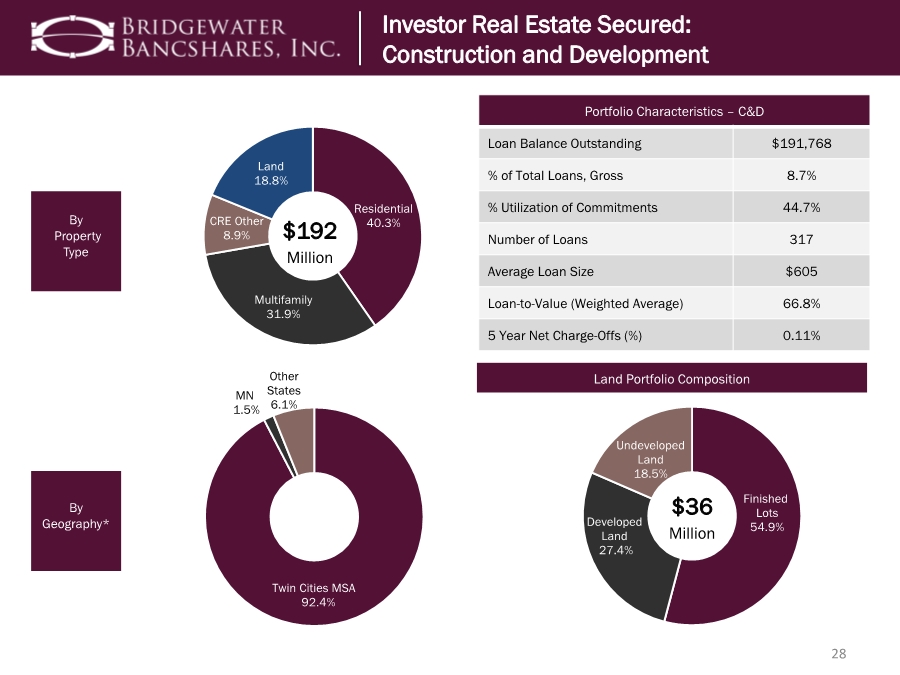
| 28 By Property Type By Geography* Land Portfolio Composition Investor Real Estate Secured: CRE NOO Restaurant Investor Real Estate Secured: Construction and Development Residential 40.3% Multifamily 31.9% CRE Other 8.9% Land 18.8% $192 Million Portfolio Characteristics – C&D Loan Balance Outstanding $191,768 % of Total Loans, Gross 8.7% % Utilization of Commitments 44.7% Number of Loans 317 Average Loan Size $605 Loan-to-Value (Weighted Average) 66.8% 5 Year Net Charge-Offs (%) 0.11% Twin Cities MSA 92.4% MN 1.5% Other States 6.1% Finished Lots 54.9% Developed Land 27.4% Undeveloped Land 18.5% $36 Million |
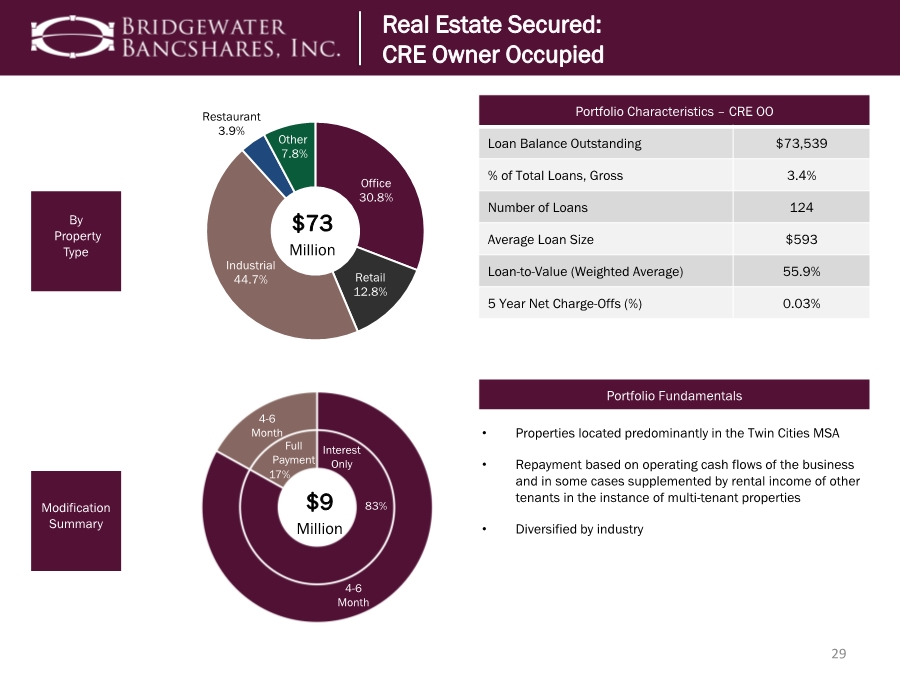
| 29 Investor Real Estate Secured: CRE Nonowner Occupied (“NOO”) By Property Type Modification Summary Portfolio Characteristics – CRE OO Loan Balance Outstanding $73,539 % of Total Loans, Gross 3.4% Number of Loans 124 Average Loan Size $593 Loan-to-Value (Weighted Average) 55.9% 5 Year Net Charge-Offs (%) 0.03% Portfolio Fundamentals • Properties located predominantly in the Twin Cities MSA • Repayment based on operating cash flows of the business and in some cases supplemented by rental income of other tenants in the instance of multi-tenant properties • Diversified by industry Office 30.8% Retail 12.8% Industrial 44.7% Restaurant 3.9% Other 7.8% $73 Million Real Estate Secured: CRE Owner Occupied $9 Million Full Payment Interest Only 17% 83% 4-6 Month 4-6 Month |
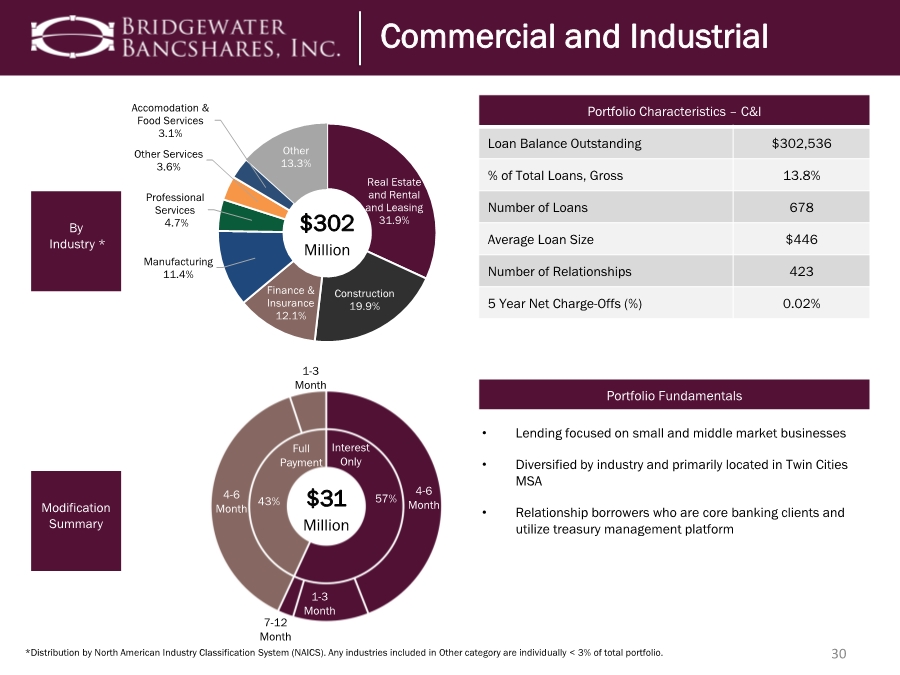
| $302 Million Real Estate and Rental and Leasing 31.9% Construction 19.9% Finance & Insurance 12.1% Manufacturing 11.4% Professional Services 4.7% Other Services 3.6% Accomodation & Food Services 3.1% Other 13.3% 30 *Distribution by North American Industry Classification System (NAICS). Any industries included in Other category are individually < 3% of total portfolio. By Industry * Modification Summary Portfolio Characteristics – C&I Loan Balance Outstanding $302,536 % of Total Loans, Gross 13.8% Number of Loans 678 Average Loan Size $446 Number of Relationships 423 5 Year Net Charge-Offs (%) 0.02% Portfolio Fundamentals • Lending focused on small and middle market businesses • Diversified by industry and primarily located in Twin Cities MSA • Relationship borrowers who are core banking clients and utilize treasury management platform Commercial and Industrial $31 Million Full Payment Interest Only 43% 57% 4-6 Month 4-6 Month 1-3 Month 7-12 Month 1-3 Month |
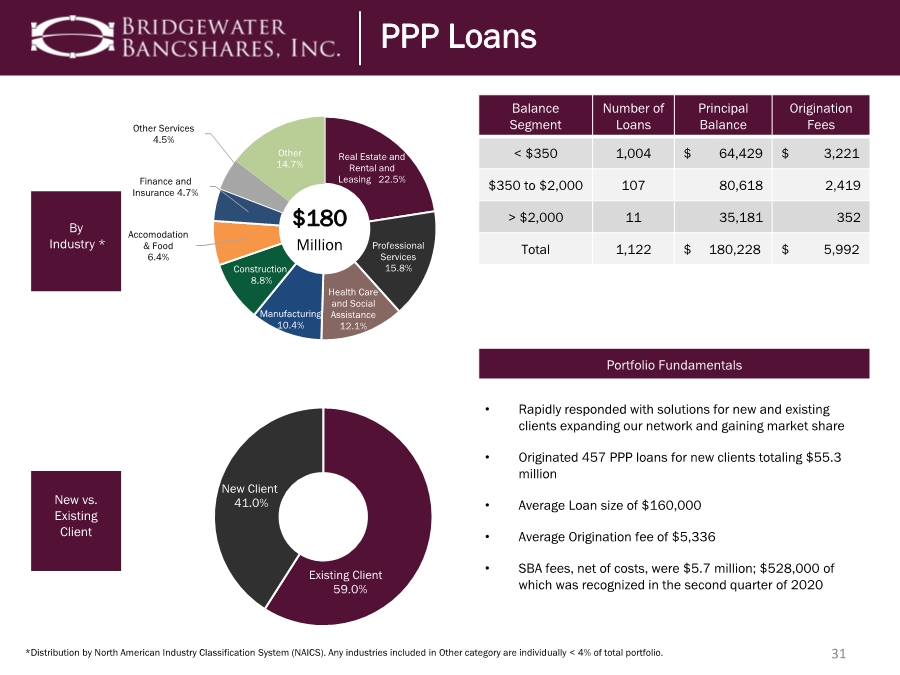
| Real Estate and Rental and Leasing 22.5% Professional Services 15.8% Health Care and Social Assistance 12.1% Manufacturing 10.4% Construction 8.8% Accomodation & Food 6.4% Finance and Insurance 4.7% Other Services 4.5% Other 14.7% $180 Million 31 *Distribution by North American Industry Classification System (NAICS). Any industries included in Other category are individually < 4% of total portfolio. By Industry * New vs. Existing Client Balance Segment Number of Loans Principal Balance Origination Fees < $350 1,004 $ 64,429 $ 3,221 $350 to $2,000 107 80,618 2,419 > $2,000 11 35,181 352 Total 1,122 $ 180,228 $ 5,992 Portfolio Fundamentals • Rapidly responded with solutions for new and existing clients expanding our network and gaining market share • Originated 457 PPP loans for new clients totaling $55.3 million • Average Loan size of $160,000 • Average Origination fee of $5,336 • SBA fees, net of costs, were $5.7 million; $528,000 of which was recognized in the second quarter of 2020 PPP Loans Existing Client 59.0% New Client 41.0% |
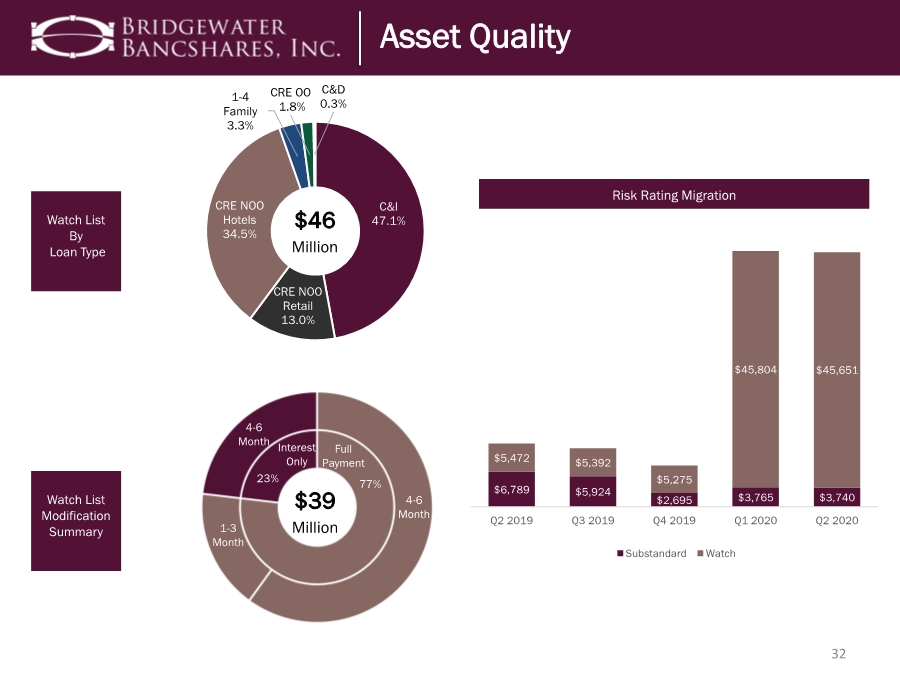
| 32 Investor Real Estate Secured: CRE Nonowner Occupied (“NOO”) Watch List By Loan Type Watch List Modification Summary Risk Rating Migration C&I 47.1% CRE NOO Retail 13.0% CRE NOO Hotels 34.5% 1-4 Family 3.3% CRE OO 1.8% C&D 0.3% $46 Million $39 Million Full Payment Interest Only 23% 77% 1-3 Month 4-6 Month 4-6 Month Asset Quality $6,789 $5,924 $2,695 $3,765 $3,740 $5,472 $5,392 $5,275 $45,804 $45,651 Q2 2019 Q3 2019 Q4 2019 Q1 2020 Q2 2020 Substandard Watch |
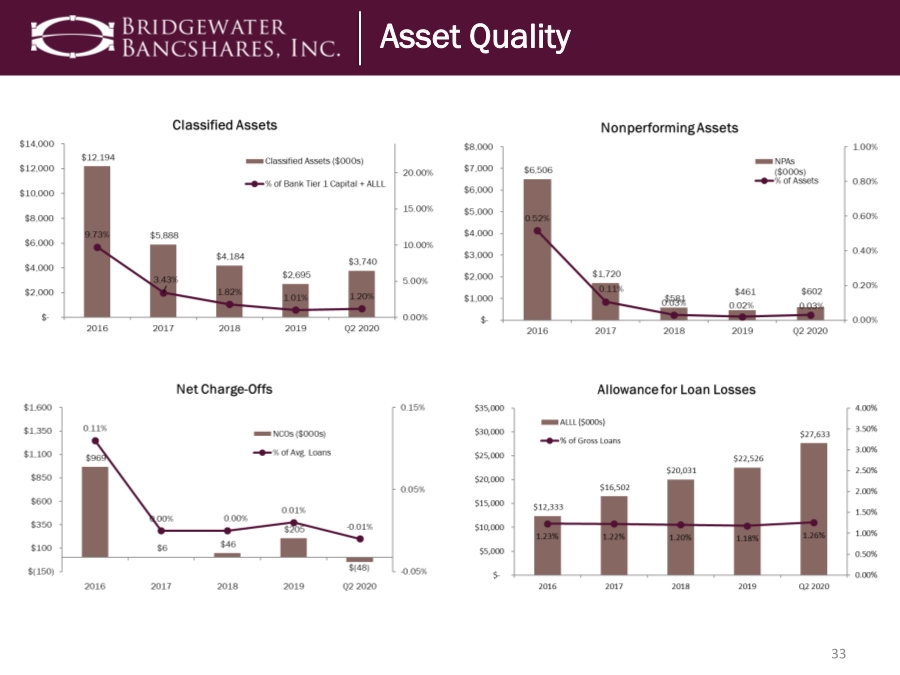
| 33 Asset Quality Asset Quality |
| 34 Investor Highlights Investor Highlights |
|

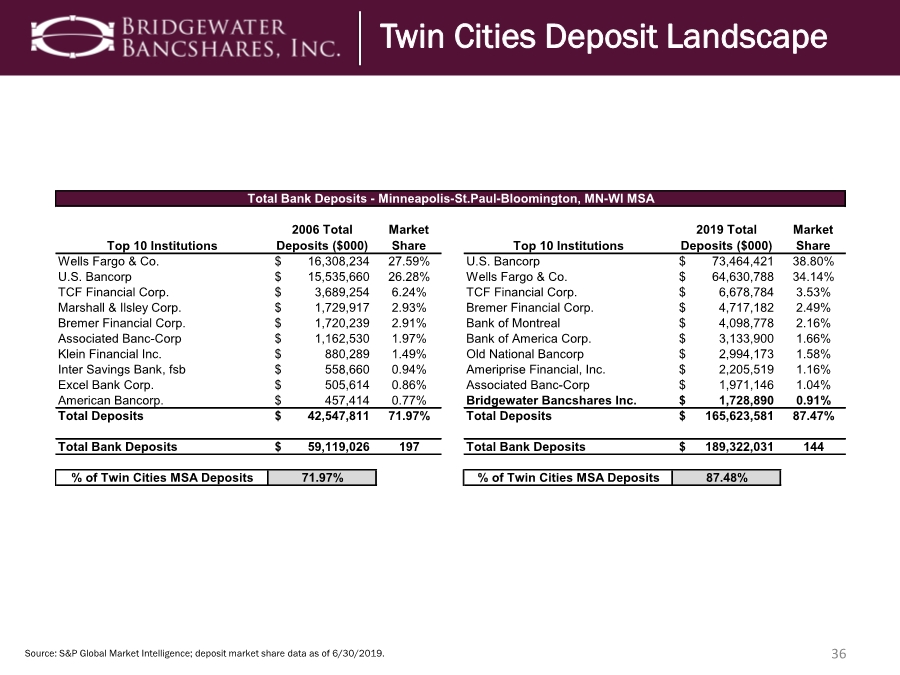
| 36 Source: S&P Global Market Intelligence; deposit market share data as of 6/30/2019. Top 10 Institutions 2006 Total Deposits ($000) Market Share Top 10 Institutions 2019 Total Deposits ($000) Market Share Wells Fargo & Co. 16,308,234 $ 27.59% U.S. Bancorp 73,464,421 $ 38.80% U.S. Bancorp 15,535,660 $ 26.28% Wells Fargo & Co. 64,630,788 $ 34.14% TCF Financial Corp. 3,689,254 $ 6.24% TCF Financial Corp. 6,678,784 $ 3.53% Marshall & Ilsley Corp. 1,729,917 $ 2.93% Bremer Financial Corp. 4,717,182 $ 2.49% Bremer Financial Corp. 1,720,239 $ 2.91% Bank of Montreal 4,098,778 $ 2.16% Associated Banc-Corp 1,162,530 $ 1.97% Bank of America Corp. 3,133,900 $ 1.66% Klein Financial Inc. 880,289 $ 1.49% Old National Bancorp 2,994,173 $ 1.58% Inter Savings Bank, fsb 558,660 $ 0.94% Ameriprise Financial, Inc. 2,205,519 $ 1.16% Excel Bank Corp. 505,614 $ 0.86% Associated Banc-Corp 1,971,146 $ 1.04% American Bancorp. 457,414 $ 0.77% Bridgewater Bancshares Inc. 1,728,890 $ 0.91% Total Deposits 42,547,811 $ 71.97% Total Deposits 165,623,581 $ 87.47% Total Bank Deposits 59,119,026 $ 197 Total Bank Deposits 189,322,031 $ 144 % of Twin Cities MSA Deposits 71.97% % of Twin Cities MSA Deposits 87.48% Total Bank Deposits - Minneapolis-St.Paul-Bloomington, MN-WI MSA Twin Cities Deposit Landscape Twin Cities Deposit Landscape |
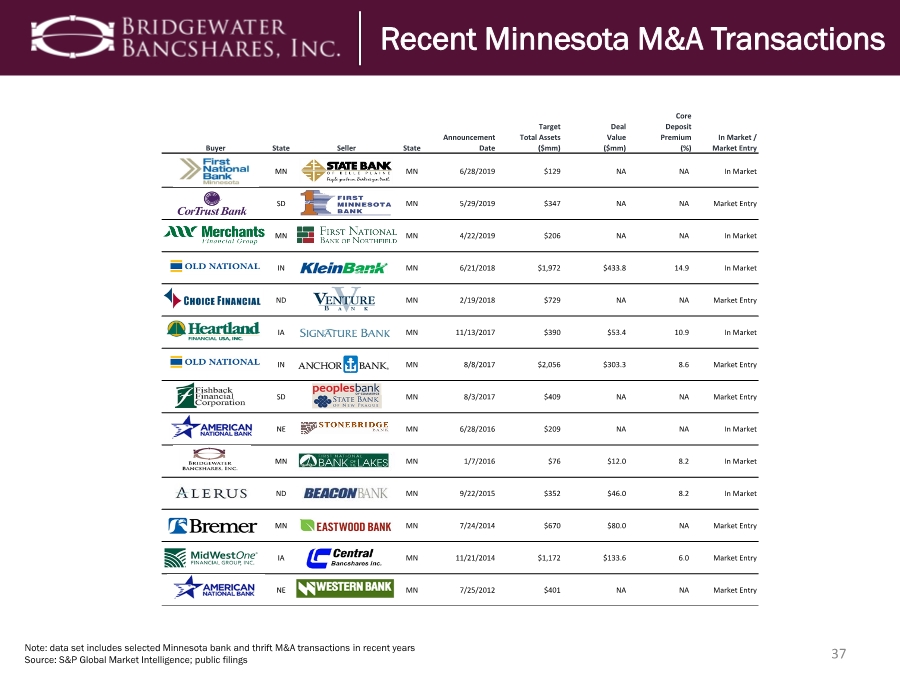
| 37 Note: data set includes selected Minnesota bank and thrift M&A transactions in recent years Source: S&P Global Market Intelligence; public filings Core Target Deal Deposit Announcement Total Assets Value Premium In Market / Buyer State Seller State Date ($mm) ($mm) (%) Market Entry MN MN 6/28/2019 $129 NA NA In Market SD MN 5/29/2019 $347 NA NA Market Entry MN MN 4/22/2019 $206 NA NA In Market IN MN 6/21/2018 $1,972 $433.8 14.9 In Market ND MN 2/19/2018 $729 NA NA Market Entry IA MN 11/13/2017 $390 $53.4 10.9 In Market IN MN 8/8/2017 $2,056 $303.3 8.6 Market Entry SD MN 8/3/2017 $409 NA NA Market Entry NE MN 6/28/2016 $209 NA NA In Market MN MN 1/7/2016 $76 $12.0 8.2 In Market ND MN 9/22/2015 $352 $46.0 8.2 In Market MN MN 7/24/2014 $670 $80.0 NA Market Entry IA MN 11/21/2014 $1,172 $133.6 6.0 Market Entry NE MN 7/25/2012 $401 NA NA Market Entry Recent Minnesota M&A Transactions |
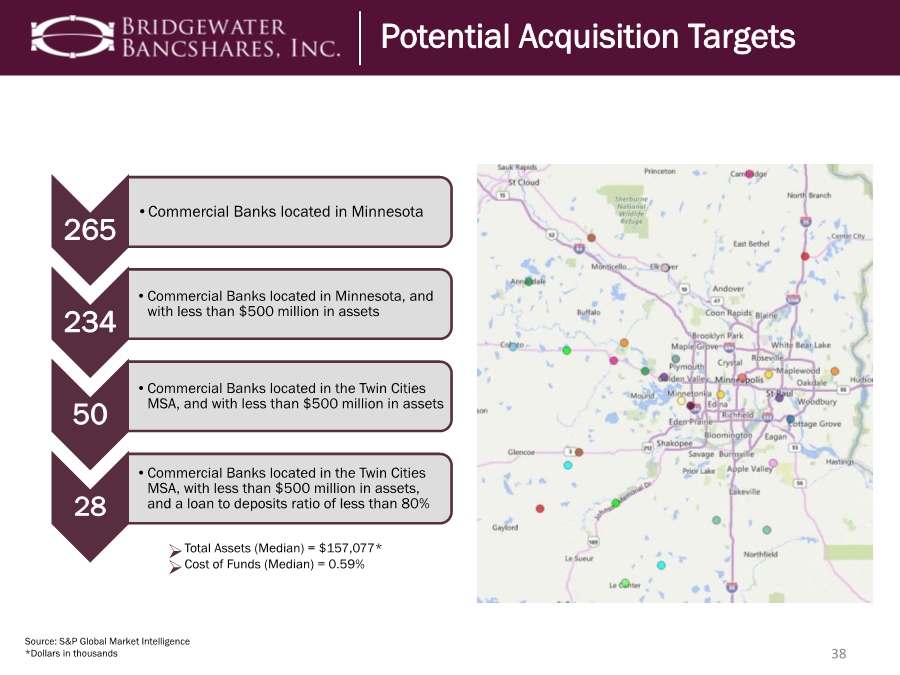
| 38 Source: S&P Global Market Intelligence *Dollars in thousands 265 •Commercial Banks located in Minnesota 234 •Commercial Banks located in Minnesota, and with less than $500 million in assets 50 •Commercial Banks located in the Twin Cities MSA, and with less than $500 million in assets 28 •Commercial Banks located in the Twin Cities MSA, with less than $500 million in assets, and a loan to deposits ratio of less than 80% ➢Total Assets (Median) = $157,077* ➢Cost of Funds (Median) = 0.59% Potential Acquisition Targets |
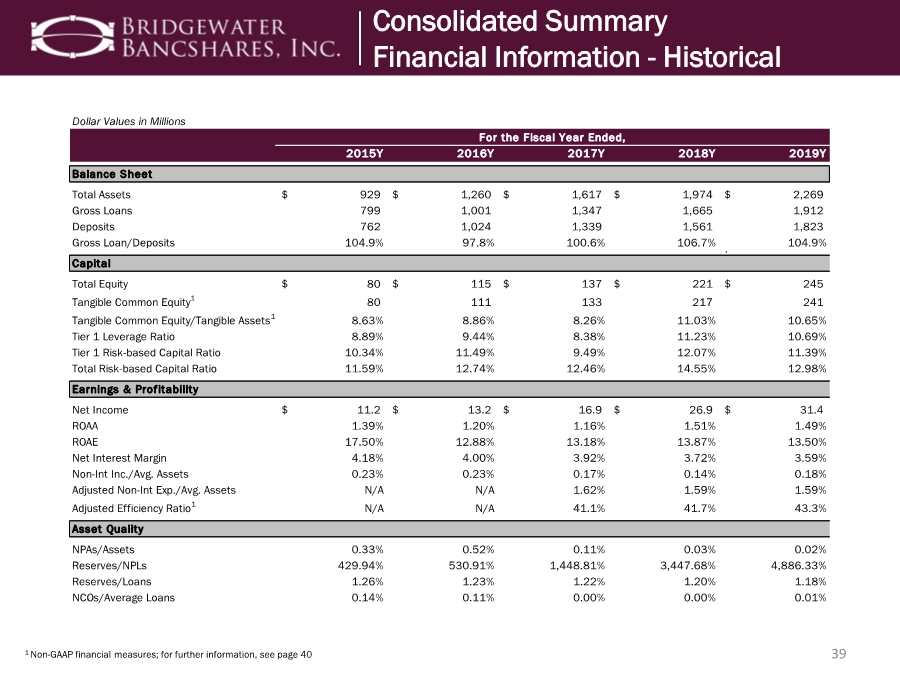
| 39 1 Non-GAAP financial measures; for further information, see page 40 Dollar Values in Millions 2015Y 2016Y 2017Y 2018Y 2019Y Balance Sheet Total Assets 929 $ 1,260 $ 1,617 $ 1,974 $ 2,269 $ Gross Loans 799 1,001 1,347 1,665 1,912 Deposits 762 1,024 1,339 1,561 1,823 Gross Loan/Deposits 104.9% 97.8% 100.6% 106.7% 104.9% \ Capital Total Equity 80 $ 115 $ 137 $ 221 $ 245 $ Tangible Common Equity1 80 111 133 217 241 Tangible Common Equity/Tangible Assets1 8.63% 8.86% 8.26% 11.03% 10.65% Tier 1 Leverage Ratio 8.89% 9.44% 8.38% 11.23% 10.69% Tier 1 Risk-based Capital Ratio 10.34% 11.49% 9.49% 12.07% 11.39% Total Risk-based Capital Ratio 11.59% 12.74% 12.46% 14.55% 12.98% Earnings & Profitability Net Income 11.2 $ 13.2 $ 16.9 $ 26.9 $ 31.4 $ ROAA 1.39% 1.20% 1.16% 1.51% 1.49% ROAE 17.50% 12.88% 13.18% 13.87% 13.50% Net Interest Margin 4.18% 4.00% 3.92% 3.72% 3.59% Non-Int Inc./Avg. Assets 0.23% 0.23% 0.17% 0.14% 0.18% Adjusted Non-Int Exp./Avg. Assets N/A N/A 1.62% 1.59% 1.59% Adjusted Efficiency Ratio1 N/A N/A 41.1% 41.7% 43.3% Asset Quality NPAs/Assets 0.33% 0.52% 0.11% 0.03% 0.02% Reserves/NPLs 429.94% 530.91% 1,448.81% 3,447.68% 4,886.33% Reserves/Loans 1.26% 1.23% 1.22% 1.20% 1.18% NCOs/Average Loans 0.14% 0.11% 0.00% 0.00% 0.01% For the Fiscal Year Ended, Consolidated Summary Financial Information - Historical |
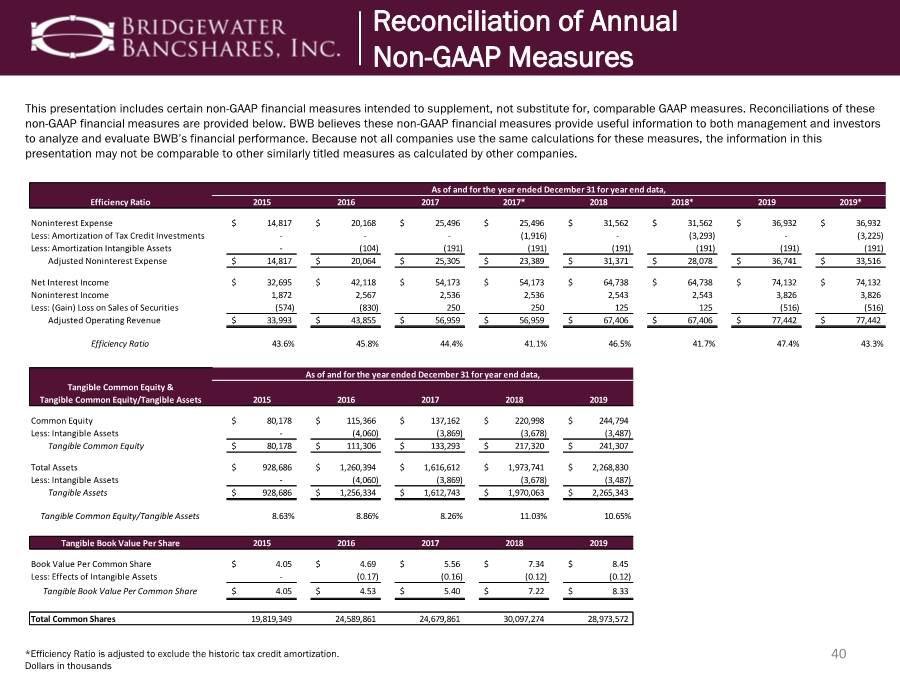
| 40 This presentation includes certain non-GAAP financial measures intended to supplement, not substitute for, comparable GAAP measures. Reconciliations of these non-GAAP financial measures are provided below. BWB believes these non-GAAP financial measures provide useful information to both management and investors to analyze and evaluate BWB’s financial performance. Because not all companies use the same calculations for these measures, the information in this presentation may not be comparable to other similarly titled measures as calculated by other companies. *Efficiency Ratio is adjusted to exclude the historic tax credit amortization. Dollars in thousands Efficiency Ratio 2015 2016 2017 2017* 2018 2018* 2019 2019* Noninterest Expense 14,817 $ 20,168 $ 25,496 $ 25,496 $ 31,562 $ 31,562 $ 36,932 $ 36,932 $ Less: Amortization of Tax Credit Investments - - - (1,916) - (3,293) - (3,225) Less: Amortization Intangible Assets - (104) (191) (191) (191) (191) (191) (191) Adjusted Noninterest Expense 14,817 $ 20,064 $ 25,305 $ 23,389 $ 31,371 $ 28,078 $ 36,741 $ 33,516 $ Net Interest Income 32,695 $ 42,118 $ 54,173 $ 54,173 $ 64,738 $ 64,738 $ 74,132 $ 74,132 $ Noninterest Income 1,872 2,567 2,536 2,536 2,543 2,543 3,826 3,826 Less: (Gain) Loss on Sales of Securities (574) (830) 250 250 125 125 (516) (516) Adjusted Operating Revenue 33,993 $ 43,855 $ 56,959 $ 56,959 $ 67,406 $ 67,406 $ 77,442 $ 77,442 $ Efficiency Ratio 43.6% 45.8% 44.4% 41.1% 46.5% 41.7% 47.4% 43.3% Tangible Common Equity & Tangible Common Equity/Tangible Assets 2015 2016 2017 2018 2019 Common Equity 80,178 $ 115,366 $ 137,162 $ 220,998 $ 244,794 $ Less: Intangible Assets - (4,060) (3,869) (3,678) (3,487) Tangible Common Equity 80,178 $ 111,306 $ 133,293 $ 217,320 $ 241,307 $ Total Assets 928,686 $ 1,260,394 $ 1,616,612 $ 1,973,741 $ 2,268,830 $ Less: Intangible Assets - (4,060) (3,869) (3,678) (3,487) Tangible Assets 928,686 $ 1,256,334 $ 1,612,743 $ 1,970,063 $ 2,265,343 $ Tangible Common Equity/Tangible Assets 8.63% 8.86% 8.26% 11.03% 10.65% Tangible Book Value Per Share 2015 2016 2017 2018 2019 Book Value Per Common Share 4.05 $ 4.69 $ 5.56 $ 7.34 $ 8.45 $ Less: Effects of Intangible Assets - (0.17) (0.16) (0.12) (0.12) Tangible Book Value Per Common Share 4.05 $ 4.53 $ 5.40 $ 7.22 $ 8.33 $ Total Common Shares 19,819,349 24,589,861 24,679,861 30,097,274 28,973,572 As of and for the year ended December 31 for year end data, As of and for the year ended December 31 for year end data, Reconciliation of Annual Non-GAAP Measures |
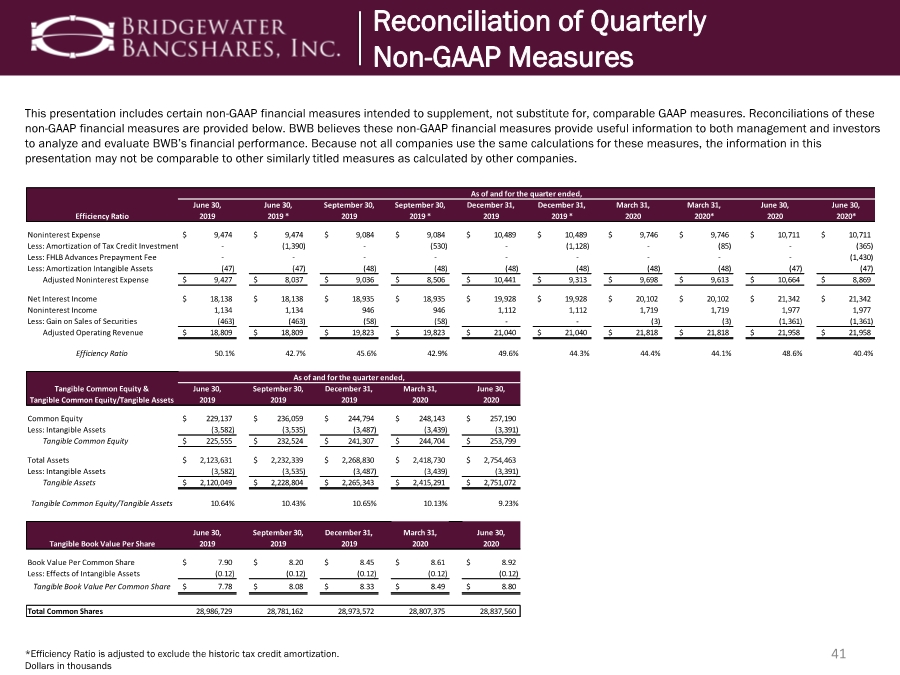
| 41 This presentation includes certain non-GAAP financial measures intended to supplement, not substitute for, comparable GAAP measures. Reconciliations of these non-GAAP financial measures are provided below. BWB believes these non-GAAP financial measures provide useful information to both management and investors to analyze and evaluate BWB’s financial performance. Because not all companies use the same calculations for these measures, the information in this presentation may not be comparable to other similarly titled measures as calculated by other companies. *Efficiency Ratio is adjusted to exclude the historic tax credit amortization. Dollars in thousands Efficiency Ratio June 30, 2019 June 30, 2019 * September 30, 2019 September 30, 2019 * December 31, 2019 December 31, 2019 * March 31, 2020 March 31, 2020* June 30, 2020 June 30, 2020* Noninterest Expense 9,474 $ 9,474 $ 9,084 $ 9,084 $ 10,489 $ 10,489 $ 9,746 $ 9,746 $ 10,711 $ 10,711 $ Less: Amortization of Tax Credit Investments - (1,390) - (530) - (1,128) - (85) - (365) Less: FHLB Advances Prepayment Fee - - - - - - - - - (1,430) Less: Amortization Intangible Assets (47) (47) (48) (48) (48) (48) (48) (48) (47) (47) Adjusted Noninterest Expense 9,427 $ 8,037 $ 9,036 $ 8,506 $ 10,441 $ 9,313 $ 9,698 $ 9,613 $ 10,664 $ 8,869 $ Net Interest Income 18,138 $ 18,138 $ 18,935 $ 18,935 $ 19,928 $ 19,928 $ 20,102 $ 20,102 $ 21,342 $ 21,342 $ Noninterest Income 1,134 1,134 946 946 1,112 1,112 1,719 1,719 1,977 1,977 Less: Gain on Sales of Securities (463) (463) (58) (58) - - (3) (3) (1,361) (1,361) Adjusted Operating Revenue 18,809 $ 18,809 $ 19,823 $ 19,823 $ 21,040 $ 21,040 $ 21,818 $ 21,818 $ 21,958 $ 21,958 $ Efficiency Ratio 50.1% 42.7% 45.6% 42.9% 49.6% 44.3% 44.4% 44.1% 48.6% 40.4% Tangible Common Equity & Tangible Common Equity/Tangible Assets June 30, 2019 September 30, 2019 December 31, 2019 March 31, 2020 June 30, 2020 Common Equity 229,137 $ 236,059 $ 244,794 $ 248,143 $ 257,190 $ Less: Intangible Assets (3,582) (3,535) (3,487) (3,439) (3,391) Tangible Common Equity 225,555 $ 232,524 $ 241,307 $ 244,704 $ 253,799 $ Total Assets 2,123,631 $ 2,232,339 $ 2,268,830 $ 2,418,730 $ 2,754,463 $ Less: Intangible Assets (3,582) (3,535) (3,487) (3,439) (3,391) Tangible Assets 2,120,049 $ 2,228,804 $ 2,265,343 $ 2,415,291 $ 2,751,072 $ Tangible Common Equity/Tangible Assets 10.64% 10.43% 10.65% 10.13% 9.23% Tangible Book Value Per Share June 30, 2019 September 30, 2019 December 31, 2019 March 31, 2020 June 30, 2020 Book Value Per Common Share 7.90 $ 8.20 $ 8.45 $ 8.61 $ 8.92 $ Less: Effects of Intangible Assets (0.12) (0.12) (0.12) (0.12) (0.12) Tangible Book Value Per Common Share 7.78 $ 8.08 $ 8.33 $ 8.49 $ 8.80 $ Total Common Shares 28,986,729 28,781,162 28,973,572 28,807,375 28,837,560 As of and for the quarter ended, As of and for the quarter ended, Reconciliation of Quarterly Non-GAAP Measures |
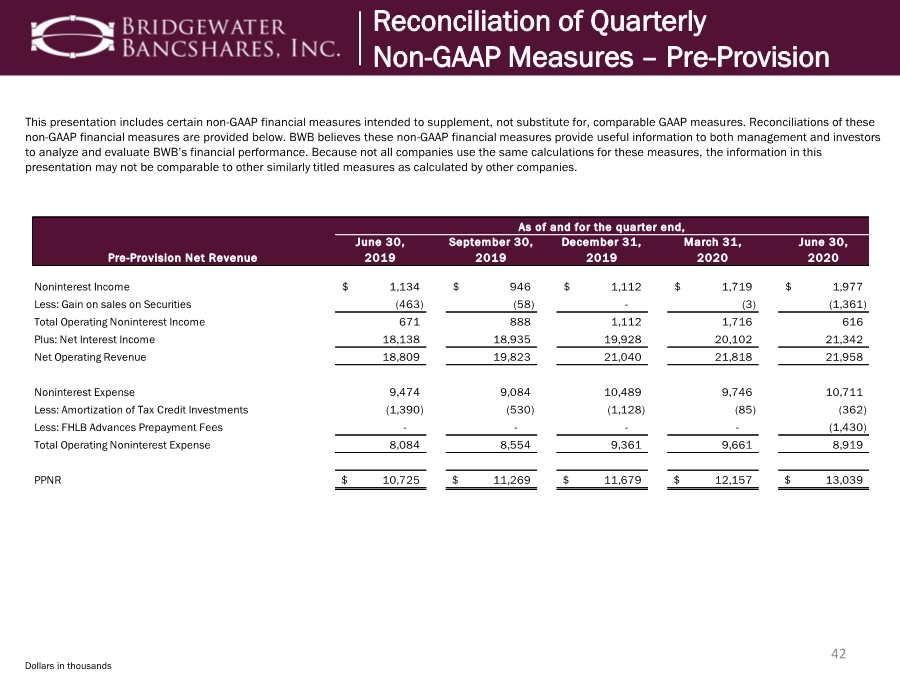
| 42 This presentation includes certain non-GAAP financial measures intended to supplement, not substitute for, comparable GAAP measures. Reconciliations of these non-GAAP financial measures are provided below. BWB believes these non-GAAP financial measures provide useful information to both management and investors to analyze and evaluate BWB’s financial performance. Because not all companies use the same calculations for these measures, the information in this presentation may not be comparable to other similarly titled measures as calculated by other companies. Dollars in thousands Pre-Provision Net Revenue June 30, 2019 September 30, 2019 December 31, 2019 March 31, 2020 June 30, 2020 Noninterest Income 1,134 $ 946 $ 1,112 $ 1,719 $ 1,977 $ Less: Gain on sales on Securities (463) (58) - (3) (1,361) Total Operating Noninterest Income 671 888 1,112 1,716 616 Plus: Net Interest Income 18,138 18,935 19,928 20,102 21,342 Net Operating Revenue 18,809 19,823 21,040 21,818 21,958 Noninterest Expense 9,474 9,084 10,489 9,746 10,711 Less: Amortization of Tax Credit Investments (1,390) (530) (1,128) (85) (362) Less: FHLB Advances Prepayment Fees - - - - (1,430) Total Operating Noninterest Expense 8,084 8,554 9,361 9,661 8,919 PPNR 10,725 $ 11,269 $ 11,679 $ 12,157 $ 13,039 $ As of and for the quarter end, Reconciliation of Quarterly Non-GAAP Measures – Pre-Provision |
|