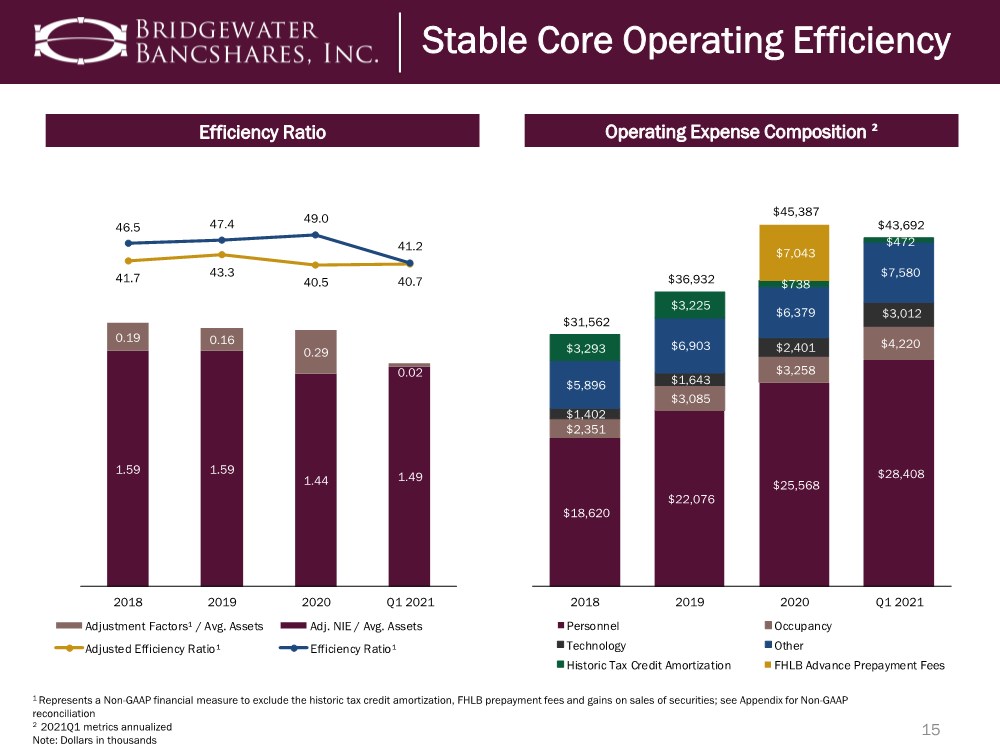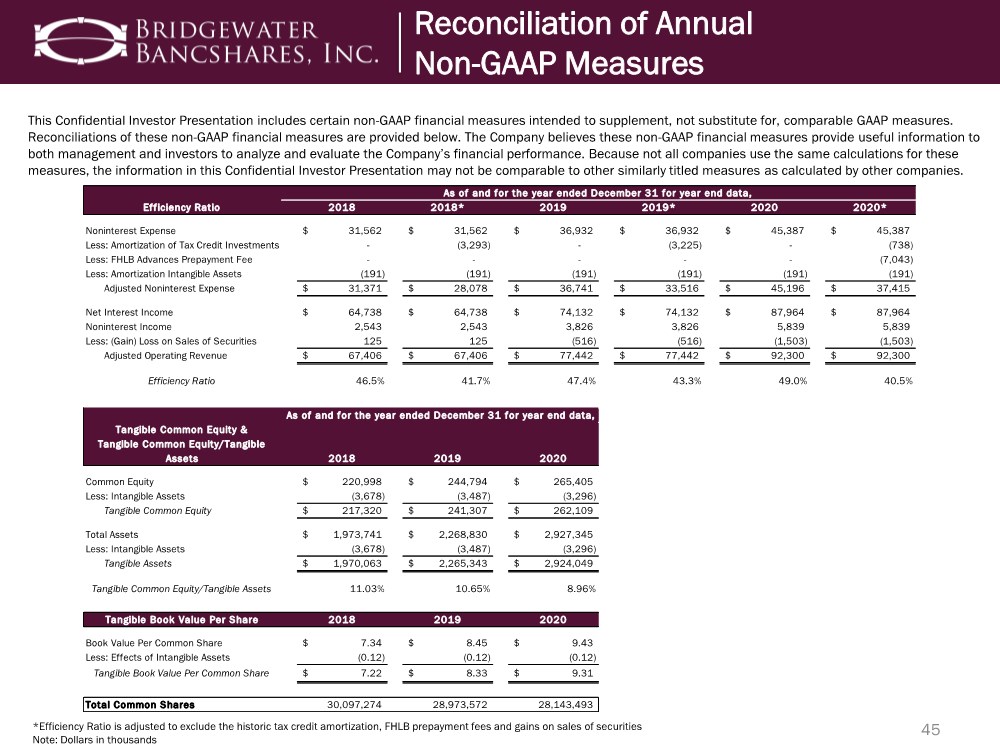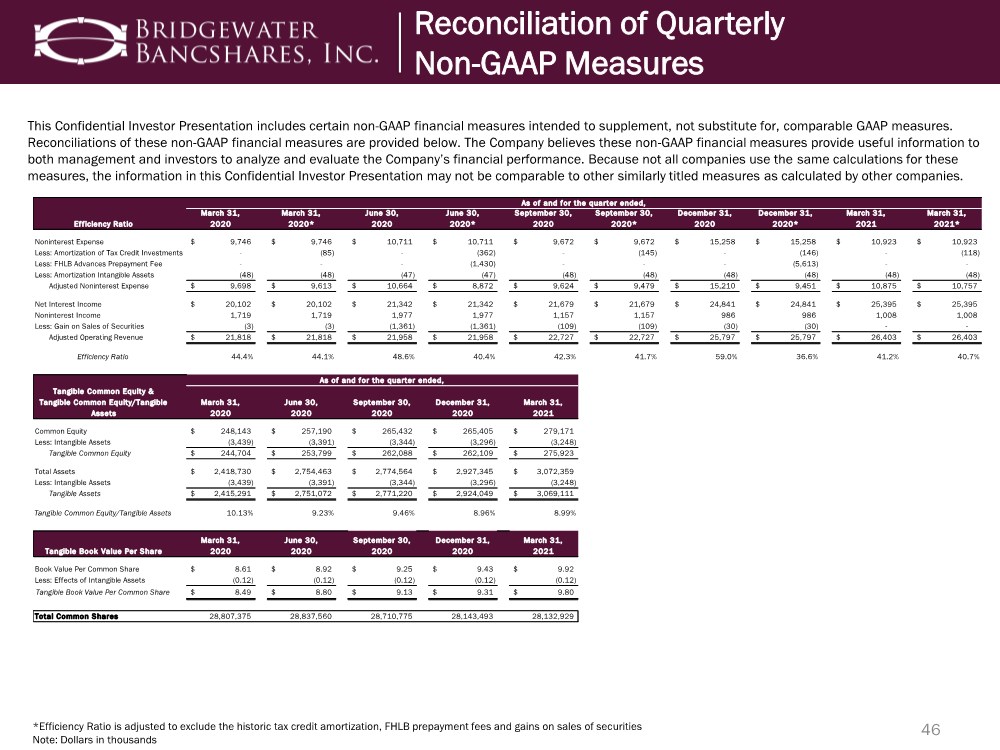
| This Confidential Investor Presentation includes certain non-GAAP financial measures intended to supplement, not substitute for, comparable GAAP measures. Reconciliations of these non-GAAP financial measures are provided below. The Company believes these non-GAAP financial measures provide useful information to both management and investors to analyze and evaluate the Company’s financial performance. Because not all companies use the same calculations for these measures, the information in this Confidential Investor Presentation may not be comparable to other similarly titled measures as calculated by other companies. *Efficiency Ratio is adjusted to exclude the historic tax credit amortization, FHLB prepayment fees and gains on sales of securities Note: Dollars in thousands Reconciliation of Quarterly Non-GAAP Measures Efficiency Ratio March 31, 2020 March 31, 2020* June 30, 2020 June 30, 2020* September 30, 2020 September 30, 2020* December 31, 2020 December 31, 2020* March 31, 2021 March 31, 2021* Noninterest Expense 9,746 $ 9,746 $ 10,711 $ 10,711 $ 9,672 $ 9,672 $ 15,258 $ 15,258 $ 10,923 $ 10,923 $ Less: Amortization of Tax Credit Investments - (85) - (362) - (145) - (146) - (118) Less: FHLB Advances Prepayment Fee - - - (1,430) - - - (5,613) - - Less: Amortization Intangible Assets (48) (48) (47) (47) (48) (48) (48) (48) (48) (48) Adjusted Noninterest Expense 9,698 $ 9,613 $ 10,664 $ 8,872 $ 9,624 $ 9,479 $ 15,210 $ 9,451 $ 10,875 $ 10,757 $ Net Interest Income 20,102 $ 20,102 $ 21,342 $ 21,342 $ 21,679 $ 21,679 $ 24,841 $ 24,841 $ 25,395 $ 25,395 $ Noninterest Income 1,719 1,719 1,977 1,977 1,157 1,157 986 986 1,008 1,008 Less: Gain on Sales of Securities (3) (3) (1,361) (1,361) (109) (109) (30) (30) - - Adjusted Operating Revenue 21,818 $ 21,818 $ 21,958 $ 21,958 $ 22,727 $ 22,727 $ 25,797 $ 25,797 $ 26,403 $ 26,403 $ Efficiency Ratio 44.4% 44.1% 48.6% 40.4% 42.3% 41.7% 59.0% 36.6% 41.2% 40.7% Tangible Common Equity & Tangible Common Equity/Tangible Assets March 31, 2020 June 30, 2020 September 30, 2020 December 31, 2020 March 31, 2021 Common Equity 248,143 $ 257,190 $ 265,432 $ 265,405 $ 279,171 $ Less: Intangible Assets (3,439) (3,391) (3,344) (3,296) (3,248) Tangible Common Equity 244,704 $ 253,799 $ 262,088 $ 262,109 $ 275,923 $ Total Assets 2,418,730 $ 2,754,463 $ 2,774,564 $ 2,927,345 $ 3,072,359 $ Less: Intangible Assets (3,439) (3,391) (3,344) (3,296) (3,248) Tangible Assets 2,415,291 $ 2,751,072 $ 2,771,220 $ 2,924,049 $ 3,069,111 $ Tangible Common Equity/Tangible Assets 10.13% 9.23% 9.46% 8.96% 8.99% Tangible Book Value Per Share March 31, 2020 June 30, 2020 September 30, 2020 December 31, 2020 March 31, 2021 Book Value Per Common Share 8.61 $ 8.92 $ 9.25 $ 9.43 $ 9.92 $ Less: Effects of Intangible Assets (0.12) (0.12) (0.12) (0.12) (0.12) Tangible Book Value Per Common Share 8.49 $ 8.80 $ 9.13 $ 9.31 $ 9.80 $ Total Common Shares 28,807,375 28,837,560 28,710,775 28,143,493 28,132,929 As of and for the quarter ended, As of and for the quarter ended, 46 |