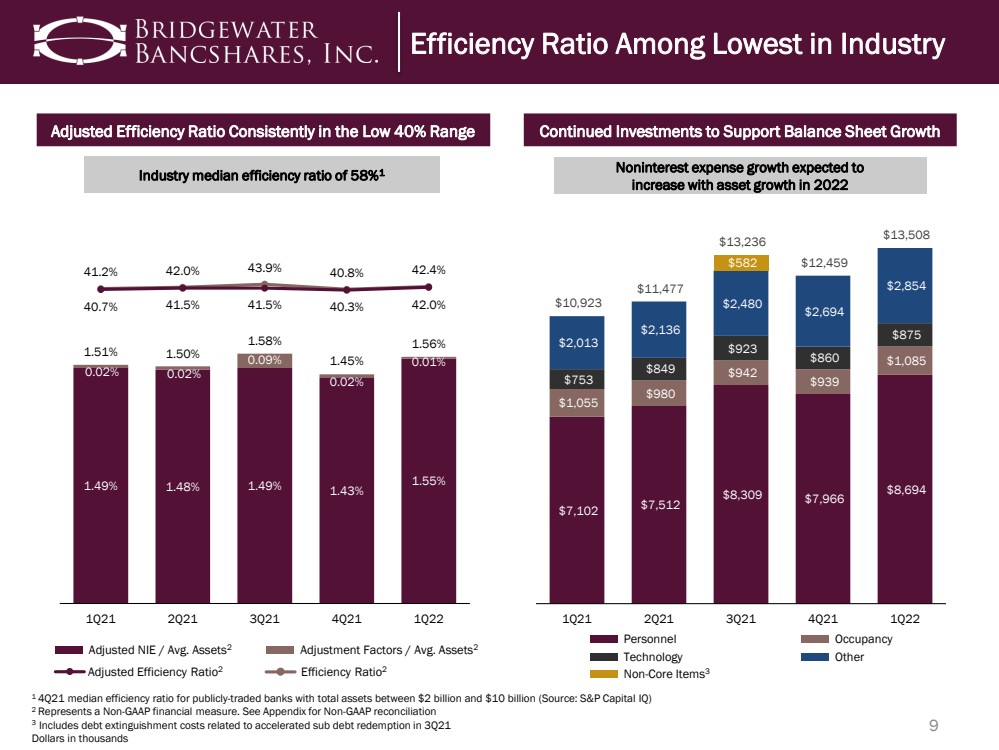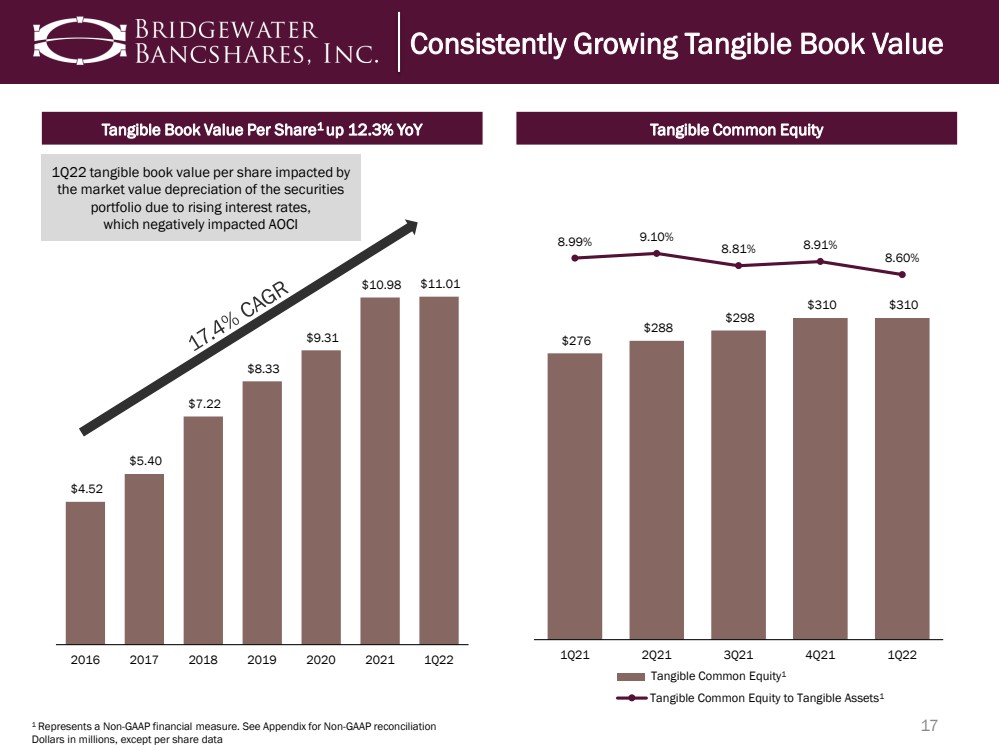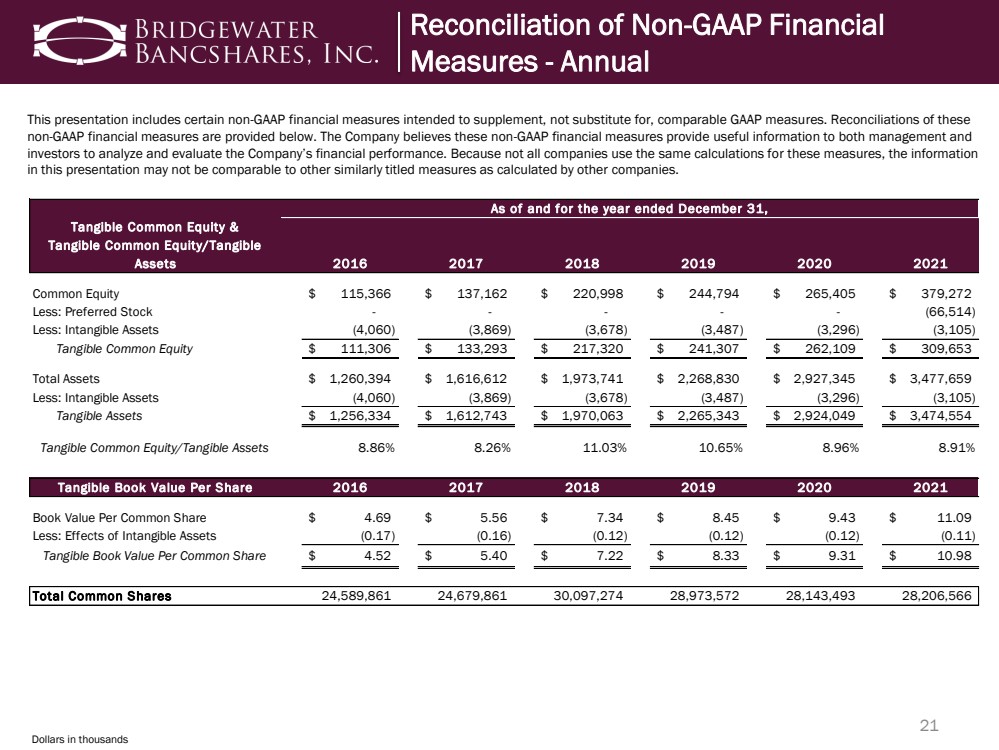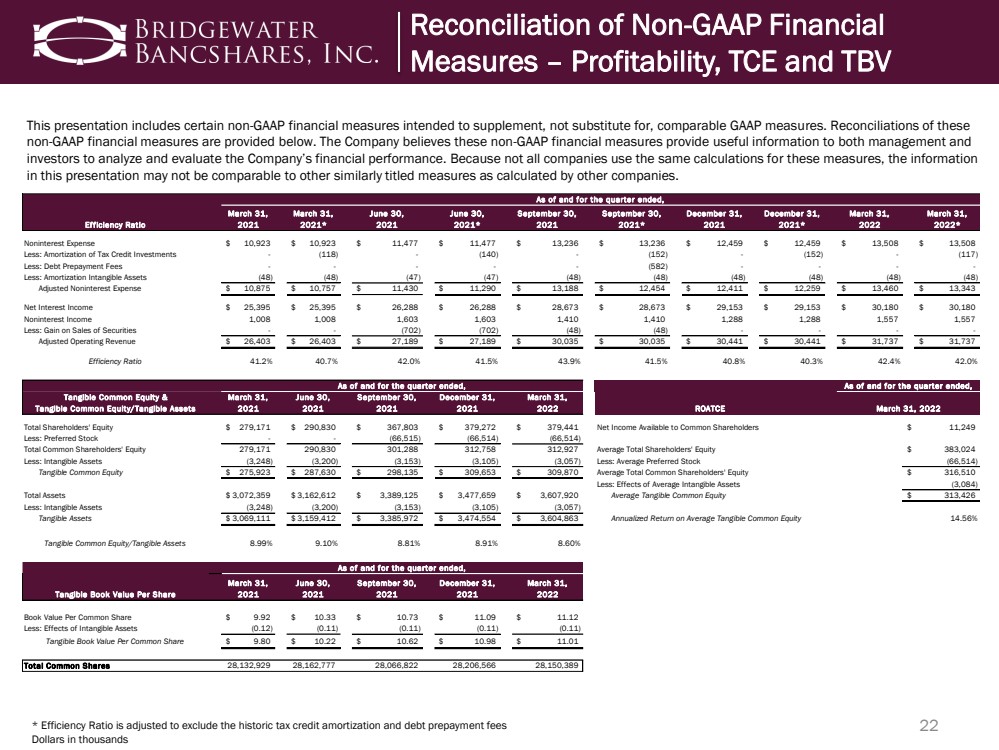
| 22 This presentation includes certain non - GAAP financial measures intended to supplement, not substitute for, comparable GAAP measu res. Reconciliations of these non - GAAP financial measures are provided below. The Company believes these non - GAAP financial measures provide useful informatio n to both management and investors to analyze and evaluate the Company’s financial performance. Because not all companies use the same calculations fo r t hese measures, the information in this presentation may not be comparable to other similarly titled measures as calculated by other companies. * Efficiency Ratio is adjusted to exclude the historic tax credit amortization and debt prepayment fees Dollars in thousands Reconciliation of Non - GAAP Financial Measures – Profitability, TCE and TBV Efficiency Ratio March 31, 2021 March 31, 2021* June 30, 2021 June 30, 2021* September 30, 2021 September 30, 2021* December 31, 2021 December 31, 2021* March 31, 2022 March 31, 2022* Noninterest Expense 10,923 $ 10,923 $ 11,477 $ 11,477 $ 13,236 $ 13,236 $ 12,459 $ 12,459 $ 13,508 $ 13,508 $ Less: Amortization of Tax Credit Investments - (118) - (140) - (152) - (152) - (117) Less: Debt Prepayment Fees - - - - - (582) - - - - Less: Amortization Intangible Assets (48) (48) (47) (47) (48) (48) (48) (48) (48) (48) Adjusted Noninterest Expense 10,875 $ 10,757 $ 11,430 $ 11,290 $ 13,188 $ 12,454 $ 12,411 $ 12,259 $ 13,460 $ 13,343 $ Net Interest Income 25,395 $ 25,395 $ 26,288 $ 26,288 $ 28,673 $ 28,673 $ 29,153 $ 29,153 $ 30,180 $ 30,180 $ Noninterest Income 1,008 1,008 1,603 1,603 1,410 1,410 1,288 1,288 1,557 1,557 Less: Gain on Sales of Securities - - (702) (702) (48) (48) - - - - Adjusted Operating Revenue 26,403 $ 26,403 $ 27,189 $ 27,189 $ 30,035 $ 30,035 $ 30,441 $ 30,441 $ 31,737 $ 31,737 $ Efficiency Ratio 41.2% 40.7% 42.0% 41.5% 43.9% 41.5% 40.8% 40.3% 42.4% 42.0% Tangible Common Equity & Tangible Common Equity/Tangible Assets March 31, 2021 June 30, 2021 September 30, 2021 December 31, 2021 March 31, 2022 Total Shareholders' Equity 279,171 $ 290,830 $ 367,803 $ 379,272 $ 379,441 $ Net Income Available to Common Shareholders Less: Preferred Stock - - (66,515) (66,514) (66,514) Total Common Shareholders' Equity 279,171 290,830 301,288 312,758 312,927 Average Total Shareholders' Equity Less: Intangible Assets (3,248) (3,200) (3,153) (3,105) (3,057) Less: Average Preferred Stock Tangible Common Equity 275,923 $ 287,630 $ 298,135 $ 309,653 $ 309,870 $ Average Total Common Shareholders' Equity Less: Effects of Average Intangible Assets Total Assets 3,072,359 $ 3,162,612 $ 3,389,125 $ 3,477,659 $ 3,607,920 $ Average Tangible Common Equity Less: Intangible Assets (3,248) (3,200) (3,153) (3,105) (3,057) Tangible Assets 3,069,111 $ 3,159,412 $ 3,385,972 $ 3,474,554 $ 3,604,863 $ Annualized Return on Average Tangible Common Equity Tangible Common Equity/Tangible Assets 8.99% 9.10% 8.81% 8.91% 8.60% Tangible Book Value Per Share March 31, 2021 June 30, 2021 September 30, 2021 December 31, 2021 March 31, 2022 Book Value Per Common Share 9.92 $ 10.33 $ 10.73 $ 11.09 $ 11.12 $ Less: Effects of Intangible Assets (0.12) (0.11) (0.11) (0.11) (0.11) Tangible Book Value Per Common Share 9.80 $ 10.22 $ 10.62 $ 10.98 $ 11.01 $ Total Common Shares 28,132,929 28,162,777 28,066,822 28,206,566 28,150,389 As of and for the quarter ended, As of and for the quarter ended, As of and for the quarter ended, As of and for the quarter ended, March 31, 2022 ROATCE 11,249 $ 383,024 $ 316,510 $ (66,514) (3,084) 14.56% 313,426 $ |