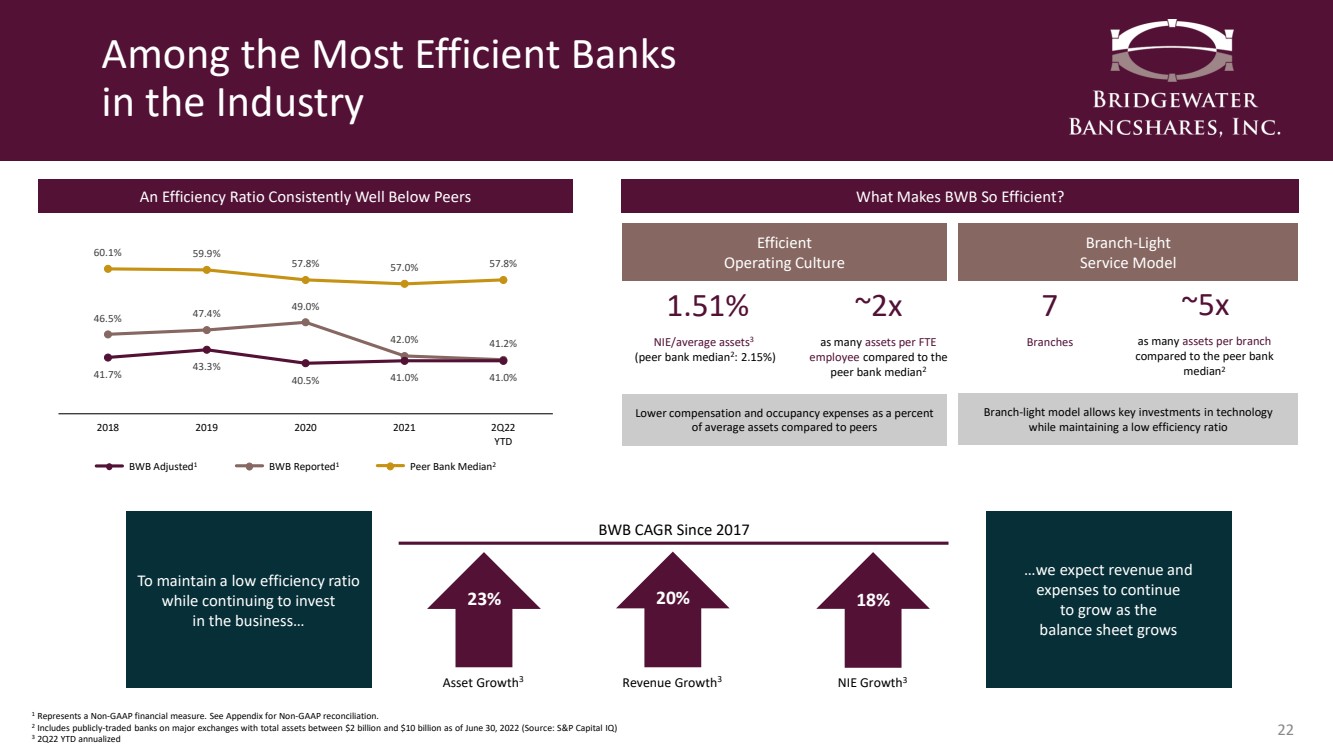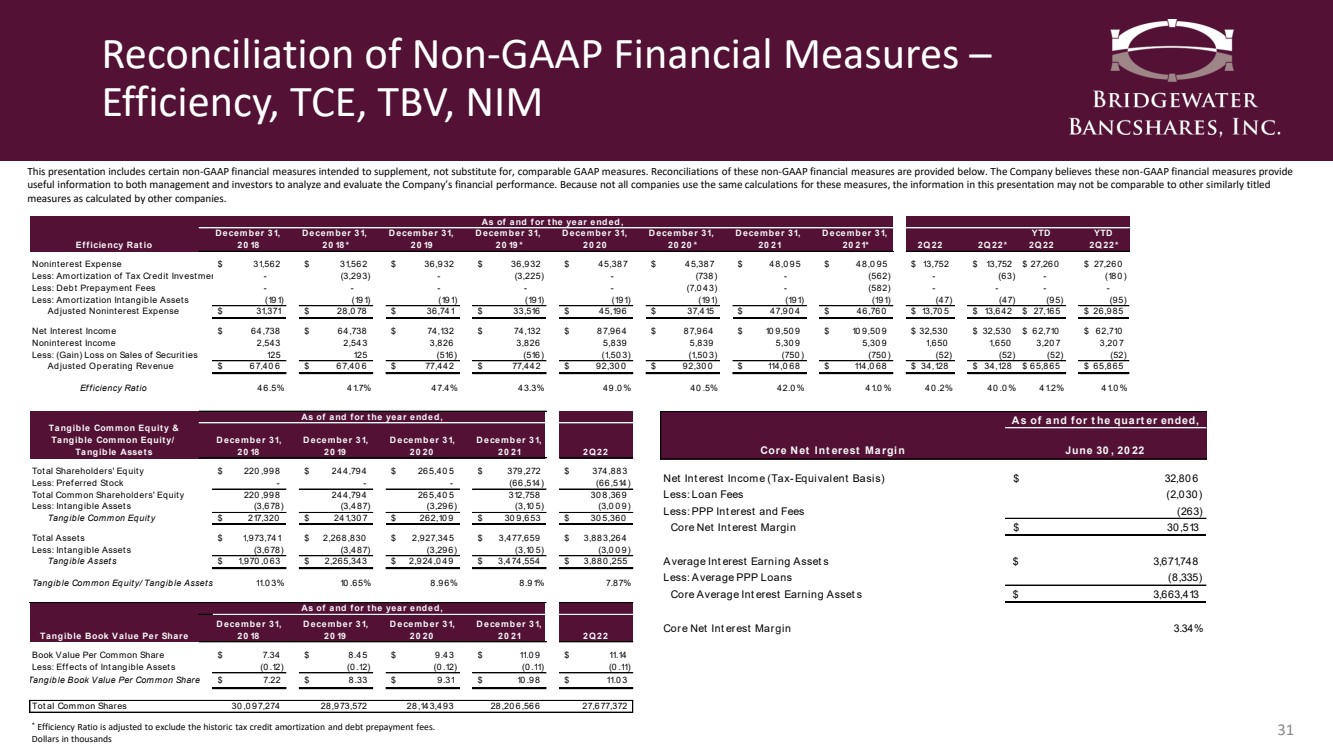
| Reconciliation of Non - GAAP Financial Measures – Efficiency, TCE, TBV, NIM 31 This presentation includes certain non - GAAP financial measures intended to supplement, not substitute for, comparable GAAP measu res. Reconciliations of these non - GAAP financial measures are provided below. The Company believes these non - GAAP financial meas ures provide useful information to both management and investors to analyze and evaluate the Company’s financial performance. Because not all companies use the same calculations for these measures, the information in this presentation may not be comparable to other s im ilarly titled measures as calculated by other companies. * Efficiency Ratio is adjusted to exclude the historic tax credit amortization and debt prepayment fees. Dollars in thousands Core Net Interest Margin June 30, 2022 Net Interest Income (Tax-Equivalent Basis) 32,806 $ Less: Loan Fees (2,030) Less: PPP Interest and Fees (263) Core Net Interest Margin 30,513 $ Average Interest Earning Assets 3,671,748 $ Less: Average PPP Loans (8,335) Core Average Interest Earning Assets 3,663,413 $ Core Net Interest Margin 3.34% As of and for the quarter ended, December 31, December 31, December 31, December 31, December 31, December 31, December 31, December 31, YTD YTD Efficiency Ratio 2018 2018* 2019 2019* 2020 2020* 2021 2021* 2Q22 2Q22* 2Q22 2Q22* Noninterest Expense 31,562 $ 31,562 $ 36,932 $ 36,932 $ 45,387 $ 45,387 $ 48,095 $ 48,095 $ 13,752 $ 13,752 $ 27,260 $ 27,260 $ Less: Amortization of Tax Credit Investments - (3,293) - (3,225) - (738) - (562) - (63) - (180) Less: Debt Prepayment Fees - - - - - (7,043) - (582) - - - - Less: Amortization Intangible Assets (191) (191) (191) (191) (191) (191) (191) (191) (47) (47) (95) (95) Adjusted Noninterest Expense 31,371 $ 28,078 $ 36,741 $ 33,516 $ 45,196 $ 37,415 $ 47,904 $ 46,760 $ 13,705 $ 13,642 $ 27,165 $ 26,985 $ Net Interest Income 64,738 $ 64,738 $ 74,132 $ 74,132 $ 87,964 $ 87,964 $ 109,509 $ 109,509 $ 32,530 $ 32,530 $ 62,710 $ 62,710 $ Noninterest Income 2,543 2,543 3,826 3,826 5,839 5,839 5,309 5,309 1,650 1,650 3,207 3,207 Less: (Gain) Loss on Sales of Securities 125 125 (516) (516) (1,503) (1,503) (750) (750) (52) (52) (52) (52) Adjusted Operating Revenue 67,406 $ 67,406 $ 77,442 $ 77,442 $ 92,300 $ 92,300 $ 114,068 $ 114,068 $ 34,128 $ 34,128 $ 65,865 $ 65,865 $ Efficiency Ratio 46.5% 41.7% 47.4% 43.3% 49.0% 40.5% 42.0% 41.0% 40.2% 40.0% 41.2% 41.0% Tangible Common Equity & Tangible Common Equity/ Tangible Assets December 31, 2018 December 31, 2019 December 31, 2020 December 31, 2021 2Q22 Total Shareholders' Equity 220,998 $ 244,794 $ 265,405 $ 379,272 $ 374,883 $ Less: Preferred Stock - - - (66,514) (66,514) Total Common Shareholders' Equity 220,998 244,794 265,405 312,758 308,369 Less: Intangible Assets (3,678) (3,487) (3,296) (3,105) (3,009) Tangible Common Equity 217,320 $ 241,307 $ 262,109 $ 309,653 $ 305,360 $ Total Assets 1,973,741 $ 2,268,830 $ 2,927,345 $ 3,477,659 $ 3,883,264 $ Less: Intangible Assets (3,678) (3,487) (3,296) (3,105) (3,009) Tangible Assets 1,970,063 $ 2,265,343 $ 2,924,049 $ 3,474,554 $ 3,880,255 $ Tangible Common Equity/Tangible Assets 11.03% 10.65% 8.96% 8.91% 7.87% Tangible Book Value Per Share December 31, 2018 December 31, 2019 December 31, 2020 December 31, 2021 2Q22 Book Value Per Common Share 7.34 $ 8.45 $ 9.43 $ 11.09 $ 11.14 $ Less: Effects of Intangible Assets (0.12) (0.12) (0.12) (0.11) (0.11) Tangible Book Value Per Common Share 7.22 $ 8.33 $ 9.31 $ 10.98 $ 11.03 $ Total Common Shares 30,097,274 28,973,572 28,143,493 28,206,566 27,677,372 As of and for the year ended, As of and for the year ended, As of and for the year ended, |