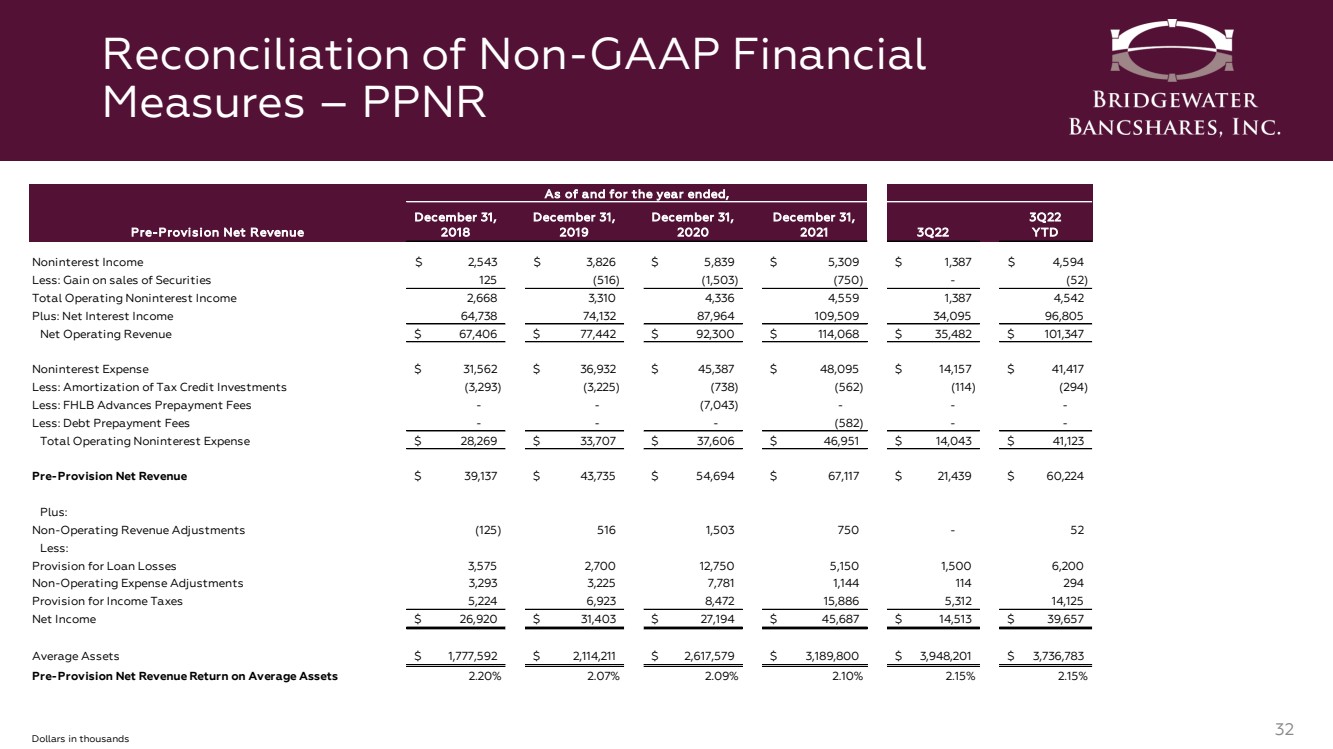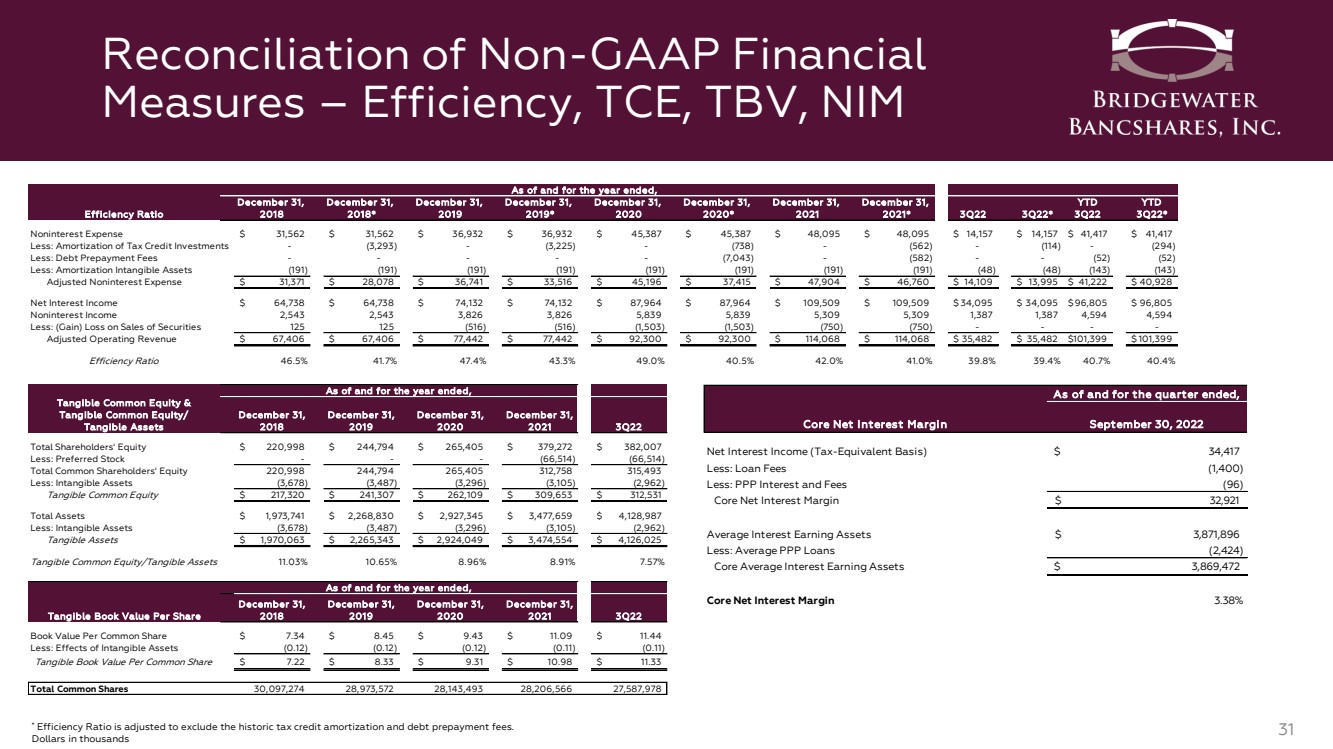
| Reconciliation of Non - GAAP Financial Measures – Efficiency, TCE, TBV, NIM 31 * Efficiency Ratio is adjusted to exclude the historic tax credit amortization and debt prepayment fees. Dollars in thousands Core Net Interest Margin September 30, 2022 Net Interest Income (Tax-Equivalent Basis) 34,417 $ Less: Loan Fees (1,400) Less: PPP Interest and Fees (96) Core Net Interest Margin 32,921 $ Average Interest Earning Assets 3,871,896 $ Less: Average PPP Loans (2,424) Core Average Interest Earning Assets 3,869,472 $ Core Net Interest Margin 3.38% As of and for the quarter ended, December 31, December 31, December 31, December 31, December 31, December 31, December 31, December 31, YTD YTD Efficiency Ratio 2018 2018* 2019 2019* 2020 2020* 2021 2021* 3Q22 3Q22* 3Q22 3Q22* Noninterest Expense 31,562 $ 31,562 $ 36,932 $ 36,932 $ 45,387 $ 45,387 $ 48,095 $ 48,095 $ 14,157 $ 14,157 $ 41,417 $ 41,417 $ Less: Amortization of Tax Credit Investments - (3,293) - (3,225) - (738) - (562) - (114) - (294) Less: Debt Prepayment Fees - - - - - (7,043) - (582) - - (52) (52) Less: Amortization Intangible Assets (191) (191) (191) (191) (191) (191) (191) (191) (48) (48) (143) (143) Adjusted Noninterest Expense 31,371 $ 28,078 $ 36,741 $ 33,516 $ 45,196 $ 37,415 $ 47,904 $ 46,760 $ 14,109 $ 13,995 $ 41,222 $ 40,928 $ Net Interest Income 64,738 $ 64,738 $ 74,132 $ 74,132 $ 87,964 $ 87,964 $ 109,509 $ 109,509 $ 34,095 $ 34,095 $ 96,805 $ 96,805 $ Noninterest Income 2,543 2,543 3,826 3,826 5,839 5,839 5,309 5,309 1,387 1,387 4,594 4,594 Less: (Gain) Loss on Sales of Securities 125 125 (516) (516) (1,503) (1,503) (750) (750) - - - - Adjusted Operating Revenue 67,406 $ 67,406 $ 77,442 $ 77,442 $ 92,300 $ 92,300 $ 114,068 $ 114,068 $ 35,482 $ 35,482 $ 101,399 $ 101,399 $ Efficiency Ratio 46.5% 41.7% 47.4% 43.3% 49.0% 40.5% 42.0% 41.0% 39.8% 39.4% 40.7% 40.4% Tangible Common Equity & Tangible Common Equity/ Tangible Assets December 31, 2018 December 31, 2019 December 31, 2020 December 31, 2021 3Q22 Total Shareholders' Equity 220,998 $ 244,794 $ 265,405 $ 379,272 $ 382,007 $ Less: Preferred Stock - - - (66,514) (66,514) Total Common Shareholders' Equity 220,998 244,794 265,405 312,758 315,493 Less: Intangible Assets (3,678) (3,487) (3,296) (3,105) (2,962) Tangible Common Equity 217,320 $ 241,307 $ 262,109 $ 309,653 $ 312,531 $ Total Assets 1,973,741 $ 2,268,830 $ 2,927,345 $ 3,477,659 $ 4,128,987 $ Less: Intangible Assets (3,678) (3,487) (3,296) (3,105) (2,962) Tangible Assets 1,970,063 $ 2,265,343 $ 2,924,049 $ 3,474,554 $ 4,126,025 $ Tangible Common Equity/Tangible Assets 11.03% 10.65% 8.96% 8.91% 7.57% Tangible Book Value Per Share December 31, 2018 December 31, 2019 December 31, 2020 December 31, 2021 3Q22 Book Value Per Common Share 7.34 $ 8.45 $ 9.43 $ 11.09 $ 11.44 $ Less: Effects of Intangible Assets (0.12) (0.12) (0.12) (0.11) (0.11) Tangible Book Value Per Common Share 7.22 $ 8.33 $ 9.31 $ 10.98 $ 11.33 $ Total Common Shares 30,097,274 28,973,572 28,143,493 28,206,566 27,587,978 As of and for the year ended, As of and for the year ended, As of and for the year ended, |