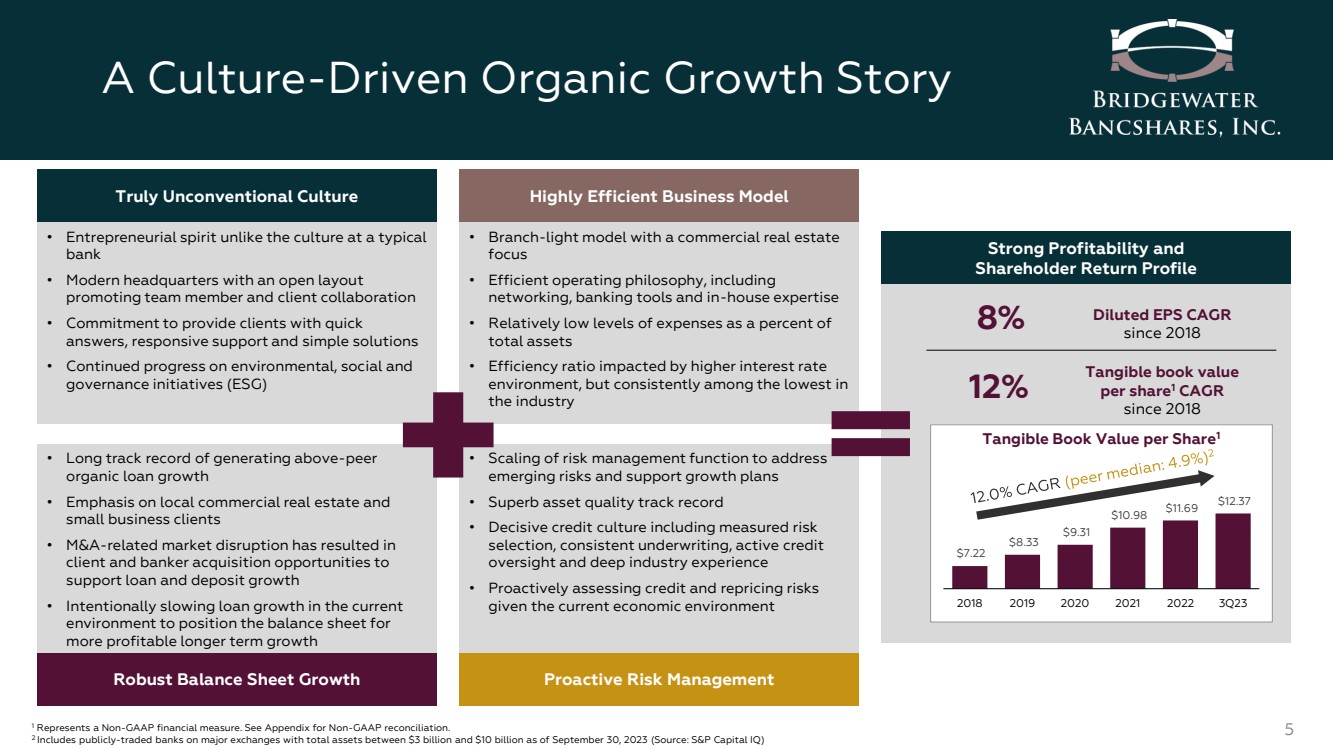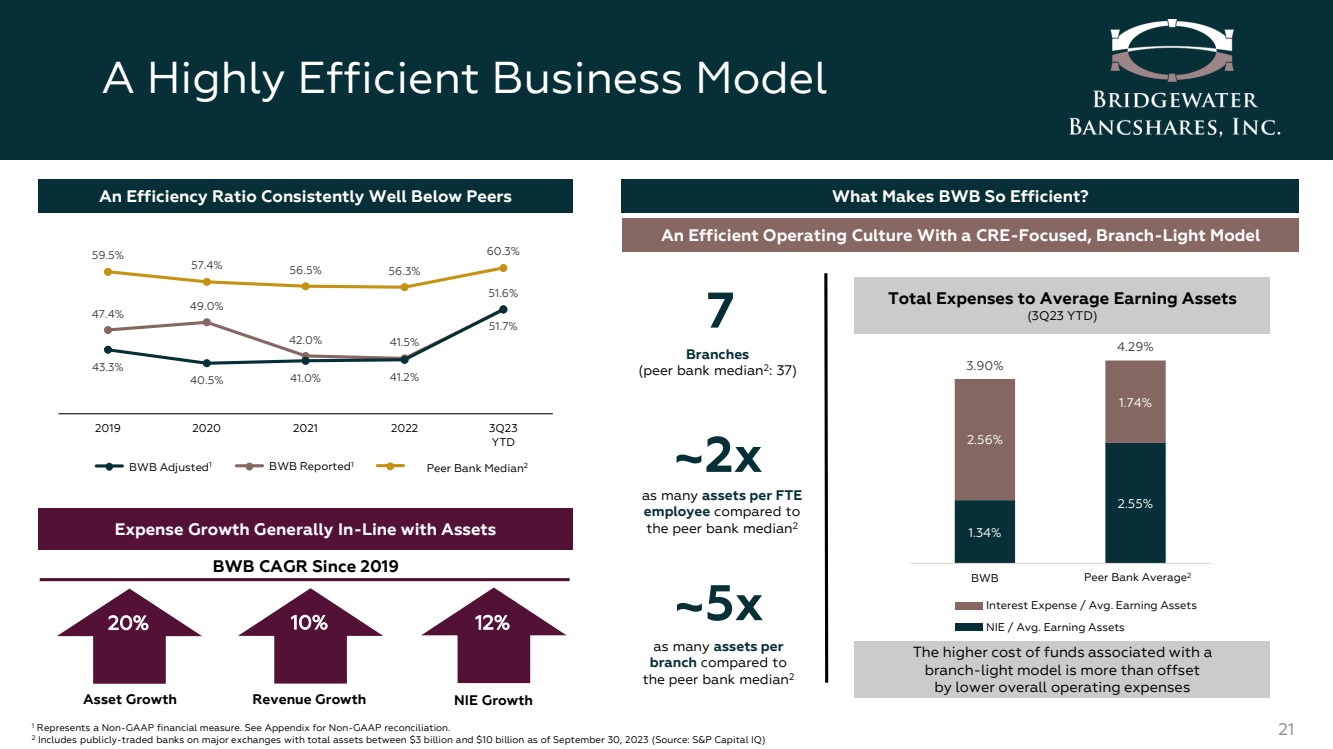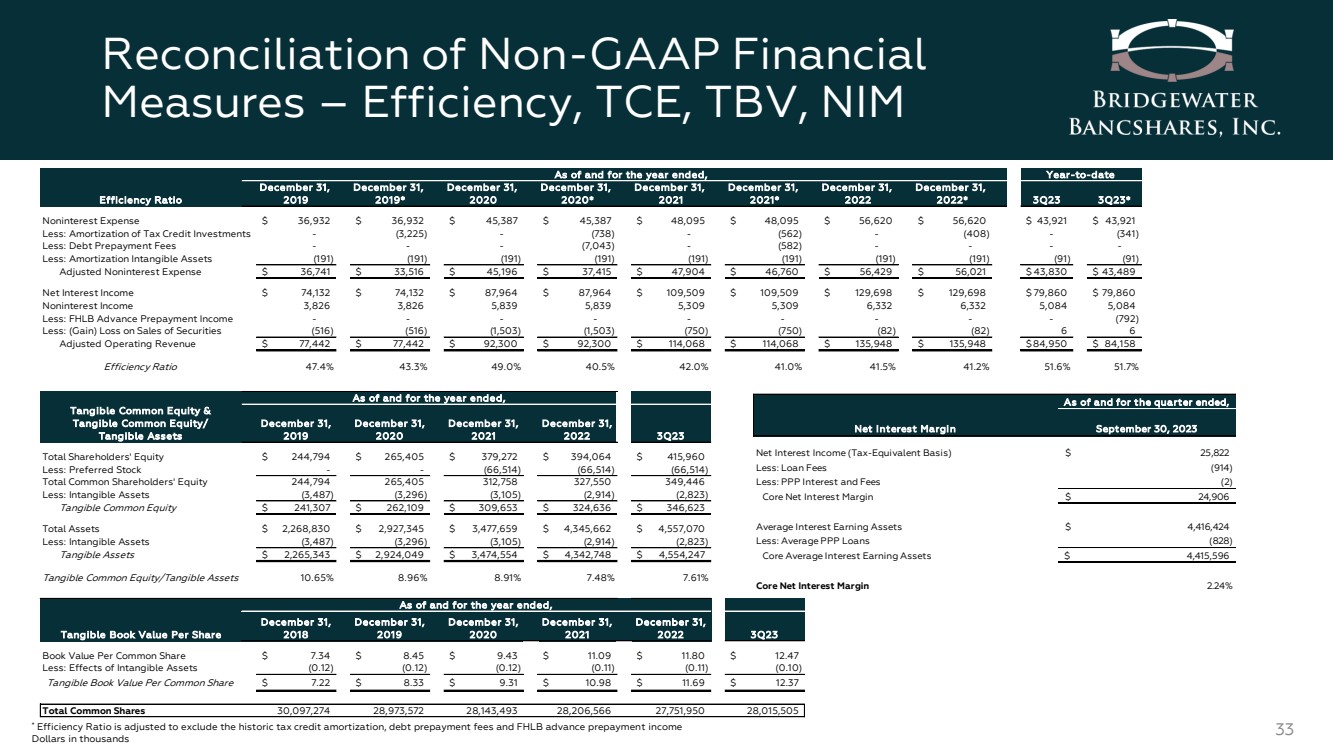
| Reconciliation of Non-GAAP Financial Measures – Efficiency, TCE, TBV, NIM 33 * Efficiency Ratio is adjusted to exclude the historic tax credit amortization, debt prepayment fees and FHLB advance prepayment income Dollars in thousands December 31, December 31, December 31, December 31, December 31, December 31, December 31, December 31, Efficiency Ratio 2019 2019* 2020 2020* 2021 2021* 2022 2022* 3Q23 3Q23* Noninterest Expense $ 36,932 $ 36,932 $ 45,387 $ 45,387 $ 48,095 $ 48,095 $ 56,620 $ 56,620 $ 43,921 $ 43,921 Less: Amortization of Tax Credit Investments - (3,225) - (738) - (562) - (408) - (341) Less: Debt Prepayment Fees - - - (7,043) - (582) - - - - Less: Amortization Intangible Assets (191) (191) (191) (191) (191) (191) (191) (191) (91) (91) Adjusted Noninterest Expense $ 36,741 $ 33,516 $ 45,196 $ 37,415 $ 47,904 $ 46,760 $ 56,429 $ 56,021 $ 43,830 $ 43,489 Net Interest Income $ 74,132 $ 74,132 $ 87,964 $ 87,964 $ 109,509 $ 109,509 $ 129,698 $ 129,698 $ 79,860 $ 79,860 Noninterest Income 3,826 3,826 5,839 5,839 5,309 5,309 6,332 6,332 5,084 5,084 Less: FHLB Advance Prepayment Income - - - - - - - - - (792) Less: (Gain) Loss on Sales of Securities (516) (516) (1,503) (1,503) (750) (750) (82) (82) 6 6 Adjusted Operating Revenue $ 77,442 $ 77,442 $ 92,300 $ 92,300 $ 114,068 $ 114,068 $ 135,948 $ 135,948 $84,950 $ 84,158 Efficiency Ratio 47.4% 43.3% 49.0% 40.5% 42.0% 41.0% 41.5% 41.2% 51.6% 51.7% Tangible Common Equity & Tangible Common Equity/ Tangible Assets December 31, 2019 December 31, 2020 December 31, 2021 December 31, 2022 3Q23 Total Shareholders' Equity $ 244,794 $ 265,405 $ 379,272 $ 394,064 $ 415,960 Less: Preferred Stock - - (66,514) (66,514) (66,514) Total Common Shareholders' Equity 244,794 265,405 312,758 327,550 349,446 Less: Intangible Assets (3,487) (3,296) (3,105) (2,914) (2,823) Tangible Common Equity $ 241,307 $ 262,109 $ 309,653 $ 324,636 $ 346,623 Total Assets $ 2,268,830 $ 2,927,345 $ 3,477,659 $ 4,345,662 $ 4,557,070 Less: Intangible Assets (3,487) (3,296) (3,105) (2,914) (2,823) Tangible Assets $ 2,265,343 $ 2,924,049 $ 3,474,554 $ 4,342,748 $ 4,554,247 Tangible Common Equity/Tangible Assets 10.65% 8.96% 8.91% 7.48% 7.61% Tangible Book Value Per Share December 31, 2018 December 31, 2019 December 31, 2020 December 31, 2021 December 31, 2022 3Q23 Book Value Per Common Share $ 7.34 $ 8.45 $ 9.43 $ 11.09 $ 11.80 $ 12.47 Less: Effects of Intangible Assets (0.12) (0.12) (0.12) (0.11) (0.11) (0.10) Tangible Book Value Per Common Share $ 7.22 $ 8.33 $ 9.31 $ 10.98 $ 11.69 $ 12.37 Total Common Shares 30,097,274 28,973,572 28,143,493 28,206,566 27,751,950 28,015,505 As of and for the year ended, As of and for the year ended, As of and for the year ended, Year-to-date Net Interest Margin September 30, 2023 Net Interest Income (Tax-Equivalent Basis) $ 25,822 Less: Loan Fees (914) Less: PPP Interest and Fees (2) Core Net Interest Margin $ 24,906 Average Interest Earning Assets $ 4,416,424 Less: Average PPP Loans (828) Core Average Interest Earning Assets $ 4,415,596 Core Net Interest Margin 2.24% As of and for the quarter ended, |