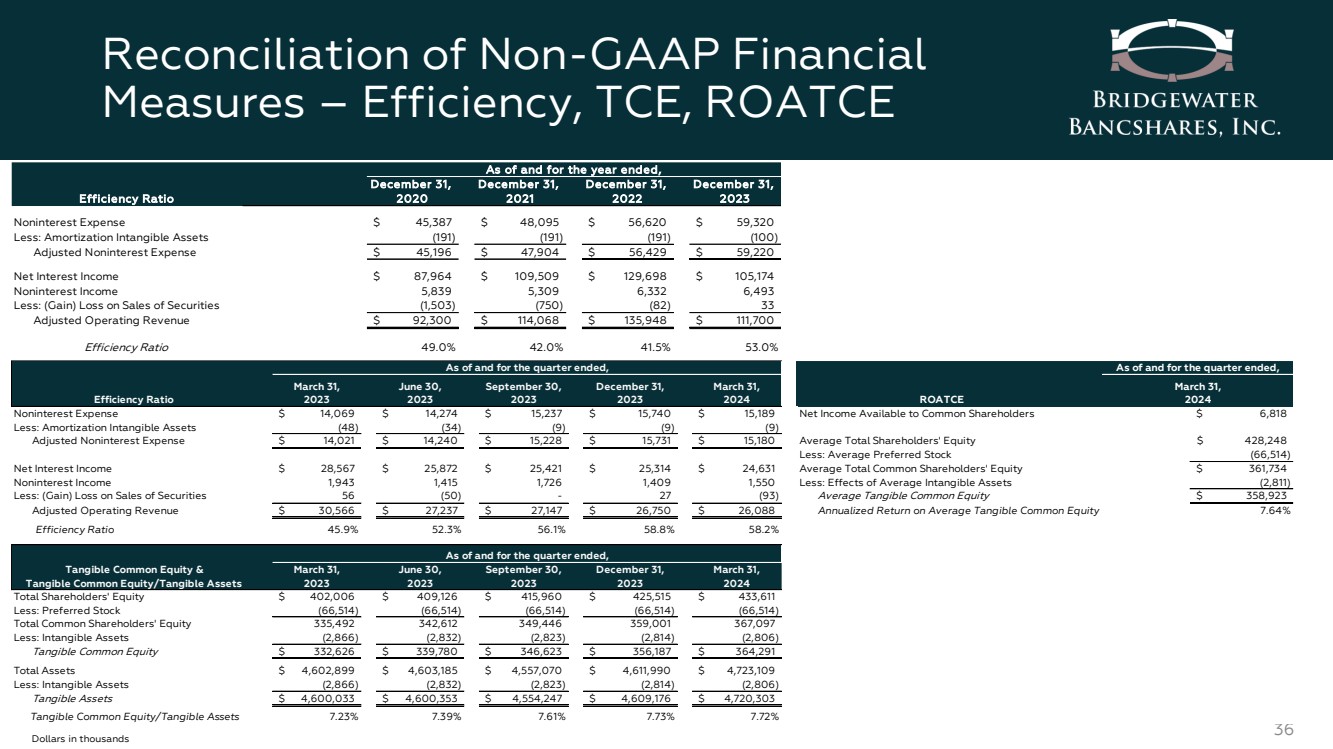
| Reconciliation of Non-GAAP Financial Measures – Efficiency, TCE, ROATCE 36 Dollars in thousands Efficiency Ratio March 31, 2023 June 30, 2023 September 30, 2023 December 31, 2023 March 31, 2024 Noninterest Expense $ 14,069 $ 14,274 $ 15,237 $ 15,740 $ 15,189 Net Income Available to Common Shareholders Less: Amortization Intangible Assets (48) (34) (9) (9) (9) Adjusted Noninterest Expense $ 14,021 $ 14,240 $ 15,228 $ 15,731 $ 15,180 Average Total Shareholders' Equity Less: Average Preferred Stock Net Interest Income $ 28,567 $ 25,872 $ 25,421 $ 25,314 $ 24,631 Average Total Common Shareholders' Equity Noninterest Income 1,943 1,415 1,726 1,409 1,550 Less: Effects of Average Intangible Assets Less: (Gain) Loss on Sales of Securities 56 (50) - 2 7 (93) Average Tangible Common Equity Adjusted Operating Revenue $ 30,566 $ 27,237 $ 27,147 $ 26,750 $ 26,088 Annualized Return on Average Tangible Common Equity Efficiency Ratio 45.9% 52.3% 56.1% 58.8% 58.2% Tangible Common Equity & Tangible Common Equity/Tangible Assets March 31, 2023 June 30, 2023 September 30, 2023 December 31, 2023 March 31, 2024 Total Shareholders' Equity $ 402,006 $ 409,126 $ 415,960 $ 425,515 $ 433,611 Less: Preferred Stock (66,514) (66,514) (66,514) (66,514) (66,514) Total Common Shareholders' Equity 335,492 342,612 349,446 359,001 367,097 Less: Intangible Assets (2,866) (2,832) (2,823) (2,814) (2,806) Tangible Common Equity $ 332,626 $ 339,780 $ 346,623 $ 356,187 $ 364,291 Total Assets $ 4,602,899 $ 4,603,185 $ 4,557,070 $ 4,611,990 $ 4,723,109 Less: Intangible Assets (2,866) (2,832) (2,823) (2,814) (2,806) Tangible Assets $ 4,600,033 $ 4,600,353 $ 4,554,247 $ 4,609,176 $ 4,720,303 Tangible Common Equity/Tangible Assets 7.23% 7.39% 7.61% 7.73% 7.72% $ 428,248 (66,514) $ 361,734 (2,811) $ 358,923 7.64% As of and for the quarter ended, ROATCE As of and for the quarter ended, March 31, 2024 $ 6,818 As of and for the quarter ended, December 31, December 31, December 31, December 31, Efficiency Ratio 2020 2021 2022 2023 Noninterest Expense $ 45,387 $ 48,095 $ 56,620 $ 59,320 Less: Amortization Intangible Assets (191) (191) (191) (100) Adjusted Noninterest Expense $ 45,196 $ 47,904 $ 56,429 $ 59,220 Net Interest Income $ 87,964 $ 109,509 $ 129,698 $ 105,174 Noninterest Income 5,839 5,309 6,332 6,493 Less: (Gain) Loss on Sales of Securities (1,503) (750) (82) 3 3 Adjusted Operating Revenue $ 92,300 $ 114,068 $ 135,948 $ 111,700 Efficiency Ratio 49.0% 42.0% 41.5% 53.0% As of and for the year ended, |