Exhibit 99.1
|
| Disclaimer Forward-Looking Statements This presentation contains “forward-looking statements” within the meaning of the safe harbor provisions of the U.S. Private Securities Litigation Reform Act of 1995. Forward-looking statements include, without limitation, statements concerning plans, estimates, calculations, forecasts and projections with respect to the anticipated future performance of the Company. These statements are often, but not always, identified by words such as “may”, “might”, “should”, “could”, “predict”, “potential”, “believe”, “expect”, “continue”, “will”, “anticipate”, “seek”, “estimate”, “intend”, “plan”, “projection”, “would”, “annualized”, “target” and “outlook”, or the negative version of those words or other comparable words of a future or forward-looking nature. Forward-looking statements are neither historical facts nor assurances of future performance. Instead, they are based only on our current beliefs, expectations and assumptions regarding our business, future plans and strategies, projections, anticipated events and trends, the economy and other future conditions. Because forward-looking statements relate to the future, they are subject to inherent uncertainties, risks and changes in circumstances that are difficult to predict and many of which are outside of our control. Our actual results and financial condition may differ materially from those indicated in the forward-looking statements. Therefore, you should not rely on any of these forward-looking statements. Important factors that could cause our actual results and financial condition to differ materially from those indicated in the forward-looking statements include, among others, the following: interest rate risk, including the effects of changes in interest rates; effects on the U.S. economy resulting from the implementation of policies proposed by the new presidential administration, including tariffs, mass deportations and tax regulations; fluctuations in the values of the securities held in our securities portfolio, including as the result of changes in interest rates; business and economic conditions generally and in the financial services industry, nationally and within our market area, including the level and impact of inflation and possible recession; the effects of developments and events in the financial services industry, including the large-scale deposit withdrawals over a short period of time that resulted in several bank failures; credit risk and risks from concentrations (by type of borrower, geographic area, collateral and industry) within the Company’s loan portfolio or large loans to certain borrowers (including CRE loans); the overall health of the local and national real estate market; our ability to successfully manage credit risk; our ability to maintain an adequate level of allowance for credit losses; new or revised accounting standards as may be adopted by state and federal regulatory agencies, the Financial Accounting Standards Board, Securities and Exchange Commission (the “SEC”) or Public Company Accounting Oversight Board; the concentration of large loans to certain borrowers; the concentration of large deposits from certain clients, including those who have balances above current Federal Deposit Insurance Corporation (“FDIC”) insurance limits; our ability to successfully manage liquidity risk, which may increase our dependence on non-core funding sources such as brokered deposits, and negatively impact our cost of funds; our ability to raise additional capital to implement our business plan; our ability to implement our growth strategy and manage costs effectively; the composition of our senior leadership team and our ability to attract and retain key personnel; talent and labor shortages and employee turnover; the occurrence of fraudulent activity, breaches or failures of our or our third-party vendors’ information security controls or cybersecurity-related incidents, including as a result of sophisticated attacks using artificial intelligence and similar tools or as a result of insider fraud; interruptions involving our information technology and telecommunications systems or third-party servicers; competition in the financial services industry, including from nonbank competitors such as credit unions, “fintech” companies and digital asset service providers; the effectiveness of our risk management framework; the commencement, cost and outcome of litigation and other legal proceedings and regulatory actions against us; the impact of recent and future legislative and regulatory changes, including in response to prior bank failures; risks related to climate change and the negative impact it may have on our customers and their businesses; the imposition of tariffs or other governmental policies impacting the value of products produced by our commercial borrowers; severe weather, natural disasters, wide spread disease or pandemics, acts of war or terrorism or other adverse external events, including ongoing conflicts in the Middle East and the Russian invasion of Ukraine; potential impairment to the goodwill the Company recorded in connection with acquisitions; risks associated with our acquisition of First Minnetonka City Bank (“FMCB”), including the possibility that the merger may be more difficult or expensive to integrate than anticipated and the effect of the merger on the Company’s customer and employee relationships and operating results; changes to U.S. or state tax laws, regulations and government policies concerning the Company’s general business, including changes in interpretation or prioritization and changes in response to prior bank failures and any other risks described in the “Risk Factors” sections of reports filed by the Company with the SEC. Any forward-looking statement made by us in this presentation is based only on information currently available to us and speaks only as of the date on which it is made. The Company undertake no obligation to publicly update any forward-looking statement, whether written or oral, that may be made from time to time, whether as a result of new information, future developments or otherwise. Certain of the information contained in this presentation is derived from information provided by industry sources. Although the Company believe that such information is accurate and that the sources from which it has been obtained are reliable, the Company cannot guarantee the accuracy of, and have not independently verified, such information. Use of Non-GAAP financial measures In addition to the results presented in accordance with U.S. General Accepted Accounting Principles (“GAAP”), the Company routinely supplements its evaluation with an analysis of certain non-GAAP financial measures. The Company believes these non-GAAP financial measures, in addition to the related GAAP measures, provide meaningful information to investors to help them understand the Company’s operating performance and trends, and to facilitate comparisons with the performance of peers. These disclosures should not be viewed as a substitute for operating results determined in accordance with GAAP, nor are they necessarily comparable to non-GAAP performance measures that may be presented by other companies. Reconciliations of non-GAAP disclosures to the comparable GAAP measures are provided in this presentation. 2 |
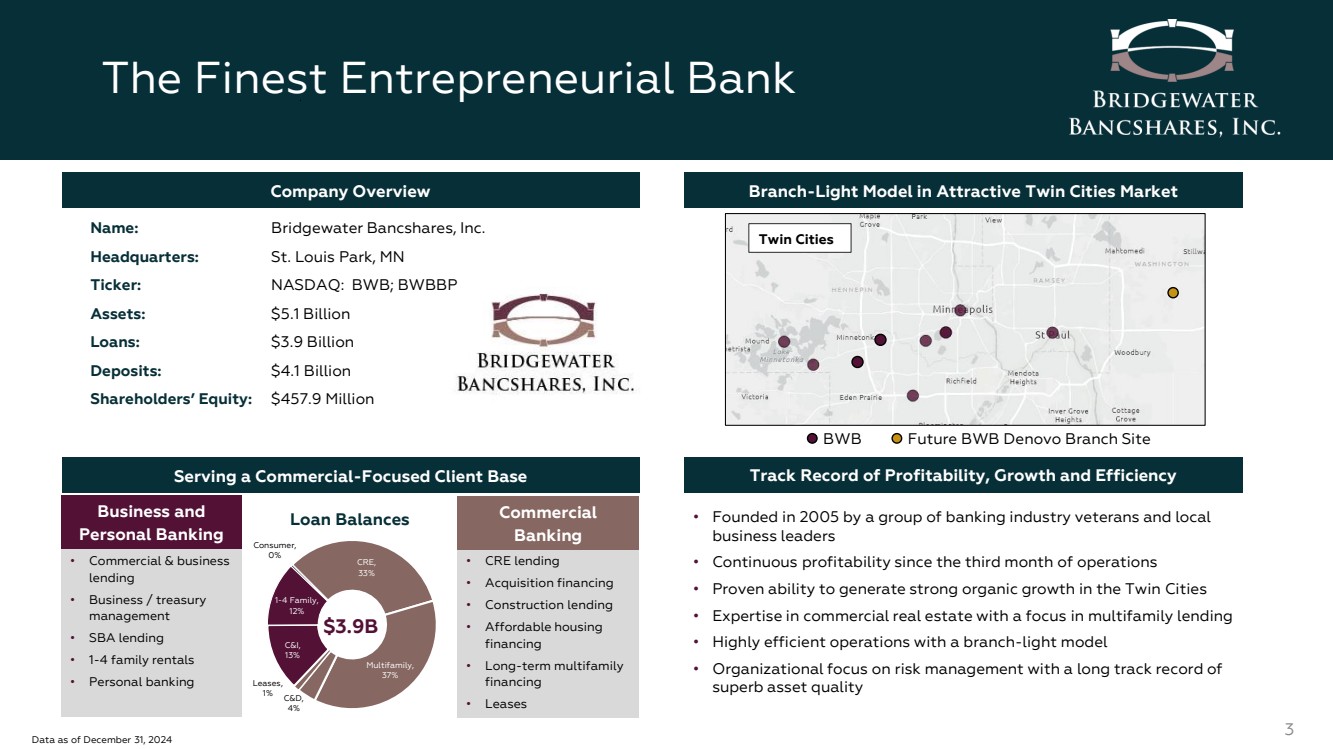
| The Finest Entrepreneurial Bank 3 Company Overview Branch-Light Model in Attractive Twin Cities Market Name: Bridgewater Bancshares, Inc. Headquarters: St. Louis Park, MN Ticker: NASDAQ: BWB; BWBBP Assets: $5.1 Billion Loans: $3.9 Billion Deposits: $4.1 Billion Shareholders’ Equity: $457.9 Million Serving a Commercial-Focused Client Base Track Record of Profitability, Growth and Efficiency • CRE lending • Acquisition financing • Construction lending • Affordable housing financing • Long-term multifamily financing • Leases • Commercial & business lending • Business / treasury management • SBA lending • 1-4 family rentals • Personal banking CRE, 33% Multifamily, 37% C&D, 4% Leases, 1% C&I, 13% 1-4 Family, 12% Consumer, 0% $3.9B Business and Personal Banking Commercial Banking Loan Balances • Founded in 2005 by a group of banking industry veterans and local business leaders • Continuous profitability since the third month of operations • Proven ability to generate strong organic growth in the Twin Cities • Expertise in commercial real estate with a focus in multifamily lending • Highly efficient operations with a branch-light model • Organizational focus on risk management with a long track record of superb asset quality Data as of December 31, 2024 BWB Future BWB Denovo Branch Site Twin Cities |
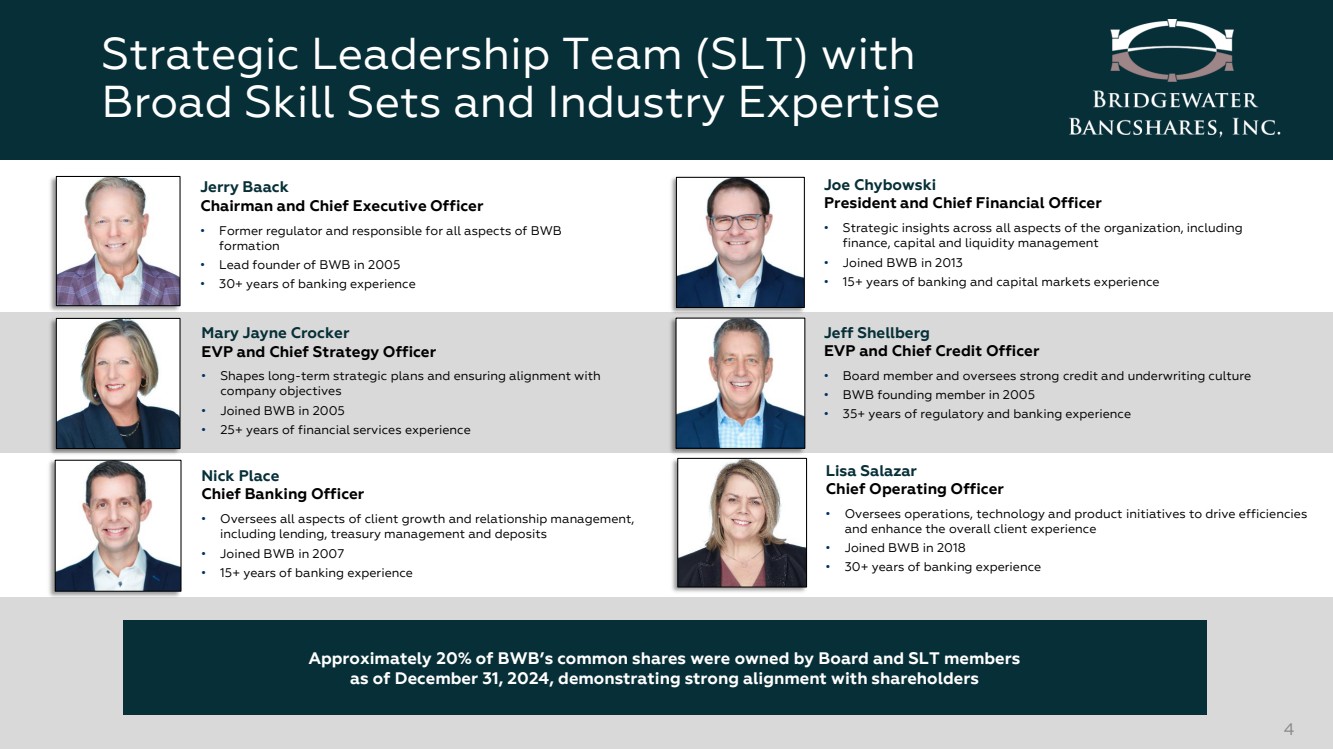
| Jerry Baack Chairman and Chief Executive Officer • Former regulator and responsible for all aspects of BWB formation • Lead founder of BWB in 2005 • 30+ years of banking experience Jeff Shellberg EVP and Chief Credit Officer • Board member and oversees strong credit and underwriting culture • BWB founding member in 2005 • 35+ years of regulatory and banking experience Nick Place Chief Banking Officer • Oversees all aspects of client growth and relationship management, including lending, treasury management and deposits • Joined BWB in 2007 • 15+ years of banking experience Mary Jayne Crocker EVP and Chief Strategy Officer • Shapes long-term strategic plans and ensuring alignment with company objectives • Joined BWB in 2005 • 25+ years of financial services experience Joe Chybowski President and Chief Financial Officer • Strategic insights across all aspects of the organization, including finance, capital and liquidity management • Joined BWB in 2013 • 15+ years of banking and capital markets experience Lisa Salazar Chief Operating Officer • Oversees operations, technology and product initiatives to drive efficiencies and enhance the overall client experience • Joined BWB in 2018 • 30+ years of banking experience Strategic Leadership Team (SLT) with Broad Skill Sets and Industry Expertise 4 Approximately 20% of BWB’s common shares were owned by Board and SLT members as of December 31, 2024, demonstrating strong alignment with shareholders |
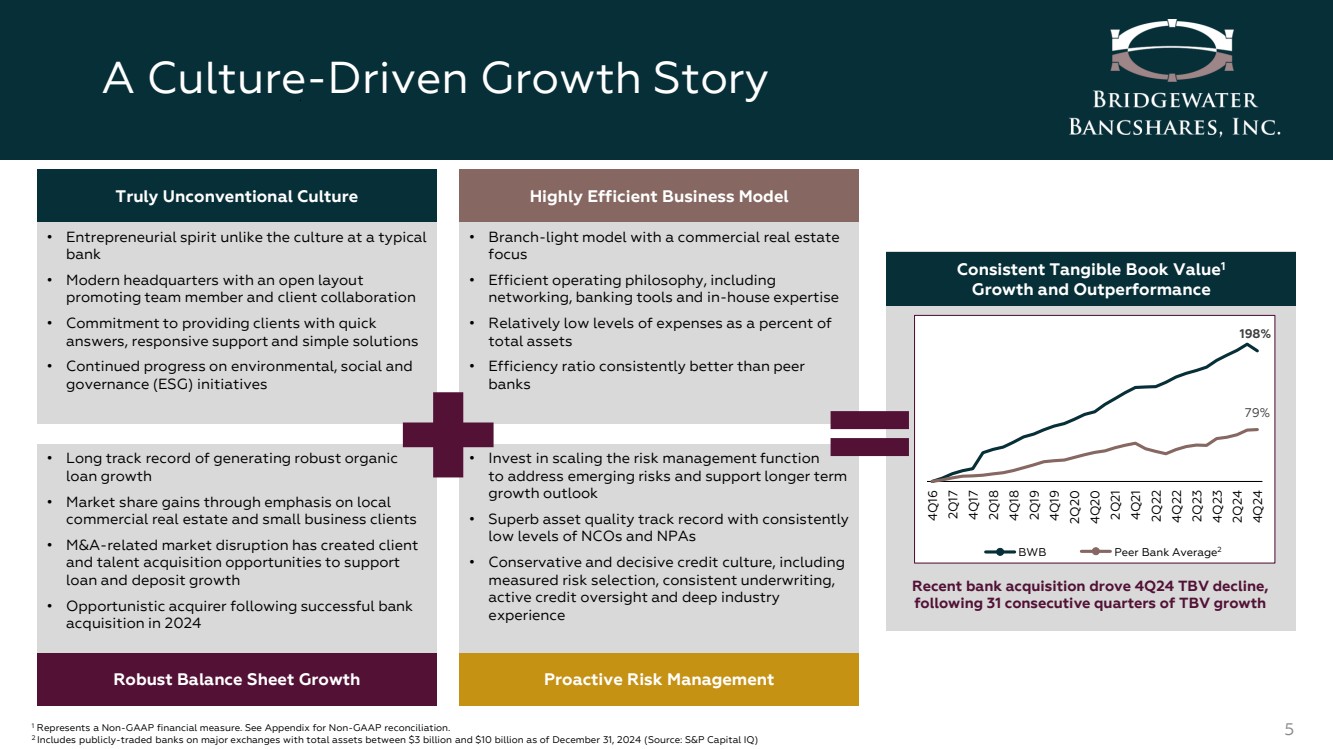
| A Culture-Driven Growth Story 5 Truly Unconventional Culture Highly Efficient Business Model Robust Balance Sheet Growth Proactive Risk Management • Entrepreneurial spirit unlike the culture at a typical bank • Modern headquarters with an open layout promoting team member and client collaboration • Commitment to providing clients with quick answers, responsive support and simple solutions • Continued progress on environmental, social and governance (ESG) initiatives • Long track record of generating robust organic loan growth • Market share gains through emphasis on local commercial real estate and small business clients • M&A-related market disruption has created client and talent acquisition opportunities to support loan and deposit growth • Opportunistic acquirer following successful bank acquisition in 2024 • Branch-light model with a commercial real estate focus • Efficient operating philosophy, including networking, banking tools and in-house expertise • Relatively low levels of expenses as a percent of total assets • Efficiency ratio consistently better than peer banks • Invest in scaling the risk management function to address emerging risks and support longer term growth outlook • Superb asset quality track record with consistently low levels of NCOs and NPAs • Conservative and decisive credit culture, including measured risk selection, consistent underwriting, active credit oversight and deep industry experience 1 Represents a Non-GAAP financial measure. See Appendix for Non-GAAP reconciliation. 2 Includes publicly-traded banks on major exchanges with total assets between $3 billion and $10 billion as of December 31, 2024 (Source: S&P Capital IQ) Consistent Tangible Book Value1 Growth and Outperformance Recent bank acquisition drove 4Q24 TBV decline, following 31 consecutive quarters of TBV growth 198% 79% 4Q16 2Q17 4Q17 2Q18 4Q18 2Q19 4Q19 2Q20 4Q20 2Q21 4Q21 2Q22 4Q22 2Q23 4Q23 2Q24 4Q24 BWB Peer Bank Average2 |
| Our Core Values 6 Unconventional. Our clients notice a difference. Responsive. Under promise, over deliver. Dedicated. Don’t stop until you get it done. Growth. If you aren’t moving forward, where are you going? Accurate. It’s more than just an expectation. 6 Our Core Values |
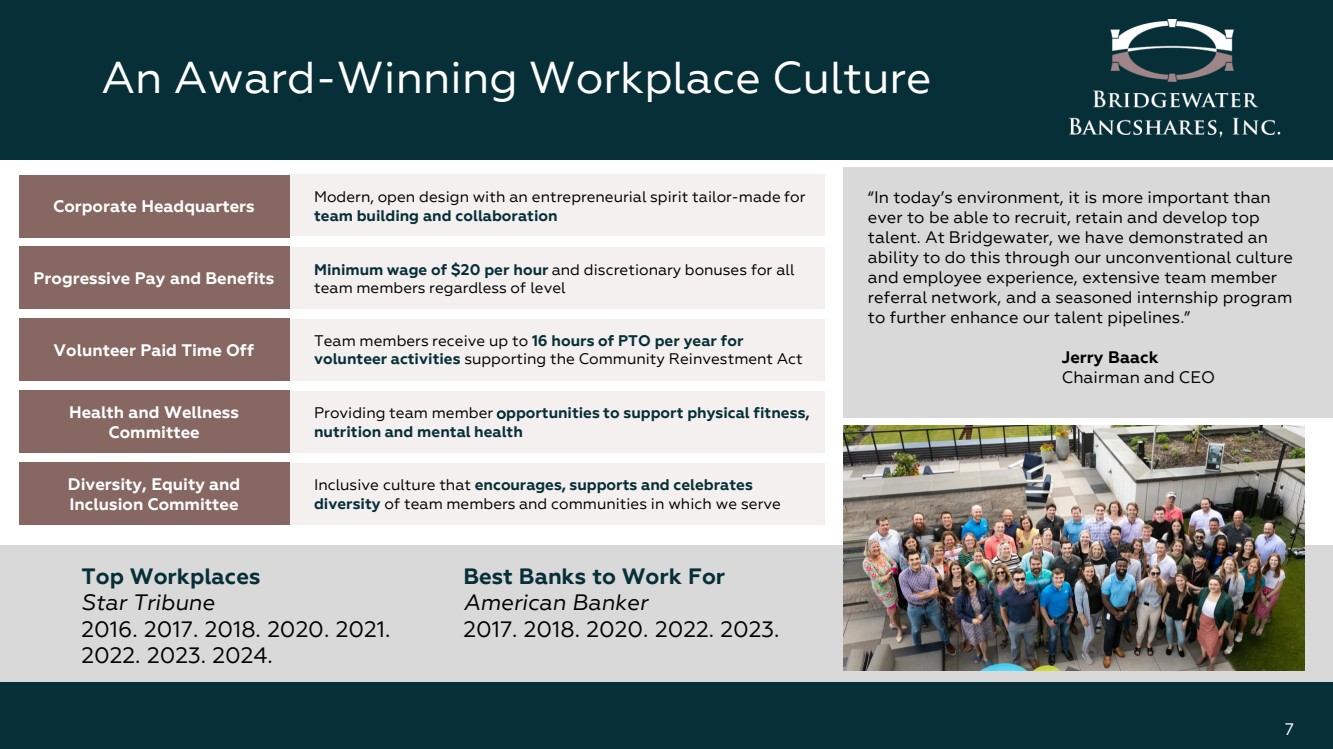
| An Award-Winning Workplace Culture “In today’s environment, it is more important than ever to be able to recruit, retain and develop top talent. At Bridgewater, we have demonstrated an ability to do this through our unconventional culture and employee experience, extensive team member referral network, and a seasoned internship program to further enhance our talent pipelines.” Jerry Baack Chairman and CEO Top Workplaces Star Tribune 2016. 2017. 2018. 2020. 2021. 2022. 2023. 2024. Best Banks to Work For American Banker 2017. 2018. 2020. 2022. 2023. Corporate Headquarters Progressive Pay and Benefits Health and Wellness Committee Diversity, Equity and Inclusion Committee Volunteer Paid Time Off Modern, open design with an entrepreneurial spirit tailor-made for team building and collaboration Minimum wage of $20 per hour and discretionary bonuses for all team members regardless of level Providing team member opportunities to support physical fitness, nutrition and mental health Inclusive culture that encourages, supports and celebrates diversity of team members and communities in which we serve Team members receive up to 16 hours of PTO per year for volunteer activities supporting the Community Reinvestment Act 7 |
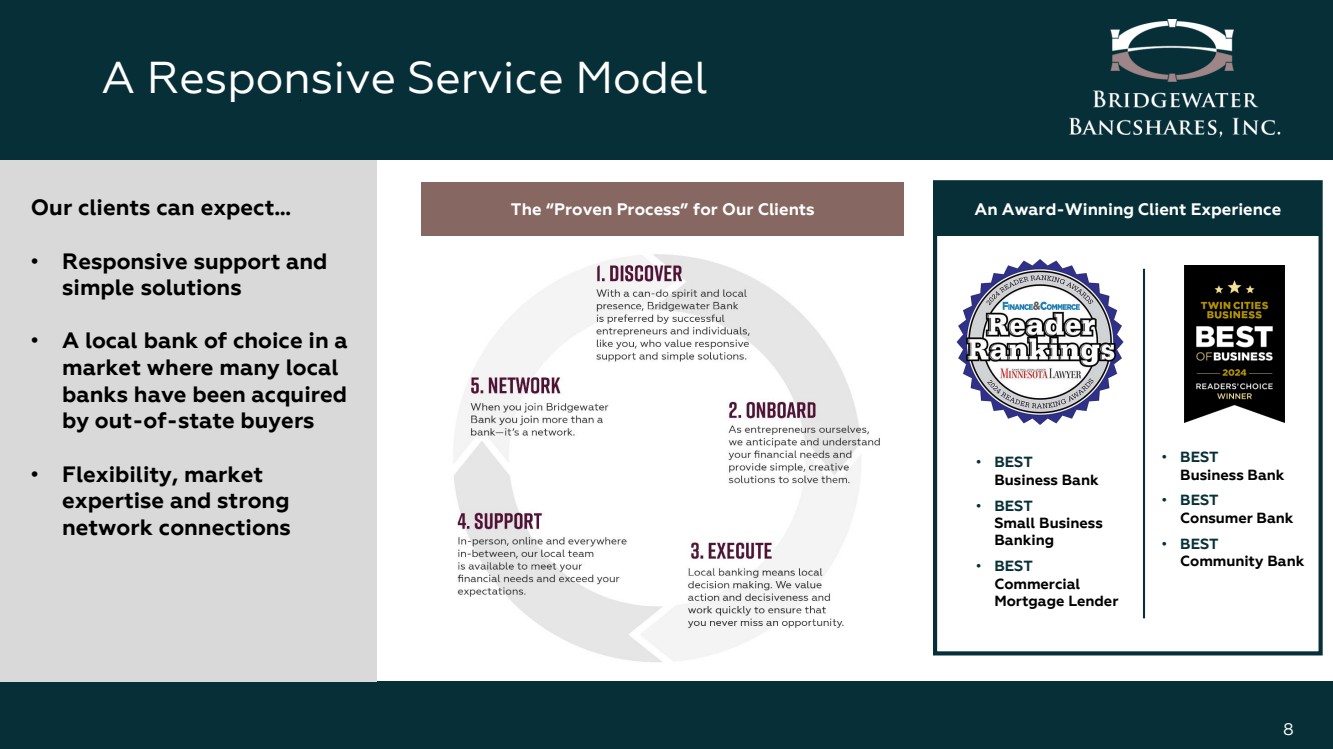
| A Responsive Service Model 8 Our clients can expect… • Responsive support and simple solutions • A local bank of choice in a market where many local banks have been acquired by out-of-state buyers • Flexibility, market expertise and strong network connections The “Proven Process” for Our Clients • BEST Business Bank • BEST Small Business Banking • BEST Commercial Mortgage Lender An Award-Winning Client Experience • BEST Business Bank • BEST Consumer Bank • BEST Community Bank |
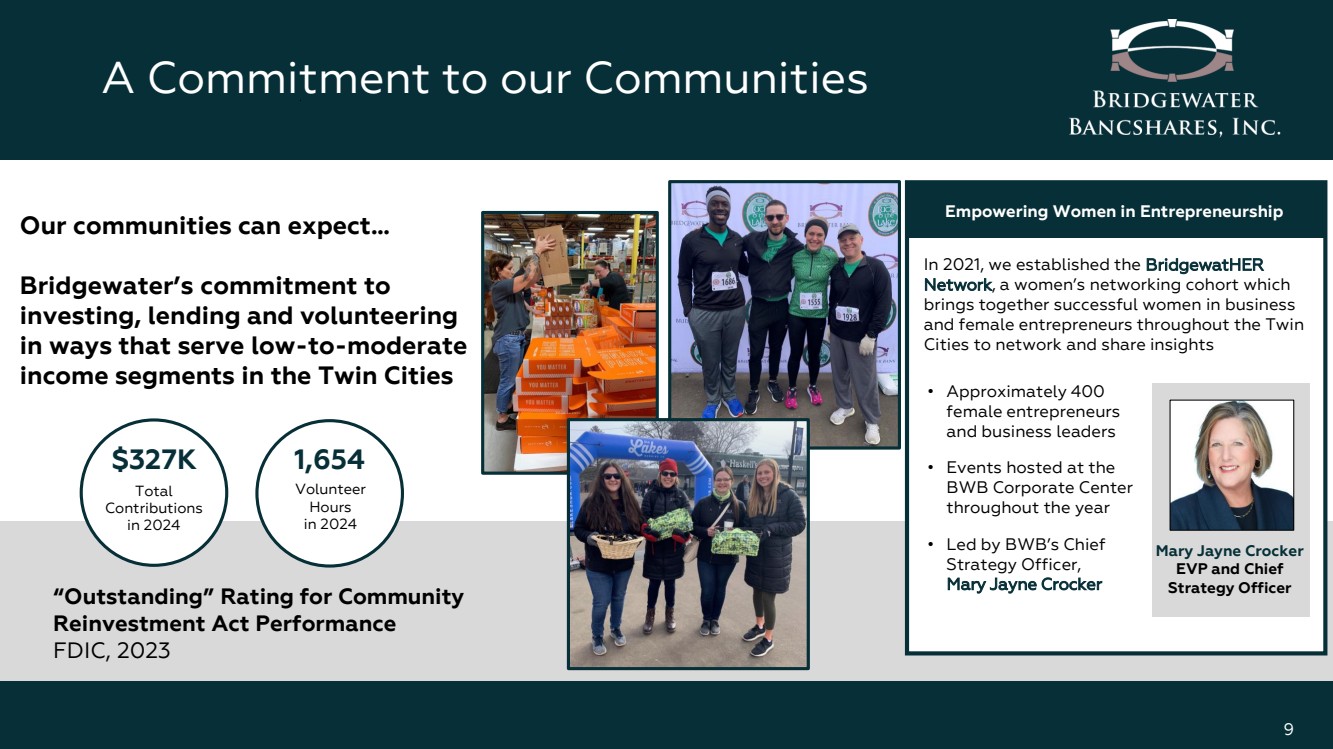
| A Commitment to our Communities 9 Our communities can expect… Bridgewater’s commitment to investing, lending and volunteering in ways that serve low-to-moderate income segments in the Twin Cities “Outstanding” Rating for Community Reinvestment Act Performance FDIC, 2023 $327K Total Contributions in 2024 1,654 Volunteer Hours in 2024 Empowering Women in Entrepreneurship In 2021, we established the BridgewatHER Network, a women’s networking cohort which brings together successful women in business and female entrepreneurs throughout the Twin Cities to network and share insights • Approximately 400 female entrepreneurs and business leaders • Events hosted at the BWB Corporate Center throughout the year • Led by BWB’s Chief Strategy Officer, Mary Jayne Crocker Mary Jayne Crocker EVP and Chief Strategy Officer |
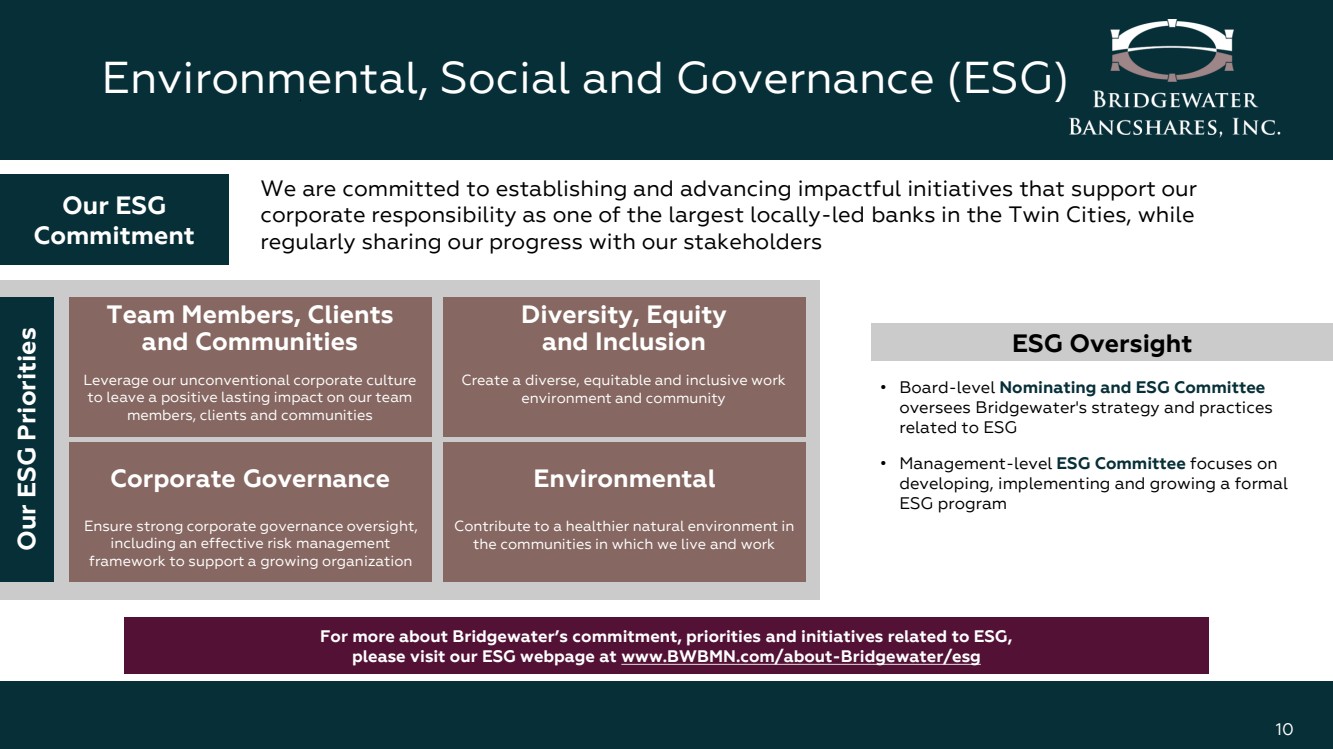
| Environmental, Social and Governance (ESG) 10 We are committed to establishing and advancing impactful initiatives that support our corporate responsibility as one of the largest locally-led banks in the Twin Cities, while regularly sharing our progress with our stakeholders Our ESG Commitment Our ESG Priorities Team Members, Clients and Communities Diversity, Equity and Inclusion Leverage our unconventional corporate culture to leave a positive lasting impact on our team members, clients and communities Ensure strong corporate governance oversight, including an effective risk management framework to support a growing organization Create a diverse, equitable and inclusive work environment and community Contribute to a healthier natural environment in the communities in which we live and work Corporate Governance Environmental ESG Oversight • Board-level Nominating and ESG Committee oversees Bridgewater's strategy and practices related to ESG • Management-level ESG Committee focuses on developing, implementing and growing a formal ESG program For more about Bridgewater’s commitment, priorities and initiatives related to ESG, please visit our ESG webpage at www.BWBMN.com/about-Bridgewater/esg |
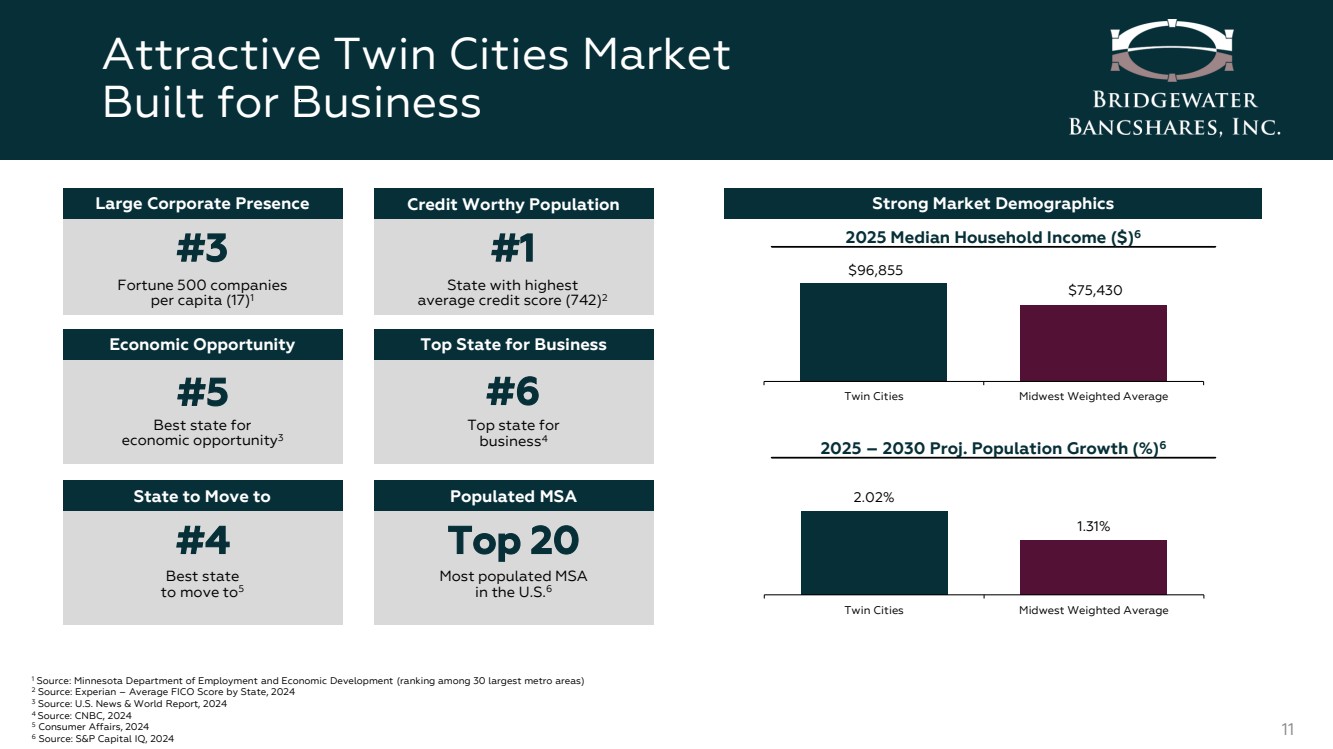
| Attractive Twin Cities Market Built for Business 11 #3 Fortune 500 companies per capita (17)1 Large Corporate Presence #1 State with highest average credit score (742)2 Credit Worthy Population #5 Best state for economic opportunity3 Economic Opportunity #6 Top state for business4 Top State for Business #4 Best state to move to5 State to Move to Top 20 Most populated MSA in the U.S.6 Populated MSA 2.02% 1.31% Twin Cities Midwest Weighted Average $96,855 $75,430 Twin Cities Midwest Weighted Average Strong Market Demographics 2025 Median Household Income ($)6 2025 – 2030 Proj. Population Growth (%)6 1 Source: Minnesota Department of Employment and Economic Development (ranking among 30 largest metro areas) 2 Source: Experian – Average FICO Score by State, 2024 3 Source: U.S. News & World Report, 2024 4 Source: CNBC, 2024 5 Consumer Affairs, 2024 6 Source: S&P Capital IQ, 2024 |
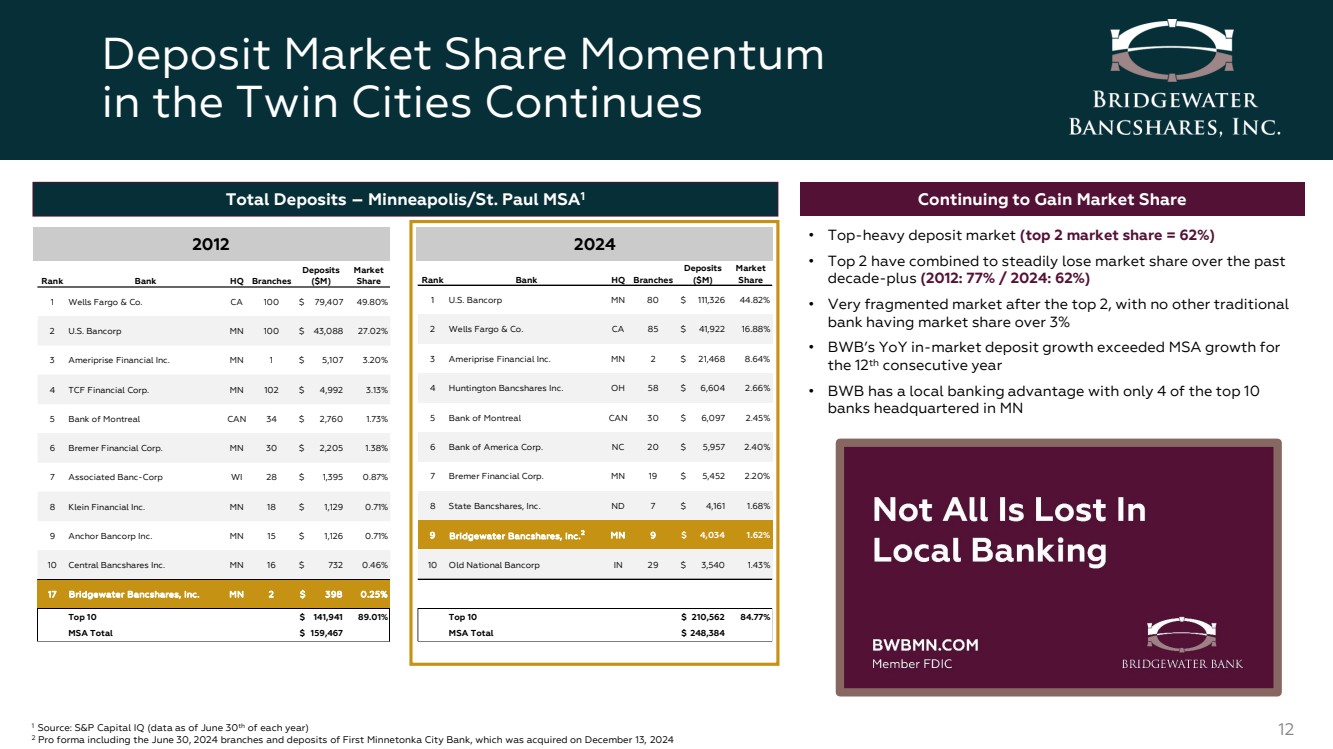
| Deposit Market Share Momentum in the Twin Cities Continues 12 Total Deposits – Minneapolis/St. Paul MSA1 2012 2024 Continuing to Gain Market Share • Top-heavy deposit market (top 2 market share = 62%) • Top 2 have combined to steadily lose market share over the past decade-plus (2012: 77% / 2024: 62%) • Very fragmented market after the top 2, with no other traditional bank having market share over 3% • BWB’s YoY in-market deposit growth exceeded MSA growth for the 12th consecutive year • BWB has a local banking advantage with only 4 of the top 10 banks headquartered in MN 1 Source: S&P Capital IQ (data as of June 30th of each year) 2 Pro forma including the June 30, 2024 branches and deposits of First Minnetonka City Bank, which was acquired on December 13, 2024 Rank Bank HQ Branches Deposits ($M) Market Share 1 Wells Fargo & Co. CA 100 $ 79,407 49.80% 2 U.S. Bancorp MN 100 $ 43,088 27.02% 3 Ameriprise Financial Inc. MN 1 $ 5,107 3.20% 4 TCF Financial Corp. MN 102 $ 4,992 3.13% 5 Bank of Montreal CAN 34 $ 2,760 1.73% 6 Bremer Financial Corp. MN 30 $ 2,205 1.38% 7 Associated Banc-Corp WI 28 $ 1,395 0.87% 8 Klein Financial Inc. MN 18 $ 1,129 0.71% 9 Anchor Bancorp Inc. MN 15 $ 1,126 0.71% 10 Central Bancshares Inc. MN 16 $ 732 0.46% 17 Bridgewater Bancshares, Inc. M N 2 $ 398 0.25% Top 10 $ 141,941 89.01% MSA Total $ 159,467 Rank Bank HQ Branches Deposits ($M) Market Share 1 U.S. Bancorp MN 80 $ 111,326 44.82% 2 Wells Fargo & Co. CA 85 $ 41,922 16.88% 3 Ameriprise Financial Inc. MN 2 $ 21,468 8.64% 4 Huntington Bancshares Inc. OH 58 $ 6,604 2.66% 5 Bank of Montreal CAN 30 $ 6,097 2.45% 6 Bank of America Corp. NC 20 $ 5,957 2.40% 7 Bremer Financial Corp. MN 19 $ 5,452 2.20% 8 State Bancshares, Inc. ND 7 $ 4,161 1.68% 9 Bridgewater Bancshares, Inc.2 M N 9 $ 4,034 1.62% 10 Old National Bancorp IN 29 $ 3,540 1.43% Top 10 $ 210,562 84.77% MSA Total $ 248,384 |
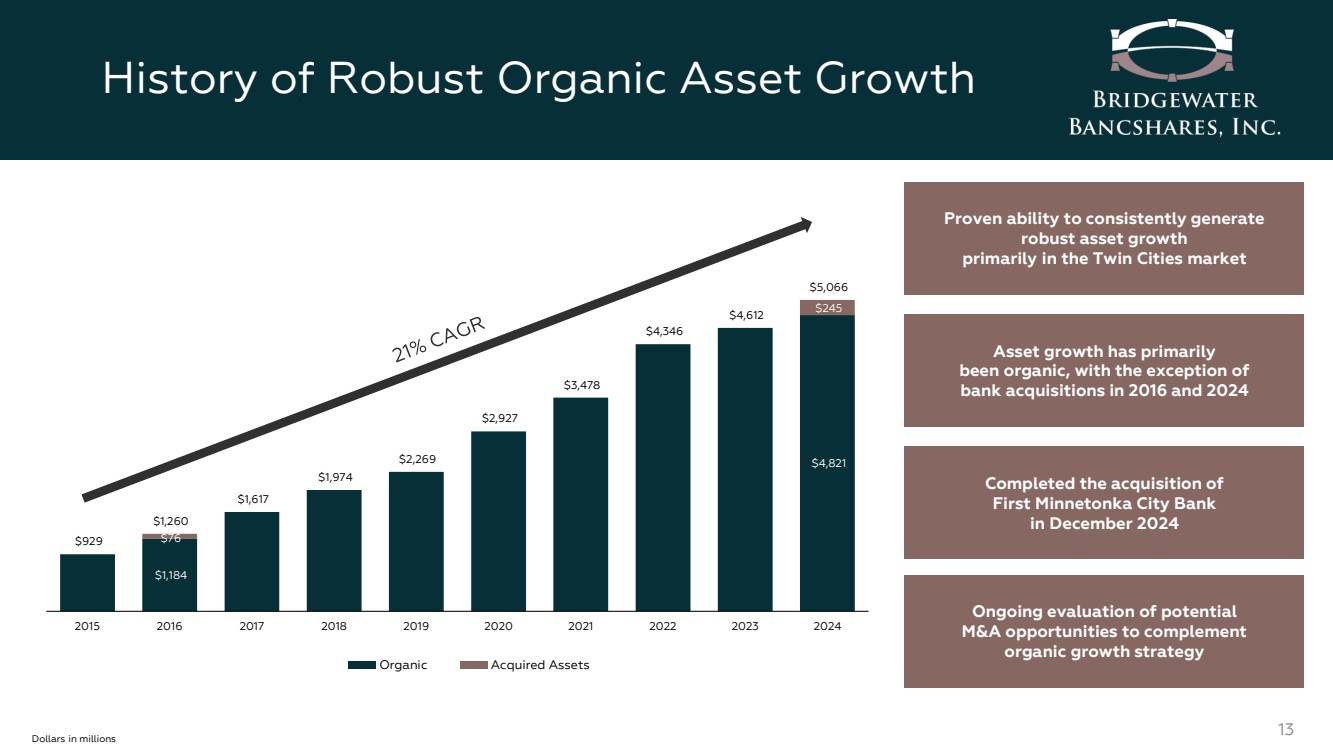
| History of Robust Organic Asset Growth 13 $1,184 $4,821 $76 $245 $929 $1,260 $1,617 $1,974 $2,269 $2,927 $3,478 $4,346 $4,612 $5,066 2015 2016 2017 2018 2019 2020 2021 2022 2023 2024 Organic Acquired Assets Proven ability to consistently generate robust asset growth primarily in the Twin Cities market Asset growth has primarily been organic, with the exception of bank acquisitions in 2016 and 2024 Dollars in millions Ongoing evaluation of potential M&A opportunities to complement organic growth strategy Completed the acquisition of First Minnetonka City Bank in December 2024 |
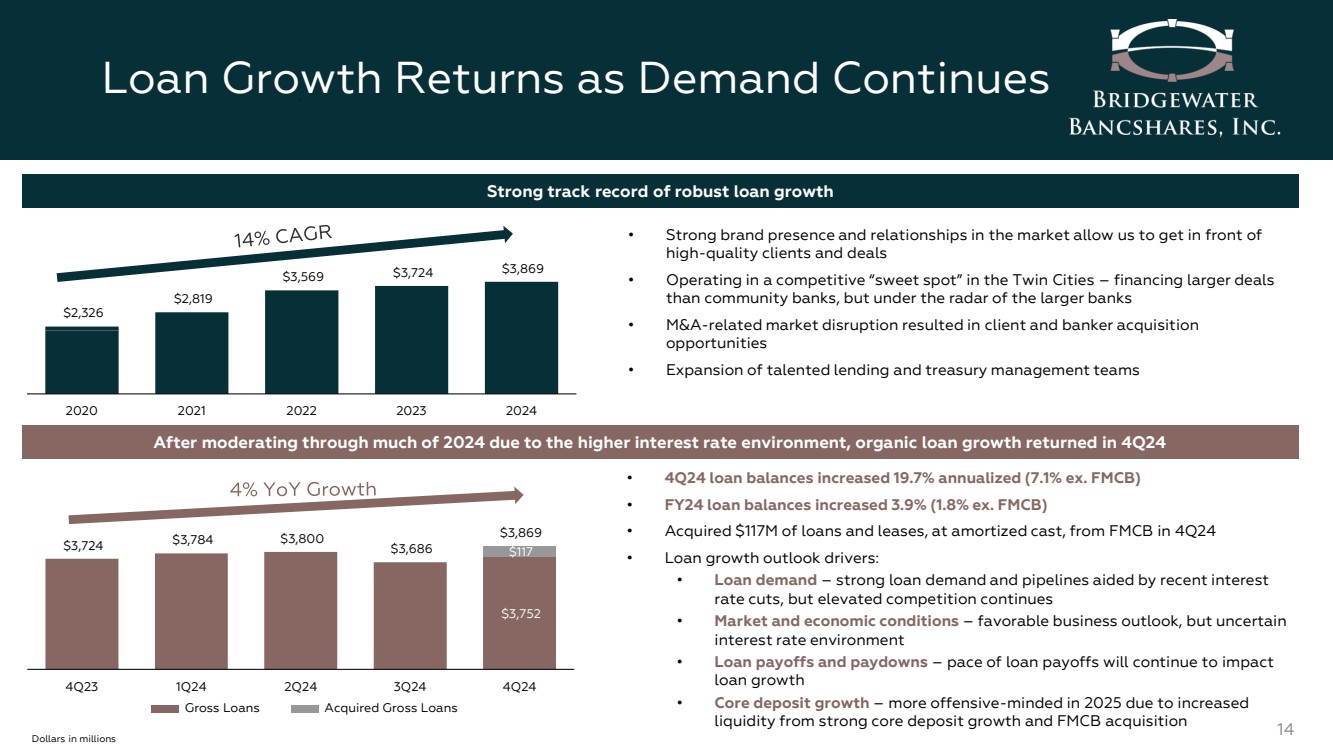
| Loan Growth Returns as Demand Continues 14 $3,752 $117 $3,724 $3,784 $3,800 $3,686 $3,869 4Q23 1Q24 2Q24 3Q24 4Q24 Dollars in millions $2,326 $2,819 $3,569 $3,724 $3,869 2020 2021 2022 2023 2024 After moderating through much of 2024 due to the higher interest rate environment, organic loan growth returned in 4Q24 • 4Q24 loan balances increased 19.7% annualized (7.1% ex. FMCB) • FY24 loan balances increased 3.9% (1.8% ex. FMCB) • Acquired $117M of loans and leases, at amortized cast, from FMCB in 4Q24 • Loan growth outlook drivers: • Loan demand – strong loan demand and pipelines aided by recent interest rate cuts, but elevated competition continues • Market and economic conditions – favorable business outlook, but uncertain interest rate environment • Loan payoffs and paydowns – pace of loan payoffs will continue to impact loan growth • Core deposit growth – more offensive-minded in 2025 due to increased liquidity from strong core deposit growth and FMCB acquisition Strong track record of robust loan growth • Strong brand presence and relationships in the market allow us to get in front of high-quality clients and deals • Operating in a competitive “sweet spot” in the Twin Cities – financing larger deals than community banks, but under the radar of the larger banks • M&A-related market disruption resulted in client and banker acquisition opportunities • Expansion of talented lending and treasury management teams Gross Loans Acquired Gross Loans |
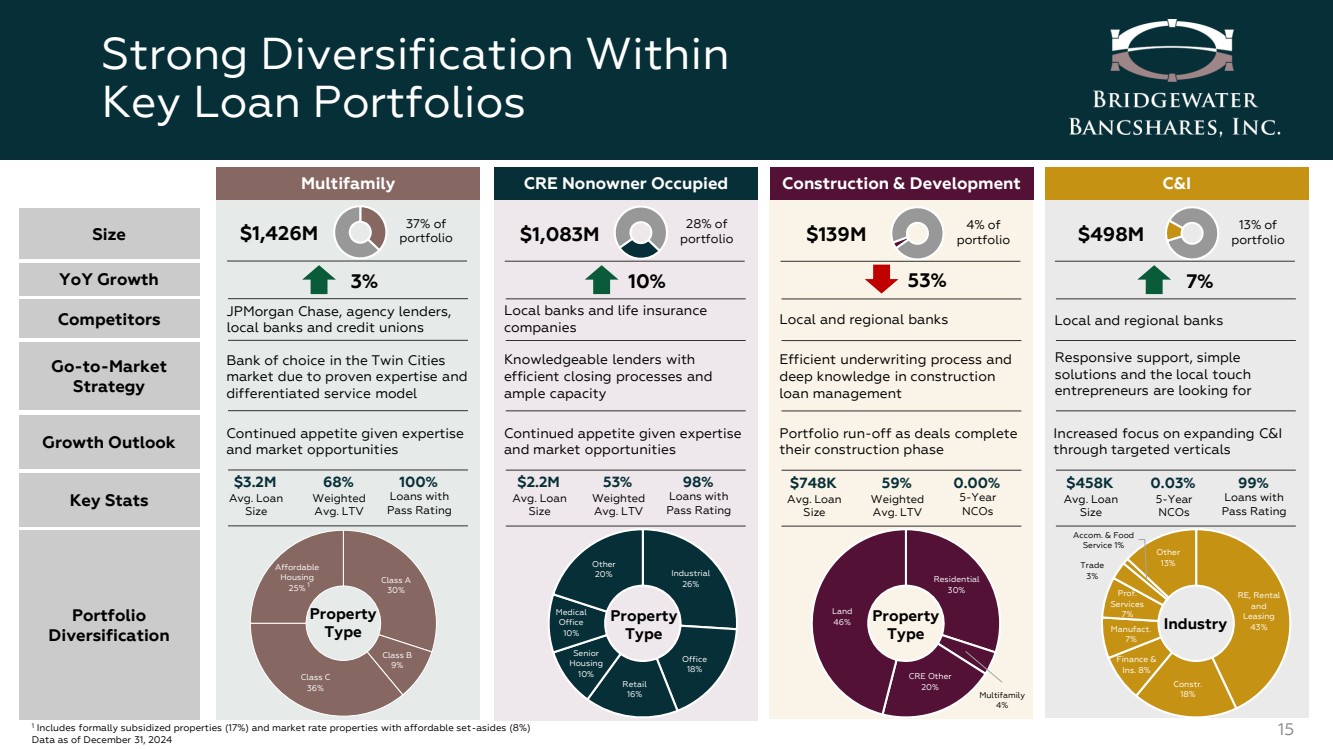
| Class A 30% Class B 9% Class C 36% Affordable Housing 25% Strong Diversification Within Key Loan Portfolios 15 Size YoY Growth Go-to-Market Strategy Competitors Growth Outlook Key Stats Portfolio Diversification Multifamily CRE Nonowner Occupied Construction & Development C&I Bank of choice in the Twin Cities market due to proven expertise and differentiated service model Knowledgeable lenders with efficient closing processes and ample capacity Responsive support, simple solutions and the local touch entrepreneurs are looking for Efficient underwriting process and deep knowledge in construction loan management JPMorgan Chase, agency lenders, local banks and credit unions Local banks and life insurance companies Local and regional banks Local and regional banks Continued appetite given expertise and market opportunities Continued appetite given expertise and market opportunities Increased focus on expanding C&I through targeted verticals Portfolio run-off as deals complete their construction phase $3.2M Avg. Loan Size 68% Weighted Avg. LTV 100% Loans with Pass Rating $2.2M Avg. Loan Size 53% Weighted Avg. LTV 98% Loans with Pass Rating $458K Avg. Loan Size 0.03% 5-Year NCOs 99% Loans with Pass Rating $748K Avg. Loan Size 59% Weighted Avg. LTV 0.00% 5-Year NCOs Property Type Industrial 26% Office 18% Retail 16% Senior Housing 10% Medical Office 10% Other 20% Property Type RE, Rental and Leasing 43% Constr. 18% Finance & Ins. 8% Manufact. 7% Prof. Services 7% Trade 3% Accom. & Food Service 1% Other 13% Industry Residential 30% Multifamily 4% CRE Other 20% Land 46% Property Type 1 Includes formally subsidized properties (17%) and market rate properties with affordable set-asides (8%) Data as of December 31, 2024 $1,426M 37% of portfolio $1,083M 28% of portfolio $498M 13% of $139M portfolio 4% of portfolio 3% 10% 53% 7% 1 |
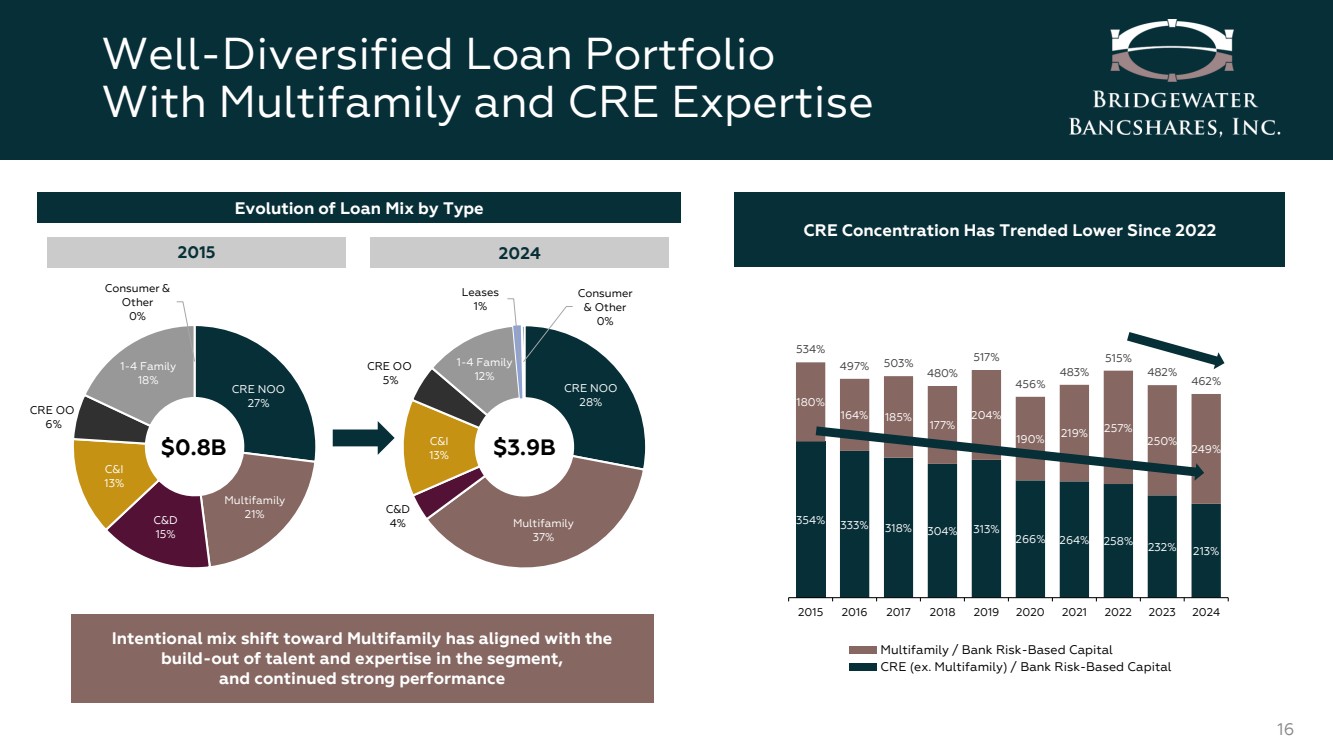
| CRE NOO 28% Multifamily 37% C&D 4% C&I 13% CRE OO 5% 1-4 Family 12% Leases 1% Consumer & Other 0% Well-Diversified Loan Portfolio With Multifamily and CRE Expertise 16 CRE NOO 27% Multifamily 21% C&D 15% C&I 13% CRE OO 6% 1-4 Family 18% Consumer & Other 0% $0.8B Evolution of Loan Mix by Type 2015 2024 Intentional mix shift toward Multifamily has aligned with the build-out of talent and expertise in the segment, and continued strong performance CRE Concentration Has Trended Lower Since 2022 Multifamily / Bank Risk-Based Capital CRE (ex. Multifamily) / Bank Risk-Based Capital $3.9B 354% 333% 318% 304% 313% 266% 264% 258% 232% 213% 180% 164% 185% 177% 204% 190% 219% 257% 250% 249% 534% 497% 503% 480% 517% 456% 483% 515% 482% 462% 2015 2016 2017 2018 2019 2020 2021 2022 2023 2024 |
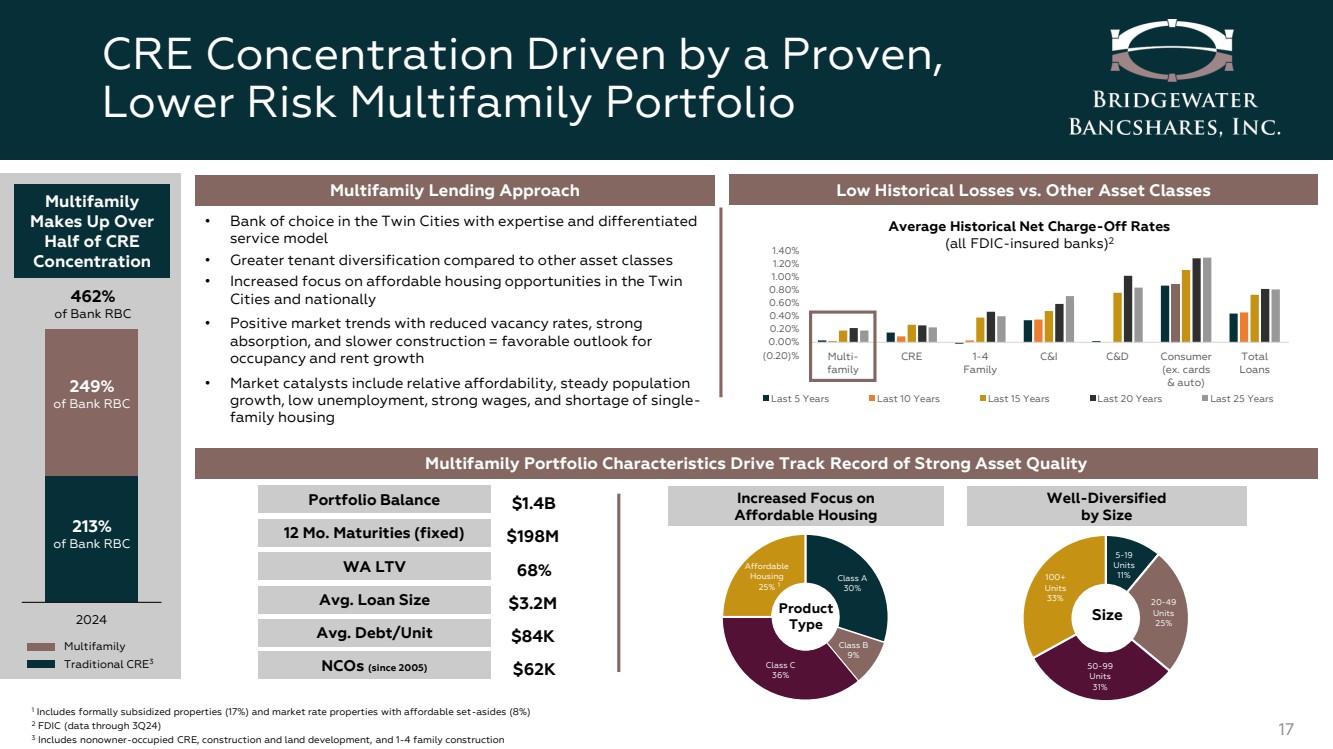
| Class A 30% Class B 9% Class C 36% Affordable Housing 25% CRE Concentration Driven by a Proven, Lower Risk Multifamily Portfolio 17 (0.20)% 0.00% 0.20% 0.40% 0.60% 0.80% 1.00% 1.20% 1.40% Multi-family CRE 1-4 Family C&I C&D Consumer (ex. cards & auto) Total Loans Last 5 Years Last 10 Years Last 15 Years Last 20 Years Last 25 Years 2024 249% of Bank RBC Multifamily Traditional CRE3 213% of Bank RBC 462% of Bank RBC Multifamily Makes Up Over Half of CRE Concentration Multifamily Lending Approach Multifamily Portfolio Characteristics Drive Track Record of Strong Asset Quality WA LTV Avg. Loan Size Avg. Debt/Unit NCOs (since 2005) 68% $3.2M $84K $62K 1 Includes formally subsidized properties (17%) and market rate properties with affordable set-asides (8%) 2 FDIC (data through 3Q24) 3 Includes nonowner-occupied CRE, construction and land development, and 1-4 family construction • Bank of choice in the Twin Cities with expertise and differentiated service model • Greater tenant diversification compared to other asset classes • Increased focus on affordable housing opportunities in the Twin Cities and nationally • Positive market trends with reduced vacancy rates, strong absorption, and slower construction = favorable outlook for occupancy and rent growth • Market catalysts include relative affordability, steady population growth, low unemployment, strong wages, and shortage of single-family housing Low Historical Losses vs. Other Asset Classes Average Historical Net Charge-Off Rates (all FDIC-insured banks)2 Portfolio Balance 12 Mo. Maturities (fixed) $1.4B $198M Increased Focus on Affordable Housing Product Type Well-Diversified by Size 5-19 Units 11% 20-49 Units 25% 50-99 Units 31% 100+ Units 33% Size 1 |
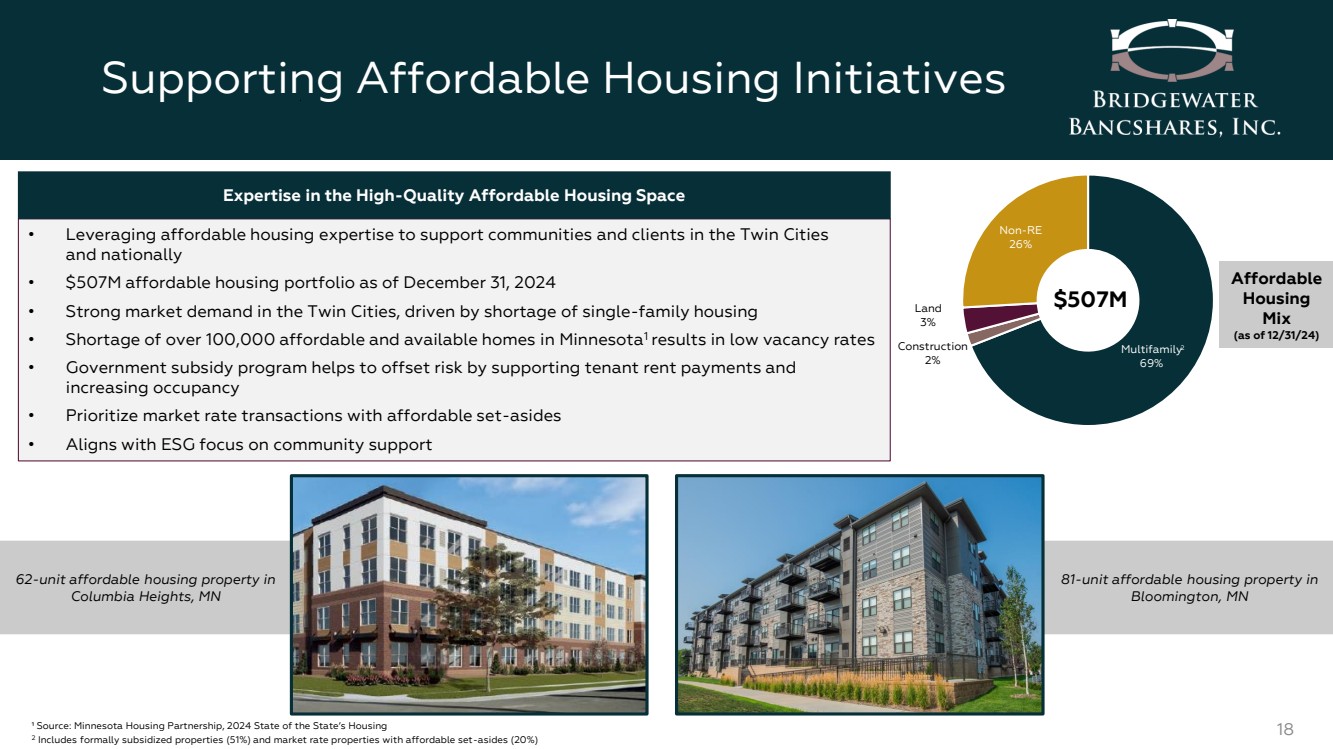
| 81-unit affordable housing property in Bloomington, MN Supporting Affordable Housing Initiatives 18 ¹ Source: Minnesota Housing Partnership, 2024 State of the State’s Housing 2 Includes formally subsidized properties (51%) and market rate properties with affordable set-asides (20%) 62-unit affordable housing property in Columbia Heights, MN • Leveraging affordable housing expertise to support communities and clients in the Twin Cities and nationally • $507M affordable housing portfolio as of December 31, 2024 • Strong market demand in the Twin Cities, driven by shortage of single-family housing • Shortage of over 100,000 affordable and available homes in Minnesota1 results in low vacancy rates • Government subsidy program helps to offset risk by supporting tenant rent payments and increasing occupancy • Prioritize market rate transactions with affordable set-asides • Aligns with ESG focus on community support Expertise in the High-Quality Affordable Housing Space Multifamily 69% Construction 2% Land 3% Non-RE 26% $507M Affordable Housing Mix (as of 12/31/24) 2 |
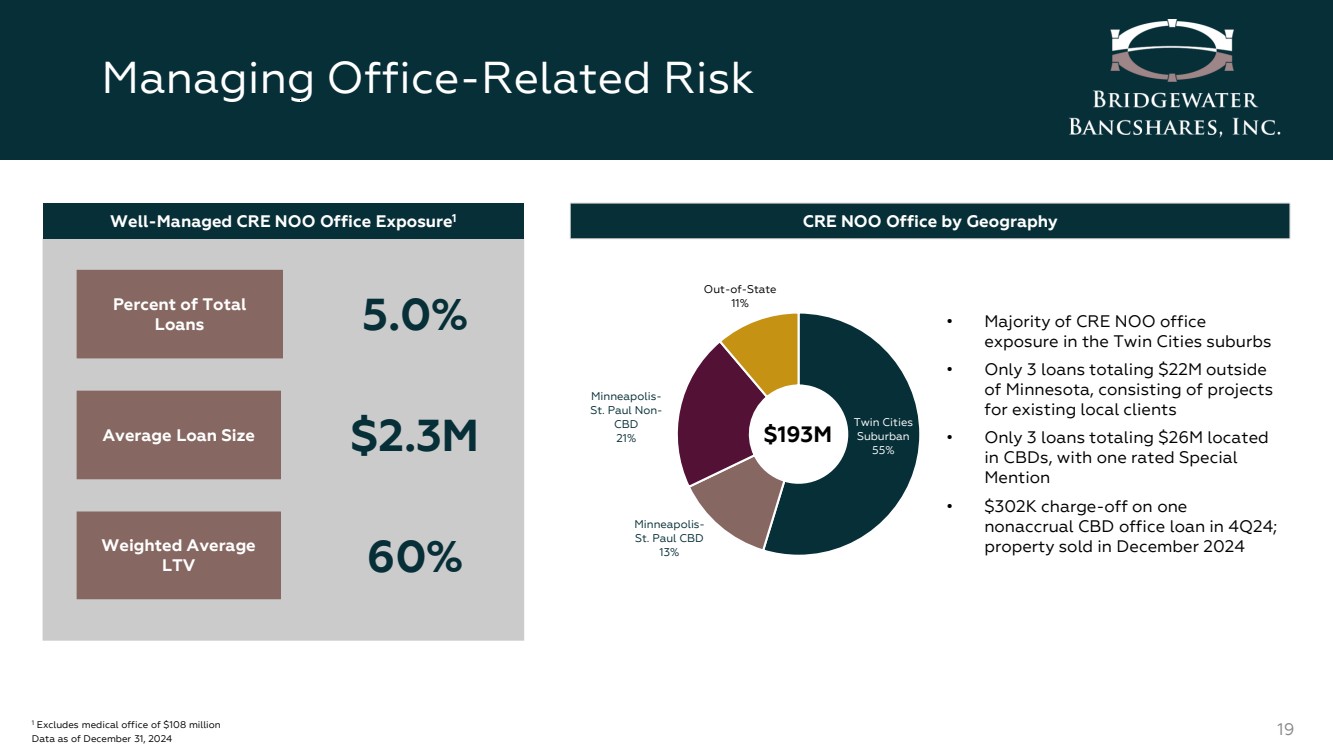
| Managing Office-Related Risk 19 1 Excludes medical office of $108 million Data as of December 31, 2024 Percent of Total Loans Average Loan Size 5.0% $2.3M Weighted Average LTV 60% CRE NOO Office by Geography • Majority of CRE NOO office exposure in the Twin Cities suburbs • Only 3 loans totaling $22M outside of Minnesota, consisting of projects for existing local clients • Only 3 loans totaling $26M located in CBDs, with one rated Special Mention • $302K charge-off on one nonaccrual CBD office loan in 4Q24; property sold in December 2024 Well-Managed CRE NOO Office Exposure1 Twin Cities Suburban 55% Minneapolis-St. Paul CBD 13% Minneapolis-St. Paul Non-CBD 21% Out-of-State 11% $193M |
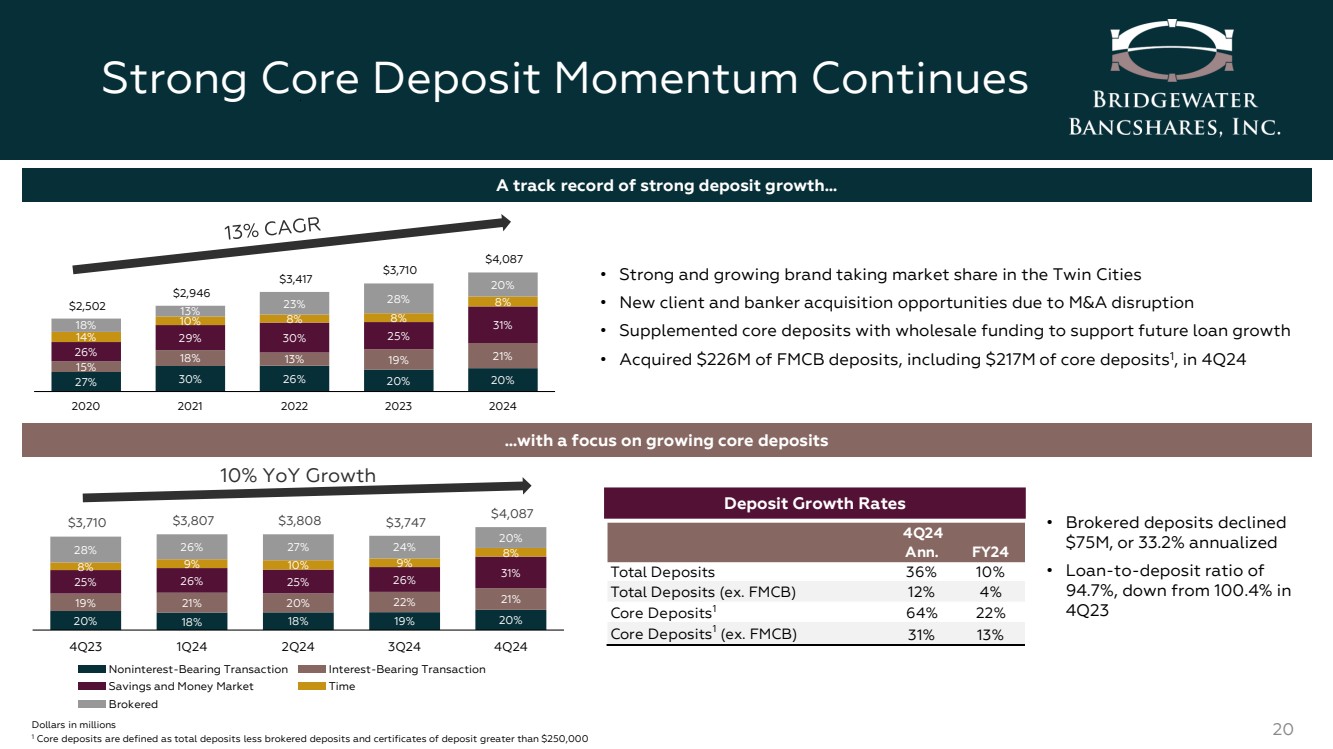
| Strong Core Deposit Momentum Continues 20 Dollars in millions 1 Core deposits are defined as total deposits less brokered deposits and certificates of deposit greater than $250,000 A track record of strong deposit growth… • Strong and growing brand taking market share in the Twin Cities • New client and banker acquisition opportunities due to M&A disruption • Supplemented core deposits with wholesale funding to support future loan growth • Acquired $226M of FMCB deposits, including $217M of core deposits1 , in 4Q24 • Brokered deposits declined $75M, or 33.2% annualized • Loan-to-deposit ratio of 94.7%, down from 100.4% in 4Q23 …with a focus on growing core deposits 27% 30% 26% 20% 20% 15% 26% 18% 13% 19% 21% 29% 30% 25% 31% 14% 10% 8% 8% 8% 18% 13% 23% 28% 20% $2,502 $2,946 $3,417 $3,710 $4,087 2020 2021 2022 2023 2024 Noninterest-Bearing Transaction Interest-Bearing Transaction Savings and Money Market Time Brokered 20% 18% 18% 19% 20% 19% 21% 20% 22% 21% 25% 26% 25% 26% 31% 8% 9% 10% 9% 28% 8% 26% 27% 24% 20% $3,710 $3,807 $3,808 $3,747 $4,087 4Q23 1Q24 2Q24 3Q24 4Q24 10% YoY Growth Deposit Growth Rates 4Q24 Ann. FY24 Total Deposits 36% 10% Total Deposits (ex. FMCB) 12% 4% Core Deposits1 64% 22% Core Deposits1 (ex. FMCB) 31% 13% |
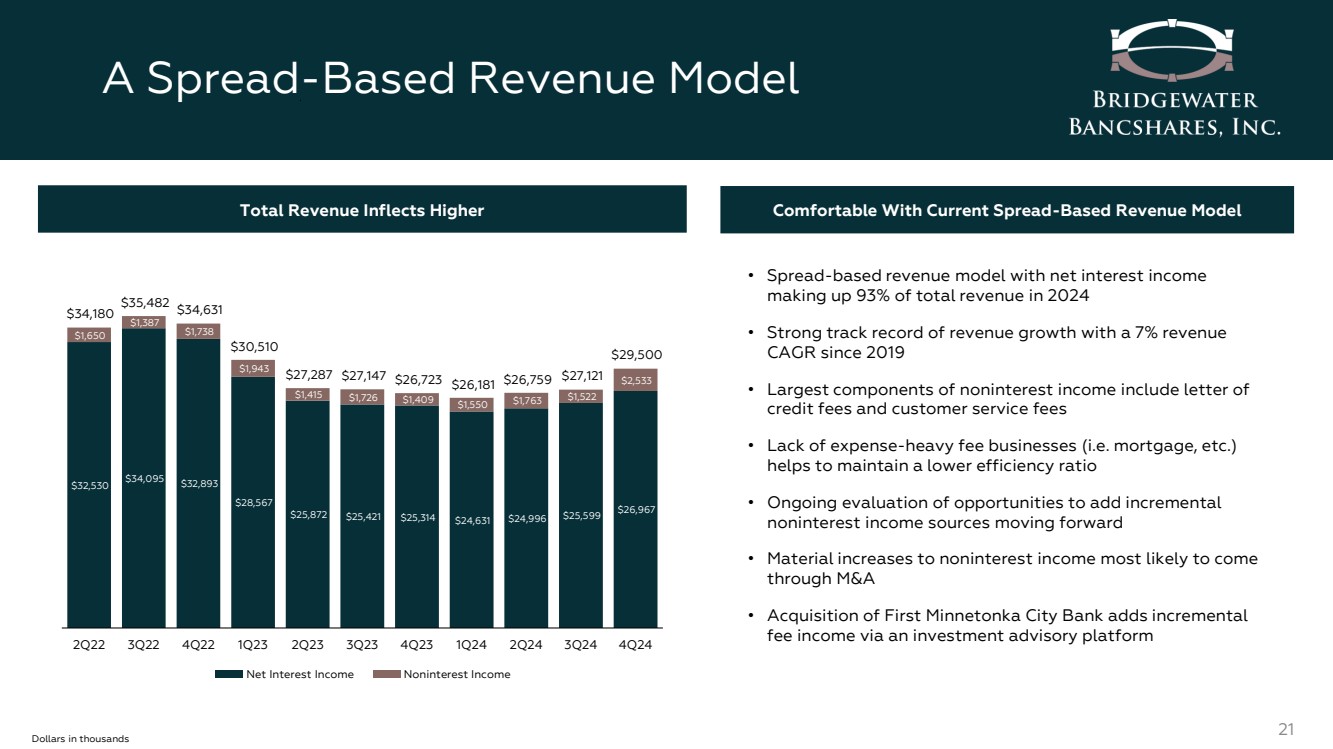
| $32,530 $34,095 $32,893 $28,567 $25,872 $25,421 $25,314 $24,631 $24,996 $25,599 $26,967 $1,650 $1,387 $1,738 $1,943 $1,415 $1,726 $1,409 $1,550 $1,763 $1,522 $2,533 $34,180 $35,482 $34,631 $30,510 $27,287 $27,147 $26,723 $26,181 $26,759 $27,121 $29,500 2Q22 3Q22 4Q22 1Q23 2Q23 3Q23 4Q23 1Q24 2Q24 3Q24 4Q24 A Spread-Based Revenue Model 21 Total Revenue Inflects Higher Dollars in thousands • Spread-based revenue model with net interest income making up 93% of total revenue in 2024 • Strong track record of revenue growth with a 7% revenue CAGR since 2019 • Largest components of noninterest income include letter of credit fees and customer service fees • Lack of expense-heavy fee businesses (i.e. mortgage, etc.) helps to maintain a lower efficiency ratio • Ongoing evaluation of opportunities to add incremental noninterest income sources moving forward • Material increases to noninterest income most likely to come through M&A • Acquisition of First Minnetonka City Bank adds incremental fee income via an investment advisory platform Comfortable With Current Spread-Based Revenue Model Net Interest Income Noninterest Income |
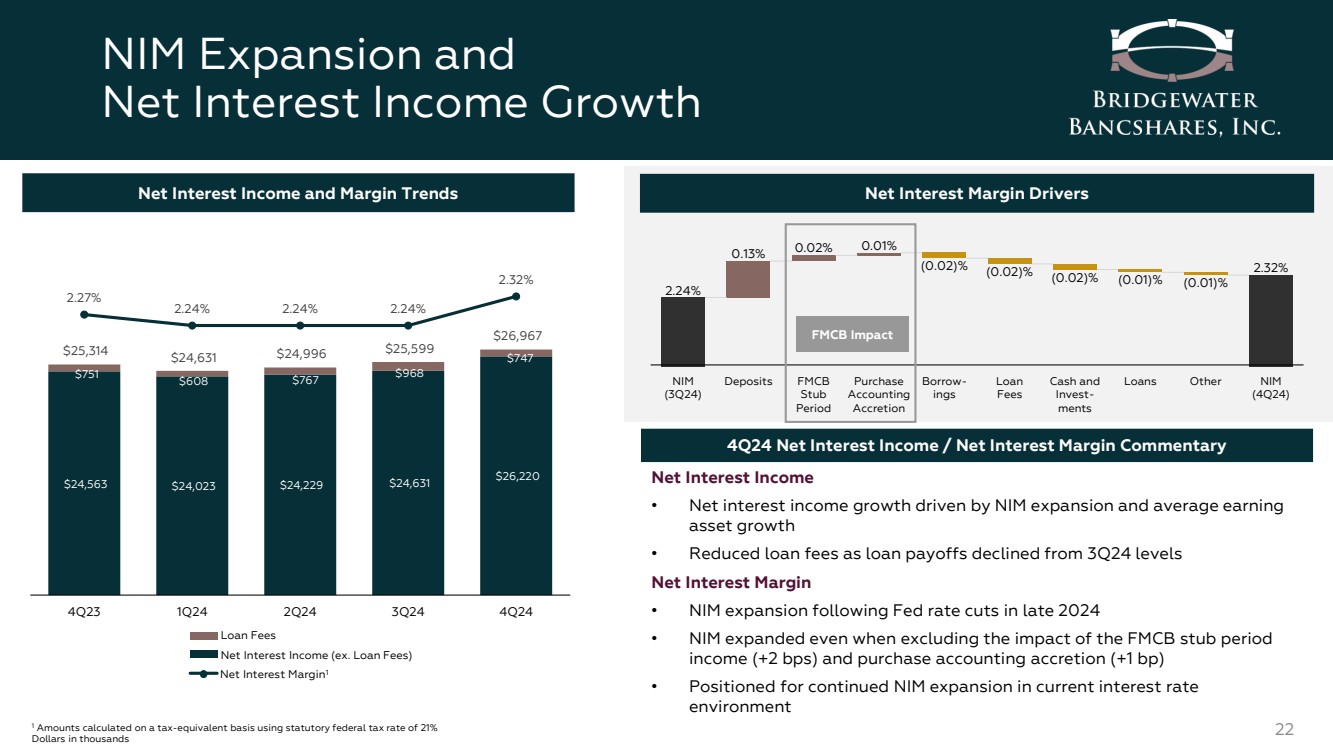
| NIM Expansion and Net Interest Income Growth 22 $24,563 $24,023 $24,229 $24,631 $26,220 $751 $608 $767 $968 $747 $25,314 $24,631 $24,996 $25,599 $26,967 2.27% 2.24% 2.24% 2.24% 2.32% 4Q23 1Q24 2Q24 3Q24 4Q24 Net Interest Margin1 Net Interest Income (ex. Loan Fees) Loan Fees Net Interest Income and Margin Trends 2.24% 0.13% (0.02)% (0.02)% (0.02)% (0.01)% (0.01)% 2.32% 0.02% 0.01% NIM (3Q24) Deposits FMCB Stub Period Purchase Accounting Accretion Borrow-ings Loan Fees Cash and Invest-ments Loans Other NIM (4Q24) Net Interest Margin Drivers 4Q24 Net Interest Income / Net Interest Margin Commentary 1 Amounts calculated on a tax-equivalent basis using statutory federal tax rate of 21% Dollars in thousands Net Interest Income • Net interest income growth driven by NIM expansion and average earning asset growth • Reduced loan fees as loan payoffs declined from 3Q24 levels Net Interest Margin • NIM expansion following Fed rate cuts in late 2024 • NIM expanded even when excluding the impact of the FMCB stub period income (+2 bps) and purchase accounting accretion (+1 bp) • Positioned for continued NIM expansion in current interest rate environment FMCB Impact |
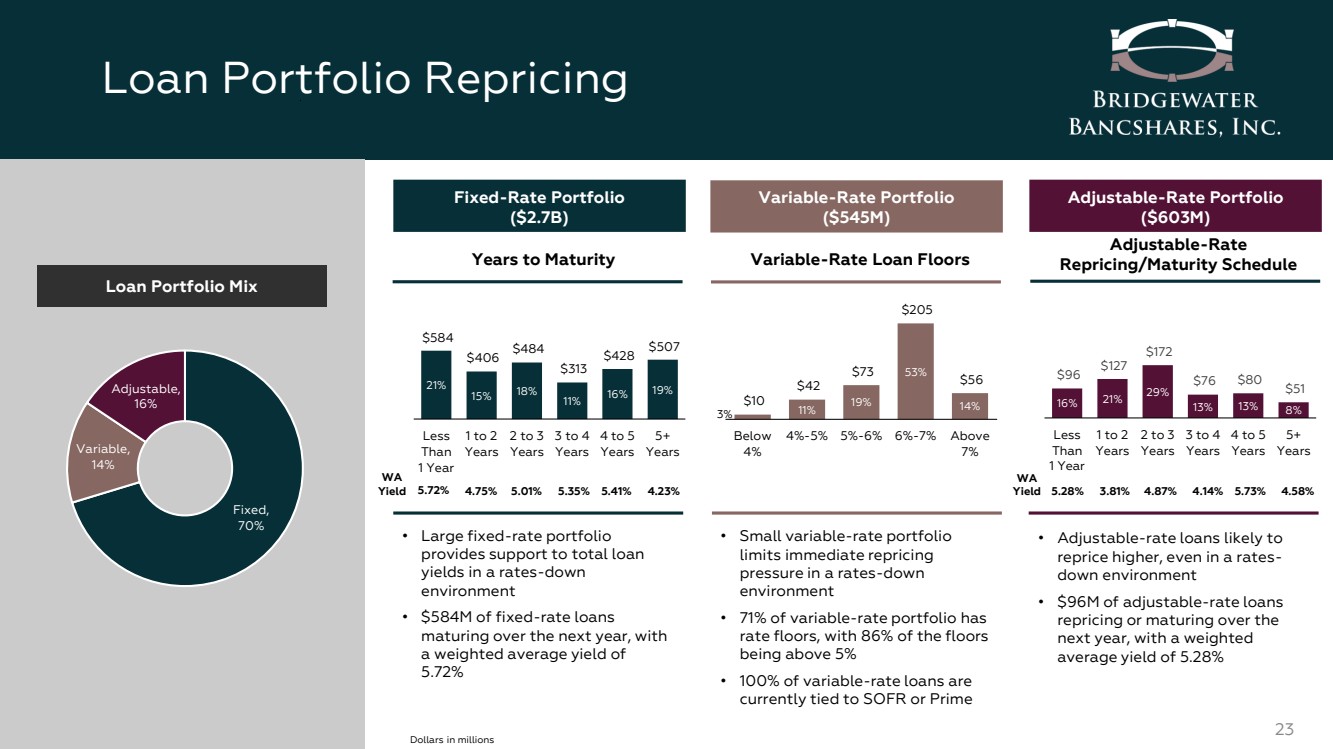
| 16% 21% 29% 13% 13% 8% $96 $127 $172 $76 $80 $51 Less Than 1 Year 1 to 2 Years 2 to 3 Years 3 to 4 Years 4 to 5 Years 5+ Years 21% 15% 18% 11% 16% 19% $584 $406 $484 $313 $428 $507 Less Than 1 Year 1 to 2 Years 2 to 3 Years 3 to 4 Years 4 to 5 Years 5+ Years Loan Portfolio Repricing 23 Fixed, 70% Variable, 14% Adjustable, 16% Loan Portfolio Mix Fixed-Rate Portfolio ($2.7B) Variable-Rate Portfolio ($545M) Adjustable-Rate Portfolio ($603M) Years to Maturity • Large fixed-rate portfolio provides support to total loan yields in a rates-down environment • $584M of fixed-rate loans maturing over the next year, with a weighted average yield of 5.72% Variable-Rate Loan Floors • Small variable-rate portfolio limits immediate repricing pressure in a rates-down environment • 71% of variable-rate portfolio has rate floors, with 86% of the floors being above 5% • 100% of variable-rate loans are currently tied to SOFR or Prime Adjustable-Rate Repricing/Maturity Schedule • Adjustable-rate loans likely to reprice higher, even in a rates-down environment • $96M of adjustable-rate loans repricing or maturing over the next year, with a weighted average yield of 5.28% Dollars in millions WA Yield 5.72% 4.75% 5.01% 5.35% 5.41% 4.23% WA Yield 5.28% 3.81% 4.87% 4.14% 5.73% 4.58% 3% 11% 19% 53% 14% $10 $42 $73 $205 $56 Below 4% 4%-5% 5%-6% 6%-7% Above 7% |
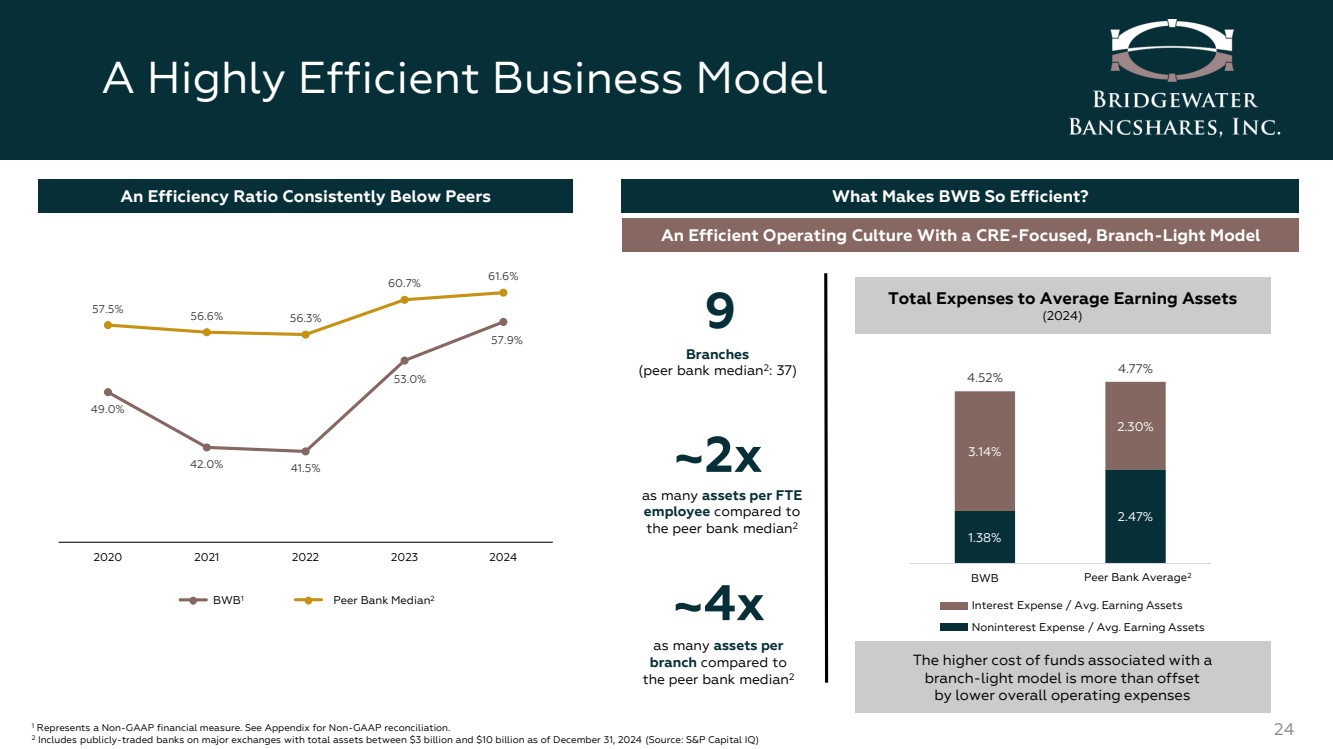
| A Highly Efficient Business Model 24 49.0% 42.0% 41.5% 53.0% 57.9% 57.5% 56.6% 56.3% 60.7% 61.6% 2020 2021 2022 2023 2024 BWB1 An Efficiency Ratio Consistently Below Peers 1 Represents a Non-GAAP financial measure. See Appendix for Non-GAAP reconciliation. 2 Includes publicly-traded banks on major exchanges with total assets between $3 billion and $10 billion as of December 31, 2024 (Source: S&P Capital IQ) What Makes BWB So Efficient? An Efficient Operating Culture With a CRE-Focused, Branch-Light Model ~2x as many assets per FTE employee compared to the peer bank median2 9 Branches (peer bank median2 : 37) ~4x as many assets per branch compared to the peer bank median2 The higher cost of funds associated with a branch-light model is more than offset by lower overall operating expenses Total Expenses to Average Earning Assets (2024) 1.38% 2.47% 3.14% 2.30% 4.52% 4.77% BWB Peer Bank Average Peer Bank Median2 2 Interest Expense / Avg. Earning Assets Noninterest Expense / Avg. Earning Assets |
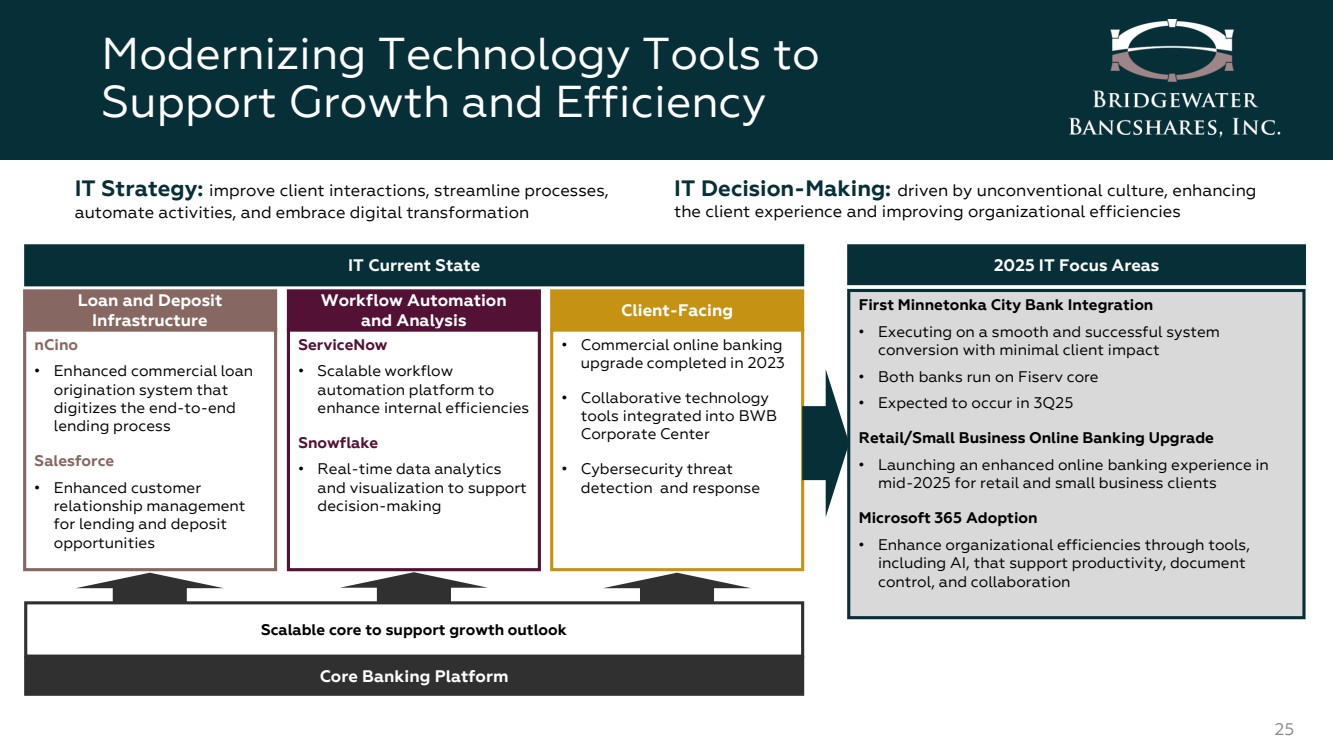
| Modernizing Technology Tools to Support Growth and Efficiency 25 Client-Facing • Commercial online banking upgrade completed in 2023 • Collaborative technology tools integrated into BWB Corporate Center • Cybersecurity threat detection and response Scalable core to support growth outlook Core Banking Platform IT Strategy: improve client interactions, streamline processes, automate activities, and embrace digital transformation IT Decision-Making: driven by unconventional culture, enhancing the client experience and improving organizational efficiencies IT Current State Loan and Deposit Infrastructure nCino • Enhanced commercial loan origination system that digitizes the end-to-end lending process Salesforce • Enhanced customer relationship management for lending and deposit opportunities Workflow Automation and Analysis ServiceNow • Scalable workflow automation platform to enhance internal efficiencies Snowflake • Real-time data analytics and visualization to support decision-making 2025 IT Focus Areas First Minnetonka City Bank Integration • Executing on a smooth and successful system conversion with minimal client impact • Both banks run on Fiserv core • Expected to occur in 3Q25 Retail/Small Business Online Banking Upgrade • Launching an enhanced online banking experience in mid-2025 for retail and small business clients Microsoft 365 Adoption • Enhance organizational efficiencies through tools, including AI, that support productivity, document control, and collaboration |
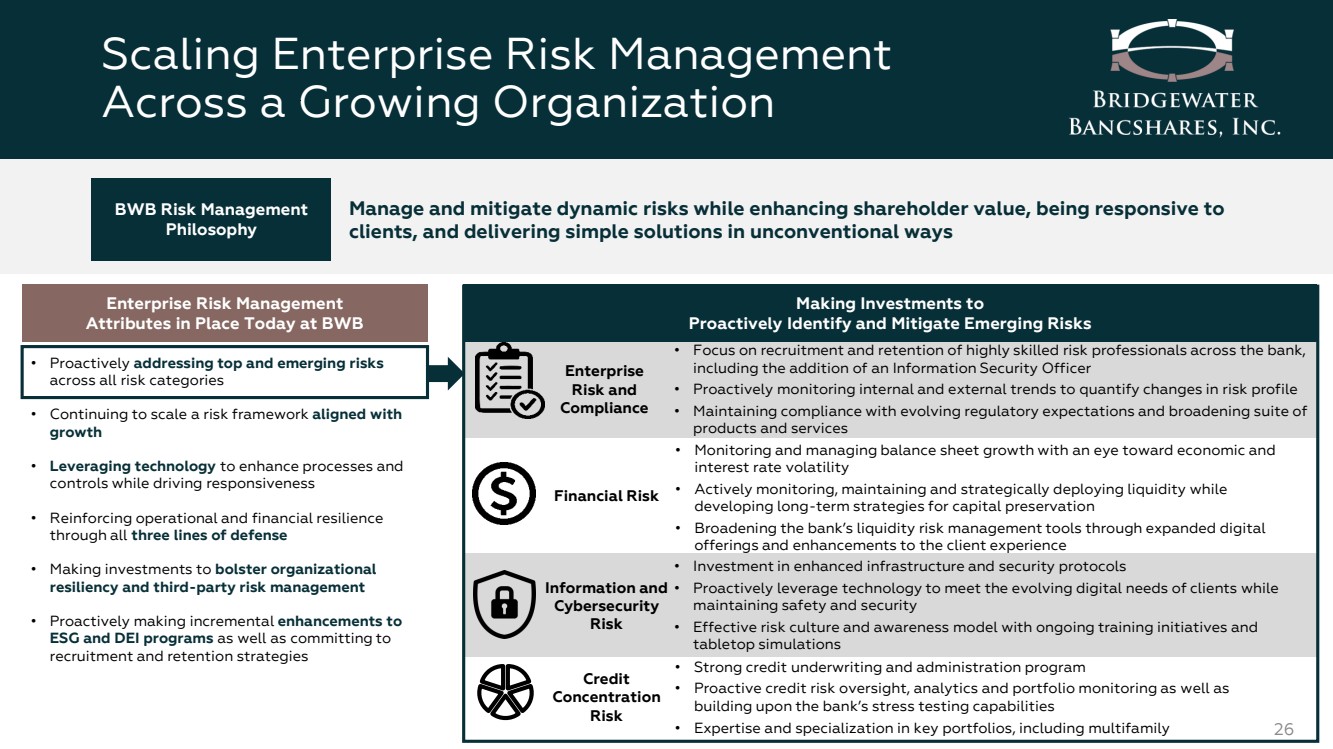
| Scaling Enterprise Risk Management Across a Growing Organization 26 Manage and mitigate dynamic risks while enhancing shareholder value, being responsive to clients, and delivering simple solutions in unconventional ways BWB Risk Management Philosophy Enterprise Risk Management Attributes in Place Today at BWB • Proactively addressing top and emerging risks across all risk categories • Continuing to scale a risk framework aligned with growth • Leveraging technology to enhance processes and controls while driving responsiveness • Reinforcing operational and financial resilience through all three lines of defense • Making investments to bolster organizational resiliency and third-party risk management • Proactively making incremental enhancements to ESG and DEI programs as well as committing to recruitment and retention strategies Making Investments to Proactively Identify and Mitigate Emerging Risks Credit Concentration Risk Information and Cybersecurity Risk Enterprise Risk and Compliance Financial Risk • Strong credit underwriting and administration program • Proactive credit risk oversight, analytics and portfolio monitoring as well as building upon the bank’s stress testing capabilities • Expertise and specialization in key portfolios, including multifamily • Investment in enhanced infrastructure and security protocols • Proactively leverage technology to meet the evolving digital needs of clients while maintaining safety and security • Effective risk culture and awareness model with ongoing training initiatives and tabletop simulations • Focus on recruitment and retention of highly skilled risk professionals across the bank, including the addition of an Information Security Officer • Proactively monitoring internal and external trends to quantify changes in risk profile • Maintaining compliance with evolving regulatory expectations and broadening suite of products and services • Monitoring and managing balance sheet growth with an eye toward economic and interest rate volatility • Actively monitoring, maintaining and strategically deploying liquidity while developing long-term strategies for capital preservation • Broadening the bank’s liquidity risk management tools through expanded digital offerings and enhancements to the client experience |
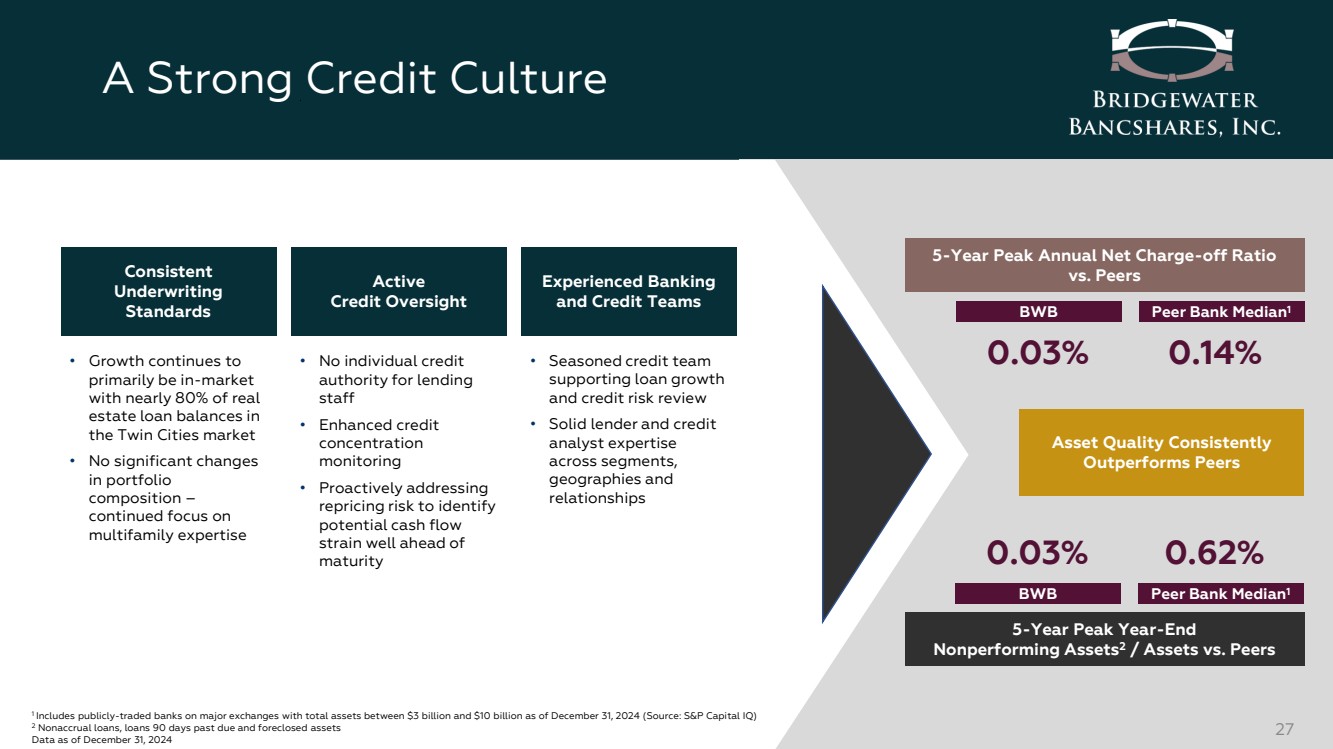
| A Strong Credit Culture 27 5-Year Peak Annual Net Charge-off Ratio vs. Peers 5-Year Peak Year-End Nonperforming Assets2 / Assets vs. Peers 0.03% BWB Peer Bank Median1 0.14% 0.03% BWB Peer Bank Median1 0.62% 1 Includes publicly-traded banks on major exchanges with total assets between $3 billion and $10 billion as of December 31, 2024 (Source: S&P Capital IQ) 2 Nonaccrual loans, loans 90 days past due and foreclosed assets Data as of December 31, 2024 Asset Quality Consistently Outperforms Peers Consistent Underwriting Standards Active Credit Oversight Experienced Banking and Credit Teams • Growth continues to primarily be in-market with nearly 80% of real estate loan balances in the Twin Cities market • No significant changes in portfolio composition – continued focus on multifamily expertise • No individual credit authority for lending staff • Enhanced credit concentration monitoring • Proactively addressing repricing risk to identify potential cash flow strain well ahead of maturity • Seasoned credit team supporting loan growth and credit risk review • Solid lender and credit analyst expertise across segments, geographies and relationships |
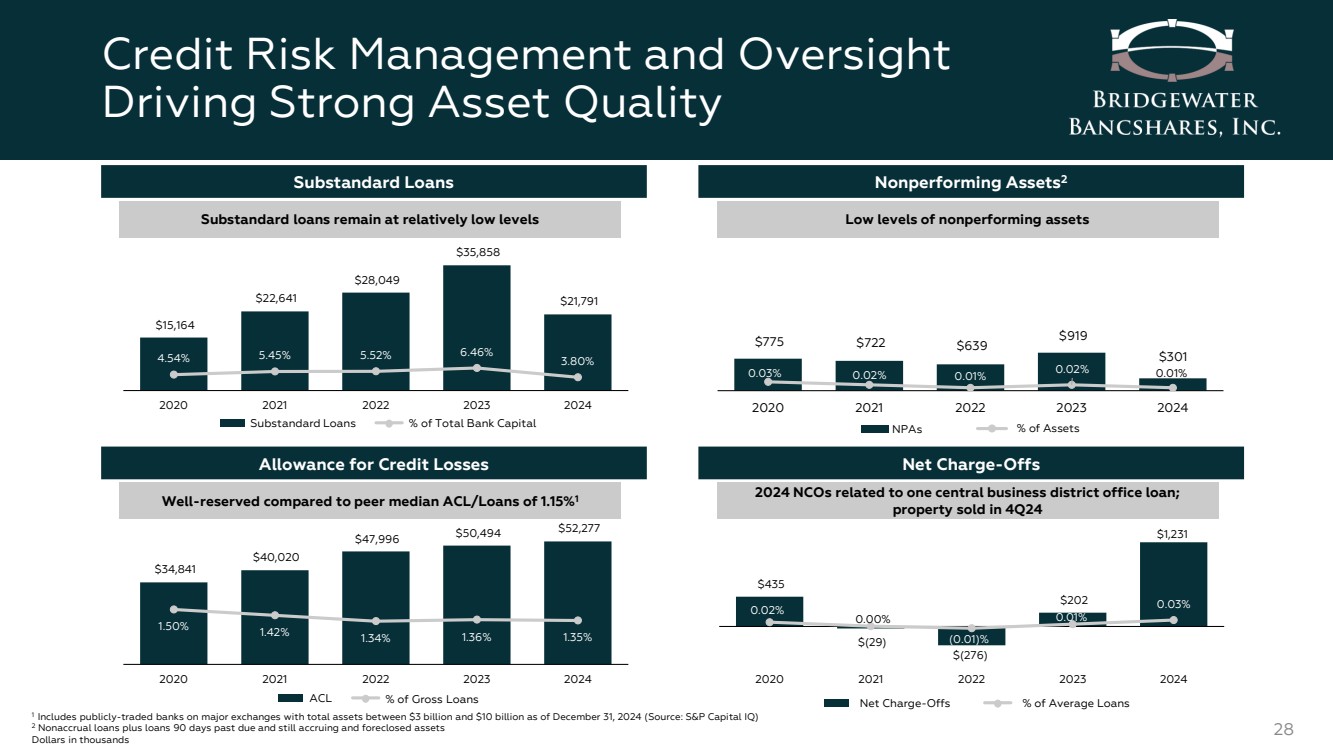
| $775 $722 $639 $919 $301 0.03% 0.02% 0.01% 0.02% 0.01% 2020 2021 2022 2023 2024 $34,841 $40,020 $47,996 $50,494 $52,277 1.50% 1.42% 1.34% 1.36% 1.35% 2020 2021 2022 2023 2024 Credit Risk Management and Oversight Driving Strong Asset Quality 28 Nonperforming Assets2 Low levels of nonperforming assets Allowance for Credit Losses Well-reserved compared to peer median ACL/Loans of 1.15%1 $435 $(29) $(276) $202 $1,231 0.02% 0.00% (0.01)% 0.01% 0.03% 2020 2021 2022 2023 2024 Net Charge-Offs 2024 NCOs related to one central business district office loan; property sold in 4Q24 Net Charge-Offs % of Average Loans $15,164 $22,641 $28,049 $35,858 $21,791 4.54% 5.45% 5.52% 6.46% 3.80% 2020 2021 2022 2023 2024 Substandard Loans Substandard loans remain at relatively low levels Substandard Loans % of Total Bank Capital ACL % of Gross Loans 1 Includes publicly-traded banks on major exchanges with total assets between $3 billion and $10 billion as of December 31, 2024 (Source: S&P Capital IQ) 2 Nonaccrual loans plus loans 90 days past due and still accruing and foreclosed assets Dollars in thousands NPAs % of Assets |
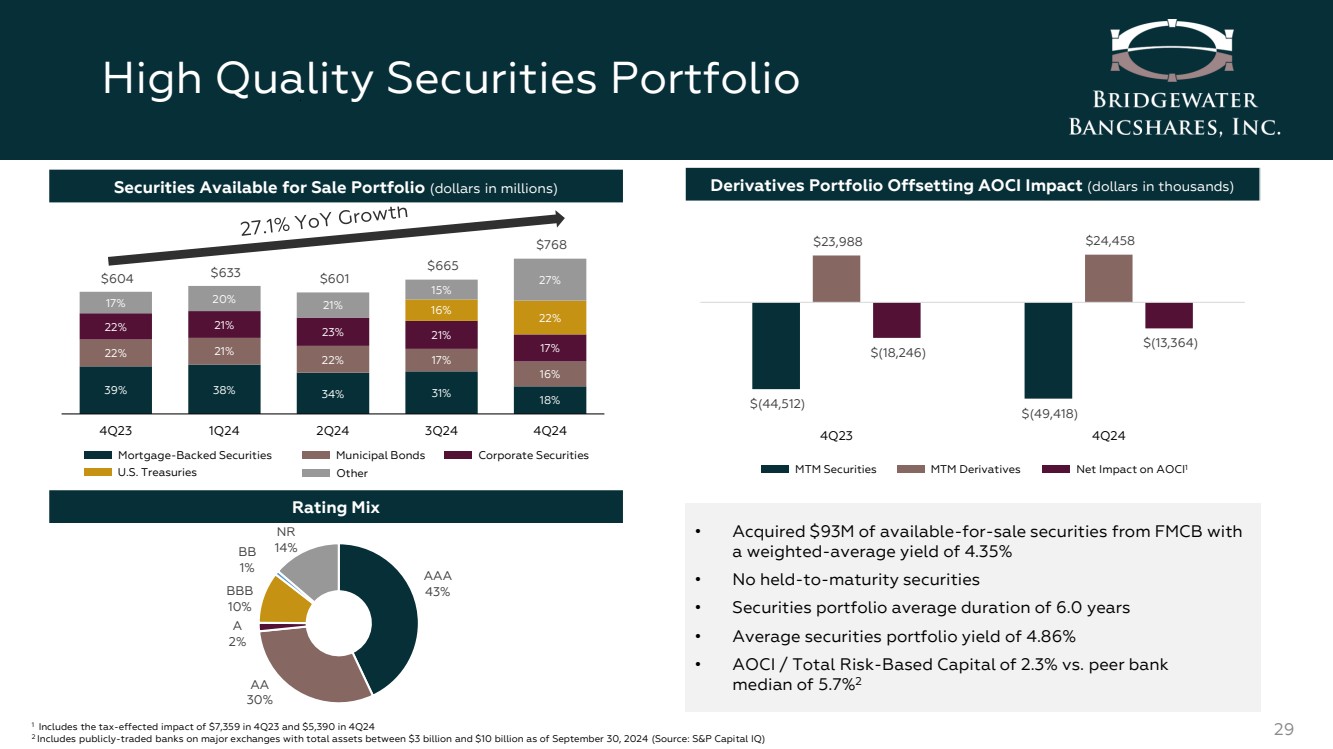
| High Quality Securities Portfolio 29 39% 38% 34% 31% 18% 22% 21% 22% 17% 16% 22% 21% 23% 21% 17% 16% 22% 17% 20% 21% 15% $604 27% $633 $601 $665 $768 4Q23 1Q24 2Q24 3Q24 4Q24 Mortgage-Backed Securities Municipal Bonds U.S. Treasuries Corporate Securities Securities Available for Sale Portfolio (dollars in millions) AAA 43% AA 30% A 2% BBB 10% BB 1% NR 14% Rating Mix Derivatives Portfolio Offsetting AOCI Impact (dollars in thousands) $(44,512) $(49,418) $23,988 $24,458 $(18,246) $(13,364) 4Q23 4Q24 MTM Securities MTM Derivatives Net Impact on AOCI1 • Acquired $93M of available-for-sale securities from FMCB with a weighted-average yield of 4.35% • No held-to-maturity securities • Securities portfolio average duration of 6.0 years • Average securities portfolio yield of 4.86% • AOCI / Total Risk-Based Capital of 2.3% vs. peer bank median of 5.7%2 1 Includes the tax-effected impact of $7,359 in 4Q23 and $5,390 in 4Q24 2 Includes publicly-traded banks on major exchanges with total assets between $3 billion and $10 billion as of September 30, 2024 (Source: S&P Capital IQ) Other |
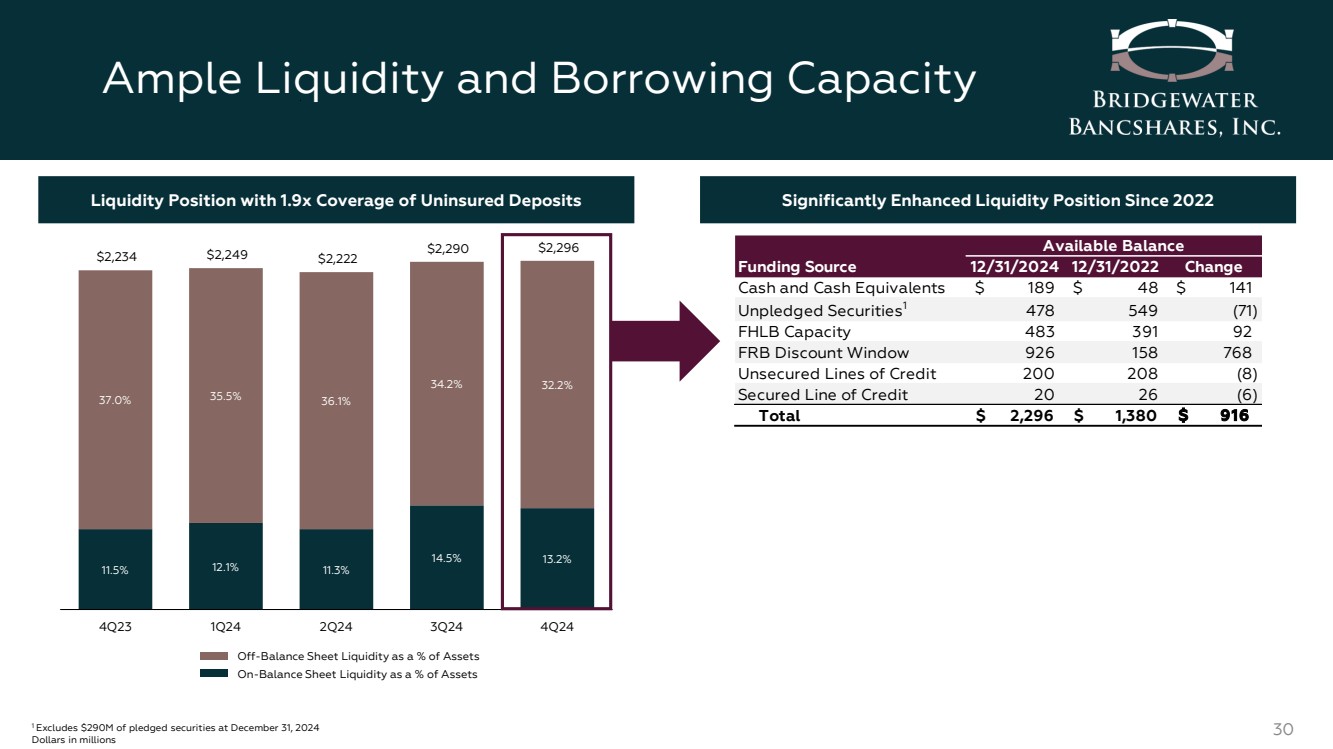
| Ample Liquidity and Borrowing Capacity 30 1 Excludes $290M of pledged securities at December 31, 2024 Dollars in millions 11.5% 12.1% 11.3% 14.5% 13.2% 37.0% 35.5% 36.1% 34.2% 32.2% $2,234 $2,249 $2,222 $2,290 $2,296 4Q23 1Q24 2Q24 3Q24 4Q24 Off-Balance Sheet Liquidity as a % of Assets On-Balance Sheet Liquidity as a % of Assets Liquidity Position with 1.9x Coverage of Uninsured Deposits Significantly Enhanced Liquidity Position Since 2022 Funding Source 12/31/2024 12/31/2022 Change Cash and Cash Equivalents $ 189 $ 4 8 $ 141 Unpledged Securities1 478 549 (71) FHLB Capacity 483 391 9 2 FRB Discount Window 926 158 768 Unsecured Lines of Credit 200 208 (8) Secured Line of Credit 20 26 (6) Total $ 2,296 $ 1,380 $ 916 Available Balance |
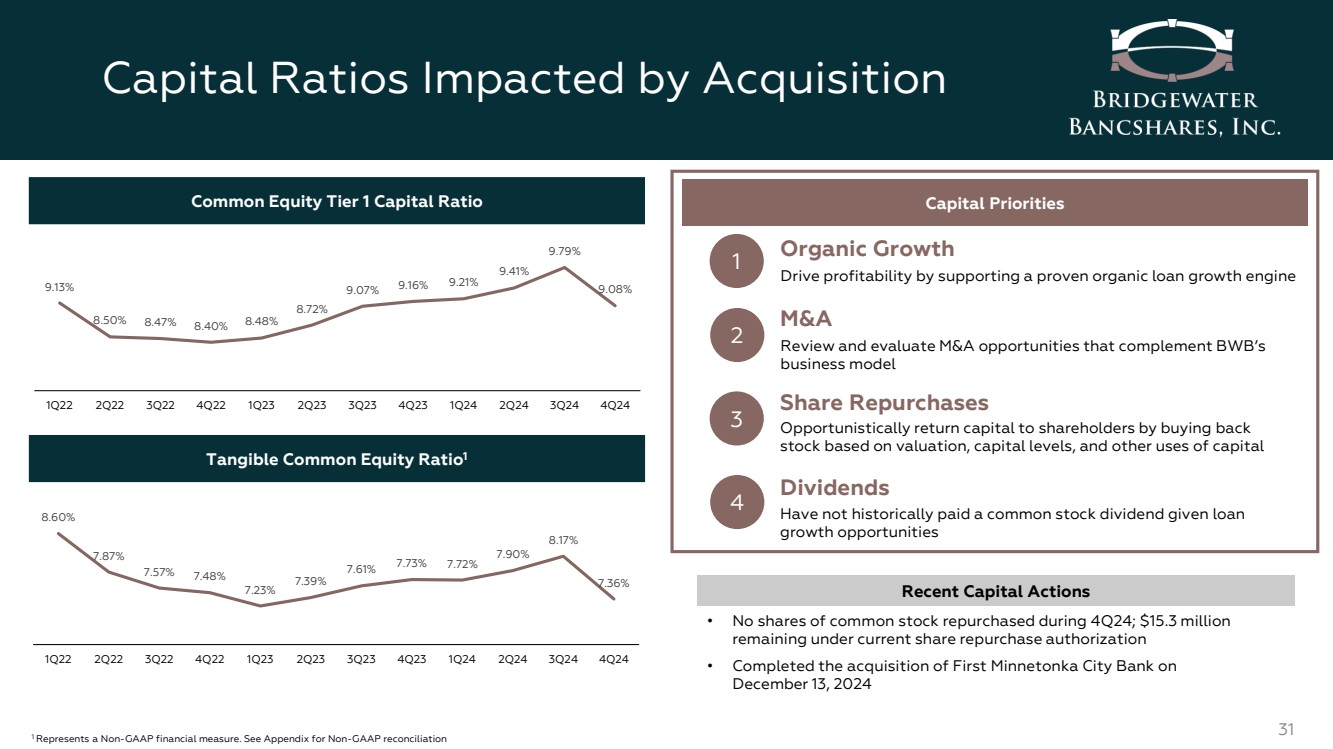
| Capital Ratios Impacted by Acquisition 31 1 Represents a Non-GAAP financial measure. See Appendix for Non-GAAP reconciliation Capital Priorities 1 3 2 Organic Growth Share Repurchases M&A 4 Dividends Drive profitability by supporting a proven organic loan growth engine Opportunistically return capital to shareholders by buying back stock based on valuation, capital levels, and other uses of capital Review and evaluate M&A opportunities that complement BWB’s business model Have not historically paid a common stock dividend given loan growth opportunities 8.60% 7.87% 7.57% 7.48% 7.23% 7.39% 7.61% 7.73% 7.72% 7.90% 8.17% 7.36% 1Q22 2Q22 3Q22 4Q22 1Q23 2Q23 3Q23 4Q23 1Q24 2Q24 3Q24 4Q24 9.13% 8.50% 8.47% 8.40% 8.48% 8.72% 9.07% 9.16% 9.21% 9.41% 9.79% 9.08% 1Q22 2Q22 3Q22 4Q22 1Q23 2Q23 3Q23 4Q23 1Q24 2Q24 3Q24 4Q24 Common Equity Tier 1 Capital Ratio Tangible Common Equity Ratio1 Recent Capital Actions • No shares of common stock repurchased during 4Q24; $15.3 million remaining under current share repurchase authorization • Completed the acquisition of First Minnetonka City Bank on December 13, 2024 |
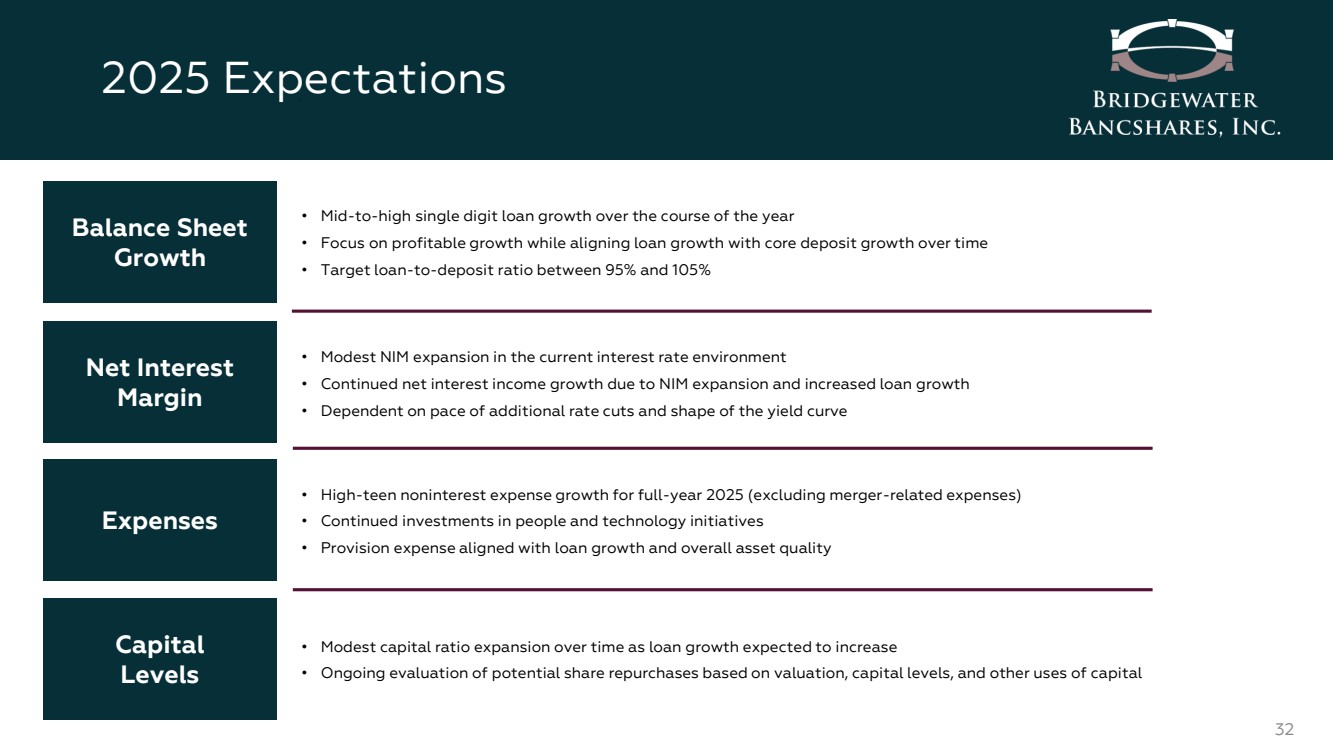
| 2025 Expectations 32 • Mid-to-high single digit loan growth over the course of the year • Focus on profitable growth while aligning loan growth with core deposit growth over time • Target loan-to-deposit ratio between 95% and 105% Balance Sheet Growth • Modest NIM expansion in the current interest rate environment • Continued net interest income growth due to NIM expansion and increased loan growth • Dependent on pace of additional rate cuts and shape of the yield curve Net Interest Margin • High-teen noninterest expense growth for full-year 2025 (excluding merger-related expenses) • Continued investments in people and technology initiatives • Provision expense aligned with loan growth and overall asset quality Expenses • Modest capital ratio expansion over time as loan growth expected to increase • Ongoing evaluation of potential share repurchases based on valuation, capital levels, and other uses of capital Capital Levels |
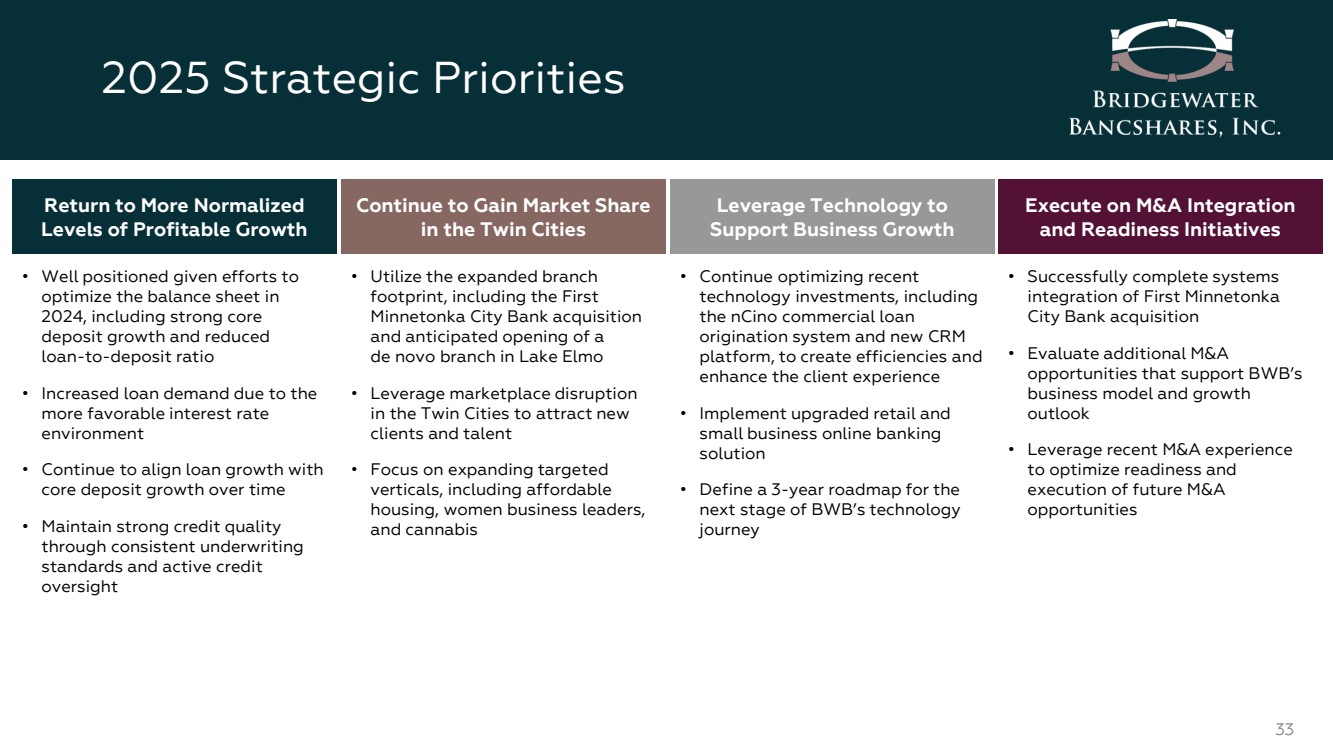
| 2025 Strategic Priorities 33 Return to More Normalized Levels of Profitable Growth Continue to Gain Market Share in the Twin Cities Leverage Technology to Support Business Growth Execute on M&A Integration and Readiness Initiatives • Well positioned given efforts to optimize the balance sheet in 2024, including strong core deposit growth and reduced loan-to-deposit ratio • Increased loan demand due to the more favorable interest rate environment • Continue to align loan growth with core deposit growth over time • Maintain strong credit quality through consistent underwriting standards and active credit oversight • Utilize the expanded branch footprint, including the First Minnetonka City Bank acquisition and anticipated opening of a de novo branch in Lake Elmo • Leverage marketplace disruption in the Twin Cities to attract new clients and talent • Focus on expanding targeted verticals, including affordable housing, women business leaders, and cannabis • Continue optimizing recent technology investments, including the nCino commercial loan origination system and new CRM platform, to create efficiencies and enhance the client experience • Implement upgraded retail and small business online banking solution • Define a 3-year roadmap for the next stage of BWB’s technology journey • Successfully complete systems integration of First Minnetonka City Bank acquisition • Evaluate additional M&A opportunities that support BWB’s business model and growth outlook • Leverage recent M&A experience to optimize readiness and execution of future M&A opportunities |
| APPENDIX 34 |

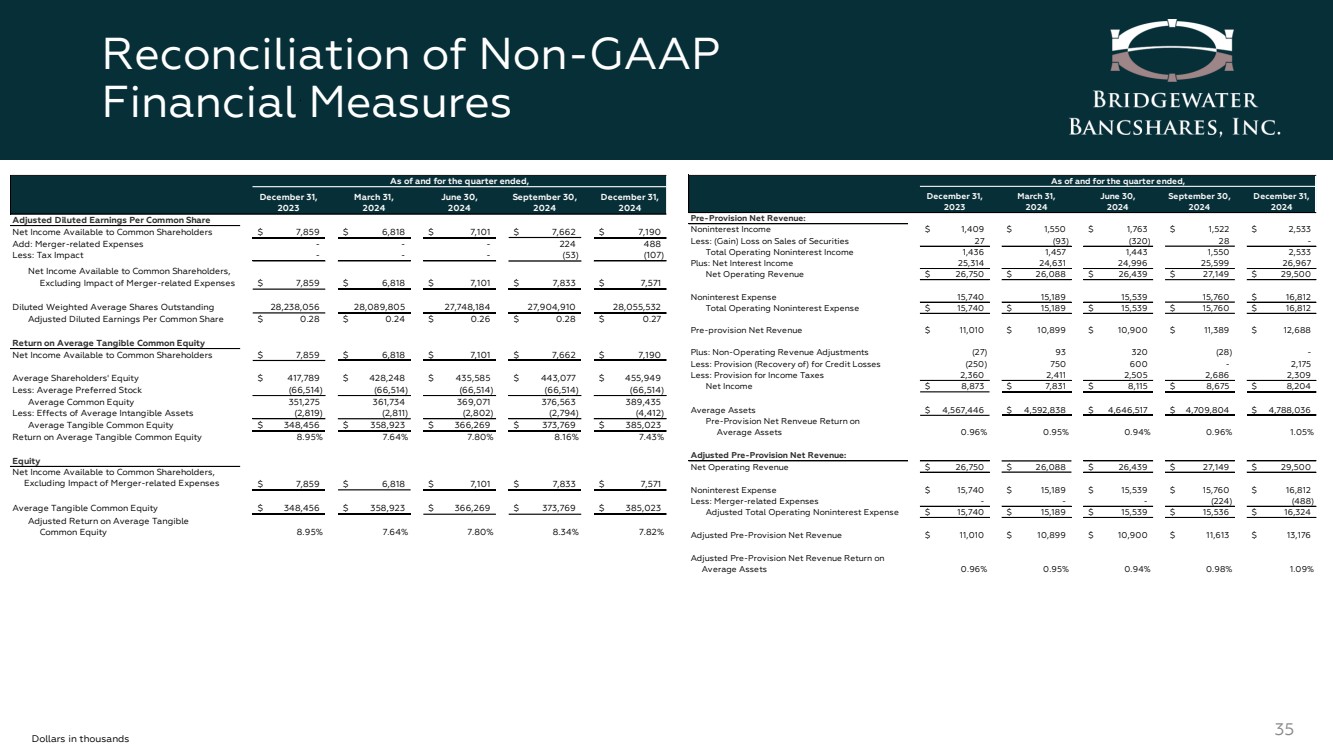
| Reconciliation of Non-GAAP Financial Measures 35 Dollars in thousands December 31, 2023 March 31, 2024 June 30, 2024 September 30, 2024 December 31, 2024 Adjusted Diluted Earnings Per Common Share Net Income Available to Common Shareholders $ 7,859 $ 6,818 $ 7,101 $ 7,662 $ 7,190 Add: Merger-related Expenses - - - 224 488 Less: Tax Impact - - - (53) (107) Net Income Available to Common Shareholders, Excluding Impact of Merger-related Expenses $ 7,859 $ 6,818 $ 7,101 $ 7,833 $ 7,571 Diluted Weighted Average Shares Outstanding 28,238,056 28,089,805 27,748,184 27,904,910 28,055,532 Adjusted Diluted Earnings Per Common Share $ 0.28 $ 0.24 $ 0.26 $ 0.28 $ 0.27 Return on Average Tangible Common Equity Net Income Available to Common Shareholders $ 7,859 $ 6,818 $ 7,101 $ 7,662 $ 7,190 Average Shareholders' Equity $ 417,789 $ 428,248 $ 435,585 $ 443,077 $ 455,949 Less: Average Preferred Stock (66,514) (66,514) (66,514) (66,514) (66,514) Average Common Equity 351,275 361,734 369,071 376,563 389,435 Less: Effects of Average Intangible Assets (2,819) (2,811) (2,802) (2,794) (4,412) Average Tangible Common Equity $ 348,456 $ 358,923 $ 366,269 $ 373,769 $ 385,023 Return on Average Tangible Common Equity 8.95% 7.64% 7.80% 8.16% 7.43% Adjusted Return on Average Tangible Common Equity Net Income Available to Common Shareholders, Excluding Impact of Merger-related Expenses $ 7,859 $ 6,818 $ 7,101 $ 7,833 $ 7,571 Average Tangible Common Equity $ 348,456 $ 358,923 $ 366,269 $ 373,769 $ 385,023 Adjusted Return on Average Tangible Common Equity 8.95% 7.64% 7.80% 8.34% 7.82% As of and for the quarter ended, December 31, 2023 March 31, 2024 June 30, 2024 September 30, 2024 December 31, 2024 Pre-Provision Net Revenue: Noninterest Income $ 1,409 $ 1,550 $ 1,763 $ 1,522 $ 2,533 Less: (Gain) Loss on Sales of Securities 2 7 (93) (320) 2 8 - Total Operating Noninterest Income 1,436 1,457 1,443 1,550 2,533 Plus: Net Interest Income 25,314 24,631 24,996 25,599 26,967 Net Operating Revenue $ 26,750 $ 26,088 $ 26,439 $ 27,149 $ 29,500 Noninterest Expense 15,740 15,189 15,539 15,760 $ 16,812 Total Operating Noninterest Expense $ 15,740 $ 15,189 $ 15,539 $ 15,760 $ 16,812 Pre-provision Net Revenue $ 11,010 $ 10,899 $ 10,900 $ 11,389 $ 12,688 Plus: Non-Operating Revenue Adjustments (27) 9 3 320 (28) - Less: Provision (Recovery of) for Credit Losses (250) 750 600 - 2,175 Less: Provision for Income Taxes 2,360 2,411 2,505 2,686 2,309 Net Income $ 8,873 $ 7,831 $ 8,115 $ 8,675 $ 8,204 Average Assets $ 4,567,446 $ 4,592,838 $ 4,646,517 $ 4,709,804 $ 4,788,036 Pre-Provision Net Renveue Return on Average Assets 0.96% 0.95% 0.94% 0.96% 1.05% Adjusted Pre-Provision Net Revenue: Net Operating Revenue $ 26,750 $ 26,088 $ 26,439 $ 27,149 $ 29,500 Noninterest Expense $ 15,740 $ 15,189 $ 15,539 $ 15,760 $ 16,812 Less: Merger-related Expenses - - - (224) (488) Adjusted Total Operating Noninterest Expense $ 15,740 $ 15,189 $ 15,539 $ 15,536 $ 16,324 Adjusted Pre-Provision Net Revenue $ 11,010 $ 10,899 $ 10,900 $ 11,613 $ 13,176 Adjusted Pre-Provision Net Revenue Return on Average Assets 0.96% 0.95% 0.94% 0.98% 1.09% As of and for the quarter ended, |
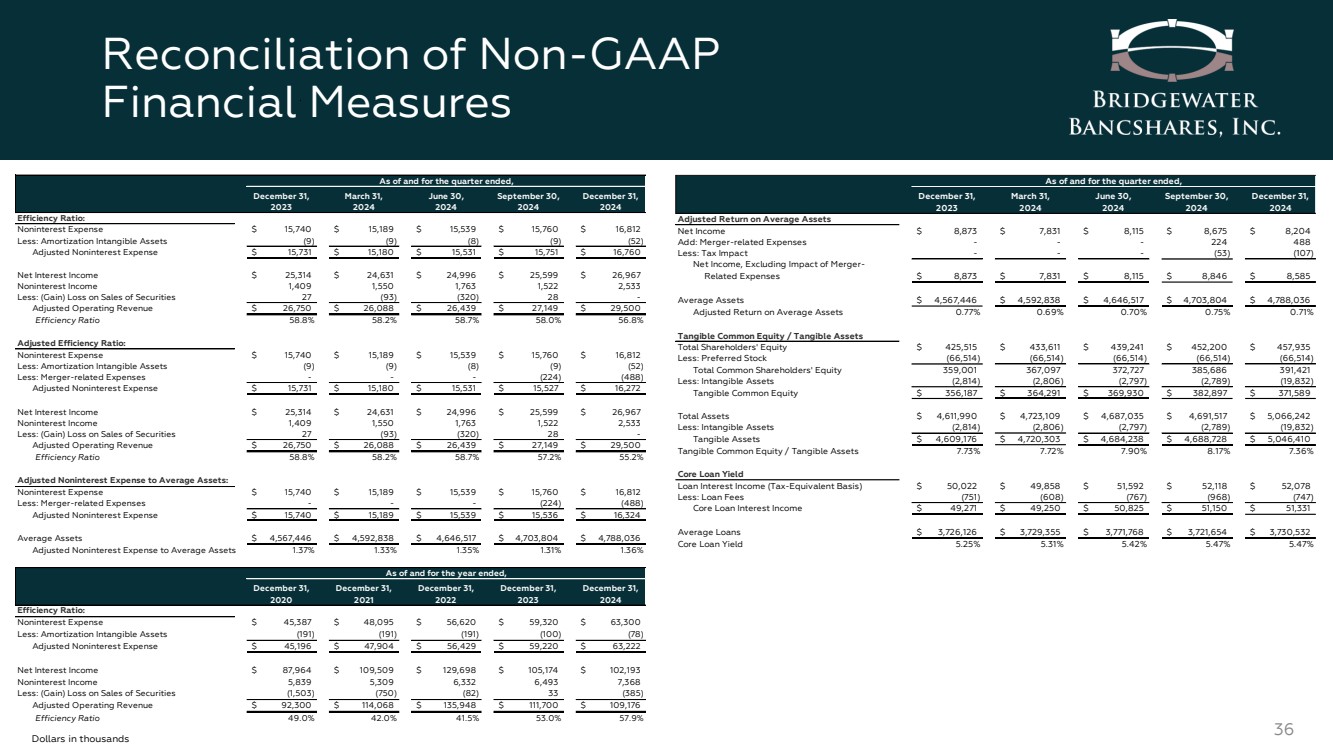
| Reconciliation of Non-GAAP Financial Measures 36 Dollars in thousands December 31, 2023 March 31, 2024 June 30, 2024 September 30, 2024 December 31, 2024 Adjusted Return on Average Assets Net Income $ 8,873 $ 7,831 $ 8,115 $ 8,675 $ 8,204 Add: Merger-related Expenses - - - 224 488 Less: Tax Impact - - - (53) (107) Net Income, Excluding Impact of Merger- Related Expenses $ 8,873 $ 7,831 $ 8,115 $ 8,846 $ 8,585 Average Assets $ 4,567,446 $ 4,592,838 $ 4,646,517 $ 4,703,804 $ 4,788,036 Adjusted Return on Average Assets 0.77% 0.69% 0.70% 0.75% 0.71% Tangible Common Equity / Tangible Assets Total Shareholders' Equity $ 425,515 $ 433,611 $ 439,241 $ 452,200 $ 457,935 Less: Preferred Stock (66,514) (66,514) (66,514) (66,514) (66,514) Total Common Shareholders' Equity 359,001 367,097 372,727 385,686 391,421 Less: Intangible Assets (2,814) (2,806) (2,797) (2,789) (19,832) Tangible Common Equity $ 356,187 $ 364,291 $ 369,930 $ 382,897 $ 371,589 Total Assets $ 4,611,990 $ 4,723,109 $ 4,687,035 $ 4,691,517 $ 5,066,242 Less: Intangible Assets (2,814) (2,806) (2,797) (2,789) (19,832) Tangible Assets $ 4,609,176 $ 4,720,303 $ 4,684,238 $ 4,688,728 $ 5,046,410 Tangible Common Equity / Tangible Assets 7.73% 7.72% 7.90% 8.17% 7.36% Core Loan Yield Loan Interest Income (Tax-Equivalent Basis) $ 50,022 $ 49,858 $ 51,592 $ 52,118 $ 52,078 Less: Loan Fees (751) (608) (767) (968) (747) Core Loan Interest Income $ 49,271 $ 49,250 $ 50,825 $ 51,150 $ 51,331 Average Loans $ 3,726,126 $ 3,729,355 $ 3,771,768 $ 3,721,654 $ 3,730,532 Core Loan Yield 5.25% 5.31% 5.42% 5.47% 5.47% As of and for the quarter ended, December 31, 2023 March 31, 2024 June 30, 2024 September 30, 2024 December 31, 2024 Efficiency Ratio: Noninterest Expense $ 15,740 $ 15,189 $ 15,539 $ 15,760 $ 16,812 Less: Amortization Intangible Assets (9) (9) (8) (9) (52) Adjusted Noninterest Expense $ 15,731 $ 15,180 $ 15,531 $ 15,751 $ 16,760 Net Interest Income $ 25,314 $ 24,631 $ 24,996 $ 25,599 $ 26,967 Noninterest Income 1,409 1,550 1,763 1,522 2,533 Less: (Gain) Loss on Sales of Securities 2 7 (93) (320) 2 8 - Adjusted Operating Revenue $ 26,750 $ 26,088 $ 26,439 $ 27,149 $ 29,500 Efficiency Ratio 58.8% 58.2% 58.7% 58.0% 56.8% Adjusted Efficiency Ratio: Noninterest Expense $ 15,740 $ 15,189 $ 15,539 $ 15,760 $ 16,812 Less: Amortization Intangible Assets (9) (9) (8) (9) (52) Less: Merger-related Expenses - - - (224) (488) Adjusted Noninterest Expense $ 15,731 $ 15,180 $ 15,531 $ 15,527 $ 16,272 Net Interest Income $ 25,314 $ 24,631 $ 24,996 $ 25,599 $ 26,967 Noninterest Income 1,409 1,550 1,763 1,522 2,533 Less: (Gain) Loss on Sales of Securities 2 7 (93) (320) 2 8 - Adjusted Operating Revenue $ 26,750 $ 26,088 $ 26,439 $ 27,149 $ 29,500 Efficiency Ratio 58.8% 58.2% 58.7% 57.2% 55.2% Adjusted Noninterest Expense to Average Assets: Noninterest Expense $ 15,740 $ 15,189 $ 15,539 $ 15,760 $ 16,812 Less: Merger-related Expenses - - - (224) (488) Adjusted Noninterest Expense $ 15,740 $ 15,189 $ 15,539 $ 15,536 $ 16,324 Average Assets $ 4,567,446 $ 4,592,838 $ 4,646,517 $ 4,703,804 $ 4,788,036 Adjusted Noninterest Expense to Average Assets 1.37% 1.33% 1.35% 1.31% 1.36% December 31, 2020 December 31, 2021 December 31, 2022 December 31, 2023 December 31, 2024 Efficiency Ratio: Noninterest Expense $ 45,387 $ 48,095 $ 56,620 $ 59,320 $ 63,300 Less: Amortization Intangible Assets (191) (191) (191) (100) (78) Adjusted Noninterest Expense $ 45,196 $ 47,904 $ 56,429 $ 59,220 $ 63,222 Net Interest Income $ 87,964 $ 109,509 $ 129,698 $ 105,174 $ 102,193 Noninterest Income 5,839 5,309 6,332 6,493 7,368 Less: (Gain) Loss on Sales of Securities (1,503) (750) (82) 3 3 (385) Adjusted Operating Revenue $ 92,300 $ 114,068 $ 135,948 $ 111,700 $ 109,176 Efficiency Ratio 49.0% 42.0% 41.5% 53.0% 57.9% As of and for the quarter ended, As of and for the year ended, |
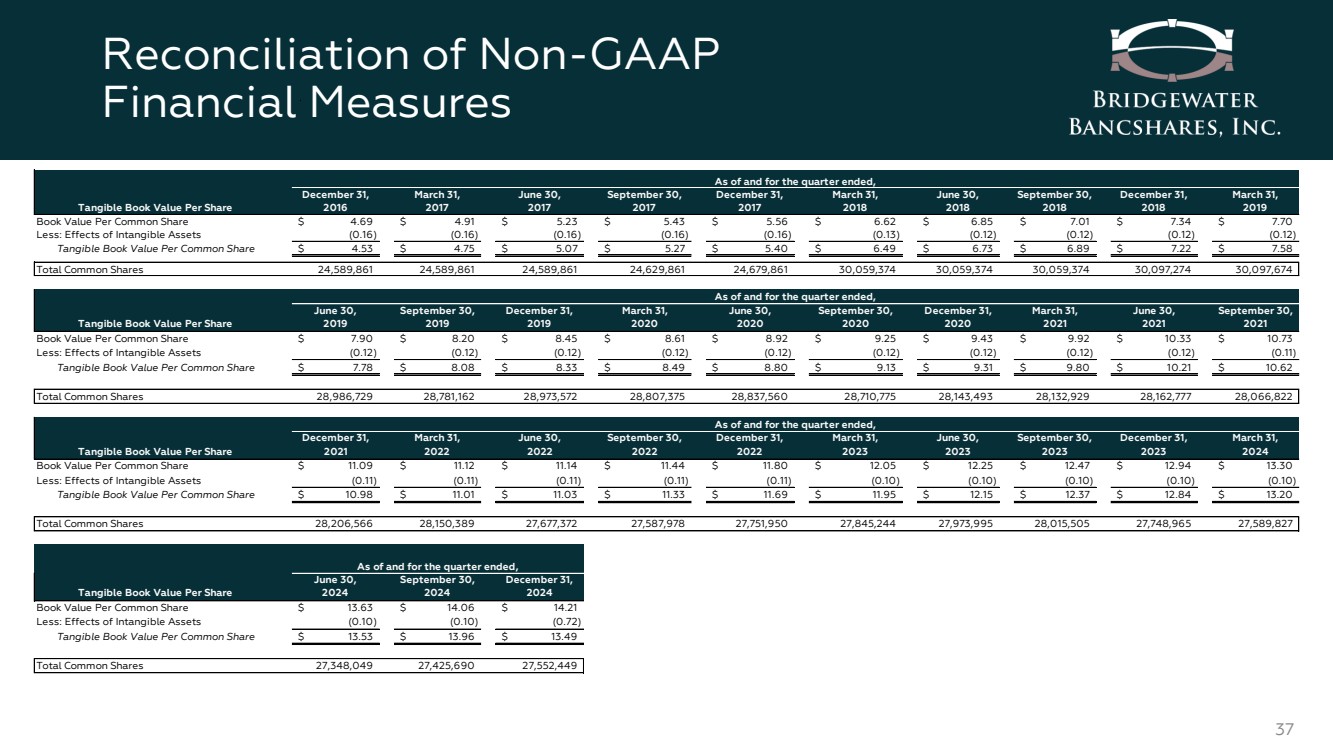
| Reconciliation of Non-GAAP Financial Measures 37 Tangible Book Value Per Share December 31, 2016 March 31, 2017 June 30, 2017 September 30, 2017 December 31, 2017 March 31, 2018 June 30, 2018 September 30, 2018 December 31, 2018 March 31, 2019 Book Value Per Common Share $ 4.69 $ 4.91 $ 5.23 $ 5.43 $ 5.56 $ 6.62 $ 6.85 $ 7.01 $ 7.34 $ 7.70 Less: Effects of Intangible Assets (0.16) (0.16) (0.16) (0.16) (0.16) (0.13) (0.12) (0.12) (0.12) (0.12) Tangible Book Value Per Common Share $ 4.53 $ 4.75 $ 5.07 $ 5.27 $ 5.40 $ 6.49 $ 6.73 $ 6.89 $ 7.22 $ 7.58 Total Common Shares 24,589,861 24,589,861 24,589,861 24,629,861 24,679,861 30,059,374 30,059,374 30,059,374 30,097,274 30,097,674 Tangible Book Value Per Share June 30, 2019 September 30, 2019 December 31, 2019 March 31, 2020 June 30, 2020 September 30, 2020 December 31, 2020 March 31, 2021 June 30, 2021 September 30, 2021 Book Value Per Common Share $ 7.90 $ 8.20 $ 8.45 $ 8.61 $ 8.92 $ 9.25 $ 9.43 $ 9.92 $ 10.33 $ 10.73 Less: Effects of Intangible Assets (0.12) (0.12) (0.12) (0.12) (0.12) (0.12) (0.12) (0.12) (0.12) (0.11) Tangible Book Value Per Common Share $ 7.78 $ 8.08 $ 8.33 $ 8.49 $ 8.80 $ 9.13 $ 9.31 $ 9.80 $ 10.21 $ 10.62 Total Common Shares 28,986,729 28,781,162 28,973,572 28,807,375 28,837,560 28,710,775 28,143,493 28,132,929 28,162,777 28,066,822 Tangible Book Value Per Share December 31, 2021 March 31, 2022 June 30, 2022 September 30, 2022 December 31, 2022 March 31, 2023 June 30, 2023 September 30, 2023 December 31, 2023 March 31, 2024 Book Value Per Common Share $ 11.09 $ 11.12 $ 11.14 $ 11.44 $ 11.80 $ 12.05 $ 12.25 $ 12.47 $ 12.94 $ 13.30 Less: Effects of Intangible Assets (0.11) (0.11) (0.11) (0.11) (0.11) (0.10) (0.10) (0.10) (0.10) (0.10) Tangible Book Value Per Common Share $ 10.98 $ 11.01 $ 11.03 $ 11.33 $ 11.69 $ 11.95 $ 12.15 $ 12.37 $ 12.84 $ 13.20 Total Common Shares 28,206,566 28,150,389 27,677,372 27,587,978 27,751,950 27,845,244 27,973,995 28,015,505 27,748,965 27,589,827 Tangible Book Value Per Share June 30, 2024 September 30, 2024 December 31, 2024 Book Value Per Common Share $ 13.63 $ 14.06 $ 14.21 Less: Effects of Intangible Assets (0.10) (0.10) (0.72) Tangible Book Value Per Common Share $ 13.53 $ 13.96 $ 13.49 Total Common Shares 27,348,049 27,425,690 27,552,449 As of and for the quarter ended, As of and for the quarter ended, As of and for the quarter ended, As of and for the quarter ended, |