Exhibit 99.2
MANAGEMENT’S DISCUSSION AND ANALYSIS
For the three months ended March 31, 2021
As of May 7, 2021
Fortuna Silver Mines Inc.
Management’s Discussion and Analysis
For the three months ended March 31, 2021
This Management’s Discussion and Analysis (“MD&A”) of the financial position and results of operations for Fortuna Silver Mines Inc. (the “Company” or “Fortuna”) (TSX: FVI, NYSE: FSM, Frankfurt: F4S.F) should be read in conjunction with the audited consolidated financial statements of the Company for the year ended December 31, 2020 and the unaudited condensed consolidated interim financial statements of the Company for the three months ended March 31, 2021 and the related notes thereto, which have been prepared in accordance with International Financial Reporting Standards (“IFRS”) as issued by the International Accounting Standards Board. For further information on the Company, reference should be made to its public filings on SEDAR at www.sedar.com and on EDGAR at www.sec.gov/edgar.
This MD&A is prepared by management and approved by the Board of Directors as of May 7, 2021. This discussion covers the three months ended March 31, 2021 (“Q1 2021” or the “Quarter”) and the subsequent period up to the date of issuance of the MD&A. All dollar amounts are in United States (“US”) dollars, except where otherwise noted. References to C$ are Canadian dollars.
This MD&A contains forward-looking statements. Readers are cautioned as to the risks and uncertainties related to the forward-looking statements, the risks and uncertainties associated with investing in the Company’s securities and the technical and scientific information under National Instrument 43-101 (“NI 43-101”) concerning the Company’s material properties, including information about mineral reserves and resources. All forward-looking statements are qualified by cautionary notes in this MD&A as well as risks and uncertainties discussed in the Company’s Annual Information Form for fiscal 2020 dated March 29, 2021 and its Management Information Circular dated April 6, 2020, which are filed on SEDAR and EDGAR.
Throughout this MD&A, cash cost per payable ounce of silver equivalent; cash cost per tonne of processed ore; total production cash cost per tonne; all-in sustaining cash cost per payable ounce sold; free cash flow and free cash flow from ongoing operations; adjusted net income; and adjusted EBITDA are non-IFRS financial measures with no standard meaning under IFRS. Non-IFRS measures are further discussed in the section Non-IFRS Measures on page 29 of this MD&A.
| Fortuna Silver Mines Inc. | | (in US Dollars, tabular amounts in millions, except where noted) |
| Management’s Discussion and Analysis | | |
| For the three months ended March 31, 2021 | | |
CONTENTS
| Business Overview | 2 |
| Highlights | 3 |
| Mineral Reserves and Resources | 5 |
| Financial Results | 7 |
| Results of Operations | 10 |
| Quarterly Information | 13 |
| Liquidity and Capital Resources | 15 |
| Financial Instruments | 16 |
| Share Position & Outstanding Options & Equity Based Share Units | 16 |
| Related Party Transactions | 17 |
| Amendments to Accounting Standards That Have Been Issued | 18 |
| Risks and Uncertainties | 18 |
| Critical Accounting Estimates and Judgements | 25 |
| Controls and Procedures | 29 |
| Non-IFRS Financial Measures | 29 |
| Cautionary Statement on Forward-Looking Statements | 36 |
| Cautionary Note to United States Investors Concerning Estimates of Reserves and Resources | 39 |
| Fortuna Silver Mines Inc. | | (in US Dollars, tabular amounts in millions, except where noted) |
| Management’s Discussion and Analysis | | |
| For the three months ended March 31, 2021 | | |
BUSINESS OVERVIEW
Fortuna is a growth focused Canadian precious metals mining company with operations in Peru, Mexico, and Argentina. The Company produces silver and gold and generates shared value over the long-term through efficient production, environmental protection, and social responsibility.
The Company operates the underground Caylloma silver, lead, and zinc mine (“Caylloma”) in southern Peru, the underground San Jose silver and gold mine (“San Jose”) in southern Mexico, and is completing the ramp up in production of the open pit Lindero gold mine (“Lindero”) in northern Argentina.
Fortuna is a publicly traded company incorporated and domiciled in British Columbia, Canada. Its common shares are listed on the New York Stock Exchange under the trading symbol FSM, on the Toronto Stock Exchange under the trading symbol FVI, and on the Frankfurt Stock Exchange under the trading symbol F4S.F.
CORPORATE DEVELOPMENTS
On April 26, 2021, the Company entered into an arrangement agreement with Roxgold Inc., (“Roxgold”) under which the Company will acquire all of the issued and outstanding securities of Roxgold (the “Proposed Transaction”) (refer Fortuna news release dated April 26, 2021). This Proposed Transaction is expected to create a low-cost intermediate global precious metals producer
Under the terms of the Proposed Transaction, Roxgold shareholders will receive 0.283 common shares of Fortuna and C$0.001 for each Roxgold common share held. Upon completion of the Proposed Transaction, existing Fortuna and Roxgold shareholders will own approximately 64.3% and 35.7% of the combined company, respectively. As at April 23, 2021 the implied fully diluted in the-money equity value of the Transaction was estimated at approximately C$1.1 billion.
The Proposed Transaction will be implemented by way of a court-approved plan of arrangement pursuant to the British Columbia Business Corporations Act and is expected to close by late June or early July 2021. The terms of the Proposed Transaction include customary provisions, including reciprocal non-solicitation of alternative transactions, a right to match superior proposals, a C$40 million reciprocal termination fee payable under certain circumstances, and in certain other customary circumstances a reciprocal expense reimbursement of up to $3 million. The closing of the Proposed Transaction is subject to approval by the shareholders of both companies, court approval, regulatory approvals and certain other customary closing conditions.
Upon completion of the Proposed Transaction, the combined company is expected to be a low-cost intermediate global precious metals producer, the combined company will feature proven and experienced mining and business leaders at the executive team level, along with diverse, high-performing teams at the combined company's regional and operating sites. Continuing Executives at Roxgold are Paul Criddle, Chief Operating Officer – Africa; Paul Weedon, Vice President Exploration – Africa; and Eric Gratton, GM External Relations – Africa.
The board of directors of both companies have unanimously approved the transaction. Full details of the Proposed Transaction will be included in the respective management information circulars of Fortuna and Roxgold, which will be mailed to shareholders in connection with the respective shareholder meetings.
| Fortuna Silver Mines Inc. | | (in US Dollars, tabular amounts in millions, except where noted) |
| Management’s Discussion and Analysis | | |
| For the three months ended March 31, 2021 | | |
HIGHLIGHTS FOR THE THREE MONTHS ENDED MARCH 31, 2021
Financial
| · | Sales of $117.8 million, an increase of 148% from the $47.5 million reported in the same period in 2020 (“Q1 2020”), due to higher realized prices and sales volumes for all metals at all mines, most notably sales from the Lindero Mine of $36.9 million |
| · | Mine operating income of $51.3 million, an increase of $43.8 million from the $7.5 million reported in Q1 2020 |
| · | Operating income of $40.4 million, an increase of $38.6 million from the $1.8 million reported in Q1 2020 |
| · | Net income of $26.4 million or $0.14 per share, an increase of $30.9 million and $0.17 per share, from the $4.5 million net loss or $0.03 loss per share reported in Q1 2020 |
| · | Adjusted net income1 of $27.5 million compared to $2.2 million net loss in Q1 2020 |
| · | Adjusted EBITDA1 of $60.8 million compared to $15.9 million reported in Q1 2020 |
| · | Free cash flow from ongoing operations1 of $17.4 million compared to $14.2 million reported in Q1 2020, the current quarter was impacted by a $16.2 million increase in trade receivables due to timing of collections |
| · | As at March 31, 2021, the Company had cash and cash equivalents of $145.7 million an increase of $13.8 million from December 31, 2020 |
Operating
| · | Silver production of 1,913,755 ounces, an increase of 5% over Q1 2020 |
| · | Gold production of 34,555 ounces, an increase of 242% over Q1 2020 |
| · | Lead production of 8,181,355 pounds, an increase of 6% over Q1 2020 |
| · | Zinc production of 11,968,896 pounds, an increase of 1% over Q1 2020 |
COVID-19
| · | The Company is managing the necessary country-by-country restrictions related to the prevention of the spread of COVID-19 in order to assist in the protection of those most vulnerable. The Company experienced an increase in COVID-19 cases in Peru which has affected operations at the Caylloma Mine and resulted in a reduced workforce and quarantine periods for those affected. Each of the Company’s mine sites is, at the date of this MD&A, operating with a reduced workforce. Worker availability continues to be a challenge but is currently being mitigated by increasing the use of temporary workers and contractors. Health protocols are in place at each mine site for control, isolation and quarantine, as necessary, and these continue to be reviewed and adjusted accordingly based on the circumstances at each location. The Company’s focus is the health and safety of the workforce and on measures to prevent and manage the transmission of COVID-19 amongst the workforce and the communities in which the Company operates. |
| · | The Company’s operations and financial performance are dependent on it being able to operate at each of its mines and projects. Given the fast-changing situation with respect to the COVID-19 pandemic, including further waves of the virus and the emergence of variant forms of the virus, it is difficult to predict the exact nature and extent of the impact the pandemic may have on the Company’s operations and its business. At this time there is no certainty that the governments of countries in which the Company operates will not mandate another round of measures, including the suspension of business activities, which could include mining. Outbreaks of COVID-19 in areas where the Company operates, or further restrictive directives of government and public health authorities, could cause delays or disruptions in our supply chain, restrictions which may impact access to our mine sites, restrictions that may affect our ability to transport and ship gold doré and or metal concentrates, restrict access to processing and refinery facilities, cause disruptions to our supply chain, or impediments to market logistics. Further suspensions of operations or curtailment of activities at the Company’s mines remain a significant risk to our business and operations. |
1 Refer to Non-IFRS Financial Measures.
| Fortuna Silver Mines Inc. | | (in US Dollars, tabular amounts in millions, except where noted) |
| Management’s Discussion and Analysis | | |
| For the three months ended March 31, 2021 | | |
Operating and Financial Highlights
| Three months ended March 31 | | 2021 | | | 2020 | | | % Change | |
| Operating Highlights | | | | | | | | | | | | |
| Silver | | | | | | | | | | | | |
| Metal produced (oz) | | | 1,913,755 | | | | 1,819,312 | | | | 5 | % |
| Metal sold (oz) | | | 1,903,868 | | | | 1,806,032 | | | | 5 | % |
| Realized price ($/oz) | | | 26.19 | | | | 16.27 | | | | 61 | % |
| Gold | | | | | | | | | | | | |
| Metal produced (oz) | | | 34,555 | | | | 10,101 | | | | 242 | % |
| Metal sold (oz) | | | 33,257 | | | | 10,206 | | | | 226 | % |
| Realized price ($/oz) | | | 1,764 | | | | 1,571 | | | | 12 | % |
| Lead | | | | | | | | | | | | |
| Metal produced (000's lbs) | | | 8,181 | | | | 7,723 | | | | 6 | % |
| Metal sold (000's lbs) | | | 7,998 | | | | 6,616 | | | | 21 | % |
| Zinc | | | | | | | | | | | | |
| Metal produced (000's lbs) | | | 11,969 | | | | 11,821 | | | | 1 | % |
| Metal sold (000's lbs) | | | 12,267 | | | | 10,512 | | | | 17 | % |
| Financial Highlights | | | | | | | | | | | | |
| Sales | | | 117.8 | | | | 47.5 | | | | 148 | % |
| Mine operating income | | | 51.3 | | | | 7.5 | | | | 584 | % |
| Operating income | | | 40.4 | | | | 1.8 | | | | 2,144 | % |
| Net income (loss) | | | 26.4 | | | | (4.5 | ) | | | - | |
| Earnings (loss) per share - basic | | | 0.14 | | | | (0.03 | ) | | | - | |
| | | | | | | | | | | | | |
| Adjusted net income (loss)1 | | | 27.5 | | | | (2.2 | ) | | | - | |
| Adjusted EBITDA1 | | | 60.8 | | | | 15.9 | | | | 282 | % |
| Net cash provided by operating activities | | | 21.1 | | | | 3.7 | | | | 470 | % |
| Free cash flow from ongoing operations1 | | | 17.4 | | | | 14.2 | | | | 23 | % |
| Capex | | | | | | | | | | | | |
| Sustaining | | | 7.9 | | | | 3.5 | | | | 126 | % |
| Non-sustaining | | | 0.3 | | | | 0.1 | | | | 200 | % |
| Lindero | | | 2.6 | | | | 21.4 | | | | (88 | )% |
| Brownfields | | | 2.5 | | | | 1.6 | | | | 56 | % |
| As at | | | Mar 31, 2021 | | | | Dec 31, 2020 | | | | % Change | |
| Cash and cash equivalents | | | 145.7 | | | | 131.9 | | | | 10 | % |
| Total assets | | | 1,069.1 | | | | 1,055.3 | | | | 1 | % |
| Debt | | | 159.0 | | | | 158.6 | | | | 0 | % |
| Shareholders' equity | | | 752.9 | | | | 725.8 | | | | 4 | % |
| | | | | | | | | | | | | |
| 1 Refer to Non-IFRS financial measures. | | | | | | | | | | | | |
| Fortuna Silver Mines Inc. | | (in US Dollars, tabular amounts in millions, except where noted) |
| Management’s Discussion and Analysis | | |
| For the three months ended March 31, 2021 | | |
MINERAL RESERVES AND RESOURCES
During the first quarter of 2021, the Company announced updated Mineral Reserve and Mineral Resource estimates as of December 31, 2020.
Highlights of Mineral Reserve and Mineral Resource Update
| · | Combined Proven and Probable Mineral Reserves for the Caylloma and San Jose mines are reported at 5.3 Mt containing 28.8 Moz silver and 170 koz gold, representing a year-over-year decrease of 23% on both contained silver and gold ounces. |
| · | Combined Inferred Mineral Resources for the Caylloma and San Jose mines are reported at 7.2 Mt containing an estimated 28.5 Moz silver and 152 koz gold, reflecting a year-over-year decrease of 8% and 10% in contained silver and gold ounces, respectively. |
| · | Lindero Proven and Probable Mineral Reserves are reported at 82.7 Mt containing 1.6 Moz of gold, reflecting a 4% decrease in contained gold ounces since March 31, 2019. Inferred Resources are reported at 30.4 Mt containing 412 koz of gold, reflecting an increase of 289% in contained gold ounces. |
| Mineral Reserves - Proven and Probable | Contained Metal |
| | Property | Classification | Tonnes (000's) | Ag
(g/t) | Au
(g/t) | Pb
| Zn
(%) | Ag
(Moz) | Au
(Koz) |
| Silver | Caylloma, | Proven | 131 | 150 | 0.56 | 2.27 | 2.28 | 0.6 | 2 |
| Mines | Peru | Probable | 1,532 | 105 | 0.26 | 2.67 | 3.65 | 5.2 | 13 |
| | | Proven + Probable | 1,662 | 108 | 0.28 | 2.64 | 3.54 | 5.8 | 15 |
| | San Jose, | Proven | 61 | 165 | 1.10 | N/A | N/A | 0.3 | 2 |
| | Mexico | Probable | 3,528 | 200 | 1.35 | N/A | N/A | 22.7 | 153 |
| | | Proven + Probable | 3,589 | 200 | 1.34 | N/A | N/A | 23.0 | 155 |
| | Total | Proven + Probable | 5,251 | 171 | 1.01 | N/A | N/A | 28.8 | 170 |
| Gold | Lindero, | Proven | 26,718 | N/A | 0.72 | N/A | N/A | - | 622 |
| Mine | Argentina | Probable | 55,940 | N/A | 0.57 | N/A | N/A | - | 1,027 |
| | | Proven + Probable | 82,658 | N/A | 0.62 | N/A | N/A | - | 1,649 |
| Total | | Proven + Probable | | | | | | 28.8 | 1,819 |
| Mineral Resources - Measured and Indicated | Contained Metal |
| | Property | Classification | Tonnes (000's) | Ag
(g/t) | Au
(g/t) | Pb
| Zn
(%) | Ag
(Moz) | Au
(Koz) |
| Silver | Caylloma, | Measured | 529 | 106 | 0.37 | 1.92 | 3.37 | 1.8 | 6 |
| Mines | Peru | Indicated | 1,611 | 96 | 0.26 | 1.74 | 3.36 | 5.0 | 14 |
| | | Measured + Indicated | 2,140 | 99 | 0.29 | 1.78 | 3.36 | 6.8 | 20 |
| | San Jose, | Measured | 42 | 120 | 0.91 | N/A | N/A | 0.2 | 1 |
| | Mexico | Indicated | 913 | 97 | 0.68 | N/A | N/A | 3 | 20 |
| | | Measured + Indicated | 955 | 98 | 0.69 | N/A | N/A | 3.0 | 21 |
| | Total | Measured + Indicated | 3,095 | 98 | 0.41 | N/A | N/A | 9.8 | 41 |
| Gold | Lindero, | Measured | 2,520 | N/A | 0.55 | N/A | N/A | - | 45 |
| Mine | Argentina | Indicated | 33,070 | N/A | 0.46 | N/A | N/A | - | 487 |
| | | Measured + Indicated | 35,590 | N/A | 0.46 | N/A | N/A | - | 532 |
| Total | | Measured + Indicated | | | | | | 9.8 | 573 |
| Fortuna Silver Mines Inc. | (in US Dollars, tabular amounts in millions, except where noted) |
| Management’s Discussion and Analysis | |
| For the three months ended March 31, 2021 | |
| Mineral Resources - Inferred | Contained Metal |
| | Property | Classification | Tonnes (000's) | Ag
(g/t) | Au
(g/t) | Pb
| Zn
(%) | Ag
(Moz) | Au
(Koz) |
| Silver Mines | Caylloma, Peru | Inferred | 3,751 | 122 | 0.40 | 2.70 | 4.08 | 14.7 | 49 |
| | San Jose, Mexico | Inferred | 3,452 | 124 | 0.93 | N/A | N/A | 13.8 | 104 |
| | Total | Inferred | 7,203 | 123 | 0.66 | | | 28.5 | 152 |
| Gold Mine | Lindero, Argentina | Inferred | 30,400 | N/A | 0.42 | N/A | N/A | - | 412 |
| Total | | Inferred | | | | | | 28.5 | 564 |
| 1. Mineral Reserves and Mineral Resources are as defined by the 2014 CIM Definition Standards for Mineral Resources and Mineral Reserves |
| |
| 2. Mineral Resources are exclusive of Mineral Reserves |
| |
| 3. Mineral Resources that are not Mineral Reserves do not have demonstrated economic viability |
| |
| 4. Factors that could materially affect the reported Mineral Resources or Mineral Reserves include; changes in metal price and exchange rate assumptions; changes in local interpretations of mineralization; changes to assumed metallurgical recoveries, mining dilution and recovery; and assumptions as to the continued ability to access the site, retain mineral and surface rights titles, maintain environmental and other regulatory permits, and maintain the social license to operate |
| |
| 5. Mineral Resources and Reserves are estimated as of June 30, 2020 and reported as of December 31, 2020 taking into account production-related depletion for the period through December 31, 2020 |
| |
| 6. Mineral Reserves for the San Jose Mine are based on underground mining within optimized stope designs using an estimated NSR break-even cut-off grade of US$69.47/t, equivalent to 120 g/t Ag Eq based on assumed metal prices of US$21/oz Ag and US$1,600/oz Au; estimated metallurgical recovery rates of 91% for Ag and 90% for Au and mining costs of US$34.92/t; processing costs of US$17.10/t; and other costs including distribution, management, community support and general service costs of US$17.44/t based on actual operating costs. Mining recovery is estimated to average 93% and mining dilution 11%. Mineral Resources are reported at a 100 g/t Ag Eq cut-off grade based on the same parameters used for Mineral Reserves and a 15% upside in metal prices. Proven + Probable Reserves include 1.9 Mt containing 14 Moz of silver and 83 koz of gold reported at a 123 g/t Ag Eq cut-off grade and Inferred Resources totaling 2.5 Mt containing 9.7 Moz of silver and 70 koz of gold reported at a 100 g/t Ag Eq cut-off grade located in the Taviche Oeste concession and subject to a 2.5% royalty |
| |
| 7. Mineral Reserves for the Caylloma Mine are reported above NSR breakeven cut-off values based on underground mining methods including; mechanized (breasting) at US$ 83.37/t; mechanized (enhanced) at US$ 81.66/t; semi-mechanized at US$ 90.19/t; and a conventional method at US$173.74/t; using assumed metal prices of US$21/oz Ag, US$1,600/oz Au, US$2,000/t Pb and US$2,270/t Zn; metallurgical recovery rates of 83% for Ag, 42% for Au, 91% for Pb and 90% for Zn with the exception of the Ramal Piso Carolina vein that uses a metallurgical recovery rate of 75% for Au. Mining, processing and administrative costs used to determine NSR cut-off values were estimated based on actual operating costs incurred from July 2019 through June 2020. Mining recovery is estimated to average 95% with average mining dilution ranging from 13% to 32% depending on the mining methodology. Mineral Resources are reported at an NSR cut-off grade of US$65/t for veins classified as wide (Animas, Animas NE, Nancy, San Cristobal) and US$135/t for veins classified as narrow (all other veins) based on the same parameters used for Mineral Reserves, and a 15% upside in metal prices |
| |
| 8. Mineral Reserves for Lindero are reported based on open pit mining within a designed pit shell based on variable gold cut-off grades and gold recoveries by metallurgical type. Met type 1 cut-off 0.27 g/t Au, recovery 75.4%; Met type 2 cut-off 0.26 g/t Au, recovery 78.2%; Met type 3 cut-off 0.26 g/t Au, recovery 78.5%; and Met type 4 cut-off 0.27 g/t Au, recovery 68.5%. Mining recovery is estimated to average 100% and mining dilution 0%. The cut-off grades and pit designs are considered appropriate for long term gold prices of US$1,600/oz, estimated mining costs of US$1.11 per tonne of material, total processing and process G&A costs of US$6.21 per tonne of ore, and refinery costs net of pay factor of US$6.50 per ounce gold. Lindero Mineral Reserves are restricted to a maximum heap leach capacity of 84.2 Mt. Reported Proven Reserves include 2.6 Mt averaging 0.55 g/t Au of stockpiled material. Lindero Mineral Resources are reported within the same conceptual pit shell above a 0.2 g/t Au cut-off grade based on the same parameters used for Mineral Reserves and a 15% upside in metal prices |
| |
| 9. Eric Chapman, P. Geo. (APEGBC #36328) is the Qualified Person for Mineral Resources and Amri Sinuhaji (APEGBC #48305) is the Qualified Person for Mineral Reserves, both being employees of Fortuna Silver Mines Inc. |
| |
| 10. N/A = Not Applicable |
| |
| 11. Totals may not add due to rounding |
| Fortuna Silver Mines Inc. | (in US Dollars, tabular amounts in millions, except where noted) |
| Management’s Discussion and Analysis | |
| For the three months ended March 31, 2021 | |
FINANCIAL RESULTS
Sales
| Three months ended March 31 | | 2021 | | | 2020 | | | % Change | |
| Provisional sales | | | | | | | | | | | | |
| Lindero | | | 36.9 | | | | - | | | | 100 | % |
| San Jose | | | 58.0 | | | | 38.7 | | | | 50 | % |
| Caylloma | | | 25.4 | | | | 13.2 | | | | 92 | % |
| Adjustments1 | | | (2.5 | ) | | | (4.4 | ) | | | (43 | )% |
| Total Sales | | | 117.8 | | | | 47.5 | | | | 148 | % |
| Silver | | | | | | | | | | | | |
| Metal produced (oz) | | | 1,913,755 | | | | 1,819,312 | | | | 5 | % |
| Provisional sales (oz) | | | 1,903,868 | | | | 1,806,032 | | | | 5 | % |
| Provisional sales | | | 46.4 | | | | 27.0 | | | | 72 | % |
| Realized price ($/oz)2 | | | 26.19 | | | | 16.27 | | | | 61 | % |
| Net realized price ($/oz)3 | | | 24.37 | | | | 14.94 | | | | 63 | % |
| Gold | | | | | | | | | | | | |
| Metal produced (oz) | | | 34,555 | | | | 10,101 | | | | 242 | % |
| Provisional sales (oz) | | | 33,257 | | | | 10,206 | | | | 226 | % |
| Provisional sales | | | 57.1 | | | | 15.3 | | | | 273 | % |
| Realized price ($/oz)2 | | | 1,764 | | | | 1,571 | | | | 12 | % |
| Net realized price ($/oz)3 | | | 1,718 | | | | 1,501 | | | | 14 | % |
| Lead | | | | | | | | | | | | |
| Metal produced (000's lbs) | | | 8,181 | | | | 7,723 | | | | 6 | % |
| Provisional sales (000's lbs) | | | 7,998 | | | | 6,616 | | | | 21 | % |
| Provisional sales | | | 6.3 | | | | 4.4 | | | | 43 | % |
| Realized price ($/lb)2 | | | 0.92 | | | | 0.85 | | | | 8 | % |
| Net realized price ($/lb)3 | | | 0.76 | | | | 0.67 | | | | 14 | % |
| Zinc | | | | | | | | | | | | |
| Metal produced (000's lbs) | | | 11,969 | | | | 11,821 | | | | 1 | % |
| Provisional sales (000's lbs) | | | 12,267 | | | | 10,512 | | | | 17 | % |
| Provisional sales | | | 10.5 | | | | 5.2 | | | | 102 | % |
| Realized price ($/lb)2 | | | 1.25 | | | | 0.98 | | | | 27 | % |
| Net realized price ($/lb)3 | | | 0.86 | | | | 0.50 | | | | 73 | % |
| 1 Adjustments consists of mark to market, final price and assay adjustments. |
| |
| 2 Based on provisional sales before final price adjustments. Net after payable metal deductions, treatment, and refining charges. |
| |
| 3 Treatment charges are allocated to base metals at Caylloma and to gold at San Jose. |
Total Sales for the three months ended March 31, 2021 were $117.8 million, an increase of 148% from the $47.5 million reported in Q1 2020. The Lindero Mine recognized sales of $36.9 million from 21,297 ounces of gold ounces sold. San Jose sales were $58.0 million, an increase of 50% from the $38.7 million reported in Q1 2020 due to increases in the prices of silver and gold and a 3% and 5% increase in the volume of silver and gold ounces sold, respectively. Sales from the Caylloma Mine were $25.4 million, a 92% increase from the $13.2 million reported in Q1 2020 due to higher metal prices and a 22%, 17%, and 21% increase in the volume of silver, zinc, and lead sold, respectively.
| Fortuna Silver Mines Inc. | (in US Dollars, tabular amounts in millions, except where noted) |
| Management’s Discussion and Analysis | |
| For the three months ended March 31, 2021 | |
Operating Income (Loss) and Adjusted EBITDA
| Three Months Ended March 31 | | | 2021 | | | | %1 | | | | 2020 | | | | %1 | |
| Operating income | | | | | | | | | | | | | | | | |
| Lindero | | | 11.7 | | | | 31 | % | | | (3.4 | ) | | | 0 | % |
| San Jose | | | 24.5 | | | | 44 | % | | | 8.0 | | | | 23 | % |
| Caylloma | | | 8.2 | | | | 32 | % | | | (1.8 | ) | | | (14 | )% |
| Corporate | | | (4.0 | ) | | | | | | | (1.0 | ) | | | | |
| Total | | | 40.4 | | | | 34 | % | | | 1.8 | | | | 4 | % |
| | | | | | | | | | | | | | | | | |
| Adjusted EBITDA2 | | | | | | | | | | | | | | | | |
| Lindero | | | 19.6 | | | | 52 | % | | | (0.1 | ) | | | 0 | % |
| San Jose | | | 33.2 | | | | 60 | % | | | 15.4 | | | | 44 | % |
| Caylloma | | | 11.9 | | | | 47 | % | | | 1.5 | | | | 12 | % |
| Corporate | | | (3.9 | ) | | | | | | | (0.9 | ) | | | | |
| Total | | | 60.8 | | | | 52 | % | | | 15.9 | | | | 34 | % |
| 1 As a Percentage of Sales. |
| |
| 2 Refer to Non-IFRS Financial Measures. |
| |
| 3 Figures may not add due to rounding. |
Operating income for the three months ended March 31, 2021 was $40.4 million, an increase of $38.6 million compared to Q1 2020. The increase was due primarily to higher mine operating income as prices of silver and gold increased 61% and 12%, respectively, compared to Q1 2020, and Lindero’s contribution to mine operating income of $11.7 million, offset partly by higher Corporate costs incurred.
At Lindero, operating income for the three months ended March 31, 2021 was $11.7 million, an increase of $15.1 million compared to Q1 2020. The mine achieved the first gold pour in October 2020, and subsequently has been generating operating income as production continues to ramp up production. The majority of the Lindero mineral property, plant and equipment costs were depreciating from January 1, 2021; the primary assets not depreciating at March 31, 2021 were the tertiary-HPGR crusher, agglomeration plant, stacking system, and SART plant, which are expected to be placed into full service during the second quarter of 2021.
At San Jose, operating income for the three months ended March 31, 2021 was $24.5 million, an increase of $16.5 million compared to Q1 2020. The increase was due primarily to a combination of higher metal prices and higher sales volume.
At Caylloma, operating income for the three months ended March 31, 2021 was $8.2 million, an increase of $10.0 million compared to Q1 2020. The increase was due primarily to a combination of higher metal prices and higher sales volume, offset partly by higher production costs due primarily to operational costs associated with COVID-19 quarantine and testing requirements.
General and Administrative (“G&A”) Expenses
| Three months ended March 31 | | 2021 | | | 2020 | | | % Change | |
| Mine G&A | | | 4.3 | | | | 2.4 | | | | 79 | % |
| Corporate G&A | | | 4.2 | | | | 2.3 | | | | 83 | % |
| Share-based payments | | | (0.4 | ) | | | (1.4 | ) | | | (71 | %) |
| Workers' participation | | | 0.5 | | | | 0.3 | | | | 67 | % |
| Total | | | 8.6 | | | | 3.6 | | | | 139 | % |
General and administrative expenses for the three months ended March 31, 2021 were $8.6 million, an increase of 139% compared to Q1 2020. Mine G&A increased $1.9 million, due primarily to operations at the Lindero Mine, which was undergoing construction in Q1 2020. Corporate G&A increased $1.9 million, due primarily to increased Corporate activities compared to Q1 2020.
| Fortuna Silver Mines Inc. | (in US Dollars, tabular amounts in millions, except where noted) |
| Management’s Discussion and Analysis | |
| For the three months ended March 31, 2021 | |
Foreign Exchange Loss
Foreign exchange loss for the three months ended March 31, 2021 was $2.4 million, an increase of $1.1 million compared to Q1 2020. The increase was due primarily to the devaluation of the Argentine peso against the U.S. dollar and its impact on the Argentine peso denominated value added tax receivable. The majority of the outstanding value added tax receivable relates to construction activities in prior years.
Income Tax Expense
Income tax expense for the three months ended March 31, 2021 was $13.3 million, an increase of $6.2 million compared to Q1 2020. The increase was due primarily to higher pre-tax income from all three mine sites and higher mining taxes due to a profitable quarter.
The effective tax rate (“ETR”) for the three months ended March 31, 2021 was 34% compared to 273% in Q1 2020. The decrease was due primarily to the higher pre-tax income from all three mine sites, and reduced impact of foreign exchange fluctuations in the Mexican peso and lower withholding taxes.
The Company is subject to tax in various jurisdictions, including Peru, Mexico, Argentina and Canada. There are a number of factors that can significantly impact the Company’s effective tax rate including the geographic distribution of income, variations in our income before income taxes, varying rates in different jurisdictions, the non-recognition of tax assets, local inflation rates, fluctuation in the value of the United States dollar and foreign currencies, changes in tax laws and the impact of specific transactions and assessments. As a result of the number of factors that can potentially impact the effective tax rate and the sensitivity of the tax provision to these factors, the effective tax rate will fluctuate, sometimes significantly. This trend is expected to continue in future periods.
| Fortuna Silver Mines Inc. | (in US Dollars, tabular amounts in millions, except where noted) |
| Management’s Discussion and Analysis | |
| For the three months ended March 31, 2021 | |
RESULTS OF OPERATIONS
Lindero Mine, Argentina
| Three months ended March 31 | | 2021 | | | 2020 | |
| Mine Production | | | | | | | | |
| Tonnes placed on the leach pad | | | 2,130,000 | | | | - | |
| | | | | | | | | |
| Gold | | | | | | | | |
| Grade (g/t) | | | 0.82 | | | | - | |
| Production (oz) | | | 22,332 | | | | - | |
| Metal sold (oz) | | | 21,297 | | | | - | |
| Realized price ($/oz) | | | 1,754 | | | | - | |
| | | | | | | | | |
| Unit Costs | | | | | | | | |
| Cash cost ($/oz Au)1 | | | 639 | | | | - | |
| All-in sustaining cash cost ($/oz Au)1 | | | 1,055 | | | | - | |
| | | | | | | | | |
| Capital expenditures ($000's) | | | | | | | | |
| Sustaining | | | 4,040 | | | | - | |
| Brownfields | | | 91 | | | | - | |
| 1 Refer to Non-IFRS Financial Measures. | | | | | | | | |
Quarterly Operating and Financial Highlights
In the first quarter of 2021, a total of 2.13 million tonnes of ore were placed on the heap leach pad averaging 0.82 g/t gold, containing an estimated 56,330 ounces of gold. The operation placed 65% more ounces on the heap leach pad and produced 53% more ounces in doré compared to the fourth quarter of 2020. Total gold production was 22,332 ounces comprised of 20,562 ounces in doré and 1,770 ounces of gold-in-carbon inventory.
Cash cost per gold ounce sold was $639, as the mine continues to ramp up production.
All-in sustaining cash costs per gold ounce sold was $1,055, below the Company’s guidance for the first half of the year of between $1,130 and $1,335 per gold ounce sold, due primarily to the timing of sustaining capital expenditures.
In the first quarter of 2021, sustaining capital expenditures included $2.1 million of leach pad expansion and $1.7 million of capitalized stripping. Capital investments for the year are estimated at $20.5 million of sustaining capital expenditures (refer Fortuna new release dated January 19, 2021), and $6.1 million of capitalized stripping.
The ramp up of the primary and secondary crushing circuits is progressing according to plan with crushing in March averaging 15,770 tonnes per day and throughput averaging 960 tonnes per hour, representing 84% and 92% of design capacity, respectively. During March, crushing peaked at 20,000 tonnes per day. Results subsequent to quarter-end up to the end of April have been consistent with March performance.
The tertiary-HPGR crusher, agglomeration plant, and stacking system throughput averaged 7,600 tonnes per day in March, achieving 41% of design capacity. During the quarter, the limiting factor for higher throughput was the stacking system, where the operation encountered challenges with automation, mechanical, and operational issues. As at the end of March, the automation and mechanical issues were largely resolved while training of the workforce continues. In April design capacity remained at similar levels as in March with a new peak of 94% of design capacity in the final days of the month.
The ADR plant is operating as per design capacity. The SART plant ramp up was suspended at the end of February to address operational issues with the copper and gypsum filters. Bypassing the SART plant is not expected to have a critical impact on gold production during the upcoming months due to the relative low levels of soluble copper in the pregnant solution. The operation expects to incorporate the SART plant into the process in the second quarter of 2021.
Construction at Lindero was substantially complete as of the end of March 2021 and is on track to achieve 2021 annual gold production guidance of 140,000 to 160,000 ounces (refer Fortuna news release dated January 19, 2021).
| Fortuna Silver Mines Inc. | | (in US Dollars, tabular amounts in millions, except where noted) |
| Management’s Discussion and Analysis | | |
| For the three months ended March 31, 2021 | | |
San Jose Mine
| Three months ended March 31 | | 2021 | | | 2020 | |
| Mine Production | | | | | | | | |
| Tonnes milled | | | 259,803 | | | | 246,826 | |
| Average tonnes milled per day | | | 3,048 | | | | 2,837 | |
| | | | | | | | | |
| Silver | | | | | | | | |
| Grade (g/t) | | | 217 | | | | 216 | |
| Recovery (%) | | | 91 | | | | 92 | |
| Production (oz) | | | 1,646,444 | | | | 1,570,201 | |
| Metal sold (oz) | | | 1,642,300 | | | | 1,593,554 | |
| Realized price ($/oz) | | | 26.17 | | | | 16.09 | |
| | | | | | | | | |
| Gold | | | | | | | | |
| Grade (g/t) | | | 1.36 | | | | 1.33 | |
| Recovery (%) | | | 91 | | | | 91 | |
| Production (oz) | | | 10,301 | | | | 9,630 | |
| Metal sold (oz) | | | 10,287 | | | | 9,777 | |
| Realized price ($/oz) | | | 1,783 | | | | 1,571 | |
| | | | | | | | | |
| Unit Costs | | | | | | | | |
| Production cash cost ($/t)2 | | | 70.13 | | | | 71.12 | |
| Production cash cost ($/oz Ag Eq)1,2 | | | 8.40 | | | | 7.48 | |
| Net smelter return ($/t) | | | 223.69 | | | | 154.31 | |
| All-in sustaining cash cost ($/oz Ag Eq)1,2 | | | 13.40 | | | | 10.67 | |
| | | | | | | | | |
| Capital expenditures ($000's) | | | | | | | | |
| Sustaining | | | 1,987 | | | | 1,573 | |
| Non-sustaining | | | 274 | | | | 127 | |
| Brownfields | | | 1,736 | | | | 1,306 | |
___________________________________
| 1 Production cash cost silver equivalent and All-in sustaining cash cost silver equivalent are calculated using realized metal prices for each period. |
| 2 Production cash cost, Production cash cost silver equivalent, and All-in sustaining cash cost silver equivalent are Non-IFRS Financial Measures. Refer to Non-IFRS Financial Measures. |
Quarterly Operating and Financial Highlights
The San Jose Mine produced 1,646,444 ounces of silver and 10,301 ounces of gold during the three months ended March 31, 2021, which represents an increase of 5% and 7%, respectively, compared to Q1 2020. The increase was due primarily to 5% higher tonnes milled.
The production cash cost per tonne for the three months ended March 31, 2021 was $70.13, consistent with the $71.12 per tonne in Q1 2020.
The all-in sustaining cash cost of payable silver equivalent for the three months ended March 31, 2021 was $13.40 per ounce, an increase of 26% compared to the $10.67 per ounce in Q1 2020. The increase was due primarily to higher royalties from higher income, and lower silver equivalent ounces sold due to a change in the silver to gold ratio (Q1 2021: 68.1:1, Q1 2020: 97.7:1), underlying sales volumes of silver and gold ounces were higher than Q1 2020.
Capital expenditures totaled $4.0 million for the three months ended March 31, 2021, an increase of 33% compared to Q1 2020.
| Fortuna Silver Mines Inc. | | (in US Dollars, tabular amounts in millions, except where noted) |
| Management’s Discussion and Analysis | | |
| For the three months ended March 31, 2021 | | |
Caylloma Mine, Peru
| Three months ended March 31 | | 2021 | | | 2020 | |
| Mine Production | | | | | | | | |
| Tonnes milled | | | 131,887 | | | | 132,741 | |
| Average tonnes milled per day | | | 1,499 | | | | 1,491 | |
| | | | | | | | | |
| Silver | | | | | | | | |
| Grade (g/t) | | | 77 | | | | 70 | |
| Recovery (%) | | | 81 | | | | 84 | |
| Production (oz) | | | 267,311 | | | | 249,111 | |
| Metal sold (oz) | | | 259,311 | | | | 212,478 | |
| Realized price ($/oz) | | | 26.29 | | | | 17.59 | |
| | | | | | | | | |
| Lead | | | | | | | | |
| Grade (%) | | | 3.21 | | | | 2.96 | |
| Recovery (%) | | | 88 | | | | 89 | |
| Production (000's lbs) | | | 8,181 | | | | 7,723 | |
| Metal sold (000's lbs) | | | 7,998 | | | | 6,616 | |
| Realized price ($/lb) | | | 0.92 | | | | 0.85 | |
| | | | | | | | | |
| Zinc | | | | | | | | |
| Grade (%) | | | 4.70 | | | | 4.58 | |
| Recovery (%) | | | 88 | | | | 88 | |
| Production (000's lbs) | | | 11,969 | | | | 11,821 | |
| Metal sold (000's lbs) | | | 12,267 | | | | 10,512 | |
| Realized price ($/lb) | | | 1.25 | | | | 0.98 | |
| | | | | | | | | |
| Unit Costs | | | | | | | | |
| Production cash cost ($/t)2 | | | 88.00 | | | | 80.83 | |
| Production cash cost ($/oz Ag Eq)1,2 | | | 13.69 | | | | 13.84 | |
| Net smelter return ($/t) | | | 194.39 | | | | 114.97 | |
| All-in sustaining cash cost ($/oz Ag Eq)1,2 | | | 18.50 | | | | 16.71 | |
| | | | | | | | | |
| Capital expenditures ($000's) | | | | | | | | |
| Sustaining | | | 1,972 | | | | 1,874 | |
| Brownfields | | | 630 | | | | 263 | |
___________________________
| 1 Production cash cost silver equivalent and All-in sustaining cash cost silver equivalent are calculated using realized metal prices for each period. |
| 2 Production cash cost, Production cash cost silver equivalent, and All-in sustaining cash cost silver equivalent are Non-IFRS Financial Measures. Refer to Non-IFRS Financial Measures. |
Quarterly Operating and Financial Highlights
The Caylloma Mine produced 267,311 ounces of silver, 8.2 million pounds of lead and 12.0 million pounds of zinc during the three months ended March 31, 2021, an increase of 7%, 6%, and 1% compared to Q1 2020. The increased metal production was due to higher head grades. Gold production totaled 1,922 ounces with an average head grade of 0.62 g/t.
The cash cost per tonne of processed ore for the three months ended March 31, 2021 was $88.00, an increase of 9% compared to Q1 2020. The increase was due primarily to operational costs associated with COVID-19 quarantine and testing requirements, offset partly by lower mine preparation costs.
The all-in sustaining cash cost of silver equivalent payable for the three months ended March 31, 2021 was $18.50 per ounce, an increase of 11% compared to Q1 2020. The increase was due primarily to higher royalties from higher income, and lower silver equivalent ounces sold due to a change in the silver equivalent ratio, Q1 2021 is calculated using a silver to gold ratio of 67.5:1 (Q1 2020: 90.5:1), silver to lead ratio of 1:28.6 pounds (Q1 2020: 1:20.7), and silver to zinc ratio of 1:21.1 pounds (Q1 2020: 1:17.9), underlying sales volumes of all metals were higher than Q1 2020.
| Fortuna Silver Mines Inc. | | (in US Dollars, tabular amounts in millions, except where noted) |
| Management’s Discussion and Analysis | | |
| For the three months ended March 31, 2021 | | |
QUARTERLY INFORMATION
The following table provides information for the last eight fiscal quarters up to March 31, 2021:
| | | Q1 2021 | | Q4 2020 | | Q3 2020 | | Q2 2020 | | Q1 2020 | | Q4 2019 | | Q3 2019 | | Q2 2019 | |
| Sales | | 117.8 | | 103.5 | | 83.4 | | 44.5 | | 47.5 | | 69.0 | | 61.3 | | 67.9 | |
| Mine operating income | | 51.3 | | 46.7 | | 42.1 | | 13.8 | | 7.5 | | 23.4 | | 16.7 | | 23.0 | |
| Operating income (loss) | | 40.4 | | 28.2 | | 28.5 | | (1.3 | ) | 1.8 | | 9.0 | | (1.5 | ) | 15.7 | |
| Net income (loss) | | 26.4 | | 18.6 | | 13.1 | | (5.7 | ) | (4.5 | ) | 19.0 | | (7.7 | ) | 10.3 | |
| | | | | | | | | | | | | | | | | | |
| Basic earnings (loss) per share | | 0.14 | | 0.10 | | 0.07 | | (0.03 | ) | (0.03 | ) | 0.12 | | (0.05 | ) | 0.07 | |
| Diluted earnings (loss) per share | | 0.14 | | 0.09 | | 0.07 | | (0.03 | ) | (0.03 | ) | 0.12 | | (0.05 | ) | 0.07 | |
| | | | | | | | | | | | | | | | | | |
| Total assets | | 1,069.1 | | 1,055.3 | | 987.8 | | 959.4 | | 957.7 | | 936.1 | | 871.5 | | 823.3 | |
| Debt | | 159.0 | | 158.6 | | 133.1 | | 132.6 | | 187.1 | | 146.5 | | 109.4 | | 69.4 | |
Sales increased 14% in the first quarter of 2021 to $117.8 million compared to $103.5 million in the fourth quarter of 2020 due primarily to higher sales at Lindero, which increased to $36.9 million from $20.3 million, and sales at Caylloma, which increased to $25.4 million from $22.2 million, offset partly by provisional pricing adjustments. Mine operating income increased 10% in the first quarter of 2021 due primarily to Lindero, which increased to $15.2 million from $10.2 million in the fourth quarter of 2020.
Sales increased 24% in the fourth quarter of 2020 to $103.5 million compared to $83.4 million in the third quarter of 2020 due primarily to the recognition of $20.3 million of gold sales and $10.1 million of cost of sales from commissioning activities at Lindero Mine. Sales at San Jose decreased $4.2 million to $60.5 million quarter-over-quarter due to lower volume of silver and gold sold while sales at Caylloma increased $3.9 million. Share-based payments increased 24% to $4.5 million as the result of a 23% increase in the Company’s share price which impacts the cash-settled share units. With construction of the Lindero Mine substantially complete, the Company ceased capitalization of interest at the end of November 2020 and expensed $0.7 million of borrowing costs. Net income increased $5.5 million to $18.6 million over the prior quarter.
Sales increased 87% in the third quarter of 2020 to $83.4 million compared to $44.5 million in the second quarter of 2020 due to increases in the prices of silver and gold and the resumption of operations at the San Jose Mine after a 54-day temporary suspension of the mine in the second quarter. Mine operating income more than tripled to $42.1 million despite a 21-day temporary suspension of the Caylloma Mine in July. The costs incurred during the suspension of operations totaled $0.9 million and are reported as care and maintenance costs. Income tax expense also increased $8.8 million over the second quarter to $15.0 million due primarily to higher pre-tax profit from the San Jose Mine, which impacted net income for the period.
Sales decreased 6% in the second quarter of 2020 to $44.5 million compared to $47.5 million in the first quarter of 2020. The primary reason for the decrease was the 54-day government mandated temporary suspension of the San Jose Mine as part of the Mexican Government’s response to curb the spread of COVID-19 which severely curtailed silver and gold production by 34% and 31% despite higher silver and gold prices. The net loss included $2.0 million of care and maintenance costs incurred during the 54-day suspension of the San Jose Mine and higher share-based payment expense, which were partially offset by $2.2 million of investment gains from cross-border bond trades.
Sales decreased 31% in the first quarter of 2020 to $47.5 million compared to $69.0 million in the fourth quarter of 2019. The decrease in sales was due primarily to the beginning of the COVID-19 pandemic in mid-March which severely impacted metal prices and combined with a planned change in mine sequencing at the San Jose Mine, caused lower grade material to be mined. This reduction in production resulted in a decrease in the volume of silver and gold ounces sold of 14% and 17%, respectively, and mine operating income decreased $15.9 million quarter-over-quarter. Partially offsetting the lower mine operating income were lower mine site and corporate administration costs and lower share-based payment expense as the Company’s share price declined in the quarter impacting the valuation of cash-settled share units.
| Fortuna Silver Mines Inc. | | (in US Dollars, tabular amounts in millions, except where noted) |
| Management’s Discussion and Analysis | | |
| For the three months ended March 31, 2021 | | |
Sales increased 13% in the fourth quarter of 2019 to $69.0 million compared to $61.3 million in the third quarter of 2019 due primarily to a 15% and 7% increase in the volume of silver and gold ounces sold, respectively. Cash mine operating costs at the San Jose Mine and Caylloma Mine were 6% higher and 4% lower, respectively. Pre-tax income included $11.0 million of investment gains from cross-border securities trades.
Sales decreased 10% in the third quarter of 2019 to $61.3 million compared to $67.9 million in the second quarter of 2019 due primarily to lower silver and gold ounces sold from the San Jose Mine as a result of scheduled mining at lower grade stopes. The lower sales and an $8.3 million foreign exchange loss from the devaluation of the Argentine peso were the primary reasons for the $1.5 million operating loss and $7.7 million net loss in the third quarter of 2019
Precious Metal Prices Trends
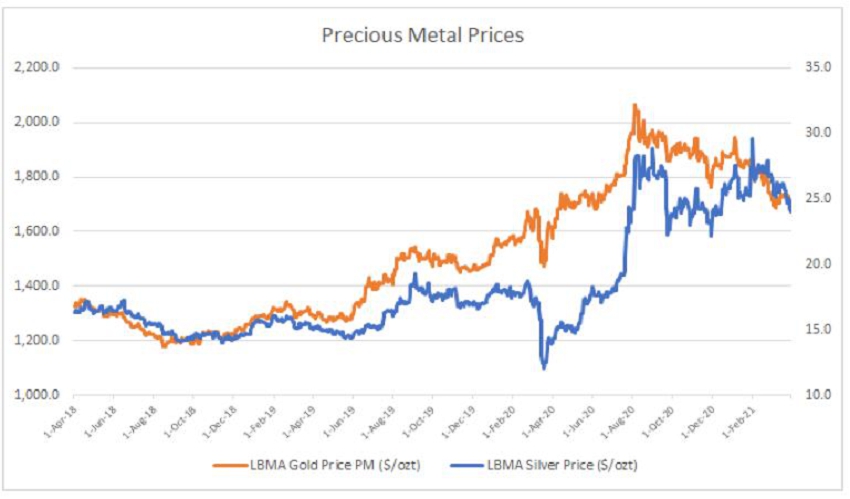
For the three months ended March 31, 2021, the sale of silver and gold ounces represent approximately 86% of the Company’s sales revenue while lead and zinc make up the remaining 14%. Therefore, the prices of silver and gold are the most dominant factors in determining the Company’s profitability and cash flow from operations. The prices of silver and gold are subject to volatile fluctuations over short periods of time and can be affected by numerous macroeconomic conditions, including supply and demand factors, the value of the U.S. dollar, interest rates and global economic and political issues. The Company’s financial performance is expected to continue to be closely linked to the prices of silver and gold.
The metal price environment for silver and gold has evolved during the COVID-19 pandemic. Since the start of 2021, the gold price has decreased from a high of $1,943 per ounce in January, to a low of $1,683 in March. Following the start of vaccinations against COVID-19 by many of the major industrialized countries in December of 2020 and continuing into 2021, the price of gold has retreated from the highs of $2,067 per ounce reached in August 2020.
Since the start of 2021, the silver price has remained relatively stable, opening the year at $27.20 per ounce, and trading within a range of $29.85 - $24.00 per ounce throughout the quarter.
| Fortuna Silver Mines Inc. | | (in US Dollars, tabular amounts in millions, except where noted) |
| Management’s Discussion and Analysis | | |
| For the three months ended March 31, 2021 | | |
LIQUIDITY AND CAPITAL RESOURCES
Cash and Cash Equivalents
The Company had cash and cash equivalents of $145.7 million at March 31, 2021, an increase of $13.8 million since the beginning of the year. The increase was due primarily to $21.1 million of net cash provided by operating activities, offset by $4.6 million net cash used in investing activities, primarily expenditures on mineral properties, plant and equipment, and $2.4 million in financing activities related to payments of lease obligations.
The Company’s investment objectives for its cash balances, in order of priority, are to preserve capital, to ensure liquidity and to maximize returns. The Company’s strategy to achieve these objectives is to invest its excess cash balance in a portfolio of primarily fixed income instruments with specified credit rating targets established by the Board of Directors of the Company. The Company does not own any asset-backed commercial paper or other similar at-risk investments in its investment portfolios.
Working Capital
Working capital at March 31, 2021 decreased $77.8 million during the quarter to $73.8 million, due primarily to the reclassification of the $40 million non-revolving credit facility and the $80 million revolving credit facility, which both mature on January 26, 2022, to current, offset partly by a $13.8 million increase in cash and cash equivalents, a $15.1 million increase in inventories, a $6.7 million reduction in current income taxes payable, a $2.4 million reduction in trade and other payable, a $2.2 million increase in other current assets, and a $1.4 million increase on accounts and other receivables.
Capital Resources
As at March 31, 2021, the Company had fully drawn $40 million from its non-revolving credit facility and $80 million from its revolving credit facility (collectively, the “Credit Facility”). The revolving portion of the Credit Facility, which had temporarily increased from $80 million to $110 million, effective December 18, 2018, reverted back to a limit of $80 million as of December 31, 2020, which has been fully drawn. The interest rate on the revolving credit facility is on a sliding scale at one-month LIBOR plus an applicable margin ranging from 2.5% to 3.5%, based on the Company’s Net Senior Secured Debt to EBITDA Ratio, as defined in the Credit Facility. The Credit Facility is secured by a first ranking lien on the assets of the San Jose Mine and Caylloma Mine as well as their holding companies.
| As at | | Mar 31, 2021 | | | Dec 31, 2020 | | | Change | |
| Cash and cash equivalents | | | 145.7 | | | | 131.9 | | | | 13.8 | |
| Credit facility | | | 120.0 | | | | 120.0 | | | | - | |
| Total liquidity available | | | 265.7 | | | | 251.9 | | | | 13.8 | |
| Amount drawn on credit facility | | | (120.0 | ) | | | (120.0 | ) | | | - | |
| Net liquidity position | | | 145.7 | | | | 131.9 | | | | 13.8 | |
As at March 31, 2021, the Company was in compliance with its financial covenants.
The full extent and impact of COVID-19 on the Company’s operations and financial condition continues to be difficult to ascertain until the duration of the outbreak, the severity of the virus and the ability to treat it can reasonably be predicted, and when the government of the countries which host our operations lift restrictions on business activities. In the event of an unexpectedly prolonged duration of COVID-19, or in the event that more rigorous capital controls are implemented in Argentina, the Company may be required to raise additional debt or equity. There is no assurance that the lenders will agree to such a request or that financing will be available to the Company on terms acceptable to it.
The Company does not have unlimited financial resources and there is no assurance that sufficient additional funding or financing will be available when needed by the Company or its direct and indirect subsidiaries on acceptable terms, or at all, to further explore or develop its properties or to fulfill its obligations under any applicable agreements. Fortuna is a multinational company and relies on financial institutions worldwide to fund corporate and project needs. Instability of large financial institutions may impact the ability of the Company to obtain equity or debt financings in the future and, if obtained, on terms that may not be favorable to the Company. Disruptions in the capital and credit markets as a result of uncertainty, geo-political events, changing or increased regulations of financial institutions, reduced alternatives or failures of significant financial institutions could adversely affect the Company’s access to the liquidity needed for the business in the longer term.
| Fortuna Silver Mines Inc. | | (in US Dollars, tabular amounts in millions, except where noted) |
| Management’s Discussion and Analysis | | |
| For the three months ended March 31, 2021 | | |
The Company may incur substantial debt from time to time to finance working capital, capital expenditures, investments or acquisitions or for other purposes. If the Company does so, the risks related to the Company’s indebtedness could intensify, including: (i) increased difficulty in satisfying existing debt obligations (ii) limitations on the ability to obtain additional financings, or imposed requirements to make non-strategic divestures (iii) impose hedging requirements (iv) imposed restrictions on the Company’s cash flows, for debt repayments or capital expenditures (v) increased vulnerability to general adverse economic and industry conditions (vi) interest rate risk exposure as borrowings may be at variable rates of interest (vii) decreased flexibility in planning for and reacting to changes in the mining industry (viii) reduced competitiveness versus less leveraged competitors, and (ix) increased cost of borrowings.
Subject to the various risks and uncertainties, as explained in the Risks and Uncertainties section, management believes the Company’s mining operations will generate sufficient cash flows and the Company has sufficient available credit lines and cash on hand to fund planned capital and exploration programs.
The Company has contingencies and capital commitments as described in Note 28 “Contingencies and Capital Commitments” in the Company’s condensed interim consolidated financial statements. From time to time, the Company may also be involved in legal proceedings that arise in the ordinary course of its business.
Off-Balance Sheet Arrangements
The Company does not have any off-balance sheet arrangements or commitments that are expected to have a current or future effect on the financial condition, results of operations, liquidity, capital expenditures, or capital resources that are material to investors.
FINANCIAL INSTRUMENTS
The Company does not utilize complex financial instruments in hedging foreign exchange or interest exposure. Any hedging activity requires approval of the Company’s Board of Directors. The Company will not hold or issue derivative instruments for speculative or trading purposes.
Provisional priced trade receivables of $35.0 million and an interest rate swap (notional amount of $40.0 million), forward metal sales, and forward fuel contracts asset totaling $0.7 million are the Company’s only level 2 fair valued financial instruments and no level 3 instruments are held.
Provisionally priced trade receivables are valued using forward London Metal Exchange prices until final prices are settled at a future date. The interest rate swap is measured at estimated fair value.
SHARE POSITION & OUTSTANDING OPTIONS & EQUITY BASED SHARE UNITS
The Company has 185,316,950 common shares outstanding as at May 7, 2021. In addition, there were 3,058,596 outstanding equity-settled share-based awards as follows:
| Incentive stock options | | | 1,013,943 | |
| Restricted share units | | | 911,061 | |
| Performance share units | | | 1,133,592 | |
| Total | | | 3,058,596 | |
On April 27, 2021, with a fair value of each grant unit of $6.36 (C$7.90), the Company granted 418,149 cash-settled restricted share units, and 936,911 share-settled performance share units. The units all vest 20% on the first anniversary of the date of grant, 30% on the second anniversary and 50% on the third anniversary. The equity-settled performance share units are only paid out if the goals are met.
| Fortuna Silver Mines Inc. | | (in US Dollars, tabular amounts in millions, except where noted) |
| Management’s Discussion and Analysis | | |
| For the three months ended March 31, 2021 | | |
An aggregate of 196,681 share-settled performance share units issued in 2019 and 936,911 share-settled performance share units issued in 2021 are subject to a multiplier ranging from 50% to 200% depending on the achievement level of certain performance targets.
As at March 31, 2021 the Company has $46.0 million of Debentures that are convertible at the holder’s option into common shares in the capital of the Company at a conversion price of $5.00 per share, representing a conversion rate of 200 Common Shares per $1,000 principal amount of Debentures, subject to adjustment in certain circumstances. Subject to certain exceptions in connection with a change of control of the Company, the Debentures cannot be redeemed by the Company prior to October 31, 2022. Between November 1, 2022 and prior to October 31, 2023, the Debentures may be redeemed in whole or in part from time to time at the Company’s option at a price equal to their principal amount plus accrued and unpaid interest, provided that the volume weighted average trading price of the Common Shares on the NYSE for the 20 consecutive trading days ending on the fifth trading day preceding the date on which the notice of the redemption is given is at least 125% of the Conversion Price. On and after October 31, 2023, the Debentures may be redeemed in whole or in part from time to time at the Company’s option at a price equal to their principal amount plus accrued and unpaid interest regardless of the trading price of the Common Shares. The Debentures mature on October 31, 2024 and bear interest at a rate of 4.65% per annum, payable semi-annually in arrears on the last business day of April and October, commencing on April 30, 2020.
Subject to applicable securities laws and regulatory approval and provided that no event of default has occurred and is continuing, the Company may, at its option, elect to satisfy its obligation to pay the principal amount of the Debentures and accrued and unpaid interest on the redemption date and the maturity date, in whole or in part, through the issuance of Common Shares, by issuing and delivering that number of Common Shares, obtained by dividing the principal amount of the Debentures and all accrued and unpaid interest thereon by 95% of the current market price (as defined in the Debenture Indenture) on such redemption date or maturity date, as applicable.
RELATED PARTY TRANSACTIONS
The Company has entered into the following related party transactions during the three months ended March 31, 2021 and 2020:
(a) Purchase of Goods and Services
The Company was charged for general and administrative services pursuant to a shared services agreement with Gold Group Management Inc., a company of which Simon Ridgway, the Company’s former Chairman, is a director.
| Three months ended March 31 (thousands of US dollars) | | 2021 | | | 2020 | |
| Personnel costs | | | 1 | | | | 5 | |
| General and administrative expenses | | | 4 | | | | 92 | |
| | | | 5 | | | | 97 | |
As at March 31, 2021, the Company had an outstanding balance payable to Gold Group Management Inc. of $nil (December 31, 2020 - $9 thousand). Amounts due to related parties are due on demand and are unsecured.
Effective February 2, 2021, Mr. Ridgway stepped down as a director and Chairman of the Board of Directors of the Company.
| Fortuna Silver Mines Inc. | | (in US Dollars, tabular amounts in millions, except where noted) |
| Management’s Discussion and Analysis | | |
| For the three months ended March 31, 2021 | | |
(b)�� Key Management Personnel
During the three months ended March 31, 2021 and 2020, the Company was charged for consulting services by Mario Szotlender, a director of the Company, and by Mill Street Services Ltd., a company of which Simon Ridgway, the Company’s former Chairman, is a director. Such amounts, along with other amounts paid to key management personnel are as follows:
| Three months ended March 31 (thousands of US dollars) | | 2021 | | | 2020 | |
| Salaries and benefits | | | 1,897 | | | | 474 | |
| Directors fees | | | 158 | | | | 171 | |
| Consulting fees | | | 24 | | | | 39 | |
| Share-based payments | | | (384 | ) | | | (1,266 | ) |
| | | | 1,695 | | | | (582 | ) |
AMENDMENTS TO ACCOUNTING STANDARDS THAT HAVE BEEN ISSUED
In 2020, the IASB published Interest Rate Benchmark Reform - Phase 2 (Amendments to IFRS 9, IAS 39, IFRS 7, IFRS 4, and IFRS 16) (“Phase 2 amendments”) to address the financial reporting impacts of replacing one benchmark interest rate with an alternative rate and became effective January 1, 2021. The adoption of these amounts did not have a significant effect on the Company’s interim financial statements.
RISKS AND UNCERTAINTIES
The Company is exposed to many risks in conducting its business, including but not limited to metal price risk as the Company derives its revenue from the sale of silver, gold, lead and zinc; credit risk in the normal course of business; foreign exchange risk as the Company reports its financial statements in U.S. dollars whereas the Company operates in jurisdictions that conducts its business in other currencies; the inherent risks of uncertainties in estimating mineral reserves and mineral resources; the risk in relation to the construction, the timing of completion of ramp up in production at the Lindero Mine; operational risks related to the spread of the COVID-19 pandemic; political risks, exchange rate and capital controls risk, environmental risks; and risks related to its relations with employees. These and other risks are described below and in the Company’s audited consolidated financial statements for 2020, its Annual Information Form which is available on SEDAR at www.sedar.com, and its Form 40-F filed with the SEC. Readers are encouraged to refer to these documents for a more detailed description of some of the risks and uncertainties inherent to the Company’s business.
Foreign Jurisdiction Risk
The Company currently conducts its operations in Peru, Mexico, and Argentina. All these jurisdictions are potentially subject to a number of political and economic risks, including those described in the following section. The Company is unable to determine the impact of these risks or its future financial position or results of operations and the Company’s exploration, development, and production activities may be substantially affected by factors outside of the Company’s control. These potential factors include but are not limited to royalty and tax increases or claims by governmental bodies, expropriation or nationalization, lack of an independent judiciary, foreign exchange controls, capital and currency controls, import and export regulations, cancellation or renegotiation of contracts, and environmental and permitting regulations. The Company has no political risk insurance coverage against these risks.
The majority of the Company’s production and revenue to March 31, 2021 was derived from its operations in Peru, Mexico, and Argentina. As the Company’s business is carried on in a number of developing countries, it is exposed to a number of risks and uncertainties, including the following: expropriation or nationalization without adequate compensation especially in Argentina which has a history of expropriation where the Company operates the Lindero Mine; changing political and fiscal regimes, and economic and regulatory instability; unanticipated changes to royalty and tax regulations; unreliable and undeveloped infrastructure, labor unrest and labor scarcity; difficulty procuring key equipment and components for equipment; import and export regulation and restrictions; the imposition of capital controls which may affect the repatriation of funds; high rates of inflation; extreme fluctuations in foreign exchange rates and the imposition of currency controls; inability to obtain fair dispute resolution or judicial determination because of bias, corruption or abuse of power; difficulties enforcing judgments; difficulties understanding and complying with regulatory and legal framework with respect to ownership and maintenance of mineral properties, mines and mining operations, local opposition to mine development projects, which include the potential for violence, property damage and frivolous or vexatious claims; terrorism and hostage taking; military repression and increased likelihood of international conflicts or aggression; increased public health concerns. Certain of these risks and uncertainties are prevalent in the jurisdictions where the Company operates.
| Fortuna Silver Mines Inc. | | (in US Dollars, tabular amounts in millions, except where noted) |
| Management’s Discussion and Analysis | | |
| For the three months ended March 31, 2021 | | |
There can be no assurance that these measures will not be extended or that more restrictive measures will be put in place in the countries in which the Company operates, which may result in the suspension of operations or construction at the Company’s mines on a short or long-term basis.
Estimating Mineral Resources and Mineral Reserves
There is a degree of uncertainty attributable to the estimation of Mineral Resources, Mineral Reserves, and expected mineral grades. Until mineral deposits are actually mined and processed, Mineral Resources, Mineral Reserves must be considered as estimates only. Any such estimates are expressions of judgment based on knowledge, mining experience, analysis of drilling results, and industry practices.
Mineral Resources and Mineral Reserves may require revision based on actual production experience. Market fluctuations in the price of metals, as well as increased production costs and reduced metallurgical recovery rates, may render certain Mineral Reserves uneconomic and may ultimately result in a restatement of Mineral Resources and/or Mineral Reserves. Short-term operating factors relating to the Mineral Resources and Mineral Reserves, such as the need for sequential development of ore bodies, may adversely affect the Company’s profitability in any accounting period. Estimates of operating costs are based on assumptions including those relating to inflation and currency exchange, which may prove incorrect. Estimates of mineralization can be imprecise and depend upon geological interpretation and statistical inferences drawn from drilling and sampling analysis, which may prove to be unreliable. In addition, the grade and/or quantity of precious metals ultimately recovered may differ from that indicated by drilling results. There can be no assurance that precious metals recovered in small scale tests will be duplicated in large scale tests under onsite conditions or in production scale. Amendments to mine plans and production profiles may be required as the amount of Mineral Resources changes or upon receipt of further information during the implementation phase of the project. Extended declines in market prices for gold, silver, and other metals may render portions of the Company’s mineralization uneconomic and result in reduced reported mineralization. Any material reduction in estimates of mineralization, or in the Company’s ability to develop its properties and extract and sell such minerals, could have a material adverse effect on the Company's results of operations or financial condition.
Mining Operations
The capital costs required by the Company’s projects may be significantly higher than anticipated. Capital and operating costs, production and economic returns, and other estimates contained in the Company’s current technical reports, may differ significantly from those provided for in future studies and estimates and from management guidance, and there can be no assurance that the Company’s actual capital and operating costs will not be higher than currently anticipated. In addition, delays to construction and exploration schedules may negatively impact the net present value and internal rates of return of the Company’s mineral properties as set forth in the applicable technical report. Similarly, there can be no assurance that historical rates of production, grades of ore processed, rates of recoveries, or mining cash costs will not experience fluctuations or differ significantly from current levels over the course of the mining operations. In addition, there can be no assurance that the Company will be able to continue to extend the production from its current operations through exploration and drilling programs.
Uncertainties and Risks Related to the Ramp up in Production at the Lindero Mine
The Company is subject to inherent uncertainties and risks related to the ramp up in production at the Lindero Mine, the principal of which include: delays associated with contractors; budget overruns due to changes in costs of fuel, labour, power, materials and supplies, inflation and exchange rate risks, and potential opposition from non-governmental organizations, environmental groups or local groups which may delay or prevent activities.
| Fortuna Silver Mines Inc. | | (in US Dollars, tabular amounts in millions, except where noted) |
| Management’s Discussion and Analysis | | |
| For the three months ended March 31, 2021 | | |
The Company’s ability to meet construction, development and production schedules, and cost estimates for the Lindero Mine cannot be assured. The Company has prepared estimates of capital costs and/or operating costs for the Lindero Mine, but no assurance can be given that such estimates will be achieved. Delays in the commencement of commercial production, failure to achieve cost estimates, or material increases in costs due to increases in foreign exchange rates; continuation of capital controls imposed in Argentina; imposition of exchange control restrictions; and delays in obtaining the value added tax refunds, could have an adverse impact in future cash flows, profitability, results of operations, and the financial condition of the Company.
Environmental Uncertainties
All phases of the Company’s operations are subject to environmental regulation in the various jurisdictions in which it operates. These laws address emissions into the air, discharges into water, management of waste, management of hazardous substances, protection of natural resources, antiquities and endangered species, and reclamation of lands disturbed by mining operations. The Company’s operations generate chemical and metals depositions in the form of tailings. The Company’s ability to obtain, maintain and renew permits and approvals, and to successfully develop and operate mines may be adversely affected by real or perceived impacts associated with the Company’s activities or of other mining companies that affect the environment, human health and safety. Environmental hazards may exist on the Company’s properties which are unknown to the Company at present and were caused by previous or existing owners or operators of the properties, for which the Company could be held liable.
Environmental legislation is evolving in a manner requiring stricter standards and enforcement, increased fines and penalties for non-compliance, more stringent environmental assessments of proposed projects and a heightened degree of responsibility for companies and their officers, directors and employees. Compliance with environmental laws and regulations may require significant capital outlays on behalf of the Company and may cause material changes or delays in the Company's intended activities. Failure to comply with applicable environmental laws, regulations and permitting requirements may result in enforcement actions thereunder, including orders issued by regulatory or judicial authorities, causing operations to cease or be curtailed. Such enforcement actions may include the imposition of corrective measures requiring capital expenditure, installation of new equipment or remedial action. There is no assurance that future changes in environmental regulation, if any, will not adversely affect the Company’s operations.
Uncertainties and Risks Relating to COVID-19
The outbreak of COVID-19, which was declared a global pandemic by the World Health Organization in March 2020 and has resulted in a wide spread global health crisis. The novel strain of COVID-19 emerged from China and spread to other countries including Peru, Mexico, Argentina and Canada, the countries in which the Company operates. The international response to the spread of COVID-19 has led to significant restrictions on travel, temporary business closures, mandatory quarantines, global stock market volatility, operating and supply chain delays and disruptions, and a general reduction in consumer activity.
During the three months ended March 31, 2021, our operations were not significantly impacted by the spread of the COVID-19 pandemic.
Even though the Company has and continues to implement business continuity measures to mitigate and reduce any potential impacts of COVID-19 on its business, operations, supply chain and financial condition, the spread of COVID-19 in the countries in which it operates could have a material adverse impact on: the Company’s workforce; production at the Caylloma Mine, San Jose Mine, and Lindero Mine, final ramp up in production at the Lindero Mine; the continued operation of its mines and exploration projects; its ability to transport and sell concentrates and doré could likewise be restricted; any of which would have an effect on the Company’s financial condition.
Given the fast-changing situation with respect to the COVID-19 pandemic, including further waves of the virus and the emergence of variants of the virus, it is difficult to predict the exact nature and extent of the impact the pandemic may have on the Company and its business. Until the number of cases and death rate start to flatten the curve and decline, and vaccines are readily available, there is no certainty that governments may not mandate another round of extreme measures, which could include the suspension of business activities, including mining, which would have an adverse impact on our business and operations.
| Fortuna Silver Mines Inc. | | (in US Dollars, tabular amounts in millions, except where noted) |
| Management’s Discussion and Analysis | | |
| For the three months ended March 31, 2021 | | |
In addition, COVID-19 has caused: volatility in commodity prices (including gold, silver, lead, and zinc); volatility in the stock markets on which the Company’s Common Shares and Debentures are listed, and in the price of the Company’s securities. The continued adverse effects of the spread of COVID-19 if not contained, could impact the Company’s ability to raise capital or refinance the Company’s debt obligations in the future, which may have a material adverse effect on the business, operations, and financial condition of Company.
The Company remains focused on ensuring the health and safety of the workforce and in continuing measures to prevent and manage transmission of COVID-19 amongst the workforce and the wider community. Despite these measures, there can be no assurance that such measures will be successful.
Credit Risk
Credit risk is the risk of an unexpected loss if a customer or third party to a financial instrument fails to meet its contractual obligations. All of our trade receivables from concentrate sales are held with large international metals trading companies.
The Company’s cash and cash equivalents are held through large financial institutions. These investments mature at various dates within one year.
The Company’s maximum exposure to credit risk as at March 31, 2021 and December 31, 2020 is as follows:
| As at | | Mar 31, 2021 | | | Dec 31, 2020 | |
| Cash and cash equivalents | | | 145.7 | | | | 131.9 | |
| Derivative assets | | | 0.7 | | | | - | |
| Accounts receivable and other assets | | | 78.0 | | | | 76.6 | |
| Other non-current receivables | | | 6.0 | | | | 6.4 | |
| | | | 230.4 | | | | 214.9 | |
The carrying amount of financial assets recorded in the financial statements represents the Company’s maximum exposure to credit risk. We limit our exposure to counterparty credit risk on cash and term deposits by only dealing with financial institutions with high credit ratings and through our investment policy of purchasing only instruments with a high credit rating. Almost all of our concentrate is sold to large well-known concentrate buyers.
Metal Price Risk
The Company derives its revenue from the sale of silver, gold, lead, and zinc. The Company’s sales are directly dependent on metal prices, and metal prices have historically shown significant volatility that is beyond the Company’s control.
The following table illustrates the sensitivity to a +/-10% change in metal prices on the Company’s outstanding trade receivables as at March 31, 2021:
| Metal | | Change | | Effect on Sales | |
| Silver | | | +/-10% | | | 2.0 | |
| Gold | | | +/-10% | | | 0.8 | |
| Lead | | | +/-10% | | | 0.4 | |
| Zinc | | | +/-10% | | | 0.3 | |
From time to time, the Company mitigates the price risk associated with its base metal production by entering into forward sale and collar contracts for some of its forecasted base metal production and non-metal commodities.
| Fortuna Silver Mines Inc. | | (in US Dollars, tabular amounts in millions, except where noted) |
| Management’s Discussion and Analysis | | |
| For the three months ended March 31, 2021 | | |
During December 2020, the Company entered into the following contracts:
| ● | zero-cost collars for 12,300 tonnes of zinc with a floor price of $2,600 per tonne and a cap of $2,900 per tonne, maturing monthly from January 1, 2021 to December 31, 2021; |
| ● | zero-cost collars for 720,000 gallons of heating oil with a floor price of $1.40 per gallon and a cap of $1.6150 per gallon, maturing monthly from January 1, 2021 to December 31, 2021; |
| ● | zero-cost collars for 1,680,000 gallons of jet fuel with a floor price of $1.30 per gallon and a cap of $1.4775 per gallon, maturing monthly from January 1, 2021 to December 31, 2021; |
| ● | forward swaps for 720,000 gallons of heating oil with a price of $1.52 per gallon, maturing monthly from January 1, 2022 to December 31, 2022; and |
| ● | forward swaps for 1,680,000 gallons of jet fuel with a price of $1.438 per gallon, maturing monthly from January 1, 2022 to December 31, 2022. |
On February 11, 2021, the Company entered into a zero-cost collars for 6,237 tonnes of lead with a floor price of $2,000 per tonne and a cap of $2,125 per tonne, maturing monthly beginning on February 1, 2021 to December 31, 2022.
The zinc, lead, and fuel contracts are derivative financial instruments and are not accounted for as designated hedges. They were initially recognized at fair value on the date on which the related derivative contracts were entered into and are subsequently re-measured to estimated fair value. Any gains or losses arising from changes in the fair value of the derivatives are credited or charged to profit or loss.
During the three months ended March 31, 2021 the Company recognized $885 thousand of realized gains on settlement of swaps and $857 thousand of unrealized gains (three months ended March 31, 2020 – nil and nil, respectively) from changes in the fair value of the open positions.
Currency Risk
The functional and reporting currency for all entities within the consolidated group is the US dollar. We are exposed to fluctuations in foreign exchange rates as a portion of our expenses are incurred in Canadian dollars, Peruvian soles, Argentine peso, and Mexican peso. A significant change in the foreign exchange rates between the United States dollar relative to the other currencies could have a material effect on the Company’s profit or loss, financial position, or cash flows. We have not hedged our exposure to foreign currency fluctuations.
The following table summarizes the sensitivity to a +/-10% change in foreign currency exchange rates on the Company’s foreign currency exposure as at March 31, 2021:
| Currency of foreign denominated items | | Change | | Effect | |
| Mexican peso | | | +/-10% | | | 1.3 | |
| Peruvian soles | | | +/-10% | | | 0.4 | |
| Argentine peso | | | +/-10% | | | 2.1 | |
| Canadian dollar | | | +/-10% | | | 0.6 | |
Due to the volatility of the exchange rate for Argentine peso, the Company is applying additional measures in cash management to minimize potential losses arising from the conversion of funds. As discussed below in the capital management section, the capital controls are in effect when the Lindero Mine reaches commercial production, the Company will be required to convert the equivalent value into Argentine peso from the export sale of all gold doré from the Lindero Mine. In addition, the Company would be required to obtain the prior consent of the Argentine Central Bank for the payment of cash dividends and distributions of profits out of Argentina.
| Fortuna Silver Mines Inc. | (in US Dollars, tabular amounts in millions, except where noted) |
| Management’s Discussion and Analysis |
| For the three months ended March 31, 2021 |
The following tables summarizes the Company’s exposure to currency risk through the following assets and liabilities denominated in foreign currencies:
| As at March 31, 2021 (In millions of local currency) | | Canadian
dollars | | | Peruvian
soles | | | Mexican
pesos | | | Argentine
pesos | |
| Cash and cash equivalents | | | 2.3 | | | | 6.1 | | | | 33.5 | | | | 20.8 | |
| Marketable securities | | | 1.1 | | | | - | | | | - | | | | - | |
| Trade and VAT receivables | | | 0.1 | | | | 1.8 | | | | 152.3 | | | | 2,597.9 | |
| Income tax receivable | | | - | | | | 2.6 | | | | - | | | | - | |
| VAT - long term receivable | | | - | | | | - | | | | 70.9 | | | | - | |
| Trade and other payables | | | (11.0 | ) | | | (25.0 | ) | | | (350.3 | ) | | | (357.0 | ) |
| Provisions, current | | | - | | | | - | | | | (4.8 | ) | | | (101.4 | ) |
| Income tax payable | | | - | | | | (0.1 | ) | | | (139.1 | ) | | | - | |
| Other liabilities | | | - | | | | (0.4 | ) | | | (5.2 | ) | | | - | |
| Provisions, non current | | | - | | | | - | | | | (57.7 | ) | | | - | |
| Total foreign currency exposure | | | (7.5 | ) | | | (15.0 | ) | | | (300.4 | ) | | | 2,160.3 | |
| US$ equivalent of foreign currency exposure | | | (6.1 | ) | | | (4.0 | ) | | | (14.6 | ) | | | 23.5 | |
| Figures may not add due to rounding. | | | | | | | | | | | | | | | | |
| As at December 31, 2020 (In millions of local currency) | | Canadian
dollars | | | Peruvian
soles | | | Mexican
pesos | | | Argentine
pesos | |
| Cash and cash equivalents | | | 1.4 | | | | 9.7 | | | | 3.1 | | | | 2.3 | |
| Marketable securities | | | 1.3 | | | | - | | | | - | | | | - | |
| Trade and VAT receivables | | | 0.1 | | | | 3.6 | | | | 108.6 | | | | 3,281.8 | |
| Income tax receivable | | | - | | | | 6.9 | | | | - | | | | - | |
| VAT - long term receivable | | | - | | | | - | | | | 67.5 | | | | - | |
| Trade and other payables | | | (17.8 | ) | | | (28.0 | ) | | | (311.7 | ) | | | (764.3 | ) |
| Due to related parties | | | - | | | | - | | | | - | | | | - | |
| Provisions, current | | | (0.1 | ) | | | 0.1 | | | | (4.9 | ) | | | (77.5 | ) |
| Income tax payable | | | - | | | | (0.3 | ) | | | (297.1 | ) | | | - | |
| Other liabilities | | | (0.2 | ) | | | - | | | | (5.2 | ) | | | - | |
| Provisions, non current | | | - | | | | (0.8 | ) | | | (67.1 | ) | | | - | |
| Total foreign currency exposure | | | (15.3 | ) | | | (8.8 | ) | | | (506.8 | ) | | | 2,442.3 | |
| US$ equivalent of foreign currency exposure | | | (12.0 | ) | | | (2.4 | ) | | | (25.4 | ) | | | 29.1 | |
| Figures may not add due to rounding. | | | | | | | | | | | | | | | | |
Liquidity Risk
Liquidity risk is the risk that we will not be able to meet our financial obligations as they come due. We manage our liquidity risk by continually monitoring forecasted and actual cash flows. We have in place a planning and budgeting process to help determine the funds required to support our normal operating requirements and our development plans. We aim to maintain sufficient liquidity to meet our short term business requirements, taking into account our anticipated cash flows from operations, our holdings of cash and cash equivalents, and our committed and anticipated liabilities.
The Company manages its liquidity risk by continuously monitoring forecasted and actual cashflows. A rigorous reporting, planning and budgeting process are in place to help facilitate forecasting funding requirements, to support operations on an ongoing basis and expansion plans, if any. See also Liquidity and Capital Resources.
| Fortuna Silver Mines Inc. | (in US Dollars, tabular amounts in millions, except where noted) |
| Management’s Discussion and Analysis |
| For the three months ended March 31, 2021 |
As at March 31, 2021, the Company expects the following maturities of its financial liabilities, lease obligations, and other contractual commitments, excluding payments relating to interest:
| | | Expected payments due by year as at March 31, 2021 | |
| | | Less than | | | | | | | | | After | | | | |
| | | 1 year | | | 1 - 3 years | | | 4 - 5 years | | | 5 years | | | Total | |
| Trade and other payables | | | 62.9 | | | | - | | | | - | | | | - | | | | 62.9 | |
| Debt | | | 120.0 | | | | - | | | | 46.0 | | | | - | | | | 166.0 | |
| Income taxes payable | | | 17.1 | | | | - | | | | - | | | | - | | | | 17.1 | |
| Lease obligations | | | 6.5 | | | | 6.4 | | | | 4.0 | | | | 14.0 | | | | 30.9 | |
| Other liabilities | | | - | | | | 2.5 | | | | - | | | | - | | | | 2.5 | |
| Capital commitments, Lindero | | | 0.4 | | | | - | | | | - | | | | - | | | | 0.4 | |
| Closure and reclamation provisions | | | 0.7 | | | | 3.3 | | | | 7.7 | | | | 25.5 | | | | 37.2 | |
| Total | | | 207.6 | | | | 12.2 | | | | 57.7 | | | | 39.5 | | | | 317.0 | |
| | | | | | | | | | | | | | | | | | | | | |
| Figures may not add due to rounding. | | | | | | | | | | | | | | | | | | | | |
Capital Management
The Company’s objective when managing its capital is to maintain its ability to continue as a going concern while at the same time maximizing the growth of its business and providing returns to its shareholders. The Company manages its capital structure and makes adjustments based on changes to its economic environment and the risk characteristics of the Company’s assets.
Effective December 23, 2019, changes to Argentina’s tax laws proposed by the new Argentine Government were implemented. The changes ratified and extended legislation which was to expire on December 31, 2019 and allow the Argentine Central Bank to regulate funds coming into and flowing out of Argentina in order to maintain stability and support the economic recovery of the country. These restrictions currently remain in place and the Argentine Government has not set an expiry date for these restrictions. These capital controls together with additional temporary controls enacted on May 29, 2020, have the effect of: requiring exporters to convert the equivalent value of foreign currency received from the export into Argentine pesos; requiring the prior consent of the Argentine Central Bank to the payment of cash dividends and distributions of currency out of Argentina; requiring Argentine companies to convert foreign currency loans received from abroad into Argentine pesos; and restricting the sale of Argentine pesos for foreign currency.
In September 2020, the Argentine Central Bank approved a new resolution which requires companies to restructure sixty percent of any individual debt exceeding $1.0 million, which has at least a two-year term and is maturing between October 15, 2020 and March 31, 2021. However, this resolution does not apply to intercompany debt and the Company does not hold any external debt at Lindero.
The Argentine Central Bank has also issued a temporary measure in effect until June 30, 2021, which requires the consent of the Central Bank to the repayment of certain types of intercompany loans. There can be no assurance that the temporary measure will not be extended.
The Company’s capital requirement is effectively managed based on the Company having a thorough reporting, planning and forecasting process to help identify the funds required to ensure the Company is able to meet its operating and growth objectives.
| Fortuna Silver Mines Inc. | (in US Dollars, tabular amounts in millions, except where noted) |
| Management’s Discussion and Analysis |
| For the three months ended March 31, 2021 |
The Company’s capital structure consists of equity comprising of share capital, reserves and retained earnings as well as debt consisting of credit facilities and convertible debentures, lease obligations less cash and cash equivalents.
| As at | | Mar 31, 2021 | | | Dec 31, 2020 | |
| Equity | | | 752.9 | | | | 725.8 | |
| Debt | | | 159.0 | | | | 158.6 | |
| Lease obligations | | | 18.6 | | | | 19.5 | |
| Less: cash and cash equivalents | | | (145.7 | ) | | | (131.9 | ) |
| | | | 784.8 | | | | 772.0 | |
| | | | | | | | | |
| Figures may not add due to rounding. | | | | | | | | |
As discussed above, the Company operates in Argentina where the new Argentine government has ratified and extended legislation to December 31, 2025 to allow the Argentine Central Bank to regulate funds coming into and flowing out of Argentina. Other than the restrictions related to these capital controls and complying with the debt covenants under the credit facilities, the Company is not subject to any externally imposed capital requirements. As at March 31, 2021 and December 31, 2020, the Company was in compliance with its debt covenants. See also Liquidity and Capital Resources.
Interest Rate Risk
Interest rate risk is the risk that the fair value or future cash flows of a financial instrument will fluctuate because of changes in market interest rates. Currently, our interest rate exposure mainly relates to interest earned on our cash and cash equivalents balances, interest paid on the Company’s LIBOR-based debt, and the mark-to-market value of derivative instruments which depend on interest rates. As at March 31, 2021, the Company has outstanding an interest rate swap as a hedge on the $40 million non-revolving credit facility to mitigate the interest rate risk on our debt.
Key Personnel
The Company is dependent on a number of key management and employee personnel. The Company’s ability to manage its exploration, development, construction, and operating activities, and hence its success, will depend in large part on the ability to retain current personnel and attract and retain new personnel, including management, technical, and unskilled employees. The loss of the services of one or more key management personnel, as well as a prolonged labor disruption, could have a material adverse effect on the Company’s ability to successfully manage and expand its affairs.
Claims and Legal Proceedings
The Company is subject to various claims and legal proceedings covering a wide range of matters that arise in the normal course of business. The Company may be subject to claims by local communities, indigenous groups or private land owners relating to land and mineral rights and such claimants may seek sizable monetary damages or seek the return of surface or mineral rights that may be valuable to the Company which may significantly impact operations and profitability, if lost. These matters are subject to various uncertainties and it is possible that some of these matters may be resolved with an unfavorable outcome to the Company. The Company does carry liability insurance coverage, but such coverage does not cover all risks to which the Company may be exposed to.
CRITICAL ACCOUNTING ESTIMATES AND JUDGEMENTS
Many of the amounts included in the condensed interim consolidated financial statements require management to make estimates, assumptions, and judgements. These estimates, assumptions, and judgements are continuously evaluated and are based on management’s experience and knowledge of the relevant facts and circumstances. Areas where critical accounting estimates and assumptions have the most significant effect on the amounts recognized in the condensed interim consolidated financial statements include:
| Fortuna Silver Mines Inc. | (in US Dollars, tabular amounts in millions, except where noted) |
| Management’s Discussion and Analysis |
| For the three months ended March 31, 2021 |
Mineral Reserves and Resources and the Life of Mine Plan
We estimate our mineral reserves and mineral resources in accordance with the requirements of National Instrument 43-101 Standards of Disclosure for Mineral Projects published by the Canadian Securities Administrators. Estimates of the quantities of the mineral reserves and mineral resources form the basis for our life of mine plans, which are used for the calculation of depletion expense under the units of production method, impairment tests, and forecasting the timing of the payments related to the environmental rehabilitation provision.
Significant estimation is involved in determining the reserves and resources included within our life of mine plans. Changes in forecast prices of commodities, exchange rates, production costs, or metallurgical recovery rates may result in our life of mine plan being revised and such changes could impact depletion rates, asset carrying values and our environmental rehabilitation provision. As at December 31, 2020 we have used the following long-term prices for our mineral reserve and mineral resource estimations: gold $1,600/oz, silver $21/oz, lead $2,000/t and zinc $2,270/t.
In addition to the estimates above, estimation is involved in determining the percentage of mineral resources ultimately expected to be converted to mineral reserves and hence included in our life of mine plans. Our life of mine plans include a portion of inferred mineral resources as we believe this provides a better estimate of the expected life of mine for certain types of deposits, in particular for vein type structures. The percentage of inferred resources of the total tonnage included in the life of mine plans is based on site specific geological, technical, and economic considerations. Estimation of future conversion of resources is inherently uncertain and involves judgment and actual outcomes may vary from these judgments and estimates and such changes could have a material impact on the financial results. Some of the key judgments of the estimation process include geological continuity, stationarity in the grades within defined domains, reasonable geotechnical and metallurgical conditions, treatment of outlier (extreme) values, cut-off grade determination and the establishment of geostatistical and search parameters. Revisions to these estimates are accounted for prospectively in the period in which the change in estimate arises. See note 4(g)(i) to the audited consolidated financial statements for 2020.
Valuation of Mineral Properties and Exploration Properties
The Company carries its mineral properties at cost less accumulated depletion and any accumulated provision for impairment. The costs of each property and related capitalized expenditures are depleted over the economic life of the property on a units-of-production basis. Costs are charged to the consolidated statement of income (loss) when a property is abandoned or when there is an impairment.
The Company undertakes a review of the carrying values of mining properties and related expenditures whenever events or changes in circumstances indicate that their carrying values may exceed their estimated net recoverable amounts determined by reference to estimated future operating results and discounted net cash flows. Where previous impairment has been recorded the Company analyzes any impairment reversal indicators. An impairment loss is recognized when the carrying value of those assets is not recoverable. In undertaking this review, management of the Company is required to make significant estimates of, amongst other things, future production and sales volumes, metal prices, foreign exchange rates, mineral resource and reserve quantities, future operating and capital costs to the end of the mine’s life, and reclamation costs. These estimates are subject to various risks and uncertainties which may ultimately have an effect on the expected recoverability of the carrying values of the mining properties and related expenditures.
The Company, from time to time, acquires exploration and development properties. When properties are acquired, the Company must determine the fair value attributable to each of the properties. When the Company conducts exploration on a mineral property and the results from the exploration do not support the carrying value, the property is written down to its new fair value which could have a material effect on the consolidated statement of financial position and the consolidated income statement.
Reclamation and Other Closure Provisions
The Company has obligations for reclamation and other closure activities related to its mining properties. The future obligations for mine closure activities are estimated by the Company using mine closure plans or other similar studies which outline the requirements that will be carried out to meet the obligations. Because the obligations are dependent on the laws and regulations of the countries in which the mines operate, the requirements could change as a result of amendments in the laws and regulations relating to environmental protection and other legislation affecting resource companies. As the estimate of the obligations is based on future expectations, a number of estimates and assumptions are made by management in the determination of closure provisions.
| Fortuna Silver Mines Inc. | (in US Dollars, tabular amounts in millions, except where noted) |
| Management’s Discussion and Analysis |
| For the three months ended March 31, 2021 |
Revenue Recognition
Revenue from the sale of concentrate to customer is recognized when the customer obtains control of the concentrate. A provisional invoice is issued to the customer based on the monthly average metal prices on the expected date of final settlement at which time the final sale prices will be fixed. Variations between the prices at initial recognition and final settlement may occur due to changes in the market metal prices and result in an embedded derivative in the accounts receivable. The embedded derivative is recorded at fair value each period until final settlement occurs with changes in the fair value classified as revenue. For changes in metal quantities upon receipt of new information and assays, the provisional sale quantities are adjusted.
Contingencies
Contingencies can be either possible assets or possible liabilities arising from past events which, by their nature, will only be resolved when one or more future events not within our control occur or fail to occur. The assessment of such contingencies inherently involves the exercise of significant judgment and estimates of the outcome of future events. In assessing loss contingencies related to legal proceedings that are pending against the Company or unasserted claims that may result in such proceedings or regulatory or government actions that may negatively impact our business or operations, the Company with assistance from its legal counsel evaluates the perceived merits of any legal proceedings or unasserted claims or actions.
A liability is recognized in the condensed interim consolidated financial statements when the outcome of the legal proceedings is probable, and the estimated settlement amount can be estimated reliably. Contingent assets are not recognized in the condensed interim consolidated financial statements until virtually certain.
In 2017, the Mexican Geological Service (“SGM”) advised the Company that a previous owner of one of the Company’s mineral concessions located at the San Jose Mine in Oaxaca, Mexico had granted the SGM a royalty of 3% of the billing value of minerals obtained from the concession. The Company, supported by legal opinions from three independent law firms, has previously advised the Mexican mining authorities that it is of the view that no royalty is payable, and in 2018 initiated administrative and legal proceedings (the “Administrative Proceedings”) in the Mexican Federal Administrative Court (“FAC”) against the Dirección General de Minas (“DGM”) to remove reference to the royalty on the title register.
Effective March 26, 2021, the FAC resolved against correcting the title register, on the basis that the previous owner of the mineral concession offered the disputed royalty to the SGM. The Company’s Mexican legal advisors are of the view that the resolution of the FAC is erroneous as the Judge failed to consider the relevant Mining Laws relating to royalties in place at the time of the grant of the mineral concession. The Company’s legal position with respect to the disputed royalty remains unchanged. The Company intends to vigorously defend its position and on April 21, 2021 filed an appeal to the resolution with the Collegiate Circuit Court in Mexico.
In January 2020, the Company received notice from the DGM seeking to cancel the mining concession if the royalty, in the Mexican peso equivalent of $30 million plus VAT (being the amount of the claimed royalty from 2011 to 2019), was not paid before March 15, 2020. In February 2020, the Company initiated legal proceedings (the “Amparo Proceedings”) against the DGM in the Juzgado Séptimo de Distrito en Materia Administrativa en la Ciudad de México (“District Court”) to contest and extinguish the cancellation procedure on the grounds that the royalty is not valid, and also to stay the cancellation process. The District Court in Mexico City admitted the Company’s legal proceedings on March 2, 2020 and granted a permanent stay of execution, which protects the Company from the cancellation of the concession until a final non-appealable resolution is reached on the legality of the DGM’s cancellation procedure.
| Fortuna Silver Mines Inc. | (in US Dollars, tabular amounts in millions, except where noted) |
| Management’s Discussion and Analysis |
| For the three months ended March 31, 2021 |
On November 27, 2020, the District Court at first instance found that the Company suffered no harm from the initiation of the cancellation procedure and dismissed the proceedings (the “Procedural Finding”) without deciding on the merit of the Amparo Proceedings and on the validity of the royalty. The Procedural Finding does not affect the permanent stay of execution, which remains in place. The Company’s Mexican advisors are of the view that the decision of the District Court is flawed. The Company’s legal position with respect to the disputed royalty remains unchanged. The Company intends to vigorously defend its position and has filed an appeal to the Procedural Finding with the Collegiate Court in Mexico. The previously obtained stay of execution protects the Company from the cancellation of the concession and remains in place until all avenues of appeal have been exhausted. In the event that the Company does not prevail in the appeal, it may be required to pay the disputed royalty in order to preserve the mining concession. If the Company is required to pay the royalty, it will do so from available capital resources.
The Company has determined that it is more likely than not that it will succeed in these proceedings; therefore, no provision has been recorded as at March 31, 2021 and December 31, 2020.
CRITICAL ACCOUNTING JUDGEMENTS IN APPLYING THE ENTITY’S ACCOUNTING POLICIES
Judgements that have the most significant effect on the amounts recognized in the Company’s condensed interim consolidated financial statements are as follows:
Income Taxes
Deferred tax assets and liabilities are determined based on differences between the financial statement carrying values of assets and liabilities and their respective income tax bases (“temporary differences”) and losses carried forward. The determination of the ability of the Company to utilize tax loss carry-forwards to offset deferred tax liabilities requires management to exercise judgment and make certain assumptions about the future performance of the Company.
Management is required to assess whether it is “probable” that the Company will benefit from these prior losses and other deferred tax assets. Changes in economic conditions, metal prices and other factors could result in revisions to the estimates of the benefits to be realized or the timing of utilization of the losses.
Assessment of Impairment and Reversal of Impairment Indicators
Management applies significant judgment in assessing whether indicators of impairment or reversal of impairment exist for an asset or a group of assets which could result in a testing for impairment. Internal and external factors such as significant changes in the use of the asset, commodity prices, life of mines, tax laws or regulations in the countries that our mines operate in and interest rates are used by management in determining whether there are any indicators of impairment or reversal of previous impairments.
Functional Currency
The functional currency for the Company and its subsidiaries is the currency of the primary economic environment in which each operates. The Company has determined that its functional currency and that of its subsidiaries is the U.S. dollar. The determination of functional currency may require certain judgments to determine the primary economic environment. The Company reconsiders the functional currency used when there is a change in the events and conditions which determined the primary economic environment.
IFRS 16 Leases
Significant estimates, assumptions and judgments made by management on adoption of IFRS 16 Leases primarily included judgement about whether the lease conveys the right to use a specific asset, whether the Company obtains substantially all of the economic benefits from the use of the asset, whether the Company has the right to direct the use of the asset, evaluating the appropriate discount rate to use to discount the lease liability for each lease or groups of assets, and to determine the lease term where a contract includes renewal options. Significant estimates, assumptions and judgements over these factors would affect the present value of the lease liabilities, as well as the associated amount of the ROU asset.
| Fortuna Silver Mines Inc. | (in US Dollars, tabular amounts in millions, except where noted) |
| Management’s Discussion and Analysis |
| For the three months ended March 31, 2021 |
CONTROLS AND PROCEDURES
Evaluation of Disclosure Controls and Procedures
Disclosure controls and procedures have been designed to provide reasonable assurance that all material information related to the Company is identified and communicated to management on a timely basis. Management of the Company, under the supervision of the President and Chief Executive Officer and the Chief Financial Officer, is responsible for the design and operation of disclosure controls and procedures in accordance with the requirements of National Instrument 52-109 of the Canadian Securities Administrators (“National Instrument 52-109”) and as defined in Rules 13a-15(e) and 15d-15(e) under the Securities Exchange Act of 1934, as amended (the U.S. Exchange Act).
Management’s Report on Internal Control over Financial Reporting
The Company’s internal control over financial reporting (“ICFR”) is designed to provide reasonable assurance regarding the reliability of financial reporting and preparation of financial statements for external reporting purposes in accordance with IFRS as issued by the International Accounting Standards Board. However, due to its inherent limitations, internal control over financial reporting may not prevent or detect all misstatements and fraud.
Management assesses the effectiveness of the Company’s internal control over financial reporting using the Internal Control – Integrated Framework (2013) issued by the Committee of Sponsoring Organization of the Treadway Commission (“COSO”). Management conducted an evaluation of the effectiveness of ICFR and concluded that it was effective as at December 31, 2020.
Changes in Internal Control over Financial Reporting
There have been no changes in the Company’s internal control over financial reporting during the three months ended March 31, 2021 that have materially affected, or are reasonably likely to materially affect, the Company’s internal control over financial reporting.
NON-IFRS FINANCIAL MEASURES
This MD&A refers to various Non-IFRS Financial Measures, including cash cost per payable ounce of silver equivalent; cash cost per tonne of processed ore; total production cash cost per tonne; all-in sustaining cash cost per payable ounce of silver equivalent sold; all-in cash cost per payable ounce of silver equivalent sold; cash cost per ounce of gold; all-in sustaining cash cost per ounce of gold sold; free cash flow and free cashflow from ongoing operations; adjusted net income; and adjusted EBITDA.
These measures are used by the Company to manage and evaluate operating performance and ability to generate cash flow and are widely reported in the mining industry as benchmarks for performance. The Company believes that certain investors use these Non-IFRS Financial Measures to evaluate the Company’s performance. However, the measures do not have a standardized meaning and may differ from measures used by other companies with similar descriptions. Accordingly, Non-IFRS Financial Measures should not be considered in isolation or as a substitute for measures of performance prepared in accordance with IFRS. The Company has calculated these measures consistently for all periods presented; in alignment with the World Gold Council (WGC”) standard for all-in sustaining cash cost and all-in cash cost, the company has presented the cash cost figures on a sold ounce basis for all periods presented, with the change from the previously presented figures on a produced ounce basis being applied retrospectively to prior periods.
To facilitate a better understanding of these measures as calculated by the Company, descriptions and reconciliations are provided here.
Cash Cost per Payable Ounce of Silver Equivalent Sold and Cash Cost per Tonne of Processed Ore
Cash cost per payable ounce of silver equivalent sold and total production cash cost per tonne of processed ore are key performance measures that management uses to monitor performance. Management believes that certain investors also use these Non-IFRS Financial Measures to evaluate the Company’s performance. Cash cost is an industry-standard method of comparing certain costs on a per unit basis; however, they do not have a standardized meaning or method of calculation, even though the descriptions of such measures may be similar. These performance measures have no meaning under IFRS, and, therefore, amounts presented may not be comparable with similar data presented by other mining companies.
| Fortuna Silver Mines Inc. | (in US Dollars, tabular amounts in millions, except where noted) |
| Management’s Discussion and Analysis | |
| |
| For the three months ended March 31, 2021 | |
The following tables present a reconciliation of cash cost per tonne of processed ore and cash cost per payable ounce of silver equivalent sold to the cost of sales in the condensed interim consolidated financial statements for the three months ended March 31, 2021 and 2020:
| SAN JOSE MINE | | | | | | |
| Three months ended March 31 | | | | | 2021 | | | 2020 | |
| Cost of sales | | | | | | | 28,708 | | | | 27,287 | |
| Changes in concentrate inventory | | | | | | | 29 | | | | (350 | ) |
| Depletion and depreciation in concentrate inventory | | | | | | | 14 | | | | 115 | |
| Inventory adjustment | | | | | | | 80 | | | | 120 | |
| IFRS 16 embedded lease adjustment | | | | | | | 44 | | | | 6 | |
| Royalties and mining taxes | | | | | | | (1,343 | ) | | | (890 | ) |
| Workers participation | | | | | | | (1,709 | ) | | | (1,286 | ) |
| Depletion and depreciation | | | | | | | (7,604 | ) | | | (7,447 | ) |
| Cash cost | | | A | | | | 18,219 | | | | 17,555 | |
| Total processed ore (tonnes) | | | B | | | | 259,803 | | | | 246,826 | |
| Cash cost per tonne of processed ore ($/t) | | | =A/B | | | | 70.13 | | | | 71.12 | |
| Cash cost | | | A | | | | 18,219 | | | | 17,555 | |
| Changes in concentrate inventory | | | | | | | (29 | ) | | | 350 | |
| Depletion and depreciation in concentrate inventory | | | | | | | (14 | ) | | | (115 | ) |
| Inventory adjustment | | | | | | | (80 | ) | | | (120 | ) |
| Treatment charges | | | | | | | (239 | ) | | | (323 | ) |
| Refining charges | | | | | | | 1,014 | | | | 903 | |
| Cash cost applicable per payable ounce sold | | | C | | | | 18,871 | | | | 18,250 | |
| Payable ounces of silver equivalent sold1 | | | D | | | | 2,245,819 | | | | 2,438,937 | |
| Cash cost per ounce of payable silver equivalent sold2 ($/oz) | | | =C/D | | | | 8.40 | | | | 7.48 | |
| Mining cost per tonne | | | | | | | 37.52 | | | | 35.48 | |
| Milling cost per tonne | | | | | | | 16.83 | | | | 19.18 | |
| Indirect cost per tonne | | | | | | | 10.64 | | | | 9.21 | |
| Community relations cost per tonne | | | | | | | 0.32 | | | | 0.64 | |
| Distribution cost per tonne | | | | | | | 4.82 | | | | 6.61 | |
| Total production cost per tonne | | | | | | | 70.13 | | | | 71.12 | |
| | | | | | | | | | | | | |
| 1 Silver equivalent sold for Q1 2021 is calculated using a silver to gold ratio of 68.1:1 (Q1 2020: 97.7:1). |
| 2 Silver equivalent is calculated using the realized prices for gold and silver. Refer to Financial Results - Sales and Realized Prices. |
| Fortuna Silver Mines Inc. | (in US Dollars, tabular amounts in millions, except where noted) |
| Management’s Discussion and Analysis | |
| |
| For the three months ended March 31, 2021 | |
| CAYLLOMA MINE | | | | | | |
| Three months ended March 31 | | | | | 2021 | | | 2020 | |
| Cost of sales | | | | | | | 15,617 | | | | 12,790 | |
| Changes in concentrate inventory | | | | | | | 65 | | | | 1,827 | |
| Depletion and depreciation in concentrate inventory | | | | | | | 4 | | | | (526 | ) |
| IFRS 16 embedded lease adjustment | | | | | | | 648 | | | | 568 | |
| Royalties and mining taxes | | | | | | | (27 | ) | | | (166 | ) |
| Provision for community support | | | | | | | - | | | | 72 | |
| Workers participation | | | | | | | (640 | ) | | | (20 | ) |
| Depletion and depreciation | | | | | | | (4,061 | ) | | | (3,816 | ) |
| Cash cost | | | A | | | | 11,606 | | | | 10,729 | |
| Total processed ore (tonnes) | | | B | | | | 131,887 | | | | 132,741 | |
| Cash cost per tonne of processed ore ($/t) | | | =A/B | | | | 88.00 | | | | 80.83 | |
| Cash cost | | | A | | | | 11,606 | | | | 10,729 | |
| Changes in concentrate inventory | | | | | | | (65 | ) | | | (1,827 | ) |
| Depletion and depreciation in concentrate inventory | | | | | | | (4 | ) | | | 526 | |
| Treatment charges | | | | | | | 3,157 | | | | 4,462 | |
| Refining charges | | | | | | | 405 | | | | 324 | |
| Cash cost applicable per payable ounce sold | | | C | | | | 15,099 | | | | 14,214 | |
| Payable ounces of silver equivalent sold1 | | | D | | | | 1,103,000 | | | | 1,027,096 | |
| Cash cost per ounce of payable silver equivalent sold2 ($/oz) | | | =C/D | | | | 13.69 | | | | 13.84 | |
| Mining cost per tonne | | | | | | | 36.89 | | | | 40.03 | |
| Milling cost per tonne | | | | | | | 13.57 | | | | 13.95 | |
| Indirect cost per tonne | | | | | | | 29.56 | | | | 20.29 | |
| Community relations cost per tonne | | | | | | | 0.55 | | | | 0.40 | |
| Distribution cost per tonne | | | | | | | 7.43 | | | | 6.16 | |
| Total production cost per tonne | | | | | | | 88.00 | | | | 80.83 | |
| | | | | | | | | | | | | |
| 1 Silver equivalent sold for Q1 2021 is calculated using a silver to gold ratio of 67.5:1 (Q1 2020: 90.5:1) , silver to lead ratio of 1:28.6 pounds (Q1 2020: 1:20.7), and silver to zinc ratio of 1:21.1 pounds (Q1 2020: 1:17.9). |
| 2 Silver equivalent is calculated using the realized prices for gold, silver, lead, and zinc. Refer to Financial Results - Sales and Realized Prices. |
Cash Cost per Ounce of Gold Sold
Cash cost per payable ounce of gold sold is a key performance measures that management uses to monitor performance. Management believes that certain investors also use these Non-IFRS Financial Measures to evaluate the Company’s performance. Cash cost is an industry-standard method of comparing certain costs on a per unit basis; however, they do not have a standardized meaning or method of calculation, even though the descriptions of such measures may be similar. These performance measures have no meaning under IFRS, and, therefore, amounts presented may not be comparable with similar data presented by other mining companies.
The following tables present a reconciliation of cash cost per ounce of gold sold to the cost of sales in the condensed interim consolidated financial statements for the three months ended March 31, 2021 and 2020:
| LINDERO MINE | | | | | | |
| Three months ended March 31 | | | | | 2021 | | | 2020 | |
| Cost of sales | | | | | | | 22,186 | | | | - | |
| IFRS 16 embedded lease adjustment | | | | | | | 518 | | | | - | |
| Export duties | | | | | | | (2,800 | ) | | | - | |
| Depletion and depreciation | | | | | | | (6,245 | ) | | | - | |
| By product credits | | | | | | | (58 | ) | | | - | |
| Treatment charges | | | | | | | 10 | | | | - | |
| Cash cost applicable per gold ounce sold | | | A | | | | 13,611 | | | | - | |
| Ounces of gold sold | | | B | | | | 21,289 | | | | - | |
| Cash cost per ounce of gold sold ($/oz) | | | =A/B | | | | 639 | | | | - | |
| Fortuna Silver Mines Inc. | (in US Dollars, tabular amounts in millions, except where noted) |
| Management’s Discussion and Analysis | |
| |
| For the three months ended March 31, 2021 | |
All-in Sustaining Cash Cost and All-in Cash Cost per Payable Ounce of Silver Equivalent Sold
The Company believes that “all-in-sustaining cash cost silver equivalent” and “all-in cash cost silver equivalent” meet the needs of management, analysts, investors, and other stakeholders of the Company in understanding the costs associated with producing silver, the economics of silver mining, the Company’s operating performance and the Company’s ability to generate cash flow from current operations, and on an overall company basis.
The Company, in conjunction with an initiative undertaken within the gold mining industry, has adopted an all-in-sustaining cost performance measure; however, this performance measure has no standardized meaning. The Company conforms its all-in-sustaining cost definition to that set out in the guidance issued by the WGC.
All-in-sustaining cash cost silver equivalent and all-in cash cost silver equivalent are intended to provide additional information only and do not have standardized definitions under IFRS and should not be considered in isolation or as a substitute for measures of performance prepared in accordance with IFRS. These measures are not necessarily indicative of operating profit or cash flow from operations as determined under IFRS. Although the WGC has published a standardized definition, companies may calculate these measures differently.
All-in sustaining cash cost includes total production cash costs incurred at the Company’s mining operations. Sustaining capital expenditures, corporate selling, general and administrative expenses, and brownfield exploration expenditures are added to the cash cost to calculate the all-in-sustaining cost. The Company believes that this measure represents the total costs of selling silver from operations and provides the Company and its stakeholders with additional information on the Company’s operational performance and the ability to generate cash flows. Certain cash expenditures such as new project spending, tax payments, dividends, and financing costs are not included. We report this measure on a payable silver equivalent ounce sold basis. Silver equivalent sold is calculated taking the total metal payable sales of gold, lead and zinc multiplied by the realized prices of gold, lead, and zinc and divided by the realized silver price to calculate the silver equivalent sold.
The following tables show a breakdown of the all-in sustaining cash cost per silver equivalent ounce payable for the three months ended March 31, 2021 and 2020:
| SAN JOSE MINE | | | |
| Three months ended March 31 | | 2021 | | | 2020 | |
| Cash cost applicable | | | 18,871 | | | | 18,127 | |
| Royalties and mining taxes | | | 3,683 | | | | 1,599 | |
| Workers' participation | | | 2,136 | | | | 1,607 | |
| General and administrative expenses (operations) | | | 1,675 | | | | 1,421 | |
| Adjusted operating cash cost | | | 26,365 | | | | 22,754 | |
| Sustaining capital expenditures3 | | | 1,987 | | | | 1,573 | |
| Brownfields exploration expenditures3 | | | 1,736 | | | | 1,306 | |
| All-in sustaining cash cost | | | 30,088 | | | | 25,633 | |
| Non-sustaining capital expenditures3 | | | 274 | | | | 127 | |
| All-in cash cost | | | 30,362 | | | | 25,760 | |
| Payable ounces of silver equivalent sold1 | | | 2,245,819 | | | | 2,402,847 | |
| All-in sustaining cash cost per ounce of payable silver equivalent sold2 | | | 13.40 | | | | 10.67 | |
| All-in cash cost per ounce of payable silver equivalent sold2 | | | 13.52 | | | | 10.72 | |
| | | | | | | | | |
| 1 Silver equivalent sold for Q1 2021 is calculated using a silver to gold ratio of 68.1:1 (Q1 2020: 97.7:1). |
| 2 Silver equivalent is calculated using the realized prices for gold and silver. Refer to Financial Results - Sales and Realized Prices. |
| 3 Presented on a cash basis. |
| Fortuna Silver Mines Inc. | (in US Dollars, tabular amounts in millions, except where noted) |
| Management’s Discussion and Analysis | |
| |
| For the three months ended March 31, 2021 | |
| CAYLLOMA MINE | | | |
| Three months ended March 31 | | 2021 | | | 2020 | |
| Cash cost applicable | | | 15,099 | | | | 16,166 | |
| Royalties and mining taxes | | | 688 | | | | 300 | |
| Workers' participation | | | 736 | | | | 25 | |
| General and administrative expenses (operations) | | | 1,278 | | | | 1,042 | |
| Adjusted operating cash cost | | | 17,801 | | | | 17,533 | |
| Sustaining capital expenditures3 | | | 1,972 | | | | 1,874 | |
| Brownfields exploration expenditures3 | | | 630 | | | | 263 | |
| All-in sustaining cash cost | | | 20,403 | | | | 19,670 | |
| All-in cash cost | | | 20,403 | | | | 19,670 | |
| Payable ounces of silver equivalent sold1 | | | 1,103,000 | | | | 1,176,927 | |
| All-in sustaining cash cost per ounce of payable silver equivalent sold2 | | | 18.50 | | | | 16.71 | |
| All-in cash cost per ounce of payable silver equivalent sold2 | | | 18.50 | | | | 16.71 | |
| 1 Silver equivalent sold for Q1 2021 is calculated using a silver to gold ratio of 67.5:1 (Q1 2020: 90.5:1), silver to lead ratio of 1:28.6 pounds (Q1 2020: 1:20.7), and silver to zinc ratio of 1:21.1 pounds (Q1 2020: 1:17.9). |
| 2 Silver equivalent is calculated using the realized prices for gold, silver, lead, and zinc. Refer to Financial Results - Sales and Realized Prices. |
| 3 Presented on a cash basis. |
All-in Sustaining Cash Cost per Ounce of Gold Sold
The Company believes that “all-in-sustaining cash cost gold” meet the needs of management, analysts, investors, and other stakeholders of the Company in understanding the costs associated with producing silver, the economics of silver mining, the Company’s operating performance and the Company’s ability to generate cash flow from current operations, and on an overall company basis.
The Company, in conjunction with an initiative undertaken within the gold mining industry, has adopted an all-in-sustaining cost performance measure; however, this performance measure has no standardized meaning. The Company conforms its all-in-sustaining cost definition to that set out in the guidance issued by the World Gold Council (“WGC”).
All-in-sustaining cash cost per ounce of gold sold is intended to provide additional information only and do not have standardized definitions under IFRS and should not be considered in isolation or as a substitute for measures of performance prepared in accordance with IFRS. These measures are not necessarily indicative of operating profit or cash flow from operations as determined under IFRS. Although the WGC has published a standardized definition, companies may calculate these measures differently.
All-in sustaining cash cost includes total production cash costs incurred at the Company’s mining operations. Sustaining capital expenditures, corporate selling, general and administrative expenses, and brownfield exploration expenditures are added to the cash cost to calculate the all-in-sustaining cost. The Company believes that this measure represents the total costs of selling gold from operations and provides the Company and its stakeholders with additional information on the Company’s operational performance and the ability to generate cash flows. Certain cash expenditures such as new project spending, tax payments, dividends, and financing costs are not included.
| LINDERO MINE | | | |
| Three months ended March 31 | | 2021 | | | 2020 | |
| Cash cost applicable | | | 13,611 | | | | - | |
| Export duties and mining taxes | | | 3,581 | | | | - | |
| General and administrative expenses (operations) | | | 1,138 | | | | - | |
| Adjusted operating cash cost | | | 18,330 | | | | - | |
| Sustaining capital expenditures1 | | | 4,040 | | | | - | |
| Brownfields exploration expenditures1 | | | 91 | | | | - | |
| All-in sustaining cash cost | | | 22,461 | | | | - | |
| Ounces of gold sold | | | 21,289 | | | | - | |
| All-in sustaining cash cost per ounce of gold sold | | | 1,055 | | | | - | |
| | | | | | | | | |
| 1 Presented on a cash basis. |
| Fortuna Silver Mines Inc. | (in US Dollars, tabular amounts in millions, except where noted) |
| Management’s Discussion and Analysis | |
| |
| For the three months ended March 31, 2021 | |
Free Cash Flow From Ongoing Operations
The Company uses the financial measure of “free cash flow from ongoing operations” to supplement information in its condensed interim consolidated financial statements. Free cash flow from ongoing operations is defined as cash provided from operating activities, including Lindero commissioning, less changes in long-term receivable sustaining capital expenditures, less current income tax expense, add back impact from adoption of new or amended accounting standards, and add back income taxes paid. This measure is used by the Company and investors to measure the cash flow available to fund the Company’s growth through investments and capital expenditures. These performance measures are intended to provide additional information only and do not have standardized definitions under IFRS and should not be considered in isolation or as a substitute for measures of performance prepared in accordance with IFRS. These measures are not necessarily indicative of operating profits or cash flow from operations as determined under IFRS.
The following table presents a reconciliation of free cash flow from ongoing operations for the three months ended March 31, 2021 and 2020:
| Three months ended March 31 | | 2021 | | | 2020 | |
| | | | | | (Restated) | |
| Net cash provided by operating activities | | | 21.1 | | | | 3.7 | |
| Change in long-term receivables | | | - | | | | (0.2 | ) |
| Additions to sustaining capital | | | (9.3 | ) | | | (4.9 | ) |
| Impact of adoption in IAS 16 | | | - | | | | 9.5 | |
| Current income tax expense | | | (14.0 | ) | | | (5.9 | ) |
| Income taxes paid | | | 19.6 | | | | 12.0 | |
| Free cash flow from ongoing operations | | | 17.4 | | | | 14.2 | |
Adjusted Net Income
The Company uses the financial measure of “adjusted net income” to supplement information in its condensed interim consolidated financial statements. Adjusted net income is defined as net income (loss) for the period adding back foreign exchange losses and other expenses and subtracting investment income related to the Lindero Mine and other non-cash items. The Company believes that in addition to conventional measures prepared in accordance with IFRS, the Company and certain investors and analysts use this information and information obtained from conventional IFRS measures to evaluate the Company’s performance. The term “adjusted net income” does not have a standardized meaning prescribed by IFRS, and therefore the Company’s definitions are unlikely to be comparable to similar measures presented by other companies.
The following table presents a reconciliation of the adjusted net income for the three months ended March 31, 2021 and 2020:
| Three months ended March 31 | | 2021 | | | 2020 | |
| Net income (loss) | | | 26.4 | | | | (4.5 | ) |
| Adjustments, net of tax: | | | | | | | | |
| Foreign exchange loss, Lindero Mine | | | 2.2 | | | | 3.3 | |
| Investment income | | | - | | | | (1.1 | ) |
| Other non-cash items | | | (1.1 | ) | | | 0.1 | |
| Adjusted net income (loss) | | | 27.5 | | | | (2.2 | ) |
| Fortuna Silver Mines Inc. | (in US Dollars, tabular amounts in millions, except where noted) |
| Management’s Discussion and Analysis | |
| |
| For the three months ended March 31, 2021 | |
Adjusted EBITDA
The Company uses other financial measures whose presentation is not meant to be a substitute for other subtotals or totals presented in accordance with IFRS measures, but that rather should be evaluated in conjunction with IFRS measures. The item described and presented below does not have a standardized meaning prescribed by IFRS, and therefore the Company’s definitions are unlikely to be comparable to similar measures presented by other companies. The Company believes that its presentation provides useful information for investors.
The following table presents a reconciliation of Adjusted EBITDA for the three months ended March 31, 2021 and 2020:
| Three months ended March 31 | | 2021 | | | 2020 | |
| Net income (loss) | | | 26.4 | | | | (4.5 | ) |
| Adjustments: | | | | | | | | |
| Inventory adjustment | | | (0.1 | ) | | | (0.1 | ) |
| Foreign exchange loss, Lindero Mine | | | 2.2 | | | | 3.3 | |
| Net finance items | | | 2.4 | | | | 0.4 | |
| Depreciation, depletion, and amortization | | | 19.2 | | | | 11.5 | |
| Income taxes | | | 13.3 | | | | 7.1 | |
| Investment income | | | - | | | | (1.1 | ) |
| Other non-cash items | | | (2.6 | ) | | | (0.7 | ) |
| Adjusted EBITDA | | | 60.8 | | | | 15.9 | |
| San Jose Mine | | | | | | |
| Three months ended March 31 | | 2021 | | | 2020 | |
| Net income | | | 16.4 | | | | 3.1 | |
| Adjustments: | | | | | | | | |
| Inventory adjustment | | | (0.1 | ) | | | (0.1 | ) |
| Net finance items | | | 0.1 | | | | 0.1 | |
| Depreciation, depletion, and amortization | | | 8.1 | | | | 7.4 | |
| Income taxes | | | 8.8 | | | | 5.0 | |
| Other non-cash items | | | (0.1 | ) | | | (0.1 | ) |
| Adjusted EBITDA | | | 33.2 | | | | 15.4 | |
| Caylloma Mine | | | | | | |
| Three months ended March 31 | | 2021 | | | 2020 | |
| Net income (loss) | | | 5.1 | | | | (2.1 | ) |
| Adjustments: | | | | | | | | |
| Net finance items | | | 0.1 | | | | 0.2 | |
| Depreciation, depletion, and amortization | | | 4.6 | | | | 3.8 | |
| Income taxes | | | 3.0 | | | | 0.3 | |
| Other non-cash items | | | (0.9 | ) | | | (0.7 | ) |
| Adjusted EBITDA | | | 11.9 | | | | 1.5 | |
| Lindero Mine | | | | | | |
| Three months ended March 31 | | 2021 | | | 2020 | |
| Net income (loss) | | | 10.7 | | | | (2.2 | ) |
| Adjustments: | | | | | | | | |
| Foreign exchange loss, Lindero Mine | | | 2.2 | | | | 3.3 | |
| Net finance items | | | 0.2 | | | | - | |
| Depreciation, depletion, and amortization | | | 6.4 | | | | - | |
| Income taxes | | | 0.8 | | | | - | |
| Investment income | | | - | | | | (1.1 | ) |
| Other non-cash items | | | (0.7 | ) | | | (0.1 | ) |
| Adjusted EBITDA | | | 19.6 | | | | (0.1 | ) |
| Fortuna Silver Mines Inc. | (in US Dollars, tabular amounts in millions, except where noted) |
| Management’s Discussion and Analysis | |
| |
| For the three months ended March 31, 2021 | |
Qualified Person
Eric Chapman, P.Geo (APEGBC #36328) is the Vice-President of Technical Services for the Company and is the Company’s Qualified Person (as defined by National Instrument 43-101). Mr. Chapman has reviewed and approved the scientific and technical information contained in this MD&A and has verified the underlying data.
Other Information, Risks and Uncertainties
For further information regarding the Company’s operational risks, please refer to the section entitled “Description of the Business - Risk Factors” in the Company’s most recent Annual Information Form that is available at www.sedar.com and www.sec.gov/edgar.shtml.
CAUTIONARY STATEMENT ON FORWARD-LOOKING STATEMENTS
This MD&A and any documents incorporated by reference into this MD&A contain forward-looking statements which constitute forward-looking statements within the meaning of the U.S. Private Securities Litigation Reform Act of 1995 and Section 21E of the United States Securities Exchange Act of 1934, as amended, and forward-looking information within the meaning of applicable Canadian securities legislation (collectively, “Forward-looking Statements”). All statements included herein, other than statements of historical fact, are Forward-looking Statements and are subject to a variety of known and unknown risks and uncertainties which could cause actual events or results to differ materially from those reflected in the Forward-Looking Statements. The Forward-looking Statements in this MD&A include, without limitation, statements relating to:
| · | mineral “reserves” and “resources” as they involve the implied assessment, based on estimates and assumptions that the reserves and resources described exist in the quantities predicted or estimated and can be profitably produced in the future; |
| · | the potential impact of COVID-19 on the Company’s business and operations, and financial condition, including the Company’s ability to operate or to continue operating at its sites; |
| · | the Company’s ability to manage challenges presented by COVID-19; |
| · | achieving the targets set out in the Company’s cost reduction programs; |
| · | the effectiveness of the preventative measures and safety protocols put in place by the Company to curb the spread of COVID-19; |
| · | escalation of travel restrictions resulted from COVID-19; |
| · | production rates and forecasted production for 2021 at the Company’s mines; |
| · | production rates at the Company’s properties; |
| · | timing for delivery of materials and equipment for the Company’s properties; |
| · | the sufficiency of the Company’s cash position and its ability to raise equity capital or access debt facilities; |
| · | the Company’s planned greenfields exploration programs; |
| · | the Company’s planned capital expenditures and brownfields exploration at the San Jose Mine; |
| · | the Company’s planned capital expenditures and brownfields exploration at the Caylloma Mine; |
| · | the Company’s planned capital expenditures and brownfields exploration at the Lindero Mine; |
| · | the anticipated timing for the completion of ramp up in production at the Lindero Mine; |
| · | the final budgeted construction cost for the Lindero Mine; |
| · | the anticipated completion of the announced transaction with Roxgold and the timing and the benefits thereof; |
| · | maturities of the Company’s financial liabilities, finance leases and other contractual commitments; |
| · | expiry dates of bank letters of guarantee; |
| · | estimated mine closure costs; and |
| · | management’s expectation that any investigations, claims, and legal, labour and tax proceedings arising in the ordinary course of business will not have a material effect on the results of operations or financial condition of the Company. |
| Fortuna Silver Mines Inc. | (in US Dollars, tabular amounts in millions, except where noted) |
| Management’s Discussion and Analysis |
| For the three months ended March 31, 2021 |
Often, but not always, these Forward-looking Statements can be identified by the use of words such as “anticipates”, “believes”, “plans”, “estimates”, “expects”, “forecasts”, “scheduled”, “targets”, “possible”, “strategy”, “potential”, “intends”, “advance”, “goal”, “objective”, “projects”, “budget”, “calculates” or statements that events, “will”, “may”, “could” or “should” occur or be achieved and similar expressions, including negative variations.
Forward-looking Statements involve known and unknown risks, uncertainties and other factors which may cause the actual results, performance or achievements of the Company to be materially different from any results, performance or achievements expressed or implied by the Forward-looking Statements. Such uncertainties and factors include, among others:
| • | operational risks relating to mining and mineral processing; |
| • | uncertainty relating to Mineral Resource and Mineral Reserve estimates; |
| • | uncertainty relating to capital and operating costs, production schedules and economic returns; |
| • | uncertainty and risks related to the ramp up in production at the Lindero Mine; |
| • | uncertainty relating to new mining operations and development projects such as the Lindero Mine including the possibility that actual capital and operating costs and economic returns will differ significantly from those estimated for such projects prior to production; |
| • | failure to obtain any required regulatory and other approvals (or to do so in a timely manner) in connection with the announced transaction with Roxgold; |
| • | the anticipated timeline for the completion of the transaction with Roxgold may change for a number of reasons, including the inability to secure the necessary regulatory approvals or other approvals in the time assumed, developments with respect to the COVID-19 pandemic or the need for additional time to satisfy the conditions to the completion of the transaction; |
| • | risks associated with mineral exploration and project development; |
| • | uncertainty relating to the repatriation of funds as a result of currency controls; |
| • | environmental matters including obtaining or renewing environmental permits and potential liability claims; |
| • | uncertainty relating to nature and climate conditions; |
| • | risks associated with political instability and changes to the regulations governing the Company’s business operations; |
| • | changes in national and local government legislation, taxation, controls, regulations and political or economic developments in countries in which the Company does or may carry on business; |
| • | risks relating to the termination of the Company’s mining concessions in certain circumstances; |
| • | risks related to International Labour Organization (“ILO”) Convention 169 compliance; |
| • | developing and maintaining relationships with local communities and stakeholders; |
| • | risks associated with losing control of public perception as a result of social media and other web-based applications; |
| • | potential opposition of the Company’s exploration, development and operational activities; |
| • | risks related to the Company’s ability to obtain adequate financing for planned exploration and development activities; |
| • | substantial reliance on the Caylloma Mine, the San Jose Mine, and the Lindero Mine for revenues; |
| • | risks relating to the integration of businesses and assets acquired by the Company; |
| • | risks associated with climate change legislation; |
| Fortuna Silver Mines Inc. | (in US Dollars, tabular amounts in millions, except where noted) |
| Management’s Discussion and Analysis |
| For the three months ended March 31, 2021 |
| • | reliance on key personnel; |
| • | uncertainty relating to potential conflicts of interest involving the Company’s directors and officers; |
| • | risks associated with the Company’s reliance on local counsel and advisors and the experience of its management and board of directors in foreign jurisdictions; |
| • | adequacy of insurance coverage; |
| • | risks related to the Company’s compliance with the United States Sarbanes-Oxley Act; |
| • | risks related to the foreign corrupt practices regulations and anti-bribery laws; |
| • | potential legal proceedings to which it is a party; |
| • | the Company is subject to any adverse ruling in any of the litigation; |
| • | uncertainties relating to general economic conditions; |
| • | risks relating to a global pandemic, which until contained could continue to cause a slowdown in global economic growth and impact the Company’s business, operations, financial condition and share price; |
| • | the duration of the COVID-19 pandemic and the impact of COVID-19 on the Company’s business, operations and financial condition, including the Company’s ability operate or continue to operate at its sites in light of government restrictions; |
| • | possible future suspensions of operations at the mine sites or the Lindero Mine related to COVID-19; |
| • | the Company’s ability to manage the various challenges (both anticipated and not) presented by COVID-19 to its business, operations and financial condition; |
| • | fluctuations in metal prices; |
| • | risks associated with entering into commodity forward and option contracts for base metals production; |
| • | fluctuations in currency exchange rates; |
| • | failure to meet covenants under its Credit Facilities |
| • | tax audits and reassessments; |
| • | uncertainty relating to concentrate treatment charges and transportation costs; |
| • | sufficiency of monies allotted by the Company for land reclamation; |
| • | risks associated with dependence upon information technology systems, which are subject to disruption, damage, failure and risks with implementation and integration; |
| • | risks related to the volatility of the trading price of the Company’s common shares (“Common Shares”) and the Company’s Debentures (as defined herein); |
| • | dilution from further equity or convertible debenture financings; and |
| • | risks associated with dependence upon information technology systems, which are subject to disruption, damage, failure and risks with implementation and integration; |
| • | risks related to future insufficient liquidity resulting from a decline in the price of the Common Shares or Debentures; |
| • | uncertainty relating to the Company’s ability to pay dividends in the future; |
| • | risks relating to the market for the Company’s securities; |
| • | risks relating to the Debentures of the Company; and |
| • | uncertainty relating to the enforcement of U.S. judgments against the Company. |
as well as those factors referred to in the “Risks and Uncertainties” section in this MD&A and in the “Risk Factors” section in our Annual Information Form filed with the Canadian Securities Administrators and available at www.sedar.com and filed with the U.S. Securities and Exchange Commission as part of the Company’s Form 40-F and available at www.sec.gov/edgar.shtml. Although the Company has attempted to identify important factors that could cause actual actions, events or results to differ materially from those described in Forward-looking Statements, there may be other factors that cause actions, events or results not to be as anticipated, estimated or intended.
| Fortuna Silver Mines Inc. | (in US Dollars, tabular amounts in millions, except where noted) |
| Management’s Discussion and Analysis |
| For the three months ended March 31, 2021 |
Forward-looking Statements contained in this MD&A are based on the assumptions, beliefs, expectations and opinions of management, including but not limited to:
| · | all required third party contractual, regulatory and governmental approvals will be obtained for the exploration, development, construction and production of its properties; |
| · | there being no significant disruptions affecting operations, whether relating to labour, supply, power, damage to equipment or other matter; |
| · | the world-wide economic and social impact of COVID-19 is managed, and the duration and extent of the coronavirus pandemic is minimized or not long-term; |
| · | there being no material and negative impact to the various contractors, suppliers and subcontractors at the Company’s mine sites as a result of COVID-19 or otherwise that would impair their ability to provide goods and services; |
| · | permitting, construction, development, expansion, and production continuing on a basis consistent with the Company’s current expectations; |
| · | expected trends and specific assumptions regarding metal prices and currency exchange rates; |
| · | prices for and availability of fuel, electricity, parts and equipment and other key supplies remaining consistent with current levels; |
| · | production forecasts meeting expectations; and |
| · | the accuracy of the Company’s current mineral resource and reserve estimates. |
These Forward-looking Statements are made as of the date of this MD&A. There can be no assurance that Forward-looking Statements will prove to be accurate, as actual results and future events could differ materially from those anticipated in such statements. Accordingly, readers are cautioned not to place undue reliance on Forward-looking Statements. Except as required by law, the Company does not assume the obligation to revise or update these forward looking-statements after the date of this document or to revise them to reflect the occurrence of future unanticipated events.
CAUTIONARY NOTE TO UNITED STATES INVESTORS CONCERNING ESTIMATES OF RESERVES AND RESOURCES
Reserve and resource estimates included in this Management’s Discussion and Analysis have been prepared in accordance with National Instrument 43-101 Standards of Disclosure for Mineral Projects ("NI 43-101") and the Canadian Institute of Mining, Metallurgy, and Petroleum Definition Standards on Mineral Resources and Mineral Reserves. NI 43-101 is a rule developed by the Canadian Securities Administrators that establishes standards for public disclosure by a Canadian company of scientific and technical information concerning mineral projects. Unless otherwise indicated, all mineral reserve and mineral resource estimates contained in the technical disclosure referred to herein have been prepared in accordance with NI 43-101 and the Canadian Institute of Mining, Metallurgy and Petroleum Definition Standards on Mineral Resources and Reserves.
Canadian standards, including NI 43-101, differ significantly from the requirements of the Securities and Exchange Commission, and mineral reserve and resource information included in this Management’s Discussion and Analysis may not be comparable to similar information disclosed by U.S. companies.