Celsius Holdings Reports Fourth Quarter and Full-Year 2023 Financial Results
Record fourth quarter revenue of $347 million, up 95% from $178 million in Q4 2022 and
record full year revenue of $1,318 million, up 102% from $654 million in full year 2022
Celsius achieved record fourth quarter revenue of $347 million, up 95% from $178 million for the prior year fourth quarter, driven predominantly by North American revenue, which increased 97% to $333 million, up from $169 million for the prior year fourth quarter. North American revenue was driven by expansion in total distribution points and higher SKUs per location. International revenue increased 68% to $14.6 million for the fourth quarter of 2023, from $8.7 million for the prior year quarter, driven in large part by new flavor launches, product availability and increased velocity.
Gross profit for the fourth quarter of 2023 was $166 million, up 110% from $79 million for the prior year fourth quarter. Gross profit as a percentage of revenue was 47.8% for the three months ended December 31, 2023, up from 44.4% for the prior year fourth quarter. The 340 basis point improvement in gross profit margin was attributed to efficiencies in raw material sourcing, product waste reduction, and benefits from improved leverage across promotional allowances.
Net income attributable to common stockholders for the fourth quarter of 2023 totaled $39 million, or $0.17 per diluted share, compared to a net loss of $28 million, or $(0.12) per diluted share, for the prior year fourth quarter.
Non-GAAP Adjusted EBITDA* increased 387% to approximately $65 million, compared to $13 million for the prior year fourth quarter, driven by substantial revenue growth and improved gross margins, as well as continued leverage across SG&A.
As of December 31, 2023, Celsius had $756 million in cash and cash equivalents, none of which was restricted, as compared to $653 million as of December 31, 2022, which included $39 million in restricted cash related to distributor termination payments.
“During the fourth quarter of 2023, Celsius delivered record revenue of $347 million and more than $39 million in net income, driven by expanded availability of our products and increased consumer awareness. We continued to drive growth of the category by bringing in new loyal consumers, as well as increasing consumption occasions,” commented John Fieldly, Chairman and Chief Executive Officer.
| | | | | | | | | | | | | | | | | | | | | | | |
| Summary Financials | 4Q 2023 | 4Q 2022 | % Change | FY 2023 | FY 2022 | % Change |
| $(000)’s |
| Revenue | $347.4 | $178.0 | 95% | $1,318.0 | $653.6 | 102% |
| N. America | $332.8 | $169.3 | 97% | $1,263.3 | $617.5 | 105% |
| International | $14.6 | $8.7 | 68% | $54.7 | $36.1 | 52% |
| Gross Margin % | 47.8% | 44.4% | +340 BPS | 48.0% | 41.4% | +660 BPS |
| Net Income att. to Common Shareholders | $39.1 | $(28.2) | 239% | $182.0 | $(198.8) | 192% |
| Diluted Earnings per Share | $0.17 | $(0.12) | 242% | $0.77 | $(0.88) | 188% |
| Adjusted EBITDA* | $65.2 | $13.4 | 387% | $295.6 | $71.1 | 316% |
*The Company reports financial results in accordance with generally accepted accounting principles in the United States (“GAAP”), but management believes that disclosure of Adjusted EBITDA, a non-GAAP financial measure that management uses to assess our performance, may provide users with additional insights into operating performance. Please see “Use of Non-GAAP Measures” and reconciliations of this non-GAAP measure to the most directly comparable GAAP measure, both of which can be found below.
| | | | | | | | | | | | | | | | | |
| 2023 Full Year Financial Highlights |
Celsius achieved record revenue of $1.32 billion for the year ended 2023, up 102% from $654 million for the prior year. North American revenue grew 105% to $1.26 billion for the year ended December 31, 2023, from $617 million for the prior full year driven by continued gains in distribution points and SKUs per location. International revenue increased by 52% to $55 million for the year ended December 31, 2023, from $36 million for the prior year, driven in large part by successful innovation launches, increased velocity, and brand awareness.
Gross profit for the year ended December 31, 2023, was $633 million, an increase of 134% from $271 million for the prior year. Gross profit as a percentage of revenue was 48.0% for the year ended December 31, 2023, up from 41.4% for the prior year. Gross profit margin improvements were attributed to efficiencies in raw material sourcing and product waste reduction.
Net income attributable to common stockholders totaled $182.0 million, or $0.77 per diluted share, for the year ended December 31, 2023, compared to a net loss of $198.8 million, or $(0.88) per diluted share, for the prior year.
Non-GAAP Adjusted EBITDA increased 316% to approximately $296 million for the year ended December 31, 2023, compared to $71 million for the prior year, benefiting from substantial revenue growth and significantly improved gross margins as well as continued leverage across SG&A.
Growth Trends in Revenue By Quarter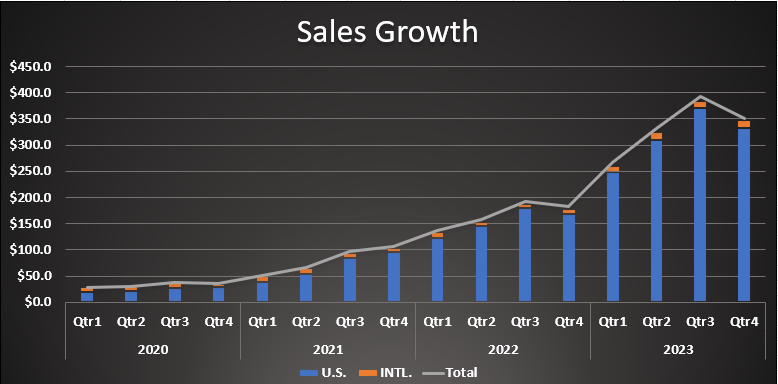
| | | | | | | | | | | | | | | | | |
| Selected Financial Data |
| | | | |
| | OUTPACING ENERGY GROWTH +10.3X *Circana (IRI) Total US MULO+C, top brand sales in the Celsius Custom Energy Segment, 13 weeks ended 12/31/2023 vs. prior year |
CELSIUS was the #1 Dollar and Unit Growth brand in Total US Mulo+C in 2023, contributing $1.09B incremental dollars (+140% vs. YA and 31% of category growth) and 339M incremental units (+117% vs. YA and 39% of category growth). *L 52W Circana (IRI) Total US MULO+C Data Ended 12/31/23 | |
|
|
| | | | | |
•Circana (IRI) data as of 12/31/23, shows Celsius sales up +112.3% y/y for 4-wks, +126.6% y/y for 13-wks and +142.3% y/y for 26-wks. This compares to the energy category which grew +12.4% y/y for 4-wks, +12.3% y/y for 13-wks and +13.4% y/y for 26-wks ◦On Amazon, CELSIUS® was the highest selling energy drink with a 19.7% share of the Energy Drink Category, ahead of MONSTER® at a 19.6% share, and REDBULL® at 12.3% (Last 14 week period ended 12/30/23, Stackline, Energy Drink Category: Total US) ◦Amazon Q4 2023 sales of $27.9 million vs $15.0 million for the year ago period, up 86.0%. Full year 2023 sales of $100.1 million vs. $57.9 million for the year ago period, up 72.9%. •Per Circana (IRI) Celsius Custom Energy Category 4W data ended 12/31/23: ◦In MULOC, Celsius is the #3 Energy Drink in the US with a 10.5% market share, more than doubling its 4.9% share in the same time period last year ◦In MULOC, Celsius ACV sits at 97.8% compared to 90.6% year ago ◦In Convenience, Celsius gained an additional 7.5 pts of ACV growth to end the period at 96.9%, compared to 89.4% y/y •Club channel revenue totaled $77.1 million for the quarter ended December 31, 2023, up 64.0% y/y, compared to $47.0 million for the prior year fourth quarter. Club channel revenue totaled $254.6 million for the full year ended December 31, 2023, up 83.6% y/y, compared to $138.7 million for the prior year. | |
|
| | | | | | | | | | | | | | | | | |
| Q4 2023 Investor Information |
Conference Call
Management will host a conference call today, Thursday February 29, 2024 at 10:00 a.m. ET to discuss the results with the investment community.
To join the conference call, please call one of the following telephone numbers at least 10 minutes before the start of the call:
| | | | | |
| Toll Free | 877-709-8150 |
| International: | 201-689-8354 |
Webcast: https://event.choruscall.com/mediaframe/webcast.html?webcastid=gvxb9rgYA replay of the conference call can be accessed through the webcast link above.
Disclosures can be found on the Company's online disclosure portal at: https://www.celsiusholdingsinc.com/sec-filings/Investor Contact: investorrelations@celsius.com
About Celsius Holdings, Inc.
Celsius Holdings, Inc. (Nasdaq: CELH) is the maker of energy drink brand CELSIUS®, a lifestyle energy drink born in fitness and a pioneer in the rapidly growing energy category. For more information, please visit https://www.celsiusholdingsinc.com/
Forward-Looking Statements
This press release may contain statements that are not historical facts and are considered forward-looking statements within the meaning of the Private Securities Litigation Reform Act of 1995. These forward-looking statements may contain projections of Celsius Holdings’ future results of operations or financial position, or state other forward-looking information. You can identify these statements by the use of words such as “anticipate,” “believe,” “could,” “estimate,” “expect,” “intend,” “may,” “should,” “will,” “would”,”could”,”project”,”plan”, “potential”,”designed”, “seek”, “target”, and variations of these terms, the negatives of such terms and similar expressions. You should not rely on forward-looking statements because Celsius Holdings’ actual results may differ materially from those indicated by forward-looking statements as a result of a number of important factors. These factors include but are not limited to: general economic and business conditions; our business strategy for expanding our presence in our industry; our expectations of revenue; operating costs and profitability; our expectations regarding our strategy and investments; our expectations regarding our business, including market opportunity, consumer demand and our competitive advantage; anticipated trends in our financial condition and results of operation; the impact of competition and technology change; existing and future regulations affecting our business; the Company’s ability to satisfy in a timely manner, all Securities and Exchange Commission (the “SEC”) required filings and the requirements of Section 404 of the Sarbanes-Oxley Act of 2002 and the rules and regulations adopted under that Section; and other risks and uncertainties discussed in the reports Celsius Holdings has filed previously with the SEC, such as its Annual Report on Form 10-K, Quarterly Report on Form 10-Q and Current Reports on Form 8-K. Forward-looking statements speak only as of the date the statements were made. Celsius Holdings does not undertake an obligation to update forward-looking information, except to the extent required by applicable law.
Celsius Holdings, Inc.
Condensed Consolidated Balance Sheets (In thousands, except par value)
| | | | | | | | | | | |
| December 31, 2023 | | December 31, 2022 |
| ASSETS | | | |
| Current assets: | | | |
| Cash and cash equivalents | 755,981 | | | 614,159 | |
| Restricted cash | — | | | 38,768 | |
| Accounts receivable-net | 183,703 | | | 63,311 | |
| Note receivable-current | 2,318 | | | 2,979 | |
| Inventories-net | 229,275 | | | 173,289 | |
| Prepaid expenses and other current assets | 19,503 | | | 11,341 | |
| Deferred other costs-current | 14,124 | | | 14,124 | |
| Total current assets | $ | 1,204,904 | | | $ | 917,971 | |
| | | |
| Note receivable-non-current | — | | | 3,574 | |
| Property and equipment-net | 24,868 | | | 10,185 | |
| Deferred tax asset | 29,518 | | | 501 | |
| Right of use assets-operating leases | 1,957 | | | 972 | |
| Right of use assets-finance leases | 208 | | | 208 | |
| Other long-term assets | 291 | | | 263 | |
| Deferred other costs-non-current | 248,338 | | | 262,462 | |
| Intangibles-net | 12,139 | | | 12,254 | |
| Goodwill | 14,173 | | | 13,679 | |
| Total Assets | $ | 1,536,396 | | | $ | 1,222,069 | |
| | | |
| LIABILITIES, MEZZANINE EQUITY AND STOCKHOLDERS’ EQUITY | | | |
| | | |
| Current liabilities: | | | |
| Accounts payable | 42,840 | | | 36,248 | |
| Accrued expenses | 62,120 | | | 69,899 | |
| Income taxes payable | 50,424 | | | 1,193 | |
| Accrued distributor termination fees | — | | | 3,986 | |
| Accrued promotional allowance | 99,787 | | | 35,977 | |
| Lease liability obligation-operating leases | 980 | | | 661 | |
| Lease liability obligation-finance leases | 59 | | | 70 | |
| Deferred revenue-current | 9,513 | | | 9,675 | |
| Other current liabilities | 10,890 | | | 3,586 | |
| Total current liabilities | 276,613 | | | 161,295 | |
| | | |
| | | |
| Lease liability obligation-operating leases | 955 | | | 326 | |
| Lease liability obligation-finance leases | 193 | | | 162 | |
| Deferred tax liability | 2,880 | | | 15,919 | |
| Deferred revenue-non-current | 167,227 | | | 179,788 | |
| Total Liabilities | $ | 447,868 | | | $ | 357,490 | |
| | | |
| Commitment and contingencies | | | |
| | | |
| Mezzanine Equity: | | | |
| Series A convertible preferred shares, $0.001 par value, 5% cumulative dividends; 1,466,666 shares issued and outstanding at December 31, 2023 and December 31, 2022, respectively, aggregate liquidation preference of $550,000 as of December 31, 2023 and December 31, 2022, respectively | 824,488 | | | 824,488 | |
| | | |
| Stockholders’ Equity: | | | |
| Common stock, $0.001 par value; 300,000,000 shares authorized, 231,787,482 and 229,146,788 shares issued and outstanding at December 31, 2023 and December 31, 2022, respectively | 77 | | | 76 | |
| Additional paid-in capital | 276,717 | | | 280,668 | |
| Accumulated other comprehensive loss | (701) | | | (1,881) | |
| Accumulated deficit | (12,053) | | | (238,772) | |
| Total Stockholders’ Equity | 264,040 | | | 40,091 | |
| Total Liabilities, Mezzanine Equity and Stockholders’ Equity | $ | 1,536,396 | | | $ | 1,222,069 | |
Celsius Holdings, Inc.
Consolidated Statements of Operations and Comprehensive Income
(In thousands, except per share amounts)
| | | | | | | | | | | | | | | | | | | | | | | |
| For the Three Months Ended December 31, | | For the Year Ended December 31, |
| 2023 | | 2022 | | 2023 | | 2022 |
| Revenue | 347,435 | | | 177,964 | | | 1,318,014 | | | 653,604 | |
| Cost of revenue | 181,190 | | | 98,957 | | | 684,875 | | | 382,735 | |
| Gross profit | 166,245 | | | 79,007 | | | 633,139 | | | 270,869 | |
| Selling, general and administrative expenses | 107,302 | | | 111,753 | | | 366,773 | | | 428,670 | |
| | | | | | | |
| Income (loss) from operations | 58,943 | | | (32,746) | | | 266,366 | | | (157,801) | |
| | | | | | | |
| Other income (expense): | | | | | | | |
| | | | | | | |
| Interest income | 8,835 | | | 3,899 | | | 26,501 | | | 5,292 | |
| Interest income on note receivable | 27 | | | 51 | | | 128 | | | 237 | |
| Foreign exchange gain (loss) | (20) | | | 538 | | | (1,246) | | | (392) | |
| Total other income | 8,842 | | | 4,488 | | | 25,383 | | | 5,137 | |
| | | | | | | |
| Net income (loss) before income taxes | 67,785 | | | (28,258) | | | 291,749 | | | (152,664) | |
| | | | | | | |
| Income tax (expense) benefit | (17,669) | | | 7,035 | | | (64,948) | | | (34,618) | |
| | | | | | | |
| Net income (loss) | $ | 50,116 | | | $ | (21,223) | | | $ | 226,801 | | | $ | (187,282) | |
| | | | | | | |
| Less: dividends on Series A convertible preferred shares | (6,950) | | | (6,930) | | | (27,462) | | | (11,526) | |
| | | | | | | |
| Income allocated to participating preferred shares | (4,085) | | | — | | | (17,348) | | | — | |
| Net income(loss) attributed to common stockholders | $ | 39,081 | | | $ | (28,153) | | | $ | 181,991 | | | $ | (198,808) | |
| | | | | | | |
| Other comprehensive income (loss): | | | | | | | |
| Foreign currency translation gain (loss), net of income tax | 1,840 | | | 2,318 | | | 1,180 | | | (2,495) | |
| Comprehensive income (loss) | $ | 40,921 | | | $ | (25,835) | | | $ | 183,171 | | | $ | (201,303) | |
| | | | | | | |
| *Earnings per share: | | | | | | | |
| Basic | $ | 0.17 | | | $ | (0.12) | | | $ | 0.79 | | | $ | (0.88) | |
| Dilutive | $ | 0.17 | | | $ | (0.12) | | | $ | 0.77 | | | $ | (0.88) | |
| | | | | | | |
| | | | | | | |
| | | | | | | |
*Please refer to Note 3 in the Annual Report Form 10K for Earnings per Share reconciliations.
Celsius Holdings, Inc.
Reconciliation of Non-GAAP Financial Measures
Reconciliation of GAAP net income to non-GAAP adjusted EBITDA
| | | | | | | | | | | |
| Three months ended
December 31, |
| 2023 | | 2022 |
| Net income (loss) (GAAP measure) | 50,116 | | | (21,223) | |
| Add back/(Deduct): | | | |
| Net interest expense | (8,862) | | | (3,950) | |
| Income tax expense (benefit) | 17,669 | | | (7,035) | |
| Depreciation and amortization expense | 1,105 | | | 548 | |
| Non-GAAP EBITDA | 60,028 | | | (31,660) | |
Stock-based compensation1 | 5,005 | | | 5,885 | |
| Foreign exchange | 20 | | | (538) | |
Distributor Termination2 | 126 | | | 37,649 | |
Legal Settlement Costs3 | — | | | 2,108 | |
| Non-GAAP Adjusted EBITDA | $ | 65,179 | | | $ | 13,444 | |
| | | | | | | | | | | |
| Year ended December 31, |
| 2023 | | 2022 |
| Net income (loss) (GAAP measure) | 226,801 | | | (187,282) | |
| Add back/(Deduct): | | | |
| Net interest expense | (26,629) | | | (5,529) | |
| Income tax expense | 64,948 | | | 34,618 | |
| Depreciation and amortization expense | 3,226 | | | 1,917 | |
| Non-GAAP EBITDA | 268,346 | | | (156,276) | |
Stock-based compensation1 | 21,226 | | | 20,665 | |
| Foreign exchange | 1,246 | | | 392 | |
Distributor Termination2 | (3,115) | | | 193,843 | |
Legal Settlement Costs3 | 7,900 | | | 9,908 | |
Func Food brand impairment charge4 | — | | | 2,538 | |
| Non-GAAP Adjusted EBITDA | $ | 295,603 | | | $ | 71,070 | |
| | | | | | | | | | | | | | |
| | | | |
1 Selling, general and administrative expenses related to employee non-cash stock-based compensation expense. Stock-based compensation expense consists of non-cash charges for the estimated fair value of unvested restricted share unit and stock option awards granted to employees and directors. The Company believes that the exclusion provides a more accurate comparison of operating results and is useful to investors to understand the impact that stock-based compensation expense has on its operating results. 2 2023 Distributor termination represents reversals of accrued termination payments. The unused funds designated for termination expense payments to legacy distributors were reimbursed to Pepsi for the quarter ended June 30, 2023. Prior year Distributor Termination represents the disbursement of funds to terminated distributors after the migration to Pepsi’s system. 3 2023 Legal class action settlement pertained to the McCallion vs Celsius Holdings, class action lawsuit, which we settled during the quarter ended June 30, 2023. 2022 Legal class action settlement pertained to the Hezi vs Celsius Holdings class action lawsuit, which we settled during the quarter ended September 30, 2022 and the Strong Arm Productions USA, Inc. vs Celsius, for which we accrued a portion of the judgement during the quarter ended December 31, 2022. These costs are excluded by the Company’s management in assessing current operating performance and forecasting future earnings, and are therefore added back in the non-GAAP Adjusted EBITDA measures. 4 2022 expense related to impairment of Finland-based Func Foods brand division during the quarter ended September 30, 2022. |
Reconciliation of GAAP SG&A to non-GAAP SG&A
| | | | | | | | | | | | | | |
| Reported Expense (In $ thousands) | 4Q 2023 | 4Q 2022 | For the Year ended December 31, 2023 | For the Year ended December 31, 2022 |
| Sales & Marketing | $80,418 | $89,985 | $264,107 | $352,767 |
| G & A | $26,884 | $21,768 | $102,666 | $75,903 |
| Total GAAP SG&A | $107,302 | $111,753 | $366,773 | $428,670 |
| minus Distributor Termination costs (credits) in Sales & Marketing | $126 | $37,649 | $(3,115) | $193,843 |
| Total non-GAAP SG&A | $107,176 | $74,104 | $369,888 | $234,827 |
| | | | | | | | | | | | | | |
| GAAP SG&A | 4Q 2023 | 4Q 2022 | For the Year ended December 31, 2023 | For the Year ended December 31, 2022 |
| Sales & Marketing | 23.1% | 50.6% | 20.0% | 54.0% |
| G & A | 7.7% | 12.2% | 7.8% | 11.6% |
| Total GAAP SG&A % of Revenue | 30.8% | 62.8% | 27.8% | 65.6% |
| | | | |
| Non-GAAP SG&A | | | | |
| As Adjusted Sales & Marketing | 23.1% | 29.4% | 20.3% | 24.3% |
| G & A | 7.7% | 12.2% | 7.8% | 11.6% |
| Total non-GAAP SG&A % of Revenue | 30.8% | 41.6% | 28.1% | 35.9% |
Celsius defines Adjusted EBITDA as net income before net interest expense, income tax expense (benefit), and depreciation and amortization expense, further adjusted by excluding stock-based compensation expense, foreign exchange gains or losses, distributor termination fees, legal settlement costs and certain impairment charges. Celsius defines non-GAAP SG&A as SG&A before distributor termination costs. Adjusted EBITDA and non-GAAP SG&A are non-GAAP financial measures.
Celsius uses Adjusted EBITDA and non-GAAP SG&A for operational and financial decision-making and believes these measures are useful in evaluating its performance because they eliminate certain items that management does not consider indicators of Celsius’ operating performance. Adjusted EBITDA and non-GAAP SG&A may also be used by many of Celsius’ investors, securities analysts, and other interested parties in evaluating its operational and financial performance across reporting periods. Celsius believes that the presentation of Adjusted EBITDA and non-GAAP SG&A provides useful information to investors by allowing an understanding of measures that it uses internally for operational decision-making, budgeting and assessing operating performance.
Adjusted EBITDA and non-GAAP SG&A are not recognized terms under GAAP and should not be considered as a substitute for net income or SG&A or any other financial measure presented in accordance with GAAP. Non-GAAP financial measures have limitations as analytical tools and should not be considered in isolation or as substitutes for analysis of Celsius’ results as reported under GAAP. Celsius strongly encourages investors to review its financial statements and publicly filed reports in their entirety and not to rely on any single financial measure.
Because non-GAAP financial measures are not standardized, Adjusted EBITDA and non-GAAP SG&A, as defined by Celsius, may not be comparable to similarly titled measures reported by other companies. It therefore may not be possible to compare Celsius’ use of these non-GAAP financial measures with those used by other companies.