(An Exploration Stage Mining Company)
Index to Consolidated Financial Statements
(Audited)
Year ended June 30, 2012

REPORT OF INDEPENDENT REGISTERED PUBLIC ACCOUNTING FIRM
To the Board of Directors and Stockholders of Paramount Gold and Silver Corp. (An Exploration Stage Corporation):
We have audited the accompanying consolidated balance sheets of Paramount Gold and Silver Corp. (the "Company") as of June 30, 2012 and 2011, and the related consolidated statements of loss, stockholders’ equity, and cash flows for each of the years in the three-year period ended June 30, 2012 and from the date of inception (March 29, 2005) through June 30, 2012. We also have audited the Company's internal control over financial reporting as of June 30, 2012, based on criteria established in Internal Control - Integrated Framework issued by the Committee of Sponsoring Organizations of the Treadway Commission. The Company's management is responsible for these financial statements, for maintaining effective internal control over financial reporting, and for its assessment of the effectiveness of internal control over financial reporting, included in the accompanying Management's Report on Internal Control over Financial Reporting. Our responsibility is to express an opinion on these financial statements and financial statement schedule and an opinion on the Company's internal control over financial reporting based on our audits.
We conducted our audits in accordance with the standards of the Public Company Accounting Oversight Board (United States). Those standards require that we plan and perform the audit to obtain reasonable assurance about whether the financial statements are free of material misstatement and whether effective internal control over financial reporting was maintained in all material respects. Our audits of the financial statements included examining, on a test basis, evidence supporting the amounts and disclosures in the financial statements, assessing the accounting principles used and significant estimates made by management, and evaluating the overall financial statement presentation. Our audit of internal control over financial reporting included obtaining an understanding of internal control over financial reporting, assessing the risk that a material weakness exists, and testing and evaluating the design and operating effectiveness of internal control based on the assessed risk. Our audits also included performing such other procedures as we considered necessary in the circumstances. We believe that our audits provide a reasonable basis for our opinions.
A company's internal control over financial reporting is a process designed by, or under the supervision of, the company's principal executive and principal financial officers, or persons performing similar functions, and effected by the company's board of directors, management, and other personnel to provide reasonable assurance regarding the reliability of financial reporting and the preparation of financial statements for external purposes in accordance with generally accepted accounting principles. A company's internal control over financial reporting includes those policies and procedures that (1) pertain to the maintenance of records that, in reasonable detail, accurately and fairly reflect the transactions and dispositions of the assets of the company; (2) provide reasonable assurance that transactions are recorded as necessary to permit preparation of financial statements in accordance with generally accepted accounting principles and that receipts and expenditures of the company are being made only in accordance with authorizations of management and directors of the company; and (3) provide reasonable assurance regarding prevention or timely detection of unauthorized acquisition, use, or disposition of the company's assets that could have a material effect on the financial statements.
 | ACCOUNTING › CONSULTING › TAX 2300, 1055 DUNSMUIR STREET, BOX 49148, VANCOUVER, BC V7X 1J1 1.877.688.8408 P: 604.685.8408 F: 604.685.8594 mnp.ca |
Because of the inherent limitations of internal control over financial reporting, including the possibility of collusion or improper management override of controls, material misstatements due to error or fraud may not be prevented or detected on a timely basis. Also, projections of any evaluation of the effectiveness of the internal control over financial reporting to future periods are subject to the risk that the controls may become inadequate because of changes in conditions, or that the degree of compliance with the policies or procedures may deteriorate.
In our opinion, these consolidated financial statements present fairly, in all material respects, the financial position of the company as at June 30, 2012 and 2011 and the results of its operations and its cash flows for each of the years in the three year period ended June 30, 2012 and from the date of inception (March 29, 2005) through June 30, 2012 in conformity with generally accepted accounting principles in the United States of America. Also, in our opinion, the Company maintained, in all material respects, effective internal control over financial reporting as of June 30, 2012, based on the criteria established in Internal Control - Integrated Framework issued by the Committee of Sponsoring Organizations of the Treadway Commission.
Vancouver, BC
September 10, 2012
PARAMOUNT GOLD AND SILVER CORP. (An Exploration Stage Mining Company)
Consolidated Balance Sheets
As at June 30, 2012 and June 30, 2011
(Expressed in United States dollars, unless otherwise stated)
| | | As at June 30, | | | As at June 30, | |
| | | 2012 (Audited) | | | 2011 (Audited) | |
| Assets | | | | | | |
| | | | | | | |
| Current Assets | | | | | | |
| Cash and cash equivalents | | $ | 12,500,708 | | | $ | 14,689,241 | |
| Short-term investments | | | 7,500,000 | | | | - | |
| Amounts receivable | | | 1,458,365 | | | | 1,625,724 | |
| Prepaid and deposits | | | 354,667 | | | | 34,252 | |
| Prepaid insurance, current portion (Note 11) | | | 245,215 | | | | 245,215 | |
| Marketable securities (Note 3) | | | - | | | | 319,219 | |
| Total Current Assets | | | 22,058,955 | | | | 16,913,651 | |
| Non-Current Assets | | | | | | | | |
| Mineral properties (Note 8) | | | 50,479,859 | | | | 49,515,859 | |
| Property and equipment (Note 9) | | | 458,937 | | | | 487,740 | |
| Prepaid insurance, non current portion (Note 11) | | | 367,822 | | | | 613,035 | |
| Reclamation bond (Note 11) | | | 2,754,316 | | | | 2,765,742 | |
| Total Non-Current Assets | | | 54,060,934 | | | | 53,382,376 | |
| | | | | | | | | |
| Total Assets | | $ | 76,119,889 | | | $ | 70,296,027 | |
| | | | | | | | | |
| Liabilities and Stockholders' Equity | | | | | | | | |
| | | | | | | | | |
| Liabilities | | | | | | | | |
| | | | | | | | | |
| Current Liabilities | | | | | | | | |
| Accounts payable and accrued liabilities | | $ | 1,364,419 | | | $ | 769,172 | |
| Warrant liability (Note 4) | | | 10,746,787 | | | | 16,914,660 | |
| Total Current Liabilities | | | 12,111,206 | | | | 17,683,832 | |
| | | | | | | | | |
| Non-Current Liabilities | | | | | | | | |
| Reclamation and environmental obligation (Note 11) | | | 1,198,179 | | | | 1,143,892 | |
| Total Liabilities | | $ | 13,309,385 | | | | 18,827,724 | |
| | | | | | | | | |
| Stockholders' Equity | | | | | | | | |
| Capital Stock, par value $0.001 per share; authorized 200,000,000 shares, 147,412,603 issued and outstanding at June 30, 2012 and 136,249,512 shares issued and outstanding at June 30, 2011 | | | 147,413 | | | | 136,249 | |
| Additional paid in capital | | | 151,564,888 | | | | 129,664,660 | |
| Contributed surplus | | | 12,892,174 | | | | 11,287,242 | |
| Deficit accumulated during the exploration stage | | | (101,729,241 | ) | | | (89,637,633 | ) |
| Accumulated other comprehensive income (loss) | | | (64,730 | ) | | | 17,785 | |
| Total Stockholders' Equity | | | 62,810,504 | | | | 51,468,303 | |
| | | | | | | | | |
| Total Liabilities and Stockholders' Equity | | $ | 76,119,889 | | | $ | 70,296,027 | |
Subsequent Events (Note 13)
The accompanying notes are an integral part of the consolidated financial statements
PARAMOUNT GOLD AND SILVER CORP. (An Exploration Stage Mining Company)
Consolidated Statements of Operations and Comprehensive Loss
For the Years Ended June 30, 2012, June 30, 2011 and June 30, 2010
(Expressed in United States dollars, unless otherwise stated)
| | | For the Year Ended June 30, 2012 | | | For the Year Ended June 30, 2011 | | | For the Year Ended June 30, 2010 | | | Cumulative Since Inception to June 30, 2012 | |
| Revenue | | | | | | | | | | | | |
| Interest income | | $ | 42,660 | | | $ | 118,870 | | | $ | 35,853 | | | $ | 1,179,492 | |
| Other income | | | 73,130 | | | | 180,833 | | | | - | | | | 253,963 | |
| Total Revenue | | $ | 115,790 | | | $ | 299,703 | | | $ | 35,853 | | | $ | 1,433,455 | |
| | | | | | | | | | | | | | | | | |
| Expenses: | | | | | | | | | | | | | | | | |
| Incorporation costs | | | - | | | | - | | | | - | | | | 1,773 | |
| Exploration | | | 13,427,376 | | | | 7,984,774 | | | | 6,043,791 | | | | 45,209,413 | |
| Professional fees | | | 1,166,881 | | | | 1,280,869 | | | | 931,404 | | | | 8,672,804 | |
| Directors compensation | | | 1,357,051 | | | | 813,154 | | | | 141,224 | | | | 2,311,429 | |
| Travel & lodging | | | 224,705 | | | | 212,999 | | | | 192,642 | | | | 1,486,952 | |
| Corporate communications | | | 440,382 | | | | 260,309 | | | | 332,139 | | | | 3,817,789 | |
| Consulting fees | | | 475,087 | | | | 464,790 | | | | 418,437 | | | | 14,744,697 | |
| Office & administration | | | 451,773 | | | | 333,789 | | | | 429,149 | | | | 3,141,395 | |
| Interest & service charges | | | 10,648 | | | | 12,643 | | | | 57,644 | | | | 120,133 | |
| Loss on disposal of fixed assets | | | - | | | | - | | | | - | | | | 44,669 | |
| Insurance | | | 323,777 | | | | 317,457 | | | | 47,804 | | | | 917,106 | |
| Depreciation | | | 77,155 | | | | 73,299 | | | | 66,367 | | | | 446,733 | |
| Accretion | | | 153,704 | | | | 119,884 | | | | - | | | | 273,588 | |
| Miscellaneous | | | - | | | | - | | | | 18,124 | | | | 203,097 | |
| Financing & listing fees | | | - | | | | - | | | | - | | | | (22,024 | ) |
| Acquisition expenses | | | - | | | | 262,764 | | | | 1,242,569 | | | | 1,505,334 | |
| Income and other taxes | | | - | | | | 13,015 | | | | 51,732 | | | | 64,747 | |
| Write down of mineral property | | | 100,000 | | | | 10,000 | | | | 275,000 | | | | 1,856,049 | |
| Total Expenses | | | 18,208,539 | | | | 12,159,746 | | | | 10,248,026 | | | | 84,795,684 | |
| Net Loss before other items | | $ | 18,092,749 | | | $ | 11,860,043 | | | $ | 10,212,173 | | | $ | 83,362,229 | |
| | | | | | | | | | | | | | | | | |
| Other items | | | | | | | | | | | | | | | | |
| Change in fair value of equity conversion right | | | - | | | | 169,081 | | | | 821,155 | | | | 990,236 | |
| Change in fair value of warrant liability | | | (6,167,873 | ) | | | 16,421,412 | | | | (5,681,370 | ) | | | 17,210,044 | |
| Loss on sale of marketable securities | | | 166,732 | | | | - | | | | - | | | | 166,732 | |
| Net Loss | | $ | 12,091,608 | | | $ | 28,450,536 | | | $ | 5,351,958 | | | $ | 101,729,241 | |
| | | | | | | | | | | | | | | | | |
| Other comprehensive loss | | | | | | | | | | | | | | | | |
| Foreign currency translation adjustment | | | 113,460 | | | | (492,405 | ) | | | 156,483 | | | | 64,730 | |
| Unrealized loss on available-for-sale-securities | | | (30,945 | ) | | | 30,945 | | | | - | | | | - | |
| Total Comprehensive Loss for the Period | | $ | 12,174,123 | | | $ | 27,989,076 | | | $ | 5,508,441 | | | $ | 101,793,971 | |
| | | | | | | | | | | | | | | | | |
| Loss per Common share | | | | | | | | | | | | | | | | |
| Basic | | $ | 0.09 | | | $ | 0.21 | | | $ | 0.06 | | | | | |
| Diluted | | $ | 0.09 | | | $ | 0.21 | | | $ | 0.06 | | | | | |
| | | | | | | | | | | | | | | | | |
| Weighted Average Number of Common | | | | | | | | | | | | | | | | |
| Shares Used in Per Share Calculations | | | | | | | | | | | | | | | | |
| Basic | | | 139,466,595 | | | | 130,677,585 | | | | 98,617,938 | | | | | |
| Diluted | | | 139,466,595 | | | | 130,677,585 | | | | 98,617,938 | | | | | |
The accompanying notes are an integral part of the consolidated financial statements
(An Exploration Stage Mining Company)
Consolidated Statements of Cash Flow
For the Years Ended June 30, 2012, June 30, 2011 and June 30, 2010
(Expressed in United States dollars, unless otherwise stated)
| | | For the Year Ended June 30, 2012 | | | For the Year Ended June 30, 2011 | | | For the Year Ended June 30, 2010 | | | Cumulative Since Inception to June 30, 2012 | |
| | | | | | | | | | | | | |
| Net Loss | | $ | (12,091,608 | ) | | $ | (28,450,536 | ) | | $ | (5,351,958 | ) | | $ | (101,729,241 | ) |
| Adjustment for: | | | | | | | | | | | | | | | | |
| Depreciation | | | 77,155 | | | | 73,299 | | | | 66,367 | | | | 446,733 | |
| Loss on disposal of assets | | | - | | | | - | | | | - | | | | 44,669 | |
| Stock based compensation | | | 1,918,724 | | | | 1,200,875 | | | | 309,840 | | | | 19,577,123 | |
| Accrued interest | | | - | | | | - | | | | - | | | | (58,875 | ) |
| Write-down of mineral properties | | | 100,000 | | | | 10,000 | | | | 275,000 | | | | 1,856,049 | |
| Accretion expense | | | 153,704 | | | | 119,884 | | | | - | | | | 273,588 | |
| Change in reclamation | | | (5,312 | ) | | | 63,592 | | | | - | | | | 58,280 | |
| Insurance expense | | | 245,213 | | | | 182,235 | | | | - | | | | 427,448 | |
| Other non cash transactions | | | 205,474 | | | | (899 | ) | | | - | | | | 204,575 | |
| Change in fair value of equity conversion right | | | - | | | | 169,081 | | | | 821,155 | | | | 990,236 | |
| Change in fair value of warrant liability | | | (6,167,873 | ) | | | 16,421,412 | | | | (5,681,370 | ) | | | 17,210,044 | |
| (Increase) Decrease in accounts receivable | | | 167,359 | | | | (30,679 | ) | | | (1,290,352 | ) | | | (1,374,939 | ) |
| (Increase) Decrease in prepaid expenses | | | (320,415 | ) | | | 11,116 | | | | 37,215 | | | | (354,667 | ) |
| Increase (Decrease) in accounts payable | | | 595,247 | | | | (1,544,935 | ) | | | 46,878 | | | | (519,364 | ) |
| Cash used in operating activities | | $ | (15,122,332 | ) | | $ | (11,775,554 | ) | | $ | (10,767,225 | ) | | $ | (62,948,341 | ) |
| | | | | | | | | | | | | | | | | |
| Sale (purchase) of marketable securities | | | 144,690 | | | | - | | | | - | | | | 144,690 | |
| Increase of reclamation bond | | | (82,678 | ) | | | - | | | | - | | | | (82,678 | ) |
| Purchase of GIC receivable | | | (7,500,000 | ) | | | - | | | | 1,063,772 | | | | (7,441,125 | ) |
| Notes receivable issued | | | - | | | | 243,495 | | | | (152,130 | ) | | | 21,365 | |
| Purchase of equity conversion right | | | - | | | | - | | | | (1,337,700 | ) | | | (1,337,700 | ) |
| Purchase of mineral properties | | | (100,000 | ) | | | (191,061 | ) | | | (3,574,252 | ) | | | (7,209,870 | ) |
| Cash acquired on acquisition of X-Cal | | | - | | | | 843,101 | | | | - | | | | 843,101 | |
| Purchase of equipment | | | (48,352 | ) | | | (10,989 | ) | | | (64,955 | ) | | | (950,214 | ) |
| Cash provided by (used in) investing activities | | $ | (7,586,340 | ) | | $ | 884,546 | | | $ | (4,065,265 | ) | | $ | (16,012,431 | ) |
| | | | | | | | | | | | | | | | | |
| Demand notes payable issued | | | - | | | | - | | | | - | | | | 105,580 | |
| Issuance of capital Stock | | | 20,633,600 | | | | 3,707,339 | | | | 29,328,480 | | | | 91,465,579 | |
| Cash provided by financing activities | | $ | 20,633,600 | | | $ | 3,707,339 | | | $ | 29,328,480 | | | $ | 91,571,159 | |
| | | | | | | | | | | | | | | | | |
| Effect of exchange rate changes on cash | | | (113,460 | ) | | | 492,405 | | | | (156,484 | ) | | | (109,678 | ) |
| | | | | | | | | | | | | | | | | |
| Change in cash during period | | | (2,188,533 | ) | | | (6,691,264 | ) | | | 14,339,506 | | | | 12,500,708 | |
| | | | | | | | | | | | | | | | | |
| Cash at beginning of period | | | 14,689,241 | | | | 21,380,505 | | | | 7,040,999 | | | | - | |
| Cash at end of period | | $ | 12,500,708 | | | $ | 14,689,241 | | | $ | 21,380,505 | | | $ | 12,500,708 | |
| | | | | | | | | | | | | | | | | |
| Supplemental Cash Flow Disclosure | | | | | | | | | | | | | | | | |
| Cash | | $ | 3,125,789 | | | $ | 3,680,403 | | | $ | 2,723,992 | | | | | |
| Cash Equivalents | | $ | 9,374,919 | | | $ | 11,008,837 | | | $ | 18,656,513 | | | | | |
The accompanying notes are an integral part of the consolidated financial statements
PARAMOUNT GOLD AND SILVER CORP. (An Exploration Stage Mining Company)
Consolidated Statements of Stockholder’s Equity
As at June 30, 2012, June 30, 2011 and June 30, 2010
(Expressed in United States dollars, unless otherwise stated)
| | | Shares | | | Par Value | | | Additional Paid in Capital | | | Deficit Accumulated During Exploration Stage | | | Contributed Surplus | | | Accumulated Other Comprehensive Income (Loss) | | | Total Stockholders Equity | |
| Balance at inception | | | — | | | $ | — | | | $ | — | | | $ | — | | | $ | — | | | $ | — | | | $ | — | |
| Capital issued for financing | | | 121,533,078 | | | | 121,533 | | | | 26,105,855 | | | | — | | | | — | | | | — | | | | 26,227,388 | |
| Capital issued for services | | | 5,342,304 | | | | 5,342 | | | | 10,160,732 | | | | — | | | | — | | | | — | | | | 10,166,074 | |
| Capital issued from stock options and warrants exercised | | | 384,627 | | | | 385 | | | | 249,623 | | | | | | | | (237,008 | ) | | | | | | | 13,000 | |
| Capital issued for mineral properties | | | 17,378,519 | | | | 17,379 | | | | 15,822,867 | | | | — | | | | — | | | | — | | | | 15,840,246 | |
| Capital issued on settlement of notes payable | | | 39,691 | | | | 39 | | | | 105,541 | | | | — | | | | — | | | | — | | | | 105,580 | |
| Returned to treasury | | | (61,660,000 | ) | | | (61,660 | ) | | | 61,660 | | | | — | | | | — | | | | — | | | | — | |
| Fair value of warrants | | | — | | | | — | | | | — | | | | — | | | | 12,073,546 | | | | — | | | | 12,073,546 | |
| Stock based compensation | | | — | | | | — | | | | — | | | | — | | | | 6,132,972 | | | | — | | | | 6,132,972 | |
| Foreign currency translation | | | — | | | | — | | | | — | | | | — | | | | — | | | | (287,192 | ) | | | (287,192 | ) |
| Net Income (loss) | | | — | | | | — | | | | — | | | | (43,197,264 | ) | | | — | | | | — | | | | (43,197,264 | ) |
| Balance at June 30, 2009 | | | 83,018,219 | | | $ | 83,018 | | | $ | 52,506,278 | | | $ | (43,197,264 | ) | | $ | 17,969,510 | | | $ | (287,192 | ) | | $ | 27,074,350 | |
| Capital issued for financing | | | 18,400,000 | | | | 18,400 | | | | 21,371,043 | | | | — | | | | — | | | | — | | | | 21,389,443 | |
| Capital issued from stock options and warrants exercised | | | 8,351,360 | | | | 8,351 | | | | 16,361,552 | | | | — | | | | (3,841,264 | ) | | | — | | | | 12,528,639 | |
| Capital issued for mineral properties | | | 300,000 | | | | 300 | | | | 374,700 | | | | — | | | | — | | | | — | | | | 375,000 | |
| Stock based compensation | | | — | | | | — | | | | — | | | | — | | | | 309,840 | | | | — | | | | 309,840 | |
| Transition adjustment (Note 2) | | | — | | | | — | | | | — | | | | (12,637,875 | ) | | | (3,612,864 | ) | | | — | | | | (16,250,739 | ) |
| Foreign currency translation | | | — | | | | — | | | | — | | | | — | | | | — | | | | (156,483 | ) | | | (156,483 | ) |
| Net Income (loss) | | | — | | | | — | | | | — | | | | (5,351,958 | ) | | | — | | | | — | | | | (5,351,958 | ) |
| Balance at June 30, 2010 | | | 110,069,579 | | | $ | 110,069 | | | $ | 90,613,573 | | | $ | (61,187,097 | ) | | $ | 10,825,222 | | | $ | (443,675 | ) | | $ | 39,918,092 | |
| Capital issued for financing | | | 19,395 | | | | 19 | | | | 23,970 | | | | — | | | | — | | | | — | | | | 23,989 | |
| Capital issued from stock options and warrants exercised | | | 4,153,085 | | | | 4,154 | | | | 10,219,361 | | | | — | | | | (1,053,645 | ) | | | — | | | | 9,169,870 | |
| Capital issued for acquisition | | | 22,007,453 | | | | 22,007 | | | | 28,807,756 | | | | — | | | | 314,790 | | | | — | | | | 29,144,553 | |
| Stock based compensation | | | — | | | | — | | | | — | | | | — | | | | 1,200,875 | | | | — | | | | 1,200,875 | |
| Foreign currency translation | | | — | | | | — | | | | — | | | | — | | | | — | | | | 492,405 | | | | 492,405 | |
| Unrealized loss on available for sale securities | | | — | | | | — | | | | — | | | | — | | | | — | | | | (30,945 | ) | | | (30,945 | ) |
| Net Income (loss) | | | — | | | | — | | | | — | | | | (28,450,536 | ) | | | — | | | | — | | | | (28,450,536 | ) |
| Balance at June 30, 2011 | | | 136,249,512 | | | $ | 136,249 | | | $ | 129,664,660 | | | $ | (89,637,633 | ) | | $ | 11,287,242 | | | $ | 17,785 | | | $ | 51,468,303 | |
| Capital issued for financing | | | 10,417,776 | | | | 10,418 | | | | 20,335,755 | | | | — | | | | — | | | | — | | | | 20,346,173 | |
| Capital issued from stock options and warrants exercised | | | 345,315 | | | | 346 | | | | 600,873 | | | | — | | | | (313,792 | ) | | | — | | | | 287,427 | |
| Capital issued for mineral properties | | | 400,000 | | | | 400 | | | | 963,600 | | | | — | | | | — | | | | — | | | | 964,000 | |
| Stock based compensation | | | — | | | | — | | | | — | | | | — | | | | 1,918,724 | | | | — | | | | 1,918,724 | |
| Foreign currency translation | | | — | | | | — | | | | — | | | | — | | | | — | | | | (113,460 | ) | | | (113,460 | ) |
| Unrealized loss on available for sale securities | | | — | | | | — | | | | — | | | | — | | | | — | | | | 30,945 | | | | 30,945 | |
| Net Income (loss) | | | — | | | | — | | | | — | | | | (12,091,608 | ) | | | — | | | | — | | | | (12,091,608 | ) |
| Balance at June 30, 2012 | | | 147,412,603 | | | $ | 147,413 | | | $ | 151,564,888 | | | $ | (101,729,241 | ) | | $ | 12,892,174 | | | $ | (64,730 | ) | | $ | 62,810,504 | |
The accompanying notes are an integral part of the consolidated financial statements
(An Exploration Stage Mining Company)
Notes to Consolidated financial statements (Audited)
For the Year Ended June 30, 2012
(Expressed in United States dollars, unless otherwise stated)
| 1. | Principal Accounting Policies: |
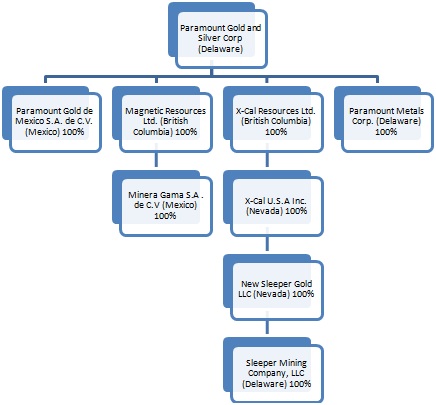
Paramount Gold and Silver Corp. (the “Company”), incorporated under the General Corporation Law of the State of Delaware, and its wholly-owned subsidiaries are engaged in the acquisition, exploration and development of precious metal properties. The Company’s wholly owned subsidiaries include Paramount Gold de Mexico S.A. de C.V., Magnetic Resources Ltd, Minera Gama SA de CV, and X-Cal Resources Ltd. The Company is an exploration stage company in the process of exploring its mineral properties in both the United States and Mexico, and has not yet determined whether these properties contain reserves that are economically recoverable.
Basis of Presentation and Preparation
The consolidated financial statements are prepared by management in accordance with U.S generally accepted accounting principles (“U.S. GAAP”). The consolidated financial statements include the accounts of the Company and its wholly owned subsidiaries. All significant intercompany accounts and transactions are eliminated in consolidation.
Use of Estimates
The preparation of consolidated financial statements in conformity with United States generally accepted accounting principles requires management to make estimates and assumptions that affect the reported amounts of assets and liabilities, disclosure of contingent assets and liabilities at the date of the consolidated financial statements, and the reported amounts of revenue and expenses during the reporting period. Actual results could differ from those estimates.
Significant estimates made by management in the accompanying financial statements include collectability of amounts receivable, the fair value of warrant liability, the adequacy of the Company’s asset retirement obligations, fair value of stock based compensation and valuation of deferred tax assets.
Cash and Cash Equivalents
All highly liquid investments with maturities of three months or less at the date of purchase are classified as cash and cash equivalents.
Marketable Securities
The Company classifies its marketable securities as available-for-sale securities. The securities are measured at fair market value in the financial statements with unrealized gains or losses recorded in other comprehensive income. At the time securities are sold, gains or losses are included in net income.
Fair Value Measurements
The Company has adopted FASB ASC 820, Fair Value Measurements and Disclosures, which defines fair value, establishes guidelines for measuring fair value and expands disclosures regarding fair value measurements. The company applies fair value accounting for all financial assets and liabilities and non – financial assets and liabilities that are recognized or disclosed at fair value in the financial statements on a recurring basis. The Company defines fair value as the price that would be received from selling an asset or paid to transfer a liability in an orderly transaction between market participants at the measurement date.
The Company has adopted FASB ASC 825, Financial Instruments, which allows companies to choose to measure eligible financial instruments and certain other items at fair value that are not required to be measured at fair value. The Company has not elected the fair value option for any eligible financial instruments.
The accompanying notes are an integral part of the consolidated financial statements
PARAMOUNT GOLD AND SILVER CORP.
(An Exploration Stage Mining Company)
Notes to Consolidated financial statements (Audited)
For the Year Ended June 30, 2012
(Expressed in United States dollars, unless otherwise stated)
| 1. | Principal Accounting Policies (Continued): |
Stock Based Compensation
The Company has adopted the provisions of FASB ASC 718, “Stock Compensation” (“ASC 718”), which establishes accounting for equity instruments exchanged for employee services. Under the provisions of ASC 718, stock-based compensation cost is measured at the grant date, based on the calculated fair value of the award, and is recognized as an expense over the employee’s requisite service period (generally the vesting period of the equity grant). New shares of the Company’s Common Stock will be issued for any options exercised or awards granted.
Comprehensive Income
FASB ASC 220“Reporting Comprehensive Income” establishes standards for the reporting and display of comprehensive income and its components in the financial statements.
Mineral Properties
Mineral property acquisition costs are capitalized when incurred and will be amortized using the units –of – production method over the estimated life of the reserve following the commencement of production. If a mineral property is subsequently abandoned or impaired, any capitalized costs will be expensed in the period of abandonment or impairment.
Acquisition costs include cash consideration and the fair market value of shares issued on the acquisition of mineral properties.
Exploration Costs
Exploration costs, which include maintenance, development and exploration of mineral claims, are expensed as incurred. When it is determined that a mineral deposit can be economically developed as a result of establishing proven and probable reserves, the costs incurred after such determination will be capitalized and amortized over their useful lives. To date, the Company has not established the commercial feasibility of its exploration prospects; therefore, all exploration costs are being expensed.
Derivatives
The Company accounts for its derivative instruments not indexed to our stock as either assets or liabilities and carries them at fair value. Derivatives that are not defined as hedges must be adjusted to fair value through earnings.
Warrants and options issued in prior periods with exercise prices denominated in Canadian dollars are no longer considered indexed to our stock, as their exercise price is not in the Company’s functional currency of the US dollar, and therefore no longer qualify for the scope exception and must be accounted for as a derivative. These warrants and options are reclassified as liabilities under the caption “Warrant liability” and recorded at estimated fair value at each reporting date, computed using the Black-Scholes valuation method. Changes in the liability from period to period are recorded in the Statements of Operations under the caption “Change in fair value of warrant liability.”
The Company elected to record the change in fair value of the warrant liability as a component of other income and expense on the statement of operations as we believe the amounts recorded relate to financing activities and not as a result of our operations.
The accompanying notes are an integral part of the consolidated financial statements
PARAMOUNT GOLD AND SILVER CORP.
(An Exploration Stage Mining Company)
Notes to Consolidated financial statements (Audited)
For the Year Ended June 30, 2012
(Expressed in United States dollars, unless otherwise stated)
| 1. | Principle Accounting Policies (Continued): |
Equipment is recorded at cost less accumulated depreciation. All equipment is amortized over its estimated useful life at the following annual rates:
| Computer equipment | 30% declining balance |
| Equipment | 20% declining balance |
| Furniture and fixtures | 20% declining balance |
| Exploration equipment | 20% declining balance |
Income Taxes
Income taxes are determined using assets and liability method. Deferred tax assets and liabilities are recognized for the future tax consequences attributable to differences between the financial statement carrying amounts of existing assets and liabilities and their respective tax bases. Deferred tax assets and liabilities are measured using the enacted tax rates expected to apply to taxable income in the years in which those temporary differences are expected to be recovered or settled. The effect on deferred tax assets and liabilities of a change in tax rates is recognized in the period that includes the enactment date. In addition, a valuation allowance is established to reduce any deferred tax asset for which it is determined that it is more likely than not that some portion of the deferred tax asset will not be realized.
Potential benefits of income tax losses are not recognized in the accounts until realization is more likely than not. The Company has adopted FASB ASC 740 as of its inception. Pursuant to FASB ASC 740 the Company is required to compute tax asset benefits for net operating losses carried forward. Potential benefits of net operating losses have not been recognized in these financial statements because the Company cannot be assured it is more likely than not it will utilize the net operating losses carried forward in future periods; and accordingly is offset by a valuation allowance. FIN No.48 prescribes a recognition threshold and measurement attribute for financial statement recognition and measurement of tax positions taken into in tax returns.
To the extent interest and penalties may be assessed by taxing authorities on any underpayment of income tax, such amounts would be accrued and classified as a component of income tax expense in our Consolidated Statements of Operations and Comprehensive Loss. The Company elected this accounting policy, which is a continuation of our historical policy, in connection with our adoption of FIN 48.
Net Income Per Share
Basic earnings per share is computed by dividing net loss available to common shareholders by the weighted average number of shares outstanding during each period. Diluted earnings per share reflect the potential dilution that could occur if securities or other contracts to issue common stock were exercised or converted into common stock.
For the year ended June 30, 2012, 2011 and 2010 the shares of common stock equivalents related to outstanding stock option and stock purchase warrants have not been included in the diluted per share calculation as they are anti-dilutive as the Company has recorded a net loss from continuing operations for each year.
Concentration of Credit Risk and Amounts Receivable
Financial instruments that potentially subject the Company to a concentration of credit risk consist principally of cash and cash equivalents and amounts receivable. We deposit our cash with financial institutions which we believe have sufficient credit quality to minimize risk of loss.
The accompanying notes are an integral part of the consolidated financial statements
PARAMOUNT GOLD AND SILVER CORP.
(An Exploration Stage Mining Company)
Notes to Consolidated financial statements (Audited)
For the Year Ended June 30, 2012
(Expressed in United States dollars, unless otherwise stated)
Impuesto al Valor Agregado taxes (IVA) are recoverable value-added taxes charged by the Mexican government on goods sold and services rendered at a rate of 16%. Under certain circumstances, these taxes are recoverable by filing a tax return and as determined by the Mexican taxing authority. Each period, receivables are reviewed for collectability. When a receivable is determined to not be collectable we allow for the receivable until we are either assured of collection or assured that a write-off is necessary. Allowances in association with our receivable from IVA from our Mexico subsidiaries is based on our determination that the Mexican government may not allow the complete refund of these taxes. The Company believes that all amounts recorded as a receivable from the Mexican government will be recovered.
Foreign Currency
The parent company’s functional currency is the United States dollar. The functional currencies of the Company’s wholly-owned subsidiaries are the U.S. Dollar and the Canadian Dollar. Monetary assets and liabilities denominated in foreign currencies are translated using the exchange rate prevailing at the consolidated balance sheet date. Foreign currency transaction gains and losses are included in the statement of operations and comprehensive loss. The aggregate foreign transaction loss for the year ended June 30, 2012 is $649,243.
The financial statements of the subsidiaries are translated to United States dollars in accordance with ASC 830 using period-end rates of exchange for assets and liabilities, and average rates of exchange for the period for revenues and expenses. Translation gains (losses) are recorded in accumulated other comprehensive income (loss) as a component of stockholders’ equity.
| 2. | Recent Accounting Pronouncements Adopted: |
In January 2010, the FASB issued guidance regarding fair value: 1) adding new requirements for disclosures about transfers into and out of Levels 1 and 2 measurements and separate disclosures about purchases, sales, issuances and settlements relating to Level 3 measurements, and 2) clarifying existing fair value disclosures about the level of disaggregation and about inputs and valuation techniques used to measure fair value. The guidance also required that disclosures about postretirement benefit plan assets be provided by classes of assets instead of by major categories of assets. The guidance is effective for the first reporting period beginning after December 15, 2009, except for the requirement to provide Level 3 activity, which was effective for fiscal years beginning after December 15, 2010. The Company has adopted this guidance, which did not have any effect on its results of operations, financial position and cash flows.
In May 2011, the FASB issued ASU 2011-04, “Fair Value Measurement (Topic 820): Amendments to Achieve Common Fair Value Measurement and Disclosure Requirements in U.S. GAAP and IFRSs.” The new guidance does not extend the use of fair value accounting, but provides guidance on how it should be applied where its use is already required or permitted by other standards within GAAP or International Financial Reporting Standards (“IFRSs”). The new guidance also changes the working used to describe many requirements in GAAP for measuring fair value and for disclosing information about fair value measurements and it clarifies the FASB’s intent about the application of existing fair value measurements. The new guidance applies prospectively and is effective for interim and annual periods beginning after December 15, 2011. We do not expect the adoption of the new provisions to have a material impact on our financial condition or results of operations.
The accompanying notes are an integral part of the consolidated financial statements
PARAMOUNT GOLD AND SILVER CORP.
(An Exploration Stage Mining Company)
Notes to Consolidated financial statements (Audited)
For the Year Ended June 30, 2012
(Expressed in United States dollars, unless otherwise stated)
In June 2011, the FASB issued Accounting Standards Update No. 2011-05, Comprehensive Income (Topic 220): Presentation of Comprehensive Income (ASU 2011-05). The objective of this amendment is to increase the prominence of other comprehensive income in the financial statements. The amendments require entities to report components of net income and the components of other comprehensive income either in a continuous statement of comprehensive income or in two separate but consecutive statements. Additionally, the amendments in ASU 2011-05 require an entity to present on the face of the financial statements reclassification adjustments for items that are reclassified from other comprehensive income to net income in the statements where the components of net income and the components of other comprehensive income are presented. In December 2011, the FASB issued Accounting Standards Update No. 2011-12, which deferred the specific requirements related to the presentation of reclassification adjustments. This amendment is effective for fiscal years, and interim periods within those years, beginning after December 15, 2011. We expect the adoption of this ASU will affect financial statement presentation only.
In September 2011, FASB issued Accounting Standards Update No. 2011-08, Testing Goodwill for Impairment (ASU 2011-08), which amends the guidance in ASC 350-20. The amendments in ASU 2011-08 provide entities with the option of performing a qualitative assessment before performing the first step of the two-step impairment test. If entities determine, on the basis of qualitative factors, it is not more likely than not that the fair value of the reporting unit is less than the carrying amount, then performing the two-step impairment test would be unnecessary. However, if an entity concludes otherwise, then it is required to perform the first step of the two-step impairment test by calculating the fair value of the reporting unit and comparing the fair value with the carrying amount of the reporting unit. If the carrying amount of a reporting unit exceeds its fair value, then the entity is required to perform the second step of the goodwill impairment test to measure the amount of the impairment loss, if any. ASU 2011-08 also provides entities with the option to bypass the qualitative assessment for any reporting unit in any period and proceed directly to the first step of the two-step impairment test. ASU 2011-08 is effective for interim and annual periods beginning after December 15, 2011 but early adoption is permitted. The Company does not expect material financial statement implications relating to the adoption of this ASU.
| 3. | Marketable Securities and Investments: |
As of June 30, 2011, the Company had investments in available-for-sale securities with a cost basis of $350,164. The investments included certain equity securities of entities involved in the exploration of precious metals. For the year ended June 30, 2012, the Company sold its investment in available-for-sale securities for proceeds of $144,690 and recorded a loss on its statement of operations and comprehensive loss of $205,474. The Company also recorded a gain on its statement of operations and comprehensive loss of $38,743 for securities which were previously restricted from sale that were sold during the year-ended June 30, 2012.
| 4. | Fair Value Measurements: |
Fair value is the price that would be received from selling an asset or paid to transfer a liability in an orderly transaction between market participants at the measurement date. Fair value is estimated by applying the following hierarchy, which prioritizes the inputs used to measure fair value into three levels and bases the categorization with the hierarchy upon the lowest level of input that is available and significant to the fair value measurement:
The fair value hierarchy consists of three broad levels, which gives the highest priority to unadjusted quoted prices in active markets for identical assets or liabilities (Level 1) and the lowest priority to unobservable inputs (Level 3).
The three levels of the fair value hierarchy under ASC 820 are described below:
The accompanying notes are an integral part of the consolidated financial statements
PARAMOUNT GOLD AND SILVER CORP.
(An Exploration Stage Mining Company)
Notes to Consolidated financial statements (Audited)
For the Year Ended June 30, 2012
(Expressed in United States dollars, unless otherwise stated)
| Level 1 | Unadjusted quoted prices in active markets that are accessible at the measurement date for identical, unrestricted assets or liabilities. |
| Level 2 | Inputs other than quoted prices included within Level 1 that are observable for the asset or liability, either directly or indirectly, including quoted prices for similar assets or liabilities in active markets; quoted prices for identical or similar assets or liabilities in markets that are not active; inputs other than quoted prices that are observable for the asset or liability (e.g., interest rates); and inputs that are derived principally from or corroborated by observable market data by correlation or other means. |
| Level 3 | Inputs that are both significant to the fair value measurement and unobservable. |
The accompanying notes are an integral part of the consolidated financial statements
PARAMOUNT GOLD AND SILVER CORP.
(An Exploration Stage Mining Company)
Notes to Consolidated financial statements (Audited)
For the Year Ended June 30, 2012
(Expressed in United States dollars, unless otherwise stated)
| 4. | Fair Value Measurements (Continued): |
The following table sets forth the Company’s financial assets and liabilities measured at fair value by level within the fair value hierarchy. As required by ASC 820, assets and liabilities are classified in their entirety based on the lowest level of input that is significant to the fair value measurement.
| | | | | | Fair Value at June 30, 2012 | | | June 30, 2011 | |
| Assets | | Total | | | Level 1 | | | Level 2 | | | Level 3 | | | Total | |
| Cash and cash equivalents | | $ | 12,500,708 | | | | 12,500,708 | | | | - | | | | - | | | | 14,689,241 | |
| Short-term investments | | | 7,500,000 | | | | 7,500,000 | | | | | | | | | | | | - | |
| Marketable Securities | | | - | | | | - | | | | - | | | | - | | | | 319,219 | |
| | | | | | | | | | | | | | | | | | | | | |
| Liabilities | | | | | | | | | | | | | | | | | | | | |
| Warrant liability | | $ | 10,746,787 | | | | - | | | | - | | | | 10,746,787 | | | | 16,914,660 | |
The Company’s cash and cash equivalents and short-term investments are classified within Level 1 of the fair value hierarchy because they are valued using quoted market prices. The cash and cash equivalents that are valued based on quoted market prices in active markets are primarily comprised of commercial paper, short-term certificates of deposit and U.S. Treasury securities. The amounts receivable represent amounts due from a national government regarding refund of taxes.
The estimated fair value of warrants and options accounted for as liabilities was determined on the date of closing and marked to market at each financial reporting period. The change in fair value of the warrants is recorded in the statement of operations as a gain (loss) and is estimated using the Black-Scholes option-pricing model with the following inputs:
| | | June 30, 2012 |
| Risk free interest rate | | | 0.23 | % |
| Expected life of warrants and options | | Less than 1 year |
| Expected stock price volatility | | | 70.1 | % |
| Expected dividend yield | | | 0 | % |
The changes in fair value of the warrants during the year ended June 30, 2012were as follows:
| Balance at July 1, 2011 | | $ | 16,914,660 | |
| Issuance of warrants and options | | | - | |
| Change in fair value recorded in earnings | | | (6,167,873 | ) |
| Transferred to equity upon exercise | | | - | |
| Balance at June 30, 2012 | | $ | 10,746,787 | |
The accompanying notes are an integral part of the consolidated financial statements
PARAMOUNT GOLD AND SILVER CORP.
(An Exploration Stage Mining Company)
Notes to Consolidated financial statements (Audited)
For the Year Ended June 30, 2012
(Expressed in United States dollars, unless otherwise stated)
During the years ended June 30, 2012, 2011 and 2010, the Company entered into certain non-cash activities as follows:
| | | 2012 | | | 2011 | | | 2010 | |
| Operating and Financing Activities | | | | | | | | | |
| From issuance of shares for acquisitions | | $ | - | | | $ | 29,144,553 | | | $ | - | |
| From issuance of shares for cashless exercise of options | | $ | 16,455 | | | $ | 1,016,273 | | | $ | 1,596,896 | |
| From issuance of shares for mineral properties | | $ | 964,000 | | | $ | - | | | $ | 375,000 | |
a) Share issuances:
Authorized capital stock consists of 200,000,000 common shares with par value of $0.001 per share. At June 30, 2012 there were 147,412,603 shares issued and outstanding and 136,249,512 shares issued and outstanding at June 30, 2011.
During year ended June 30, 2012, the Company issued a total of 11,163,091 common shares which are summarized as follows:
| | | Common Shares | | | | |
| | | 2012 | | | 2011 | | | 2010 | |
| Financing | | | 10,417,776 | | | | 19,395 | | | | 18,400,000 | |
| For acquisition of companies | | | - | | | | 22,007,453 | | | | - | |
| Acquisition of mineral properties | | | 400,000 | | | | - | | | | 300,000 | |
| For exercise of warrants and options | | | 345,315 | | | | 4,153,085 | | | | 8,351,360 | |
| | | | 11,163,091 | | | | 26,179,933 | | | | 27,051,360 | |
For the year ended June 30, 2012, the Company closed a private placement offering pursuant to which the Company sold 10,417,776 shares of its common stock for gross proceeds of $21,356,442, at an offering price of $2.05 per share. In the same period, the Company also recorded share issuance costs of $1,010,270 for net proceeds of $20,346,173.
For the year ended June 30, 2012, the Company entered into an agreement to purchase mining claims in northwestern Nevada in exchange for 400,000 shares of its common stock. The seller of the mineral claims retains a net smelter royalty of 1.5% on the portion of claims not subject to other royalties and a net smelter royalty of 0.5% on the portion already subject to a 2.0% royalty held by a third party.
For the year ended June 30, 2012, the Company issued 345,315 shares for the exercise of options and received cash in the amount of $287,425. The exercise price of these options ranged from $0.65 to $1.55.
The accompanying notes are an integral part of the consolidated financial statements
PARAMOUNT GOLD AND SILVER CORP.
(An Exploration Stage Mining Company)
Notes to Consolidated financial statements (Audited)
For the Year Ended June 30, 2012
(Expressed in United States dollars, unless otherwise stated)
| 6. | Capital Stock (Continued): |
b) Warrants:
The following share purchase warrants were outstanding at June 30, 2012:
| | | Exercise price in CAD | | | Exercise price in USD at June 30, 2012 | | | Number of warrants | | | Remaining contractual life (years) | |
| Warrants * | | $ | 1.05 | | | $ | 1.03 | | | | 7,700,000 | | | | 0.72 | |
| Outstanding and exercisable at June 30, 2012 | | | | | | | | | | | 7,700,000 | | | | | |
* Strike price of warrant contract in Canadian dollars. At June 30, 2012 $1.00 USD = $0.98 CAD.
| | | June 30, 2012 | | | June 30, 2011 | |
| Risk free interest rate | | | 0.19 | % | | | 0.19 | % |
| Expected life of warrants | | .72 year | | 1 year |
| Expected stock price volatility | | | 66 | % | | | 72 | % |
| Expected dividend yield | | | 0 | % | | | 0 | % |
c) Stock options:
On August 23, 2007, the board and stockholders approved the 2007/2008 Stock Incentive & Compensation Plan thereby reserving an additional 4,000,000 common shares for issuance to employees, directors and consultants.
On February 24, 2009, the stockholders approved the 2008/2009 Stock Incentive & Equity Compensation Plan thereby reserving an additional 3,000,000 common shares for future issuance. The stockholders also approved the re-pricing of the exercise price of all outstanding stock options to $0.65 per share.
On December 2, 2011, the stockholders approved the 2011/2012 Stock Incentive & Equity Compensation Plan thereby reserving an additional 4,000,000 common shares for future issuance to employees, directors and consultants.
Stock Based Compensation
The Company uses the Black-Scholes option valuation model to value stock options granted. The Black-Scholes model was developed for use in estimating the fair value of traded options that have no vesting restrictions and are fully transferable. The model requires management to make estimates which are subjective and may not be representative of actual results. Changes in assumptions can materially affect estimates of fair values. For purposes of the calculation, the following assumptions were used:
| | | June 30, 2012 | | | June 30, 2011 | |
| WA Risk free interest rate | | | 0.22 | % | | | 0.43 | % |
| WA Expected dividend yield | | | 0 | % | | | 0 | % |
| WA Expected stock price volatility | | | 77 | % | | | 74 | % |
| WA Expected life of options | | 3.4 years | | 1.8 years |
The accompanying notes are an integral part of the consolidated financial statements
PARAMOUNT GOLD AND SILVER CORP.
(An Exploration Stage Mining Company)
Notes to Consolidated financial statements (Audited)
For the Year Ended June 30, 2012
(Expressed in United States dollars, unless otherwise stated)
| 6. | Capital Stock (Continued): |
Changes in the Company’s stock options for the year ended June 30, 2012 are summarized below:
| Options | | Number | | | Weighted Avg. Exercise Price | | | Weighted-Average Remaining Contractual Term | | | Aggregate Intrinsic Value | |
| Outstanding at June 30, 2010 | | | 2,785,000 | | | $ | 0.91 | | | | 2.40 | | | $ | 1,261,750 | |
| Issued | | | 1,999,375 | | | | 2.09 | | | | | | | | | |
| Cancelled/Expired | | | (200,000 | ) | | | 1.75 | | | | | | | | | |
| Exercised | | | (2,423,255 | ) | | | 1.08 | | | | | | | $ | 3,311,224 | |
| Outstanding at June 30, 2011 | | | 2,161,120 | | | $ | 1.74 | | | | 2.08 | | | $ | 3,280,911 | |
| Issued | | | 1,693,500 | | | | 2.50 | | | | | | | | | |
| Cancelled / Expired | | | (370,500 | ) | | | 2.64 | | | | | | | | | |
| Exercised | | | (355,000 | ) | | | 0.83 | | | | | | | $ | 418,663 | |
| Outstanding at June 30, 2012 | | | 3,129,120 | | | $ | 2.16 | | | | 2.41 | | | $ | 1,166,543 | |
| Exercisable at June 30, 2012 | | | 2,424,121 | | | $ | 2.00 | | | | 1.97 | | | $ | 1,166,543 | |
At June 30, 2012, there were 3,129,120 options outstanding. Options outstanding above that have not been vested at period end are 704,999 which have a maximum service term of 1- 4 years. The vesting of these options is dependent on market conditions which have yet to be met. As of June 30, 2012, there was $479,600 of unrecognized compensation cost related to non-vested stock options to be recognized over a weighted average period of 1.4 years.
A summary of the non-vested options as of June 30, 2012 and 2011 and changes during the fiscal years ended June 30, 2012 and 2011 is as follows:
| Non-vested Options | | Number | | | Weighted Avg. Grant-Date Fair Value | |
| Non-vested at June 30, 2010 | | | 831,252 | | | $ | 0.79 | |
| Issued | | | 1,999,375 | | | | 0.85 | |
| Vested | | | (2,550,628 | ) | | | 0.71 | |
| Forfeited | | | (50,000 | ) | | | 1.15 | |
| Non-vested at June 30, 2011 | | | 229,999 | | | $ | 2.12 | |
| Issued | | | 1,693,500 | | | $ | 1.23 | |
| Vested | | | (1,168,500 | ) | | | 1.03 | |
| Forfeited | | | (50,000 | ) | | | 1.29 | |
| Non-vested at June 30, 2012 | | | 704,999 | | | $ | 1.84 | |
For the year ended June 30, 2012 the Company recognized stock based compensation expense in the amount of $1,918,724 (2011 - $1,200,875, 2010 - $309,840) .
| 7. | Related Party Transactions: |
During the year ended June 30, 2012, directors received cash payments in the amount of $240,500 (2011 -$215,000, 2010 - $144,758) for their services as directors or members of committees of the Company’s Board. During the year ended June 30, 2012, the Company also recorded a non-cash transaction to recognize stock based compensation for directors in the amount of $1,116,551 (2011 -$598,153, 2010 -$nil)
The accompanying notes are an integral part of the consolidated financial statements
PARAMOUNT GOLD AND SILVER CORP.
(An Exploration Stage Mining Company)
Notes to Consolidated financial statements (Audited)
For the Year Ended June 30, 2012
(Expressed in United States dollars, unless otherwise stated)
During the year ended June 30, 2012 the Company made payments of $93,656 (2011 - $96,080, 2010 -$91,469) pursuant to a premises lease agreement to a corporation in which an officer is a shareholder.
All transactions with related parties are made in the normal course of operations and measured at exchange value.
The accompanying notes are an integral part of the consolidated financial statements
PARAMOUNT GOLD AND SILVER CORP.
(An Exploration Stage Mining Company)
Notes to Consolidated financial statements (Audited)
For the Year Ended June 30, 2012
(Expressed in United States dollars, unless otherwise stated)
The Company has capitalized acquisition costs on mineral properties as follows:
| | | June 30, 2012 | | | June 30, 2011 | |
| Iris Royalty | | | 50,000 | | | | 50,000 | |
| Morelos | | | - | | | | 100,000 | |
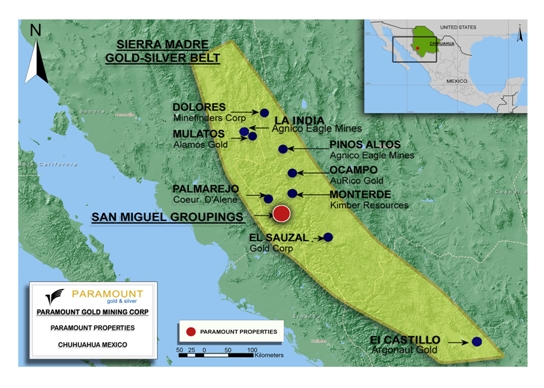
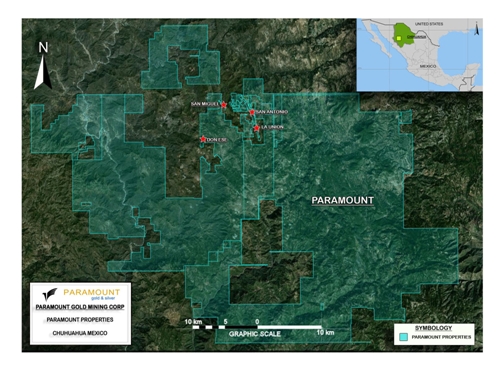
| San Miguel Project | | | 21,992,263 | | | | 21,992,263 | |
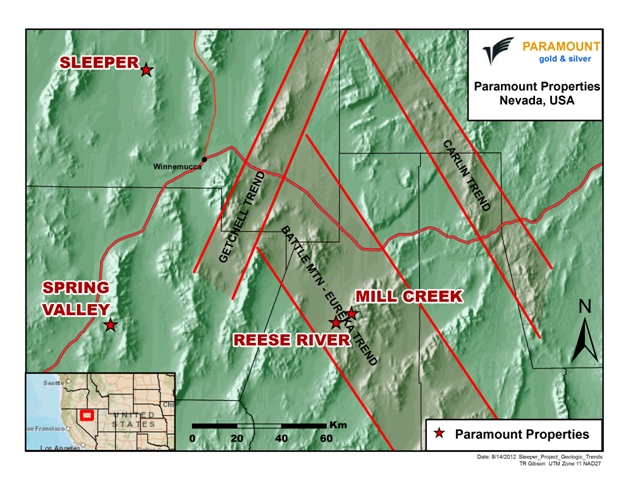
| Sleeper | | | 25,891,490 | | | | 24,827,490 | |
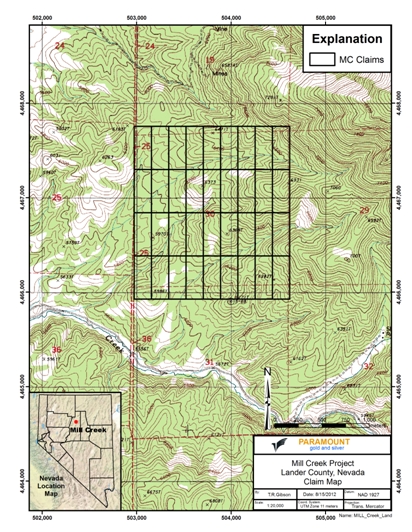
| Mill Creek | | | 2,096,616 | | | | 2,096,616 | |
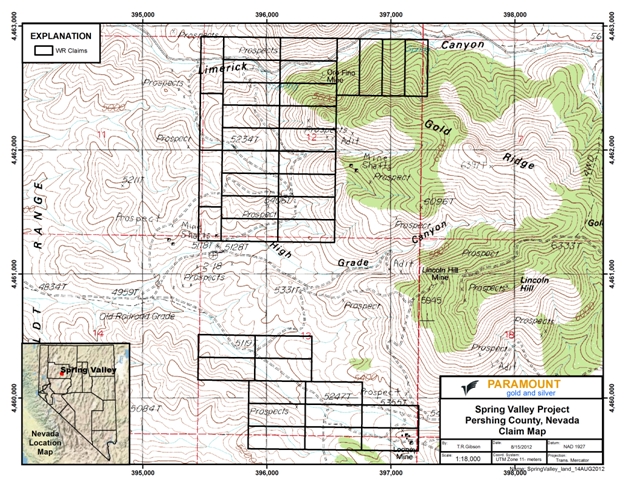
| Spring Valley | | | 385,429 | | | | 385,429 | |
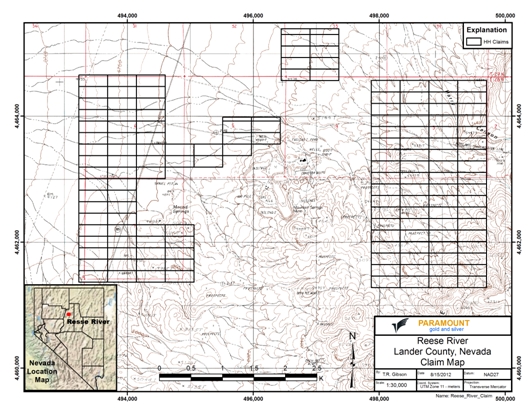
| Reese River | | | 64,061 | | | | 64,061 | |
| | | $ | 50,479,859 | | | $ | 49,515,859 | |
For the year ended June 30, 2012, the Company decided it would not make the required bi-annual mineral concession payments to the Mexican Government for its interest in the Morelos property. As a result, the value the Company has recorded for its interest in the Morelos property has been written off and a loss of $100,000 has been recorded on the statement of operations and comprehensive loss.
For the year ended June 30, 2012, the Company purchased mineral claims that are related to the Sleeper Gold Project for shares in the Company’s common stock. The fair value of the shares issued were $964,000.
For the year ended June 30, 2012, the Company made a payment for $100,000 towards a previously purchased mineral claim that is part of the Sleeper Gold Project.
| 9. | Property and Equipment: |
| | | | | | | | | Net Book Value | |
| | | Cost | | | Accumulated Amortization | | | June 30, 2012 | | | June 30,2011 | |
| | | | | | | | | | | | | |
| Property and Equipment | | $ | 856,285 | | | $ | 397,348 | | | $ | 458,937 | | | $ | 487,740 | |
During the year ended June 30, 2012, net additions to property, and equipment were $48,352 (2011- $10,989). During the year ended June 30, 2012 the Company recorded depreciation of $77,155 (2011-$73,299, 2010 – $66,367).
The accompanying notes are an integral part of the consolidated financial statements
PARAMOUNT GOLD AND SILVER CORP.
(An Exploration Stage Mining Company)
Notes to Consolidated financial statements (Audited)
For the Year Ended June 30, 2012
(Expressed in United States dollars, unless otherwise stated)
| 10. | Segmented Information: |
Segmented information has been compiled based on the geographic regions in which the Company has acquired mineral properties and performs exploration activities.
Loss for the period by geographical segment for the year ended June 30, 2012:
| | | United States | | | Mexico | | | Total | |
| Interest income | | $ | 32,869 | | | $ | 9,791 | | | $ | 42,660 | |
| Other income | | | 73,130 | | | | - | | | | 73,130 | |
| Total income | | $ | 105,999 | | | $ | 9,791 | | | $ | 115,790 | |
| | | | | | | | | | | | | |
| Expenses: | | | | | | | | | | | | |
| Exploration | | | 4,479,783 | | | | 8,947,593 | | | | 13,427,376 | |
| Professional fees | | | 1,166,881 | | | | - | | | | 1,166,881 | |
| Directors compensation | | | 1,357,051 | | | | - | | | | 1,357,051 | |
| Travel and lodging | | | 224,705 | | | | - | | | | 224,705 | |
| Corporate communications | | | 440,382 | | | | - | | | | 440,382 | |
| Consulting fees | | | 475,087 | | | | - | | | | 475,087 | |
| Office and administration | | | 383,691 | | | | 68,082 | | | | 451,773 | |
| Interest and service charges | | | 7,480 | | | | 3,168 | | | | 10,648 | |
| Insurance | | | 323,777 | | | | - | | | | 323,777 | |
| Amortization | | | 41,027 | | | | 36,128 | | | | 77,155 | |
| Accretion | | | 153,704 | | | | - | | | | 153,704 | |
| Write-down of mineral properties | | | - | | | | 100,000 | | | | 100,000 | |
| Total Expenses | | | 9,053,568 | | | | 9,154,971 | | | | 18,208,539 | |
| Net loss before other items | | $ | 8,947,569 | | | $ | 9,145,180 | | | $ | 18,092,749 | |
| | | | | | | | | | | | | |
| Other items | | | | | | | | | | | | |
| Change in fair value of warrant liability | | | (6,167,873 | ) | | | - | | | | (6,167,873 | ) |
| Loss on sale of marketable securities | | | 166,732 | | | | - | | | | 166,732 | |
| Net Loss | | $ | 2,946,428 | | | $ | 9,145,180 | | | $ | 12,091,608 | |
| | | | | | | | | | | | | |
| Other comprehensive loss | | | | | | | | | | | | |
| Foreign currency translation adjustment | | | 113,460 | | | | - | | | | 113,460 | |
| Unrealized loss on available for sale securities | | | (30,945 | ) | | | | | | | (30,945 | ) |
| Total Comprehensive Loss for the Period | | $ | 3,028,943 | | | $ | 9,145,180 | | | $ | 12,174,123 | |
The accompanying notes are an integral part of the consolidated financial statements
PARAMOUNT GOLD AND SILVER CORP.
(An Exploration Stage Mining Company)
Notes to Consolidated financial statements (Audited)
For the Year Ended June 30, 2012
(Expressed in United States dollars, unless otherwise stated)
| 10. | Segmented Information (Continued): |
Loss for the period by geographical segment for the year ended June 30, 2011:
| | | United States | | | Mexico / Latin America | | | Total | |
| Interest income | | $ | 81,265 | | | $ | 37,605 | | | $ | 118,870 | |
| Other income | | | 178,230 | | | | 2,603 | | | | 180,833 | |
| Total income | | $ | 259,495 | | | $ | 40,208 | | | $ | 299,703 | |
| | | | | | | | | | | | | |
| Expenses: | | | | | | | | | | | | |
| Exploration | | | 4,516,969 | | | | 3,467,805 | | | | 7,984,774 | |
| Professional fees | | | 1,280,869 | | | | - | | | | 1,280,869 | |
| Directors compensation | | | 813,154 | | | | - | | | | 813,154 | |
| Travel and lodging | | | 212,999 | | | | - | | | | 212,999 | |
| Corporate communications | | | 260,309 | | | | - | | | | 260,309 | |
| Consulting fees | | | 464,790 | | | | - | | | | 464,790 | |
| Office and administration | | | 297,702 | | | | 36,087 | | | | 333,789 | |
| Interest and service charges | | | 9,586 | | | | 3,057 | | | | 12,643 | |
| Insurance | | | 317,457 | | | | - | | | | 317,457 | |
| Amortization | | | 20,161 | | | | 53,138 | | | | 73,299 | |
| Accretion | | | 119,884 | | | | - | | | | 119,884 | |
| Acquisition Expenses | | | 262,764 | | | | - | | | | 262,764 | |
| Write off of mineral property | | | - | | | | 10,000 | | | | 10,000 | |
| Income and other taxes | | | 13,015 | | | | - | | | | 13,015 | |
| Total Expenses | | | 8,589,659 | | | | 3,570,087 | | | | 12,159,746 | |
| Net loss before other items | | $ | 8,330,164 | | | $ | 3,529,879 | | | $ | 11,860,043 | |
| | | | | | | | | | | | | |
| Other item | | | | | | | | | | | | |
| Change in fair value of equity conversion right | | | 169,081 | | | | - | | | | 169,081 | |
| Change in fair value of warrant liability | | | 16,421,412 | | | | - | | | | 16,421,412 | |
| Net Loss | | $ | 24,920,657 | | | $ | 3,529,879 | | | $ | 28,450,536 | |
| | | | | | | | | | | | | |
| Other comprehensive loss | | | | | | | | | | | | |
| Foreign currency translation adjustment | | | (492,405 | ) | | | - | | | | (492,405 | ) |
| Unrealized loss on available for sale securities | | | 30,945 | | | | - | | | | 30,945 | |
| Total Comprehensive Loss for the Period | | $ | 24,459,197 | | | $ | 3,529,879 | | | $ | 27,989,076 | |
The accompanying notes are an integral part of the consolidated financial statements
PARAMOUNT GOLD AND SILVER CORP.
(An Exploration Stage Mining Company)
Notes to Consolidated financial statements (Audited)
For the Year Ended June 30, 2012
(Expressed in United States dollars, unless otherwise stated)
| 10. | Segmented Information (Continued): |
Loss for the period by geographical segment for the year ended June 30, 2010:
| | | United States | | | Mexico / Latin America | | | Total | |
| Interest income | | $ | 35,779 | | | $ | 74 | | | $ | 35,853 | |
| Total income | | $ | 35,779 | | | $ | 74 | | | $ | 35,853 | |
| | | | | | | | | | | | | |
| Expenses: | | | | | | | | | | | | |
| Exploration | | | 640,045 | | | | 5,403,746 | | | | 6,043,791 | |
| Professional fees | | | 930,926 | | | | 478 | | | | 931,404 | |
| Directors compensation | | | 141,224 | | | | - | | | | 141,224 | |
| Travel and lodging | | | 192,642 | | | | - | | | | 192,642 | |
| Corporate communications | | | 332,139 | | | | - | | | | 332,139 | |
| Consulting fees | | | 418,437 | | | | - | | | | 418,437 | |
| Office and administration | | | 310,371 | | | | 118,778 | | | | 429,149 | |
| Interest and service charges | | | 53,818 | | | | 3,826 | | | | 57,644 | |
| Insurance | | | 47,804 | | | | - | | | | 47,804 | |
| Amortization | | | 18,661 | | | | 47,706 | | | | 66,367 | |
| Acquisition expenses | | | 1,242,569 | | | | - | | | | 1,242,569 | |
| Miscellaneous | | | 18,124 | | | | - | | | | 18,124 | |
| Write off of mineral property | | | 275,000 | | | | - | | | | 275,000 | |
| Income and other taxes | | | 51,732 | | | | - | | | | 51,732 | |
| Total Expenses | | | 4,673,492 | | | | 5,574,534 | | | | 10,248,026 | |
| Net loss before other items | | $ | 4,637,713 | | | $ | 5,574,460 | | | $ | 10,212,173 | |
| | | | | | | | | | | | | |
| Other item | | | | | | | | | | | | |
| Change in fair value of equity conversion right | | | 821,155 | | | | - | | | | 821,155 | |
| Change in fair value of warrant liability | | | (5,681,370 | ) | | | - | | | | (5,681,370 | ) |
| Net Loss | | $ | (222,502 | ) | | $ | 5,574,460 | | | $ | 5,351,958 | |
| | | | | | | | | | | | | |
| Other comprehensive loss | | | | | | | | | | | | |
| Foreign currency translation adjustment | | | 156,483 | | | | - | | | | 156,483 | |
| Total Comprehensive Loss for the Period | | $ | (66,019 | ) | | $ | 5,574,460 | | | $ | 5,508,441 | |
The accompanying notes are an integral part of the consolidated financial statements
PARAMOUNT GOLD AND SILVER CORP.
(An Exploration Stage Mining Company)
Notes to Consolidated financial statements (Audited)
For the Year Ended June 30, 2012
(Expressed in United States dollars, unless otherwise stated)
| 10. | Segmented Information (Continued): |
Assets by geographical segment:
| | | United States | | | Mexico | | | Total | |
| June 30, 2012 | | | | | | | | | |
| Mineral properties | | $ | 28,337,596 | | | $ | 22,142,263 | | | $ | 50,479,859 | |
| Property and equipment | | | 99,686 | | | | 359,251 | | | | 458,937 | |
| | | | | | | | | | | | | |
| June 30, 2011 | | | | | | | | | | | | |
| Mineral properties | | | 27,373,596 | | | | 22,142,263 | | | | 49,515,859 | |
| Property and equipment | | $ | 131,683 | | | $ | 356,057 | | | $ | 487,740 | |
| 11. | Reclamation and Environmental: |
The Company holds an insurance policy related to its Sleeper Gold Project that covers reclamation costs in the event the Company defaults on payments of its reclamation costs up to an aggregate of $25 million. The insurance premium is being amortized over ten years and the current and non-current prepaid insurance balance at June 30, 2012 is $613,037.
As a part of the policy, the Company has funds in a commutation account which is used to reimburse reclamation costs and indemnity claims. For the year ended June 30, 2012, the Company and the Bureau of Land Management of Nevada reviewed the previous reclamation cost estimates for the exploration activities of the Company and determined an increase in those estimates was required. As a result, the Company provided additional bonding to the Bureau of Land Management and increased the balance of the commutation account by $82,678. The balance of the commutation account at June 30, 2012 is $2,754,316.
Reclamation and environmental costs are based principally on legal requirements. Management estimates costs associated with reclamation of mineral properties. On an ongoing basis the Company evaluates its estimates and assumptions; however, actual amounts could differ from those based on estimates and assumptions. A liability has been established equal to the present value of the obligation, and the carrying amount of the mineral properties has been increased by the same amount.
Changes to the Company’s asset retirement obligations are as follows:
| | | June 30, 2012 | | | June 30, 2011 | |
| Balance at beginning of period | | $ | 1,143,892 | | | $ | - | |
| Asset retirement obligations acquired | | | | | | | 1,121,150 | |
| Accretion expense | | | 153,704 | | | | 119,884 | |
| Payments | | | (99,417 | ) | | | (97,142 | ) |
| Balance at end of period | | $ | 1,198,179 | | | $ | 1,143,892 | |
The accompanying notes are an integral part of the consolidated financial statements
PARAMOUNT GOLD AND SILVER CORP.
(An Exploration Stage Mining Company)
Notes to Consolidated financial statements (Audited)
For the Year Ended June 30, 2012
(Expressed in United States dollars, unless otherwise stated)
At June 30, 2012, the Company has unused tax loss carry forwards in the United States of $31,619,622 (2011 - $22,595,854, 2010 - $17,769,298) expiring between the years 2019 and 2032 which are available to reduce taxable income and unused capital loss carry forwards of $2,156,659 (2011 - $nil, 2010 - $nil) expiring in year 2015 which are available to reduce taxable capital gains. As at June 30, 2012 the Company has unused tax loss carry forwards in Canada of $6,369,054 (2011 - $6,643,964, 2010 - $nil) expiring between 2013 and 2032 which are available to reduce taxable income. As at June 30, 2012 the Company has unused tax loss carry forwards in Mexico and Peru of $30,829,351 (2011 - $29,837,310, 2010 - $24,633,228) which are available to reduce taxable income. The tax effects of the significant components within the Company’s deferred tax asset (liability) at June 30, 2012 are as follows:
| | | 2012 | | | 2011 | | | 2010 | |
| United States | | | | | | | | | |
| Loss carry forwards | | | 10,750,672 | | | | 6,778,756 | | | | 5,330,789 | |
| Capital loss carry forwards | | | 733,264 | | | | - | | | | - | |
| Other | | | 407,381 | | | | 343,168 | | | | (154,964 | ) |
| Mineral properties | | | 1,248,312 | | | | 1,299,948 | | | | - | |
| Property, plant and equipment | | | (16,554 | ) | | | (25,207 | ) | | | 27 | |
| Canada | | | | | | | | | | | | |
| Loss carry forwards | | | 1,592,263 | | | | 1,660,991 | | | | - | |
| Other | | | 2,825 | | | | 7,469 | | | | - | |
| Property, plant and equipment | | | 56,837 | | | | 63,961 | | | | - | |
| Mexico | | | | | | | | | | | | |
| Loss carry forwards | | | 8,632,218 | | | | 7,053,872 | | | | 5,774,229 | |
| Property, plant and equipment | | | 97,768 | | | | 76,997 | | | | 56,134 | |
| Peru | | | | | | | | | | | | |
| Loss carry forwards | | | - | | | | 1,393,473 | | | | 1,203,263 | |
| | | | | | | | | | | | | |
| Valuation allowance | | | (23,504,986 | ) | | | (18,653,428 | ) | | | (12,209,478 | ) |
| | | | | | | | | | | | | |
| Net deferred tax asset | | | - | | | | - | | | | - | |
The income tax expense differs from the amounts computed by applying statutory tax to pre-tax losses as a result of the following:
| | | 2012 | | | 2011 | | | 2010 | |
| | | | | | | | | | |
| Loss before income taxes | | | (12,091,608 | ) | | | (28,450,536 | ) | | | (5,351,958 | ) |
| Statutory tax rate | | | 34 | % | | | 30 | % | | | 30 | % |
| Expected recovery at statutory tax rate | | | (4,111,147 | ) | | | (8,535,161 | ) | | | (1,605,587 | ) |
| Adjustments to benefits resulting from: | | | | | | | | | | | | |
| | | | | | | | | | | | | |
| Impact of lower tax rate in subsidiaries | | | 524,715 | | | | 112,345 | | | | 106,980 | |
| Permanent differences | | | (1,119,555 | ) | | | - | | | | - | |
| Terminal loss on disposal of asset | | | (145,571 | ) | | | 5,738,239 | | | | (1,509,157 | ) |
| Valuation allowance | | | 4,851,558 | | | | 2,684,577 | | | | 3,007,764 | |
| | | | | | | | | | | | | |
| Provision for income taxes | | | - | | | | - | | | | - | |
The accompanying notes are an integral part of the consolidated financial statements
PARAMOUNT GOLD AND SILVER CORP.
(An Exploration Stage Mining Company)
Notes to Consolidated financial statements (Audited)
For the Year Ended June 30, 2012
(Expressed in United States dollars, unless otherwise stated)
The potential tax benefits of net operating and capital losses have not been recognized in these financial statements because the Company cannot be assured it is more likely than not it will utilize the net operating or capital losses carried forward in future years.
Accounting for uncertainty for Income Tax
Income taxes are determined using assets and liability method. Deferred tax assets and liabilities are recognized for the future tax consequences attributable to differences between the financial statement carrying amounts of existing assets and liabilities and their respective tax bases. Deferred tax assets and liabilities are measured using the enacted tax rates expected to apply to taxable income in the years in which those temporary differences are expected to be recovered or settled. The effect on deferred tax assets and liabilities of a change in tax rates is recognized in the period that includes the enactment date. In addition, a valuation allowance is established to reduce any deferred tax asset for which it is determined that it is more likely than not that some portion of the deferred tax asset will not be realized.
Effective July 1, 2009, the Company adopted the interpretation for accounting for uncertainty in income taxes which was an interpretation of the accounting standard accounting for income taxes. This interpretation created a single model to address accounting for uncertainty in tax positions. This interpretation clarifies the accounting for income taxes, by prescribing a minimum recognition threshold a tax position is required to meet before being recognized in the financial statements.
As at June 30, 2012 and 2011, the Company’s consolidated balance sheets did not reflect a liability for uncertain tax positions, nor any accrued penalties or interest associated with income tax uncertainties. The Company is subject to income taxation at the federal and state levels. The Company is subject to US federal tax examinations for the tax years 2008 through 2011. Loss carryforwards generated or utilized in years earlier than 2008 are also subject to examination and adjustment. The Company has no income tax examinations in process.
In July 2012, the Company exercised two options to acquire 11 mining concessions located in Mexico and related to its San Miguel project. In consideration for the mining concessions, the Company has made cash payments totaling $1,693,000. Included in the payment is a value added tax amount of $234,200 from the Mexican Government.
The accompanying notes are an integral part of the consolidated financial statements
F-25