UNITED STATES
SECURITIES AND EXCHANGE COMMISSION
WASHINGTON, D.C. 20549
FORM N-CSR
CERTIFIED SHAREHOLDER REPORT OF REGISTERED
MANAGEMENT INVESTMENT COMPANIES
Investment Company Act file number: 811-21829
BBH TRUST
On behalf of the following series:
BBH Core Select
BBH Global Core Select
BBH Partner Fund - International Equity
BBH Limited Duration Fund
BBH Intermediate Municipal Bond Fund
BBH Income Fund
(Exact name of registrant as specified in charter)
140 Broadway, New York, NY 10005
(Address of principal executive offices) (Zip Code)
Corporation Services Company
2711 Centerville Road, Suite 400
Wilmington, DE 19808
(Name and address of agent for service)
Registrant's telephone number, including area code: (800) 575-1265
Date of fiscal year end: October 31
Date of reporting period: October 31, 2018
Form N-CSR is to be used by management investment companies to file reports with the Commission not later than 10 days after the transmission to stockholders of any report that is required to be transmitted to stockholders under Rule 30e-1 under the Investment Company Act of 1940 (17 CFR 270.30e-1). The Commission may use the information provided on Form N-CSR in its regulatory, disclosure review, inspection, and policymaking roles.
A registrant is required to disclose the information specified by Form N-CSR, and the Commission will make this information public. A registrant is not required to respond to the collection of information contained in Form N-CSR unless the Form displays a currently valid Office of Management and Budget (“OMB”) control number. Please direct comments concerning the accuracy of the information collection burden estimate and any suggestions for reducing the burden to Secretary, Securities and Exchange Commission, 450 Fifth Street, NW, Washington, DC 20549-0609. The OMB has reviewed this collection of information under the clearance requirements of 44 U.S.C. § 3507.
Item 1. Report to Stockholders.

BBH CORE SELECT
MANAGEMENT’S DISCUSSION OF FUND PERFORMANCE
October 31, 2018
* | A margin of safety exists when we believe there is a significant discount to intrinsic value at the time of purchase — we aim to purchase at 75% of our estimate to intrinsic value or less. Intrinsic value represents what we believe to be the value of a security based on our analysis of both tangible and intangible factors. |
BBH CORE SELECT
MANAGEMENT’S DISCUSSION OF FUND PERFORMANCE (continued)
October 31, 2018
financial statements october 31, 2018 | 3 |
BBH CORE SELECT
MANAGEMENT’S DISCUSSION OF FUND PERFORMANCE (continued)
October 31, 2018
BBH CORE SELECT
MANAGEMENT’S DISCUSSION OF FUND PERFORMANCE (continued)
October 31, 2018
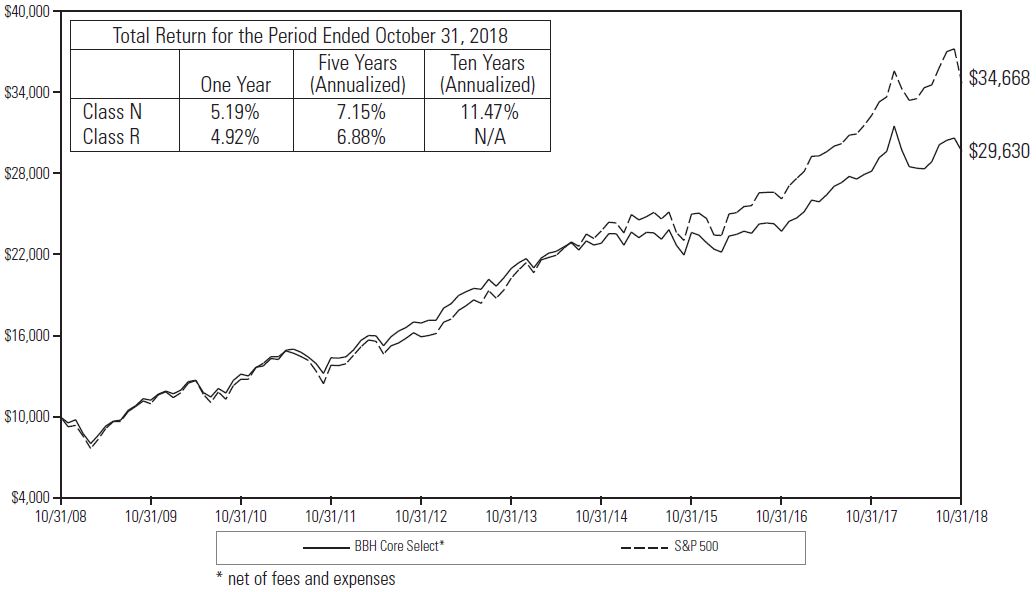 |
| 1 | The Fund’s performance assumes the reinvestment of all dividends and distributions. The S&P 500 has been adjusted to reflect reinvestment of dividends on securities. The S&P 500 is not adjusted to reflect sales charges, expenses or other fees that the Securities and Exchange Commission requires to be reflected in the Fund’s performance. The index is unmanaged. Investments cannot be made in an index. |
financial statements october 31, 2018 | 5 |
BBH CORE SELECT
REPORT OF INDEPENDENT REGISTERED PUBLIC ACCOUNTING FIRM
October 31, 2018
BBH CORE SELECT
REPORT OF INDEPENDENT REGISTERED PUBLIC ACCOUNTING FIRM (continued)
October 31, 2018
evaluating the accounting principles used and significant estimates made by management, as well as evaluating the overall presentation of the financial statements and financial highlights. Our procedures included confirmation of securities owned as of October 31, 2018, by correspondence with the custodian and brokers. We believe that our audits provide a reasonable basis for our opinion.
 |
December 21, 2018
financial statements october 31, 2018 | 7 |
BBH CORE SELECT
PORTFOLIO ALLOCATION
October 31, 2018
| U.S. $ Value | Percent of Net Assets | |||||||||
Common Stock: | ||||||||||
Basic Materials | $ | 96,142,883 | 5.7 | % | ||||||
Communications | 291,308,033 | 17.2 | ||||||||
Consumer Cyclical | 105,639,115 | 6.3 | ||||||||
Consumer Non-Cyclical | 590,526,913 | 34.9 | ||||||||
Financials | 289,790,885 | 17.1 | ||||||||
Industrials | 64,286,937 | 3.8 | ||||||||
Technology | 186,833,294 | 11.0 | ||||||||
Repurchase Agreements | 63,800,000 | 3.8 | ||||||||
Cash and Other Assets in Excess of Liabilities | 4,020,844 | 0.2 | ||||||||
NET ASSETS | $ | 1,692,348,904 | 100.0 | % | ||||||
The accompanying notes are an integral part of these financial statements.
BBH CORE SELECT
PORTFOLIO OF INVESTMENTS
October 31, 2018
| Shares | Value | |||||||||
COMMON STOCK (96.0%) | ||||||||||
BASIC MATERIALS (5.7%) | ||||||||||
| 413,443 | Celanese Corp. (Series A) | $ | 40,079,165 | |||||||
| 338,815 | Linde, Plc. (Ireland) | 56,063,718 | ||||||||
Total Basic Materials | 96,142,883 | |||||||||
COMMUNICATIONS (17.2%) | ||||||||||
| 96,806 | Alphabet, Inc. (Class C)1 | 104,237,797 | ||||||||
| 2,691,704 | Comcast Corp. (Class A) | 102,661,590 | ||||||||
| 1,715,664 | Discovery, Inc. (Class C)1 | 50,286,112 | ||||||||
| 1,362,721 | Liberty Global, Plc. (Class C) (United Kingdom)1 | 34,122,534 | ||||||||
Total Communications | 291,308,033 | |||||||||
CONSUMER CYCLICAL (6.3%) | ||||||||||
| 718,755 | Copart, Inc.1 | 35,154,307 | ||||||||
| 227,766 | Dollar General Corp. | 25,368,577 | ||||||||
| 2,056,346 | Qurate Retail, Inc. (Class A)1 | 45,116,231 | ||||||||
Total Consumer Cyclical | 105,639,115 | |||||||||
CONSUMER NON-CYCLICAL (34.9%) | ||||||||||
| 250,912 | Dentsply Sirona, Inc. | 8,689,083 | ||||||||
| 440,700 | Diageo, Plc. ADR (United Kingdom) | 60,887,112 | ||||||||
| 346,258 | FleetCor Technologies, Inc.1 | 69,261,988 | ||||||||
| 648,185 | Henry Schein, Inc.1 | 53,799,355 | ||||||||
| 2,124,650 | Kroger Co. | 63,229,584 | ||||||||
| 362,987 | Nestle SA ADR (Switzerland) | 30,592,544 | ||||||||
| 891,011 | Novartis AG ADR (Switzerland) | 77,927,822 | ||||||||
| 451,083 | PayPal Holdings, Inc.1 | 37,976,678 | ||||||||
| 682,757 | Perrigo Co., Plc. (Ireland) | 47,997,817 | ||||||||
| 1,756,928 | Sabre Corp. | 43,308,275 | ||||||||
| 649,022 | Unilever NV (NY Shares) (Netherlands) | 34,904,403 | ||||||||
| 687,213 | Zoetis, Inc. (Class A) | 61,952,252 | ||||||||
Total Consumer Non-Cyclical | 590,526,913 | |||||||||
The accompanying notes are an integral part of these financial statements.
financial statements october 31, 2018 | 9 |
BBH CORE SELECT
PORTFOLIO OF INVESTMENTS (continued)
October 31, 2018
| Shares | Value | |||||||||
COMMON STOCK (continued) | ||||||||||
FINANCIALS (17.1%) | ||||||||||
| 408 | Berkshire Hathaway, Inc. (Class A)1 | $ | 125,543,640 | |||||||
| 1,624,224 | US Bancorp | 84,898,189 | ||||||||
| 1,490,683 | Wells Fargo & Co. | 79,349,056 | ||||||||
Total Financials | 289,790,885 | |||||||||
INDUSTRIALS (3.8%) | ||||||||||
| 424,010 | Allegion, Plc. (Ireland) | 36,350,377 | ||||||||
| 312,245 | Waste Management, Inc. | 27,936,560 | ||||||||
Total Industrials | 64,286,937 | |||||||||
TECHNOLOGY (11.0%) | ||||||||||
| 277,805 | KLA-Tencor Corp. | 25,430,270 | ||||||||
| 2,386,759 | Oracle Corp. | 116,569,309 | ||||||||
| 712,891 | QUALCOMM, Inc. | 44,833,715 | ||||||||
Total Technology | 186,833,294 | |||||||||
Total Common Stock (Identified cost $972,135,955) | 1,624,528,060 | |||||||||
The accompanying notes are an integral part of these financial statements.
BBH CORE SELECT
PORTFOLIO OF INVESTMENTS (continued)
October 31, 2018
| Principal Amount | Maturity Date | Interest Rate | Value | |||||||||||||||
REPURCHASE AGREEMENTS (3.8%) | ||||||||||||||||||
| $63,800,000 | National Australia Bank, Ltd. (Agreement dated 10/31/18 collateralized by U.S. Treasury Notes 2.625%, due 07/31/20, original par $64,920,000, valued at $65,076,000) | 11/01/18 | 2.170 | % | $ | 63,800,000 | ||||||||||||
Total Repurchase Agreements (Identified cost $63,800,000) | 63,800,000 | |||||||||||||||||
| TOTAL INVESTMENTS (Identified cost $1,035,935,955)2 | 99.8 | % | $ | 1,688,328,060 | ||||||||||||||
| CASH AND OTHER ASSETS IN EXCESS OF LIABILITIES | 0.2 | % | 4,020,844 | |||||||||||||||
| NET ASSETS | 100.0 | % | $ | 1,692,348,904 | ||||||||||||||
| 1 | Non-income producing security. |
| 2 | The aggregate cost for federal income tax purposes is $1,034,628,608, the aggregate gross unrealized appreciation is $678,110,035, and the aggregate gross unrealized depreciation is $24,410,583, resulting in net unrealized appreciation of $653,699,452. |
The accompanying notes are an integral part of these financial statements.
financial statements october 31, 2018 | 11 |
BBH CORE SELECT
PORTFOLIO OF INVESTMENTS (continued)
October 31, 2018
— | Level 1 – unadjusted quoted prices in active markets for identical assets and liabilities. |
— | Level 2 – significant other observable inputs (including quoted prices for similar assets and liabilities, interest rates, prepayment speeds, credit risk, etc.). |
— | Level 3 – significant unobservable inputs (including the Fund’s own assumptions in determining the fair value of assets and liabilities). |
The accompanying notes are an integral part of these financial statements.
BBH CORE SELECT
PORTFOLIO OF INVESTMENTS (continued)
October 31, 2018
| Investments, at value | Unadjusted Quoted Prices in Active Markets for Identical Investments (Level 1)* | Significant Other Observable Inputs (Level 2)* | Significant Unobservable Inputs (Level 3)* | Balance as of October 31, 2018 | ||||||||||||||
Common Stock: | ||||||||||||||||||
Basic Materials | $ | 96,142,883 | $ | — | $ | — | $ | 96,142,883 | ||||||||||
Communications | 291,308,033 | — | — | 291,308,033 | ||||||||||||||
Consumer Cyclical | 105,639,115 | — | — | 105,639,115 | ||||||||||||||
Consumer Non-Cyclical | 590,526,913 | — | — | 590,526,913 | ||||||||||||||
Financials | 289,790,885 | — | — | 289,790,885 | ||||||||||||||
Industrials | 64,286,937 | — | — | 64,286,937 | ||||||||||||||
Technology | 186,833,294 | — | — | 186,833,294 | ||||||||||||||
Repurchase Agreements | — | 63,800,000 | — | 63,800,000 | ||||||||||||||
Investments, at value | $ | 1,624,528,060 | $ | 63,800,000 | $ | — | $ | 1,688,328,060 | ||||||||||
* | The Fund’s policy is to disclose transfers between levels based on valuations at the end of the reporting period. There were no transfers between Levels 1, 2 or 3 during the period ended October 31, 2018. |
The accompanying notes are an integral part of these financial statements.
financial statements october 31, 2018 | 13 |
BBH CORE SELECT
STATEMENT OF ASSETS AND LIABILITIES
October 31, 2018
| ASSETS: | ||||||
Investments in securities, at value (Identified cost $972,135,955) | $ | 1,624,528,060 | ||||
Repurchase agreements (Identified cost $63,800,000) | 63,800,000 | |||||
Cash | 2,016,289 | |||||
Receivables for: | ||||||
Dividends | 7,897,539 | |||||
Shares sold | 224,156 | |||||
Investment advisory and administrative fee waiver reimbursement | 9,339 | |||||
Interest | 3,846 | |||||
Prepaid assets | 14,058 | |||||
Total Assets | 1,698,493,287 | |||||
LIABILITIES: | ||||||
Payables for: | ||||||
Shares redeemed | 4,429,304 | |||||
Investment advisory and administrative fees | 1,207,411 | |||||
Shareholder servicing fees | 301,853 | |||||
Professional fees | 58,948 | |||||
Custody and fund accounting fees | 31,708 | |||||
Distribution fees | 31,309 | |||||
Transfer agent fees | 9,061 | |||||
Board of Trustees’ fees | 471 | |||||
Accrued expenses and other liabilities | 74,318 | |||||
Total Liabilities | 6,144,383 | |||||
NET ASSETS | $ | 1,692,348,904 | ||||
Net Assets Consist of: | ||||||
Paid-in capital | $ | 675,747,080 | ||||
Retained earnings | 1,016,601,824 | |||||
Net Assets | $ | 1,692,348,904 |
NET ASSET VALUE AND OFFERING PRICE PER SHARE | ||||||
CLASS N SHARES | ||||||
($1,616,856,063 ÷ 77,505,153 shares outstanding) | $20.86 | |||||
RETAIL CLASS SHARES | ||||||
($75,492,841 ÷ 7,052,647 shares outstanding) | $10.70 |
The accompanying notes are an integral part of these financial statements.
BBH CORE SELECT
STATEMENT OF OPERATIONS
For the year ended October 31, 2018
NET INVESTMENT INCOME: | ||||||
Income: | ||||||
Dividends (net of foreign withholding taxes of $1,052,165) | $ | 31,746,759 | ||||
Interest income | 2,650,104 | |||||
Total Income | 34,396,863 | |||||
Expenses: | ||||||
Investment advisory and administrative fees | 18,853,849 | |||||
Shareholder servicing fees | 4,713,462 | |||||
Distribution fees | 223,331 | |||||
Custody and fund accounting fees | 151,013 | |||||
Transfer agent fees | 149,567 | |||||
Professional fees | 70,281 | |||||
Board of Trustees’ fees | 52,963 | |||||
Miscellaneous expenses | 514,220 | |||||
Total Expenses | 24,728,686 | |||||
Investment advisory and administrative fee waiver | (882,428 | ) | ||||
Expense offset arrangement | (36,384 | ) | ||||
Net Expenses | 23,809,874 | |||||
Net Investment Income | 10,586,989 | |||||
NET REALIZED AND UNREALIZED GAIN: | ||||||
Net realized gain on investments in securities | 482,435,941 | |||||
Net change in unrealized appreciation/(depreciation) on investments in securities | (351,225,923 | ) | ||||
Net Realized and Unrealized Gain | 131,210,018 | |||||
Net Increase in Net Assets Resulting from Operations | $ | 141,797,007 |
The accompanying notes are an integral part of these financial statements.
financial statements october 31, 2018 | 15 |
BBH CORE SELECT
STATEMENTS OF CHANGES IN NET ASSETS
| For the years ended October 31, | |||||||||||
| 2018 | 2017 | ||||||||||
DECREASE IN NET ASSETS: | |||||||||||
Operations: | |||||||||||
Net investment income | $ | 10,586,989 | $ | 13,983,608 | |||||||
Net realized gain on investments in securities | 482,435,941 | 542,225,458 | |||||||||
Net change in unrealized appreciation/(depreciation) on investments in securities | (351,225,923 | ) | (1,648,305 | ) | |||||||
Net increase in net assets resulting from operations | 141,797,007 | 554,560,761 | |||||||||
Dividends and distributions declared: | |||||||||||
Class N | (385,882,439 | ) | (263,168,282 | )1 | |||||||
Retail Class | (36,362,272 | ) | (22,162,196 | )2 | |||||||
Total dividends and distributions declared | (422,244,711 | ) | (285,330,478 | ) | |||||||
Share transactions: | |||||||||||
Proceeds from sales of shares3 | 288,574,533 | 263,771,524 | |||||||||
Net asset value of shares issued to shareholders for reinvestment of dividends and distributions | 288,266,495 | 204,685,714 | |||||||||
Proceeds from short-term redemption fees | 8,301 | 14,407 | |||||||||
Cost of shares redeemed3 | (1,343,052,733 | ) | (1,579,605,854 | ) | |||||||
Net decrease in net assets resulting from share transactions | (766,203,404 | ) | (1,111,134,209 | ) | |||||||
Total decrease in net assets | (1,046,651,108 | ) | (841,903,926 | ) | |||||||
NET ASSETS: | |||||||||||
Beginning of year | 2,739,000,012 | 3,580,903,938 | |||||||||
End of year | $ | 1,692,348,904 | $ | 2,739,000,012 | 4 | ||||||
| 1 | For the year ended October 31, 2017, dividends and distributions declared from net investment income and from net realized gains for Class N were equal to $20,614,105 and $242,554,177, respectively. |
| 2 | For the year ended October 31, 2017, dividends and distributions declared from net investment income and from net realized gains for Retail Class were equal to $1,323,018 and $20,839,178, respectively. |
| 3 | Includes share exchanges. See Note 5 in Notes to Financial Statements. |
| 4 | Including undistributed net investment income of $12,701,945. |
The accompanying notes are an integral part of these financial statements.
BBH CORE SELECT
FINANCIAL HIGHLIGHTS
Selected per share data and ratios for a Class N share outstanding throughout each year.
| For the years ended October 31, | |||||||||||||||||||||||
| 2018 | 2017 | 2016 | 2015 | 2014 | |||||||||||||||||||
Net asset value, beginning of year | $ | 23.18 | $ | 21.15 | $ | 22.79 | $ | 22.52 | $ | 21.21 | |||||||||||||
Income from investment operations: | |||||||||||||||||||||||
Net investment income1 | 0.10 | 0.10 | 0.12 | 0.12 | 0.14 | ||||||||||||||||||
Net realized and unrealized gain (loss) | 1.09 | 3.64 | (0.08 | ) | 0.64 | 1.70 | |||||||||||||||||
Total income from investment operations | 1.19 | 3.74 | 0.04 | 0.76 | 1.84 | ||||||||||||||||||
Less dividends and distributions: | |||||||||||||||||||||||
From net investment income | (0.12 | ) | (0.13 | ) | (0.12 | ) | (0.14 | ) | (0.10 | ) | |||||||||||||
From net realized gains | (3.39 | ) | (1.58 | ) | (1.56 | ) | (0.35 | ) | (0.43 | ) | |||||||||||||
Total dividends and distributions | (3.51 | ) | (1.71 | ) | (1.68 | ) | (0.49 | ) | (0.53 | ) | |||||||||||||
Short-term redemption fees1,2 | 0.00 | 0.00 | 0.00 | 0.00 | 0.00 | ||||||||||||||||||
Net asset value, end of year | $ | 20.86 | $ | 23.18 | $ | 21.15 | $ | 22.79 | $ | 22.52 | |||||||||||||
Total return | 5.19 | % | 18.70 | % | 0.40 | % | 3.47 | % | 8.90 | % | |||||||||||||
Ratios/Supplemental data: | |||||||||||||||||||||||
Net assets, end of year (in millions) | $ | 1,617 | $ | 2,592 | $ | 3,403 | $ | 4,970 | $ | 5,816 | |||||||||||||
Ratio of expenses to average net assets before reductions | �� | 1.04 | % | 1.02 | % | 1.01 | % | 1.07 | % | 1.07 | % | ||||||||||||
Fee waiver | 0.04 | %3 | 0.02 | %3 | 0.01 | %3 | 0.07 | %3 | 0.07 | %3 | |||||||||||||
Expense offset arrangement | 0.00 | %4 | 0.00 | %4 | 0.00 | %4 | 0.00 | %4 | 0.00 | %4 | |||||||||||||
Ratio of expenses to average net assets after reductions | 1.00 | % | 1.00 | % | 1.00 | % | 1.00 | % | 1.00 | % | |||||||||||||
Ratio of net investment income to average net assets | 0.46 | % | 0.46 | % | 0.57 | % | 0.53 | % | 0.66 | % | |||||||||||||
Portfolio turnover rate | 14 | % | 15 | % | 12 | % | 8 | % | 8 | % | |||||||||||||
| 1 | Calculated using average shares outstanding for the year. |
| 2 | Less than $0.01. |
| 3 | The ratio of expenses to average net assets for the years ended October 31, 2018, 2017, 2016, 2015 and 2014, reflect fees reduced as result of a contractual operating expense limitation of the share class of 1.00%. The agreement is effective for all years presented and is effective through March 1, 2019 unless renewed by all parties to the agreement. For the years ended October 31, 2018, 2017, 2016, 2015 and 2014, the waived fees were $811,840, $673,403, $531,298, $3,938,986 and $4,238,260, respectively. |
| 4 | Less than 0.01%. |
The accompanying notes are an integral part of these financial statements.
financial statements october 31, 2018 | 17 |
BBH CORE SELECT
FINANCIAL HIGHLIGHTS (continued)
Selected per share data and ratios for a Retail Class share outstanding throughout each year.
| For the years ended October 31, | |||||||||||||||||||||||
| 2018 | 2017 | 2016 | 2015 | 2014 | |||||||||||||||||||
Net asset value, beginning of year | $ | 13.51 | $ | 13.00 | $ | 14.65 | $ | 14.66 | $ | 13.99 | |||||||||||||
Income from investment operations: | |||||||||||||||||||||||
Net investment income1 | 0.02 | 0.03 | 0.05 | 0.03 | 0.06 | ||||||||||||||||||
Net realized and unrealized gain (loss) | 0.64 | 2.16 | (0.07 | ) | 0.42 | 1.11 | |||||||||||||||||
Total income (loss) from investment operations . | 0.66 | 2.19 | (0.02 | ) | 0.45 | 1.17 | |||||||||||||||||
Less dividends and distributions: | |||||||||||||||||||||||
From net investment income | (0.08 | ) | (0.10 | ) | (0.07 | ) | (0.11 | ) | (0.07 | ) | |||||||||||||
From net realized gains | (3.39 | ) | (1.58 | ) | (1.56 | ) | (0.35 | ) | (0.43 | ) | |||||||||||||
Total dividends and distributions | (3.47 | ) | (1.68 | ) | (1.63 | ) | (0.46 | ) | (0.50 | ) | |||||||||||||
Short-term redemption fees1,2 | 0.00 | 0.00 | 0.00 | 0.00 | 0.00 | ||||||||||||||||||
Net asset value, end of year | $ | 10.70 | $ | 13.51 | $ | 13.00 | $ | 14.65 | $ | 14.66 | |||||||||||||
Total return | 4.92 | % | 18.40 | % | 0.19 | % | 3.14 | % | 8.63 | % | |||||||||||||
Ratios/Supplemental data: | |||||||||||||||||||||||
Net assets, end of year (in millions) | $ | 75 | $ | 147 | $ | 178 | $ | 280 | $ | 400 | |||||||||||||
Ratio of expenses to average net assets before reductions | 1.32 | % | 1.33 | % | 1.33 | % | 1.39 | % | 1.40 | % | |||||||||||||
Fee waiver | 0.07 | %3 | 0.08 | %3 | 0.10 | %3 | 0.14 | %3 | 0.15 | %3 | |||||||||||||
Expense offset arrangement | 0.00 | %4 | 0.00 | %4 | 0.00 | %4 | 0.00 | %4 | 0.00 | %4 | |||||||||||||
Ratio of expenses to average net assets after reductions | 1.25 | % | 1.25 | % | 1.23 | % | 1.25 | % | 1.25 | % | |||||||||||||
Ratio of net investment income to average net assets | 0.16 | % | 0.21 | % | 0.37 | % | 0.24 | % | 0.40 | % | |||||||||||||
Portfolio turnover rate | 14 | % | 15 | % | 12 | % | 8 | % | 8 | % | |||||||||||||
| 1 | Calculated using average shares outstanding for the year. |
| 2 | Less than $0.01. |
| 3 | The ratio of expenses to average net assets for the years ended October 31, 2018, 2017, 2016, 2015 and 2014, reflect fees reduced as result of a contractual operating expense limitation of the share class of 1.25%. The agreement is effective for all years presented and is effective through March 1, 2019, unless renewed by all parties to the agreement. For the years ended October 31, 2018, 2017, 2016, 2015 and 2014, the waived fees were $70,588, $133,469, 234,959, $551,384 and $577,948, respectively. |
| 4 | Less than 0.01%. |
The accompanying notes are an integral part of these financial statements.
BBH CORE SELECT
NOTES TO FINANCIAL STATEMENTS
October 31, 2018
1. | Organization. The Fund is a separate, non-diversified series of BBH Trust (the “Trust”), which is registered under the Investment Company Act of 1940, as amended (the “1940 Act”), as an open-end management investment company. The Trust was originally organized under the laws of the State of Maryland on July 16, 1990 as BBH Fund, Inc. and re-organized as a Delaware statutory trust on June 12, 2007. The Fund commenced operations on November 2, 1998. The Fund offers Class N and Retail Class shares. Class N and Retail Class shares have different operating expenses. With the exception of class specific expenses, all expenses are allocated between classes based on net assets. Neither Class N shares nor Retail Class shares automatically convert to any other share class of the Fund. As of October 31, 2018, there were seven series of the Trust. |
2. | Significant Accounting Policies. The Fund’s financial statements are prepared in accordance with Generally Accepted Accounting Principles in the United States of America (“GAAP”). The Fund is an investment company and accordingly follows the investment company accounting and reporting guidance of the Financial Accounting Standards Board (“FASB”) Accounting Standard Codification Topic 946 Financial Services — Investments Companies. The following summarizes significant accounting policies of the Fund: |
A. | Valuation of Investments. (1) The value of investments listed on a securities exchange is based on the last sale price on that exchange prior to the time when assets are valued, or in the absence of recorded sales, at the average of readily available closing bid and asked prices on such exchange; (2) securities not traded on an exchange are valued at the average of the quoted bid and asked prices in the over-the-counter market; (3) securities or other assets for which market quotations are not readily available are valued at fair value in accordance with procedures established by and under the general supervision and responsibility of the Board of Trustees (the “Board”); (4) short-term investments, which mature in 60 days or less are valued at amortized cost if their original maturity was 60 days or less, or by amortizing their value on the 61st day prior to maturity, if their original maturity when acquired by the Fund was more than 60 days, unless the use of amortized cost is determined not to represent “fair value” by the Board. |
B. | Accounting for Investments and Income. Investment transactions are accounted for on the trade date. Realized gains and losses on investment transactions are determined based on the identified cost method. Dividend income and other distributions received from portfolio securities are recorded on the ex-dividend date. Non-cash dividends included in dividend income, if any, are recorded at the fair market value of securities received at ex-date. Distributions received on securities that represent a return of capital are recorded as a reduction of cost of investments. Distributions received on securities that represent a capital gain are recorded as a realized gain. Interest income is accrued daily. Investment income is recorded net of any foreign taxes withheld where recovery of such tax is uncertain. |
financial statements october 31, 2018 | 19 |
BBH CORE SELECT
NOTES TO FINANCIAL STATEMENTS (continued)
October 31, 2018
C. | Fund Expenses. Most expenses of the Trust can be directly attributed to a specific fund. Expenses which cannot be directly attributed to a fund are apportioned amongst each fund in the Trust on a net assets basis. Expense estimates are accrued in the period to which they relate and adjustments are made when actual amounts are known. |
D. | Repurchase Agreements. The Fund may enter into repurchase agreements. Repurchase agreements are transactions in which the Fund buys a security from a dealer or bank and agrees to sell the security back at a mutually agreed upon time and price. The repurchase price normally is in excess of the purchase price, reflecting an agreed upon interest rate. The rate is effective for the period of time that assets of the Fund are invested in the agreement and is not related to the coupon rate on the underlying security. The Fund will enter into repurchase agreements only with banks and other recognized financial institutions, such as securities dealers, deemed creditworthy by the investment adviser. The Fund’s custodian or sub-custodian will take possession of the securities subject to repurchase agreements. The investment adviser, custodian or sub-custodian will monitor the value of the underlying collateral each day to ensure that the value of the security always equals or exceeds the repurchase price. |
| Repurchase agreements are entered into by the Fund under Master Repurchase Agreements (“MRA”) which permit the Fund, under certain circumstances including an event of default (such as bankruptcy or insolvency), to offset payables and/or receivables under the MRA with collateral held and/or posted to the counterparty and create one single net payment due to or from the Fund. However, bankruptcy or insolvency laws of a particular jurisdiction may impose restrictions on or prohibitions against such a right of offset in the event of the MRA counterparty’s bankruptcy or insolvency. Lastly, the MRA does not preclude the Fund from selling, transferring, pledging or hypothecating the underlying collateral but no such transaction shall relieve the Fund of its obligation to transfer the collateral to the counterparty upon the latter’s repurchase of the securities. |
| The Fund’s repurchase agreements as of October 31, 2018 are shown on a gross basis and the required disclosures under Accounting Standards Update (“ASU”) 2013-01 are shown in the Portfolio of Investments. Repurchase agreements are subject to credit risks. |
E. | Federal Income Taxes. It is the Trust’s policy to comply with the requirements of the Internal Revenue Code (the “Code”) applicable to regulated investment companies and to distribute substantially all of its taxable income to its shareholders. Accordingly, no federal income tax provision is required. The Fund files a tax return annually using tax accounting methods required under provisions of the Code, which may differ from GAAP, which is the basis on which these financial statements are prepared. Accordingly, the amount of net investment income and net realized gain reported in these financial statements may differ from that reported on the Fund’s tax |
BBH CORE SELECT
NOTES TO FINANCIAL STATEMENTS (continued)
October 31, 2018
| return, due to certain book-to-tax timing differences such as losses deferred due to “wash sale” transactions and utilization of capital loss carryforwards. These differences may result in temporary over-distributions for financial statement purposes and are classified as distributions in excess of accumulated net realized gains or net investment income. These distributions do not constitute a return of capital. Permanent differences are reclassified between paid-in capital and retained earnings/(accumulated deficit) within the Statement of Assets and Liabilities based upon their tax classification. As such, the character of distributions to shareholders reported in the Financial Highlights table may differ from that reported to shareholders on Form 1099-DIV. |
| The Fund is subject to the provisions of Accounting Standards Codification 740 Income Taxes (“ASC 740”). ASC 740 sets forth a minimum threshold for financial statement recognition of the benefit of a tax position taken or expected to be taken in a tax return. The Fund did not have any unrecognized tax benefits as of October 31, 2018, nor were there any increases or decreases in unrecognized tax benefits for the year then ended. The Fund recognizes interest and penalties, if any, related to unrecognized tax benefits as an income tax expense in the Statement of Operations. During the year ended October 31, 2018, the Fund did not incur any such interest or penalties. The Fund is subject to examination by U.S. federal and state tax authorities for returns filed for the prior three year ends. The Fund is not aware of any tax positions for which it is reasonably possible that the total amounts of unrecognized tax benefits will significantly change in the next twelve months. |
F. | Dividends and Distributions to Shareholders. Dividends and distributions from net investment income to shareholders, if any, are paid annually and are recorded on the ex-dividend date. Distributions from net capital gains, if any, are generally declared and paid annually and are recorded on the ex-dividend date. The Fund declared dividends in the amounts of $385,882,439 and $36,362,272 to Class N shares and Retail Class shareholders, respectively, during the year ended October 31, 2018. In addition, the Fund designated a portion of the payment made to redeeming shareholders as a distribution for income tax purposes. |
financial statements october 31, 2018 | 21 |
BBH CORE SELECT
NOTES TO FINANCIAL STATEMENTS (continued)
October 31, 2018
| The tax character of distributions paid during the years ended October 31, 2018 and 2017, respectively, were as follows: |
| Distributions paid from: | ||||||||||||||||||||
| Ordinary income | Net long-term capital gain | Total taxable distributions | Tax return of capital | Total distributions paid | ||||||||||||||||
2018: | $ | 14,349,099 | $ | 407,895,612 | $ | 422,244,711 | $ | — | $ | 422,244,711 | ||||||||||
2017: | 21,937,123 | 263,393,355 | 285,330,478 | — | 285,330,478 | |||||||||||||||
| As of October 31, 2018 and 2017, respectively, the components of retained earnings/(accumulated deficit) on a tax basis were as follows: |
| Components of retained earnings/(accumulated deficit): | ||||||||||||||||||||||||||||||||
| Undistributed ordinary income | Undistributed long-term capital gain | Retained earnings/ (accumulated deficit) | Accumulated capital and other losses | Other book/tax temporary differences | Book unrealized appreciation/ (depreciation) | Total retained earnings/ (accumulated deficit) | ||||||||||||||||||||||||||
2018: | $ | 4,937,659 | $ | 357,964,713 | $ | 362,902,372 | $ | — | $ | 1,307,347 | $ | 652,392,105 | $ | 1,016,601,824 | ||||||||||||||||||
2017: | 12,701,945 | 407,895,164 | 420,597,109 | — | (390,289 | ) | 1,003,618,028 | 1,423,824,848 | ||||||||||||||||||||||||
| The Fund did not have a net capital loss carryforward at October 31, 2018. |
| The Fund is permitted to carryforward capital losses for an unlimited period and they will retain their character as either short-term or long-term capital losses rather than being considered all short-term capital losses. |
| Total distributions paid may differ from amounts reported in the Statements of Changes in Net Assets because, for tax purposes, dividends are recognized when actually paid. |
| The differences between book-basis and tax-basis unrealized appreciation/(depreciation) is attributable primarily to the tax deferral of losses on wash sales. |
| To the extent future capital gains are offset by capital loss carryforwards, if any, such gains will not be distributed. |
BBH CORE SELECT
NOTES TO FINANCIAL STATEMENTS (continued)
October 31, 2018
G. | Use of Estimates. The preparation of the financial statements in accordance with GAAP requires management to make estimates and assumptions that affect the reported amounts of assets and liabilities in the financial statements, disclosure of contingent assets and liabilities at the date of the financial statements and the reported amounts of increase and decrease in net assets from operations during the reporting period. Actual results could differ from these estimates. |
3. | Fees and Other Transactions with Affiliates. |
A. | Investment Advisory and Administrative Fees. Under a combined Investment Advisory and Administrative Services Agreement (“Agreement”) with the Trust, Brown Brothers Harriman & Co. (“BBH”) through a separately identifiable department (“SID” or “Investment Adviser”) provides investment advisory, portfolio management and administrative services to the Fund. The Fund pays a combined fee for investment advisory and administrative services calculated daily and paid monthly at an annual rate equivalent to 0.80% per annum on the first $3 billion of the Fund’s average daily net assets and 0.75% per annum on the Fund’s average daily net assets over $3 billion. For the year ended October 31, 2018, the Fund incurred $18,853,849 under the Agreement. |
B. | Investment Advisory and Administrative Fee Waivers. Effective July 14, 2010, the Investment Adviser contractually agreed to limit the annual fund operating expenses (excluding interest, taxes, brokerage commissions, other expenditures that are capitalized in accordance with GAAP, other extraordinary expenses not incurred in the ordinary course of the Fund’s business and for Retail Class, amounts payable pursuant to any plan adopted in accordance with Rule 12b-1) of Class N and Retail Class to 1.00%. The agreement will terminate on March 1, 2019, unless it is renewed by all parties to the agreement. The agreement may only be terminated during its term with approval of the Fund’s Board of Trustees. For the year ended October 31, 2018, the Investment Adviser waived fees in the amount of $811,840 and $70,588 for Class N and Retail Class, respectively. |
C. | Shareholder Servicing Fees. The Trust has a shareholder servicing agreement with BBH. BBH receives a fee from the Fund calculated daily and paid monthly at an annual rate of 0.20% of Class N and Retail Class shares’ average daily net assets. For the year ended October 31, 2018, the Fund incurred shareholder servicing fees in the amount of $4,504,891 and $208,571 for Class N and Retail Class, respectively. |
D. | Distribution (12b-1) Fees. The Fund has adopted a distribution plan pursuant to Rule 12b-1 for Retail Class shares that allows the Fund to pay distribution and other fees for the sale of its shares and for distribution-related services provided to shareholders. Because these fees are paid out of the Fund’s assets continuously, over time these fees will increase the cost of investment in Retail Class shares and may cost the Retail Class shareholder more than paying other types of sales |
financial statements october 31, 2018 | 23 |
BBH CORE SELECT
NOTES TO FINANCIAL STATEMENTS (continued)
October 31, 2018
| charges. The maximum annual distribution fee for Retail Class shares is 0.25% of the average daily net assets of the Retail Class shares of the Fund. With this agreement along with the investment advisory and waiver agreements above, it is anticipated that total operating expenses for Retail Class shares will be no greater than 1.25% of the average daily net assets. For the year ended October 31, 2018, Retail Class shares of the Fund incurred $223,331 for Distribution (12b-1) Fees. This amount is presented under line item “Distribution fees” in the Statement of Operations. |
E. | Custody and Fund Accounting Fees. BBH acts as a custodian and fund accountant and receives custody and fund accounting fees from the Fund calculated daily and incurred monthly. BBH holds all of the Fund’s cash and investments and calculates the Fund’s daily net asset value. The custody fee is an asset and transaction-based fee. The fund accounting fee is an asset-based fee calculated at 0.004% of the Fund’s net asset value. For the year ended October 31, 2018, the Fund incurred $151,013 in custody and fund accounting fees. These fees for the Fund were reduced by $36,384 as a result of an expense offset arrangement with the Fund’s custodian. The credit amount (if any) is disclosed in the Statement of Operations as a reduction to the Fund’s expenses. In the event that the Fund is overdrawn, under the custody agreement with BBH, BBH will make overnight loans to the Fund to cover overdrafts. Pursuant to their agreement, the Fund will pay the Federal Funds overnight investment rate on the day of the overdraft. The total interest incurred by the Fund for the year ended October 31, 2018, was $425. This amount is included under line item “Custody and fund accounting fees” in the Statement of Operations. |
F. | Board of Trustees’ Fees. Each Trustee who is not an “interested person” as defined under the 1940 Act receives an annual fee as well as reimbursement for reasonable out-of-pocket expenses from the Fund. For the year ended October 31, 2018, the Fund incurred $52,963 in independent Trustee compensation and expense reimbursements. |
G. | Officers of the Trust. Certain officers of the Trust are also employees of BBH. Such officers are paid no fees by the Trust for their services to the Trust. |
4. | Investment Transactions. For the year ended October 31, 2018, the cost of purchases and the proceeds of sales of investment securities, other than short-term investments, were $296,194,284 and $1,344,763,297, respectively. |
BBH CORE SELECT
NOTES TO FINANCIAL STATEMENTS (continued)
October 31, 2018
5. | Shares of Beneficial Interest. The Trust is permitted to issue an unlimited number of Class N and Retail Class shares of beneficial interest at no par value. Transactions in Class N and Retail Class shares were as follows: |
| For the year ended October 31, 2018 | For the year ended October 31, 2017 | ||||||||||||||||||
| Shares | Dollars | Shares | Dollars | ||||||||||||||||
Class N | |||||||||||||||||||
Shares sold | 13,148,212 | $ | 277,541,062 | 11,338,201 | $ | 246,670,938 | |||||||||||||
Shares issued in connection with reinvestments of dividends | 12,123,335 | 252,165,359 | 8,861,662 | 182,638,860 | |||||||||||||||
Proceeds from short-term redemption fees | N/A | 7,891 | N/A | 13,587 | |||||||||||||||
Shares redeemed | (59,598,540 | ) | (1,252,582,575 | ) | (69,301,288 | ) | (1,503,377,696 | ) | |||||||||||
Net decrease | (34,326,993 | ) | $ | (722,868,263 | ) | (49,101,425 | ) | $ | (1,074,054,311 | ) | |||||||||
Retail Class | |||||||||||||||||||
Shares sold | 992,349 | $ | 11,033,471 | 1,334,628 | $ | 17,100,586 | |||||||||||||
Shares issued in connection with reinvestments of dividends | 3,373,938 | 36,101,136 | 1,831,134 | 22,046,854 | |||||||||||||||
Proceeds from short-term redemption fees | N/A | 410 | N/A | 820 | |||||||||||||||
Shares redeemed | (8,212,773 | ) | (90,470,158 | ) | (5,942,387 | ) | (76,228,158 | ) | |||||||||||
Net decrease | (3,846,486 | ) | $ | (43,335,141 | ) | (2,776,625 | ) | $ | (37,079,898 | ) | |||||||||
financial statements october 31, 2018 | 25 |
BBH CORE SELECT
NOTES TO FINANCIAL STATEMENTS (continued)
October 31, 2018
6. | Principal Risk Factors and Indemnifications. |
A. | Principal Risk Factors. Investing in the Fund may involve certain risks, as discussed in the Fund’s prospectus, including but not limited to, those described below: |
| A shareholder may lose money by investing in the Fund (investment risk). The Fund is actively managed and the decisions by the Investment Adviser may cause the Fund to incur losses or miss profit opportunities (management risk). Price movements may occur due to factors affecting individual companies, such as the issuance of an unfavorable earnings report, or other events affecting particular industries or the equity market as a whole (equity securities risk). The value of securities held by the Fund may fall due to changing economic, political, regulatory or market conditions, or due to a company’s or issuer’s individual situation (market risk). In the normal course of business, the Fund invests in securities and enters into transactions where risks exist due to assumption of large positions in securities of a small number of issuers (non-diversification risk). There are certain risks associated with investing in foreign securities not present in domestic investments, including, but not limited to, recovery of tax withheld by foreign jurisdictions (foreign investment risk). The Fund’s shareholders may be adversely impacted by asset allocation decisions made by an investment adviser whose discretionary clients make up a large percentage of the Fund’s shareholders (shareholder concentration risk). The extent of the Fund’s exposure to these risks in respect to these financial assets is included in their value as recorded in the Fund’s Statement of Assets and Liabilities. |
| Please refer to the Fund’s prospectus for a complete description of the principal risks of investing in the Fund. |
B. | Indemnifications. Under the Trust’s organizational documents, its officers and Trustees may be indemnified against certain liabilities and expenses arising out of the performance of their duties to the Fund, and shareholders are indemnified against personal liability for the obligations of the Trust. Additionally, in the normal course of business, the Fund enters into agreements with service providers that may contain indemnification clauses. The Fund’s maximum exposure under these arrangements is unknown as this would involve future claims that may be made against the Fund that have not yet occurred. The risk of material loss from such claims is considered remote. |
7. | Recent Pronouncements. |
A. | ASU 2018-13. On August 28, 2018, the Financial Accounting Standards Board issued an Accounting Standards Update, ASU 2018-13, Fair Value Measurement (Topic 820): Disclosure Framework —Changes to the Disclosure Requirements for Fair Value Measurement (the “ASU 2018-13”). |
BBH CORE SELECT
NOTES TO FINANCIAL STATEMENTS (continued)
October 31, 2018
| ASU 2018-13 modifies the disclosure objective paragraphs of Accounting Standards Codification 820 to eliminate (1) “at a minimum” from the phrase “an entity shall disclose at a minimum” and (2) other similar “open ended” disclosure requirements to promote the appropriate exercise of discretion by entities. ASU 2018-13 also eliminates and modifies other requirements under ASU 2018-13. ASU 2018-13 is effective for all entities for fiscal years, and interim periods within those fiscal years, beginning after December 15, 2019. Early application is permitted. Management does not expect the application of ASU 2018-13 will have material impact on the Fund’s financial statements. |
B. | Regulation S-X. In October 2018, the U.S. Securities and Exchange Commission adopted amendments to certain disclosure requirements that had become “redundant, duplicative, overlapping, outdated or superseded, in light of the other Commission disclosure requirements, U.S. GAAP or changes in the information environment”. The compliance date for the amendments to Regulation S-X is November 5, 2018 (for reporting period end dates of September 30, 2018 and after). |
| The Fund’s financial statements were prepared in compliance with the new amendments to Regulation S-X. |
8. | Subsequent Events. Management has evaluated events and transactions that have occurred since October 31, 2018 through the date the financial statements were issued and determined that there were none that would require recognition or additional disclosure in the financial statements. |
financial statements october 31, 2018 | 27 |
BBH CORE SELECT
DISCLOSURE OF FUND EXPENSES
October 31, 2018 (unaudited)
BBH CORE SELECT
DISCLOSURE OF FUND EXPENSES (continued)
October 31, 2018 (unaudited)
| Beginning Account Value May 1, 2018 | Ending Account Value October 31, 2018 | Expenses Paid During Period May 1, 2018 to October 31, 20181 | ||||||||||||
Class N | ||||||||||||||
Actual | $ | 1,000 | $ | 1,044 | $ | 5.15 | ||||||||
Hypothetical2 | $ | 1,000 | $ | 1,020 | $ | 5.09 | ||||||||
| Beginning Account Value May 1, 2018 | Ending Account Value October 31, 2018 | Expenses Paid During Period May 1, 2018 to October 31, 20181 | ||||||||||||
Retail Class | ||||||||||||||
Actual | $ | 1,000 | $ | 1,042 | $ | 6.43 | ||||||||
Hypothetical2 | $ | 1,000 | $ | 1,019 | $ | 6.36 | ||||||||
| 1 | Expenses are equal to the Fund’s annualized expense ratio of 1.00% and 1.25% for Class N and Retail Class shares, respectively, multiplied by the average account value over the period, multiplied by 184/365 (to reflect the one-half year period). |
| 2 | Assumes a return of 5% before expenses. For the purposes of the calculation, the applicable annualized expense ratio for each class of shares is subtracted from the assumed return before expenses. |
financial statements october 31, 2018 | 29 |
BBH CORE SELECT
CONFLICTS OF INTEREST
October 31, 2018 (unaudited)
BBH CORE SELECT
CONFLICTS OF INTEREST (continued)
October 31, 2018 (unaudited)
financial statements october 31, 2018 | 31 |
BBH CORE SELECT
CONFLICTS OF INTEREST (continued)
October 31, 2018 (unaudited)
servicing and fund accounting services to the Fund. BBH may have conflicting duties of loyalty while servicing the Fund and/or opportunities to further its own interest to the detriment of the Fund. For example, in negotiating fee arrangements with affiliated service providers, BBH may have an incentive to agree to higher fees than it would in the case of unaffiliated service providers. BBH acting in its capacity as the Fund’s administrator is the primary valuation agent of the Fund. BBH values securities and assets in the Fund according to the Fund’s valuation policies. Because the Investment Adviser’s advisory and administrative fees are calculated by reference to the Fund’s net assets, BBH and its affiliates may have an incentive to seek to overvalue certain assets.
BBH CORE SELECT
CONFLICTS OF INTEREST (continued)
October 31, 2018 (unaudited)
not provide such services. The Investment Adviser will determine in good faith whether the amount of commission is reasonable in relation to the value of research and services provided and whether the services provide lawful and appropriate assistance in its investment decision-making responsibilities.
financial statements october 31, 2018 | 33 |
BBH CORE SELECT
CONFLICTS OF INTEREST (continued)
October 31, 2018 (unaudited)
BBH CORE SELECT
CONFLICTS OF INTEREST (continued)
October 31, 2018 (unaudited)
financial statements october 31, 2018 | 35 |
BBH CORE SELECT
ADDITIONAL FEDERAL TAX INFORMATION
October 31, 2018 (unaudited)
TRUSTEES AND OFFICERS OF BBH CORE SELECT
(unaudited)
| Name and Birth Year | | Position(s) Held with the Trust | | Term of Office and Length of Time Served# | | Principal Occupation(s) During Past 5 Years | | Number of Portfolios in Fund Complex Overseen by Trusteeˆ | | Other Public Company or Investment Company Directorships held by Trustee During Past 5 Years |
Independent Trustees | ||||||||||
H. Whitney Wagner Birth Year: 1956 | Chairman of the Board and Trustee | Chairman Since 2014; Trustee Since 2007 and 2006-2007 with the Predecessor Trust | President, Clear Brook Advisors, a registered investment adviser. | 7 | None. | |||||
Andrew S. Frazier Birth Year: 1948 | Trustee | Since 2010 | Retired. | 7 | Director of Western World Insurance Group, Inc. | |||||
Mark M. Collins Birth Year: 1956 | Trustee | Since 2011 | Partner of Brown Investment Advisory Incorporated, a registered investment adviser. | 7 | Chairman of Dillon Trust Company. | |||||
John M. Tesoro Birth Year: 1952 | Trustee | Since 2014 | Retired. | 7 | Trustee, Bridge Builder Trust (8 Funds); Director of Teton Advisors, Inc. (a registered investment adviser). | |||||
financial statements october 31, 2018 | 37 |
TRUSTEES AND OFFICERS OF BBH CORE SELECT
(unaudited)
| Name, Address and Birth Year | | Position(s) Held with the Trust | | Term of Office and Length of Time Served# | | Principal Occupation(s) During Past 5 Years | | Number of Portfolios in Fund Complex Overseen by Trusteeˆ | | Other Public Company or Investment Company Directorships held by Trustee During Past 5 Years |
Interested Trustees | ||||||||||
Susan C. Livingston+ 50 Post Office Square Boston, MA 02110 Birth Year: 1957 | Trustee | Since 2011 | Partner (since 1998) and Senior Client Advocate (since 2010) for BBH&Co.; Director of BBH Luxembourg S.C.A. (since 1992). | 7 | None. | |||||
John A. Gehret+ 140 Broadway New York, NY 10005 Birth Year: 1959 | Trustee | Since 2011 | Limited Partner of BBH&Co. (2012- present); Director of BBH Luxembourg Funds (since 2012); Director of BBH Trust Company (Cayman) Ltd. (since 2012). | 7 | None. | |||||
TRUSTEES AND OFFICERS OF BBH CORE SELECT
(unaudited)
| Name, Address and Birth Year | | Position(s) Held with the Trust | | Term of Office and Length of Time Served# | | Principal Occupation(s) During Past 5 Years |
Officers | ||||||
Jean-Pierre Paquin 140 Broadway New York, NY 10005 Birth Year: 1973 | President and Principal Executive Officer | Since 2016 | Partner of BBH&Co. since 2015; joined BBH&Co. in 1996. | |||
Daniel Greifenkamp 140 Broadway New York, NY 10005 Birth Year: 1969 | Vice President | Since 2016 | Managing Director of BBH&Co. since 2014; joined BBH&Co. in 2011. | |||
Charles H. Schreiber 140 Broadway New York, NY 10005 Birth Year: 1957 | Treasurer and Principal Financial Officer | Since 2007 2006-2007 with the Predecessor Trust | Senior Vice President of BBH&Co. since 2001; joined BBH&Co. in 1999. | |||
Paul F. Gallagher 140 Broadway New York, NY 10005 Birth Year: 1959 | Chief Compliance Officer (“CCO”) | Since 2015 | Senior Vice President of BBH&Co. since September 2015; Executive Director, Counsel, Morgan Stanley Smith Barney LLC (2009-September 2015). | |||
Keith M. Kelley 50 Post Office Square Boston, MA 02110 Birth Year: 1983 | Anti-Money Laundering Officer (“AMLO”) | Since 2016 | Vice President of BBH&Co. since February 2016; joined BBH&Co. in 2016; Director, Legal and Compliance, Morgan Stanley Smith Barney LLC (2014-February 2016); Compliance Manager, State Street Corporation (2013-2014). |
financial statements october 31, 2018 | 39 |
TRUSTEES AND OFFICERS OF BBH CORE SELECT
(unaudited)
| Name, Address and Birth Year | | Position(s) Held with the Trust | | Term of Office and Length of Time Served# | | Principal Occupation(s) During Past 5 Years |
Suzan M. Barron 50 Post Office Square Boston, MA 02110 Birth Year: 1964 | Secretary | Since 2009 | Senior Vice President and Senior Investor Services Counsel, BBH&Co. since 2005. | |||
Crystal Cheung 140 Broadway New York, NY 10005 Birth Year: 1974 | Assistant Treasurer | Since 2018 | Assistant Vice President of BBH&Co. since 2016; joined BBH&Co. in 2014; Financial Reporting Manager, BNY Mellon Corporation (2010-2014). | |||
Brian J. Carroll 50 Post Office Square Boston, MA 02110 Birth Year: 1985 | Assistant Secretary | Since 2018 | Associate and Investor Services Assistant Counsel of BBH&Co. since 2017; joined BBH&Co. in 2014. |
# | All officers of the Trust hold office for one year and until their respective successors are chosen and qualified (subject to the ability of the Trustees to remove any officer in accordance with the Trust’s By-laws). Mr. Wagner previously served on the Board of Trustees of the Predecessor Trust. |
+ | Ms. Livingston and Mr. Gehret are “interested persons” of the Trust as defined in the 1940 Act because of their positions as Partner and Limited Partner of BBH&Co., respectively. |
ˆ | The Fund Complex consists of the Trust, which has seven series, and each is counted as one “Portfolio” for purposes of this table. |
Administrator Brown Brothers Harriman & Co. 140 Broadway New York, NY 10005 Distributor ALPS Distributors, Inc. 1290 Broadway, Suite 1100 Denver, CO 80203 Shareholder Servicing Agent Brown Brothers Harriman & Co. 140 Broadway New York, NY 10005 1-800-575-1265 | Investment Adviser Brown Brothers Harriman Mutual Fund Advisory Department 140 Broadway New York, NY 10005 | |||||
By telephone: | Call 1-800-575-1265 | |||||
By E-mail send your request to: | bbhfunds@bbh.com | |||||
On the internet: | www.bbhfunds.com | |||||

BBH GLOBAL CORE SELECT
MANAGEMENT’S DISCUSSION OF FUND PERFORMANCE
October 31, 2018
BBH GLOBAL CORE SELECT
MANAGEMENT’S DISCUSSION OF FUND PERFORMANCE (continued)
October 31, 2018
financial statements october 31, 2018 | 3 |
BBH GLOBAL CORE SELECT
MANAGEMENT’S DISCUSSION OF FUND PERFORMANCE (continued)
October 31, 2018
total loss frequencies. The barriers to entry are high and the industry exhibits defensive characteristics as accident frequency, vehicle value, and probability of total loss are less correlated to economic cycles.
BBH GLOBAL CORE SELECT
MANAGEMENT’S DISCUSSION OF FUND PERFORMANCE (continued)
October 31, 2018
essential service to two-sided network of fragmented counterparties enabling commercial customers to manage fuel, lodging, tolls, and corporate payments while driving traffic to fuel, lodging, and other transport service providers. Management is executing well and has a strong capital allocation track record with a demonstrated ability to improve the operating performance of acquired businesses.
financial statements october 31, 2018 | 5 |
BBH GLOBAL CORE SELECT
MANAGEMENT’S DISCUSSION OF FUND PERFORMANCE (continued)
October 31, 2018
investment given i) the composition and quality of its listed and non-listed assets, ii) the Company’s adherence to investment criteria that are well-aligned with our own, and iii) the significant discount to NAV at which the shares currently trade.
BBH GLOBAL CORE SELECT
MANAGEMENT’S DISCUSSION OF FUND PERFORMANCE (continued)
October 31, 2018
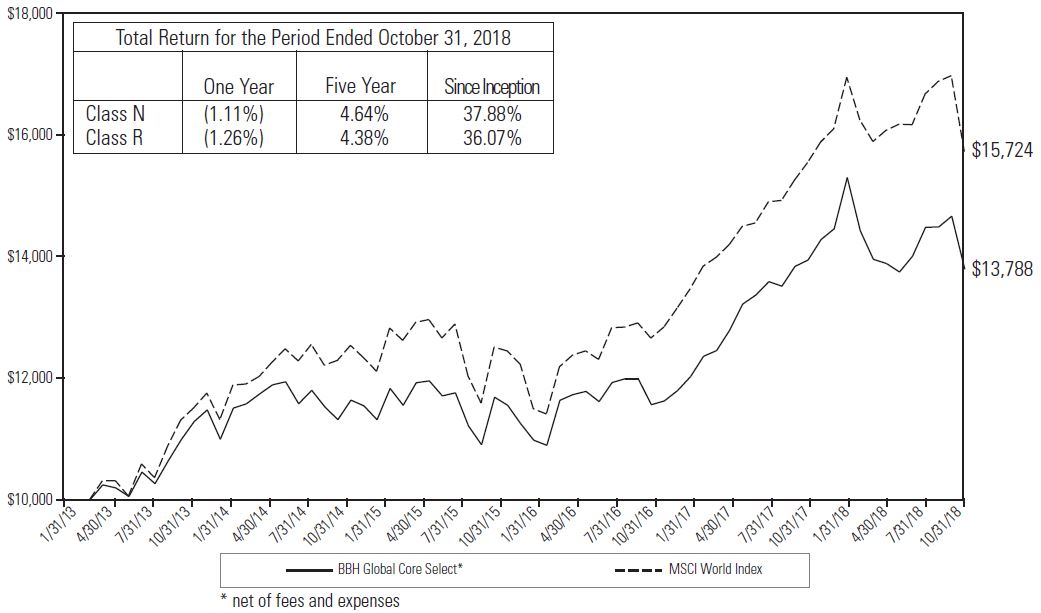 |
| 1 | The Fund’s performance assumes the reinvestment of all dividends and distributions. The MSCI World Index has been adjusted to reflect reinvestment of dividends on securities. The MSCI World Index is not adjusted to reflect sales charges, expenses or other fees that the Securities and Exchange Commission requires to be reflected in the Fund’s performance. The index is unmanaged. Investments cannot be made in an index. |
financial statements october 31, 2018 | 7 |
BBH GLOBAL CORE SELECT
REPORT OF INDEPENDENT REGISTERED PUBLIC ACCOUNTING FIRM
BBH GLOBAL CORE SELECT
REPORT OF INDEPENDENT REGISTERED PUBLIC ACCOUNTING FIRM (continued)
evaluating the accounting principles used and significant estimates made by management, as well as evaluating the overall presentation of the financial statements and financial highlights. Our procedures included confirmation of securities owned as of October 31, 2018, by correspondence with the custodian and brokers. We believe that our audits provide a reasonable basis for our opinion.
|
December 21, 2018
financial statements october 31, 2018 | 9 |
BBH GLOBAL CORE SELECT
PORTFOLIO ALLOCATION
October 31, 2018
| U.S. $ Value | Percent of Net Assets | |||||||||
Common Stock: | ||||||||||
Belgium | $ | 3,621,964 | 4.1 | % | ||||||
Canada | 4,887,659 | 5.6 | ||||||||
France | 7,466,751 | 8.5 | ||||||||
Germany | 4,541,364 | 5.2 | ||||||||
Ireland | 5,464,687 | 6.2 | ||||||||
Italy | 2,646,774 | 3.0 | ||||||||
Netherlands | 3,259,068 | 3.7 | ||||||||
Switzerland | 5,219,824 | 5.9 | ||||||||
United Kingdom | 12,416,492 | 14.1 | ||||||||
United States | 34,776,523 | 39.5 | ||||||||
Repurchase Agreements | 1,000,000 | 1.1 | ||||||||
Cash and Other Assets in Excess of Liabilities | 2,731,742 | 3.1 | ||||||||
NET ASSETS | $ | 88,032,848 | 100.0 | % | ||||||
| U.S. $ Value | Percent of Net Assets | |||||||||
Common Stock: | ||||||||||
Basic Materials | $ | 7,361,108 | 8.4 | % | ||||||
Communications | 11,434,157 | 13.0 | ||||||||
Consumer Cyclical | 7,977,716 | 9.1 | ||||||||
Consumer Non-Cyclical | 33,844,986 | 38.4 | ||||||||
Financials | 15,854,495 | 18.0 | ||||||||
Technology | 7,828,644 | 8.9 | ||||||||
Repurchase Agreements | 1,000,000 | 1.1 | ||||||||
Cash and Other Assets in Excess of Liabilities | 2,731,742 | 3.1 | ||||||||
NET ASSETS | $ | 88,032,848 | 100.0 | % | ||||||
The accompanying notes are an integral part of these financial statements.
BBH GLOBAL CORE SELECT
PORTFOLIO OF INVESTMENTS
October 31, 2018
| Shares | Value | |||||||||
COMMON STOCK (95.8%) | ||||||||||
BELGIUM (4.1%) | ||||||||||
CONSUMER NON-CYCLICAL | ||||||||||
| 25,275 | Anheuser-Busch InBev S.A. NV | $ | 1,863,259 | |||||||
FINANCIALS | ||||||||||
| 25,530 | KBC Group NV | 1,758,705 | ||||||||
Total Belgium | 3,621,964 | |||||||||
CANADA (5.6%) | ||||||||||
CONSUMER CYCLICAL | ||||||||||
| 78,245 | Alimentation Couche-Tard, Inc. (Class B) | 3,746,868 | ||||||||
FINANCIALS | ||||||||||
| 14,400 | Intact Financial Corp. | 1,140,791 | ||||||||
Total Canada | 4,887,659 | |||||||||
FRANCE (8.5%) | ||||||||||
COMMUNICATIONS | ||||||||||
| 60,840 | JCDecaux S.A. | 2,002,365 | ||||||||
CONSUMER NON-CYCLICAL | ||||||||||
| 26,070 | Sanofi | 2,331,184 | ||||||||
FINANCIALS | ||||||||||
| 24,160 | Wendel S.A. | 3,133,202 | ||||||||
Total France | 7,466,751 | |||||||||
GERMANY (5.2%) | ||||||||||
BASIC MATERIALS | ||||||||||
| 20,975 | Brenntag AG | 1,097,143 | ||||||||
| 27,450 | Fuchs Petrolub SE | 1,190,316 | ||||||||
| 2,287,459 | ||||||||||
FINANCIALS | ||||||||||
| 17,790 | Deutsche Boerse AG | 2,253,905 | ||||||||
Total Germany | 4,541,364 | |||||||||
IRELAND (6.2%) | ||||||||||
BASIC MATERIALS | ||||||||||
| 17,460 | Linde, Plc.1 | 2,889,106 | ||||||||
CONSUMER NON-CYCLICAL | ||||||||||
| 36,637 | Perrigo Co., Plc. | 2,575,581 | ||||||||
Total Ireland | 5,464,687 | |||||||||
The accompanying notes are an integral part of these financial statements.
financial statements october 31, 2018 | 11 |
BBH GLOBAL CORE SELECT
PORTFOLIO OF INVESTMENTS (continued)
October 31, 2018
| Shares | Value | |||||||||
COMMON STOCK (continued) | ||||||||||
ITALY (3.0%) | ||||||||||
CONSUMER NON-CYCLICAL | ||||||||||
| 344,175 | Davide Campari-Milano SpA | $ | 2,646,774 | |||||||
Total Italy | 2,646,774 | |||||||||
NETHERLANDS (3.7%) | ||||||||||
CONSUMER NON-CYCLICAL | ||||||||||
| 15,650 | Heineken Holding NV | 1,355,872 | ||||||||
| 35,335 | Unilever NV | 1,903,196 | ||||||||
Total Netherlands | 3,259,068 | |||||||||
SWITZERLAND (5.9%) | ||||||||||
CONSUMER NON-CYCLICAL | ||||||||||
| 19,330 | Nestle S.A. | 1,632,290 | ||||||||
| 41,031 | Novartis AG | 3,587,534 | ||||||||
Total Switzerland | 5,219,824 | |||||||||
UNITED KINGDOM (14.1%) | ||||||||||
COMMUNICATIONS | ||||||||||
| 72,554 | Liberty Global, Plc. (Class C)1 | 1,816,752 | ||||||||
CONSUMER NON-CYCLICAL | ||||||||||
| 112,225 | Diageo, Plc. | 3,880,329 | ||||||||
| 40,265 | Reckitt Benckiser Group, Plc. | 3,254,754 | ||||||||
| 7,135,083 | ||||||||||
FINANCIALS | ||||||||||
| 4,740,525 | Lloyds Banking Group, Plc. | 3,464,657 | ||||||||
Total United Kingdom | 12,416,492 | |||||||||
UNITED STATES (39.5%) | ||||||||||
BASIC MATERIALS | ||||||||||
| 22,535 | Celanese Corp. (Series A) | 2,184,543 | ||||||||
COMMUNICATIONS | ||||||||||
| 4,658 | Alphabet, Inc. (Class C)1 | 5,015,595 | ||||||||
| 88,688 | Discovery, Inc. (Class C)1 | 2,599,445 | ||||||||
| 7,615,040 | ||||||||||
CONSUMER CYCLICAL | ||||||||||
| 42,930 | Copart, Inc.1 | 2,099,706 | ||||||||
| 97,135 | Qurate Retail, Inc. (Class A)1 | 2,131,142 | ||||||||
| 4,230,848 | ||||||||||
The accompanying notes are an integral part of these financial statements.
BBH GLOBAL CORE SELECT
PORTFOLIO OF INVESTMENTS (continued)
October 31, 2018
| Shares | Value | |||||||||
COMMON STOCK (continued) | ||||||||||
UNITED STATES (continued) | ||||||||||
CONSUMER NON-CYCLICAL | ||||||||||
| 18,335 | FleetCor Technologies, Inc.1 | $ | 3,667,550 | |||||||
| 24,640 | PayPal Holdings, Inc.1 | 2,074,441 | ||||||||
| 34,079 | Zoetis, Inc. (Class A) | 3,072,222 | ||||||||
| 8,814,213 | ||||||||||
FINANCIALS | ||||||||||
| 77,085 | Wells Fargo & Co. | 4,103,235 | ||||||||
TECHNOLOGY | ||||||||||
| 109,180 | Oracle Corp. | 5,332,351 | ||||||||
| 39,693 | QUALCOMM, Inc. | 2,496,293 | ||||||||
| 7,828,644 | ||||||||||
Total United States | 34,776,523 | |||||||||
Total Common Stock (Identified cost $68,228,874) | 84,301,106 | |||||||||
| Principal Amount | Maturity Date | Interest Rate | Value | |||||||||||||
REPURCHASE AGREEMENTS (1.1%) | ||||||||||||||||
| $1,000,000 | National Australia Bank, Ltd. (Agreement dated 10/31/18 collateralized by U.S. Treasury Note 2.625%, due 07/31/20, original par $1,020,000, valued at $1,020,000) | 11/01/18 | 2.170 | % | $ | 1,000,000 | ||||||||||
Total Repurchase Agreements (Identified cost $1,000,000) | 1,000,000 | |||||||||||||||
| TOTAL INVESTMENTS (Identified cost $69,228,874)2 | 96.9 | % | $ | 85,301,106 | |||
| CASH AND OTHER ASSETS IN EXCESS OF LIABILITIES | 3.1 | % | 2,731,742 | ||||
| NET ASSETS | 100.0 | % | $ | 88,032,848 |
| 1 | Non-income producing security. |
| 2 | The aggregate cost for federal income tax purposes is $69,581,543, the aggregate gross unrealized appreciation is $20,583,170 and the aggregate gross unrealized depreciation is $4,863,607, resulting in net unrealized appreciation of $15,719,563. |
The accompanying notes are an integral part of these financial statements.
financial statements october 31, 2018 | 13 |
BBH GLOBAL CORE SELECT
PORTFOLIO OF INVESTMENTS (continued)
October 31, 2018
— | Level 1 – unadjusted quoted prices in active markets for identical assets and liabilities. |
— | Level 2 – significant other observable inputs (including quoted prices for similar assets and liabilities, interest rates, prepayment speeds, credit risk, etc.). |
— | Level 3 – significant unobservable inputs (including the Fund’s own assumptions in determining the fair value of assets and liabilities). |
The accompanying notes are an integral part of these financial statements.
BBH GLOBAL CORE SELECT
PORTFOLIO OF INVESTMENTS (continued)
October 31, 2018
| Investments, at value | Unadjusted Quoted Prices in Active Markets for Identical Investments (Level 1)* | Significant Other Observable Inputs (Level 2)* | Significant Unobservable Inputs (Level 3)* | Balance as of October 31, 2018 | ||||||||||||||
Common Stock: | ||||||||||||||||||
Basic Materials | $ | 5,073,649 | $ | 2,287,459 | $ | — | $ | 7,361,108 | ||||||||||
Communications | 9,431,792 | 2,002,365 | — | 11,434,157 | ||||||||||||||
Consumer Cyclical | 7,977,716 | — | — | 7,977,716 | ||||||||||||||
Consumer Non-Cyclical | 11,389,794 | 22,455,192 | — | 33,844,986 | ||||||||||||||
Financials | 5,244,026 | 10,610,469 | — | 15,854,495 | ||||||||||||||
Technology | 7,828,644 | — | — | 7,828,644 | ||||||||||||||
Repurchase Agreements | — | 1,000,000 | — | 1,000,000 | ||||||||||||||
Investments, at value | $ | 46,945,621 | $ | 38,355,485 | $ | — | $ | 85,301,106 | ||||||||||
* | The Fund’s policy is to disclose transfers between levels based on valuations at the end of the reporting period. There were no transfers between Levels 1, 2 or 3 during the period ended October 31, 2018. |
The accompanying notes are an integral part of these financial statements.
financial statements october 31, 2018 | 15 |
BBH GLOBAL CORE SELECT
STATEMENT OF ASSETS AND LIABILITIES
October 31, 2018
ASSETS: | ||||||
Investments in securities, at value (Identified cost $68,228,874) | $ | 84,301,106 | ||||
Repurchase agreements (Identified cost $1,000,000) | 1,000,000 | |||||
Cash | 1,863,614 | |||||
Foreign currency at value (Identified cost $17) | 17 | |||||
Receivables for: | ||||||
Investments sold | 898,626 | |||||
Dividends | 175,127 | |||||
Investment advisory and administrative fee waiver reimbursement | 2,258 | |||||
Interest | 60 | |||||
Prepaid assets | 786 | |||||
Total Assets | 88,241,594 | |||||
LIABILITIES: | ||||||
Payables for: | ||||||
Investment advisory and administrative fees | 84,740 | |||||
Professional fees | 60,625 | |||||
Shares redeemed | 31,000 | |||||
Shareholder servicing fees | 17,840 | |||||
Transfer agent fees | 2,963 | |||||
Custody and fund accounting fees | 1,833 | |||||
Distribution fees | 736 | |||||
Board of Trustees’ fees | 260 | |||||
Accrued expenses and other liabilities | 8,749 | |||||
Total Liabilities | 208,746 | |||||
NET ASSETS | $ | 88,032,848 | ||||
Net Assets Consist of: | ||||||
Paid-in capital | $ | 63,412,557 | ||||
Retained earnings | 24,620,291 | |||||
Net Assets | $ | 88,032,848 |
NET ASSET VALUE AND OFFERING PRICE PER SHARE | ||||||
CLASS N SHARES | ||||||
($86,271,951 ÷ 6,696,074 shares outstanding) | $12.88 | |||||
RETAIL CLASS SHARES | ||||||
($1,760,897 ÷ 137,457 shares outstanding) | $12.81 | |||||
The accompanying notes are an integral part of these financial statements.
BBH GLOBAL CORE SELECT
STATEMENT OF OPERATIONS
For the year ended October 31, 2018
NET INVESTMENT INCOME: | ||||||
Income: | ||||||
Dividends (net of foreign withholding taxes of $147,811) | $ | 2,140,359 | ||||
Interest income | 130,257 | |||||
Total Income | 2,270,616 | |||||
Expenses: | ||||||
Investment advisory and administrative fees | 1,218,552 | |||||
Shareholder servicing fees | 256,537 | |||||
Professional fees | 72,351 | |||||
Board of Trustees’ fees | 52,965 | |||||
Custody and fund accounting fees | 37,824 | |||||
Transfer agent fees | 36,623 | |||||
Distribution fees | 5,554 | |||||
Miscellaneous expenses | 66,724 | |||||
Total Expenses | 1,747,130 | |||||
Investment advisory and administrative fee waiver | (102,348 | ) | ||||
Expense offset arrangement | (36,641 | ) | ||||
Net Expenses | 1,608,141 | |||||
Net Investment Income | 662,475 | |||||
NET REALIZED AND UNREALIZED LOSS: | ||||||
Net realized gain on investments in securities | 10,977,412 | |||||
Net realized loss on foreign exchange transactions and translations | (82,598 | ) | ||||
Net realized gain on investments in securities and foreign exchange transactions and translations | 10,894,814 | |||||
Net change in unrealized appreciation/(depreciation) on investments in securities | (12,271,683 | ) | ||||
Net change in unrealized appreciation/(depreciation) on foreign currency translations | (5,932 | ) | ||||
Net change in unrealized appreciation/(depreciation) on investments in securities and foreign currency translations | (12,277,615 | ) | ||||
Net Realized and Unrealized Loss | (1,382,801 | ) | ||||
Net Decrease in Net Assets Resulting from Operations | $ | (720,326 | ) |
The accompanying notes are an integral part of these financial statements.
financial statements october 31, 2018 | 17 |
BBH GLOBAL CORE SELECT
STATEMENTS OF CHANGES IN NET ASSETS
| For the years ended October 31, | |||||||||||
| 2018 | 2017 | ||||||||||
INCREASE (DECREASE) IN NET ASSETS: | |||||||||||
Operations: | |||||||||||
Net investment income | $ | 662,475 | $ | 531,369 | |||||||
Net realized gain on investments in securities and foreign exchange transactions and translations | 10,894,814 | 2,885,323 | |||||||||
Net change in unrealized appreciation/(depreciation) on investments in securities and foreign currency translations | (12,277,615 | ) | 19,192,714 | ||||||||
Net increase (decrease) in net assets resulting from operations | (720,326 | ) | 22,609,406 | ||||||||
Dividends and distributions declared: | |||||||||||
Class N | (2,954,827 | ) | (593,082 | )1 | |||||||
Retail Class | (80,202 | ) | (10,877 | )1 | |||||||
Total dividends and distributions declared | (3,035,029 | ) | (603,959 | ) | |||||||
Share transactions: | |||||||||||
Proceeds from sales of shares | 13,323,466 | 10,904,266 | |||||||||
Net asset value of shares issued to shareholders for reinvestment of dividends and distributions | 2,381,377 | 480,926 | |||||||||
Cost of shares redeemed | (58,271,914 | ) | (11,071,494 | ) | |||||||
Net increase (decrease) in net assets resulting from share transactions | (42,567,071 | ) | 313,698 | ||||||||
Total increase (decrease) in net assets | (46,322,426 | ) | 22,319,145 | ||||||||
NET ASSETS: | |||||||||||
Beginning of year | 134,355,274 | 112,036,129 | |||||||||
End of year | $ | 88,032,848 | $ | 134,355,274 | 2 | ||||||
| 1 | For the year ended October 31, 2017, dividends and distributions declared were only from net investment income for Class N and Retail Class. |
| 2 | Including undistributed net investment income of $496,880. |
The accompanying notes are an integral part of these financial statements.
BBH GLOBAL CORE SELECT
FINANCIAL HIGHLIGHTS
Selected per share data and ratios for a Class N share outstanding throughout each year.
| For the years ended October 31, | |||||||||||||||||||||||
| 2018 | 2017 | 2016 | 2015 | 2014 | |||||||||||||||||||
Net asset value, beginning of year | $ | 13.32 | $ | 11.11 | $ | 11.37 | $ | 11.27 | $ | 10.99 | |||||||||||||
Income from investment operations: | |||||||||||||||||||||||
Net investment income1 | 0.07 | 0.05 | 0.06 | 0.06 | 0.12 | ||||||||||||||||||
Net realized and unrealized gain (loss) | (0.21 | ) | 2.22 | (0.18 | ) | 0.30 | 0.21 | ||||||||||||||||
Total income (loss) from investment operations | (0.14 | ) | 2.27 | (0.12 | ) | 0.36 | 0.33 | ||||||||||||||||
Less dividends and distributions: | |||||||||||||||||||||||
From net investment income | (0.05 | ) | (0.06 | ) | (0.07 | ) | (0.13 | ) | (0.02 | ) | |||||||||||||
From net realized gains | (0.25 | ) | — | (0.07 | ) | (0.13 | ) | (0.03 | ) | ||||||||||||||
Total dividends and distributions | (0.30 | ) | (0.06 | ) | (0.14 | ) | (0.26 | ) | (0.05 | ) | |||||||||||||
Short-term redemption fees1 | — | — | 0.00 | 2 | — | 0.00 | 2 | ||||||||||||||||
Net asset value, end of year | $ | 12.88 | $ | 13.32 | $ | 11.11 | $ | 11.37 | $ | 11.27 | |||||||||||||
Total return | (1.11 | )% | 20.54 | % | (1.06 | )% | 3.27 | % | 3.01 | % | |||||||||||||
Ratios/Supplemental data: | |||||||||||||||||||||||
Net assets, end of year (in millions) | $ | 86 | $ | 130 | $ | 108 | $ | 132 | $ | 127 | |||||||||||||
Ratio of expenses to average net assets before reductions | 1.33 | % | 1.36 | % | 1.38 | % | 1.31 | % | 1.32 | % | |||||||||||||
Fee waiver | 0.05 | %3 | 0.10 | %3 | 0.13 | %3 | 0.05 | %3 | 0.07 | %3 | |||||||||||||
Expense offset arrangement | 0.03 | % | 0.01 | % | 0.01 | % | 0.01 | % | 0.00 | %4 | |||||||||||||
Ratio of expenses to average net assets after reductions | 1.25 | % | 1.25 | % | 1.24 | % | 1.25 | % | 1.25 | % | |||||||||||||
Ratio of net investment income to average net assets | 0.52 | % | 0.44 | % | 0.58 | % | 0.55 | % | 1.01 | % | |||||||||||||
Portfolio turnover rate | 19 | % | 23 | % | 19 | % | 31 | % | 40 | % | |||||||||||||
| 1 | Calculated using average shares outstanding for the year. |
| 2 | Less than $0.01. |
| 3 | The ratio of expenses to average net assets for the years ended October 31, 2018, 2017, 2016, 2015 and 2014 reflect fees reduced as result of a contractual operating expense limitation of the share class of 1.25%. The agreement is effective for all years presented and is effective through March 1, 2019. For the years ended October 31, 2018, 2017, 2016, 2015 and 2014, the waived fees were $70,117, $110,626, $146,074, $74,640 and $90,671, respectively. |
| 4 | Less than 0.01%. |
The accompanying notes are an integral part of these financial statements.
financial statements october 31, 2018 | 19 |
BBH GLOBAL CORE SELECT
FINANCIAL HIGHLIGHTS (continued)
Selected per share data and ratios for a Retail Class share outstanding throughout each year.
| For the years ended October 31, | |||||||||||||||||||||||
| 2018 | 2017 | 2016 | 2015 | 2014 | |||||||||||||||||||
Net asset value, beginning of year | $ | 13.24 | $ | 11.05 | $ | 11.31 | $ | 11.24 | $ | 10.98 | |||||||||||||
Income from investment operations: | |||||||||||||||||||||||
Net investment income1 | 0.02 | 0.02 | 0.04 | 0.03 | 0.07 | ||||||||||||||||||
Net realized and unrealized gain (loss) | (0.18 | ) | 2.20 | (0.18 | ) | 0.29 | 0.22 | ||||||||||||||||
Total income (loss) from investment operations | (0.16 | ) | 2.22 | (0.14 | ) | 0.32 | 0.29 | ||||||||||||||||
Less dividends and distributions: | |||||||||||||||||||||||
From net investment income | (0.02 | ) | (0.03 | ) | (0.05 | ) | (0.12 | ) | (0.01 | ) | |||||||||||||
From net realized gains | (0.25 | ) | — | (0.07 | ) | (0.13 | ) | (0.03 | ) | ||||||||||||||
Total dividends and distributions | (0.27 | ) | (0.03 | ) | (0.12 | ) | (0.25 | ) | (0.04 | ) | |||||||||||||
Short-term redemption fees1 | — | — | — | — | 0.01 | ||||||||||||||||||
Net asset value, end of year | $ | 12.81 | $ | 13.24 | $ | 11.05 | $ | 11.31 | $ | 11.24 | |||||||||||||
Total return | (1.26 | )% | 20.18 | % | (1.25 | )% | 2.98 | % | 2.70 | % | |||||||||||||
Ratios/Supplemental data: | |||||||||||||||||||||||
Net assets, end of year (in millions) | $ | 2 | $ | 4 | $ | 4 | $ | 4 | $ | 2 | |||||||||||||
Ratio of expenses to average net assets before reductions | 2.94 | % | 2.44 | % | 2.65 | % | 2.93 | % | 3.36 | % | |||||||||||||
Fee waiver | 1.45 | %2 | 0.93 | %2 | 1.14 | %2 | 1.43 | %2 | 1.86 | %2 | |||||||||||||
Expense offset arrangement | 0.02 | % | 0.01 | % | 0.01 | % | 0.00 | %3 | 0.00 | %3 | |||||||||||||
Ratio of expenses to average net assets after reductions | 1.47 | % | 1.50 | % | 1.50 | % | 1.50 | % | 1.50 | % | |||||||||||||
Ratio of net investment income to average net assets | 0.13 | % | 0.20 | % | 0.32 | % | 0.29 | % | 0.61 | % | |||||||||||||
Portfolio turnover rate | 19 | % | 23 | % | 19 | % | 31 | % | 40 | % | |||||||||||||
| 1 | Calculated using average shares outstanding for the year. |
| 2 | The ratio of expenses to average net assets for the years ended October 31, 2018, 2017, 2016, 2015 and 2014 reflect fees reduced as result of a contractual operating expense limitation of the share class of 1.50%. The agreement is effective for all years presented and is effective through March 1, 2019. For the years ended October 31, 2018, 2017, 2016, 2015 and 2014, the waived fees were $32,231, $35,288, $40,663, $41,058 and $41,099, respectively. |
| 3 | Less than 0.01%. |
The accompanying notes are an integral part of these financial statements.
BBH GLOBAL CORE SELECT
NOTES TO FINANCIAL STATEMENTS
October 31, 2018
1. | Organization. The Fund is a separate, non-diversified series of BBH Trust (the “Trust”), which is registered under the Investment Company Act of 1940, as amended (the “1940 Act”), as an open-end management investment company. The Trust was originally organized under the laws of the State of Maryland on July 16, 1990 as BBH Fund, Inc. and re-organized as a Delaware statutory trust on June 12, 2007. The Fund is the successor to the BBH private investment fund, BBH Global Funds, LLC — Global Core Select, which launched on April 2, 2012. The Fund commenced operations on March 28, 2013. The Fund offers Class N shares and Retail Class shares. Class N and Retail Class shares have different operating expenses. With the exception of class specific expenses, all expenses are allocated between classes based on net assets. Neither Class N shares nor Retail Class shares automatically convert to any other class of shares of the Fund. As of October 31, 2018 there were seven series of the Trust. |
2. | Significant Accounting Policies. The Fund’s financial statements are prepared in accordance with Generally Accepted Accounting Principles in the United States of America (“GAAP”). The Fund is an investment company and accordingly follows the investment company accounting and reporting guidance of the Financial Accounting Standards Board (“FASB”) Accounting Standard Codification Topic 946 Financial Services — Investment Companies. The following summarizes significant accounting policies of the Fund: |
A. | Valuation of Investments. (1) The value of investments listed on a securities exchange is based on the last sale price on that exchange prior to the time when assets are valued, or in the absence of recorded sales, at the average of readily available closing bid and asked prices on such exchange; (2) securities not traded on an exchange are valued at the average of the quoted bid and asked prices in the over-the counter market; (3) securities or other assets for which market quotations are not readily available are valued at fair value in accordance with procedures established by and under the general supervision and responsibility of the Board of Trustees (the “Board”); (4) for securities traded on international exchanges, if events which may affect the value of the Fund’s securities occur after the close of the primary exchange on which such securities trade and before the Fund’s net asset value is next determined, then those securities will be fair valued as determined in good faith under supervision of the Board. The Fund currently uses a systematic fair value model provided by an independent third party to adjust the observed values of international securities on a daily basis; (5) short-term investments, which mature in 60 days or less are valued at amortized cost if their original maturity was 60 days or less, or by amortizing their value on the 61st day prior to maturity, if their original maturity when acquired by the Fund was more than 60 days, unless the use of amortized cost is determined not to represent “fair value” by the Board. |
financial statements october 31, 2018 | 21 |
BBH GLOBAL CORE SELECT
NOTES TO FINANCIAL STATEMENTS (continued)
October 31, 2018
B. | Accounting for Investments and Income. Investment transactions are accounted for on the trade date. Realized gains and losses on investment transactions are determined based on the identified cost method. Dividend income and other distributions received from portfolio securities are recorded on the ex-dividend date. Non-cash dividends included in dividend income, if any, are recorded at the fair market value of securities received at ex-date. Distributions received on securities that represent a return of capital are recorded as a reduction of cost of investments. Distributions received on securities that represent a capital gain are recorded as a realized gain. Interest income is accrued daily. Investment income is recorded net of any foreign taxes withheld where recovery of such tax is uncertain. |
C. | Fund Expenses. Most expenses of the Trust can be directly attributed to a specific fund. Expenses which cannot be directly attributed to a fund are apportioned amongst each fund in the Trust on a net assets basis. Expense estimates are accrued in the period to which they relate and adjustments are made when actual amounts are known. |
D. | Repurchase Agreements. The Fund may enter into repurchase agreements. Repurchase agreements are transactions in which the Fund buys a security from a dealer or bank and agrees to sell the security back at a mutually agreed upon time and price. The repurchase price normally is in excess of the purchase price, reflecting an agreed upon interest rate. The rate is effective for the period of time that assets of the Fund are invested in the agreement and is not related to the coupon rate on the underlying security. The Fund will enter into repurchase agreements only with banks and other recognized financial institutions, such as securities dealers, deemed creditworthy by the investment adviser. The Fund’s custodian or sub-custodian will take possession of the securities subject to repurchase agreements. The investment adviser, custodian or sub-custodian will monitor the value of the underlying collateral each day to ensure that the value of the security always equals or exceeds the repurchase price. |
BBH GLOBAL CORE SELECT
NOTES TO FINANCIAL STATEMENTS (continued)
October 31, 2018
E. | Foreign Currency Translations. The accounting records of the Fund are maintained in U.S. dollars. Foreign currency amounts are translated into U.S. dollars at the current rate of exchange of such currency against the U.S. dollar to determine the value of investments, assets and liabilities. Purchases and sales of securities, and income and expenses are translated at the prevailing rate of exchange on the respective dates of such transactions. Upon the purchase or sale of a security denominated in foreign currency, the Fund may enter into forward foreign currency exchange contracts for the purchase or sale, for a fixed amount of U.S. dollars, of the amount of foreign currency involved in the underlying security transaction. Reported net realized gains and losses arise from the sales of portfolio securities, sales of foreign currencies, currency gains or losses realized between the trade and settlement dates on securities transactions, and the difference between the amounts of dividends, interest and foreign withholding taxes recorded on the Fund’s books and the U.S. dollar equivalent of the amounts actually received or paid. The effect of changes in foreign exchange rates on foreign denominated securities is reflected in the net realized and unrealized gain or loss on investments in securities and foreign exchange transactions and translations and net change in unrealized appreciation or depreciation on investments in securities and foreign currency translations within the Statement of Operations. Net unrealized appreciation or depreciation on foreign currency translations arise from changes in the value of the assets and liabilities, excluding investments in securities, at period end, resulting from changes in the exchange rate. |
F. | Federal Income Taxes. The Fund may be subject to foreign taxes on income, gains on investments or currency repatriation, a portion of which may be recoverable. The Fund will accrue such taxes and recoveries, as applicable, based upon its current interpretation of tax rules and regulations that exist in the markets in which it invests. |
financial statements october 31, 2018 | 23 |
BBH GLOBAL CORE SELECT
NOTES TO FINANCIAL STATEMENTS (continued)
October 31, 2018
may differ from GAAP, which is the basis on which these financial statements are prepared. Accordingly, the amount of net investment income and net realized gain reported in these financial statements may differ from that reported on the Fund’s tax return, due to certain book-to-tax timing differences such as losses deferred due to “wash sale” transactions and utilization of capital loss carryforwards. These differences may result in temporary over-distributions for financial statement purposes and are classified as distributions in excess of accumulated net realized gains or net investment income. These distributions do not constitute a return of capital. Permanent differences are reclassified between paid-in capital and retained earnings/(accumulated deficit) within the Statement of Assets and Liabilities based upon their tax classification. As such, the character of distributions to shareholders reported in the Financial Highlights table may differ from that reported to shareholders on Form 1099-DIV.
G. | Dividends and Distributions to Shareholders. Dividends and distributions from net investment income to shareholders, if any, are paid annually and are recorded on the ex-dividend date. Distributions from net capital gains, if any, are generally declared and paid annually and are recorded on the ex-dividend date. The Fund declared dividends in the amount of $2,954,827 and $80,202 to Class N and Retail Class shareholders, respectively, during the year ended October 31, 2018. In addition, the Fund designated a portion of the payment made to redeeming shareholders as a distribution for income tax purposes. |
| Distributions paid from: | ||||||||||||||||||||||
| Ordinary income | Net long-term capital gain | Total taxable distributions | Tax return of capital | Total distributions paid | ||||||||||||||||||
2018: | $ | 1,398,238 | $ | 1,636,791 | $ | 3,035,029 | $ | — | $ | 3,035,029 | ||||||||||||
2017: | 603,959 | — | 603,959 | — | 603,959 | |||||||||||||||||
BBH GLOBAL CORE SELECT
NOTES TO FINANCIAL STATEMENTS (continued)
October 31, 2018
| Components of retained earnings/(accumulated deficit): | ||||||||||||||||||||||||||||||||
| Undistributed ordinary income | Undistributed long-term capital gain | Retained earnings/ (accumulated deficit) | Accumulated capital and other losses | Other book/tax temporary differences | Book unrealized appreciation/ (depreciation) | Total retained earnings/ (accumulated deficit) | ||||||||||||||||||||||||||
2018: | $ | 407,144 | $ | 8,499,653 | $ | 8,906,797 | $ | — | $ | (352,669 | ) | $ | 16,066,163 | $ | 24,620,291 | |||||||||||||||||
2017: | 1,374,478 | 1,635,451 | 3,009,929 | — | (447,191 | ) | 28,343,778 | 30,906,516 | ||||||||||||||||||||||||
H. | Use of Estimates. The preparation of the financial statements in accordance with GAAP requires management to make estimates and assumptions that affect the reported amounts of assets and liabilities in the financial statements, disclosure of contingent assets and liabilities at the date of the financial statements and the reported amounts of increase and decrease in net assets from operations during the reporting period. Actual results could differ from these estimates. |
3. | Fees and Other Transactions with Affiliates. |
A. | Investment Advisory and Administrative Fees. Under a combined Investment Advisory and Administrative Services Agreement (“Agreement”) with the Trust, Brown Brothers Harriman & Co. (“BBH”) through a separately identifiable department (“SID” or “Investment Adviser”) provides investment advisory, portfolio management and administrative services to the Fund. The Fund pays |
financial statements october 31, 2018 | 25 |
BBH GLOBAL CORE SELECT
NOTES TO FINANCIAL STATEMENTS (continued)
October 31, 2018
B. | Investment Advisory and Administrative Fee Waivers. Effective March 28, 2013, the Investment Adviser contractually agreed to limit the annual Fund operating expenses (excluding interest, taxes, brokerage commissions, other expenditures that are capitalized in accordance with GAAP, other extraordinary expenses not incurred in the ordinary course of the Fund’s business and for Retail Class, amounts payable pursuant to any plan adopted in accordance with Rule 12b-1) of Class N and Retail Class to 1.25%. The agreement will terminate on March 1, 2019, unless it is renewed by all parties to the agreement. The agreement may only be terminated during its term with approval of the Fund’s Board of Trustees. For the year ended October 31, 2018, the Investment Adviser waived fees in the amount of $70,117 and $32,231 for Class N and Retail Class, respectively. |
C. | Shareholder Servicing Fees. The Trust has a shareholder servicing agreement with BBH. BBH receives a fee from the Fund calculated daily and paid monthly at an annual rate of 0.20% of Class N and Retail Class shares’ average daily net assets. For the year ended October 31, 2018, the Fund incurred shareholder servicing fees in the amount of $252,097 and $4,440 for Class N and Retail Class, respectively. |
D. | Distribution (12b-1) Fees. The Fund has adopted a distribution plan pursuant to Rule 12b-1 for Retail Class shares that allows the Fund to pay distribution and other fees for the sale of its shares and for distribution-related services provided to shareholders. Because these fees are paid out of the Fund’s assets continuously, over time these fees will increase the cost of investment in Retail Class shares and may cost the shareholder more than paying other types of sales charges. The maximum annual distribution fee for Retail Class shares is 0.25% of the average daily net assets of the Retail Class shares of the Fund. With this agreement along with the investment advisory and waiver agreements above, it is anticipated that total operating expenses for Retail Class shares will be 1.50% of the average daily net assets. For the year ended October 31, 2018, Retail Class shares of the Fund incurred $5,554 for Distribution (12b-1) Fees. This amount is presented under line item “Distribution fees” in the Statement of Operations. |
BBH GLOBAL CORE SELECT
NOTES TO FINANCIAL STATEMENTS (continued)
October 31, 2018
E. | Custody and Fund Accounting Fees. BBH acts as a custodian and fund accountant and receives custody and fund accounting fees from the Fund calculated daily and incurred monthly. BBH holds all of the Fund’s cash and investments and calculates the Fund’s daily net asset value. The custody fee is an asset and transaction-based fee. The fund accounting fee is an asset-based fee calculated at 0.004% of the Fund’s net asset value. For the year ended October 31, 2018, the Fund incurred $37,824 in custody and fund accounting fees. |
| These fees for the Fund were reduced by $36,641 as a result of an expense offset arrangement with the Fund’s custodian. The credit amount (if any) is disclosed in the Statement of Operations as a reduction to the Fund’s expenses. In the event that the Fund is overdrawn, under the custody agreement with BBH, BBH will make overnight loans to the Fund to cover overdrafts. Pursuant to their agreement, the Fund will pay the Federal Funds overnight investment rate on the day of the overdraft. The total interest incurred by the Fund for the year ended October 31, 2018, was $291. This amount is included under line item “Custody and fund accounting fees” in the Statement of Operations. |
F. | Board of Trustees’ Fees. Each Trustee who is not an “interested person” as defined under the 1940 Act receives an annual fee as well as reimbursement for reasonable out-of-pocket expenses from the Fund. For the year ended October 31, 2018, the Fund incurred $52,965 in independent Trustee compensation and reimbursements. |
G. | Officers of the Trust. Certain officers of the Trust are also employees of BBH. Such officers are paid no fees by the Trust for their services to the Trust. |
4. | Investment Transactions. For the year ended October 31, 2018, the cost of purchases and the proceeds of sales of investment securities, other than short-term investments, were $22,428,344 and $55,001,894, respectively. |
financial statements october 31, 2018 | 27 |
BBH GLOBAL CORE SELECT
NOTES TO FINANCIAL STATEMENTS (continued)
October 31, 2018
5. | Shares of Beneficial Interest. The Trust is permitted to issue an unlimited number of Class N and Retail Class shares of beneficial interest, at no par value. Transactions in Class N and Retail Class shares were as follows: |
| For the year ended October 31, 2018 | For the year ended October 31, 2017 | ||||||||||||||||||
| Shares | Dollars | Shares | Dollars | ||||||||||||||||
Class N | |||||||||||||||||||
Shares sold | 972,167 | $ | 13,141,827 | 891,299 | $ | 10,859,908 | |||||||||||||
Shares issued in connection with reinvestments of dividends | 172,526 | 2,308,404 | 41,531 | 470,955 | |||||||||||||||
Shares redeemed | (4,245,795 | ) | (55,913,343 | ) | (901,051 | ) | (10,675,842 | ) | |||||||||||
Net increase (decrease) | (3,101,102 | ) | $ | (40,463,112 | ) | 31,779 | $ | 655,021 | |||||||||||
Retail Class | |||||||||||||||||||
Shares sold | 13,515 | $ | 181,639 | 3,632 | $ | 44,358 | |||||||||||||
Shares issued in connection with reinvestments of dividends | 5,478 | 72,973 | 882 | 9,971 | |||||||||||||||
Shares redeemed | (175,571 | ) | (2,358,571 | ) | (31,411 | ) | (395,652 | ) | |||||||||||
Net decrease | (156,578 | ) | $ | (2,103,959 | ) | (26,897 | ) | $ | (341,323 | ) | |||||||||
6. | Principal Risk Factors and Indemnifications. |
A. | Principal Risk Factors. Investing in the Fund may involve certain risks, as discussed in the Fund’s prospectus, including but not limited to, those described below: |
BBH GLOBAL CORE SELECT
NOTES TO FINANCIAL STATEMENTS (continued)
October 31, 2018
investing in securities of issuers based in developing countries (emerging markets risk). Non-U.S. currencies invested in by the Fund may depreciate against the U.S. dollar (currency exchange rate risk). The Fund’s shareholders may be adversely impacted by asset allocation decisions made by an investment adviser whose discretionary clients make up a large percentage of the Fund’s shareholders (shareholder concentration risk). The extent of the Fund’s exposure to these risks in respect to these financial assets is included in their value as recorded in the Fund’s Statement of Assets and Liabilities.
B. | Indemnifications. Under the Trust’s organizational documents, its officers and Trustees may be indemnified against certain liabilities and expenses arising out of the performance of their duties to the Fund, and shareholders are indemnified against personal liability for the obligations of the Trust. Additionally, in the normal course of business, the Fund enters into agreements with service providers that may contain indemnification clauses. The Fund’s maximum exposure under these arrangements is unknown as this would involve future claims that may be made against the Fund that have not yet occurred. The risk of material loss from such claims is considered remote. |
7. | Recent Pronouncements. |
A. | ASU 2018-13. On August 28, 2018, the Financial Accounting Standards Board issued an Accounting Standards Update, ASU 2018-13, Fair Value Measurement (Topic 820): Disclosure Framework —Changes to the Disclosure Requirements for Fair Value Measurement (the “ASU 2018-13”). ASU 2018-13 modifies the disclosure objective paragraphs of ASC 820 to eliminate (1) “at a minimum” from the phrase “an entity shall disclose at a minimum” and (2) other similar “open ended” disclosure requirements to promote the appropriate exercise of discretion by entities. ASU 2018-13 also eliminates and modifies other requirements under ASU 2018-13. ASU 2018-13 is effective for all entities for fiscal years, and interim periods within those fiscal years, beginning after December 15, 2019. Early application is permitted. Management does not expect the application of ASU 2018-13 will have material impact on the Fund’s financial statements. |
financial statements october 31, 2018 | 29 |
BBH GLOBAL CORE SELECT
NOTES TO FINANCIAL STATEMENTS (continued)
October 31, 2018
B. | Regulation S-X. In October 2018, the U.S. Securities and Exchange Commission adopted amendments to certain disclosure requirements that had become “redundant, duplicative, overlapping, outdated or superseded, in light of the other Commission disclosure requirements, U.S. GAAP or changes in the information environment”. The compliance date for the amendments to Regulation S-X is November 5, 2018 (for reporting period end dates of September 30, 2018 and after). |
8. | Subsequent Events. Management has evaluated events and transactions that have occurred since October 31, 2018 through the date the financial statements were issued and determined that there were none that would require recognition or additional disclosure in the financial statements. |
BBH GLOBAL CORE SELECT
DISCLOSURE OF FUND EXPENSES
October 31, 2018 (unaudited)
financial statements october 31, 2018 | 31 |
BBH GLOBAL CORE SELECT
DISCLOSURE OF FUND EXPENSES (continued)
October 31, 2018 (unaudited)
| Beginning Account Value May 1, 2018 | Ending Account Value October 31, 2018 | Expenses Paid During Period May 1, 2018 to October 31, 20181 | ||||||||||||
Class N | ||||||||||||||
Actual | $ | 1,000 | $ | 993 | $ | 6.28 | ||||||||
Hypothetical2 | $ | 1,000 | $ | 1,019 | $ | 6.36 | ||||||||
| Beginning Account Value May 1, 2018 | Ending Account Value October 31, 2018 | Expenses Paid During Period May 1, 2018 to October 31, 20181 | ||||||||||||
Retail Class | ||||||||||||||
Actual | $ | 1,000 | $ | 992 | $ | 7.11 | ||||||||
Hypothetical2 | $ | 1,000 | $ | 1,018 | $ | 7.20 | ||||||||
| 1 | Expenses are equal to the Fund’s annualized expense ratio of 1.25% and 1.42% for Class N and Retail Class shares, respectively, multiplied by the average account value over the period, multiplied by 184/365 (to reflect the one-half year period). |
| 2 | Assumes a return of 5% before expenses. For the purposes of the calculation, the applicable annualized expenses ratio for each class of shares is subtracted from the assumed return before expenses. |
BBH GLOBAL CORE SELECT
CONFLICTS OF INTEREST
October 31, 2018 (unaudited)
financial statements october 31, 2018 | 33 |
BBH GLOBAL CORE SELECT
CONFLICTS OF INTEREST (continued)
October 31, 2018 (unaudited)
BBH GLOBAL CORE SELECT
CONFLICTS OF INTEREST (continued)
October 31, 2018 (unaudited)
financial statements october 31, 2018 | 35 |
BBH GLOBAL CORE SELECT
CONFLICTS OF INTEREST (continued)
October 31, 2018 (unaudited)
Investment Adviser in the investment decision-making process (including with respect to futures, fixed price offerings and over-the-counter transactions). The use of a broker that provides research and securities transaction services may result in a higher commission than that offered by a broker who does not provide such services. The Investment Adviser will determine in good faith whether the amount of commission is reasonable in relation to the value of research and services provided and whether the services provide lawful and appropriate assistance in its investment decision-making responsibilities.
BBH GLOBAL CORE SELECT
CONFLICTS OF INTEREST (continued)
October 31, 2018 (unaudited)
financial statements october 31, 2018 | 37 |
BBH GLOBAL CORE SELECT
CONFLICTS OF INTEREST (continued)
October 31, 2018 (unaudited)
BBH GLOBAL CORE SELECT
ADDITIONAL FEDERAL TAX INFORMATION
October 31, 2018 (unaudited)
| Foreign Source Income | Foreign Taxes Paid | |||
| $1,648,025 | $147,811 | |||
financial statements october 31, 2018 | 39 |
TRUSTEES AND OFFICERS OF BBH GLOBAL CORE SELECT
(unaudited)
| Name and Birth Year | | Position(s) Held with the Trust | | Term of Office and Length of Time Served# | | Principal Occupation(s) During Past 5 Years | | Number of Portfolios in Fund Complex Overseen by Trusteeˆ | | Other Public Company or Investment Company Directorships held by Trustee During Past 5 Years |
Independent Trustees | ||||||||||
H. Whitney Wagner Birth Year: 1956 | Chairman of the Board and Trustee | Chairman Since 2014; Trustee Since 2007 and 2006-2007 with the Predecessor Trust | President, Clear Brook Advisors, a registered investment adviser. | 7 | None. | |||||
Andrew S. Frazier Birth Year: 1948 | Trustee | Since 2010 | Retired. | 7 | Director of Western World Insurance Group, Inc. | |||||
Mark M. Collins Birth Year: 1956 | Trustee | Since 2011 | Partner of Brown Investment Advisory Incorporated, a registered investment adviser. | 7 | Chairman of Dillon Trust Company. | |||||
John M. Tesoro Birth Year: 1952 | Trustee | Since 2014 | Retired. | 7 | Trustee, Bridge Builder Trust (8 Funds); Director of Teton Advisors, Inc. (a registered investment adviser). |
TRUSTEES AND OFFICERS OF BBH GLOBAL CORE SELECT
(unaudited)
| Name, Address and Birth Year | | Position(s) Held with the Trust | | Term of Office and Length of Time Served# | | Principal Occupation(s) During Past 5 Years | | Number of Portfolios in Fund Complex Overseen by Trusteeˆ | | Other Public Company or Investment Company Directorships held by Trustee During Past 5 Years | ||||||||||||
Interested Trustees | ||||||||||||||||||||||
Susan C. Livingston+ 50 Post Office Square Boston, MA 02110 Birth Year: 1957 | Trustee | Since 2011 | Partner (since 1998) and Senior Client Advocate (since 2010) for BBH&Co.; Director of BBH Luxembourg S.C.A. (since 1992). | 7 | None. | |||||||||||||||||
John A. Gehret+ 140 Broadway New York, NY 10005 Birth Year: 1959 | Trustee | Since 2011 | Limited Partner of BBH&Co. (2012- present); Director of BBH Luxembourg S.C.A. (since 2012); Director of BBH Trust Company (Cayman) Ltd. (since 2012). | 7 | None. | |||||||||||||||||
financial statements october 31, 2018 | 41 |
TRUSTEES AND OFFICERS OF BBH GLOBAL CORE SELECT
(unaudited)
| Name, Address and Birth Year | Position(s) Held with the Trust | | Term of Office and Length of Time Served# | | Principal Occupation(s) During Past 5 Years | |
Officers | ||||||
Jean-Pierre Paquin 140 Broadway New York, NY 10005 Birth Year: 1973 | President and Principal Executive Officer | Since 2016 | Partner of BBH&Co. since 2015; joined BBH&Co. in 1996. | |||
Daniel Greifenkamp 140 Broadway New York, NY 10005 Birth Year: 1969 | Vice President | Since 2016 | Managing Director of BBH&Co. since 2014; joined BBH&Co. in 2011. | |||
Charles H. Schreiber 140 Broadway New York, NY 10005 Birth Year: 1957 | Treasurer and Principal Financial Officer | Since 2007 2006-2007 with the Predecessor Trust | Senior Vice President of BBH&Co. since 2001; joined BBH&Co. in 1999. | |||
Paul F. Gallagher 140 Broadway New York, NY 10005 Birth Year: 1959 | Chief Compliance Officer (“CCO”) | Since 2015 | Senior Vice President of BBH&Co. since September 2015; Executive Director, Counsel, Morgan Stanley Smith Barney LLC (2009-September 2015). | |||
Keith M. Kelley 50 Post Office Square Boston, MA 02110 Birth Year: 1983 | Anti-Money Laundering Officer (“AMLO”) | Since 2016 | Vice President of BBH&Co. since February 2016; joined BBH&Co. in 2016; Director, Legal and Compliance, Morgan Stanley Smith Barney LLC (2014-February 2016); Compliance Manager, State Street Corporation (2013-2014). | |||
Suzan M. Barron 50 Post Office Square Boston, MA 02110 Birth Year: 1964 | Secretary | Since 2009 | Senior Vice President and Senior Investor Services Counsel, BBH&Co. since 2005 |
TRUSTEES AND OFFICERS OF BBH GLOBAL CORE SELECT
(unaudited)
| Name, Address and Birth Year | Position(s) Held with the Trust | | Term of Office and Length of Time Served# | | Principal Occupation(s) During Past 5 Years | |
Crystal Cheung 140 Broadway New York, NY 10005 Birth Year: 1974 | Assistant Treasurer | Since 2018 | Assistant Vice President of BBH&Co. since 2016; joined BBH&Co. in 2014; Financial Reporting Manager, BNY Mellon Corporation (2010-2014). | |||
Brian J. Carroll 50 Post Office Square Boston, MA 02110 Birth Year: 1985 | Assistant Secretary | Since 2018 | Associate and Investor Services Assistant Counsel of BBH&Co. since 2017; joined BBH&Co. in 2014. |
| # | All officers of the Trust hold office for one year and until their respective successors are chosen and qualified (subject to the ability of the Trustees to remove any officer in accordance with the Trust’s By-laws). Mr. Wagner previously served on the Board of Trustees of the Predecessor Trust. |
| + | Ms. Livingston and Mr. Gehret are “interested persons” of the Trust as defined in the 1940 Act because of their positions as Partner and Limited Partner of BBH&Co., respectively. |
| ˆ | The Fund Complex consists of the Trust, which has seven series, and each is counted as one “Portfolio” for purposes of this table. |
financial statements october 31, 2018 | 43 |
Administrator Brown Brothers Harriman & Co. 140 Broadway New York, NY 10005 Distributor ALPS Distributors, Inc. 1290 Broadway, Suite 1100 Denver, CO 80203 Shareholder Servicing Agent Brown Brothers Harriman & Co. 140 Broadway New York, NY 10005 1-800-575-1265 | Investment Adviser Brown Brothers Harriman Mutual Fund Advisory Department 140 Broadway New York, NY 10005 | |||||
By telephone: | Call 1-800-575-1265 | |||||
By E-mail send your request to: | bbhfunds@bbh.com | |||||
On the internet: | www.bbhfunds.com | |||||
BBH PARTNER FUND – INTERNATIONAL EQUITY
MANAGEMENT’S DISCUSSION OF FUND PERFORMANCE
October 31, 2018
BBH PARTNER FUND – INTERNATIONAL EQUITY
MANAGEMENT’S DISCUSSION OF FUND PERFORMANCE (continued)
October 31, 2018
financial statements october 31, 2018 | 3 |
BBH PARTNER FUND – INTERNATIONAL EQUITY
MANAGEMENT’S DISCUSSION OF FUND PERFORMANCE (continued)
October 31, 2018
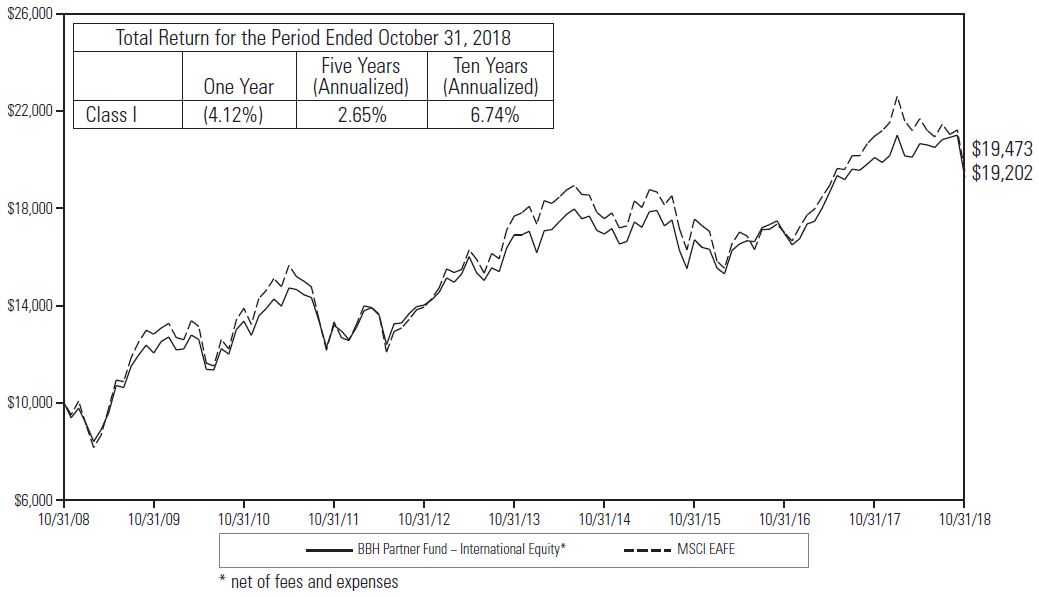 |
| 1 | The Fund’s performance assumes the reinvestment of all dividends and distributions. The EAFE has been adjusted to reflect reinvestment of dividends on securities in the index. The EAFE is not adjusted to reflect sales charges, expenses or other fees that the Securities and Exchange Commission requires to be reflected in the Fund’s performance. |
BBH PARTNER FUND – INTERNATIONAL EQUITY
REPORT OF INDEPENDENT REGISTERED PUBLIC ACCOUNTING FIRM
BBH Partner Fund – International Equity:
financial statements october 31, 2018 | 5 |
BBH PARTNER FUND – INTERNATIONAL EQUITY
REPORT OF INDEPENDENT REGISTERED PUBLIC ACCOUNTING FIRM (continued)
evaluating the accounting principles used and significant estimates made by management, as well as evaluating the overall presentation of the financial statements and financial highlights. Our procedures included confirmation of securities owned as of October 31, 2018, by correspondence with the custodian and brokers. We believe that our audits provide a reasonable basis for our opinion.
|
December 21, 2018
BBH PARTNER FUND – INTERNATIONAL EQUITY
PORTFOLIO ALLOCATION
October 31, 2018
| U.S. $ Value | Percent of Net Assets | |||||||||
Common Stock: | ||||||||||
Bermuda | $ | 15,910,181 | 1.1 | % | ||||||
Brazil | 27,644,365 | 1.8 | ||||||||
Canada | 64,936,859 | 4.3 | ||||||||
Cayman Islands | 91,450,463 | 6.1 | ||||||||
France | 148,245,889 | 9.8 | ||||||||
Germany | 170,984,076 | 11.4 | ||||||||
Hong Kong | 78,221,445 | 5.2 | ||||||||
Ireland | 36,949,190 | 2.4 | ||||||||
Japan | 68,104,059 | 4.5 | ||||||||
Jersey | 47,603,931 | 3.2 | ||||||||
Netherlands | 77,354,714 | 5.1 | ||||||||
South Korea | 24,854,912 | 1.6 | ||||||||
Spain | 37,082,880 | 2.5 | ||||||||
Sweden | 35,696,097 | 2.4 | ||||||||
Switzerland | 297,830,229 | 19.8 | ||||||||
United Kingdom | 188,945,569 | 12.5 | ||||||||
United States | 20,551,220 | 1.4 | ||||||||
Registered Investments Companies: United States | 39,200,000 | 2.6 | ||||||||
Cash and Other Assets in Excess of Liabilities | 34,167,266 | �� | 2.3 | |||||||
NET ASSETS | $ | 1,505,733,345 | 100.0 | % | ||||||
The accompanying notes are an integral part of these financial statements.
financial statements october 31, 2018 | 7 |
BBH PARTNER FUND – INTERNATIONAL EQUITY
PORTFOLIO ALLOCATION (continued)
October 31, 2018
| U.S. $ Value | Percent of Net Assets | |||||||||
Common Stock: | ||||||||||
Basic Materials | $ | 43,208,665 | 2.9 | % | ||||||
Communications | 101,645,646 | 6.7 | ||||||||
Consumer Cyclical | 304,882,431 | 20.2 | ||||||||
Consumer Non-Cyclical | 414,414,752 | 27.5 | ||||||||
Financials | 243,857,055 | 16.2 | ||||||||
Industrials | 175,509,507 | 11.7 | ||||||||
Technology | 148,848,023 | 9.9 | ||||||||
Registered Investment Companies | 39,200,000 | 2.6 | ||||||||
Cash and Other Assets in Excess of Liabilities | 34,167,266 | 2.3 | ||||||||
NET ASSETS | $ | 1,505,733,345 | 100.0 | % | ||||||
The accompanying notes are an integral part of these financial statements.
BBH PARTNER FUND – INTERNATIONAL EQUITY
PORTFOLIO OF INVESTMENTS
October 31, 2018
| Shares/ Units | Value | |||||||||
COMMON STOCK (95.1%) | ||||||||||
BERMUDA (1.1%) | ||||||||||
CONSUMER NON-CYCLICAL | ||||||||||
| 302,878 | IHS Markit, Ltd.1 | $ | 15,910,181 | |||||||
Total Bermuda | 15,910,181 | |||||||||
BRAZIL (1.8%) | ||||||||||
CONSUMER NON-CYCLICAL | ||||||||||
| 6,283,087 | Ambev SA | 27,644,365 | ||||||||
Total Brazil | 27,644,365 | |||||||||
CANADA (4.3%) | ||||||||||
CONSUMER CYCLICAL | ||||||||||
| 412,122 | Alimentation Couche-Tard, Inc. (Class B) | 19,735,022 | ||||||||
FINANCIALS | ||||||||||
| 541,686 | Brookfield Asset Management, Inc. (Class A) | 22,073,705 | ||||||||
TECHNOLOGY | ||||||||||
| 33,515 | Constellation Software, Inc. | 23,128,132 | ||||||||
Total Canada | 64,936,859 | |||||||||
CAYMAN ISLANDS (6.1%) | ||||||||||
COMMUNICATIONS | ||||||||||
| 455,268 | Alibaba Group Holding, Ltd. ADR1 | 64,775,531 | ||||||||
| 786,700 | Tencent Holdings, Ltd. | 26,674,932 | ||||||||
Total Cayman Islands | 91,450,463 | |||||||||
FRANCE (9.8%) | ||||||||||
BASIC MATERIALS | ||||||||||
| 356,546 | Air Liquide SA | 43,208,665 | ||||||||
CONSUMER CYCLICAL | ||||||||||
| 132,034 | LVMH Moet Hennessy Louis Vuitton SE | 40,018,225 | ||||||||
TECHNOLOGY | ||||||||||
| 531,566 | Capgemini SE | 65,018,999 | ||||||||
Total France | 148,245,889 | |||||||||
The accompanying notes are an integral part of these financial statements.
financial statements october 31, 2018 | 9 |
BBH PARTNER FUND – INTERNATIONAL EQUITY
PORTFOLIO OF INVESTMENTS (continued)
October 31, 2018
| Shares/ Units | Value | |||||||||
COMMON STOCKS (continued) | ||||||||||
GERMANY (11.4%) | ||||||||||
CONSUMER CYCLICAL | ||||||||||
| 183,987 | Adidas AG | $ | 43,359,345 | |||||||
CONSUMER NON-CYCLICAL | ||||||||||
| 1,069,795 | Fresenius SE & Co. KGaA | 68,208,254 | ||||||||
| 376,721 | Merck KGaA | 40,386,671 | ||||||||
| 108,594,925 | ||||||||||
TECHNOLOGY | ||||||||||
| 177,488 | SAP SE | 19,029,806 | ||||||||
Total Germany | 170,984,076 | |||||||||
HONG KONG (5.2%) | ||||||||||
FINANCIALS | ||||||||||
| 10,280,410 | AIA Group, Ltd. | 78,221,445 | ||||||||
Total Hong Kong | 78,221,445 | |||||||||
IRELAND (2.4%) | ||||||||||
INDUSTRIALS | ||||||||||
| 1,236,026 | CRH, Plc. | 36,949,190 | ||||||||
Total Ireland | 36,949,190 | |||||||||
JAPAN (4.5%) | ||||||||||
COMMUNICATIONS | ||||||||||
| 220,025 | Dentsu, Inc. | 10,195,183 | ||||||||
CONSUMER NON-CYCLICAL | ||||||||||
| 897,210 | Seven & i Holdings Co., Ltd. | 38,815,552 | ||||||||
INDUSTRIALS | ||||||||||
| 39,200 | Keyence Corp. | 19,093,324 | ||||||||
Total Japan | 68,104,059 | |||||||||
The accompanying notes are an integral part of these financial statements.
BBH PARTNER FUND – INTERNATIONAL EQUITY
PORTFOLIO OF INVESTMENTS (continued)
October 31, 2018
| Shares/ Units | Value | |||||||||
COMMON STOCKS (continued) | ||||||||||
JERSEY (3.2%) | ||||||||||
CONSUMER CYCLICAL | ||||||||||
| 705,740 | Ferguson, Plc. | $ | 47,603,931 | |||||||
Total Jersey | 47,603,931 | |||||||||
NETHERLANDS (5.1%) | ||||||||||
CONSUMER NON-CYCLICAL | ||||||||||
| 395,777 | Heineken NV | 35,683,628 | ||||||||
TECHNOLOGY | ||||||||||
| 243,591 | ASML Holding NV | 41,671,086 | ||||||||
Total Netherlands | 77,354,714 | |||||||||
SOUTH KOREA (1.6%) | ||||||||||
CONSUMER NON-CYCLICAL | ||||||||||
| 27,027 | LG Household & Health Care, Ltd. | 24,854,912 | ||||||||
Total South Korea | 24,854,912 | |||||||||
SPAIN (2.5%) | ||||||||||
CONSUMER CYCLICAL | ||||||||||
| 1,314,222 | Industria de Diseno Textil SA | 37,082,880 | ||||||||
Total Spain | 37,082,880 | |||||||||
SWEDEN (2.4%) | ||||||||||
INDUSTRIALS | ||||||||||
| 1,131,360 | Atlas Copco AB (Class A) | 28,006,877 | ||||||||
| 156,851 | Hexagon AB (Class B) | 7,689,220 | ||||||||
Total Sweden | 35,696,097 | |||||||||
SWITZERLAND (19.8%) | ||||||||||
CONSUMER CYCLICAL | ||||||||||
| 514,970 | Cie Financiere Richemont SA | 37,600,772 | ||||||||
The accompanying notes are an integral part of these financial statements.
financial statements october 31, 2018 | 11 |
BBH PARTNER FUND – INTERNATIONAL EQUITY
PORTFOLIO OF INVESTMENTS (continued)
October 31, 2018
| Shares/ Units | Value | |||||||||
COMMON STOCKS (continued) | ||||||||||
SWITZERLAND (continued) | ||||||||||
CONSUMER NON-CYCLICAL | ||||||||||
| 50,696 | Lonza Group AG1 | $ | 15,916,097 | |||||||
| 852,116 | Nestle SA | 71,955,549 | ||||||||
| 12,778 | SGS SA | 30,311,468 | ||||||||
| 118,183,114 | ||||||||||
FINANCIALS | ||||||||||
| 2,546,694 | Credit Suisse Group AG1 | 33,231,886 | ||||||||
| 35,209 | Partners Group Holding AG | 25,043,561 | ||||||||
| 58,275,447 | ||||||||||
INDUSTRIALS | ||||||||||
| 846,216 | ABB, Ltd. | 17,032,617 | ||||||||
| 289,011 | Kuehne + Nagel International AG | 40,185,324 | ||||||||
| 206,834 | Sika AG | 26,552,955 | ||||||||
| 83,770,896 | ||||||||||
Total Switzerland | 297,830,229 | |||||||||
UNITED KINGDOM (12.5%) | ||||||||||
CONSUMER CYCLICAL | ||||||||||
| 4,040,755 | Compass Group, Plc. | 79,482,256 | ||||||||
CONSUMER NON-CYCLICAL | ||||||||||
| 1,221,717 | RELX, Plc. | 24,176,855 | ||||||||
FINANCIALS | ||||||||||
| 21,744,934 | Melrose Industries, Plc. | 46,778,019 | ||||||||
| 1,920,264 | Prudential, Plc. | 38,508,439 | ||||||||
| 85,286,458 | ||||||||||
Total United Kingdom | 188,945,569 | |||||||||
UNITED STATES (1.4%) | ||||||||||
CONSUMER NON-CYCLICAL | ||||||||||
| 223,772 | Worldpay, Inc. (Class A)1 | 20,551,220 | ||||||||
Total United States | 20,551,220 | |||||||||
Total Common Stock (Identified cost $1,450,279,298) | 1,432,366,079 | |||||||||
The accompanying notes are an integral part of these financial statements.
BBH PARTNER FUND – INTERNATIONAL EQUITY
PORTFOLIO OF INVESTMENTS (continued)
October 31, 2018
| Shares/ Units | Value | |||||||||
REGISTERED INVESTMENT COMPANIES (2.6%) | ||||||||||
| 39,200,000 | Morgan Stanley Institutional Liquidity Funds — Treasury Securities Portfolio, Institutional Share Class | $ | 39,200,000 | |||||||
Total Registered Investment Companies (Identified cost $39,200,000) | 39,200,000 | |||||||||
TOTAL INVESTMENTS (Identified cost $1,489,479,298)2 | 97.7 | % | $ | 1,471,566,079 | ||||||
CASH AND OTHER ASSETS IN EXCESS OF LIABILITIES | 2.3 | % | 34,167,266 | |||||||
NET ASSETS | 100.0 | % | $ | 1,505,733,345 |
| 1 | Non-income producing security. |
| 2 | The aggregate cost for federal income tax purposes is $1,491,081,743, the aggregate gross unrealized appreciation is $99,580,394 and the aggregate gross unrealized depreciation is $119,096,058, resulting in net unrealized depreciation of $19,515,664. |
The accompanying notes are an integral part of these financial statements.
financial statements october 31, 2018 | 13 |
BBH PARTNER FUND – INTERNATIONAL EQUITY
PORTFOLIO OF INVESTMENTS (continued)
October 31, 2018
— | Level 1 – unadjusted quoted prices in active markets for identical assets and liabilities. |
— | Level 2 – significant other observable inputs (including quoted prices for similar assets and liabilities, interest rates, prepayment speeds, credit risk, etc.). |
— | Level 3 – significant unobservable inputs (including the Fund’s own assumptions in determining the fair value of assets and liabilities). |
The accompanying notes are an integral part of these financial statements.
BBH PARTNER FUND – INTERNATIONAL EQUITY
PORTFOLIO OF INVESTMENTS (continued)
October 31, 2018
The accompanying notes are an integral part of these financial statements.
financial statements october 31, 2018 | 15 |
BBH PARTNER FUND – INTERNATIONAL EQUITY
PORTFOLIO OF INVESTMENTS (continued)
October 31, 2018
| Investments, at value | Unadjusted Quoted Prices in Active Markets for Identical Investments (Level 1)* | Significant Other Observable Inputs (Level 2)* | Significant Unobservable Inputs (Level 3)* | Balance as of October 31, 2018 | ||||||||||||||
Common Stock: | ||||||||||||||||||
Bermuda | $ | 15,910,181 | $ | — | $ | — | $ | 15,910,181 | ||||||||||
Brazil | — | 27,644,365 | — | 27,644,365 | ||||||||||||||
Canada | 64,936,859 | — | — | 64,936,859 | ||||||||||||||
Cayman Islands | 64,775,531 | 26,674,932 | — | 91,450,463 | ||||||||||||||
France | — | 148,245,889 | — | 148,245,889 | ||||||||||||||
Germany | — | 170,984,076 | — | 170,984,076 | ||||||||||||||
Hong Kong | — | 78,221,445 | — | 78,221,445 | ||||||||||||||
Ireland | — | 36,949,190 | — | 36,949,190 | ||||||||||||||
Japan | — | 68,104,059 | — | 68,104,059 | ||||||||||||||
Jersey | — | 47,603,931 | — | 47,603,931 | ||||||||||||||
Netherlands | — | 77,354,714 | — | 77,354,714 | ||||||||||||||
South Korea | — | 24,854,912 | — | 24,854,912 | ||||||||||||||
Spain | — | 37,082,880 | — | 37,082,880 | ||||||||||||||
Sweden | — | 35,696,097 | — | 35,696,097 | ||||||||||||||
Switzerland | — | 297,830,229 | — | 297,830,229 | ||||||||||||||
United Kingdom | — | 188,945,569 | — | 188,945,569 | ||||||||||||||
United States | 20,551,220 | — | — | 20,551,220 | ||||||||||||||
Registered Investment Companies: United States | 39,200,000 | — | — | 39,200,000 | ||||||||||||||
Investments, at value | $ | 205,373,791 | $ | 1,266,192,288 | $ | — | $ | 1,471,566,079 | ||||||||||
* | The Fund’s policy is to disclose transfers between levels based on valuations at the end of the reporting period. There were no transfers between Levels 1, 2 or 3 during the year ended October 31, 2018. |
The accompanying notes are an integral part of these financial statements.
BBH PARTNER FUND – INTERNATIONAL EQUITY
STATEMENT OF ASSETS AND LIABILITIES
October 31, 2018
ASSETS: | ||||||
Investments in securities, at value (Identified cost $1,489,479,298) | $ | 1,471,566,079 | ||||
Cash | 29,090,548 | |||||
Foreign currency at value (Identified cost $4) | 4 | |||||
Receivables for: | ||||||
Dividends | 4,819,999 | |||||
Shares sold | 1,414,375 | |||||
Investments sold | 395,432 | |||||
Prepaid assets | 72,774 | |||||
Total Assets | 1,507,359,211 | |||||
LIABILITIES: | ||||||
Payables for: | ||||||
Investment advisory and administrative fees | 849,179 | |||||
Shares redeemed | 688,062 | |||||
Professional fees | 65,952 | |||||
Transfer agent fees | 3,702 | |||||
Board of Trustees’ fees | 288 | |||||
Accrued expenses and other liabilities | 18,683 | |||||
Total Liabilities | 1,625,866 | |||||
NET ASSETS | $ | 1,505,733,345 | ||||
Net Assets Consist of: | ||||||
Paid-in capital | $ | 1,420,125,022 | ||||
Retained earnings | 85,608,323 | |||||
Net Assets | $ | 1,505,733,345 | ||||
NET ASSET VALUE AND OFFERING PRICE PER SHARE | ||||||
CLASS I SHARES | ||||||
($1,505,733,345 ÷ 101,077,433 shares outstanding) | $14.90 |
The accompanying notes are an integral part of these financial statements.
financial statements october 31, 2018 | 17 |
BBH PARTNER FUND – INTERNATIONAL EQUITY
STATEMENT OF OPERATIONS
For the year ended October 31, 2018
NET INVESTMENT INCOME: | ||||||
Income: | �� | |||||
Dividends (net of foreign withholding taxes of $2,348,951) | $ | 27,279,720 | ||||
Other income | 206 | |||||
Total Income | 27,279,926 | |||||
Expenses: | ||||||
Investment advisory and administrative fees | 9,648,016 | |||||
Custody and fund accounting fees | 402,338 | |||||
Professional fees | 75,292 | |||||
Board of Trustees’ fees | 53,133 | |||||
Transfer agent fees | 32,561 | |||||
Miscellaneous expenses | 114,383 | |||||
Total Expenses | 10,325,723 | |||||
Expense offset arrangement | (524,200 | ) | ||||
Net Expenses | 9,801,523 | |||||
Net Investment Income | 17,478,403 | |||||
NET REALIZED AND UNREALIZED LOSS: | ||||||
Net realized gain on investments in securities | 89,420,370 | |||||
Net realized loss on foreign exchange transactions and translations | (723,474 | ) | ||||
Net realized gain on investments in securities and foreign exchange transactions and translations | 88,696,896 | |||||
Net change in unrealized appreciation/(depreciation) on investments in securities | (176,057,960 | ) | ||||
Net change in unrealized appreciation/(depreciation) on foreign currency translations | (60,633 | ) | ||||
Net change in unrealized appreciation/(depreciation) on investments in securities and foreign currency translations | (176,118,593 | ) | ||||
Net Realized and Unrealized Loss | (87,421,697 | ) | ||||
Net Decrease in Net Assets Resulting from Operations | $ | (69,943,294 | ) |
The accompanying notes are an integral part of these financial statements.
BBH PARTNER FUND – INTERNATIONAL EQUITY
STATEMENTS OF CHANGES IN NET ASSETS
| For the years ended October 31, | |||||||||||
| 2018 | 2017 | ||||||||||
INCREASE IN NET ASSETS: | |||||||||||
Operations: | |||||||||||
Net investment income | $ | 17,478,403 | $ | 10,719,147 | |||||||
Net realized gain on investments in securities and foreign exchange transactions and translations | 88,696,896 | 148,540,985 | |||||||||
Net change in unrealized appreciation/(depreciation) on investments in securities and foreign currency translations | (176,118,593 | ) | 41,034,703 | ||||||||
Net increase (decrease) in net assets resulting from operations | (69,943,294 | ) | 200,294,835 | ||||||||
Dividends and distributions declared: | |||||||||||
Class N1 | — | (912,244 | )2 | ||||||||
Class I | (102,915,403 | ) | (20,664,200 | )2 | |||||||
Total dividends and distributions declared | (102,915,403 | ) | (21,576,444 | ) | |||||||
Share transactions: | |||||||||||
Proceeds from sales of shares | 324,005,397 | 425,081,311 | 3 | ||||||||
Net asset value of shares issued to shareholders for reinvestment of dividends and distributions | 4,374,243 | 1,195,485 | |||||||||
Proceeds from short-term redemption fees | — | 5,129 | |||||||||
Cost of shares redeemed | (75,329,408 | ) | (138,701,031 | )3 | |||||||
Net increase in net assets resulting from share transactions | 253,050,232 | 287,580,894 | |||||||||
Total increase in net assets | 80,191,535 | 466,299,285 | |||||||||
NET ASSETS: | |||||||||||
Beginning of year | 1,425,541,810 | 959,242,525 | |||||||||
End of year | $ | 1,505,733,345 | $ | 1,425,541,810 | 4 | ||||||
| 1 | Effective February 24, 2017 Class N shares were converted into Class I shares. |
| 2 | For the year ended October 31, 2017, dividends and distributions declared where only from net investment income for Class N and Class I. |
| 3 | Includes share exchanges. See note 5 in Notes to Financial Statements. |
| 4 | Including undistributed net investment income of $8,990,100. |
The accompanying notes are an integral part of these financial statements.
financial statements october 31, 2018 | 19 |
BBH PARTNER FUND – INTERNATIONAL EQUITY
FINANCIAL HIGHLIGHTS
Selected per share data and ratios for a Class I share outstanding throughout each year.
| For the years ended October 31, | |||||||||||||||||||||||
| 2018 | 2017* | 2016 | 2015 | 2014 | |||||||||||||||||||
Net asset value, beginning of year | $ | 16.75 | $ | 14.46 | $ | 14.54 | $ | 15.16 | $ | 15.43 | |||||||||||||
Income from investment operations: | |||||||||||||||||||||||
Net investment income1 | 0.18 | 0.14 | 0.34 | 0.26 | 0.40 | ||||||||||||||||||
Net realized and unrealized gain (loss) | (0.83 | ) | 2.47 | (0.14 | ) | (0.49 | ) | (0.38 | ) | ||||||||||||||
Total income (loss) from investment operations | (0.65 | ) | 2.61 | 0.20 | (0.23 | ) | 0.02 | ||||||||||||||||
Less dividends and distributions: | |||||||||||||||||||||||
From net investment income | (0.10 | ) | (0.32 | ) | (0.28 | ) | (0.39 | ) | (0.29 | ) | |||||||||||||
From net realized gains | (1.10 | ) | — | — | — | — | |||||||||||||||||
Total dividends and distributions | (1.20 | ) | (0.32 | ) | (0.28 | ) | (0.39 | ) | (0.29 | ) | |||||||||||||
Short-term redemption fees1 | — | 0.00 | 2 | 0.00 | 2 | 0.00 | 2 | — | |||||||||||||||
Net asset value, end of year | $ | 14.90 | $ | 16.75 | $ | 14.46 | $ | 14.54 | $ | 15.16 | |||||||||||||
Total return | (4.12 | )% | 18.51 | % | 1.51 | % | (1.42 | )% | 0.21 | % | |||||||||||||
Ratios/Supplemental data: | |||||||||||||||||||||||
Net assets, end of year (in millions) | $ | 1,506 | $ | 1,426 | $ | 914 | $ | 68 | $ | 86 | |||||||||||||
Ratio of expenses to average net assets before reductions | 0.68 | % | 0.74 | % | 0.85 | % | 0.89 | % | 0.90 | % | |||||||||||||
Expense offset arrangement | 0.03 | % | 0.01 | % | 0.00 | %3 | 0.00 | %3 | 0.00 | %3 | |||||||||||||
Ratio of expenses to average net assets after reductions | 0.65 | % | 0.73 | % | 0.85 | % | 0.89 | % | 0.90 | % | |||||||||||||
Ratio of net investment income to average net assets | 1.15 | % | 0.91 | % | 2.41 | % | 1.77 | % | 2.62 | % | |||||||||||||
Portfolio turnover rate | 124 | % | 130 | % | 12 | % | 18 | % | 15 | % | |||||||||||||
* | Effective February 24, 2017 Class N shares were converted into Class I shares. |
| 1 | Calculated using average shares outstanding for the year. |
| 2 | Less than $0.01. |
| 3 | Less than 0.01%. |
The accompanying notes are an integral part of these financial statements.
BBH PARTNER FUND – INTERNATIONAL EQUITY
NOTES TO FINANCIAL STATEMENTS
October 31, 2018
1. | Organization. The Fund is a separate, diversified series of BBH Trust (the “Trust”), which is registered under the Investment Company Act of 1940, as amended (the “1940 Act”), as an open-end management investment company. The Trust was originally organized under the laws of the State of Maryland on July 16, 1990 as BBH Fund, Inc. and re-organized as a Delaware statutory trust on June 12, 2007. The Fund commenced operations on June 6, 1997. The Fund currently offers one class of shares designated as Class I shares. The investment objective of the Fund is long-term maximization of total return, primarily through capital appreciation. As of October 31, 2018, there were seven series of the Trust. |
2. | Significant Accounting Policies. The Fund’s financial statements are prepared in accordance with Generally Accepted Accounting Principles in the United States of America (“GAAP”). The Fund is an investment company and accordingly follows the investment company accounting and reporting guidance of the Financial Accounting Standards Board (“FASB”) Accounting Standard Codification Topic 946 Financial Services — Investment Companies. The following summarizes significant accounting policies of the Fund: |
A. | Valuation of Investments. (1) The value of investments listed on a securities exchange is based on the last sale price on that exchange prior to the time when assets are valued, or in the absence of recorded sales, at the average of readily available closing bid and asked prices on such exchange; (2) securities not traded on an exchange are valued at the average of the quoted bid and asked prices in the over-the-counter market; (3) securities or other assets for which market quotations are not readily available are valued at fair value in accordance with procedures established by and under the general supervision and responsibility of the Board of Trustees (the “Board”); (4) for securities traded on international exchanges, if events which may affect the value of the Fund’s securities occur after the close of the primary exchange on which such securities trade and before the Fund’s net asset value is next determined, then those securities will be fair valued as determined in good faith under supervision of the Board. The Fund currently uses a systematic fair value model provided by an independent third party to adjust the observed values of international securities on a daily basis; (5) short-term investments, which mature in 60 days or less are valued at amortized cost if their original maturity was 60 days or less, or by amortizing their value on the 61st day prior to maturity, if their original maturity when acquired by the Fund was more than 60 days, unless the use of amortized cost is determined not to represent “fair value” by the Board. |
B. | Accounting for Investments and Income. Investment transactions are accounted for on the trade date. Realized gains and losses on investment transactions are determined based on the identified cost method. Dividend income and other distributions received from portfolio securities are recorded on the ex-dividend date. Non-cash dividends included in dividend income, if any, are recorded at the fair market value of securities received at ex-date. Distributions received on securities that |
financial statements october 31, 2018 | 21 |
BBH PARTNER FUND – INTERNATIONAL EQUITY
NOTES TO FINANCIAL STATEMENTS (continued)
October 31, 2018
| represent a return of capital are recorded as a reduction of cost of investments. Distributions received on securities that represent a capital gain are recorded as a realized gain. Interest income is accrued daily. Investment income is recorded net of any foreign taxes withheld where recovery of such tax is uncertain. |
C. | Fund Expenses. Most expenses of the Trust can be directly attributed to a specific fund. Expenses which cannot be directly attributed to a fund are apportioned amongst each fund in the Trust on a net assets basis. Expense estimates are accrued in the period to which they relate and adjustments are made when actual amounts are known. |
D. | Forward Foreign Currency Exchange Contracts. The Fund may enter into forward foreign currency exchange contracts (“Contracts”) in connection with planned purchases or sales of securities to economically hedge the U.S. dollar value of securities denominated in a particular currency, or to increase or shift its exposure to a currency other than U.S. dollars. The Fund has no specific limitation on the percentage of assets which may be committed to these types of Contracts. The Fund could be exposed to risks if the counterparties to the Contracts are unable to meet the terms of their Contracts or if the value of the foreign currency changes unfavorably. The U.S. dollar values of foreign currency underlying all contractual commitments held by the Fund are determined using forward foreign currency exchange rates supplied by a quotation service. During the year ended October 31, 2018, the Fund had no open contracts. |
E. | Foreign Currency Translations. The accounting records of the Fund are maintained in U.S. dollars. Foreign currency amounts are translated into U.S. dollars at the current rate of exchange of such currency against the U.S. dollar to determine the value of investments, assets and liabilities. Purchases and sales of securities, and income and expenses are translated at the prevailing rate of exchange on the respective dates of such transactions. Upon the purchase or sale of a security denominated in foreign currency, the Fund may enter into forward foreign currency exchange contracts for the purchase or sale, for a fixed amount of U.S. dollars, of the amount of foreign currency involved in the underlying security transaction. Reported net realized gains and losses arise from the sales of portfolio securities, sales of foreign currencies, currency gains or losses realized between the trade and settlement dates on securities transactions, and the difference between the amounts of dividends, interest and foreign withholding taxes recorded on the Fund’s books and the U.S. dollar equivalent of the amounts actually received or paid. The effect of changes in foreign exchange rates on foreign denominated securities is reflected in the net realized and unrealized gain or loss on investments in securities and foreign exchange transactions and translations and net change in unrealized appreciation or depreciation on investments in securities and foreign |
BBH PARTNER FUND – INTERNATIONAL EQUITY
NOTES TO FINANCIAL STATEMENTS (continued)
October 31, 2018
currency translations within the Statement of Operations. Net unrealized appreciation or depreciation on foreign currency translations arise from changes in the value of the assets and liabilities, excluding investments in securities, at period end, resulting from changes in the exchange rate.
F. | Federal Income Taxes. The Fund may be subject to foreign taxes on income, gains on investments or currency repatriation, a portion of which may be recoverable. The Fund will accrue such taxes and recoveries, as applicable, based upon its current interpretation of tax rules and regulations that exist in the markets in which it invests. |
financial statements october 31, 2018 | 23 |
BBH PARTNER FUND – INTERNATIONAL EQUITY
NOTES TO FINANCIAL STATEMENTS (continued)
October 31, 2018
Fund is subject to examination by U.S. federal and state tax authorities for returns filed for the prior three years. The Fund is not aware of any tax positions for which it is reasonably possible that the total amounts of unrecognized tax benefits will significantly change in the next twelve months.
G. | Dividends and Distributions to Shareholders. Dividends and distributions from net investment income to shareholders, if any, are paid annually and are recorded on the ex-dividend date. Distributions from net capital gains, if any, are generally declared and paid annually and are recorded on the ex-dividend date. The Fund declared dividends in the amount of $102,915,403 to Class I shares during the year ended October 31, 2018. In addition, the Fund designated a portion of the payment made to redeeming shareholders as a distribution for income tax purposes. |
| Distributions paid from: | ||||||||||||||||||||
| Ordinary income | Net long-term capital gain | Total taxable distributions | Tax return of capital | Total distributions paid | ||||||||||||||||
2018: | $ | 17,240,637 | $ | 85,674,766 | $ | 102,915,403 | $ | — | $ | 102,915,403 | ||||||||||
2017: | 21,576,444 | — | 21,576,444 | — | 21,576,444 | |||||||||||||||
| Components of retained earnings/(accumulated deficit): | ||||||||||||||||||||||||||||||||
| Undistributed ordinary income | Undistributed long-term capital gain | Retained earnings/ (accumulated deficit) | Accumulated capital and other losses | Other book/tax temporary differences | Book unrealized appreciation/ (depreciation) | Total retained earnings/ (accumulated deficit) | ||||||||||||||||||||||||||
2018: | $ | 52,353,382 | $ | 52,846,121 | $ | 105,199,503 | $ | — | $ | (1,602,445 | ) | $ | (17,988,735 | ) | $ | 85,608,323 | ||||||||||||||||
2017: | 17,227,537 | 85,667,346 | 102,894,883 | — | (100,912 | ) | 158,129,858 | 260,923,829 | ||||||||||||||||||||||||
BBH PARTNER FUND – INTERNATIONAL EQUITY
NOTES TO FINANCIAL STATEMENTS (continued)
October 31, 2018
H. | Use of Estimates. The preparation of the financial statements in accordance with GAAP requires management to make estimates and assumptions that affect the reported amounts of assets and liabilities in the financial statements, disclosure of contingent assets and liabilities at the date of the financial statements and the reported amounts of increase and decrease in net assets from operations during the reporting period. Actual results could differ from these estimates. |
A. | Investment Advisory and Administrative Fees. Under a combined Investment Advisory and Administrative Services Agreement (“Agreement”) with the Trust, Brown Brothers Harriman & Co. (“BBH”) through a separately identifiable department (“SID” or “Investment Adviser”) provides investment advisory, portfolio management and administrative services to the Fund. BBH employs a “manager-of-managers” investment approach, whereby it allocates the Fund’s assets to the Fund’s sub-adviser, currently Select Equity Group, L.P. (“Select Equity Group” or the “Sub-adviser”). The Sub-adviser is responsible for investing the assets of the Fund and the Investment Adviser oversees the Sub-adviser and evaluates its performance results. The Fund’s investment advisory and administrative services fee is calculated daily and paid monthly at an annual rate equivalent to 0.65% per annum on the first $3 billion of average daily net assets and 0.60% per annum on all average daily net assets over $3 billion. The Investment Adviser pays its Sub-adviser a percentage from its investment advisory and administrative fees. For the year ended October 31, 2018, the Fund incurred $9,648,016 for services under the Agreement. |
B. | Custody and Fund Accounting Fees. BBH acts as a custodian and fund accountant and receives custody and fund accounting fees from the Fund calculated daily and incurred monthly. BBH holds all of the Fund’s cash and investments and calculates the Fund’s daily net asset value. The custody fee is an asset and transaction-based fee. The fund accounting fee is an asset-based fee calculated at 0.004% of the Fund’s net asset value. For the year ended October 31, 2018, the Fund incurred $402,338 in custody and fund accounting fees. These fees for the Fund were reduced by $524,200 as a result of an expense offset arrangement with the Fund’s custodian. The credit amount (if any) is disclosed in the Statement of Operations as a reduction to the Fund’s expenses. In the event that the Fund is overdrawn, under the custody agreement with BBH, BBH will make overnight loans to the Fund to cover overdrafts. Pursuant to their agreement, the Fund will pay the Federal Funds overnight investment rate on the day of the overdraft. The total interest incurred by the Fund for the year ended October 31, 2018, was $3,208. This amount is included under line item “Custody and fund accounting fees” in the Statement of Operations. |
financial statements october 31, 2018 | 25 |
BBH PARTNER FUND – INTERNATIONAL EQUITY
NOTES TO FINANCIAL STATEMENTS (continued)
October 31, 2018
C. | Board of Trustees’ Fees. Each Trustee who is not an “interested person” as defined under the 1940 Act receives an annual fee as well as reimbursement for reasonable out-of-pocket expenses from the Fund. For the year ended October 31, 2018, the Fund incurred $53,133 in independent Trustee compensation and expense reimbursements. |
D. | Officers of the Trust. Certain officers of the Trust are also employees of BBH. Such officers are paid no fees by the Trust for their services to the Trust. |
4. | Investment Transactions. For the year ended October 31, 2018, the cost of purchases and the proceeds of sales of investment securities, other than short-term investments, were $2,013,306,741 and $1,846,389,523 respectively. |
5. | Shares of Beneficial Interest. The Trust is permitted to issue an unlimited number of Class I shares of beneficial interest, at no par value. Effective February 24, 2017, the Fund’s Class N shares were converted into Class I shares. Transactions in Class N shares and Class I shares were as follows: |
| For the year ended October 31, 2018 | For the year ended October 31, 2017 | ||||||||||||||||||
| Shares | Dollars | Shares | Dollars | ||||||||||||||||
Class N | |||||||||||||||||||
Shares sold | N/A | $ | N/A | 254,302 | $ | 3,635,185 | |||||||||||||
Shares issued in connection with reinvestments of dividends | N/A | N/A | 63,325 | 885,747 | |||||||||||||||
Proceeds from short-term redemption fees | N/A | N/A | N/A | — | |||||||||||||||
Shares redeemed | N/A | N/A | (3,432,844 | ) | (50,037,147 | ) | |||||||||||||
Net decrease | N/A | $ | N/A | (3,115,217 | ) | $ | (45,516,215 | ) | |||||||||||
Class I | |||||||||||||||||||
Shares sold | 20,426,475 | $ | 324,005,397 | 27,598,208 | $ | 421,446,126 | |||||||||||||
Shares issued in connection with reinvestments of dividends | 283,237 | 4,374,243 | 22,126 | 309,738 | |||||||||||||||
Proceeds from short-term redemption fees | N/A | — | N/A | 5,129 | |||||||||||||||
Shares redeemed | (4,744,185 | ) | (75,329,408 | ) | (5,731,089 | ) | (88,663,884 | ) | |||||||||||
Net increase | 15,965,527 | $ | 253,050,232 | 21,889,245 | $ | 333,097,109 | |||||||||||||
BBH PARTNER FUND – INTERNATIONAL EQUITY
NOTES TO FINANCIAL STATEMENTS (continued)
October 31, 2018
| Included in Shares Sold and Shares Redeemed are shareholder exchanges during the year ended October 31, 2017. Specifically: |
| During the year ended October 31, 2017, 3,299,230 shares of Class N were exchanged for 3,295,030 shares of Class I valued at $48,140,385. |
A. | Principal Risk Factors. Investing in the Fund may involve certain risks, as discussed in the Fund’s prospectus, including, but not limited to, those described below: |
financial statements october 31, 2018 | 27 |
BBH PARTNER FUND – INTERNATIONAL EQUITY
NOTES TO FINANCIAL STATEMENTS (continued)
October 31, 2018
funds during periods when the Fund’s large cap securities are out of favor (large cap company risk). The extent of the Fund’s exposure to these risks in respect to these financial assets is included in their value as recorded in the Fund’s Statement of Assets and Liabilities.
B. | Indemnifications. Under the Trust’s organizational documents, its officers and Trustees may be indemnified against certain liabilities and expenses arising out of the performance of their duties to the Fund, and shareholders are indemnified against personal liability for the obligations of the Trust. Additionally, in the normal course of business, the Fund enters into agreements with service providers that may contain indemnification clauses. The Fund’s maximum exposure under these arrangements is unknown as this would involve future claims that may be made against the Fund that have not yet occurred. The risk of material loss from such claims is considered remote. |
7. | Recent Pronouncements. |
A. | ASU 2018-13. On August 28, 2018, the Financial Accounting Standards Board issued an Accounting Standards Update, ASU 2018-13, Fair Value Measurement (Topic 820): Disclosure Framework — Changes to the Disclosure Requirements for Fair Value Measurement (the “ASU 2018-13”). ASU 2018-13 modifies the disclosure objective paragraphs of Accounting Standards Codification 820 to eliminate (1) “at a minimum” from the phrase “an entity shall disclose at a minimum” and (2) other similar “open ended” disclosure requirements to promote the appropriate exercise of discretion by entities. ASU 2018-13 also eliminates and modifies other requirements under ASU 2018-13. ASU 2018-13 is effective for all entities for fiscal years, and interim periods within those fiscal years, beginning after December 15, 2019. Early application is permitted and Management is currently evaluating the application of ASU 2018-13 and its impact, if any, on the Fund’s financial statements. |
B. | Regulation S-X. In October 2018, the U.S. Securities and Exchange Commission adopted amendments to certain disclosure requirements that had become “redundant, duplicative, overlapping, outdated or superseded, in light of the other Commission disclosure requirements, U.S. GAAP or changes in the information environment”. The compliance date for the amendments to Regulation S-X is November 5, 2018 (for reporting period end dates of September 30, 2018 and after). |
BBH PARTNER FUND – INTERNATIONAL EQUITY
NOTES TO FINANCIAL STATEMENTS (continued)
October 31, 2018
8. | Subsequent Events. Management has evaluated events and transactions that have occurred since October 31, 2018 through the date the financial statements were issued and determined that there were none that would require recognition or additional disclosure in the financial statements. |
financial statements october 31, 2018 | 29 |
BBH PARTNER FUND – INTERNATIONAL EQUITY
DISCLOSURE OF FUND EXPENSES
October 31, 2018 (unaudited)
BBH PARTNER FUND – INTERNATIONAL EQUITY
DISCLOSURE OF FUND EXPENSES (continued)
October 31, 2018 (unaudited)
| Beginning Account Value May 1, 2018 | Ending Account Value October 31, 2018 | Expenses Paid During Period May 1, 2018 to October 31, 20181 | ||||||||||||
Class I | ||||||||||||||
Actual | $ | 1,000 | $ | 932 | $ | 3.07 | ||||||||
Hypothetical2 | $ | 1,000 | $ | 1,022 | $ | 3.21 | ||||||||
| 1 | Expenses are equal to the Fund’s annualized expense ratio of 0.63% for I shares, multiplied by the average account value over the period, multiplied by 184/365 (to reflect the one-half year period). |
| 2 | Assumes a return of 5% before expenses. For the purposes of the calculation, the applicable annualized expenses ratio for each class of shares is subtracted from the assumed return before expenses. |
financial statements october 31, 2018 | 31 |
BBH PARTNER FUND – INTERNATIONAL EQUITY
CONFLICTS OF INTEREST
October 31, 2018 (unaudited)
BBH PARTNER FUND – INTERNATIONAL EQUITY
CONFLICTS OF INTEREST (continued)
October 31, 2018 (unaudited)
arise in connection with a portfolio manager’s management of the Fund’s investments, on the one hand, and the investments of other funds or accounts for which the portfolio manager is responsible, on the other. For example, it is possible that the various funds or accounts managed by the Investment Adviser or Sub-Adviser could have different investment strategies that, at times, might conflict with one another to the possible detriment of the Fund. From time to time, the Investment Adviser and Sub-Adviser, sponsor and is affiliated with other investment pools and accounts which engage in the same or similar businesses as the Fund using the same or similar investment strategies. To the extent that the same investment opportunities might be desirable for more than one account or fund, possible conflicts could arise in determining how to allocate them because the Investment Adviser or Sub-Adviser may have an incentive to allocate investment opportunities to certain accounts or funds. However, BBH and the Sub-adviser have implemented policies and procedures designed to ensure that information relevant to investment decisions is disseminated promptly within its portfolio management teams and investment opportunities are allocated equitably among different clients. The policies and procedures require, among other things, objective allocation for limited investment opportunities, and documentation and review of justifications for any decisions to make investments only for select accounts or in a manner disproportionate to the size of the account. Nevertheless, access to investment opportunities may be allocated differently among accounts due to the particular characteristics of an account, such as size of the account, cash position, tax status, risk tolerance and investment restrictions or for other reasons.
financial statements october 31, 2018 | 33 |
BBH PARTNER FUND – INTERNATIONAL EQUITY
CONFLICTS OF INTEREST (continued)
October 31, 2018 (unaudited)
decisions for different accounts are made separately, or if it is determined that aggregating is not practicable, or in cases involving client direction. Prevailing trading activity frequently may make impossible the receipt of the same price or execution on the entire volume of securities purchased or sold. When this occurs, the various prices may be averaged, and the Fund will be charged or credited with the average price. Thus, the effect of the aggregation may operate on some occasions to the disadvantage of the Fund. In addition, under certain circumstances, the Fund will not be charged the same commission or commission equivalent rates in connection with an aggregated order.
BBH PARTNER FUND – INTERNATIONAL EQUITY
CONFLICTS OF INTEREST (continued)
October 31, 2018 (unaudited)
basis, many of the same conflicts related to traditional soft dollars may exist. For example, the research effectively will be paid by client commissions that also will be used to pay for the execution, clearing, and settlement services provided by the broker-dealer and will not be paid by the Sub-Adviser.
financial statements october 31, 2018 | 35 |
BBH PARTNER FUND – INTERNATIONAL EQUITY
CONFLICTS OF INTEREST (continued)
October 31, 2018 (unaudited)
the Fund’s sale or redemption of its shares at net asset value, at a time when a holding or holdings are valued by BBH (pursuant to Board-adopted procedures) at fair value, may have the effect of diluting or increasing the economic interest of existing shareholders.
BBH PARTNER FUND – INTERNATIONAL EQUITY
ADDITIONAL FEDERAL TAX INFORMATION
October 31, 2018 (unaudited)
| Foreign Source Income | Foreign Taxes Paid | |
$27,048,504 | $2,348,952 |
financial statements october 31, 2018 | 37 |
TRUSTEES AND OFFICERS OF BBH PARTNER FUND – INTERNATIONAL EQUITY
(unaudited)
| Name and Birth Year | | Position(s) Held with the Trust | | Term of Office and Length of Time Served# | | Principal Occupation(s) During Past 5 Years | | Number of Portfolios in Fund Complex Overseen by Trusteeˆ | | Other Public Company or Investment Company Directorships held by Trustee During Past 5 Years |
Independent Trustees | ||||||||||
H. Whitney Wagner Birth Year: 1956 | Chairman of the Board and Trustee | Chairman Since 2014; Trustee Since 2007 and 2006-2007 with the Predecessor Trust | President, Clear Brook Advisors, a registered investment adviser. | 7 | None. | |||||
Andrew S. Frazier Birth Year: 1948 | Trustee | Since 2010 | Retired. | 7 | Director of Western World Insurance Group, Inc. | |||||
Mark M. Collins Birth Year: 1956 | Trustee | Since 2011 | Partner of Brown Investment Advisory Incorporated, a registered investment adviser. | 7 | Chairman of Dillon Trust Company. | |||||
John M. Tesoro Birth Year: 1952 | Trustee | Since 2014 | Retired. | 7 | Trustee, Bridge Builder Trust (8 Funds); Director of Teton Advisors, Inc. (a registered investment adviser). | |||||
TRUSTEES AND OFFICERS OF BBH PARTNER FUND – INTERNATIONAL EQUITY
(unaudited)
| Name, Address and Birth Year | | Position(s) Held with the Trust | | Term of Office and Length of Time Served# | | Principal Occupation(s) During Past 5 Years | | Number of Portfolios in Fund Complex Overseen by Trusteeˆ | | Other Public Company or Investment Company Directorships held by Trustee During Past 5 Years |
Interested Trustees | ||||||||||
Susan C. Livingston+ 50 Post Office Square Boston, MA 02110 Birth Year: 1957 | Trustee | Since 2011 | Partner (since 1998) and Senior Client Advocate (since 2010) for BBH&Co.; Director of BBH Luxembourg S.C.A. (since 1992). | 7 | None. | |||||
John A. Gehret+ 140 Broadway New York, NY 10005 Birth Year: 1959 | Trustee | Since 2011 | Limited Partner of BBH&Co. (2012-present); Director of BBH Luxembourg Funds (since 2012); Director of BBH Trust Company (Cayman) Ltd. (since 2012). | 7 | None. |
financial statements october 31, 2018 | 39 |
TRUSTEES AND OFFICERS OF BBH PARTNER FUND – INTERNATIONAL EQUITY
(unaudited)
| Name, Address and Birth Year | Position(s) Held with the Trust | | Term of Office and Length of Time Served# | | Principal Occupation(s) During Past 5 Years | |||||||
Officers | ||||||||||||
Jean-Pierre Paquin 140 Broadway New York, NY 10005 Birth Year: 1973 | President and Principal Executive Officer | Since 2016 | Partner of BBH&Co. since 2015; joined BBH&Co. in 1996. | |||||||||
Daniel Greifenkamp 140 Broadway New York, NY 10005 Birth Year: 1969 | Vice President | Since 2016 | Managing Director of BBH&Co. since 2014; joined BBH&Co. in 2011. | |||||||||
Charles H. Schreiber 140 Broadway New York, NY 10005 Birth Year: 1957 | Treasurer and Principal Financial Officer | Since 2007 2006-2007 with the Predecessor Trust | Senior Vice President of BBH&Co. since 2001; joined BBH&Co. in 1999. | |||||||||
Paul F. Gallagher 140 Broadway New York, NY 10005 Birth Year: 1959 | Chief Compliance Officer (“CCO”) | Since 2015 | Senior Vice President of BBH&Co. since September 2015; Executive Director, Counsel, Morgan Stanley Smith Barney LLC (2009-September 2015). | |||||||||
Keith M. Kelley 50 Post Office Square Boston, MA 02110 Birth Year: 1983 | Anti-Money Laundering Officer (“AMLO”) | Since 2016 | Vice President of BBH&Co. since February 2016; joined BBH&Co. in 2016; Director, Legal and Compliance, Morgan Stanley Smith Barney LLC (2014-February 2016); Compliance Manager, State Street Corporation (2013-2014). | |||||||||
Suzan M. Barron 50 Post Office Square Boston, MA 02110 Birth Year: 1964 | Secretary | Since 2009 | Senior Vice President and Senior Investor Services Counsel, BBH&Co. since 2005. | |||||||||
TRUSTEES AND OFFICERS OF BBH PARTNER FUND – INTERNATIONAL EQUITY
(unaudited)
| Name, Address and Birth Year | | Position(s) Held with the Trust | | Term of Office and Length of Time Served# | | Principal Occupation(s) During Past 5 Years | ||
Crystal Cheung 140 Broadway New York, NY 10005 Birth Year: 1974 | Assistant Treasurer | Since 2018 | Assistant Vice President of BBH&Co. since 2016; joined BBH&Co. in 2014; Financial Reporting Manager, BNY Mellon Corporation (2010-2014). | |||||
Brian J. Carroll 50 Post Office Square Boston, MA 02110 Birth Year: 1985 | Assistant Secretary | Since 2018 | Associate and Investor Services Assistant Counsel of BBH&Co. since 2017; joined BBH&Co. in 2014. |
# | All officers of the Trust hold office for one year and until their respective successors are chosen and qualified (subject to the ability of the Trustees to remove any officer in accordance with the Trust’s By-laws). Mr. Wagner previously served on the Board of Trustees of the Predecessor Trust. |
+ | Ms. Livingston and Mr. Gehret are “interested persons” of the Trust as defined in the 1940 Act because of their positions as Partner and Limited Partner of BBH&Co., respectively. |
ˆ | The Fund Complex consists of the Trust, which has seven series, and each is counted as one “Portfolio” for purposes of this table. |
financial statements october 31, 2018 | 41 |
Administrator Brown Brothers Harriman & Co. 140 Broadway New York, NY 10005 Distributor ALPS Distributors, Inc. 1290 Broadway, Suite 1100 Denver, CO 80203 Shareholder Servicing Agent Brown Brothers Harriman & Co. 140 Broadway New York, NY 10005 1-800-575-1265 | Investment Adviser Brown Brothers Harriman Mutual Fund Advisory Department 140 Broadway New York, NY 10005 | |||||
By telephone: | Call 1-800-575-1265 | |||||
By E-mail send your request to: | bbhfunds@bbh.com | |||||
On the internet: | www.bbhfunds.com | |||||
BBH LIMITED DURATION FUND
MANAGEMENT’S DISCUSSION OF FUND PERFORMANCE
October 31, 2018
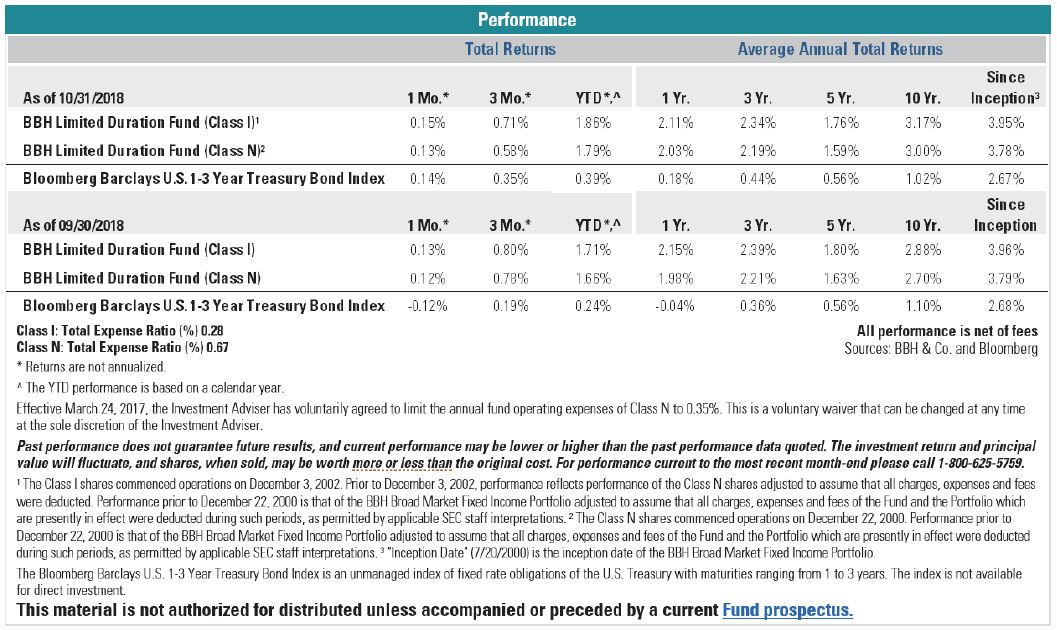 |
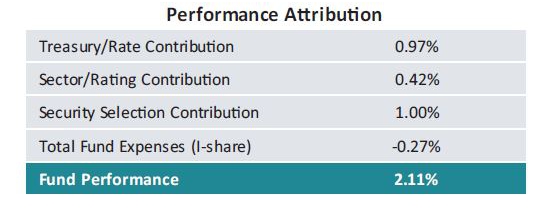
BBH LIMITED DURATION FUND
MANAGEMENT’S DISCUSSION OF FUND PERFORMANCE (continued)
October 31, 2018
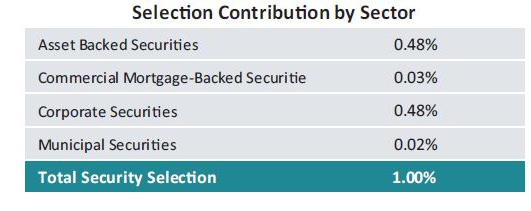
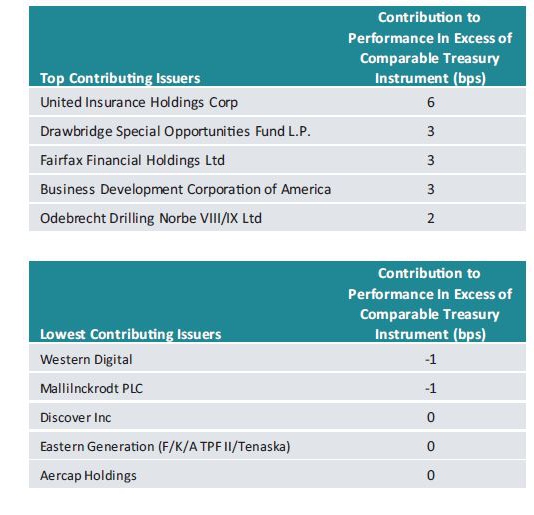
financial statements october 31, 2018 | 3 |
BBH LIMITED DURATION FUND
MANAGEMENT’S DISCUSSION OF FUND PERFORMANCE (continued)
October 31, 2018
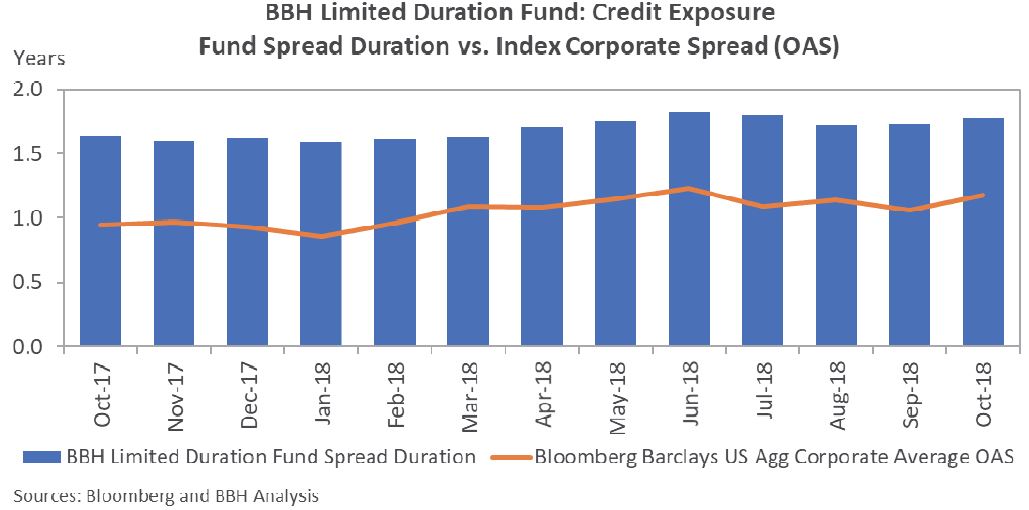
BBH LIMITED DURATION FUND
MANAGEMENT’S DISCUSSION OF FUND PERFORMANCE (continued)
October 31, 2018
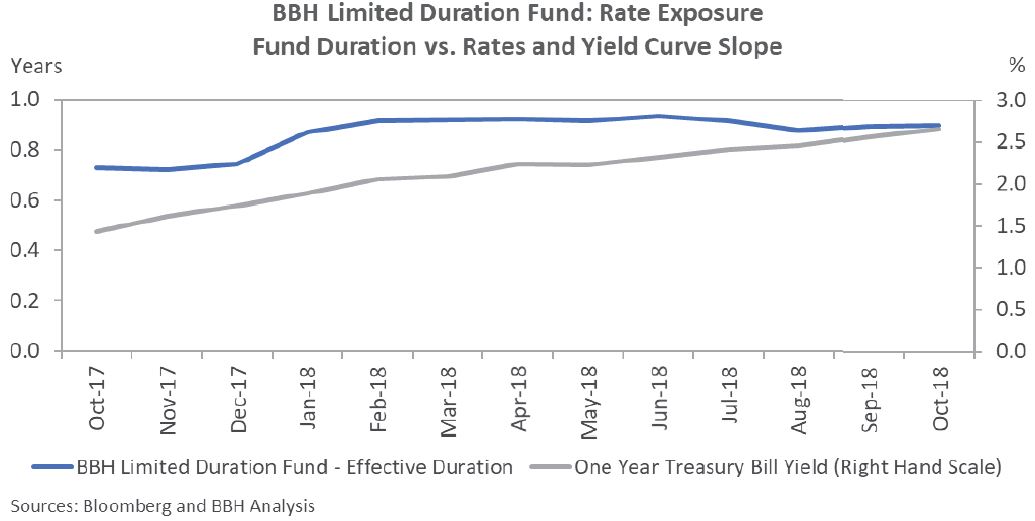
financial statements october 31, 2018 | 5 |
BBH LIMITED DURATION FUND
MANAGEMENT’S DISCUSSION OF FUND PERFORMANCE (continued)
October 31, 2018
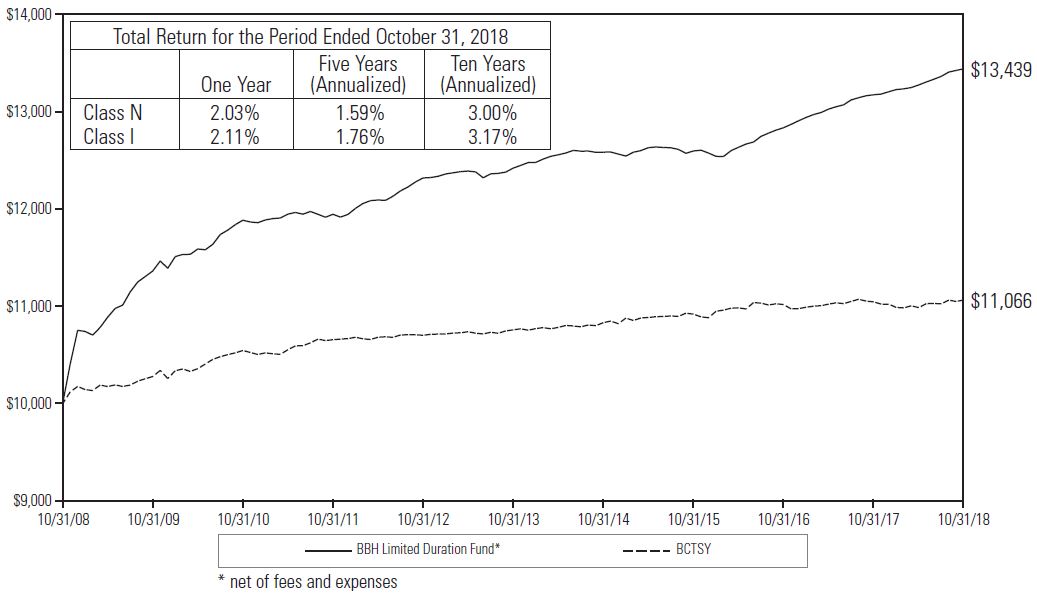 |
| 1 | The Fund’s performance assumes the reinvestment of all dividends and distributions. The Barclays Capital U.S. 1-3 Year Treasury Bond Index (“BCTSY”) has been adjusted to reflect reinvestment of dividends on securities in the index. The BCTSY is not adjusted to reflect sales charges, expenses or other fees that the Securities and Exchange Commission requires to be reflected in the Fund’s performance. The index is unmanaged. Investments cannot be made in the index. |
BBH LIMITED DURATION FUND
REPORT OF INDEPENDENT REGISTERED PUBLIC ACCOUNTING FIRM
|
December 21, 2018
financial statements october 31, 2018 | 7 |
BBH LIMITED DURATION FUND
PORTFOLIO ALLOCATION
October 31, 2018
| U.S. $ Value | Percent of Net Assets | |||||||||
Asset Backed Securities | $ | 2,871,290,416 | 45.8 | % | ||||||
Commercial Mortgage Backed Securities | 253,443,753 | 4.0 | ||||||||
Corporate Bonds | 1,754,169,649 | 27.9 | ||||||||
Loan Participations and Assignments | 763,233,826 | 12.2 | ||||||||
Municipal Bonds | 131,038,434 | 2.1 | ||||||||
U.S. Government Agency Obligations | 101,552,309 | 1.6 | ||||||||
U.S. Treasury Bills | 481,581,643 | 7.7 | ||||||||
Liabilities in Excess of Other Assets | (80,776,712 | ) | (1.3 | ) | ||||||
NET ASSETS | $ | 6,275,533,318 | 100.0 | % | ||||||
The accompanying notes are an integral part of these financial statements.
BBH LIMITED DURATION FUND
PORTFOLIO OF INVESTMENTS
October 31, 2018
| Principal Amount | Maturity Date | Interest Rate | Value | |||||||||||||||
ASSET BACKED SECURITIES (45.8%) | ||||||||||||||||||
| $ 19,896,895 | AIM Aviation Finance, Ltd. 2015-1A1 | 02/15/40 | 4.213 | % | $ | 19,839,444 | ||||||||||||
| 22,121,154 | Ally Auto Receivables Trust 2018-1 | 09/15/20 | 2.140 | 22,071,242 | ||||||||||||||
| 48,170,000 | American Express Credit Account Master Trust 2018-1 | 10/17/22 | 2.670 | 47,874,424 | ||||||||||||||
| 7,215,061 | AmeriCredit Automobile Receivables Trust 2017-2 | 09/18/20 | 1.650 | 7,199,408 | ||||||||||||||
| 24,970,621 | AmeriCredit Automobile Receivables Trust 2017-4 | 05/18/21 | 1.830 | 24,875,458 | ||||||||||||||
| 7,498,288 | ARI Fleet Lease Trust 2017-A1 | 04/15/26 | 1.910 | 7,444,817 | ||||||||||||||
| 6,918,727 | AXIS Equipment Finance Receivables IV LLC 2016-1A1 | 11/20/21 | 2.210 | 6,879,071 | ||||||||||||||
| 24,499,985 | AXIS Equipment Finance Receivables IV LLC 2018-1A1 | 12/20/23 | 3.240 | 24,345,496 | ||||||||||||||
| 20,580,000 | AXIS Equipment Finance Receivables VI LLC 2018-2A1 | 07/20/22 | 3.890 | 20,581,735 | ||||||||||||||
| 5,138,873 | BCC Funding XIII LLC 2016-11 | 12/20/21 | 2.200 | 5,119,117 | ||||||||||||||
| 30,200,028 | Business Jet Securities LLC 2018-11 | 02/15/33 | 4.335 | 30,096,222 | ||||||||||||||
| 48,857,949 | Business Jet Securities LLC 2018-21 | 06/15/33 | 4.447 | 48,821,085 | ||||||||||||||
| 4,834,644 | Canadian Pacer Auto Receivables Trust 2017-1A1 | 12/19/19 | 1.772 | 4,827,361 | ||||||||||||||
| 30,111,796 | Canadian Pacer Auto Receivables Trust 2018-1A1 | 08/19/20 | 2.700 | 30,078,390 | ||||||||||||||
| 39,695,185 | Capital Auto Receivables Asset Trust 2018-11 | 10/20/20 | 2.540 | 39,638,286 | ||||||||||||||
| 24,634,850 | Capital Automotive REIT LLC 2017-1A1 | 04/15/47 | 3.870 | 24,364,399 | ||||||||||||||
| 18,059,288 | CarMax Auto Owner Trust 2018-1 | 05/17/21 | 2.230 | 17,989,988 | ||||||||||||||
| 44,810,000 | CarMax Auto Owner Trust 2018-2 | 08/16/21 | 2.730 | 44,729,535 | ||||||||||||||
| 1,968,900 | Cazenovia Creek Funding I LLC 2015-1A1 | 12/10/23 | 2.000 | 1,964,593 | ||||||||||||||
| 55,969,365 | Cazenovia Creek Funding II LLC 2018-1A1 | 07/15/30 | 3.561 | 55,720,654 | ||||||||||||||
| 23,871,595 | CCG Receivables Trust 2017-11 | 11/14/23 | 1.840 | 23,668,646 | ||||||||||||||
| 12,090,000 | CCG Receivables Trust 2018-11 | 06/16/25 | 2.500 | 12,010,083 | ||||||||||||||
| 20,779,399 | Chesapeake Funding II LLC 2017-2A1 | 05/15/29 | 1.990 | 20,567,744 | ||||||||||||||
| 21,964,840 | Chesapeake Funding II LLC 2017-4A1 | 11/15/29 | 2.120 | 21,672,299 | ||||||||||||||
| 31,740,000 | Chesapeake Funding II LLC 2018-1A1 | 04/15/30 | 3.040 | 31,601,274 | ||||||||||||||
The accompanying notes are an integral part of these financial statements.
financial statements october 31, 2018 | 9 |
BBH LIMITED DURATION FUND
PORTFOLIO OF INVESTMENTS (continued)
October 31, 2018
| Principal Amount | Maturity Date | Interest Rate | Value | |||||||||||||||
ASSET BACKED SECURITIES (continued) | ||||||||||||||||||
| $ 20,649,840 | Chesterfield Financial Holdings LLC 2014-1A1 | 12/15/34 | 4.500 | % | $ | 20,587,783 | ||||||||||||
| 47,700,000 | Citibank Credit Card Issuance Trust 2017-A2 | 01/19/21 | 1.740 | 47,604,595 | ||||||||||||||
| 6,776,268 | Credit Acceptance Auto Loan Trust 2016-2A1 | 11/15/23 | 2.420 | 6,766,273 | ||||||||||||||
| 15,480,000 | Credit Acceptance Auto Loan Trust 2017-1A1 | 10/15/25 | 2.560 | 15,398,591 | ||||||||||||||
| 50,700,000 | Credit Acceptance Auto Loan Trust 2017-2A1 | 02/17/26 | 2.550 | 50,302,750 | ||||||||||||||
| 25,550,000 | Credit Acceptance Auto Loan Trust 2017-3A1 | 06/15/26 | 2.650 | 25,237,536 | ||||||||||||||
| 37,120,000 | Daimler Trucks Retail Trust 2018-11 | 07/15/21 | 2.850 | 37,021,970 | ||||||||||||||
| 22,900,000 | DLL LLC 2018-11 | 11/17/20 | 2.810 | 22,867,448 | ||||||||||||||
| 12,649,792 | DLL Securitization Trust 2017-A1 | 07/15/20 | 1.890 | 12,600,189 | ||||||||||||||
| 6,544,434 | Drive Auto Receivables Trust 2018-1 | 04/15/20 | 2.230 | 6,541,062 | ||||||||||||||
| 11,705,643 | Eagle I, Ltd. 2014-1A1 | 12/15/39 | 4.310 | 11,703,787 | ||||||||||||||
| 18,716,906 | ECAF I, Ltd. 2015-1A1 | 06/15/40 | 3.473 | 18,517,430 | ||||||||||||||
| 21,900,000 | Elm Trust 2016-1A1 | 06/20/25 | 4.163 | 21,696,052 | ||||||||||||||
| 23,340,000 | Elm Trust 2018-2A1 | 10/20/27 | 4.605 | 23,357,115 | ||||||||||||||
| 16,087,101 | Emerald Aviation Finance, Ltd. 2013-11 | 10/15/38 | 4.650 | 16,083,748 | ||||||||||||||
| 12,523,049 | Engs Commercial Finance Trust 2018-1A1 | 02/22/21 | 2.970 | 12,481,704 | ||||||||||||||
| 6,755,616 | Enterprise Fleet Financing LLC 2016-21 | 02/22/22 | 1.740 | 6,729,459 | ||||||||||||||
| 10,316,991 | Enterprise Fleet Financing LLC 2017-11 | 07/20/22 | 2.130 | 10,258,267 | ||||||||||||||
| 16,242,957 | Enterprise Fleet Financing LLC 2017-21 | 01/20/23 | 1.970 | 16,119,570 | ||||||||||||||
| 22,145,245 | Enterprise Fleet Financing LLC 2017-31 | 05/22/23 | 2.130 | 21,932,433 | ||||||||||||||
| 24,320,000 | Enterprise Fleet Financing LLC 2018-11 | 10/20/23 | 2.870 | 24,214,969 | ||||||||||||||
| 24,155,307 | Exeter Automobile Receivables Trust 2018-3A1 | 01/18/22 | 2.900 | 24,119,477 | ||||||||||||||
| 19,182,653 | Finance of America Structured Securities Trust 2017-HB11,2,3 | 11/25/27 | 2.321 | 19,123,379 | ||||||||||||||
| 29,817,609 | Finance of America Structured Securities Trust 2018-HB11,2,3 | 09/25/28 | 3.375 | 29,816,669 | ||||||||||||||
The accompanying notes are an integral part of these financial statements.
BBH LIMITED DURATION FUND
PORTFOLIO OF INVESTMENTS (continued)
October 31, 2018
| Principal Amount | Maturity Date | Interest Rate | Value | |||||||||||||||||||
ASSET BACKED SECURITIES (continued) | ||||||||||||||||||||||
| $ 14,500,000 | Ford Credit Auto Owner Trust 2014-21 | 04/15/26 | 2.310 | % | $ | 14,395,430 | ||||||||||||||||
| 44,320,000 | Ford Credit Floorplan Master Owner Trust A 2017-2 | 09/15/22 | 2.160 | 43,459,704 | ||||||||||||||||||
| 4,064,684 | Foursight Capital Automobile Receivables Trust 2015-11 | 01/15/21 | 2.340 | 4,053,075 | ||||||||||||||||||
| 9,059,874 | Foursight Capital Automobile Receivables Trust 2017-11 | 04/15/22 | 2.370 | 9,006,528 | ||||||||||||||||||
| 16,420,000 | Foursight Capital Automobile Receivables Trust 2018-21 | 04/15/22 | 3.320 | 16,419,655 | ||||||||||||||||||
| 21,607,525 | FREED ABS Trust 2018-11 | 07/18/24 | 3.610 | 21,576,724 | ||||||||||||||||||
| 11,220,000 | FREED ABS Trust 2018-21 | 10/20/25 | 3.990 | 11,215,703 | ||||||||||||||||||
| 1,569,411 | FRS I LLC 2013-1A1 | 04/15/43 | 1.800 | 1,562,483 | ||||||||||||||||||
| 3,604,943 | Global Container Assets, Ltd. 2015-1A1 | 02/05/30 | 2.100 | 3,595,173 | ||||||||||||||||||
| 19,700,000 | GM Financial Consumer Automobile Receivables Trust 2018-2 | 05/17/21 | 2.550 | 19,659,042 | ||||||||||||||||||
| 1,852,567 | GM Financial Consumer Automobile 2017-1A1 | 03/16/20 | 1.510 | 1,850,289 | ||||||||||||||||||
| 12,180,000 | GM Financial Consumer Automobile 2017-1A1 | 10/18/21 | 1.780 | 12,046,663 | ||||||||||||||||||
| 32,520,000 | GMF Floorplan Owner Revolving Trust 2017-21 | 07/15/22 | 2.130 | 31,877,867 | ||||||||||||||||||
| 11,280,000 | GreatAmerica Leasing Receivables Funding LLC 2018-11 | 05/15/20 | 2.350 | 11,243,218 | ||||||||||||||||||
| 24,690,000 | Hercules Capital Funding Trust 2018-1A1 | 11/22/27 | 4.605 | 24,736,294 | ||||||||||||||||||
| 20,683,633 | Hertz Fleet Lease Funding LP 2017-11 | 04/10/31 | 2.130 | 20,549,034 | ||||||||||||||||||
| 19,930,000 | Hertz Vehicle Financing LLC 2018-2A1 | 06/27/22 | 3.650 | 19,856,239 | ||||||||||||||||||
| 50,290,415 | Honda Auto Receivables Owner Trust 2018-1 | 06/15/20 | 2.360 | 50,178,997 | ||||||||||||||||||
| 32,160,000 | Hyundai Auto Receivables Trust 2018-A | 04/15/21 | 2.550 | 32,085,308 | ||||||||||||||||||
| 10,800,000 | John Deere Owner Trust 2018-A | 10/15/20 | 2.420 | 10,778,070 | ||||||||||||||||||
| 38,860,000 | Lendmark Funding Trust 2017-1A1 | 12/22/25 | 2.830 | 38,348,560 | ||||||||||||||||||
| 18,340,000 | Lendmark Funding Trust 2017-2A1 | 05/20/26 | 2.800 | 18,057,557 | ||||||||||||||||||
| 14,220,000 | Lendmark Funding Trust 2018-1A1 | 12/21/26 | 3.810 | 14,131,759 | ||||||||||||||||||
| 19,500,000 | Mariner Finance Issuance Trust 2017-AA1 | 02/20/29 | 3.620 | 19,476,243 | ||||||||||||||||||
The accompanying notes are an integral part of these financial statements.
financial statements october 31, 2018 | 11 |
BBH LIMITED DURATION FUND
PORTFOLIO OF INVESTMENTS (continued)
October 31, 2018
| Principal Amount | Maturity Date | Interest Rate | Value | |||||||||||||||
ASSET BACKED SECURITIES (continued) | ||||||||||||||||||
| $ 55,510,000 | Mariner Finance Issuance Trust 2017-BA1 | 12/20/29 | 2.920 | % | $ | 54,647,708 | ||||||||||||
| 712,765 | MCA Fund I Holding LLC2014-1 (3-Month USD-LIBOR + 2.000%)1,2 | 08/15/24 | 4.314 | 712,843 | ||||||||||||||
| 19,263,912 | MCA Fund II Holding LLC2017-1 (3-Month USD-LIBOR + 1.650%)1,2 | 08/15/28 | 3.964 | 19,263,719 | ||||||||||||||
| 4,473,554 | MMAF Equipment Finance LLC 2017-AA1 | 05/18/20 | 1.730 | 4,461,488 | ||||||||||||||
| 20,415,237 | MMAF Equipment Finance LLC 2017-B1 | 10/15/20 | 1.930 | 20,320,313 | ||||||||||||||
| 21,973,500 | Motor Plc. 2017-1A (1-Month USD-LIBOR + 0.530%)1,2 | 09/25/24 | 2.811 | 21,972,138 | ||||||||||||||
| 8,570,092 | Nationstar HECM Loan Trust 2017-2A1,2,3 | 09/25/27 | 2.038 | 8,508,499 | ||||||||||||||
| 22,187,362 | Nationstar HECM Loan Trust 2018-1A1,2,3 | 02/25/28 | 2.760 | 22,182,547 | ||||||||||||||
| 19,098,621 | Nationstar HECM Loan Trust 2018-2A1,2,3 | 07/25/28 | 3.188 | 19,053,739 | ||||||||||||||
| 5,496,172 | Navitas Equipment Receivables LLC 2016-11 | 06/15/21 | 2.200 | 5,481,916 | ||||||||||||||
| 10,768,541 | New Mexico Educational Assistance Foundation 2013-1 (1-Month USD-LIBOR + 0.700%)2 | 01/02/25 | 2.956 | 10,782,432 | ||||||||||||||
| 3,111,070 | Newtek Small Business Loan Trust 2010-1 (1-Month USD-LIBOR + 2.300%)1,2 | 02/25/41 | 4.581 | 3,124,812 | ||||||||||||||
| 13,301,057 | Newtek Small Business Loan Trust 2016-1A (1-Month USD-LIBOR + 3.000%)1,2 | 02/25/42 | 5.281 | 13,521,356 | ||||||||||||||
| 22,200,000 | NextGear Floorplan Master Owner Trust 2016-2A1 | 09/15/21 | 2.190 | 22,022,327 | ||||||||||||||
| 16,020,000 | NextGear Floorplan Master Owner Trust 2017-2A1 | 10/17/22 | 2.560 | 15,718,420 | ||||||||||||||
| 21,040,000 | NextGear Floorplan Master Owner Trust 2018-2A1 | 10/16/23 | 3.690 | 21,097,500 | ||||||||||||||
The accompanying notes are an integral part of these financial statements.
BBH LIMITED DURATION FUND
PORTFOLIO OF INVESTMENTS (continued)
October 31, 2018
| Principal Amount | Maturity Date | Interest Rate | Value | |||||||||||||||||||
ASSET BACKED SECURITIES (continued) | ||||||||||||||||||||||
| $ 37,691,525 | Nissan Auto Receivables Owner Trust 2018-A | 12/15/20 | 2.390 | % | $ | 37,595,947 | ||||||||||||||||
| 38,465,000 | OnDeck Asset Securitization Trust LLC 2018-1A1 | 04/18/22 | 3.500 | 38,298,654 | ||||||||||||||||||
| 26,190,000 | OneMain Financial Issuance Trust 2015-1A1 | 03/18/26 | 3.850 | 26,288,446 | ||||||||||||||||||
| 24,865,000 | Oportun Funding X LLC 2018-C1 | 10/08/24 | 4.100 | 24,834,709 | ||||||||||||||||||
| 4,084,256 | OSCAR US Funding Trust VI LLC 2017-1A1 | 05/11/20 | 2.300 | 4,079,494 | ||||||||||||||||||
| 17,529,627 | OSCAR US Funding Trust VII LLC 2017-2A1 | 11/10/20 | 2.130 | 17,451,199 | ||||||||||||||||||
| 23,398,584 | OSCAR US Funding Trust VIII LLC 2018-1A1 | 04/12/21 | 2.910 | 23,352,770 | ||||||||||||||||||
| 13,110,000 | OSCAR US Funding Trust IX LLC 2018-2A1 | 08/10/21 | 3.150 | 13,088,001 | ||||||||||||||||||
| 18,920,000 | OSCAR US Funding Trust IX LLC 2018-2A1 | 09/12/22 | 3.390 | 18,820,178 | ||||||||||||||||||
| 4,587,586 | Oxford Finance Funding LLC 2014-1A1 | 12/15/22 | 3.475 | 4,582,869 | ||||||||||||||||||
| 13,906,066 | Oxford Finance Funding LLC 2016-1A1 | 06/17/24 | 3.968 | 13,922,759 | ||||||||||||||||||
| 29,000,000 | PFS Financing Corp. 2017-AA (1-Month USD-LIBOR + 0.580%)1,2 | 03/15/21 | 2.860 | 29,035,566 | ||||||||||||||||||
| 26,450,000 | PFS Financing Corp. 2017-BA1 | 07/15/22 | 2.220 | 25,909,793 | ||||||||||||||||||
| 34,310,000 | PFS Financing Corp. 2017-D1 | 10/17/22 | 2.400 | 33,631,990 | ||||||||||||||||||
| 21,680,000 | PFS Financing Corp. 2018-B1 | 02/15/23 | 2.890 | 21,431,742 | ||||||||||||||||||
| 4,238,861 | ReadyCap Lending Small Business Loan Trust 2015-1 (1-Month USD-LIBOR + 1.250%)2 | 12/25/38 | 3.531 | 4,236,996 | ||||||||||||||||||
| 17,940,000 | Regional Management Issuance Trust 2018-11 | 07/15/27 | 3.830 | 17,852,155 | ||||||||||||||||||
| 9,897,963 | Santander Drive Auto Receivables Trust 2015-3 | 01/15/21 | �� | 2.740 | 9,895,833 | |||||||||||||||||
| 13,647,705 | Santander Drive Auto Receivables Trust 2018-1 | 11/16/20 | 2.100 | 13,628,546 | ||||||||||||||||||
| 8,885,000 | Santander Drive Auto Receivables Trust 2018-2 | 09/15/21 | 2.750 | 8,855,367 | ||||||||||||||||||
The accompanying notes are an integral part of these financial statements.
financial statements october 31, 2018 | 13 |
BBH LIMITED DURATION FUND
PORTFOLIO OF INVESTMENTS (continued)
October 31, 2018
| Principal Amount | Maturity Date | Interest Rate | Value | |||||||||||||||||||
ASSET BACKED SECURITIES (continued) | ||||||||||||||||||||||
| $ 20,120,000 | Securitized Term Auto Receivables Trust 2018-1A1 | 12/29/20 | 2.807 | % | $ | 20,086,589 | ||||||||||||||||
| 15,950,537 | Shenton Aircraft Investment I, Ltd. 2015-1A1 | 10/15/42 | 4.750 | 16,046,675 | ||||||||||||||||||
| 33,095,816 | Spirit Master Funding LLC 2014-4A1 | 01/20/45 | 3.501 | 33,009,128 | ||||||||||||||||||
| 41,369,840 | Spirit Master Funding LLC 2017-1A1 | 12/20/47 | 4.360 | 41,027,877 | ||||||||||||||||||
| 34,770,000 | SPS Servicer Advance Receivables Trust Advance Receivables Backed Notes 2016-T21 | 11/15/49 | 2.750 | 34,668,990 | ||||||||||||||||||
| 19,684,211 | STORE Master Funding LLC 2013-3A1 | 11/20/43 | 4.240 | 19,585,829 | ||||||||||||||||||
| 30,805,000 | SWC Funding LLC 2018-1A1,4 | 08/15/33 | 4.750 | 30,418,385 | ||||||||||||||||||
| 14,417,500 | TAL Advantage V LLC 2014-3A1 | 11/21/39 | 3.270 | 14,074,661 | ||||||||||||||||||
| 3,832,038 | Tax Ease Funding LLC 2016-1A1 | 06/15/28 | 3.131 | 3,818,798 | ||||||||||||||||||
| 23,926,928 | Textainer Marine Containers V, Ltd. 2017-1A1 | 05/20/42 | 3.720 | 23,536,904 | ||||||||||||||||||
| 32,734,400 | Textainer Marine Containers V, Ltd. 2017-2A1 | 06/20/42 | 3.520 | 31,813,640 | ||||||||||||||||||
| 6,537,713 | TLF National Tax Lien Trust 2017-1A1 | 12/15/29 | 3.090 | 6,502,700 | ||||||||||||||||||
| 61,740,000 | Trafigura Securitisation Finance, Plc. 2017-1A1 | 12/15/20 | 2.470 | 60,454,265 | ||||||||||||||||||
| 27,390,000 | Trafigura Securitisation Finance, Plc. 2018-1A1 | 03/15/22 | 3.730 | 27,366,280 | ||||||||||||||||||
| 49,712,527 | Triton Container Finance IV LLC 2017-2A1 | 08/20/42 | 3.620 | 48,460,592 | ||||||||||||||||||
| 4,850,035 | United Auto Credit Securitization Trust 2018-11 | 04/10/20 | 2.260 | 4,843,115 | ||||||||||||||||||
| 2,332,692 | Utah State Board of Regents 2011-1 (3-Month USD-LIBOR + 0.850%)2 | 05/01/29 | 3.193 | 2,345,965 | ||||||||||||||||||
| 7,232,482 | Veros Automobile Receivables Trust 2017-11 | 04/17/23 | 2.840 | 7,210,001 | ||||||||||||||||||
| 15,830,000 | Veros Automobile Receivables Trust 2018-11 | 05/15/23 | 3.630 | 15,805,462 | ||||||||||||||||||
| 30,243,558 | Westlake Automobile Receivables Trust 2018-1A1 | 12/15/20 | 2.240 | 30,140,346 | ||||||||||||||||||
The accompanying notes are an integral part of these financial statements.
BBH LIMITED DURATION FUND
PORTFOLIO OF INVESTMENTS (continued)
October 31, 2018
| Principal Amount | Maturity Date | Interest Rate | Value | |||||||||||||||
ASSET BACKED SECURITIES (continued) | ||||||||||||||||||
| $ 64,480,000 | World Financial Network Credit Card Master Trust 2017-A | 03/15/24 | 2.120 | % | $ | 63,336,292 | ||||||||||||
| 10,310,000 | World Financial Network Credit Card Master Trust 2017-B | 06/15/23 | 1.980 | 10,225,140 | ||||||||||||||
| 50,885,000 | World Financial Network Credit Card Master Trust 2018-A | 12/16/24 | 3.070 | 50,413,566 | ||||||||||||||
| 21,193,857 | World Omni Auto Receivables Trust 2018-A | 05/17/21 | 2.190 | 21,113,333 | ||||||||||||||
| 29,900,000 | World Omni Auto Receivables Trust 2018-B | 07/15/21 | 2.570 | 29,822,897 | ||||||||||||||
| 30,450,000 | WRG Debt Funding II LLC 2017-11,4 | 03/15/26 | 4.458 | 30,275,573 | ||||||||||||||
| Total Asset Backed Securities (Identified cost $2,889,603,619) | 2,871,290,416 | |||||||||||||||||
COMMERCIAL MORTGAGE BACKED SECURITIES (4.0%) | ||||||||||||||||||
| 15,540,000 | Aventura Mall Trust 2013-AVM1,2,3 | 12/05/32 | 3.867 | 15,686,064 | ||||||||||||||
| 26,807,000 | BB-UBS Trust 2012-TFT1,2,3 | 06/05/30 | 3.584 | 26,066,703 | ||||||||||||||
| 43,000,000 | BX Commercial Mortgage Trust 2018-IND (1-Month USD-LIBOR + 0.750%)1,2 | 11/15/35 | 3.030 | 42,978,070 | ||||||||||||||
| 30,910,000 | BXMT, Ltd. 2017-FL1 (1-Month USD-LIBOR + 0.870%)1,2 | 06/15/35 | 3.160 | 30,928,187 | ||||||||||||||
| 31,329,000 | CG-CCRE Commercial Mortgage Trust 2014-FL2 (1-Month USD-LIBOR + 2.900%)1,2 | 11/15/31 | 5.180 | 31,164,426 | ||||||||||||||
| 4,656,846 | Commercial Mortgage Pass Through Certificates 2013-GAM1 | 02/10/28 | 1.705 | 4,568,351 | ||||||||||||||
| 9,690,000 | Commercial Mortgage Pass Through Certificates 2013-GAM1,2,3 | 02/10/28 | 3.417 | 9,395,603 | ||||||||||||||
| 22,660,000 | Commercial Mortgage Pass Through Certificates 2014-TWC (1-Month USD-LIBOR + 0.850%)1,2 | 02/13/32 | 3.127 | 22,652,867 | ||||||||||||||
| 29,435,000 | Hospitality Mortgage Trust 2017-HIT (1-Month USD-LIBOR + 0.850%)1,2 | 05/08/30 | 3.131 | 29,435,194 | ||||||||||||||
The accompanying notes are an integral part of these financial statements.
financial statements october 31, 2018 | 15 |
BBH LIMITED DURATION FUND
PORTFOLIO OF INVESTMENTS (continued)
October 31, 2018
| Principal Amount | Maturity Date | Interest Rate | Value | |||||||||||||||||||
COMMERCIAL MORTGAGE BACKED SECURITIES (continued) | ||||||||||||||||||||||
| $ 32,615,000 | Morgan Stanley Capital I Trust 2017-CLS (1-Month USD-LIBOR + 0.700%)1,2 | 11/15/34 | 2.980 | % | $ | 32,594,713 | ||||||||||||||||
| 7,978,573 | WFCG Commercial Mortgage Trust 2015-BXRP (1-Month USD-LIBOR + 1.472%)1,2 | 11/15/29 | 3.751 | 7,973,575 | ||||||||||||||||||
| Total Commercial Mortgage Backed Securities (Identified cost $254,529,015) | 253,443,753 | |||||||||||||||||||||
CORPORATE BONDS (27.9%) | ||||||||||||||||||||||
AEROSPACE/DEFENSE (0.4%) | ||||||||||||||||||||||
| 24,988,000 | BAE Systems Holdings, Inc.1 | 06/01/19 | 6.375 | 25,437,011 | ||||||||||||||||||
AGRICULTURE (0.5%) | ||||||||||||||||||||||
| 30,710,000 | Bunge Ltd. Finance Corp. | 03/15/24 | 4.350 | 30,138,898 | ||||||||||||||||||
AUTO MANUFACTURERS (0.9%) | ||||||||||||||||||||||
| 27,950,000 | Ford Motor Credit Co. LLC | 01/08/19 | 2.943 | 27,943,229 | ||||||||||||||||||
| 28,550,000 | General Motors Financial Co., Inc. | 01/15/19 | 3.100 | 28,557,090 | ||||||||||||||||||
| 56,500,319 | ||||||||||||||||||||||
BANKS (10.4%) | ||||||||||||||||||||||
| 24,290,000 | ANZ New Zealand (Int’l), Ltd., London Branch1 | 02/01/19 | 2.250 | 24,245,599 | ||||||||||||||||||
| 25,580,000 | ANZ New Zealand (Int’l), Ltd., London Branch1 | 09/23/19 | 2.600 | 25,451,755 | ||||||||||||||||||
| 19,435,000 | ASB Bank, Ltd.1 | 06/14/23 | 3.750 | 19,208,944 | ||||||||||||||||||
| 32,360,000 | Bank of America Corp. | 06/01/19 | 7.625 | 33,204,166 | ||||||||||||||||||
| 4,975,000 | BNZ International Funding, Ltd., London Branch1 | 02/21/20 | 2.400 | 4,907,887 | ||||||||||||||||||
| 24,335,000 | BNZ International Funding, Ltd., London Branch1 | 03/02/21 | 2.750 | 23,826,559 | ||||||||||||||||||
| 14,660,000 | BNZ International Funding, Ltd., London Branch1 | 03/01/23 | 3.375 | 14,302,993 | ||||||||||||||||||
| 38,280,000 | Citizens Bank NA | 03/14/19 | 2.500 | 38,228,413 | ||||||||||||||||||
| 17,940,000 | Commonwealth Bank of Australia | 09/06/19 | 2.300 | 17,825,902 | ||||||||||||||||||
The accompanying notes are an integral part of these financial statements.
BBH LIMITED DURATION FUND
PORTFOLIO OF INVESTMENTS (continued)
October 31, 2018
| Principal Amount | Maturity Date | Interest Rate | Value | |||||||||||||||
CORPORATE BONDS (continued) | ||||||||||||||||||
BANKS (continued) | ||||||||||||||||||
| $ 26,250,000 | Commonwealth Bank of Australia1 | 10/15/19 | 5.000 | % | $ | 26,710,135 | ||||||||||||
| 2,627,000 | Fifth Third Bank | 03/15/19 | 2.300 | 2,622,559 | ||||||||||||||
| 20,035,000 | JPMorgan Chase Bank NA (3-Month USD-LIBOR + 0.350%)2 | 04/26/21 | 3.086 | 19,957,465 | ||||||||||||||
| 40,856,000 | KeyBank NA | 03/08/19 | 2.350 | 40,789,251 | ||||||||||||||
| 49,001,000 | Morgan Stanley | 01/24/19 | 2.500 | 48,969,449 | ||||||||||||||
| 11,920,000 | MUFG Americas Holdings Corp. | 02/10/20 | 2.250 | 11,820,481 | ||||||||||||||
| 32,252,000 | MUFG Bank, Ltd.1 | 03/10/19 | 2.300 | 32,179,309 | ||||||||||||||
| 13,760,000 | National Australia Bank, Ltd. | 09/20/21 | 3.375 | 13,660,212 | ||||||||||||||
| 38,712,000 | Royal Bank of Canada | 04/15/19 | 1.625 | 38,509,220 | ||||||||||||||
| 39,890,000 | Skandinaviska Enskilda Banken AB | 03/11/20 | 2.300 | 39,319,254 | ||||||||||||||
| 12,345,000 | Skandinaviska Enskilda Banken AB | 03/15/21 | 2.625 | 12,070,813 | ||||||||||||||
| 27,414,000 | Svenska Handelsbanken AB | 01/25/19 | 2.500 | 27,398,100 | ||||||||||||||
| 6,979,000 | Svenska Handelsbanken AB | 10/01/20 | 2.400 | 6,850,240 | ||||||||||||||
| 25,085,000 | Toronto-Dominion Bank | 04/07/21 | 2.125 | 24,377,505 | ||||||||||||||
| 39,945,000 | Wells Fargo Bank NA | 01/15/20 | 2.400 | 39,606,810 | ||||||||||||||
| 14,405,000 | Wells Fargo Bank NA | 01/15/21 | 2.600 | 14,128,419 | ||||||||||||||
| 7,395,000 | Wells Fargo Bank NA (3-Month USD-LIBOR + 0.490%)2 | 07/23/21 | 3.325 | 7,369,475 | ||||||||||||||
| 11,428,000 | Westpac Banking Corp. | 11/19/19 | 4.875 | 11,632,104 | ||||||||||||||
| 35,277,000 | Westpac Banking Corp. | 03/06/20 | 2.150 | 34,771,212 | ||||||||||||||
| 653,944,231 | ||||||||||||||||||
BEVERAGES (0.3%) | ||||||||||||||||||
| 19,020,000 | Anheuser-Busch InBev Finance, Inc. | 02/01/21 | 2.650 | 18,646,447 | ||||||||||||||
BIOTECHNOLOGY (0.8%) | ||||||||||||||||||
| 50,910,000 | Amgen, Inc. | 05/10/19 | 1.900 | 50,660,619 | ||||||||||||||
COMMERCIAL SERVICES (0.4%) | ||||||||||||||||||
| 27,350,000 | United Rentals North America, Inc. | 07/15/23 | 4.625 | 27,110,688 | ||||||||||||||
COMPUTERS (0.4%) | ||||||||||||||||||
| 6,790,000 | Dell International LLC / EMC Corp.1 | 06/15/21 | 4.420 | 6,846,333 | ||||||||||||||
| 17,250,000 | Dell International LLC / EMC Corp.1 | 06/15/23 | 5.450 | 17,878,959 | ||||||||||||||
| 24,725,292 | ||||||||||||||||||
The accompanying notes are an integral part of these financial statements.
financial statements october 31, 2018 | 17 |
BBH LIMITED DURATION FUND
PORTFOLIO OF INVESTMENTS (continued)
October 31, 2018
| Principal Amount | Maturity Date | Interest Rate | Value | |||||||||||||||
CORPORATE BONDS (continued) | ||||||||||||||||||
DIVERSIFIED FINANCIAL SERVICES (1.7%) | ||||||||||||||||||
| $ 1,174,756 | Ahold Lease Series 2001-A-1 Pass Through Trust | 01/02/20 | 7.820 | % | $ | 1,182,693 | ||||||||||||
| 20,500,000 | Air Lease Corp. | 01/15/19 | 3.375 | 20,505,197 | ||||||||||||||
| 3,750,000 | Alliance Data Systems Corp.1 | 11/01/21 | 5.875 | 3,814,875 | ||||||||||||||
| 8,790,000 | Alliance Data Systems Corp.1 | 08/01/22 | 5.375 | 8,822,962 | ||||||||||||||
| 21,335,000 | Credit Acceptance Corp. | 02/15/21 | 6.125 | 21,384,071 | ||||||||||||||
| 49,455,000 | Drawbridge Special Opportunities Fund1 | 08/01/21 | 5.000 | 49,458,495 | ||||||||||||||
| 105,168,293 | ||||||||||||||||||
ELECTRIC (2.9%) | ||||||||||||||||||
| 37,629,000 | Berkshire Hathaway Energy Co. | 11/15/18 | 2.000 | 37,620,307 | ||||||||||||||
| 17,618,000 | Dominion Energy, Inc. | 01/15/19 | 1.875 | 17,592,627 | ||||||||||||||
| 54,231,000 | Duke Energy Progress LLC | 01/15/19 | 5.300 | 54,555,363 | ||||||||||||||
| 30,395,000 | Electricite de France SA1 | 01/22/19 | 2.150 | 30,323,268 | ||||||||||||||
| 17,000,000 | Electricite de France SA1 | 10/13/20 | 2.350 | 16,675,383 | ||||||||||||||
| 8,080,000 | Mississippi Power Co. (3-Month USD-LIBOR + 0.650%)2 | 03/27/20 | 3.031 | 8,080,824 | ||||||||||||||
| 19,690,000 | Nevada Power Co. | 04/15/20 | 2.750 | 19,598,351 | ||||||||||||||
| 184,446,123 | ||||||||||||||||||
INSURANCE (2.8%) | ||||||||||||||||||
| 24,310,000 | Athene Global Funding1 | 01/25/22 | 4.000 | 24,394,102 | ||||||||||||||
| 12,290,000 | Enstar Group, Ltd. | 03/10/22 | 4.500 | 12,282,167 | ||||||||||||||
| 7,638,000 | Marsh & McLennan Cos., Inc. | 09/10/19 | 2.350 | 7,594,455 | ||||||||||||||
| 22,800,000 | New York Life Global Funding1 | 04/09/20 | 2.000 | 22,453,174 | ||||||||||||||
| 31,810,000 | Sirius International Group, Ltd.1 | 11/01/26 | 4.600 | 28,854,851 | ||||||||||||||
| 31,750,000 | United Insurance Holdings Corp. | 12/15/27 | 6.250 | 32,392,621 | ||||||||||||||
| 33,330,000 | Vitality Re V, Ltd. (Underlying Investment Yield + 1.750%)1,2 | 01/07/20 | 4.080 | 33,369,996 | ||||||||||||||
| 16,740,000 | Vitality Re VIII, Ltd. (Underlying Investment Yield + 1.750%)1,2 | 01/08/22 | 4.080 | 16,830,396 | ||||||||||||||
| 178,171,762 | ||||||||||||||||||
The accompanying notes are an integral part of these financial statements.
BBH LIMITED DURATION FUND
PORTFOLIO OF INVESTMENTS (continued)
October 31, 2018
| Principal Amount | Maturity Date | Interest Rate | Value | |||||||||||||||
CORPORATE BONDS (continued) | �� | |||||||||||||||||
INTERNET (0.2%) | ||||||||||||||||||
| $ 11,680,000 | Expedia Group, Inc. | 08/15/20 | 5.950 | % | $ | 12,128,306 | ||||||||||||
INVESTMENT COMPANIES (1.4%) | ||||||||||||||||||
| 6,800,000 | Ares Capital Corp. | 11/30/18 | 4.875 | 6,809,588 | ||||||||||||||
| 1,845,000 | Ares Capital Corp. | 01/19/22 | 3.625 | 1,807,126 | ||||||||||||||
| 35,855,000 | Business Development Corp. of America1 | 12/30/22 | 4.750 | 35,219,639 | ||||||||||||||
| 963,403 | Carlyle Investment Management LLC4 | 07/15/19 | 4.339 | 963,403 | ||||||||||||||
| 22,645,000 | FS Investment Corp. | 01/15/20 | 4.250 | 22,714,834 | ||||||||||||||
| 21,515,000 | PennantPark Investment Corp. | 10/01/19 | 4.500 | 21,600,250 | ||||||||||||||
| 89,114,840 | ||||||||||||||||||
MACHINERY—CONSTRUCTION & MINING (1.0%) | ||||||||||||||||||
| 10,397,000 | Caterpillar Financial Services Corp. | 05/18/19 | 1.350 | 10,307,170 | ||||||||||||||
| 17,525,000 | Caterpillar Financial Services Corp. | 01/10/20 | 2.100 | 17,328,362 | ||||||||||||||
| 35,330,000 | Caterpillar Financial Services Corp. | 03/15/21 | 2.900 | 34,955,673 | ||||||||||||||
| 62,591,205 | ||||||||||||||||||
MEDIA (0.1%) | ||||||||||||||||||
| 8,781,000 | TEGNA, Inc. | 10/15/19 | 5.125 | 8,759,048 | ||||||||||||||
PHARMACEUTICALS (0.8%) | ||||||||||||||||||
| 34,063,000 | AbbVie, Inc. | 05/14/20 | 2.500 | 33,618,130 | ||||||||||||||
| 14,000,000 | AbbVie, Inc. | 05/14/21 | 2.300 | 13,564,258 | ||||||||||||||
| 47,182,388 | ||||||||||||||||||
PIPELINES (1.2%) | ||||||||||||||||||
| 36,120,000 | Kinder Morgan Energy Partners LP | 02/01/19 | 2.650 | 36,050,730 | ||||||||||||||
| 22,261,000 | TransCanada PipeLines, Ltd. | 01/15/19 | 3.125 | 22,268,477 | ||||||||||||||
| 18,843,000 | TransCanada PipeLines, Ltd. | 01/15/19 | 7.125 | 18,987,656 | ||||||||||||||
| 77,306,863 | ||||||||||||||||||
REAL ESTATE (0.2%) | ||||||||||||||||||
| 11,490,000 | Prologis International Funding II SA1 | 02/15/20 | 4.875 | 11,632,187 | ||||||||||||||
RETAIL (0.6%) | ||||||||||||||||||
| 35,660,000 | Walmart, Inc. | 06/23/21 | 3.125 | 35,645,736 | ||||||||||||||
The accompanying notes are an integral part of these financial statements.
financial statements october 31, 2018 | 19 |
BBH LIMITED DURATION FUND
PORTFOLIO OF INVESTMENTS (continued)
October 31, 2018
| Principal Amount | Maturity Date | Interest Rate | Value | ||||||||||||||||
CORPORATE BONDS (continued) | |||||||||||||||||||
TELECOMMUNICATIONS (0.3%) | |||||||||||||||||||
| $ 21,147,750 | Sprint Spectrum Co. LLC / Sprint Spectrum Co. II LLC / Sprint Spectrum Co. III LLC1 | 03/20/23 | 3.360 | % | $ | 20,936,273 | |||||||||||||
TRANSPORTATION (0.3%) | |||||||||||||||||||
| 16,626,000 | Burlington Northern Santa Fe LLC | 10/01/19 | 4.700 | 16,871,970 | |||||||||||||||
TRUCKING & LEASING (0.3%) | |||||||||||||||||||
| 17,180,000 | Park Aerospace Holdings, Ltd.1 | 08/15/22 | 5.250 | 17,051,150 | |||||||||||||||
| Total Corporate Bonds (Identified cost $1,763,162,690) | 1,754,169,649 | ` | |||||||||||||||||
LOAN PARTICIPATIONS AND ASSIGNMENTS (12.2%) | |||||||||||||||||||
| 20,000,000 | American Tower Corporation (1-Month USD-LIBOR + 0.875%)2 | 03/29/19 | 3.125 | 20,000,000 | |||||||||||||||
| 11,434,098 | Analog Devices, Inc. (1-Month USD-LIBOR + 1.125%)2 | 09/23/19 | 3.365 | 11,434,098 | |||||||||||||||
| 3,826,381 | Analog Devices, Inc. (3-Month USD-LIBOR + 1.250%)2 | 09/23/21 | 3.530 | 3,816,815 | |||||||||||||||
| 9,568,711 | Aria Energy Operating LLC (1-Month USD-LIBOR + 4.500%)2 | 05/27/22 | 6.802 | 9,568,711 | |||||||||||||||
| 64,130,603 | AT&T, Inc. Term A (1-Month USD-LIBOR + 1.125%)2 | 12/14/20 | 3.405 | 64,010,678 | |||||||||||||||
| 18,785,655 | Avolon TLB Borrower 1 (US) LLC Term B3 (1-Month USD-LIBOR + 2.000%)2 | 01/15/25 | 4.280 | 18,726,105 | |||||||||||||||
| 4,987,500 | BCP Renaissance Parent LLC (3-Month USD-LIBOR + 3.500%)2 | 10/31/24 | 6.027 | 4,999,969 | |||||||||||||||
| 16,519,202 | Brixmor Operating Partnership LP (1-Month USD-LIBOR + 1.400%)2 | 03/18/19 | 3.713 | 16,519,202 | |||||||||||||||
| 34,936,000 | Charter Communications Operating LLC (CCO Safari LLC) Term B (1-Month USD-LIBOR + 2.000%)2 | 04/30/25 | 4.310 | 34,931,808 | |||||||||||||||
| 29,924,242 | Clean Harbors, Inc. (1-Month USD-LIBOR + 1.750%)2 | 06/30/24 | 4.052 | 29,952,371 | |||||||||||||||
The accompanying notes are an integral part of these financial statements.
BBH LIMITED DURATION FUND
PORTFOLIO OF INVESTMENTS (continued)
October 31, 2018
| Principal Amount | Maturity Date | Interest Rate | Value | |||||||||||||||
LOAN PARTICIPATIONS AND ASSIGNMENTS (continued) | ||||||||||||||||||
| $ 36,335,673 | Dell International LLC Term A2 (1-Month USD-LIBOR + 1.750%)2 | 09/07/21 | 4.060 | % | $ | 36,260,095 | ||||||||||||
| 24,998,333 | Dell International LLC Term B (1-Month USD-LIBOR + 2.000%)2 | 09/07/23 | 4.310 | 24,960,835 | ||||||||||||||
| 34,844,329 | Delos Finance S.a.r.l (3-Month USD-LIBOR + 1.750%)2 | 10/06/23 | 4.136 | 34,873,250 | ||||||||||||||
| 26,591,862 | Eastern Power LLC (TPF II LC LLC) (1-Month USD-LIBOR + 3.750%)2 | 10/02/23 | 6.052 | 26,521,127 | ||||||||||||||
| 35,000,000 | Elanco Animal Health, Inc. (3-Month USD-LIBOR + 1.250%)2 | 09/06/21 | 3.809 | 35,000,000 | ||||||||||||||
| 34,416,750 | Frontera Generation Holdings LLC (3-Month USD-LIBOR + 4.250%)2 | 05/02/25 | 6.524 | 34,502,792 | ||||||||||||||
| 7,882,353 | HCA, Inc. Term A5 (1-Month USD-LIBOR + 1.500%)2 | 06/10/20 | 3.802 | 7,892,206 | ||||||||||||||
| 13,042,459 | HCA, Inc. Term B11 (1-Month USD-LIBOR + 1.750%)2 | 03/17/23 | 4.052 | 13,084,325 | ||||||||||||||
| 13,306,650 | Kestrel Acquisition LLC Term B (1-Month USD-LIBOR + 4.250%)2 | 06/02/25 | 6.560 | 13,384,228 | ||||||||||||||
| 18,905,000 | Mallinckrodt International Finance SA (3-Month USD-LIBOR + 3.000%)2 | 02/24/25 | 5.517 | 18,760,188 | ||||||||||||||
| 9,640,298 | Mallinckrodt International Finance SA Term B (3-Month USD-LIBOR + 2.750%)2 | 09/24/24 | 5.136 | 9,506,201 | ||||||||||||||
| 38,888,889 | Marvell Technology Group, Ltd. Term A (1-Month USD-LIBOR + 1.375%)2 | 06/04/21 | 3.665 | 38,840,278 | ||||||||||||||
| 17,909,501 | RPI Finance Trust Term A4 (3-Month USD-LIBOR + 1.500%)2 | 05/04/22 | 3.886 | 17,898,397 | ||||||||||||||
| 46,912,332 | RPI Finance Trust Term B6 (3-Month USD-LIBOR + 2.000%)2 | 03/27/23 | 4.386 | 46,920,776 | ||||||||||||||
| 24,617,309 | Sprint Communications, Inc. (1-Month USD-LIBOR + 2.500%)2 | 02/02/24 | 4.813 | 24,594,168 | ||||||||||||||
| 12,614,251 | SS&C Technologies Holdings, Inc. Term B3 (1-Month USD-LIBOR + 2.250%)2 | 04/16/25 | 4.552 | 12,544,116 | ||||||||||||||
The accompanying notes are an integral part of these financial statements.
financial statements october 31, 2018 | 21 |
BBH LIMITED DURATION FUND
PORTFOLIO OF INVESTMENTS (continued)
October 31, 2018
| Principal Amount | Maturity Date | Interest Rate | Value | |||||||||||||||
LOAN PARTICIPATIONS AND ASSIGNMENTS (continued) | ||||||||||||||||||
| $ 3,635,128 | SS&C Technologies Holdings, Inc. Term B4 (1-Month USD-LIBOR + 2.250%)2 | 04/16/25 | 4.552 | % | $ | 3,614,916 | ||||||||||||
| 5,535,000 | SS&C Technologies Holdings, Inc. Term B5 (1-Month USD-LIBOR + 2.250%)2 | 04/16/25 | 4.552 | 5,501,402 | ||||||||||||||
| 21,255,017 | Terraform Power Operating LLC (1-Month USD-LIBOR + 2.000%)2 | 11/08/22 | 4.302 | 21,255,017 | ||||||||||||||
| 14,961,929 | Vistra Operations Co. LLC (Tex Operations Company LLC) (1-Month USD-LIBOR + 2.000%)2 | 08/04/23 | 4.302 | 14,920,335 | ||||||||||||||
| 32,898,123 | Western Digital Corp. Term B4 (1-Month USD-LIBOR + 1.750%)2 | 04/29/23 | 4.044 | 32,661,585 | ||||||||||||||
| 46,800,000 | Western Union Company (1-Month USD-LIBOR + 1.500%)2 | 04/09/21 | 3.790 | 46,800,000 | ||||||||||||||
| 29,008,000 | Wyndham Hotels & Resorts, Inc. Term B (1-Month USD-LIBOR + 1.750%)2 | 05/30/25 | 4.052 | 28,977,832 | ||||||||||||||
| Total Loan Participations and Assignments (Identified cost $764,239,254) | 763,233,826 | |||||||||||||||||
MUNICIPAL BONDS (2.1%) | ||||||||||||||||||
| 14,250,000 | Baylor Health Care System, Revenue Bonds2,3 | 11/15/25 | 3.256 | 14,245,583 | ||||||||||||||
| 14,525,000 | New Jersey Economic Development Authority, Revenue Bonds | 06/15/21 | 5.000 | 15,288,579 | ||||||||||||||
| 10,100,000 | New Jersey Turnpike Authority, Revenue Bonds (1-Month USD-LIBOR + 0.700%)2 | 01/01/24 | 2.279 | 10,113,736 | ||||||||||||||
| 85,500,000 | New Jersey Turnpike Authority, Revenue Bonds (1-Month USD-LIBOR + 0.700%)2 | 01/01/24 | 2.279 | 85,616,280 | ||||||||||||||
| 5,893,000 | Pennsylvania Industrial Development Authority, Revenue Bonds1 | 07/01/21 | 2.967 | 5,774,256 | ||||||||||||||
| Total Municipal Bonds (Identified cost $130,365,855) | 131,038,434 | |||||||||||||||||
The accompanying notes are an integral part of these financial statements.
BBH LIMITED DURATION FUND
PORTFOLIO OF INVESTMENTS (continued)
October 31, 2018
| Principal Amount | Maturity Date | Interest Rate | Value | |||||||||||||||
U.S. GOVERNMENT AGENCY OBLIGATIONS (1.6%) | ||||||||||||||||||
| $ 85,000,000 | Federal Home Loan Bank Discount Notes5 | 11/01/18 | 0.000 | % | $ | 85,000,000 | ||||||||||||
| 108,205 | Federal Home Loan Mortgage Corp. (FHLMC) Non Gold Guaranteed (1-Year USD-LIBOR + 1.791%)2 | 04/01/36 | 3.874 | 113,558 | ||||||||||||||
| 17,720 | Federal Home Loan Mortgage Corp. (FHLMC) Non Gold Guaranteed (6-Month USD-LIBOR + 1.740%)2 | 12/01/36 | 4.240 | 18,643 | ||||||||||||||
| 25,664 | Federal Home Loan Mortgage Corp. (FHLMC) Non Gold Guaranteed (1-Year USD-LIBOR + 1.745%)2 | 01/01/37 | 3.557 | 26,912 | ||||||||||||||
| 38,036 | Federal Home Loan Mortgage Corp. (FHLMC) Non Gold Guaranteed (1-Year USD-LIBOR + 1.884%)2 | 02/01/37 | 3.884 | 39,832 | ||||||||||||||
| 7,117,954 | Federal National Mortgage Association (FNMA) | 07/01/35 | 5.000 | 7,526,867 | ||||||||||||||
| 476,271 | Federal National Mortgage Association (FNMA) | 11/01/35 | 5.500 | 510,634 | ||||||||||||||
| 49,037 | Federal National Mortgage Association (FNMA) (1-Year USD-LIBOR + 1.954%)2 | 07/01/36 | 4.704 | 51,893 | ||||||||||||||
| 101,598 | Federal National Mortgage Association (FNMA) (1-Year USD-LIBOR + 1.714%)2 | 09/01/36 | 4.464 | 106,665 | ||||||||||||||
| 52,476 | Federal National Mortgage Association (FNMA) (1-Year USD-LIBOR + 1.820%)2 | 01/01/37 | 3.620 | 55,198 | ||||||||||||||
| 414,165 | Federal National Mortgage Association (FNMA) | 08/01/37 | 5.500 | 443,820 | ||||||||||||||
| 4,836,901 | Federal National Mortgage Association (FNMA) | 08/01/37 | 5.500 | 5,185,495 | ||||||||||||||
| 2,197,967 | Federal National Mortgage Association (FNMA) | 06/01/40 | 6.500 | 2,457,632 | ||||||||||||||
| 14,688 | Government National Mortgage Association (GNMA) (1-Year CMT Index + 1.500%)2 | 08/20/29 | 3.750 | 15,160 | ||||||||||||||
| Total U.S. Government Agency Obligations (Identified cost $101,437,606) | 101,552,309 | |||||||||||||||||
The accompanying notes are an integral part of these financial statements.
financial statements october 31, 2018 | 23 |
BBH LIMITED DURATION FUND
PORTFOLIO OF INVESTMENTS (continued)
October 31, 2018
| Principal Amount | Maturity Date | Interest Rate | Value | |||||||||||||||
U.S. TREASURY BILLS (7.7%) | ||||||||||||||||||
| $ 50,000,000 | U.S. Treasury Bill5 | 11/15/18 | 0.000% | $ | 49,960,139 | |||||||||||||
| 45,000,000 | U.S. Treasury Bill5 | 12/06/18 | 0.000 | 44,907,644 | ||||||||||||||
| 65,000,000 | U.S. Treasury Bill5,6 | 01/03/19 | 0.000 | 64,748,470 | ||||||||||||||
| 50,000,000 | U.S. Treasury Bill5 | 01/17/19 | 0.000 | 49,760,311 | ||||||||||||||
| 75,000,000 | �� | U.S. Treasury Bill5 | 02/07/19 | 0.000 | 74,532,458 | |||||||||||||
| 50,000,000 | U.S. Treasury Bill5 | 02/21/19 | 0.000 | 49,642,222 | ||||||||||||||
| 100,000,000 | U.S. Treasury Bill5 | 03/28/19 | 0.000 | 99,038,885 | ||||||||||||||
| 50,000,000 | U.S. Treasury Bill5 | 08/15/19 | 0.000 | 48,991,514 | ||||||||||||||
| Total U.S. Treasury Bills (Identified cost $481,681,220) | 481,581,643 | |||||||||||||||||
| TOTAL INVESTMENTS (Identified cost $6,385,019,259)7 | 101.3 | % | $ | 6,356,310,030 | ||||||||||||||
| LIABILITIES IN EXCESS OF OTHER ASSETS | (1.3 | )% | (80,776,712 | ) | ||||||||||||||
| NET ASSETS | 100.0 | % | $ | 6,275,533,318 | ||||||||||||||
| 1 | Security exempt from registration under Rule 144A of the Securities Act of 1933, as amended. These securities may be resold in transactions exempt from registration, normally to qualified institutional buyers. Total market value of Rule 144A securities owned at October 31, 2018 was $3,034,041,513 or 48.3% of net assets. Unless otherwise noted, these securities are not considered illiquid. |
| 2 | Variable rate instrument. Interest rates change on specific dates (such as coupon or interest payment date). The yield shown represents the October 31, 2018 coupon or interest rate. |
| 3 | This variable rate security is based on a predetermined schedule and the rate at period end also represents the reference rate at period end. |
| 4 | Security that used significant unobservable inputs to determine fair value. |
| 5 | Security issued with zero coupon. Income is recognized through accretion of discount. |
| 6 | All or a portion of this security is held at the broker as collateral for open futures contracts. |
| 7 | The aggregate cost for federal income tax purposes is $6,388,522,354, the aggregate gross unrealized appreciation is $5,316,714 and the aggregate gross unrealized depreciation is $34,032,737, resulting in net unrealized depreciation of $28,716,023. |
The accompanying notes are an integral part of these financial statements.
BBH LIMITED DURATION FUND
PORTFOLIO OF INVESTMENTS (continued)
October 31, 2018
| Description | Number of Contracts | Expiration Date | Notional Amount | Market Value | Unrealized Gain/(Loss) | |||||||||||||||||
Contracts to Sell: | ||||||||||||||||||||||
U.S. Treasury 2-Year Notes | 175 | December 2018 | $ | 36,976,953 | $ | 36,864,844 | $ | 112,109 | ||||||||||||||
U.S. Treasury 5-Year Notes | 2,214 | December 2018 | 251,187,318 | 248,815,548 | 2,371,770 | |||||||||||||||||
U.S. Treasury 10-Year Notes | 561 | December 2018 | 67,455,859 | 66,443,437 | 1,012,422 | |||||||||||||||||
| $ | 3,496,301 | |||||||||||||||||||||
The accompanying notes are an integral part of these financial statements.
financial statements october 31, 2018 | 25 |
BBH LIMITED DURATION FUND
PORTFOLIO OF INVESTMENTS (continued)
October 31, 2018
The accompanying notes are an integral part of these financial statements.
BBH LIMITED DURATION FUND
PORTFOLIO OF INVESTMENTS (continued)
October 31, 2018
| Investments, at value | Unadjusted Quoted Prices in Active Markets for Identical Investments (Level 1)* | Significant Other Observable Inputs (Level 2)* | Significant Unobservable Inputs (Level 3)* | Balance as of October 31, 2018 | ||||||||||||||
Asset Backed Securities | $ | — | $ | 2,810,596,458 | $ | 60,693,958 | $ | 2,871,290,416 | ||||||||||
Commercial Mortgage Backed Securities | — | 253,443,753 | — | 253,443,753 | ||||||||||||||
Corporate Bonds | — | 1,753,206,246 | 963,403 | 1,754,169,649 | ||||||||||||||
Loan Participations and Assignments | — | 763,233,826 | — | 763,233,826 | ||||||||||||||
Municipal Bonds | — | 131,038,434 | — | 131,038,434 | ||||||||||||||
U.S. Government Agency Obligations | — | 101,552,309 | — | 101,552,309 | ||||||||||||||
U.S. Treasury Bills | — | 481,581,643 | — | 481,581,643 | ||||||||||||||
Total Investments, at value | $ | — | $ | 6,294,652,669 | $ | 61,657,361 | $ | 6,356,310,030 | ||||||||||
Other Financial Instruments, at value | ||||||||||||||||||
Financial Futures Contracts | $ | 3,496,301 | $ | — | $ | — | $ | 3,496,301 | ||||||||||
Other Financial Instruments, at value | $ | 3,496,301 | $ | — | $ | — | $ | 3,496,301 | ||||||||||
* | The Fund’s policy is to disclose transfers between levels based on valuations at the end of the reporting period. During the period ended October 31, 2018, there were no transfers between Levels 1 and 2 or Levels 1 and 3. A security with a value of $30,275,573 was transferred from Level 2 to Level 3 due to a reduction in the availability of significant observable inputs to determine fair value. |
The accompanying notes are an integral part of these financial statements.
financial statements october 31, 2018 | 27 |
BBH LIMITED DURATION FUND
PORTFOLIO OF INVESTMENTS (continued)
October 31, 2018
| Asset Back Securities | Corporate Bonds | Total | ||||||||||||
Balance as of October 31, 2017 | $ | — | $ | 2,247,939 | $ | 2,247,939 | ||||||||
Purchases | 30,588,170 | — | 30,588,170 | |||||||||||
Sales / Paydowns | — | (1,284,536 | ) | (1,284,536 | ) | |||||||||
Realized gains (losses) | — | — | — | |||||||||||
Change in unrealized appreciation (depreciation) | (186,943 | ) | — | (186,943 | ) | |||||||||
Amortization | 17,158 | — | 17,158 | |||||||||||
Transfers from Level 3 | — | — | — | |||||||||||
Transfers to Level 3 | 30,275,573 | — | 30,275,573 | |||||||||||
Balance as of October 31, 2018 | $ | 60,693,958 | $ | 963,403 | $ | 61,657,361 | ||||||||
The accompanying notes are an integral part of these financial statements.
BBH LIMITED DURATION FUND
STATEMENT OF ASSETS AND LIABILITIES
October 31, 2018
ASSETS: | ||||||
Investments in securities, at value (Identified cost $6,385,019,259) | $ | 6,356,310,030 | ||||
Cash | 1,242,492 | |||||
Cash collateral for futures contracts | 2,797,272 | |||||
Receivables for: | ||||||
Interest | 22,016,758 | |||||
Shares sold | 19,200,443 | |||||
Investments sold | 11,170,032 | |||||
Futures variation margin on open contracts | 699,029 | |||||
Investment advisory and administrative fee waiver reimbursement | 10,334 | |||||
Other | 2,611,517 | |||||
Prepaid assets | 39,688 | |||||
Total Assets | 6,416,097,595 | |||||
LIABILITIES: | ||||||
Payables for: | ||||||
Investments purchased | 130,854,912 | |||||
Shares redeemed | 7,943,218 | |||||
Investment advisory and administrative fees | 1,354,815 | |||||
Custody and fund accounting fees | 144,602 | |||||
Periodic distributions | 109,897 | |||||
Professional fees | 89,091 | |||||
Shareholder servicing fees | 43,609 | |||||
Transfer agent fees | 3,521 | |||||
Board of Trustees’ fees | 287 | |||||
Accrued expenses and other liabilities | 20,325 | |||||
Total Liabilities | 140,564,277 | |||||
NET ASSETS | $ | 6,275,533,318 | ||||
Net Assets Consist of: | ||||||
Paid-in capital | $ | 6,343,563,804 | ||||
Accumulated deficit | (68,030,486 | ) | ||||
Net Assets | $ | 6,275,533,318 |
NET ASSET VALUE AND OFFERING PRICE PER SHARE | ||||||
CLASS N SHARES | ||||||
($275,461,442 ÷ 27,135,131 shares outstanding) | $10.15 | |||||
CLASS I SHARES | ||||||
($6,000,071,876 ÷ 591,312,712 shares outstanding) | $10.15 |
The accompanying notes are an integral part of these financial statements.
financial statements october 31, 2018 | 29 |
BBH LIMITED DURATION FUND
STATEMENT OF OPERATIONS
For the year ended October 31, 2018
NET INVESTMENT INCOME: | ||||||
Income: | ||||||
Interest income | $ | 177,762,719 | ||||
Other income | 1,170,941 | |||||
Total Income | 178,933,660 | |||||
Expenses: | ||||||
Investment advisory and administrative fees | 16,368,364 | |||||
Custody and fund accounting fees | 697,511 | |||||
Shareholder servicing fees | 326,643 | |||||
Professional fees | 100,472 | |||||
Board of Trustees’ fees | 52,715 | |||||
Transfer agent fees | 45,193 | |||||
Miscellaneous expenses | 285,736 | |||||
Total Expenses | 17,876,634 | |||||
Investment advisory and administrative fee waiver | (242,627 | ) | ||||
Expense offset arrangement | (223,362 | ) | ||||
Net Expenses | 17,410,645 | |||||
Net Investment Income | 161,523,015 | |||||
NET REALIZED AND UNREALIZED LOSS: | ||||||
Net realized loss on investments in securities | (9,524,499 | ) | ||||
Net realized gain on futures contracts | 16,113,283 | |||||
Net realized gain on investments in securities and futures contracts | 6,588,784 | |||||
Net change in unrealized appreciation/(depreciation) on investments in securities | (33,024,717 | ) | ||||
Net change in unrealized appreciation/(depreciation) on futures contracts | (1,861,590 | ) | ||||
Net change in unrealized appreciation/(depreciation) on investments in securities and futures contracts | (34,886,307 | ) | ||||
Net Realized and Unrealized Loss | (28,297,523 | ) | ||||
Net Increase in Net Assets Resulting from Operations | $ | 133,225,492 |
The accompanying notes are an integral part of these financial statements.
BBH LIMITED DURATION FUND
STATEMENTS OF CHANGES IN NET ASSETS
| For the years ended October 31, | |||||||||||
| 2018 | 2017 | ||||||||||
INCREASE IN NET ASSETS: | |||||||||||
Operations: | |||||||||||
Net investment income | $ | 161,523,015 | $ | 127,287,300 | |||||||
Net realized gain on investments in securities and futures contracts | 6,588,784 | 11,359,824 | |||||||||
Net change in unrealized appreciation/(depreciation) on investments in securities and futures contracts | (34,886,307 | ) | 20,117,102 | ||||||||
Net increase in net assets resulting from operations | 133,225,492 | 158,764,226 | |||||||||
Dividends and distributions declared: | |||||||||||
Class N | (4,285,493 | ) | (1,046,363 | )1 | |||||||
Class I | (156,716,668 | ) | (124,987,733 | )1 | |||||||
Total dividends and distributions declared | (161,002,161 | ) | (126,034,096 | ) | |||||||
Share transactions: | |||||||||||
Proceeds from sales of shares2 | 3,374,484,922 | 4,351,810,164 | |||||||||
Net asset value of shares issued to shareholders for reinvestment of dividends and distributions | 30,595,806 | 16,722,566 | |||||||||
Cost of shares redeemed2 | (3,520,060,947) | (2,762,241,924 | ) | ||||||||
Net increase (decrease) in net assets resulting from share transactions | (114,980,219 | ) | 1,606,290,806 | ||||||||
Total increase (decrease) in net assets | (142,756,888 | ) | 1,639,020,936 | ||||||||
NET ASSETS: | |||||||||||
Beginning of year | 6,418,290,206 | 4,779,269,270 | |||||||||
End of year | $ | 6,275,533,318 | $ | 6,418,290,206 | 3 | ||||||
| 1 | For the year ended October 31, 2017, dividends and distributions declared were only from net investment income for Class N and Class I. |
| 2 | Includes share exchanges. See Note 5 in Notes to Financial Statements. |
| 3 | Including undistributed net investment income of $1,712,065. |
The accompanying notes are an integral part of these financial statements.
financial statements october 31, 2018 | 31 |
BBH LIMITED DURATION FUND
FINANCIAL HIGHLIGHTS
Selected per share data and ratios for a Class N share outstanding throughout each year.
| For the years ended October 31, | |||||||||||||||||||||||
| 2018 | 2017 | 2016 | 2015 | 2014 | |||||||||||||||||||
Net asset value, beginning of year | $ | 10.19 | $ | 10.13 | $ | 10.14 | $ | 10.31 | $ | 10.35 | |||||||||||||
Income from investment operations: | |||||||||||||||||||||||
Net investment income1 | 0.26 | 0.21 | 0.19 | 0.18 | 0.14 | ||||||||||||||||||
Net realized and unrealized gain (loss) | (0.06 | ) | 0.05 | (0.00 | )2 | (0.17 | ) | (0.01 | ) | ||||||||||||||
Total income from investment operations | 0.20 | 0.26 | 0.19 | 0.01 | 0.13 | ||||||||||||||||||
Less dividends and distributions: | |||||||||||||||||||||||
From net investment income | (0.24 | ) | (0.20 | ) | (0.20 | ) | (0.18 | ) | (0.14 | ) | |||||||||||||
From net realized gains | — | — | — | — | (0.03 | ) | |||||||||||||||||
Total dividends and distributions | (0.24 | ) | (0.20 | ) | (0.20 | ) | (0.18 | ) | (0.17 | ) | |||||||||||||
Net asset value, end of year | $ | 10.15 | $ | 10.19 | $ | 10.13 | $ | 10.14 | $ | 10.31 | |||||||||||||
Total return | 2.03 | % | 2.64 | % | 1.90 | % | 0.10 | % | 1.32 | % | |||||||||||||
Ratios/Supplemental data: | |||||||||||||||||||||||
Net assets, end of year (in millions) | $ | 275 | $ | 72 | $ | 42 | $ | 2,557 | $ | 2,625 | |||||||||||||
Ratio of expenses to average net assets before reductions | 0.50 | % | 0.67 | % | 0.49 | % | 0.48 | % | 0.48 | % | |||||||||||||
Fee waiver | 0.15 | %3 | 0.27 | %3 | 0.01 | %3 | — | % | — | % | |||||||||||||
Expense offset arrangement | 0.00 | %4 | 0.00 | %4 | 0.00 | %4 | 0.00 | %4 | 0.00 | %4 | |||||||||||||
Ratio of expenses to average net assets after reductions | 0.35 | % | 0.40 | % | 0.48 | % | 0.48 | % | 0.48 | % | |||||||||||||
Ratio of net investment income to average net assets | 2.52 | % | 2.05 | % | 1.91 | % | 1.75 | % | 1.36 | % | |||||||||||||
Portfolio turnover rate | 48 | % | 52 | % | 53 | % | 46 | % | 35 | % | |||||||||||||
| 1 | Calculated using average shares outstanding for the year. |
| 2 | Less than $0.01. |
| 3 | The ratio of expenses to average net assets for the years ended October 31, 2018, 2017 and 2016, reflect fees reduced as result of voluntary operating expense limitation of the share class. Prior to March 24, 2017, the expense limitation of the share class was 0.48%. Following March 24, 2017, the expense limitation was changed to 0.35%. The agreement is effective for the periods beginning on December 29, 2015 and can be changed at any time at the sole discretion of the Investment Advisor. For the years ended October 31, 2018, 2017 and 2016, the waived fees were $242,627, $132,560 and $45,079, respectively. |
| 4 | Less than 0.01%. |
The accompanying notes are an integral part of these financial statements.
BBH LIMITED DURATION FUND
FINANCIAL HIGHLIGHTS (continued)
Selected per share data and ratios for a Class I share outstanding throughout each year.
| For the years ended October 31, | |||||||||||||||||||||||
| 2018 | 2017 | 2016 | 2015 | 2014 | |||||||||||||||||||
Net asset value, beginning of year | $ | 10.19 | $ | 10.13 | $ | 10.14 | $ | 10.31 | $ | 10.35 | |||||||||||||
Income from investment operations: | |||||||||||||||||||||||
Net investment income1 | 0.25 | 0.22 | 0.22 | 0.20 | 0.16 | ||||||||||||||||||
Net realized and unrealized gain (loss) | (0.04 | ) | 0.06 | (0.01 | ) | (0.17 | ) | (0.01 | ) | ||||||||||||||
Total income from investment operations | 0.21 | 0.28 | 0.21 | 0.03 | 0.15 | ||||||||||||||||||
Less dividends and distributions: | |||||||||||||||||||||||
From net investment income | (0.25 | ) | (0.22 | ) | (0.22 | ) | (0.20 | ) | (0.16 | ) | |||||||||||||
From net realized gains | — | — | — | — | (0.03 | ) | |||||||||||||||||
Total dividends and distributions | (0.25 | ) | (0.22 | ) | (0.22 | ) | (0.20 | ) | (0.19 | ) | |||||||||||||
Net asset value, end of year | $ | 10.15 | $ | 10.19 | $ | 10.13 | $ | 10.14 | $ | 10.31 | |||||||||||||
Total return | 2.11 | % | 2.77 | % | 2.13 | % | 0.30 | % | 1.52 | % | |||||||||||||
Ratios/Supplemental data: | |||||||||||||||||||||||
Net assets, end of year (in millions) | $ | 6,000 | $ | 6,346 | $ | 4,737 | $ | 2,153 | $ | 2,547 | |||||||||||||
Ratio of expenses to average net assets before reductions | 0.27 | % | 0.28 | % | 0.27 | % | 0.28 | % | 0.29 | % | |||||||||||||
Expense offset arrangement | 0.00 | %2 | 0.00 | %2 | 0.00 | %2 | 0.00 | %2 | 0.00 | %2 | |||||||||||||
Ratio of expenses to average net assets after reductions | 0.27 | % | 0.28 | % | 0.27 | % | 0.28 | % | 0.29 | % | |||||||||||||
Ratio of net investment income to average net assets | 2.47 | % | 2.17 | % | 2.21 | % | 1.94 | % | 1.56 | % | |||||||||||||
Portfolio turnover rate | 48 | % | 52 | % | 53 | % | 46 | % | 35 | % | |||||||||||||
| 1 | Calculated using average shares outstanding for the year. |
| 2 | Less than 0.01%. |
The accompanying notes are an integral part of these financial statements.
financial statements october 31, 2018 | 33 |
BBH LIMITED DURATION FUND
NOTES TO FINANCIAL STATEMENTS
October 31, 2018
1. | Organization. The Fund is a separate, diversified series of BBH Trust (the “Trust”), which is registered under the Investment Company Act of 1940, as amended (the “1940 Act”), as an open-end management investment company. The Trust was originally organized under the laws of the State of Maryland on July 16, 1990 as BBH Fund, Inc. and re-organized as a Delaware statutory trust on June 12, 2007. The Fund commenced operations on December 22, 2000. The Fund offers Class N and Class I shares. Class N and Class I shares have different operating expenses. With the exception of class specific expenses, all expenses are allocated between classes based on net assets. Neither Class N shares nor Class I shares automatically convert to any other share class of the Fund. As of October 31, 2018, there were seven series of the Trust. |
2. | Significant Accounting Policies. The Fund’s financial statements are prepared in accordance with Generally Accepted Accounting Principles in the United States of America (“GAAP”). The Fund is an investment company and accordingly follows the investment company accounting and reporting guidance of the Financial Accounting Standards Board (“FASB”) Accounting Standard Codification Topic 946 Financial Services — Investment Companies. The following summarizes significant accounting policies of the Fund: |
A. | Valuation of Investments. Bonds and other fixed income securities, including restricted securities (other than short-term obligations but including listed issues) are valued at their most recent bid prices (sales price if the principal market is an exchange) in the principal market in which such securities are normally traded, on the basis of valuations furnished by a pricing service, use of which has been approved by the Board of Trustees (the “Board”). In making such valuations, the pricing service utilizes both dealer supplied valuations and electronic data processing techniques, which take into account appropriate factors such as institutional-size trading in similar groups of securities, yield, quality, coupon rate, maturity, type of issue, trading characteristics and other market data, without exclusive reliance upon quoted prices, or exchange or over-the-counter prices, since such valuations are believed to reflect more accurately the fair value of such securities. Futures contracts held by the Fund are valued daily at the official settlement price of the exchange on which it is traded. |
BBH LIMITED DURATION FUND
NOTES TO FINANCIAL STATEMENTS (continued)
October 31, 2018
B. | Accounting for Investments and Income. Investment transactions are accounted for on the trade date. Realized gains and losses on investment transactions are determined based on the identified cost method. Interest income is accrued daily and consists of interest accrued, discount earned (including, if any, both original issue and market discount) and premium amortization on the investments of the Fund. Investment income is recorded net of any foreign taxes withheld where recovery of such tax is uncertain. Debt obligations may be placed on non-accrual status and related interest income may be reduced by ceasing current accruals and writing off interest receivable when the collection of all or a portion of the interest has become doubtful based on consistently applied procedures. A debt obligation is removed from non-accrual status when the issuer resumes interest payments or when collectability of interest is reasonably assured. |
C. | Fund Expenses. Most expenses of the Trust can be directly attributed to a specific fund. Expenses which cannot be directly attributed to a fund are apportioned amongst each fund in the Trust on a net assets basis. Expense estimates are accrued in the period to which they relate and adjustments are made when actual amounts are known. |
D. | Financial Futures Contracts. The Fund may enter into open futures contracts in order to economically hedge against anticipated future changes in interest rates which otherwise might either adversely affect the value of securities held for the Fund or adversely affect the prices of securities that are intended to be purchased at a later date for the Fund. The contractual amount of the futures contracts represents the investment the Fund has in a particular contract and does not necessarily represent the amounts potentially subject to risk of loss. Trading in futures contracts involves, to varying degrees, risk of loss in excess of any futures variation margin reflected in the Statement of Assets and Liabilities. The measurement of risk associated with futures contracts is meaningful only when all related and offsetting transactions are considered. Gains and losses are realized upon the expiration or closing of the futures contracts. |
financial statements october 31, 2018 | 35 |
BBH LIMITED DURATION FUND
NOTES TO FINANCIAL STATEMENTS (continued)
October 31, 2018
| Asset Derivatives | Liability Derivatives | |||||||||||||
| Risk | Statement of Assets and Liabilities Location | Fair Value | Statement of Assets and Liabilities Location | Fair Value | ||||||||||
Interest Rate Risk | Net unrealized appreciation/(depreciation) on investments in securities and futures contracts | $ | 3,496,301 | * | Net unrealized appreciation/(depreciation) on investments in securities and futures contracts | $ | — | |||||||
Total | $ | 3,496,301 | $ | — | ||||||||||
* | Includes cumulative appreciation/(depreciation) of futures contracts as reported in the Statement of Assets and Liabilities and Notes to Financial Statements. Only the current day’s variation margin is reported within the Statement of Assets and Liabilities. |
| Interest Rate Risk | ||||||
Net Realized Gain on Derivatives | ||||||
Futures Contracts | $ | 16,113,283 | ||||
Net Change in Unrealized Appreciation/(Depreciation) on Derivatives | ||||||
Futures Contracts | $ | (1,861,590 | ) | |||
E. | Rule 144A Securities. The Fund may purchase securities that are not registered under the Securities Act of 1933, as amended (“1933 Act”) but that can be sold to “qualified institutional buyers” in accordance with the requirements stated in Rule 144A under the 1933 Act (“Rule 144A Securities”). A Rule 144A Security may be considered illiquid and therefore, under SEC Regulations for open-end investment companies, subject to the 15% limitation on the purchase of illiquid securities, unless it is determined on an ongoing basis that an adequate trading market exists for the security, which is the case for the Fund. Guidelines have been adopted and the daily function of determining and monitoring liquidity of Rule 144A Securities has been delegated to the investment adviser. All relevant factors will be considered in determining the liquidity of Rule 144A Securities and all investments in Rule 144A Securities will be carefully monitored. Information regarding Rule 144A Securities is included at the end of the Portfolio of Investments. |
BBH LIMITED DURATION FUND
NOTES TO FINANCIAL STATEMENTS (continued)
October 31, 2018
F. | Loan Participations and Assignments. The Fund may invest in loan participations and assignments, which include institutionally traded floating and fixed-rate debt securities generally acquired as an assignment from another holder of, or participation interest in, loans originated by a bank or financial institution (the “Lender”) that acts as agent for all holders. Some loan participations and assignments may be purchased on a “when-issued” basis. The agent administers the terms of the loan, as specified in the loan agreement. When investing in a loan participation, the Fund has the right to receive payments of principal, interest and any fees to which it is entitled only from the Lender selling the loan agreement and only upon receipt by the Lender of payments from the borrower. The Fund generally has no right to enforce compliance with the terms of the loan agreement with the borrower. |
G. | Federal Income Taxes. It is the Trust’s policy to comply with the requirements of the Internal Revenue Code (the “Code”) applicable to regulated investment companies and to distribute substantially all of its taxable income to its shareholders. Accordingly, no federal income tax provision is required. The Fund files a tax return annually using tax accounting methods required under provisions of the Code, which may differ from GAAP, which is the basis on which these financial statements are prepared. Accordingly, the amount of net investment income and net realized gain reported in these financial statements may differ from that reported on the Fund’s tax return, due to certain book-to-tax timing differences such as losses deferred due to “wash sale” transactions and utilization of capital loss carryforwards. These differences may result in temporary over-distributions for financial statement purposes and are classified as distributions in excess of accumulated net realized gains or net investment income. These distributions do not constitute a return of capital. Permanent differences are reclassified between paid-in capital and retained earnings/(accumulated deficit) within the Statement of Assets and Liabilities based upon their tax classification. As such, the character of distributions to shareholders reported in the Financial Highlights table may differ from that reported to shareholders on Form 1099-DIV. |
financial statements october 31, 2018 | 37 |
BBH LIMITED DURATION FUND
NOTES TO FINANCIAL STATEMENTS (continued)
October 31, 2018
H. | Dividends and Distributions to Shareholders. Dividends and distributions from net investment income to shareholders, if any, are paid monthly and are recorded on the ex-dividend date. Distributions from net capital gains, if any, are generally declared and paid annually and are recorded on the ex-dividend date. The Fund declared dividends in the amount of $4,285,493 and $156,716,668 to Class N and Class I shareholders, respectively, during the year ended October 31, 2018. |
| Distributions paid from: | ||||||||||||||||||||||||
| Ordinary income | Net long-term capital gain | Total taxable distributions | Tax return of capital | Total distributions paid | ||||||||||||||||||||
2018: | $ | 161,002,161 | $ | — | $ | 161,002,161 | $ | — | $ | 161,002,161 | ||||||||||||||
2017: | 126,034,096 | — | 126,034,096 | — | 126,034,096 | |||||||||||||||||||
| Components of retained earnings/(accumulated deficit): | ||||||||||||||||||||||||||||||||
| Undistributed ordinary income | Undistributed long-term capital gain | Retained earnings/ (accumulated deficit) | Accumulated capital and other losses | Other book/tax temporary differences | Book unrealized appreciation/ (depreciation) | Total retained earnings/ (accumulated deficit) | ||||||||||||||||||||||||||
2018: | $ | 2,429,200 | $ | — | $ | 2,429,200 | $ | (41,743,663 | ) | $ | (3,503,095 | ) | $ | (25,212,928 | ) | $ | (68,030,486 | ) | ||||||||||||||
2017: | 1,712,065 | — | 1,712,065 | (45,774,424 | ) | (5,864,837 | ) | 9,673,379 | (40,253,817 | ) | ||||||||||||||||||||||
BBH LIMITED DURATION FUND
NOTES TO FINANCIAL STATEMENTS (continued)
October 31, 2018
I. | Use of Estimates. The preparation of the financial statements in accordance with GAAP requires management to make estimates and assumptions that affect the reported amounts of assets and liabilities in the financial statements, disclosure of contingent assets and liabilities at the date of the financial statements and the reported amounts of increase and decrease in net assets from operations during the reporting period. Actual results could differ from these estimates. |
3. | Fees and Other Transactions with Affiliates. |
A. | Investment Advisory and Administrative Fees. Under a combined Investment Advisory and Administrative Services Agreement (“Agreement”) with the Trust, Brown Brothers Harriman & Co. (“BBH”) through a separately identifiable department (“SID” or “Investment Adviser”) provides investment advisory, portfolio and management administrative services to the Fund. The Fund pays a combined fee for investment advisory and administrative services calculated daily and paid monthly at an annual rate equivalent to 0.30% per annum on the first $1 billion of the Fund’s average daily net assets and 0.25% per annum on the Fund’s average daily net assets over $1 billion. For the year ended October 31, 2018, the Fund incurred $16,368,364 for services under the Agreement. |
B. | Investment Advisory and Administrative Fee Waivers. Effective March 24, 2017 the Investment Adviser has voluntarily agreed to waive fees and/or reimburse expenses for the Fund’s Class N shares in order to limit total annual fund operating expenses (excluding interest, taxes, brokerage |
financial statements october 31, 2018 | 39 |
BBH LIMITED DURATION FUND
NOTES TO FINANCIAL STATEMENTS (continued)
October 31, 2018
| commissions, other expenditures that are capitalized in accordance with GAAP, other extraordinary expenses not incurred in the ordinary course of the Fund’s business) of Class N to 0.35%. Effective December 29, 2015 and prior to March 24, 2017 the Investment Adviser had voluntarily agreed to limit the annual fund operating expenses of Class N to 0.48%. This is a voluntary waiver that can be changed at any time at the sole discretion of the Investment Adviser. For the year ended October 31, 2018, the Investment Adviser waived fees in the amount of $242,627 for Class N. |
C. | Shareholder Servicing Fees. The Trust has a shareholder servicing agreement with BBH. BBH receives a fee from the Fund calculated daily and paid monthly at an annual rate of 0.20% of Class N shares’ average daily net assets. For the year ended October 31, 2018, Class N shares of the Fund incurred $326,643 in shareholder servicing fees. |
D. | Custody and Fund Accounting Fees. BBH acts as a custodian and fund accountant and receives custody and fund accounting fees from the Fund calculated daily and incurred monthly. BBH holds all of the Fund’s cash and investments and calculates the Fund’s daily net asset value. The custody fee is an asset and transaction-based fee. The fund accounting fee is an asset-based fee calculated at 0.004% of the Fund’s net asset value. For the year ended October 31, 2018, the Fund incurred $697,511 in custody and fund accounting fees. These fees for the Fund were reduced by $223,362 as a result of an expense offset arrangement with the Fund’s custodian. The credit amount (if any) is disclosed in the Statement of Operations as a reduction to the Fund’s expenses. In the event that the Fund is overdrawn, under the custody agreement with BBH, BBH will make overnight loans to the Fund to cover overdrafts. Pursuant to their agreement, the Fund will pay the Federal Funds overnight investment rate on the day of the overdraft. The total interest incurred by the Fund for the year ended October 31, 2018, was $6,918. This amount is included under line item “Custody and fund accounting fees” in the Statement of Operations. |
E. | Board of Trustees’ Fees. Each Trustee who is not an “interested person” as defined under the 1940 Act receives an annual fee as well as reimbursement for reasonable out-of-pocket expenses from the Fund. For the year ended October 31, 2018, the Fund incurred $52,715 in independent Trustee compensation and reimbursements. |
F. | Officers of the Trust. Certain officers of the Trust are also employees of BBH. Such officers are paid no fees by the Trust for their services to the Trust. |
4. | Investment Transactions. For the year ended October 31, 2018, the cost of purchases and the proceeds of sales of investment securities, other than short-term investments, were $3,239,013,819 and $2,490,585,831, respectively. |
BBH LIMITED DURATION FUND
NOTES TO FINANCIAL STATEMENTS (continued)
October 31, 2018
5. | Shares of Beneficial Interest. The Trust is permitted to issue an unlimited number of Class N shares and Class I shares of beneficial interest, at no par value. Transactions in Class N and Class I shares were as follows: |
| For the year ended October 31, 2018 | For the year ended October 31, 2017 | ||||||||||||||||||
| Shares | Dollars | Shares | Dollars | ||||||||||||||||
Class N | |||||||||||||||||||
Shares sold | 30,946,210 | $ | 314,812,228 | 4,739,548 | $ | 48,279,174 | |||||||||||||
Shares issued in connection with reinvestments of dividends | 387,697 | 3,939,411 | 73,191 | 744,949 | |||||||||||||||
Shares redeemed | (11,280,338 | ) | (114,748,174 | ) | (1,925,295 | ) | (19,575,111 | ) | |||||||||||
Net increase | 20,053,569 | $ | 204,003,465 | 2,887,444 | $ | 29,449,012 | |||||||||||||
Class I | |||||||||||||||||||
Shares sold | 300,746,654 | $ | 3,059,672,694 | 423,523,826 | $ | 4,303,530,990 | |||||||||||||
Shares issued in connection with reinvestments of dividends | 2,624,173 | 26,656,395 | 1,571,105 | 15,977,617 | |||||||||||||||
Shares redeemed | (334,891,134 | ) | (3,405,312,773 | ) | (269,859,797 | ) | (2,742,666,813 | ) | |||||||||||
Net increase/(decrease) | (31,520,307 | ) | $ | (318,983,684 | ) | 155,235,134 | $ | 1,576,841,794 | |||||||||||
6. | Principal Risk Factors and Indemnifications. |
A. | Principal Risk Factors. Investing in the Fund may involve certain risks, as discussed in the Fund’s prospectus, including but not limited to, those described below: |
financial statements october 31, 2018 | 41 |
BBH LIMITED DURATION FUND
NOTES TO FINANCIAL STATEMENTS (continued)
October 31, 2018
securities and enters into transactions where risks exist due to failure of a counterparty to a transaction to perform (credit risk), changes in interest rates (interest rate risk), higher volatility for securities with longer maturities (maturity risk), financial performance or leverage of the issuer (issuer risk), difficulty in being able to purchase or sell a security (liquidity risk), or certain risks associated with investing in foreign securities not present in domestic investments, including, but not limited to, recovery of tax withheld by foreign jurisdictions (foreign investment risk). The Fund’s use of derivatives creates risks that are different from, or possibly greater than, the risks associated with investing directly in securities as the Fund could lose more than the principal amount invested (derivatives risk). The Fund invests in asset-backed and mortgage-backed securities (mortgage-backed securities risk) which are subject to the risk that borrowers may default on the obligations that underlie these securities. In addition, these securities may be paid off sooner (prepayment risk) or later than expected which may increase the volatility of securities during periods of fluctuating interest rates. The Fund may invest in bonds issued by foreign governments which may be unable or unwilling to make interest payments and/or repay the principal owed (sovereign debt risk). The Fund’s use of borrowing, in reverse repurchase agreements and investment in some derivatives, involves leverage. Leverage tends to exaggerate the effect of any increase or decrease in the value of the Fund’s securities and may cause the Fund to be more volatile (leverage risk). The value of securities held by the Fund may decline in response to certain events, including: those directly involving the companies or issuers whose securities are held by the Fund; conditions affecting the general economy; overall market changes; local, regional or political, social or economic instability; and currency and interest rate and price fluctuations (market risk). The Fund’s shareholders may be adversely impacted by asset allocation decisions made by an investment adviser whose discretionary clients make up a large percentage of the Fund’s shareholders (shareholder concentration risk). While the U.S. Government has historically provided financial support to U.S. government-sponsored agencies or instrumentalities during times of financial stress, such as the various actions taken to stabilize the Federal National Mortgage Association and Federal Home Loan Mortgage Corporation during the credit crisis of 2008, no assurance can be given that it will do so in the future. Such securities are neither issued nor guaranteed by the U.S. Treasury (U.S. Government Agency Securities Risk). The extent of the Fund’s exposure to these risks in respect to these financial assets is included in their value as recorded in the Fund’s Statement of Assets and Liabilities.
B. | Indemnifications. Under the Trust’s organizational documents, its officers and Trustees may be indemnified against certain liabilities and expenses arising out of the performance of their duties to the Fund, and shareholders are indemnified against personal liability for the obligations of the Trust. Additionally, in the normal course of business, the Fund enters into agreements with service providers that may contain indemnification clauses. The Fund’s maximum exposure under these |
BBH LIMITED DURATION FUND
NOTES TO FINANCIAL STATEMENTS (continued)
October 31, 2018
| arrangements is unknown as this would involve future claims that may be made against the Fund that have not yet occurred. The risk of material loss from such claims is considered remote. |
7. | Recent Pronouncements. |
A. | ASU 2017-08. In March 2017, the Financial Accounting Standards Board issued an Accounting Standards Update, ASU 2017-08, Receivables — Nonrefundable Fees and Other Costs (Subtopic 310-20), Premium Amortization on Purchased Callable Debt Securities (the “ASU 2017-08”) which amends the amortization period for certain purchased callable debt securities held at a premium, shortening such period to the earliest call date. The ASU 2017-08 does not require any accounting change for debt securities held at a discount; the discount continues to be amortized to maturity. The ASU 2017-08 is effective for years, and interim periods within those years, beginning after December 15, 2018. Management is currently evaluating the application of ASU 2017-08 and its impact, if any, on the Fund’s financial statements. |
B. | ASU 2018-13. On August 28, 2018, the Financial Accounting Standards Board issued an Accounting Standards Update, ASU 2018-13, Fair Value Measurement (Topic 820): Disclosure Framework — Changes to the Disclosure Requirements for Fair Value Measurement (the “ASU 2018-13”). ASU 2018-13 modifies the disclosure objective paragraphs of Accounting Standards Codification 820 to eliminate (1) “at a minimum” from the phrase “an entity shall disclose at a minimum” and (2) other similar “open ended” disclosure requirements to promote the appropriate exercise of discretion by entities. ASU 2018-13 also eliminates and modifies other requirements under ASU 2018-13. ASU 2018-13 is effective for all entities for fiscal years, and interim periods within those fiscal years, beginning after December 15, 2019. Early application is permitted and Management is currently evaluating the application of ASU 2018-13 and its impact, if any, on the Fund’s financial statements. |
C. | Regulation S-X. In October 2018, the U.S. Securities and Exchange Commission adopted amendments to certain disclosure requirements that had become “redundant, duplicative, overlapping, outdated or superseded, in light of the other Commission disclosure requirements, U.S. GAAP or changes in the information environment”. The compliance date for the amendments to Regulation S-X is November 5, 2018 (for reporting period end dates of September 30, 2018 and after). |
8. | Subsequent Events. Management has evaluated events and transactions that have occurred since October 31, 2018 through the date the financial statements were issued and determined that there were none that would require recognition or additional disclosure in the financial statements. |
financial statements october 31, 2018 | 43 |
BBH LIMITED DURATION FUND
DISCLOSURE OF FUND EXPENSES
October 31, 2018 (unaudited)
BBH LIMITED DURATION FUND
DISCLOSURE OF FUND EXPENSES (continued)
October 31, 2018 (unaudited)
| Beginning Account Value May 1, 2018 | Ending Account Value October 31, 2018 | Expenses Paid During Period May 1, 2018 to October 31, 20181 | ||||||||||||
Class N | ||||||||||||||
Actual | $ | 1,000 | $ | 1,013 | $ | 1.77 | ||||||||
Hypothetical2 | $ | 1,000 | $ | 1,023 | $ | 1.78 | ||||||||
| Beginning Account Value May 1, 2018 | Ending Account Value October 31, 2018 | Expenses Paid During Period May 1, 2018 to October 31, 20181 | ||||||||||||
Class I | ||||||||||||||
Actual | $ | 1,000 | $ | 1,014 | $ | 1.31 | ||||||||
Hypothetical2 | $ | 1,000 | $ | 1,024 | $ | 1.32 | ||||||||
| 1 | Expenses are equal to the Fund’s annualized expense ratio of 0.35% and 0.26% for Class N and I shares, respectively, multiplied by the average account value over the period, multiplied by 184/365 (to reflect the one-half year period). |
| 2 | Assumes a return of 5% before expenses. For the purposes of the calculation, the applicable annualized expenses ratio for each class of shares is subtracted from the assumed return before expenses. |
financial statements october 31, 2018 | 45 |
BBH LIMITED DURATION FUND
CONFLICTS OF INTEREST
October 31, 2018 (unaudited)
BBH LIMITED DURATION FUND
CONFLICTS OF INTEREST (continued)
October 31, 2018 (unaudited)
financial statements october 31, 2018 | 47 |
BBH LIMITED DURATION FUND
CONFLICTS OF INTEREST (continued)
October 31, 2018 (unaudited)
BBH LIMITED DURATION FUND
CONFLICTS OF INTEREST (continued)
October 31, 2018 (unaudited)
Investment Adviser in the investment decision-making process (including with respect to futures, fixed price offerings and over-the-counter transactions). The use of a broker that provides research and securities transaction services may result in a higher commission than that offered by a broker who does not provide such services. The Investment Adviser will determine in good faith whether the amount of commission is reasonable in relation to the value of research and services provided and whether the services provide lawful and appropriate assistance in its investment decision-making responsibilities.
financial statements october 31, 2018 | 49 |
BBH LIMITED DURATION FUND
CONFLICTS OF INTEREST (continued)
October 31, 2018 (unaudited)
BBH LIMITED DURATION FUND
CONFLICTS OF INTEREST (continued)
October 31, 2018 (unaudited)
financial statements october 31, 2018 | 51 |
BBH LIMITED DURATION FUND
ADDITIONAL FEDERAL TAX INFORMATION
October 31, 2018 (unaudited)
TRUSTEES AND OFFICERS OF BBH LIMITED DURATION FUND
(unaudited)
| Name and Birth Year | Position(s) Held with the Trust | | Term of Office and Length of Time Served# | | Principal Occupation(s) During Past 5 Years | | Number of Portfolios in Fund Complex Overseen by Trusteeˆ | | Other Public Company or Investment Company Directorships held by Trustee During Past 5 Years | |
Independent Trustees | ||||||||||
H. Whitney Wagner Birth Year: 1956 | Chairman of the Board and Trustee | Chairman Since 2014; Trustee Since 2007 and 2006-2007 with the Predecessor Trust | President, Clear Brook Advisors, a registered investment adviser. | 7 | None. | |||||
Andrew S. Frazier Birth Year: 1948 | Trustee | Since 2010 | Retired. | 7 | Director of Western World Insurance Group, Inc. | |||||
Mark M. Collins Birth Year: 1956 | Trustee | Since 2011 | Partner of Brown Investment Advisory Incorporated, a registered investment adviser. | 7 | Chairman of Dillon Trust Company. | |||||
John M. Tesoro Birth Year: 1952 | Trustee | Since 2014 | Retired. | 7 | Trustee, Bridge Builder Trust (8 Funds); Director of Teton Advisors, Inc. (a registered investment adviser). |
financial statements october 31, 2018 | 53 |
TRUSTEES AND OFFICERS OF BBH LIMITED DURATION FUND
(unaudited)
| Name, Address and Birth Year | | Position(s) Held with the Trust | | Term of Office and Length of Time Served# | | Principal Occupation(s) During Past 5 Years | | Number of Portfolios in Fund Complex Overseen by Trusteeˆ | | Other Public Company or Investment Company Directorships held by Trustee During Past 5 Years | ||||||||||||
Interested Trustees | ||||||||||||||||||||||
Susan C. Livingston+ 50 Post Office Square Boston, MA 02110 Birth Year: 1957 | Trustee | Since 2011 | Partner (since 1998) and Senior Client Advocate (since 2010) for BBH&Co.; Director of BBH Luxembourg S.C.A. (since 1992). | 7 | None. | |||||||||||||||||
John A. Gehret+ 140 Broadway New York, NY 10005 Birth Year: 1959 | Trustee | Since 2011 | Limited Partner of BBH&Co. (2012-present); Director of BBH Luxembourg Funds (since 2012); Director of BBH Trust Company (Cayman) Ltd. (since 2012). | 7 | None. | |||||||||||||||||
TRUSTEES AND OFFICERS OF BBH LIMITED DURATION FUND
(unaudited)
| Name, Address and Birth Year | | Position(s) Held with the Trust | | Term of Office and Length of Time Served# | | Principal Occupation(s) During Past 5 Years | ||||||||
Officers | ||||||||||||||
Jean-Pierre Paquin 140 Broadway New York, NY 10005 Birth Year: 1973 | President and Principal Executive Officer | Since 2016 | Partner of BBH&Co. since 2015; joined BBH&Co. in 1996. | |||||||||||
Daniel Greifenkamp 140 Broadway New York, NY 10005 Birth Year: 1969 | Vice President | Since 2016 | Managing Director of BBH&Co. since 2014; joined BBH&Co. in 2011. | |||||||||||
Charles H. Schreiber 140 Broadway New York, NY 10005 Birth Year: 1957 | Treasurer and Principal Financial Officer | Since 2007 2006-2007 with the Predecessor Trust | Senior Vice President of BBH&Co. since 2001; joined BBH&Co. in 1999. | |||||||||||
Paul F. Gallagher 140 Broadway New York, NY 10005 Birth Year: 1959 | Chief Compliance Officer (“CCO”) | Since 2015 | Senior Vice President of BBH&Co. since September 2015; Executive Director, Counsel, Morgan Stanley Smith Barney LLC (2009-September 2015). | |||||||||||
Keith M. Kelley 50 Post Office Square Boston, MA 02110 Birth Year: 1983 | Anti-Money Laundering Officer (“AMLO”) | Since 2016 | Vice President of BBH&Co. since February 2016; joined BBH&Co. in 2016; Director, Legal and Compliance, Morgan Stanley Smith Barney LLC (2014-February 2016); Compliance Manager, State Street Corporation (2013-2014). | |||||||||||
financial statements october 31, 2018 | 55 |
TRUSTEES AND OFFICERS OF BBH LIMITED DURATION FUND
(unaudited)
| Name, Address and Birth Year | Position(s) Held with the Trust | | Term of Office and Length of Time Served# | | Principal Occupation(s) During Past 5 Years | |
Suzan M. Barron 50 Post Office Square Boston, MA 02110 Birth Year: 1964 | Secretary | Since 2009 | Senior Vice President and Senior Investor Services Counsel, BBH&Co. since 2005. | |||
Crystal Cheung 140 Broadway New York, NY 10005 Birth Year: 1974 | Assistant Treasurer | Since 2018 | Assistant Vice President of BBH&Co. since 2016; joined BBH&Co. in 2014; Financial Reporting Manager, BNY Mellon Corporation (2010-2014). | |||
Brian J. Carroll 50 Post Office Square Boston, MA 02110 Birth Year: 1985 | Assistant Secretary | Since 2018 | Associate and Investor Services Assistant Counsel of BBH&Co. since 2017; joined BBH&Co. in 2014. |
# | All officers of the Trust hold office for one year and until their respective successors are chosen and qualified (subject to the ability of the Trustees to remove any officer in accordance with the Trust’s By-laws). Mr. Wagner previously served on the Board of Trustees of the Predecessor Trust. |
+ | Ms. Livingston and Mr. Gehret are “interested persons” of the Trust as defined in the 1940 Act because of their positions as Partner and Limited Partner of BBH&Co., respectively. |
ˆ | The Fund Complex consists of the Trust, which has seven series, and each is counted as one “Portfolio” for purposes of this table. |
| Administrator Brown Brothers Harriman & Co. 140 Broadway New York, NY 10005 Distributor ALPS Distributors, Inc. 1290 Broadway, Suite 1100 Denver, CO 80203 Shareholder Servicing Agent Brown Brothers Harriman & Co. 140 Broadway New York, NY 10005 1-800-575-1265 | Investment Adviser Brown Brothers Harriman Mutual Fund Advisory Department 140 Broadway New York, NY 10005 | |||||
By telephone: | Call 1-800-575-1265 | |||||
By E-mail send your request to: | bbhfunds@bbh.com | |||||
On the internet: | www.bbhfunds.com | |||||
BBH INTERMEDIATE MUNICIPAL BOND FUND
MANAGEMENT’S DISCUSSION OF FUND PERFORMANCE
October 31, 2018
BBH INTERMEDIATE MUNICIPAL BOND FUND
MANAGEMENT’S DISCUSSION OF FUND PERFORMANCE (continued)
October 31, 2018
| 1 | Barclays Municipal Bond 1-15 Year Blend (1-17) Index is a sub-index of the Barclays Capital Municipal Bond Index, a rules-based market value-weighted index of bonds with maturities of one year to 17 years engineered for the tax exempt bond market. One cannot invest directly in an index. |
| 2 | One “basis point” or “bp” is 1/100th of a percent (0.01% or 0.0001). |
financial statements october 31, 2018 | 3 |
BBH INTERMEDIATE MUNICIPAL BOND FUND
MANAGEMENT’S DISCUSSION OF FUND PERFORMANCE (continued)
October 31, 2018
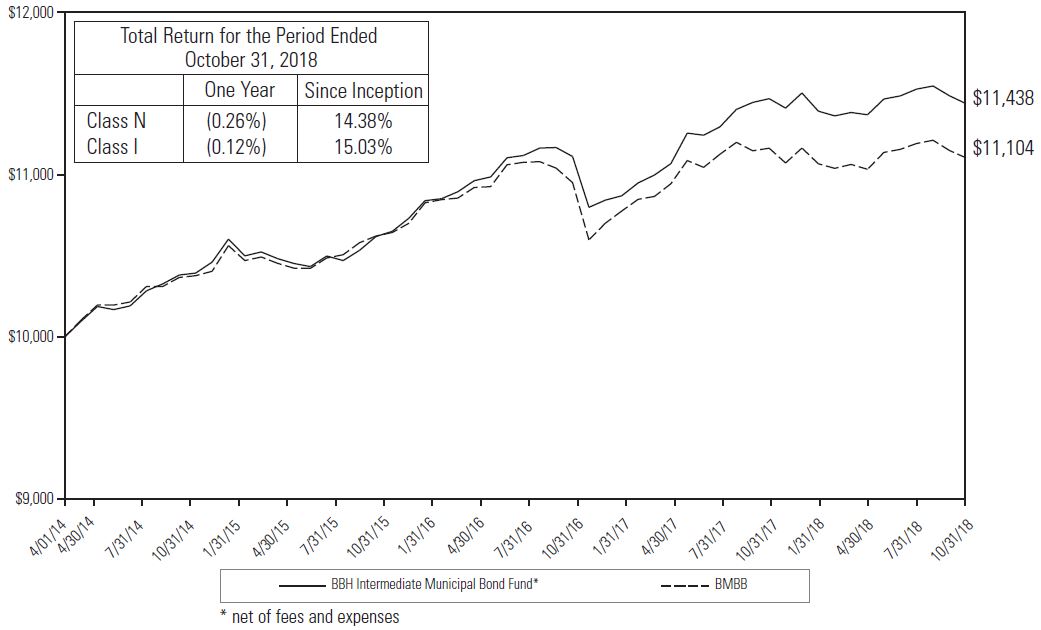 |
| 1 | The Fund’s performance assumes the reinvestment of all dividends and distributions. The Barclays Municipal Bond 1-15 Year Blend (1-17) Index (“BMBB”) has been adjusted to reflect reinvestment of dividends on securities in the index. The BMBB is not adjusted to reflect sales charges, expenses or other fees that the Securities and Exchange Commission requires to be reflected in the Fund’s performance. The index is unmanaged. Investments cannot be made in the index. |
BBH INTERMEDIATE MUNICIPAL BOND FUND
REPORT OF INDEPENDENT REGISTERED PUBLIC ACCOUNTING FIRM
BBH Intermediate Municipal Bond Fund:
financial statements october 31, 2018 | 5 |
BBH INTERMEDIATE MUNICIPAL BOND FUND
REPORT OF INDEPENDENT REGISTERED PUBLIC ACCOUNTING FIRM (continued)
evaluating the accounting principles used and significant estimates made by management, as well as evaluating the overall presentation of the financial statements and financial highlights. Our procedures included confirmation of securities owned as of October 31, 2018, by correspondence with the custodian and brokers; when replies were not received from brokers, we performed other auditing procedures. We believe that our audits provide a reasonable basis for our opinion.
|
December 21, 2018
BBH INTERMEDIATE MUNICIPAL BOND FUND
PORTFOLIO ALLOCATION
October 31, 2018
| U.S. $ Value | Percent of Net Assets | |||||||||
Municipal Bonds | $ | 160,410,540 | 98.3 | % | ||||||
Cash and Other Assets in Excess of Liabilities | 2,720,883 | 1.7 | ||||||||
NET ASSETS | $ | 163,131,423 | 100.0 | % | ||||||
| U.S. $ Value | Percent of Total Investments | |||||||||
AAA | $ | 51,817,761 | 32.3 | % | ||||||
AA | 60,676,334 | 37.8 | ||||||||
A | 39,695,687 | 24.8 | ||||||||
BBB | 8,220,758 | 5.1 | ||||||||
TOTAL INVESTMENTS | $ | 160,410,540 | 100.0 | % | ||||||
The accompanying notes are an integral part of these financial statements.
financial statements october 31, 2018 | 7 |
BBH INTERMEDIATE MUNICIPAL BOND FUND
PORTFOLIO OF INVESTMENTS
October 31, 2018
| Principal Amount | Maturity Date | Interest Rate | Value | |||||||||||||
MUNICIPAL BONDS (98.3%) | ||||||||||||||||
Alabama (0.1%) | ||||||||||||||||
| $ 150,000 | Alabama 21st Century Authority, Revenue Bonds | 06/01/21 | 5.000 | % | $ | 159,081 | ||||||||||
Total Alabama | 159,081 | |||||||||||||||
Arizona (0.4%) | ||||||||||||||||
| 475,000 | Salt Verde Financial Corp., Revenue Bonds | 12/01/19 | 5.250 | 489,450 | ||||||||||||
| 140,000 | Salt Verde Financial Corp., Revenue Bonds | 12/01/22 | 5.250 | 153,080 | ||||||||||||
Total Arizona | 642,530 | |||||||||||||||
California (4.9%) | ||||||||||||||||
| 1,000,000 | Anaheim City School District, General Obligation Bonds, NPFG1 | 08/01/26 | 0.000 | 778,990 | ||||||||||||
| 2,000,000 | Anaheim City School District, General Obligation Bonds, AGM, NPFG1 | 08/01/29 | 0.000 | 1,357,260 | ||||||||||||
| 800,000 | California Pollution Control Financing Authority, Revenue Bonds2,3 | 11/01/40 | 3.125 | 779,568 | ||||||||||||
| 1,000,000 | Golden State Tobacco Securitization Corp., Revenue Bonds, AGM1 | 06/01/25 | 0.000 | 832,250 | ||||||||||||
| 1,000,000 | Grossmont Healthcare District, General Obligation Bonds, AMBAC1 | 07/15/30 | 0.000 | 645,170 | ||||||||||||
| 1,100,000 | La Mesa-Spring Valley School District, General Obligation Bonds, NPFG1 | 08/01/26 | 0.000 | 853,622 | ||||||||||||
| 25,000 | Long Beach Bond Finance Authority, Revenue Bonds | 11/15/19 | 5.250 | 25,735 | ||||||||||||
| 725,000 | Long Beach Bond Finance Authority, Revenue Bonds | 11/15/22 | 5.250 | 792,048 | ||||||||||||
| 210,000 | Long Beach Bond Finance Authority, Revenue Bonds (3-Month USD-LIBOR + 1.450%)2 | 11/15/27 | 3.000 | 210,317 | ||||||||||||
| 1,000,000 | Santa Ana Unified School District, General Obligation Bonds, NPFG1 | 08/01/24 | 0.000 | 849,900 | ||||||||||||
The accompanying notes are an integral part of these financial statements.
BBH INTERMEDIATE MUNICIPAL BOND FUND
PORTFOLIO OF INVESTMENTS (continued)
October 31, 2018
| Principal Amount | Maturity Date | Interest Rate | Value | |||||||||||||
MUNICIPAL BONDS (continued) | ||||||||||||||||
California (continued) | ||||||||||||||||
| $1,000,000 | Ukiah Unified School District, General Obligation Bonds, NPFG1 | 08/01/24 | 0.000 | % | $ | 853,280 | ||||||||||
Total California | 7,978,140 | |||||||||||||||
Colorado (1.6%) | ||||||||||||||||
| 2,500,000 | Colorado Housing & Finance Authority, Revenue Bonds, GNMA | 11/01/48 | 4.200 | 2,566,525 | ||||||||||||
Total Colorado | 2,566,525 | |||||||||||||||
Connecticut (6.6%) | ||||||||||||||||
| 1,135,000 | Connecticut Housing Finance Authority, Revenue Bonds, FHLMC, FNMA, GNMA | 11/15/22 | 2.100 | 1,100,224 | ||||||||||||
| 530,000 | Connecticut Housing Finance Authority, Revenue Bonds | 05/15/23 | 2.800 | 527,981 | ||||||||||||
| 150,000 | Connecticut State Health & Educational Facilities Authority, Revenue Bonds (1-Month USD-LIBOR + 0.550%)2 | 07/01/49 | 2.062 | 150,006 | ||||||||||||
| 1,000,000 | State of Connecticut, General Obligation Bonds (SIFMA Municipal Swap Index Yield + 0.990%)2 | 03/01/25 | 2.590 | 1,003,270 | ||||||||||||
| 1,845,000 | State of Connecticut, General Obligation Bonds | 03/01/26 | 5.000 | 2,000,847 | ||||||||||||
| 620,000 | State of Connecticut Special Tax Revenue, Revenue Bonds | 09/01/23 | 5.000 | 681,789 | ||||||||||||
| 1,290,000 | State of Connecticut Special Tax Revenue, Revenue Bonds | 08/01/25 | 5.000 | 1,443,136 | ||||||||||||
| 2,225,000 | State of Connecticut Special Tax Revenue, Revenue Bonds | 09/01/26 | 5.000 | 2,498,742 | ||||||||||||
| 1,265,000 | State of Connecticut Special Tax Revenue, Revenue Bonds | 01/01/29 | 5.000 | 1,408,400 | ||||||||||||
Total Connecticut | 10,814,395 | |||||||||||||||
The accompanying notes are an integral part of these financial statements.
financial statements october 31, 2018 | 9 |
BBH INTERMEDIATE MUNICIPAL BOND FUND
PORTFOLIO OF INVESTMENTS (continued)
October 31, 2018
| Principal Amount | Maturity Date | Interest Rate | Value | |||||||||||||
MUNICIPAL BONDS (continued) | ||||||||||||||||
Florida (6.9%) | ||||||||||||||||
| $1,020,000 | County of Broward Airport System, Revenue Bonds | 10/01/25 | 5.000 | % | $ | 1,099,468 | ||||||||||
| 1,000,000 | County of Hillsborough Solid Waste & Resource Recovery, Revenue Bonds | 09/01/24 | 5.000 | 1,112,430 | ||||||||||||
| 1,200,000 | Florida Housing Finance Corp., Revenue Bonds, FHLMC, FNMA, GNMA | 07/01/49 | 4.000 | 1,251,672 | ||||||||||||
| 230,000 | Hillsborough County Aviation Authority, Revenue Bonds | 10/01/25 | 5.000 | 250,755 | ||||||||||||
| 55,000 | Hillsborough County Aviation Authority, Revenue Bonds | 10/01/26 | 5.000 | 59,780 | ||||||||||||
| 220,000 | Pinellas County Health Facilities Authority, Revenue Bonds, NPFG2,3 | 11/15/23 | 3.315 | 220,000 | ||||||||||||
| 1,750,000 | State of Florida, General Obligation Bonds | 06/01/26 | 5.000 | 2,038,558 | ||||||||||||
| 1,805,000 | State of Florida Lottery Revenue, Revenue Bonds | 07/01/25 | 5.000 | 2,080,353 | ||||||||||||
| 2,675,000 | State of Florida Lottery Revenue, Revenue Bonds | 07/01/27 | 5.000 | 3,090,267 | ||||||||||||
Total Florida | 11,203,283 | |||||||||||||||
Georgia (4.7%) | ||||||||||||||||
| 1,200,000 | Burke County Development Authority, Revenue Bonds2,3 | 11/01/45 | 3.000 | 1,172,760 | ||||||||||||
| 1,795,000 | Burke County Development Authority, Revenue Bonds2,3 | 11/01/45 | 3.250 | 1,747,271 | ||||||||||||
| 65,000 | Georgia Municipal Electric Authority, Revenue Bonds, NPFG2,3 | 01/01/21 | 4.000 | 65,190 | ||||||||||||
| 1,500,000 | State of Georgia, General Obligation Bonds | 02/01/24 | 5.000 | 1,695,105 | ||||||||||||
| 1,025,000 | State of Georgia, General Obligation Bonds | 12/01/24 | 5.000 | 1,173,676 | ||||||||||||
| 1,595,000 | State of Georgia, General Obligation Bonds | 12/01/26 | 5.000 | 1,873,615 | ||||||||||||
Total Georgia | 7,727,617 | |||||||||||||||
The accompanying notes are an integral part of these financial statements.
BBH INTERMEDIATE MUNICIPAL BOND FUND
PORTFOLIO OF INVESTMENTS (continued)
October 31, 2018
| Principal Amount | Maturity Date | Interest Rate | Value | |||||||||||||
MUNICIPAL BONDS (continued) | ||||||||||||||||
Illinois (2.6%) | ||||||||||||||||
| $ 75,000 | Chicago Park District, General Obligation Bonds | 01/01/19 | 3.000 | % | $ | 75,100 | ||||||||||
| 360,000 | Chicago Park District, General Obligation Bonds | 01/01/19 | 4.000 | 361,066 | ||||||||||||
| 285,000 | Chicago Park District, General Obligation Bonds | 01/01/19 | 5.000 | 286,305 | ||||||||||||
| 235,000 | Illinois Development Finance Authority, Revenue Bonds1 | 07/15/23 | 0.000 | 207,249 | ||||||||||||
| 60,000 | Illinois Finance Authority, Revenue Bonds2,3 | 07/15/57 | 5.000 | 65,761 | ||||||||||||
| 30,000 | Railsplitter Tobacco Settlement Authority, Revenue Bonds | 06/01/21 | 5.250 | 31,987 | ||||||||||||
| 1,340,000 | Railsplitter Tobacco Settlement Authority, Revenue Bonds | 06/01/24 | 5.000 | 1,484,720 | ||||||||||||
| 1,600,000 | Railsplitter Tobacco Settlement Authority, Revenue Bonds | 06/01/27 | 5.000 | 1,785,616 | ||||||||||||
Total Illinois | 4,297,804 | |||||||||||||||
Indiana (1.0%) | ||||||||||||||||
| 1,700,000 | City of Rockport, Revenue Bonds | 06/01/25 | 3.050 | 1,676,013 | ||||||||||||
Total Indiana | 1,676,013 | |||||||||||||||
Iowa (0.7%) | ||||||||||||||||
| 1,050,000 | Iowa Finance Authority, Revenue Bonds, FHLMC, FNMA, GNMA | 07/01/46 | 4.000 | 1,083,012 | ||||||||||||
Total Iowa | 1,083,012 | |||||||||||||||
Kansas (0.3%) | ||||||||||||||||
| 200,000 | City of La Cygne, Revenue Bonds, NPFG2,3 | 04/15/27 | 2.950 | 200,000 | ||||||||||||
| 100,000 | City of St. Marys, Revenue Bonds, NPFG2,3 | 04/15/32 | 3.140 | 100,000 | ||||||||||||
| 100,000 | City of Wamego, Revenue Bonds, NPFG2,3 | 04/15/32 | 3.060 | 100,000 | ||||||||||||
Total Kansas | 400,000 | |||||||||||||||
The accompanying notes are an integral part of these financial statements.
financial statements october 31, 2018 | 11 |
BBH INTERMEDIATE MUNICIPAL BOND FUND
PORTFOLIO OF INVESTMENTS (continued)
October 31, 2018
| Principal Amount | Maturity Date | Interest Rate | Value | |||||||||||||
MUNICIPAL BONDS (continued) | ||||||||||||||||
Louisiana (0.0%) | ||||||||||||||||
| $ 25,000 | Tobacco Settlement Financing Corp., Revenue Bonds | 05/15/22 | 5.000 | % | $ | 26,927 | ||||||||||
Total Louisiana | 26,927 | |||||||||||||||
Maryland (2.1%) | ||||||||||||||||
| 1,125,000 | County of Baltimore, General Obligation Bonds | 02/01/26 | 5.000 | 1,303,864 | ||||||||||||
| 1,905,000 | State of Maryland, General Obligation Bonds | 08/01/24 | 5.000 | 2,163,870 | ||||||||||||
Total Maryland | 3,467,734 | |||||||||||||||
Massachusetts (4.0%) | ||||||||||||||||
| 320,000 | Commonwealth of Massachusetts, General Obligation Bonds, AGM2,3 | 11/01/19 | 3.579 | 320,880 | ||||||||||||
| 1,500,000 | Commonwealth of Massachusetts, Revenue Bonds, AGM2,3 | 06/01/22 | 2.540 | 1,550,145 | ||||||||||||
| 1,000,000 | Commonwealth of Massachusetts, General Obligation Bonds | 09/01/26 | 5.000 | 1,165,930 | ||||||||||||
| 500,000 | Massachusetts Clean Water Trust, Revenue Bonds2,3 | 08/01/23 | 3.329 | 503,730 | ||||||||||||
| 135,000 | Massachusetts Development Finance Agency, Revenue Bonds (SIFMA Municipal Swap Index Yield + 0.480%)2 | 07/01/50 | 2.080 | 135,121 | ||||||||||||
| 1,000,000 | Massachusetts Housing Finance Agency, Revenue Bonds | 12/01/21 | 2.500 | 992,070 | ||||||||||||
| 1,895,000 | Massachusetts Housing Finance Agency, Revenue Bonds | 12/01/46 | 3.500 | 1,926,647 | ||||||||||||
Total Massachusetts | 6,594,523 | |||||||||||||||
Michigan (3.7%) | ||||||||||||||||
| 1,185,000 | Detroit City School District, General Obligation Bonds | 05/01/19 | 5.000 | 1,201,317 | ||||||||||||
| 350,000 | Detroit City School District, General Obligation Bonds | 05/01/23 | 5.000 | 377,300 | ||||||||||||
The accompanying notes are an integral part of these financial statements.
BBH INTERMEDIATE MUNICIPAL BOND FUND
PORTFOLIO OF INVESTMENTS (continued)
October 31, 2018
| Principal Amount | Maturity Date | Interest Rate | Value | |||||||||||||
MUNICIPAL BONDS (continued) | ||||||||||||||||
Michigan (continued) | ||||||||||||||||
| $ 105,000 | Detroit City School District, General Obligation Bonds, BHAC, FGIC | 05/01/25 | 5.250 | % | $ | 114,874 | ||||||||||
| 90,000 | Detroit City School District, General Obligation Bonds, AGM | 05/01/27 | 5.250 | 103,343 | ||||||||||||
| 350,000 | Detroit City School District, General Obligation Bonds, AGM | 05/01/29 | 6.000 | 404,960 | ||||||||||||
| 1,540,000 | Detroit City School District, General Obligation Bonds, AGM | 05/01/30 | 5.250 | 1,796,472 | ||||||||||||
| 1,590,000 | Detroit City School District, General Obligation Bonds, AGM | 05/01/32 | 5.250 | 1,849,043 | ||||||||||||
| 150,000 | Michigan Finance Authority, Revenue Bonds | 05/01/19 | 5.000 | 152,066 | ||||||||||||
Total Michigan | 5,999,375 | |||||||||||||||
Minnesota (2.8%) | ||||||||||||||||
| 1,765,000 | Minnesota Housing Finance Agency, Revenue Bonds, FHLMC, FNMA, GNMA | 07/01/25 | 2.800 | 1,715,651 | ||||||||||||
| 755,000 | Minnesota Housing Finance Agency, Revenue Bonds, FHLMC, FNMA, GNMA | 01/01/27 | 3.350 | 740,678 | ||||||||||||
| 1,030,000 | Minnesota Housing Finance Agency, Revenue Bonds, FHLMC, FNMA, GNMA | 07/01/27 | 3.400 | 1,008,730 | ||||||||||||
| 1,025,000 | Minnesota Housing Finance Agency, Revenue Bonds, FHLMC, FNMA, GNMA | 07/01/48 | 4.000 | 1,069,475 | ||||||||||||
Total Minnesota | 4,534,534 | |||||||||||||||
Missouri (0.6%) | ||||||||||||||||
| 600,000 | Health & Educational Facilities Authority of the State of Missouri, Revenue Bonds, AMBAC2,3 | 06/01/31 | 3.470 | 600,000 | ||||||||||||
The accompanying notes are an integral part of these financial statements.
financial statements october 31, 2018 | 13 |
BBH INTERMEDIATE MUNICIPAL BOND FUND
PORTFOLIO OF INVESTMENTS (continued)
October 31, 2018
| Principal Amount | Maturity Date | Interest Rate | Value | |||||||||||||
MUNICIPAL BONDS (continued) | ||||||||||||||||
Missouri (continued) | ||||||||||||||||
| $ 310,000 | Health & Educational Facilities Authority of the State of Missouri, Revenue Bonds, AMBAC2,3 | 06/01/31 | 3.484 | % | $ | 310,000 | ||||||||||
Total Missouri | 910,000 | |||||||||||||||
Montana (1.0%) | ||||||||||||||||
| 1,500,000 | Montana Board of Housing, Revenue Bonds | 12/01/43 | 4.000 | 1,563,180 | ||||||||||||
Total Montana | 1,563,180 | |||||||||||||||
Nebraska (0.3%) | ||||||||||||||||
| 485,000 | Central Plains Energy Project, Revenue Bonds | 09/01/27 | 5.000 | 521,108 | ||||||||||||
Total Nebraska | 521,108 | |||||||||||||||
New Hampshire (0.6%) | ||||||||||||||||
| 1,000,000 | New Hampshire Business Finance Authority, Revenue Bonds | 08/01/24 | 3.125 | 999,900 | ||||||||||||
Total New Hampshire | 999,900 | |||||||||||||||
New Jersey (6.8%) | ||||||||||||||||
| 1,420,000 | Holmdel Township School District, General Obligation Bonds | 02/01/27 | 3.250 | 1,436,387 | ||||||||||||
| 2,065,000 | New Jersey Economic Development Authority, Revenue Bonds (SIFMA Municipal Swap Index Yield + 1.550%)2 | 09/01/27 | 3.150 | 2,049,471 | ||||||||||||
| 1,180,000 | New Jersey Economic Development Authority, Revenue Bonds (SIFMA Municipal Swap Index Yield + 1.600%)2 | 03/01/28 | 3.200 | 1,167,799 | ||||||||||||
| 1,240,000 | New Jersey Transit Corp., Revenue Bonds | 09/15/20 | 5.000 | 1,297,400 | ||||||||||||
| 555,000 | New Jersey Transit Corp., Revenue Bonds | 09/15/21 | 5.000 | 587,634 | ||||||||||||
The accompanying notes are an integral part of these financial statements.
BBH INTERMEDIATE MUNICIPAL BOND FUND
PORTFOLIO OF INVESTMENTS (continued)
October 31, 2018
| Principal Amount | Maturity Date | Interest Rate | Value | |||||||||||||
MUNICIPAL BONDS (continued) | ||||||||||||||||
New Jersey (continued) | ||||||||||||||||
| $1,435,000 | New Jersey Transportation Trust Fund Authority, Revenue Bonds1 | 12/15/26 | 0.000 | % | $ | 1,022,337 | ||||||||||
| 1,855,000 | New Jersey Transportation Trust Fund Authority, Revenue Bonds1 | 12/15/30 | 0.000 | 1,070,242 | ||||||||||||
| 2,500,000 | New Jersey Turnpike Authority, Revenue Bonds (1-Month USD-LIBOR + 0.750%)2 | 01/01/30 | 2.329 | 2,517,475 | ||||||||||||
Total New Jersey | 11,148,745 | |||||||||||||||
New Mexico (1.3%) | ||||||||||||||||
| 2,030,000 | New Mexico Mortgage Finance Authority, Revenue Bonds, FHLMC, FNMA, GNMA | 01/01/49 | 4.000 | 2,116,437 | ||||||||||||
| 55,000 | New Mexico Municipal Energy Acquisition Authority, Revenue Bonds (1-Month USD-LIBOR + 0.750%)2 | 11/01/39 | 2.262 | 54,992 | ||||||||||||
Total New Mexico | 2,171,429 | |||||||||||||||
New York (2.0%) | ||||||||||||||||
| 2,000,000 | Metropolitan Transportation Authority, Revenue Bonds (SIFMA Municipal Swap Index Yield + 0.450%)2 | 11/01/26 | 2.050 | 1,999,160 | ||||||||||||
| 50,000 | New York State Energy Research & Development Authority, Revenue Bonds2,3 | 07/01/26 | 2.375 | 49,879 | ||||||||||||
| 1,000,000 | New York State Energy Research & Development Authority, Revenue Bonds2,3 | 06/01/29 | 2.000 | 992,120 | ||||||||||||
| 260,000 | Triborough Bridge & Tunnel Authority, Revenue Bonds (1-Month USD-LIBOR + 0.500%)2 | 11/15/27 | 2.010 | 260,156 | ||||||||||||
Total New York | 3,301,315 | |||||||||||||||
North Carolina (4.7%) | ||||||||||||||||
| 1,405,000 | County of Mecklenburg, General Obligation Bonds | 04/01/24 | 5.000 | 1,592,455 | ||||||||||||
The accompanying notes are an integral part of these financial statements.
financial statements october 31, 2018 | 15 |
BBH INTERMEDIATE MUNICIPAL BOND FUND
PORTFOLIO OF INVESTMENTS (continued)
October 31, 2018
| Principal Amount | Maturity Date | Interest Rate | Value | |||||||||||||
MUNICIPAL BONDS (continued) | ||||||||||||||||
North Carolina (continued) | ||||||||||||||||
| $1,575,000 | County of Wake, General Obligation Bonds | 03/01/24 | 5.000 | % | $ | 1,782,081 | ||||||||||
| 965,000 | North Carolina Housing Finance Agency, Revenue Bonds, FHLMC, FNMA, GNMA | 01/01/23 | 2.750 | 957,096 | ||||||||||||
| 965,000 | North Carolina Housing Finance Agency, Revenue Bonds, FHLMC, FNMA, GNMA | 07/01/23 | 2.800 | 954,974 | ||||||||||||
| 2,000,000 | State of North Carolina, General Obligation Bonds | 06/01/27 | 5.000 | 2,360,240 | ||||||||||||
Total North Carolina | 7,646,846 | |||||||||||||||
Ohio (3.5%) | ||||||||||||||||
| 400,000 | County of Montgomery, Revenue Bonds4 | 11/01/18 | 1.650 | 400,000 | ||||||||||||
| 600,000 | County of Montgomery, Revenue Bonds4 | 11/01/18 | 1.650 | 600,000 | ||||||||||||
| 3,000,000 | Lancaster Port Authority, Revenue Bonds (1-Month USD-LIBOR + 0.720%)2 | 05/01/38 | 2.232 | 3,000,780 | ||||||||||||
| 1,525,000 | Ohio Water Development Authority Water Pollution Control Loan Fund, Revenue Bonds | 12/01/25 | 5.000 | 1,763,464 | ||||||||||||
Total Ohio | 5,764,244 | |||||||||||||||
Oklahoma (1.2%) | ||||||||||||||||
| 2,000,000 | Oklahoma Turnpike Authority, Revenue Bonds | 01/01/33 | 3.750 | 1,986,880 | ||||||||||||
Total Oklahoma | 1,986,880 | |||||||||||||||
Oregon (4.1%) | ||||||||||||||||
| 1,000,000 | Clackamas County School District No 115, General Obligation Bonds1 | 06/15/27 | 0.000 | 756,100 | ||||||||||||
| 1,670,000 | Lane County School District No 1 Pleasant Hill, General Obligation Bonds1 | 06/15/27 | 0.000 | 1,265,910 | ||||||||||||
| 3,805,000 | Salem-Keizer School District No 24J, General Obligation Bonds1 | 06/15/25 | 0.000 | 3,148,828 | ||||||||||||
The accompanying notes are an integral part of these financial statements.
BBH INTERMEDIATE MUNICIPAL BOND FUND
PORTFOLIO OF INVESTMENTS (continued)
October 31, 2018
| Principal Amount | Maturity Date | Interest Rate | Value | |||||||||||||
MUNICIPAL BONDS (continued) | ||||||||||||||||
Oregon (continued) | ||||||||||||||||
| $1,500,000 | Washington Clackamas & Yamhill Counties School District No 88J, General Obligation Bonds1 | 06/15/31 | 0.000 | % | $ | 936,255 | ||||||||||
| 1,000,000 | Washington Clackamas & Yamhill Counties School District No 88J, General Obligation Bonds1 | 06/15/33 | 0.000 | 569,360 | ||||||||||||
Total Oregon | 6,676,453 | |||||||||||||||
Pennsylvania (3.1%) | ||||||||||||||||
| 150,000 | Allegheny County Airport Authority, Revenue Bonds, FGIC | 01/01/22 | 5.000 | 160,861 | ||||||||||||
| 75,000 | Allegheny County Airport Authority, Revenue Bonds, FGIC | 01/01/23 | 5.000 | 81,562 | ||||||||||||
| 310,000 | School District of Philadelphia, General Obligation Bonds, AGM, FGIC | 06/01/24 | 5.000 | 335,848 | ||||||||||||
| 440,000 | School District of Philadelphia, General Obligation Bonds | 09/01/26 | 5.000 | 492,840 | ||||||||||||
| 1,600,000 | School District of Philadelphia, General Obligation Bonds | 09/01/28 | 5.000 | 1,803,776 | ||||||||||||
| 1,000,000 | State Public School Building Authority, Revenue Bonds | 04/01/25 | 5.000 | 1,061,740 | ||||||||||||
| 1,000,000 | State Public School Building Authority, Revenue Bonds, AGM | 06/01/32 | 5.000 | 1,090,780 | ||||||||||||
Total Pennsylvania | 5,027,407 | |||||||||||||||
South Dakota (0.5%) | ||||||||||||||||
| 800,000 | Educational Enhancement Funding Corp., Revenue Bonds | 06/01/25 | 5.000 | 864,064 | ||||||||||||
Total South Dakota | 864,064 | |||||||||||||||
Tennessee (1.8%) | ||||||||||||||||
| 1,020,000 | Tennessee Housing Development Agency, Revenue Bonds | 07/01/45 | 4.000 | 1,047,571 | ||||||||||||
| 1,800,000 | Tennessee Housing Development Agency, Revenue Bonds | 01/01/47 | 3.500 | 1,827,576 | ||||||||||||
Total Tennessee | 2,875,147 | |||||||||||||||
The accompanying notes are an integral part of these financial statements.
financial statements october 31, 2018 | 17 |
BBH INTERMEDIATE MUNICIPAL BOND FUND
PORTFOLIO OF INVESTMENTS (continued)
October 31, 2018
| Principal Amount | Maturity Date | Interest Rate | Value | |||||||||||||
MUNICIPAL BONDS (continued) | ||||||||||||||||
Texas (12.1%) | ||||||||||||||||
| $1,320,000 | Allen Independent School District, General Obligation Bonds | 02/15/24 | 5.000 | % | $ | 1,481,713 | ||||||||||
| 1,080,000 | Allen Independent School District, General Obligation Bonds | 02/15/25 | 5.000 | 1,229,386 | ||||||||||||
| 1,000,000 | Allen Independent School District, General Obligation Bonds1 | 02/15/28 | 0.000 | 730,290 | ||||||||||||
| 660,000 | City of Houston Airport System, Revenue Bonds | 07/01/24 | 5.000 | 729,709 | ||||||||||||
| 1,170,000 | City of Houston Airport System, Revenue Bonds | 07/01/25 | 5.000 | 1,302,865 | ||||||||||||
| 1,025,000 | Dallas Love Field, Revenue Bonds | 11/01/25 | 5.000 | 1,145,294 | ||||||||||||
| 1,000,000 | Hays Consolidated Independent School District, General Obligation Bonds | 02/15/27 | 5.000 | 1,159,240 | ||||||||||||
| 1,240,000 | Houston Independent School District, General Obligation Bonds | 02/15/25 | 5.000 | 1,411,517 | ||||||||||||
| 1,015,000 | State of Texas, General Obligation Bonds | 04/01/25 | 5.000 | 1,159,962 | ||||||||||||
| 2,500,000 | Texas Department of Housing & Community Affairs, Revenue Bonds, GNMA | 09/01/33 | 3.350 | 2,471,550 | ||||||||||||
| 380,000 | Texas Municipal Gas Acquisition & Supply Corp. I, Revenue Bonds | 12/15/19 | 5.250 | 392,008 | ||||||||||||
| 580,000 | Texas Municipal Gas Acquisition & Supply Corp. I, Revenue Bonds | 12/15/20 | 5.250 | 612,585 | ||||||||||||
| 480,000 | Texas Municipal Gas Acquisition & Supply Corp. I, Revenue Bonds | 12/15/21 | 5.250 | 517,411 | ||||||||||||
| 1,760,000 | Texas Municipal Gas Acquisition & Supply Corp. I, Revenue Bonds (3-Month USD-LIBOR + 0.700%)2 | 12/15/26 | 2.264 | 1,742,682 | ||||||||||||
| 3,420,000 | Texas Municipal Gas Acquisition & Supply Corp. II, Revenue Bonds (SIFMA Municipal Swap Index Yield + 0.550%)2 | 09/15/27 | 2.150 | 3,368,392 | ||||||||||||
The accompanying notes are an integral part of these financial statements.
BBH INTERMEDIATE MUNICIPAL BOND FUND
PORTFOLIO OF INVESTMENTS (continued)
October 31, 2018
| Principal Amount | Maturity Date | Interest Rate | Value | |||||||||||||
MUNICIPAL BONDS (continued) | ||||||||||||||||
Texas (continued) | ||||||||||||||||
| $ 345,000 | Texas Municipal Gas Acquisition & Supply Corp. II, Revenue Bonds (3-Month USD-LIBOR + 0.870%)2 | 09/15/27 | 2.434 | % | $ | 341,284 | ||||||||||
Total Texas | 19,795,888 | |||||||||||||||
Virginia (4.9%) | ||||||||||||||||
| 1,755,000 | City of Virginia Beach, General Obligation Bonds | 04/01/25 | 5,000 | 2,015,723 | ||||||||||||
| 2,000,000 | County of Arlington, General Obligation Bonds | 08/15/25 | 5.000 | 2,310,240 | ||||||||||||
| 2,300,000 | Virginia Housing Development Authority, Revenue Bonds | 01/01/23 | 2.740 | 2,302,507 | ||||||||||||
| 1,150,000 | Virginia Public School Authority, Revenue Bonds | 08/01/26 | 5.000 | 1,337,231 | ||||||||||||
Total Virginia | 7,965,701 | |||||||||||||||
Washington (5.1%) | ||||||||||||||||
| 500,000 | Port of Seattle, Revenue Bonds | 06/01/23 | 5.000 | 548,095 | ||||||||||||
| 425,000 | Port of Seattle, Revenue Bonds | 06/01/27 | 3.750 | 431,974 | ||||||||||||
| 1,610,000 | State of Washington, General Obligation Bonds | 08/01/25 | 5.000 | 1,849,794 | ||||||||||||
| 1,000,000 | State of Washington, General Obligation Bonds | 08/01/26 | 5.000 | 1,162,050 | ||||||||||||
| 395,000 | Washington State Housing Finance Commission, Revenue Bonds | 06/01/44 | 3.500 | 399,910 | ||||||||||||
| 4,000,000 | Washington State Housing Finance Commission, Revenue Bonds (SIFMA Municipal Swap Index Yield + 0.550%)2 | 12/01/48 | 2.150 | 4,000,000 | ||||||||||||
Total Washington | 8,391,823 | |||||||||||||||
Wisconsin (1.3%) | ||||||||||||||||
| 290,000 | County of Milwaukee Airport, Revenue Bonds | 12/01/28 | 5.250 | 318,522 | ||||||||||||
| 1,800,000 | Public Finance Authority, Revenue Bonds2,3 | 07/01/29 | 2.000 | 1,754,730 | ||||||||||||
Total Wisconsin | 2,073,252 | |||||||||||||||
The accompanying notes are an integral part of these financial statements.
financial statements october 31, 2018 | 19 |
BBH INTERMEDIATE MUNICIPAL BOND FUND
PORTFOLIO OF INVESTMENTS (continued)
October 31, 2018
| Principal Amount | Maturity Date | Interest Rate | Value | |||||||||||||
MUNICIPAL BONDS (continued) | ||||||||||||||||
Wyoming (1.0%) | ||||||||||||||||
| $1,500,000 | Wyoming Community Development Authority, Revenue Bonds | 12/01/43 | 4.000 | % | $ | 1,555,665 | ||||||||||
Total Wyoming | 1,555,665 | |||||||||||||||
Total Municipal Bonds (Identified cost $161,425,698) | 160,410,540 | |||||||||||||||
| TOTAL INVESTMENTS (Identified cost $161,425,698)5 | 98.3 | % | $ | 160,410,540 | |||
| CASH AND OTHER ASSETS IN EXCESS OF LIABILITIES | 1.7 | % | 2,720,883 | ||||
| NET ASSETS | 100.0 | % | $ | 163,131,423 |
| 1 | Security issued with zero coupon. Income is recognized through accretion of discount. |
| 2 | Variable rate instrument. Interest rates change on specific dates (such as coupon or interest payment date). The yield shown represents the October 31, 2018 coupon or interest rate. |
| 3 | This variable rate security is based on a predetermined schedule and the rate at period end also represents the reference rate at period end. |
| 4 | Variable rate demand note. The maturity date reflects the demand repayment dates. Interest rates change on specific dates (such as coupon or interest payment date). The yield shown represents the coupon or interest rate as of October 31, 2018. |
| 5 | The aggregate cost for federal income tax purposes is $161,428,473, the aggregate gross unrealized appreciation is $669,285 and the aggregate gross unrealized depreciation is $1,687,218, resulting in net unrealized depreciation of $1,017,933. |
The accompanying notes are an integral part of these financial statements.
BBH INTERMEDIATE MUNICIPAL BOND FUND
PORTFOLIO OF INVESTMENTS (continued)
October 31, 2018
— | Level 1 - unadjusted quoted prices in active markets for identical assets and liabilities. |
— | Level 2 - significant other observable inputs (including quoted prices for similar assets and liabilities, interest rates, prepayment speeds, credit risk, etc.). |
— | Level 3 - significant unobservable inputs (including the Fund’s own assumptions in determining the fair value of assets and liabilities). |
The accompanying notes are an integral part of these financial statements.
financial statements october 31, 2018 | 21 |
BBH INTERMEDIATE MUNICIPAL BOND FUND
PORTFOLIO OF INVESTMENTS (continued)
October 31, 2018
| Investments, at value | Unadjusted Quoted Prices in Active Markets for Identical Investments (Level 1)* | Significant Other Observable Inputs (Level 2)* | Significant Unobservable Inputs (Level 3)* | Balance as of October 31, 2018 | ||||||||||||||
Municipal Bonds** | $ | — | $ | 160,410,540 | $ | — | $ | 160,410,540 | ||||||||||
Investments, at value | $ | — | $ | 160,410,540 | $ | — | $ | 160,410,540 | ||||||||||
* | The Fund’s policy is to disclose transfers between levels based on valuations at the end of the reporting period. There were no transfers between Levels 1, 2 or 3 during the period ended October 31, 2018. |
** | For geographical breakdown of municipal bond investments, refer to the Portfolio of Investments. |
The accompanying notes are an integral part of these financial statements.
BBH INTERMEDIATE MUNICIPAL BOND FUND
STATEMENT OF ASSETS AND LIABILITIES
October 31, 2018
ASSETS: | ||||||
Investments in securities, at value (Identified cost $161,425,698) | $ | 160,410,540 | ||||
Cash | 109,955 | |||||
Receivables for: | ||||||
Investments sold | 2,240,178 | |||||
Interest | 1,419,349 | |||||
Shares sold | 670,000 | |||||
Investment advisory and administrative fee waiver reimbursement | 12,271 | |||||
Prepaid assets | 735 | |||||
Total Assets | 164,863,028 | |||||
LIABILITIES: | ||||||
Payables for: | ||||||
Investments purchased | 1,551,659 | |||||
Professional fees | 61,929 | |||||
Investment advisory and administrative fees | 55,144 | |||||
Shares redeemed | 25,545 | |||||
Custody and fund accounting fees | 19,061 | |||||
Shareholder servicing fees | 5,869 | |||||
Transfer agent fees | 3,088 | |||||
Board of Trustees’ fees | 417 | |||||
Accrued expenses and other liabilities | 8,893 | |||||
Total Liabilities | 1,731,605 | |||||
NET ASSETS | $ | 163,131,423 | ||||
Net Assets Consist of: | ||||||
Paid-in capital | $ | 163,897,468 | ||||
Accumulated deficit | (766,045 | ) | ||||
Net Assets | $ | 163,131,423 |
NET ASSET VALUE AND OFFERING PRICE PER SHARE | ||||||
CLASS N SHARES | ||||||
($34,293,478 ÷ 3,379,316 shares outstanding) | $10.15 | |||||
CLASS I SHARES | ||||||
($128,837,945 ÷ 12,708,744 shares outstanding) | $10.14 | |||||
The accompanying notes are an integral part of these financial statements.
financial statements october 31, 2018 | 23 |
BBH INTERMEDIATE MUNICIPAL BOND FUND
STATEMENT OF OPERATIONS
For the year ended October 31, 2018
NET INVESTMENT INCOME: | ||||||
Income: | ||||||
Interest income | $ | 3,295,075 | ||||
Other income | 308 | |||||
Total Income | 3,295,383 | |||||
Expenses: | ||||||
Investment advisory and administrative fees | 483,526 | |||||
Professional fees | 71,890 | |||||
Board of Trustees’ fees | 52,909 | |||||
Custody and fund accounting fees | 50,770 | |||||
Shareholder servicing fees | 49,295 | |||||
Transfer agent fees | 35,932 | |||||
Registration fees | 34,867 | |||||
Miscellaneous expenses | 38,341 | |||||
Total Expenses | 817,530 | |||||
Investment advisory and administrative fee waiver | (174,465 | ) | ||||
Expense offset arrangement | (1,686 | ) | ||||
Net Expenses | 641,379 | |||||
Net Investment Income | 2,654,004 | |||||
NET REALIZED AND UNREALIZED LOSS: | ||||||
Net realized gain on investments in securities | 357,138 | |||||
Net change in unrealized appreciation/(depreciation) on investments in securities | (3,126,201 | ) | ||||
Net Realized and Unrealized Loss | (2,769,063 | ) | ||||
Net Decrease in Net Assets Resulting from Operations | $ | (115,059 | ) |
The accompanying notes are an integral part of these financial statements.
BBH INTERMEDIATE MUNICIPAL BOND FUND
STATEMENTS OF CHANGES IN NET ASSETS
| For the years ended October 31, | ||||||||||
| 2018 | 2017 | |||||||||
INCREASE (DECREASE) IN NET ASSETS: | ||||||||||
Operations: | ||||||||||
Net investment income | $ | 2,654,004 | $ | 1,996,307 | ||||||
Net realized gain on investments in securities | 357,138 | 1,099,658 | ||||||||
Net change in unrealized appreciation/(depreciation) on investments in securities | (3,126,201 | ) | (534,966 | ) | ||||||
Net increase (decrease) in net assets resulting from operations | (115,059 | ) | 2,560,999 | |||||||
Dividends and distributions declared: | ||||||||||
Class N | (666,803 | ) | (757,020 | )1 | ||||||
Class I | (2,793,710 | ) | (2,583,284 | )2 | ||||||
Total dividends and distributions declared | (3,460,513 | ) | (3,340,304 | ) | ||||||
Share transactions: | ||||||||||
Proceeds from sales of shares3 | 128,717,128 | 22,328,960 | ||||||||
Net asset value of shares issued to shareholders for reinvestment of dividends and distributions | 1,631,088 | 1,394,699 | ||||||||
Proceeds from short-term redemption fees | 296 | 146 | ||||||||
Cost of shares redeemed3 | (51,131,375 | ) | (24,953,058 | ) | ||||||
Net increase (decrease) in net assets resulting from share transactions | 79,217,137 | (1,229,253 | ) | |||||||
Total increase (decrease) in net assets | 75,641,565 | (2,008,558 | ) | |||||||
NET ASSETS: | ||||||||||
Beginning of year | 87,489,858 | 89,498,416 | ||||||||
End of year | $ | 163,131,423 | $ | 87,489,858 | ||||||
| 1 | For the year ended October 31, 2017, dividends and distributions declared from net investment income and from net realized gains for Class N were equal to $449,944 and $307,076, respectively. |
| 2 | For the year ended October 31, 2017, dividends and distributions declared from net investment income and from net realized gains for Class I were equal to $1,740,315 and $842,969, respectively. |
| 3 | Includes share exchanges. See Note 5 in Notes to Financial Statements. |
The accompanying notes are an integral part of these financial statements.
financial statements october 31, 2018 | 25 |
BBH INTERMEDIATE MUNICIPAL BOND FUND
FINANCIAL HIGHLIGHTS
Selected per share data and ratios for a Class N share outstanding throughout each period.
For the years ended October 31, | For the period from April 1, 2014 (commencement of operations) to October 31, 2014 | |||||||||||||||||||||
| 2018 | 2017 | 2016 | 2015 | |||||||||||||||||||
Net asset value, beginning of period | $ | 10.48 | $ | 10.56 | $ | 10.29 | $ | 10.30 | $ | 10.00 | ||||||||||||
Income from investment operations: | ||||||||||||||||||||||
Net investment income1 | 0.21 | 0.22 | 0.18 | 0.15 | 0.09 | |||||||||||||||||
Net realized and unrealized gain (loss) | (0.23 | ) | 0.11 | 0.29 | 0.08 | 0.29 | ||||||||||||||||
Total income (loss) from investment operations | (0.02 | ) | 0.33 | 0.47 | 0.23 | 0.38 | ||||||||||||||||
Less dividends and distributions: | ||||||||||||||||||||||
From net investment income | (0.21 | ) | (0.26 | ) | (0.18 | ) | (0.16 | ) | (0.08 | ) | ||||||||||||
From net realized gains | (0.10 | ) | (0.15 | ) | (0.02 | ) | (0.08 | ) | — | |||||||||||||
Total dividends and distributions | (0.31 | ) | (0.41 | ) | (0.20 | ) | (0.24 | ) | (0.08 | ) | ||||||||||||
Short-term redemption fees1 | 0.00 | 2 | 0.00 | 2 | 0.00 | 2 | 0.00 | 2 | — | |||||||||||||
Net asset value, end of period | $ | 10.15 | $ | 10.48 | $ | 10.56 | $ | 10.29 | $ | 10.30 | ||||||||||||
Total return | (0.26 | )% | 3.20 | % | 4.64 | % | 2.29 | % | 3.82 | %3 | ||||||||||||
Ratios/Supplemental data: | ||||||||||||||||||||||
Net assets, end of period (in millions) | $34 | $16 | $23 | $26 | $1 | |||||||||||||||||
Ratio of expenses to average net assets before reductions | 0.91 | % | 1.05 | % | 1.03 | % | 1.10 | % | 8.78 | %4 | ||||||||||||
Fee waiver | 0.26 | %5 | 0.40 | %5 | 0.38 | %5 | 0.45 | %5 | 8.13 | %4,5 | ||||||||||||
Expense offset arrangement | 0.00 | %6 | 0.00 | %6 | 0.00 | %6 | 0.00 | %6 | 0.00 | %4,6 | ||||||||||||
Ratio of expenses to average net assets after reductions | 0.65 | % | 0.65 | % | 0.65 | % | 0.65 | % | 0.65 | %4 | ||||||||||||
Ratio of net investment income to average net assets | 2.07 | % | 2.16 | % | 1.73 | % | 1.43 | % | 1.43 | %4 | ||||||||||||
Portfolio turnover rate | 146 | % | 125 | % | 77 | % | 142 | % | 91 | %3 | ||||||||||||
Portfolio turnover rate7 | 52 | % | 64 | % | 40 | % | 83 | % | 56 | %3 | ||||||||||||
| 1 | Calculated using average shares outstanding for the period. |
| 2 | Less than $0.01. |
| 3 | Not annualized. |
| 4 | Annualized with the exception of audit fees and registration fees. |
| 5 | The ratio of expenses to average net assets for the years ended October 31, 2018, 2017, 2016 and 2015 and the period ended October 31, 2014, reflect fees reduced as result of a contractual operating expense limitation of the share class to 0.65%. The agreement is effective for period beginning on April 1, 2014 and will terminate on March 1, 2019, unless it is renewed by all parties to the agreement. For the years ended October 31, 2018, 2017, 2016 and 2015 and the period from April 1, 2014 to October 31, 2014, the waived fees were $63,024, $78,871, $92,199, $71,871 and $47,942, respectively. |
| 6 | Less than 0.01%. |
| 7 | The portfolio turnover rate excludes variable rate demand notes. |
The accompanying notes are an integral part of these financial statements.
BBH INTERMEDIATE MUNICIPAL BOND FUND
FINANCIAL HIGHLIGHTS (continued)
Selected per share data and ratios for a Class I share outstanding throughout each period.
For the years ended October 31, | For the period from April 1, 2014 (commencement of operations) to October 31, 2014 | |||||||||||||||||||||
| 2018 | 2017 | 2016 | 2015 | |||||||||||||||||||
Net asset value, beginning of period | $ | 10.47 | $ | 10.55 | $ | 10.28 | $ | 10.30 | $ | 10.00 | ||||||||||||
Income from investment operations: | ||||||||||||||||||||||
Net investment income1 | 0.23 | 0.25 | 0.20 | 0.18 | 0.09 | |||||||||||||||||
Net realized and unrealized gain (loss) | (0.24 | ) | 0.09 | 0.29 | 0.06 | 0.30 | ||||||||||||||||
Total income (loss) from investment operations | (0.01 | ) | 0.34 | 0.49 | 0.24 | 0.39 | ||||||||||||||||
Less dividends and distributions: | ||||||||||||||||||||||
From net investment income | (0.22 | ) | (0.27 | ) | (0.20 | ) | (0.18 | ) | (0.09 | ) | ||||||||||||
From net realized gains | (0.10 | ) | (0.15 | ) | (0.02 | ) | (0.08 | ) | — | |||||||||||||
Total dividends and distributions | (0.32 | ) | (0.42 | ) | (0.22 | ) | (0.26 | ) | (0.09 | ) | ||||||||||||
Short-term redemption fees1 | — | 0.00 | 2 | 0.00 | 2 | 0.00 | 2 | — | ||||||||||||||
Net asset value, end of period | $ | 10.14 | $ | 10.47 | $ | 10.55 | $ | 10.28 | $ | 10.30 | ||||||||||||
Total return | (0.12 | )% | 3.36 | % | 4.80 | % | 2.33 | % | 3.89 | %3 | ||||||||||||
Ratios/Supplemental data: | ||||||||||||||||||||||
Net assets, end of period (in millions) | $129 | $71 | $66 | $66 | $52 | |||||||||||||||||
Ratio of expenses to average net assets before reductions | 0.62 | % | 0.69 | % | 0.68 | % | 0.78 | % | 0.88 | %4 | ||||||||||||
Fee waiver | 0.12 | %5 | 0.19 | %5 | 0.18 | %5 | 0.28 | %5 | 0.38 | %4,5 | ||||||||||||
Expense offset arrangement | 0.00 | %6 | 0.00 | %6 | 0.00 | %6 | 0.00 | %6 | 0.00 | %4,6 | ||||||||||||
Ratio of expenses to average net assets after reductions | 0.50 | % | 0.50 | % | 0.50 | % | 0.50 | % | 0.50 | %4 | ||||||||||||
Ratio of net investment income to average net assets | 2.23 | % | 2.46 | % | 1.88 | % | 1.72 | % | 1.49 | %4 | ||||||||||||
Portfolio turnover rate | 146 | % | 125 | % | 77 | % | 142 | % | 91 | %3 | ||||||||||||
Portfolio turnover rate7 | 52 | % | 64 | % | 40 | % | 83 | % | 56 | %3 | ||||||||||||
| 1 | Calculated using average shares outstanding for the period. |
| 2 | Less than $0.01. |
| 3 | Not annualized. |
| 4 | Annualized with the exception of audit fees and registration fees. |
| 5 | The ratio of expenses to average net assets for the years ended October 31, 2018, 2017, 2016 and 2015 and the period ended October 31, 2014, reflect fees reduced as result of a contractual operating expense limitation of the share class to 0.50%. The agreement is effective for period beginning on April 1, 2014 and will terminate on March 1, 2019, unless it is renewed by all parties to the agreement. For the years ended October 31, 2018, 2017, 2016 and 2015 and the period from April 1, 2014 to October 31, 2014, the waived fees were $111,441, $123,485, $121,168, $163,323 and $137,383, respectively. |
| 6 | Less than 0.01%. |
| 7 | The portfolio turnover rate excludes variable rate demand notes. |
The accompanying notes are an integral part of these financial statements.
financial statements october 31, 2018 | 27 |
BBH INTERMEDIATE MUNICIPAL BOND FUND
NOTES TO FINANCIAL STATEMENTS
October 31, 2018
1. | Organization. The Fund is a separate, diversified series of BBH Trust (the “Trust”), which is registered under the Investment Company Act of 1940, as amended (the “1940 Act”), as an open-end management investment company. The Trust was originally organized under the laws of the State of Maryland on July 16, 1990 as BBH Fund, Inc. and re-organized as a Delaware statutory trust on June 12, 2007. The Fund commenced operations on April 1, 2014. The Fund offers Class N shares and Class I shares. Class N and Class I shares have different operating expenses. With the exception of class specific expenses, all expenses are allocated between classes based on net assets. Neither Class N shares nor Class I shares automatically convert to any other share class of the Fund. As of October 31, 2018, there were seven series of the Trust. |
2. | Significant Accounting Policies. The Fund’s financial statements are prepared in accordance with Generally Accepted Accounting Principles in the United States of America (“GAAP”). The Fund is an investment company and accordingly follows the investment company accounting and reporting guidance of the Financial Accounting Standards Board (“FASB”) Accounting Standard Codification Topic 946 Financial Services — Investment Companies. The following summarizes significant accounting policies of the Fund: |
A. | Valuation of Investments. Prices of municipal bonds are provided by an external pricing service approved by the Fund’s Board of Trustees (the “Board”). These securities are generally classified as Level 2. The evaluated vendor pricing is based on methods that may include consideration of the following: yields or prices of municipal securities of comparable quality, type of issue, coupon, maturity and rating, market quotes or indications of value from security dealers, evaluations of anticipated cash flows or collateral, general market conditions and other information and analysis, including the obligor’s credit characteristics considered relevant. |
B. | Accounting for Investments and Income. Investment transactions are accounted for on the trade date. Realized gains and losses on investment transactions are determined based on the identified cost method. Interest income is accrued daily and consists of interest accrued, discount earned (including, if any, both original issue and market discount) and premium amortization on the investments of the Fund. Debt obligations may be placed on non-accrual status and related interest income may be reduced by ceasing current accruals and writing off interest receivable when the |
BBH INTERMEDIATE MUNICIPAL BOND FUND
NOTES TO FINANCIAL STATEMENTS (continued)
October 31, 2018
| collection of all or a portion of the interest has become doubtful based on consistently applied procedures. A debt obligation is removed from non-accrual status when the issuer resumes interest payments or when collectability of interest is reasonably assured. |
C. | Fund Expenses. Most expenses of the Trust can be directly attributed to a specific fund. Expenses which cannot be directly attributed to a fund are apportioned amongst each fund in the Trust on a net assets basis. Expense estimates are accrued in the period to which they relate and adjustments are made when actual amounts are known. |
D. | Federal Income Taxes. It is the Trust’s policy to comply with the requirements of the Internal Revenue Code (the “Code”) applicable to regulated investment companies and to distribute substantially all of its taxable income to its shareholders. Accordingly, no federal income tax provision is required. The Fund files a tax return annually using tax accounting methods required under provisions of the Code, which may differ from GAAP, which is the basis on which these financial statements are prepared. Accordingly, the amount of net investment income and net realized gain reported in these financial statements may differ from that reported on the Fund’s tax return, due to certain book-to-tax timing differences such as losses deferred due to “wash sale” transactions and utilization of capital loss carryforwards. These differences may result in temporary over-distributions for financial statement purposes and are classified as distributions in excess of accumulated net realized gains or net investment income. These distributions do not constitute a return of capital. Permanent differences are reclassified between paid-in capital and retained earnings/(accumulated deficit) within the Statement of Assets and Liabilities based upon their tax classification. As such, the character of distributions to shareholders reported in the Financial Highlights table may differ from that reported to shareholders on Form 1099-DIV. |
E. | Dividends and Distributions to Shareholders. Dividends and distributions from net investment income to shareholders, if any, are paid monthly and are recorded on the ex-dividend date. Distributions from net capital gains, if any, are generally declared and paid annually and are recorded |
financial statements october 31, 2018 | 29 |
BBH INTERMEDIATE MUNICIPAL BOND FUND
NOTES TO FINANCIAL STATEMENTS (continued)
October 31, 2018
| on the ex-dividend date. The Fund declared dividends in the amount of $666,803 and $2,793,710 to Class N and Class I shareholders, respectively, during the year ended October 31, 2018. In addition, the Fund designated a portion of the payment made to redeeming shareholders as a distribution for income tax purpose. |
| Distributions paid from: | ||||||||||||||||||||||||
| Ordinary income | Net long-term capital gain | Total taxable distributions | Tax exempt income | Tax return of capital | Total distributions paid | |||||||||||||||||||
2018: | $ | 137,628 | $ | 698,195 | $ | 835,823 | $ | 2,624,690 | $ | — | $ | 3,460,513 | ||||||||||||
2017: | 795,101 | 705,293 | 1,500,394 | 1,839,910 | — | 3,340,304 | ||||||||||||||||||
| Components of retained earnings/(accumulated deficit): | ||||||||||||||||||||||||||||
| Undistributed ordinary income | Undistributed long-term capital gain | Retained earnings/ (accumulated deficit) | Accumulated capital and other losses | Other book/tax temporary differences | Book unrealized appreciation/ (depreciation) | Total retained earnings/ (accumulated deficit) | ||||||||||||||||||||||
2018: | $ | — | $ | 251,888 | $ | 251,888 | $ | — | $ | (2,775 | ) | $ | (1,015,158 | ) | $ | (766,045 | ) | |||||||||||
2017: | 108,314 | 697,168 | 805,482 | — | — | 2,111,043 | 2,916,525 | |||||||||||||||||||||
F. | Use of Estimates. The preparation of financial statements in accordance with GAAP requires management to make estimates and assumptions that affect the reported amounts of assets and liabilities in the financial statements, disclosure of contingent assets and liabilities at the date of |
BBH INTERMEDIATE MUNICIPAL BOND FUND
NOTES TO FINANCIAL STATEMENTS (continued)
October 31, 2018
| the financial statements and the reported amounts of increases and decreases in net assets from operations during the reporting period. Actual results could differ from these estimates. |
3. | Fees and Other Transactions with Affiliates. |
A. | Investment Advisory and Administrative Fees. Effective April 1, 2014 (commencement of operations), under a combined Investment Advisory and Administrative Services Agreement (“Agreement”) with the Trust, Brown Brothers Harriman & Co. (“BBH”) through a separately identifiable department (“SID” or “Investment Adviser”) provides investment advisory, portfolio management and administrative services to the Fund. The Fund’s investment advisory and administrative services fee is calculated daily and paid monthly at an annual rate equivalent to 0.40% of the Fund’s average daily net assets. For the year ended October 31, 2018, the Fund incurred $483,526 under the Agreement. |
B. | Investment Advisory and Administrative Fee Waiver. Effective April 1, 2014 (commencement of operations), the Investment Adviser contractually agreed to limit the annual fund operating expenses (excluding interest, taxes, brokerage commissions, other expenditures that are capitalized in accordance with GAAP and other extraordinary expenses not incurred in the ordinary course of the Fund’s business) of Class N and Class I to 0.65% and 0.50%, respectively. The agreement will terminate on March 1, 2019, unless it is renewed by all parties to the agreement. The agreement may only be terminated during its term with approval of the Fund’s Board of Trustees. For the year ended October 31, 2018, the Investment Adviser waived fees in the amount of $63,024 and $111,441 for Class N and Class I, respectively. |
C. | Shareholder Servicing Fees. The Trust has a shareholder servicing agreement with BBH. BBH receives a fee from the Fund calculated daily and paid monthly at an annual rate of 0.20% of Class N shares’ average daily net assets. For the year ended October 31, 2018, Class N shares of the Fund incurred $49,295 in shareholder servicing fees. |
D. | Custody and Fund Accounting Fees. BBH acts as a custodian and fund accountant and receives custody and fund accounting fees from the Fund calculated daily and incurred monthly. BBH holds all of the Fund’s cash and investments and calculates the Fund’s daily net asset value. The custody fee is an asset and transaction-based fee. The fund accounting fee is an asset-based fee calculated at 0.004% of the Fund’s net asset value. For the year ended October 31, 2018, the Fund incurred $50,770 in custody and fund accounting fees. These fees for the Fund were reduced by $1,686 as a result of an expense offset arrangement with the Fund’s custodian. The credit amount (if any) is disclosed in the Statement of Operations as a reduction to the Fund’s expenses. In the event that the Fund is overdrawn, under the custody agreement with BBH, BBH will make overnight loans |
financial statements october 31, 2018 | 31 |
BBH INTERMEDIATE MUNICIPAL BOND FUND
NOTES TO FINANCIAL STATEMENTS (continued)
October 31, 2018
| to the Fund to cover overdrafts. Pursuant to their agreement, the Fund will pay the Federal Funds overnight investment rate on the day of the overdraft. The total interest incurred by the Fund for the year ended October 31, 2018, was $937. This amount is included under line item “Custody and Fund Accounting Fees” in the Statement of Operations. |
E. | Board of Trustees’ Fees. Each Trustee who is not an “interested person” as defined under the 1940 Act receives an annual fee as well as reimbursement for reasonable out-of-pocket expenses from the Fund. For the year ended October 31, 2018, the Fund incurred $52,909 in independent Trustee compensation and reimbursements. |
F. | Officers of the Trust. Certain officers of the Trust are also employees of BBH. Such officers are paid no fees by the Trust for their services to the Trust. |
4. | Investment Transactions. For the year ended October 31, 2018, the cost of purchases and the proceeds of sales of investment securities, other than short-term investments, was $255,522,415 and $180,008,895, respectively. |
5. | Shares of Beneficial Interest. The Trust is permitted to issue an unlimited number of Class N shares and Class I shares of beneficial interest, at no par value. Transactions in Class N and Class I shares were as follows: |
| For the year ended October 31, 2018 | For the year ended October 31, 2017 | ||||||||||||||||||
| Shares | Dollars | Shares | Dollars | ||||||||||||||||
Class N | |||||||||||||||||||
Shares sold | 2,386,419 | $ | 24,480,357 | 453,720 | $ | 4,704,644 | |||||||||||||
Shares issued in connection with reinvestments of dividends | 61,257 | 629,099 | 61,745 | 633,673 | |||||||||||||||
Proceeds from short-term redemption fees | N/A | 296 | N/A | 118 | |||||||||||||||
Shares redeemed | (592,779 | ) | (6,086,123 | ) | (1,188,349 | ) | (12,342,086 | ) | |||||||||||
Net increase (decrease) | 1,854,897 | $ | 19,023,629 | (672,884 | ) | $ | (7,003,651 | ) | |||||||||||
Class I | |||||||||||||||||||
Shares sold | 10,188,802 | $ | 104,236,771 | 1,700,059 | $ | 17,624,316 | |||||||||||||
Shares issued in connection with reinvestments of dividends | 97,549 | 1,001,989 | 73,690 | 761,026 | |||||||||||||||
Proceeds from short-term redemption fees | N/A | — | N/A | 28 | |||||||||||||||
Shares redeemed | (4,405,710 | ) | (45,045,252 | ) | (1,227,128 | ) | (12,610,972 | ) | |||||||||||
Net increase | 5,880,641 | $ | 60,193,508 | 546,621 | $ | 5,774,398 | |||||||||||||
BBH INTERMEDIATE MUNICIPAL BOND FUND
NOTES TO FINANCIAL STATEMENTS (continued)
October 31, 2018
6. | Principal Risk Factors and Indemnifications. |
A. | Principal Risk Factors. Investing in the Fund may involve certain risks, as discussed in the Fund’s prospectus, including but not limited to, those described below: |
financial statements october 31, 2018 | 33 |
BBH INTERMEDIATE MUNICIPAL BOND FUND
NOTES TO FINANCIAL STATEMENTS (continued)
October 31, 2018
Fund’s shareholders (shareholder concentration risk). The extent of the Fund’s exposure to these risks in respect to these financial assets is included in their value as recorded in the Fund’s Statement of Assets and Liabilities.
B. | Indemnifications. Under the Trust’s organizational documents, its officers and Trustees may be indemnified against certain liabilities and expenses arising out of the performance of their duties to the Fund, and shareholders are indemnified against personal liability for the obligations of the Trust. Additionally, in the normal course of business, the Fund enters into agreements with service providers that may contain indemnification clauses. The Fund’s maximum exposure under these arrangements is unknown as this would involve future claims that may be made against the Fund that have not yet occurred. The risk of material loss from such claims is considered remote. |
7. | Recent pronouncements. |
A. | ASU 2017-08. In March 2017, the Financial Accounting Standards Board issued an Accounting Standards Update, ASU 2017-08, Receivables — Nonrefundable Fees and Other Costs (Subtopic 310-20), Premium Amortization on Purchased Callable Debt Securities (the “ASU 2017-08”) which amends the amortization period for certain purchased callable debt securities held at a premium, shortening such period to the earliest call date. The ASU 2017-08 does not require any accounting change for debt securities held at a discount; the discount continues to be amortized to maturity. The ASU 2017-08 is effective for years, and interim periods within those years, beginning after December 15, 2018. Management is currently evaluating the application of ASU 2017-08 and its impact, if any, on the Fund’s financial statements. |
B. | ASU 2018-13. On August 28, 2018, the Financial Accounting Standards Board issued an Accounting Standards Update, ASU 2018-13, Fair Value Measurement (Topic 820): Disclosure Framework-Changes to the Disclosure Requirements for Fair Value Measurement (the “ASU 2018-13”). ASU 2018-13 modifies the disclosure objective paragraphs of Accounting Standard Codification 820 to eliminate (1) “at a minimum” from the phrase “an entity shall disclose at a minimum” and (2) other similar “open ended” disclosure requirements to promote the appropriate exercise of discretion by entities. ASU 2018-13 also eliminates and modifies other requirements under ASU 2018-13. ASU 2018-13 is effective for all entities for fiscal years, and interim periods within those fiscal years, beginning after December 15, 2019. Early application is permitted and Management is currently evaluating the application of ASU 2018-13 and its impact, if any, on the Fund’s financial statements. |
BBH INTERMEDIATE MUNICIPAL BOND FUND
NOTES TO FINANCIAL STATEMENTS (continued)
October 31, 2018
C. | Regulation S-X. In October 2018, the U.S. Securities and Exchange Commission adopted amendments to certain disclosure requirements that had become “redundant, duplicative, overlapping, outdated or superseded, in light of the other Commission disclosure requirements, U.S. GAAP or changes in the information environment”. The compliance date for the amendments to Regulation S-X is November 5, 2018 (for reporting period end dates of September 30, 2018 and after). |
8. | Subsequent Events. Management has evaluated events and transactions that have occurred since October 31, 2018 through the date the financial statements were issued and determined that there were none that would require recognition or additional disclosure in the financial statements. |
financial statements october 31, 2018 | 35 |
BBH INTERMEDIATE MUNICIPAL BOND FUND
DISCLOSURE OF FUND EXPENSES
October 31, 2018 (unaudited)
BBH INTERMEDIATE MUNICIPAL BOND FUND
DISCLOSURE OF FUND EXPENSES (continued)
October 31, 2018 (unaudited)
| Beginning Account Value May 1, 2018 | Ending Account Value October 31, 2018 | Expenses Paid During Period May 1, 2018 to October 31, 20181 | ||||||||||||
Class N | ||||||||||||||
Actual | $ | 1,000 | $ | 1,006 | $ | 3.29 | ||||||||
Hypothetical2 | $ | 1,000 | $ | 1,022 | $ | 3.31 | ||||||||
| Beginning Account Value May 1, 2018 | Ending Account Value October 31, 2018 | Expenses Paid During Period May 1, 2018 to October 31, 20181 | ||||||||||||
Class I | ||||||||||||||
Actual | $ | 1,000 | $ | 1,008 | $ | 2.53 | ||||||||
Hypothetical2 | $ | 1,000 | $ | 1,023 | $ | 2.55 | ||||||||
| 1 | Expenses are equal to the Fund’s annualized expense ratio of 0.65% and 0.50% for Class N and I shares, respectively, multiplied by the average account value over the period, multiplied by 184/365 (to reflect the one-half year period). |
| 2 | Assumes a return of 5% before expenses. For the purposes of the calculation, the applicable annualized expenses ratio for each class of shares is subtracted from the assumed return before expenses. |
financial statements october 31, 2018 | 37 |
BBH INTERMEDIATE MUNICIPAL BOND FUND
CONFLICT OF INTEREST
October 31, 2018 (unaudited)
BBH INTERMEDIATE MUNICIPAL BOND FUND
CONFLICT OF INTEREST (continued)
October 31, 2018 (unaudited)
financial statements october 31, 2018 | 39 |
BBH INTERMEDIATE MUNICIPAL BOND FUND
CONFLICT OF INTEREST (continued)
October 31, 2018 (unaudited)
BBH INTERMEDIATE MUNICIPAL BOND FUND
CONFLICT OF INTEREST (continued)
October 31, 2018 (unaudited)
Investment Adviser in the investment decision-making process (including with respect to futures, fixed price offerings and over-the-counter transactions). The use of a broker that provides research and securities transaction services may result in a higher commission than that offered by a broker who does not provide such services. The Investment Adviser will determine in good faith whether the amount of commission is reasonable in relation to the value of research and services provided and whether the services provide lawful and appropriate assistance in its investment decision-making responsibilities.
financial statements october 31, 2018 | 41 |
BBH INTERMEDIATE MUNICIPAL BOND FUND
CONFLICT OF INTEREST (continued)
October 31, 2018 (unaudited)
BBH INTERMEDIATE MUNICIPAL BOND FUND
CONFLICT OF INTEREST (continued)
October 31, 2018 (unaudited)
financial statements october 31, 2018 | 43 |
BBH INTERMEDIATE MUNICIPAL BOND FUND
ADDITIONAL FEDERAL TAX INFORMATION
October 31, 2018 (unaudited)
TRUSTEES AND OFFICERS OF BBH INTERMEDIATE MUNICIPAL BOND FUND
(unaudited)
| Name and Birth Year | | Position(s) Held with the Trust | | Term of Office and Length of Time Served# | | Principal Occupation(s) During Past 5 Years | | Number of Portfolios in Fund Complex Overseen by Trusteeˆ | | Other Public Company or Investment Company Directorships held by Trustee During Past 5 Years | ||
Independent Trustees | ||||||||||||
H. Whitney Wagner Birth Year: 1956 | Chairman of the Board and Trustee | Chairman Since 2014; Trustee Since 2007 and 2006-2007 with the Predecessor Trust | President, Clear Brook Advisors, a registered investment adviser. | 7 | None. | |||||||
Andrew S. Frazier Birth Year: 1948 | Trustee | Since 2010 | Retired. | 7 | Director of Western World Insurance Group, Inc. | |||||||
Mark M. Collins Birth Year: 1956 | �� | Trustee | Since 2011 | Partner of Brown Investment Advisory Incorporated, a registered investment adviser. | 7 | Chairman of Dillon Trust Company. | ||||||
John M. Tesoro Birth Year: 1952 | Trustee | Since 2014 | Retired. | 7 | Trustee, Bridge Builder Trust (8 Funds) Director of Teton Advisors, Inc. (a registered investment adviser). |
financial statements october 31, 2018 | 45 |
TRUSTEES AND OFFICERS OF BBH INTERMEDIATE MUNICIPAL BOND FUND
(unaudited)
| Name, Address and Birth Year | | Position(s) Held with the Trust | | Term of Office and Length of Time Served# | | Principal Occupation(s) During Past 5 Years | | Number of Portfolios in Fund Complex Overseen by Trusteeˆ | | Other Public Company or Investment Company Directorships held by Trustee During Past 5 Years | ||
Interested Trustees | ||||||||||||
Susan C. Livingston+ 50 Post Office Square Boston, MA 02110 Birth Year: 1957 | Trustee | Since 2011 | Partner (since 1998) and Senior Client Advocate (since 2010) for BBH&Co.; Director of BBH Luxembourg S.C.A. (since 1992). | 7 | None. | |||||||
John A. Gehret+ 140 Broadway New York, NY 10005 Birth Year: 1959 | Trustee | Since 2011 | Limited Partner of BBH&Co. (2012-present); Director of BBH Luxembourg Funds (since 2012); Director of BBH Trust Company (Cayman) Ltd. (since 2012). | 7 | None. |
TRUSTEES AND OFFICERS OF BBH INTERMEDIATE MUNICIPAL BOND FUND
(unaudited)
| Name, Address and Birth Year | | Position(s) Held with the Trust | | Term of Office and Length of Time Served# | | Principal Occupation(s) During Past 5 Years |
Officers | ||||||
Jean-Pierre Paquin 140 Broadway New York, NY 10005 Birth Year: 1973 | President and Principal Executive Officer | Since 2016 | Partner of BBH&Co. since 2015; joined BBH&Co. in 1996. | |||
Daniel Greifenkamp 140 Broadway New York, NY 10005 Birth Year: 1969 | Vice President | Since 2016 | Managing Director of BBH&Co. since 2014; joined BBH&Co. in 2011. | |||
Charles H. Schreiber 140 Broadway New York, NY 10005 Birth Year: 1957 | Treasurer and Principal Financial Officer | Since 2007 2006-2007 with the Predecessor Trust | Senior Vice President of BBH&Co. since 2001; joined BBH&Co. in 1999. | |||
Paul F. Gallagher 140 Broadway New York, NY 10005 Birth Year: 1959 | Chief Compliance Officer (“CCO”) | Since 2015 | Senior Vice President of BBH&Co. since September 2015; Executive Director, Counsel, Morgan Stanley Smith Barney LLC (2009-September 2015). | |||
Keith M. Kelley 50 Post Office Square Boston, MA 02110 Birth Year: 1983 | Anti-Money Laundering Officer (“AMLO”) | Since 2016 | Vice President of BBH&Co. since February 2016; joined BBH&Co. in 2016; Director, Legal and Compliance, Morgan Stanley Smith Barney LLC (2014-February 2016); Compliance Manager, State Street Corporation (2013-2014). |
financial statements october 31, 2018 | 47 |
TRUSTEES AND OFFICERS OF BBH INTERMEDIATE MUNICIPAL BOND FUND
(unaudited)
| Name, Address and Birth Year | | Position(s) Held with the Trust | | Term of Office and Length of Time Served# | | Principal Occupation(s) During Past 5 Years |
Suzan M. Barron 50 Post Office Square Boston, MA 02110 Birth Year: 1964 | Secretary | Since 2009 | Senior Vice President and Senior Investor Services Counsel, BBH&Co. since 2005. | |||
Crystal Cheung 140 Broadway New York, NY 10005 Birth Year: 1974 | Assistant Treasurer | Since 2018 | Assistant Vice President of BBH&Co. since 2016; joined BBH&Co. in 2014; Financial Reporting Manager, BNY Mellon Corporation (2010-2014). | |||
Brian J. Carroll 50 Post Office Square Boston, MA 02110 Birth Year: 1985 | Assistant Secretary | Since 2018 | Associate and Investor Services Assistant Counsel of BBH&Co. since 2017; joined BBH&Co. in 2014. |
# | All officers of the Trust hold office for one year and until their respective successors are chosen and qualified (subject to the ability of the Trustees to remove any officer in accordance with the Trust’s By-laws). Mr. Wagner previously served on the Board of Trustees of the Predecessor Trust. |
+ | Ms. Livingston and Mr. Gehret are “interested persons” of the Trust as defined in the 1940 Act because of their positions as Partner and Limited Partner of BBH&Co., respectively. |
ˆ | The Fund Complex consists of the Trust, which has seven series, and each is counted as one “Portfolio” for purposes of this table. |
Administrator Brown Brothers Harriman & Co. 140 Broadway New York, NY 10005 Distributor ALPS Distributors, Inc. 1290 Broadway, Suite 1100 Denver, CO 80203 Shareholder Servicing Agent Brown Brothers Harriman & Co. 140 Broadway New York, NY 10005 1-800-575-1265 | Investment Adviser Brown Brothers Harriman Mutual Fund Advisory Department 140 Broadway New York, NY 10005 | |||||
By telephone: | Call 1-800-575-1265 | |||||
By E-mail send your request to: | bbhfunds@bbh.com | |||||
On the internet: | www.bbhfunds.com | |||||
BBH INCOME FUND
MANAGEMENT’S DISCUSSION OF FUND PERFORMANCE
October 31, 2018
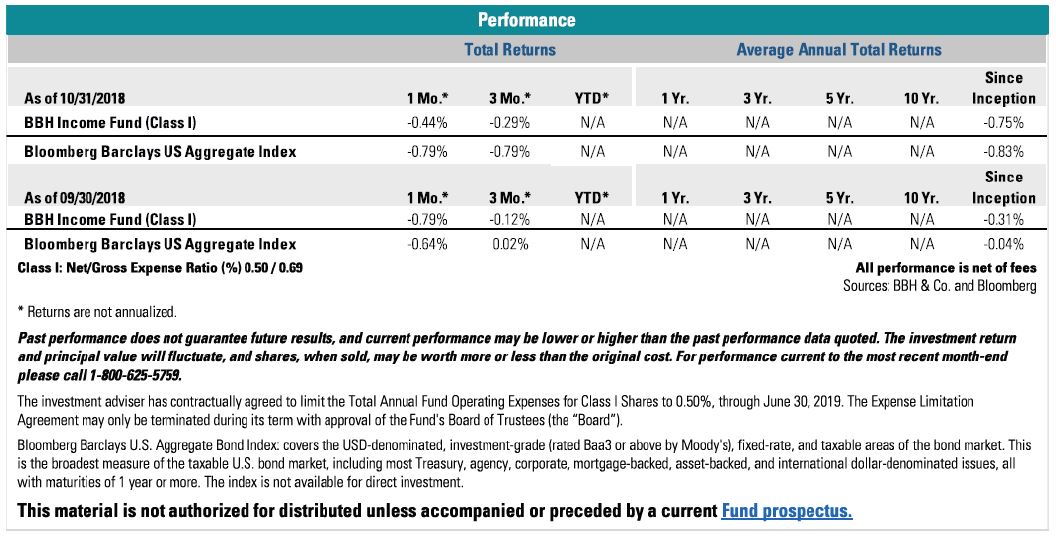 |
BBH INCOME FUND
MANAGEMENT’S DISCUSSION OF FUND PERFORMANCE (continued)
October 31, 2018
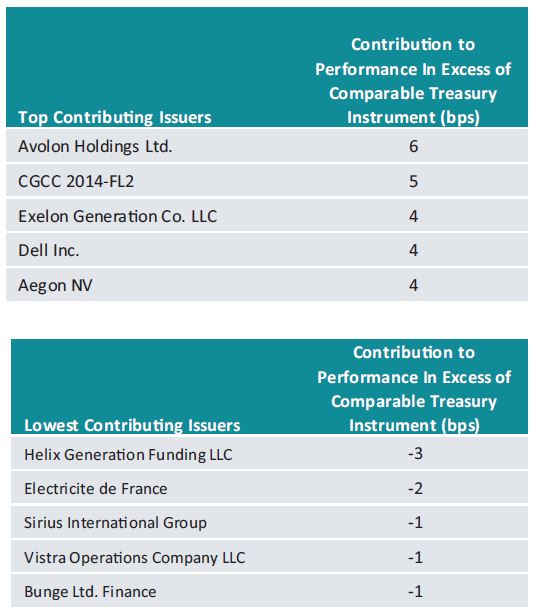
financial statements october 31, 2018 | 3 |
BBH INCOME FUND
MANAGEMENT’S DISCUSSION OF FUND PERFORMANCE (continued)
October 31, 2018
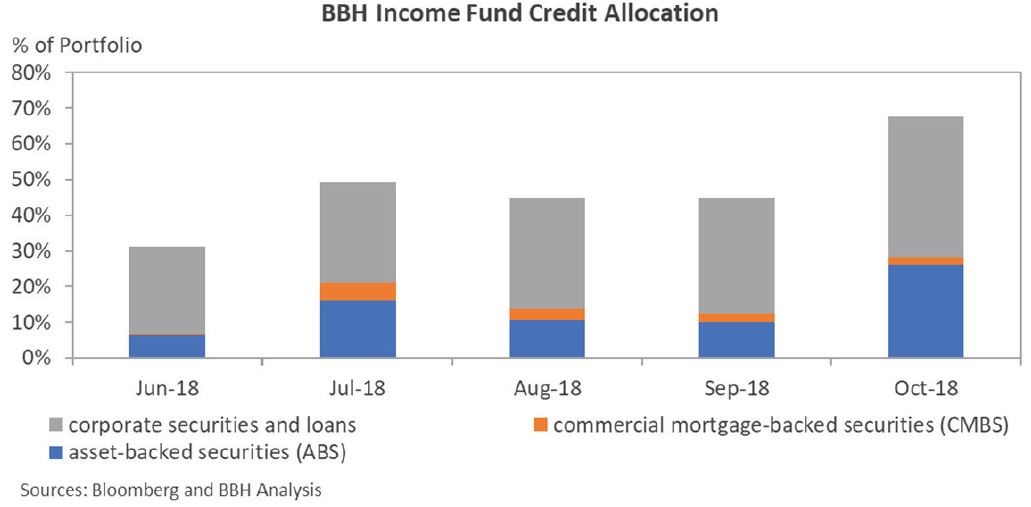
BBH INCOME FUND
MANAGEMENT’S DISCUSSION OF FUND PERFORMANCE (continued)
October 31, 2018
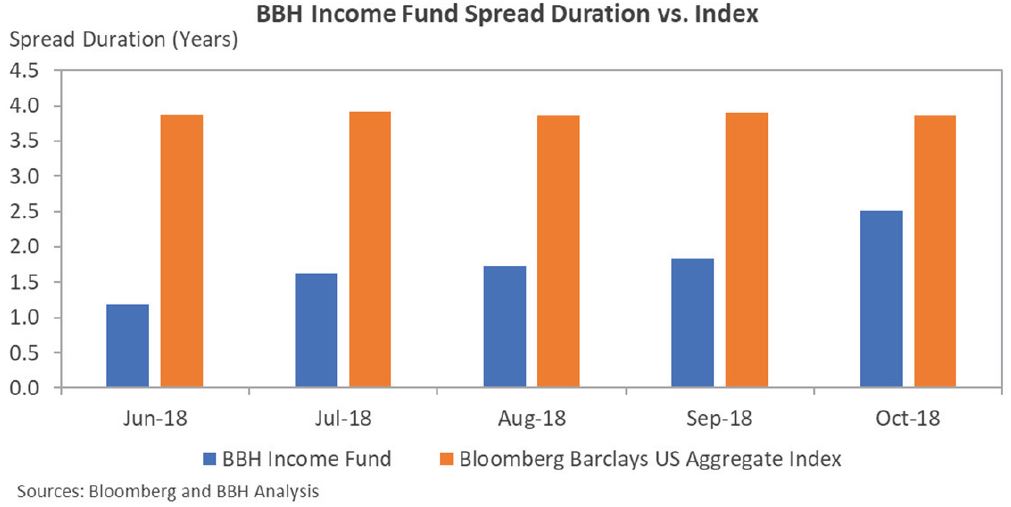
financial statements october 31, 2018 | 5 |
BBH INCOME FUND
MANAGEMENT’S DISCUSSION OF FUND PERFORMANCE (continued)
October 31, 2018
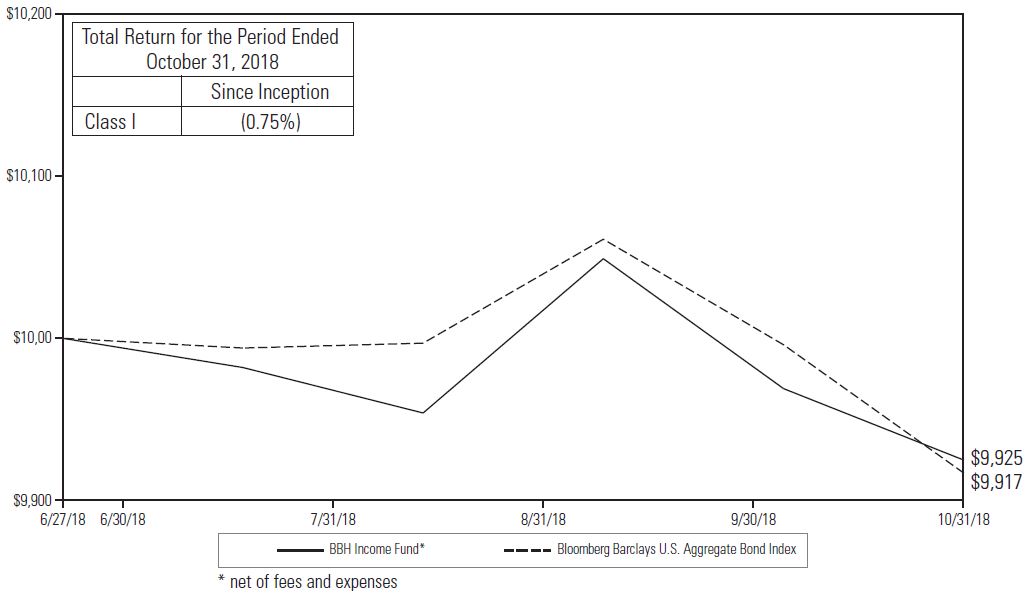 |
| 1 | The Fund’s performance assumes the reinvestment of all dividends and distributions. The Bloomberg Barclays U.S. Aggregate Bond Index has been adjusted to reflect reinvestment of dividends on securities in the index. The Bloomberg Barclays U.S. Aggregate Bond Index is not adjusted to reflect sales charges, expenses or other fees that the Securities and Exchange Commission requires to be reflected in the Fund’s performance. The index is unmanaged. Investments cannot be made in the index. |
BBH INCOME FUND
REPORT OF INDEPENDENT REGISTERED PUBLIC ACCOUNTING FIRM
|
December 21, 2018
financial statements october 31, 2018 | 7 |
BBH INCOME FUND
PORTFOLIO ALLOCATION
October 31, 2018
| U.S. $ Value | Percent of Net Assets | |||||||||
Asset Backed Securities | $ | 37,425,142 | 25.5 | % | ||||||
Commercial Mortgage Backed Securities | 3,250,087 | 2.2 | ||||||||
Corporate Bonds | 29,554,403 | 20.2 | ||||||||
Loan Participations and Assignments | 26,596,679 | 18.1 | ||||||||
U.S. Government Agency Obligations | 8,000,000 | 5.5 | ||||||||
U.S. Treasury Bonds and Notes | 46,778,427 | 31.9 | ||||||||
Liabilities in Excess of Other Assets | (5,024,554 | ) | (3.4 | ) | ||||||
NET ASSETS | $ | 146,580,184 | 100.0 | % | ||||||
The accompanying notes are an integral part of these financial statements.
BBH INCOME FUND
PORTFOLIO OF INVESTMENTS
October 31, 2018
| Principal Amount | Maturity Date | Interest Rate | Value | |||||||||||||
ASSET BACKED SECURITIES (25.5%) | ||||||||||||||||
| $ 1,380,000 | Adams Outdoor Advertising LP 2018-11 | 11/15/48 | 4.810 | % | $ | 1,376,527 | ||||||||||
| 1,450,000 | ARI Fleet Lease Trust 2018-B1 | 08/16/27 | 3.220 | 1,447,247 | ||||||||||||
| 1,350,000 | AXIS Equipment Finance Receivables VI LLC 2018-2A1 | 07/20/22 | 3.890 | 1,350,114 | ||||||||||||
| 1,360,000 | Capital Auto Receivables Asset Trust 2018-21 | 02/22/21 | 3.020 | 1,359,674 | ||||||||||||
| 1,252,648 | Cazenovia Creek Funding II LLC 2018-1A1 | 07/15/30 | 3.561 | 1,247,081 | ||||||||||||
| 750,000 | CCG Receivables Trust 2018-21 | 12/15/25 | 3.090 | 747,132 | ||||||||||||
| 550,000 | Drive Auto Receivables Trust 2018-3 | 10/15/20 | 2.750 | 549,588 | ||||||||||||
| 1,200,000 | Elm Trust 2018-2A1 | 10/20/27 | 4.605 | 1,200,880 | ||||||||||||
| 190,000 | Elm Trust 2018-2A1 | 10/20/27 | 5.584 | 190,130 | ||||||||||||
| 600,000 | Enterprise Fleet Financing LLC 2017-21 | 01/20/23 | 2.220 | 586,487 | ||||||||||||
| 1,360,000 | Enterprise Fleet Financing LLC 2018-31 | 05/20/24 | 3.380 | 1,359,835 | ||||||||||||
| 454,980 | Exeter Automobile Receivables Trust 2018-3A1 | 01/18/22 | 2.900 | 454,305 | ||||||||||||
| 1,350,000 | Finance of America Structured Securities Trust 2018-HB11,2,3 | 09/25/28 | 3.774 | 1,348,825 | ||||||||||||
| 1,400,000 | Foursight Capital Automobile Receivables Trust 2018-21 | 04/15/22 | 3.320 | 1,399,971 | ||||||||||||
| 2,700,000 | FREED ABS TRUST 2018-21 | 10/20/25 | 4.610 | 2,695,913 | ||||||||||||
| 1,353,081 | FRS I LLC 2013-1A1 | 04/15/43 | 3.080 | 1,350,091 | ||||||||||||
| 1,000,000 | GM Financial Consumer Automobile Receivables Trust 2017-2A1 | 11/16/22 | 2.070 | 974,540 | ||||||||||||
| 1,390,000 | Hercules Capital Funding Trust 2018-1A1 | 11/22/27 | 4.605 | 1,392,606 | ||||||||||||
| 600,000 | Hertz Vehicle Financing II LP 2016-3A1 | 07/25/20 | 2.270 | 595,926 | ||||||||||||
| 300,000 | Lendmark Funding Trust 2017-2A1 | 05/20/26 | 2.800 | 295,380 | ||||||||||||
| 596,641 | LIAS Administration Fee Issuer LLC 2018-1A | 07/25/48 | 5.956 | 596,641 | ||||||||||||
| 205,000 | Mariner Finance Issuance Trust 2017-BA1 | 12/20/29 | 2.920 | 201,815 | ||||||||||||
| 300,000 | Nationstar HECM Loan Trust 2018-2A1,2,3 | 07/25/28 | 3.552 | 299,040 | ||||||||||||
| 300,000 | NextGear Floorplan Master Owner Trust 2017-1A1 | 04/18/22 | 2.540 | 296,684 | ||||||||||||
| 1,370,000 | NextGear Floorplan Master Owner Trust 2018-2A1 | 10/16/23 | 3.690 | 1,373,744 | ||||||||||||
The accompanying notes are an integral part of these financial statements.
financial statements october 31, 2018 | 9 |
BBH INCOME FUND
PORTFOLIO OF INVESTMENTS (continued)
October 31, 2018
| Principal Amount | Maturity Date | Interest Rate | Value | |||||||||||||
| ASSET BACKED SECURITIES (continued) | ||||||||||||||||
| $ 600,000 | Ocwen Master Advance Receivables Trust Series 2018-T11 | 08/15/49 | 3.301 | % | $ | 599,328 | ||||||||||
| 300,000 | Oportun Funding IX LLC 2018-B1 | 07/08/24 | 3.910 | 298,518 | ||||||||||||
| 2,660,000 | Oportun Funding X LLC 2018-C1 | 10/08/24 | 4.590 | 2,659,354 | ||||||||||||
| 550,000 | OSCAR US Funding Trust IX LLC 2018-2A1 | 09/12/22 | 3.390 | 547,098 | ||||||||||||
| 1,500,000 | PFS Financing Corp. 2018-F1 | 10/16/23 | 3.520 | 1,497,754 | ||||||||||||
| 720,000 | SPS Servicer Advance Receivables Trust Advance Receivables Backed Notes 2018-T11 | 10/17/50 | 3.620 | 719,965 | ||||||||||||
| 600,000 | SWC Funding LLC 2018-1A1,4 | 08/15/33 | 4.750 | 592,470 | ||||||||||||
| 1,400,000 | Synchrony Card Issuance Trust 2018-A1 | 09/15/24 | 3.380 | 1,398,877 | ||||||||||||
| 1,400,000 | Trafigura Securitisation Finance, Plc. 2018-1A1 | 03/15/22 | 3.730 | 1,398,788 | ||||||||||||
| 268,238 | United Auto Credit Securitization Trust 2018-21 | 03/10/21 | 2.890 | 267,970 | ||||||||||||
| 1,360,000 | Veros Automobile Receivables Trust 2018-11 | 05/15/23 | 3.630 | 1,357,892 | ||||||||||||
| 1,400,000 | World Financial Network Credit Card Master Trust 2018-B | 07/15/25 | 3.460 | 1,396,952 | ||||||||||||
| Total Asset Backed Securities (Identified cost $37,465,228) | 37,425,142 | |||||||||||||||
COMMERCIAL MORTGAGE BACKED SECURITIES (2.2%) | ||||||||||||||||
| 149,500 | CG-CCRE Commercial Mortgage Trust 2014-FL2 (1-Month USD-LIBOR + 4.000%)1,2 | 11/15/31 | 6.280 | 147,225 | ||||||||||||
| 786,000 | CG-CCRE Commercial Mortgage Trust 2014-FL2 (1-Month USD-LIBOR + 4.000%)1,2 | 11/15/31 | 6.280 | 777,354 | ||||||||||||
| 600,000 | CGMS Commercial Mortgage Trust 2017-MDRB (1-Month USD-LIBOR + 1.750%)1,2 | 07/15/30 | 4.030 | 599,173 | ||||||||||||
The accompanying notes are an integral part of these financial statements.
BBH INCOME FUND
PORTFOLIO OF INVESTMENTS (continued)
October 31, 2018
| Principal Amount | Maturity Date | Interest Rate | Value | |||||||||||||
COMMERCIAL MORTGAGE BACKED SECURITIES (continued) | ||||||||||||||||
| $ 300,000 | Hospitality Mortgage Trust 2017-HIT (1-Month USD-LIBOR + 0.850%)1,2 | 05/08/30 | 3.131 | % | $ | 300,002 | ||||||||||
| 1,000,000 | Hudsons Bay Simon JV Trust 2015-HB101,2,3 | 08/05/34 | 5.629 | 923,032 | ||||||||||||
| 240,000 | JPMBB Commercial Mortgage Securities Trust 2014-C241,2,3 | 11/15/47 | 3.890 | 206,117 | ||||||||||||
| 300,000 | UBS-BAMLL Trust 2012-WRM1 | 06/10/30 | 3.663 | 297,184 | ||||||||||||
| Total Commercial Mortgage Backed Securities (Identified cost $3,216,112) | 3,250,087 | |||||||||||||||
CORPORATE BONDS (20.2%) | ||||||||||||||||
AGRICULTURE (1.2%) | ||||||||||||||||
| 1,800,000 | Bunge Ltd. Finance Corp. | 03/15/24 | 4.350 | 1,766,526 | ||||||||||||
BANKS (5.0%) | ||||||||||||||||
| 1,600,000 | ANZ New Zealand Int’l Ltd., London Branch1 | 01/25/22 | 2.875 | 1,559,712 | ||||||||||||
| 1,600,000 | ASB Bank, Ltd.1 | 06/14/23 | 3.750 | 1,581,390 | ||||||||||||
| 1,441,000 | BNZ International Funding, Ltd., London Branch1 | 03/01/23 | 3.375 | 1,405,908 | ||||||||||||
| 600,000 | Skandinaviska Enskilda Banken AB | 03/15/21 | 2.625 | 586,674 | ||||||||||||
| 750,000 | Svenska Handelsbanken AB | 05/24/21 | 3.350 | 745,660 | ||||||||||||
| 1,500,000 | Wells Fargo Bank NA (3-Month USD-LIBOR + 0.490%)2 | 07/23/21 | 3.325 | 1,494,822 | ||||||||||||
| 7,374,166 | ||||||||||||||||
BEVERAGES (1.0%) | ||||||||||||||||
| 1,500,000 | Anheuser-Busch InBev Finance, Inc. | 02/01/23 | 3.300 | 1,462,560 | ||||||||||||
BIOTECHNOLOGY (0.9%) | ||||||||||||||||
| 740,000 | Amgen, Inc. | 05/11/22 | 2.650 | 713,961 | ||||||||||||
| 600,000 | Celgene Corp. | 02/20/23 | 3.250 | 581,689 | ||||||||||||
| 1,295,650 | ||||||||||||||||
The accompanying notes are an integral part of these financial statements.
financial statements october 31, 2018 | 11 |
BBH INCOME FUND
PORTFOLIO OF INVESTMENTS (continued)
October 31, 2018
| Principal Amount | Maturity Date | Interest Rate | Value | |||||||||||||
CORPORATE BONDS (continued) | ||||||||||||||||
COMMERCIAL SERVICES (0.4%) | ||||||||||||||||
| $ 600,000 | United Rentals North America, Inc. | 07/15/23 | 4.625 | % | $ | 594,750 | ||||||||||
DIVERSIFIED FINANCIAL SERVICES (2.4%) | ||||||||||||||||
| 1,800,000 | Credit Acceptance Corp. | 02/15/21 | 6.125 | 1,804,140 | ||||||||||||
| 1,650,000 | Drawbridge Special Opportunities Fund1 | 08/01/21 | 5.000 | 1,650,117 | ||||||||||||
| 3,454,257 | ||||||||||||||||
ELECTRIC (2.4%) | ||||||||||||||||
| 1,800,000 | Electricite de France SA1 | 09/21/28 | 4.500 | 1,740,319 | ||||||||||||
| 1,705,000 | Exelon Generation Co. LLC | 10/01/39 | 6.250 | 1,802,679 | ||||||||||||
| 3,542,998 | ||||||||||||||||
HEALTHCARE-SERVICES (0.5%) | ||||||||||||||||
| 750,000 | Roche Holdings, Inc.1 | 01/28/22 | 1.750 | 713,023 | ||||||||||||
INSURANCE (4.5%) | ||||||||||||||||
| 1,045,000 | Aegon NV (6-Month USD-LIBOR + 3.540%)2 | 04/11/48 | 5.500 | 993,403 | ||||||||||||
| 1,212,000 | Athene Global Funding1 | 01/25/22 | 4.000 | 1,216,193 | ||||||||||||
| 1,500,000 | Enstar Group, Ltd. | 03/10/22 | 4.500 | 1,499,044 | ||||||||||||
| 540,000 | New York Life Global Funding1 | 08/06/21 | 3.250 | 538,439 | ||||||||||||
| 890,000 | Sirius International Group, Ltd.1 | 11/01/26 | 4.600 | 807,319 | ||||||||||||
| 1,500,000 | United Insurance Holdings Corp. | 12/15/27 | 6.250 | 1,530,360 | ||||||||||||
| 6,584,758 | ||||||||||||||||
INVESTMENT COMPANIES (0.1%) | ||||||||||||||||
| 200,000 | Business Development Corp. of America1 | 12/30/22 | 4.750 | 196,456 | ||||||||||||
PHARMACEUTICALS (1.1%) | ||||||||||||||||
| 1,600,000 | AbbVie, Inc. | 05/14/25 | 3.600 | 1,528,259 | ||||||||||||
The accompanying notes are an integral part of these financial statements.
BBH INCOME FUND
PORTFOLIO OF INVESTMENTS (continued)
October 31, 2018
| Principal Amount | Maturity Date | Interest Rate | Value | |||||||||||||
CORPORATE BONDS (continued) | ||||||||||||||||
TELECOMMUNICATIONS (0.3%) | ||||||||||||||||
| $ 450,000 | Sprint Spectrum Co. LLC / Sprint Spectrum Co. II LLC / Sprint Spectrum Co. III LLC1 | 03/20/23 | 3.360 | % | $ | 445,500 | ||||||||||
TRUCKING & LEASING (0.4%) | ||||||||||||||||
| 600,000 | Park Aerospace Holdings, Ltd.1 | 08/15/22 | 5.250 | 595,500 | ||||||||||||
| Total Corporate Bonds (Identified cost $29,881,404) | 29,554,403 | |||||||||||||||
LOAN PARTICIPATIONS AND ASSIGNMENTS (18.1%) | ||||||||||||||||
| 997,500 | Avolon TLB Borrower 1 (US) LLC Term B3 (1-Month USD-LIBOR + 2.000%)2 | 01/15/25 | 4.280 | 994,338 | ||||||||||||
| 1,995,000 | BCP Renaissance Parent LLC (3-Month USD-LIBOR + 3.500%)2. | 10/31/24 | 6.027 | 1,999,987 | ||||||||||||
| 1,994,975 | Charter Communications Operating LLC (CCO Safari LLC) Term B (1-Month USD-LIBOR + 2.000%)2 | 04/30/25 | 4.310 | 1,994,735 | ||||||||||||
| 1,994,962 | Dell International LLC Term B (1-Month USD-LIBOR + 2.000%)2 | 09/07/23 | 4.310 | 1,991,970 | ||||||||||||
| 2,000,000 | Eastern Power LLC (TPF II LC LLC) (1-Month USD-LIBOR + 3.750%)2 | 10/02/23 | 6.052 | 1,994,680 | ||||||||||||
| 2,000,000 | Frontera Generation Holdings LLC (3-Month USD-LIBOR + 4.250%)2 | 05/02/25 | 6.524 | 2,005,000 | ||||||||||||
| 1,970,588 | HCA, Inc. Term A5 (1-Month USD-LIBOR + 1.500%)2 | 06/10/20 | 3.802 | 1,973,051 | ||||||||||||
| 895,696 | Helix Gen Funding LLC (1-Month USD-LIBOR + 3.750%)2 | 06/03/24 | 6.052 | 836,356 | ||||||||||||
| 1,140,000 | NorthRiver Midstream Finance LP Term B (3-Month USD-LIBOR + 3.250%)2 | 10/01/25 | 5.809 | 1,144,754 | ||||||||||||
| 991,703 | RPI Finance Trust Term B6 (3-Month USD-LIBOR + 2.000%)2 | 03/27/23 | 4.386 | 991,882 | ||||||||||||
| 997,468 | Sprint Communications, Inc. (1-Month USD-LIBOR + 2.500%)2 | 02/02/24 | 4.813 | 996,531 | ||||||||||||
The accompanying notes are an integral part of these financial statements.
financial statements october 31, 2018 | 13 |
BBH INCOME FUND
PORTFOLIO OF INVESTMENTS (continued)
October 31, 2018
| Principal Amount | Maturity Date | Interest Rate | Value | |||||||||||||
LOAN PARTICIPATIONS AND ASSIGNMENTS (continued) | ||||||||||||||||
| $ 1,409,334 | SS&C Technologies Holdings, Inc. Term B3 (1-Month USD-LIBOR + 2.250%)2 | 04/16/25 | 4.552 | % | $ | 1,401,498 | ||||||||||
| 546,258 | SS&C Technologies Holdings, Inc. Term B4 (1-Month USD-LIBOR + 2.250%)2 | 04/16/25 | 4.552 | 543,221 | ||||||||||||
| 740,000 | SS&C Technologies Holdings, Inc. Term B5 (1-Month USD-LIBOR + 2.250%)2 | 04/16/25 | 4.552 | 735,508 | ||||||||||||
| 2,000,000 | United Rentals, Inc. (3-Month USD-LIBOR + 1.750%)2 | 10/31/25 | 4.309 | 2,006,260 | ||||||||||||
| 1,000,000 | Universal Health Services, Inc. (3-Month USD-LIBOR + 1.750%)2 | 10/31/25 | 4.309 | 1,001,250 | ||||||||||||
| 1,995,000 | Vistra Operations Co. LLC (Tex Operations Company LLC) (1-Month USD-LIBOR + 2.000%)2 | 12/31/25 | 4.293 | 1,987,738 | ||||||||||||
| 2,000,000 | Wyndham Hotels & Resorts, Inc. Term B (1-Month USD-LIBOR + 1.750%)2 | 05/30/25 | 4.052 | 1,997,920 | ||||||||||||
| Total Loan Participations and Assignments (Identified cost $26,670,675) | 26,596,679 | |||||||||||||||
U.S. GOVERNMENT AGENCY OBLIGATIONS (5.5%) | ||||||||||||||||
| 8,000,000 | Federal Home Loan Bank Discount Notes5 | 11/01/18 | 0.000 | 8,000,000 | ||||||||||||
| Total U.S. Government Agency Obligations (Identified cost $8,000,000) | 8,000,000 | |||||||||||||||
The accompanying notes are an integral part of these financial statements.
BBH INCOME FUND
PORTFOLIO OF INVESTMENTS (continued)
October 31, 2018
| Principal Amount | Maturity Date | Interest Rate | Value | |||||||||||||
U.S. TREASURY BONDS AND NOTES (31.9%) | ||||||||||||||||
| $ 8,940,000 | U.S. Treasury Bond | 08/15/40 | 3.875 | % | $ | 9,651,359 | ||||||||||
| 5,725,000 | U.S. Treasury Bond | 05/15/48 | 3.125 | 5,429,357 | ||||||||||||
| 7,225,000 | U.S. Treasury Note6 | 10/31/24 | 2.250 | 6,911,728 | ||||||||||||
| 19,800,000 | U.S. Treasury Note | 08/15/26 | 1.500 | 17,607,305 | ||||||||||||
| 3,600,000 | U.S. Treasury Note | 05/15/28 | 2.875 | 3,517,594 | ||||||||||||
| 3,750,000 | U.S. Treasury Note | 08/15/28 | 2.875 | 3,661,084 | ||||||||||||
| Total U.S. Treasury Bonds and Notes (Identified cost $48,089,750) | 46,778,427 | |||||||||||||||
| TOTAL INVESTMENTS (Identified cost $153,323,169)7 | 103.4 | % | $ | 151,604,738 | ||||||||||||
| LIABILITIES IN EXCESS OF OTHER ASSETS | (3.4) | % | (5,024,554 | ) | ||||||||||||
| NET ASSETS | 100.0 | % | $ | 146,580,184 | ||||||||||||
| 1 | Security exempt from registration under Rule 144A of the Securities Act of 1933, as amended. These securities may be resold in transactions exempt from registration, normally to qualified institutional buyers. Total market value of Rule 144A securities owned at October 31, 2018 was $ 49,183,047 or 33.6% of net assets. Unless otherwise noted, these securities are not considered illiquid. |
| 2 | Variable rate instrument. Interest rates change on specific dates (such as coupon or interest payment date). The yield shown represents the October 31, 2018 coupon or interest rate. |
| 3 | This variable rate security is based on a predetermined schedule and the rate at period end also represents the reference rate at period end. |
| 4 | Security that used significant unobservable inputs to determine fair value. |
| 5 | Security issued with zero coupon. Income is recognized through accretion of discount. |
| 6 | All or a portion of this security is held at the broker as collateral for open futures contracts. |
| 7 | The aggregate cost for federal income tax purposes is $153,788,834, the aggregate gross unrealized appreciation is $149,020 and the aggregate gross unrealized depreciation is $2,386,006, resulting in net unrealized depreciation of $2,236,986. |
The accompanying notes are an integral part of these financial statements.
financial statements october 31, 2018 | 15 |
BBH INCOME FUND
PORTFOLIO OF INVESTMENTS (continued)
October 31, 2018
| Description | Number of Contracts | Expiration Date | Notional Amount | Market Value | Unrealized Gain / (Loss) | |||||||||||||||
Contracts to Buy: | ||||||||||||||||||||
U.S. Treasury 5-Year Notes | 300 | December 2018 | $ | 33,767,734 | $ | 33,714,844 | $ | (52,890 | ) | |||||||||||
— | Level 1 – unadjusted quoted prices in active markets for identical assets and liabilities. |
— | Level 2 – significant other observable inputs (including quoted prices for similar assets and liabilities, interest rates, prepayment speeds, credit risk, etc.). |
— | Level 3 – significant unobservable inputs (including the Fund’s own assumptions in determining the fair value of assets and liabilities). |
The accompanying notes are an integral part of these financial statements.
BBH INCOME FUND
PORTFOLIO OF INVESTMENTS (continued)
October 31, 2018
market data which is readily available, regularly distributed or updated, reliable and verifiable, not proprietary, and provided by independent sources that are actively involved in the relevant market. The categorization of a financial instrument within the hierarchy is based upon the pricing transparency of the instrument and does not necessarily correspond to the investment adviser’s perceived risk of that instrument.
The accompanying notes are an integral part of these financial statements.
financial statements october 31, 2018 | 17 |
BBH INCOME FUND
PORTFOLIO OF INVESTMENTS (continued)
October 31, 2018
| Investments, at value | Unadjusted Quoted Prices in Active Markets for Identical Investments (Level 1)* | Significant Other Observable Inputs (Level 2)* | Significant Unobservable Inputs (Level 3)* | Balance as of October 31, 2018 | ||||||||||||||
Asset Backed Securities | $ | — | $ | 36,832,672 | $ | 592,470 | $ | 37,425,142 | ||||||||||
Commercial Mortgage Backed Securities | — | 3,250,087 | — | 3,250,087 | ||||||||||||||
Corporate Bonds | — | 29,554,403 | — | 29,554,403 | ||||||||||||||
Loan Participations and Assignments | — | 26,596,679 | — | 26,596,679 | ||||||||||||||
U.S. Government Agency Obligations | — | 8,000,000 | — | 8,000,000 | ||||||||||||||
U.S. Treasury Bonds and Notes | — | 46,778,427 | — | 46,778,427 | ||||||||||||||
Total Investments, at value | $ | — | $ | 151,012,268 | $ | 592,470 | $ | 151,604,738 | ||||||||||
Other Financial Instruments, at value | ||||||||||||||||||
Financial Futures Contracts | $ | (52,890 | ) | $ | — | $ | — | $ | (52,890 | ) | ||||||||
Other Financial Instruments, at value | $ | (52,890 | ) | $ | — | $ | — | $ | (52,890 | ) | ||||||||
* | The Fund’s policy is to disclose transfers between levels based on valuations at the end of the reporting period. There were no transfers between Levels 1, 2 or 3 during the period ended October 31, 2018. |
The accompanying notes are an integral part of these financial statements.
BBH INCOME FUND
PORTFOLIO OF INVESTMENTS (continued)
October 31, 2018
| Asset Backed Securities | ||||
Balance as of June 27, 2018 | $ | — | ||
Purchases | 595,776 | |||
Sales / Paydowns | — | |||
Realized gains (losses) | — | |||
Change in unrealized appreciation (depreciation) | (3,641 | ) | ||
Amortization | 335 | |||
Transfers from Level 3 | — | |||
Transfers to Level 3 | — | |||
Balance as of October 31, 2018 | $ | 592,470 | ||
The accompanying notes are an integral part of these financial statements.
financial statements october 31, 2018 | 19 |
BBH INCOME FUND
STATEMENT OF ASSETS AND LIABILITIES
October 31, 2018
ASSETS: | ||||||
Investments in securities, at value (Identified cost $153,323,169) | $ | 151,604,738 | ||||
Cash | 2,040,240 | |||||
Receivables for: | ||||||
Investments sold | 8,145,880 | |||||
Interest | 662,163 | |||||
Investment advisory and administrative fee waiver reimbursement | 24,414 | |||||
Shares sold | 2,200 | |||||
Total Assets | 162,479,635 | |||||
LIABILITIES: | ||||||
Payables for: | ||||||
Investments purchased | 15,648,885 | |||||
Professional fees | 56,992 | |||||
Futures variation margin on open contracts | 52,072 | |||||
Dividends declared | 50,582 | |||||
Investment advisory and administrative fees | 49,032 | |||||
Shares redeemed | 16,916 | |||||
Custody and fund accounting fees | 8,090 | |||||
Transfer agent fees | 2,561 | |||||
Board of Trustees’ fees | 440 | |||||
Accrued expenses and other liabilities | 13,881 | |||||
Total Liabilities | 15,899,451 | |||||
NET ASSETS | $ | 146,580,184 | ||||
Net Assets Consist of: | ||||||
Paid-in capital | $ | 148,960,822 | ||||
Accumulated deficit | (2,380,638 | ) | ||||
Net Assets | $ | 146,580,184 |
NET ASSET VALUE AND OFFERING PRICE PER SHARE | ||||||
CLASS I SHARES | ||||||
($146,580,184 ÷ 14,915,733 shares outstanding) | $9.83 |
The accompanying notes are an integral part of these financial statements.
BBH INCOME FUND
STATEMENT OF OPERATIONS
For the period from June 27, 2018 (commencement of operations) to October 31, 2018
NET INVESTMENT INCOME: | ||||||
Income: | ||||||
Interest income (net of foreign withholding taxes of $1,015) | $ | 976,748 | ||||
Other income | 21,460 | |||||
Total Income | 998,208 | |||||
Expenses: | ||||||
Investment advisory and administrative fees | 114,838 | |||||
Professional fees | 56,992 | |||||
Shareholder report fees | 18,775 | |||||
Board of Trustees’ fees | 12,959 | |||||
Registration fees | 12,000 | |||||
Transfer agent fees | 10,937 | |||||
Custody and fund accounting fees | 8,662 | |||||
Miscellaneous expenses | 2,877 | |||||
Total Expenses | 238,040 | |||||
Investment advisory and administrative fee waiver | (94,185 | ) | ||||
Net Expenses | 143,855 | |||||
Net Investment Income | 854,353 | |||||
NET REALIZED AND UNREALIZED LOSS: | ||||||
Net realized loss on investments in securities | (614,739 | ) | ||||
Net realized loss on futures contracts | (738 | ) | ||||
Net realized loss on investments in securities and futures contracts | (615,477 | ) | ||||
Net change in unrealized appreciation/(depreciation) on investments in securities | (1,718,431 | ) | ||||
Net change in unrealized appreciation/(depreciation) on futures contracts | (52,890 | ) | ||||
Net change in unrealized appreciation/(depreciation) on investments in securities and futures contracts | (1,771,321 | ) | ||||
Net Realized and Unrealized Loss | (2,386,798 | ) | ||||
Net Decrease in Net Assets Resulting from Operations | $ | (1,532,445 | ) |
The accompanying notes are an integral part of these financial statements.
financial statements october 31, 2018 | 21 |
BBH INCOME FUND
STATEMENT OF CHANGES IN NET ASSETS
| For the period from June 27, 2018 (commencement of operations) to October 31, 2018 | ||||||
| INCREASE IN NET ASSETS: | ||||||
Operations: | ||||||
Net investment income | $ | 854,353 | ||||
Net realized loss on investments in securities and futures contracts | (615,477 | ) | ||||
Net change in unrealized appreciation/(depreciation) on investments in securities and futures contracts | (1,771,321 | ) | ||||
Net decrease in net assets resulting from operations | (1,532,445 | ) | ||||
Dividends and distributions declared: | ||||||
Class I | (848,193 | ) | ||||
Share transactions: | ||||||
Proceeds from sales of shares | 148,989,868 | |||||
Net asset value of shares issued to shareholders for reinvestment of dividends and distributions | 36,328 | |||||
Cost of shares redeemed | (65,374 | ) | ||||
Net increase in net assets resulting from share transactions | 148,960,822 | |||||
Total increase in net assets | 146,580,184 | |||||
NET ASSETS: | ||||||
Beginning of period | — | |||||
End of period | $ | 146,580,184 | ||||
The accompanying notes are an integral part of these financial statements.
BBH INCOME FUND
FINANCIAL HIGHLIGHTS
Selected per share data and ratios for a Class I share outstanding through the period.
| For the period from June 27, 2018 (commencement of operations) to October 31, 2018 | ||||
Net asset value, beginning of period | $ | 10.00 | ||
Income from investment operations: | ||||
Net investment income1 | 0.10 | |||
Net realized and unrealized loss | (0.17 | ) | ||
Total income from investment operations | (0.07 | ) | ||
Less dividends and distributions: | ||||
From net investment income | (0.10 | ) | ||
Net asset value, end of period | $ | 9.83 | ||
Total return | (0.75 | )%2 | ||
Ratios/Supplemental data: | ||||
Net assets, end of period (in millions) | $ | 147 | ||
Ratio of expenses to average net assets before reductions | 0.67 | %3 | ||
Fee waiver | 0.17 | %3,4 | ||
Ratio of expenses to average net assets after reductions | 0.50 | %3 | ||
Ratio of net investment income to average net assets | 3.12 | %3 | ||
Portfolio turnover rate | 94 | %2 | ||
| 1 | Calculated using average shares outstanding for the period. |
| 2 | Not Annualized. |
| 3 | Annualized with the exception of audit fees, legal fees and registration fees. |
| 4 | The ratio of expenses to average net assets for the period ended October 31, 2018 reflect fees reduced as result of a contractual operating expense limitation of the Fund to 0.50%. The agreement is effective through June 30, 2019 and may only be terminated during its term with approval of the Fund’s Board of Trustees. For the period from June 27, 2018 to October 31, 2018 the waived fee was $94,185. |
The accompanying notes are an integral part of these financial statements.
financial statements october 31, 2018 | 23 |
BBH INCOME FUND
NOTES TO FINANCIAL STATEMENTS
As of and for the period ended October 31, 2018
1. | Organization. The Fund is a separate, diversified series of BBH Trust (the “Trust”), which is registered under the Investment Company Act of 1940, as amended (the “1940 Act”), as an open-end management investment company. The Trust was originally organized under the laws of the State of Maryland on July 16, 1990 as BBH Fund, Inc. and re-organized as a Delaware statutory trust on June 12, 2007. The Fund commenced operations on June 27, 2018. The Fund offers Class N shares and Class I shares. As of October 31, 2018, Class N shares are not available for purchase by investors. The Fund may offer Class N shares for purchase in the future. Class N and Class I shares have different operating expenses. With the exception of class specific expenses, all expenses are allocated between classes based on net assets. Neither Class N shares nor Class I shares automatically convert to any other share class of the Fund. As of October 31, 2018, there were seven series of the Trust. |
2. | Significant Accounting Policies. The Fund’s financial statements are prepared in accordance with Generally Accepted Accounting Principles in the United States of America (“GAAP”). The Fund is an investment company and accordingly follows the investment company accounting and reporting guidance of the Financial Accounting Standards Board (“FASB”) Accounting Standard Codification Topic 946 Financial Services — Investment Companies. The following summarizes significant accounting policies of the Fund: |
A. | Valuation of Investments. Bonds and other fixed income securities, including restricted securities (other than short-term obligations but including listed issues) are valued at their most recent bid prices (sales price if the principal market is an exchange) in the principal market in which such securities are normally traded, on the basis of valuations furnished by a pricing service, use of which has been approved by the Board of Trustees (the “Board”). In making such valuations, the pricing service utilizes both dealer supplied valuations and electronic data processing techniques, which take into account appropriate factors such as institutional-size trading in similar groups of securities, yield, quality, coupon rate, maturity, type of issue, trading characteristics and other market data, without exclusive reliance upon quoted prices, or exchange or over-the-counter prices, since such valuations are believed to reflect more accurately the fair value of such securities. Futures contracts held by the Fund are valued daily at the official settlement price of the exchange of which it is traded. |
BBH INCOME FUND
NOTES TO FINANCIAL STATEMENTS (continued)
As of and for the period ended October 31, 2018
B. | Accounting for Investments and Income. Investment transactions are accounted for on the trade date. Realized gains and losses on investment transactions are determined based on the identified cost method. Interest income is accrued daily and consists of interest accrued, discount earned (including, if any, both original issue and market discount) and premium amortization on the investments of the Fund. Investment income is recorded net of any foreign taxes withheld where recovery of such tax is uncertain. Debt obligations may be placed on non-accrual status and related interest income may be reduced by ceasing current accruals and writing off interest receivable when the collection of all or a portion of the interest has become doubtful based on consistently applied procedures. A debt obligation is removed from non-accrual status when the issuer resumes interest payments or when collectability of interest is reasonably assured. |
C. | Fund Expenses. Most expenses of the Trust can be directly attributed to a specific fund. Expenses which cannot be directly attributed to a fund are apportioned amongst each fund in the Trust on a net assets basis. Expense estimates are accrued in the period to which they relate and adjustments are made when actual amounts are known. |
D. | Financial Futures Contracts. The Fund may enter into open futures contracts in order to economically hedge against anticipated future changes in interest rates which otherwise might either adversely affect the value of securities held for the Fund or adversely affect the prices of securities that are intended to be purchased at a later date for the Fund. The contractual amount of the futures contracts represents the investment the Fund has in a particular contract and does not necessarily represent the amounts potentially subject to risk of loss. Trading in futures contracts involves, to varying degrees, risk of loss in excess of any futures variation margin reflected in the Statement of Assets and Liabilities. The measurement of risk associated with futures contracts is meaningful only when all related and offsetting transactions are considered. Gains and losses are realized upon the expiration or closing of the futures contracts. |
financial statements october 31, 2018 | 25 |
BBH INCOME FUND
NOTES TO FINANCIAL STATEMENTS (continued)
As of and for the period ended October 31, 2018
| Asset Derivatives | Liability Derivatives | |||||||
| Risk | Statement of Assets and Liabilities Location | Fair Value | Statement of Assets and Liabilities Location | Fair Value | ||||
Interest Rate Risk | Net unrealized appreciation/(depreciation) on investments in securities and futures contracts | $ — | Net unrealized appreciation/(depreciation) on investments in securities and futures contracts | $ (52,890)* | ||||
Total | $ — | $ (52,890) | ||||||
| * | Includes cumulative appreciation/(depreciation) of futures contracts as reported in the Statement of Assets and Liabilities and Notes to Financial Statements. Only the current day’s variation margin is reported within the Statement of Assets and Liabilities. |
| Interest Rate Risk | ||||||
Net Realized Loss on Derivatives Futures Contracts | $ | (738 | ) | |||
Net Change in Unrealized Appreciation/(Depreciation) on Derivatives Futures Contracts | $ | (52,890 | ) | |||
E. | Rule 144A Securities. The Fund may purchase securities that are not registered under the Securities Act of 1933, as amended (“1933 Act”) but that can be sold to “qualified institutional buyers” in accordance with the requirements stated in Rule 144A under the 1933 Act (“Rule 144A Securities”). A Rule 144A Security may be considered illiquid, under SEC Regulations for open-end investment companies, and therefore subject to the 15% limitation on the purchase of illiquid securities, unless it is determined on an ongoing basis that an adequate trading market exists for the security, which is the case for the Fund. Guidelines have been adopted and the daily function of determining and monitoring liquidity of Rule 144A Securities has been delegated to the investment adviser. All relevant factors will be considered in determining the liquidity of Rule 144A Securities and all investments in Rule 144A Securities will be carefully monitored. Information regarding Rule 144A Securities is included at the end of the Portfolio of Investments. |
BBH INCOME FUND
NOTES TO FINANCIAL STATEMENTS (continued)
As of and for the period ended October 31, 2018
F. | Loan Participations and Assignments. The Fund may invest in loan participations and assignments, which include institutionally traded floating and fixed-rate debt securities generally acquired as an assignment from another holder of, or participation interest in, loans originated by a bank or financial institution (the “Lender”) that acts as agent for all holders. Some loan participations and assignments may be purchased on a “when-issued” basis. The agent administers the terms of the loan, as specified in the loan agreement. When investing in a loan participation, the Fund has the right to receive payments of principal, interest and any fees to which it is entitled only from the Lender selling the loan agreement and only upon receipt by the Lender of payments from the borrower. The Fund generally has no right to enforce compliance with the terms of the loan agreement with the borrower. |
G. | Federal Income Taxes. It is the Trust’s policy to comply with the requirements of the Internal Revenue Code (the “Code”) applicable to regulated investment companies and to distribute substantially all of its taxable income to its shareholders. Accordingly, no federal income tax provision is required. The Fund files a tax return annually using tax accounting methods required under provisions of the Code, which may differ from GAAP, which is the basis on which these financial statements are prepared. Accordingly, the amount of net investment income and net realized gain reported in these financial statements may differ from that reported on the Fund’s tax return, due to certain book-to-tax timing differences such as losses deferred due to “wash sale” transactions and utilization of capital loss carryforwards. These differences may result in temporary over-distributions for financial statement purposes and are classified as distributions in excess of accumulated net realized gains or net investment income. These distributions do not constitute a return of capital. Permanent differences are reclassified between paid-in capital and retained earnings/(accumulated deficit) within the Statement of Assets and Liabilities based upon their tax |
financial statements october 31, 2018 | 27 |
BBH INCOME FUND
NOTES TO FINANCIAL STATEMENTS (continued)
As of and for the period ended October 31, 2018
classification. As such, the character of distributions to shareholders reported in the Financial Highlights table may differ from that reported to shareholders on Form 1099-DIV.
H. | Dividends and Distributions to Shareholders. Dividends and distributions from net investment income to shareholders are declared daily and paid monthly to shareholders. Distributions from net capital gains, if any, are generally declared and paid annually and are recorded on the ex-dividend date. The Fund declared dividends in the amount of $848,193 to Class I shareholders during the period ended October 31, 2018. |
| Distributions paid from: | ||||||||||||||||||||||||
| Ordinary income | Net long-term capital gain | Total taxable distributions | Tax return of capital | Total distributions paid | ||||||||||||||||||||
2018: | $ | 848,193 | $ | — | $ | 848,193 | $ | — | $ | 848,193 | ||||||||||||||
| Components of retained earnings/(accumulated deficit) | ||||||||||||||||||||||||||||||||
| Undistributed ordinary income | Undistributed long-term capital gain | Retained earnings/ (accumulated deficit) | Accumulated capital and other losses | Other book/tax temporary differences | Book unrealized appreciation/ (depreciation) | Total retained earnings/ (accumulated deficit) | ||||||||||||||||||||||||||
2018: | $ | 3,766 | $ | — | $ | 3,766 | $ | (147,418 | ) | $ | (465,665 | ) | $ | (1,771,321 | ) | $ | (2,380,638 | ) | ||||||||||||||
BBH INCOME FUND
NOTES TO FINANCIAL STATEMENTS (continued)
As of and for the period ended October 31, 2018
I. | Use of Estimates. The preparation of the financial statements in accordance with GAAP requires management to make estimates and assumptions that affect the reported amounts of assets and liabilities in the financial statements, disclosure of contingent assets and liabilities at the date of the financial statements and the reported amounts of increase and decrease in net assets from operations during the reporting period. Actual results could differ from these estimates. |
3. | Fees and Other Transactions with Affiliates. |
A. | Investment Advisory and Administrative Fees. Effective June 27, 2018 (commencement of operations), under a combined Investment Advisory and Administrative Services Agreement (“Agreement”) with the Trust, Brown Brothers Harriman & Co. (“BBH”) through a separately identifiable department (“SID” or “Investment Adviser”) provides investment advisory, portfolio management and administrative services to the Fund. The Fund pays a combined fee for investment advisory and administrative services calculated daily and paid monthly at an annual rate equivalent to 0.40% per annum. For the period ended October 31, 2018, the Fund incurred $114,838 for services under the Agreement. |
B. | Investment Advisory and Administrative Fee Waivers. Effective June 27, 2018 (commencement of operations), the Investment Adviser has contractually agreed to waive fees and/or reimburse expenses in order to limit the total annual fund operating expenses (excluding interests, taxes, brokerage commissions, other expenditures that are capitalized in accordance with generally accepted accounting principles, and other extraordinary expenses not incurred in the ordinary course of the Fund’s business) for Class I shares to 0.50%. The agreement will terminate on June 30, 2019, |
financial statements october 31, 2018 | 29 |
BBH INCOME FUND
NOTES TO FINANCIAL STATEMENTS (continued)
As of and for the period ended October 31, 2018
unless it is renewed by all parties to the agreement. The agreement may only be terminated during its term with approval of the Fund’s Board of Trustees. For the period ended October 31, 2018, the Investment Adviser waived fees in the amount of $94,185 for Class I.
C. | Custody and Fund Accounting Fees. BBH acts as a custodian and fund accountant and receives custody and fund accounting fees from the Fund calculated daily and incurred monthly. BBH holds all of the Fund’s cash and investments and calculates the Fund’s daily net asset value. The custody fee is an asset and transaction-based fee. The fund accounting fee is an asset-based fee calculated at 0.004% of the Fund’s net asset value. For the period ended October 31, 2018, the Fund incurred $8,662 in custody and fund accounting fees. In the event that the Fund is overdrawn, under the custody agreement with BBH, BBH will make overnight loans to the Fund to cover overdrafts. Pursuant to their agreement, the Fund will pay the Federal Funds overnight investment rate on the day of the overdraft. The total interest incurred by the Fund for the period ended October 31, 2018, was $307. This amount is included under line item “Custody and fund accounting fees” in the Statement of Operations. |
D. | Board of Trustees’ Fees. Each Trustee who is not an “interested person” as defined under the 1940 Act receives an annual fee as well as reimbursement for reasonable out-of-pocket expenses from the Fund. For the period ended October 31, 2018, the Fund incurred $12,959 in independent Trustee compensation and reimbursements. |
E. | Officers of the Trust. Certain officers of the Trust are also employees of BBH. Such officers are paid no fees by the Trust for their services to the Trust. |
4. | Investment Transactions. For the period ended October 31, 2018, the cost of purchases and the proceeds of sales of investment securities, other than short-term investments, were $228,135,435 and $82,294,897, respectively. |
5. | Shares of Beneficial Interest. The Trust is permitted to issue an unlimited number of Class I shares of beneficial interest, at no par value. Transactions in Class I shares were as follows: |
| For the period ended October 31, 2018* | ||||||||||
| Shares | Dollars | |||||||||
Class I | ||||||||||
Shares sold | 14,918,693 | $ | 148,989,868 | |||||||
Shares issued in connection with reinvestments of dividends | 3,682 | 36,328 | ||||||||
Shares redeemed | (6,642 | ) | (65,374 | ) | ||||||
Net increase | 14,915,733 | $ | 148,960,822 | |||||||
* | The period represented is from June 27, 2018 (commencement of operations) to October 31, 2018. |
BBH INCOME FUND
NOTES TO FINANCIAL STATEMENTS (continued)
As of and for the period ended October 31, 2018
6. | Principal Risk Factors and Indemnifications. |
A. | Principal Risk Factors. Investing in the Fund may involve certain risks, as discussed in the Fund’s prospectus, including but not limited to, those described below: |
financial statements october 31, 2018 | 31 |
BBH INCOME FUND
NOTES TO FINANCIAL STATEMENTS (continued)
As of and for the period ended October 31, 2018
do so (loan risk). The value of securities held by the Fund may decline in response to certain events, including: those directly involving the companies or issuers whose securities are held by the Fund; conditions affecting the general economy; overall market changes; local, regional or political, social or economic instability; and currency and interest rate and price fluctuations (market risk). A significant investment of Fund assets within one or more sectors, industries, securities and/or durations may increase the Fund’s sensitivity to adverse economic, business, political, or other, risks associated with such sector, industry, security or duration (sector risk). The Fund’s shareholders may be adversely impacted by asset allocation decisions made by an investment adviser whose discretionary clients make up a large percentage of the Fund’s shareholders (shareholder concentration risk). Even though the Fund’s investments in repurchase agreements are collateralized at all times, there is some risk to the Fund if the other party to the agreement should default on its obligations (repurchase agreement risk). While the U.S. Government has historically provided financial support to U.S. government-sponsored agencies or instrumentalities during times of financial stress, such as the various actions taken to stabilize the Federal National Mortgage Association and Federal Home Loan Mortgage Corporation during the credit crisis of 2008, no assurance can be given that it will do so in the future. Such securities are neither issued nor guaranteed by the U.S. Treasury (U.S. Government Agency Securities Risk). The extent of the Fund’s exposure to these risks in respect to these financial assets is included in their value as recorded in the Fund’s Statement of Assets and Liabilities.
B. | Indemnifications. Under the Trust’s organizational documents, its officers and Trustees may be indemnified against certain liabilities and expenses arising out of the performance of their duties to the Fund, and shareholders are indemnified against personal liability for the obligations of the Trust. Additionally, in the normal course of business, the Fund enters into agreements with service providers that may contain indemnification clauses. The Fund’s maximum exposure under these arrangements is unknown as this would involve future claims that may be made against the Fund that have not yet occurred. The risk of material loss from such claims is considered remote. |
7. | Recent Pronouncements. |
A. | ASU 2017-08. In March 2017, the Financial Accounting Standards Board issued an Accounting Standards Update, ASU 2017-08, Receivables — Nonrefundable Fees and Other Costs (Subtopic 310-20), Premium Amortization on Purchased Callable Debt Securities (the “ASU 2017-08”) which amends the amortization period for certain purchased callable debt securities held at a premium, shortening such period to the earliest call date. The ASU 2017-08 does not require any accounting |
BBH INCOME FUND
NOTES TO FINANCIAL STATEMENTS (continued)
As of and for the period ended October 31, 2018
| change for debt securities held at a discount; the discount continues to be amortized to maturity. The ASU 2017-08 is effective for years, and interim periods within those years, beginning after December 15, 2018. Management is currently evaluating the application of ASU 2017-08 and its impact, if any, on the Fund’s financial statements. |
B. | ASU 2018-13. On August 28, 2018, the Financial Accounting Standards Board issued an Accounting Standards Update, ASU 2018-13, Fair Value Measurement (Topic 820): Disclosure Framework —Changes to the Disclosure Requirements for Fair Value Measurement (the “ASU 2018-13”). ASU 2018-13 modifies the disclosure objective paragraphs of Accounting Standards Codification 820 to eliminate (1) “at a minimum” from the phrase “an entity shall disclose at a minimum” and (2) other similar “open ended” disclosure requirements to promote the appropriate exercise of discretion by entities. ASU 2018-13 also eliminates and modifies other requirements under ASU 2018-13. ASU 2018-13 is effective for all entities for fiscal years, and interim periods within those fiscal years, beginning after December 15, 2019. Early application is permitted and Management is currently evaluating the application of ASU 2018-13 and its impact, if any, on the Fund’s financial statements. |
C. | Regulation S-X. In October 2018, the U.S. Securities and Exchange Commission adopted amendments to certain disclosure requirements that had become “redundant, duplicative, overlapping, outdated or superseded, in light of the other Commission disclosure requirements, U.S. GAAP or changes in the information environment”. The compliance date for the amendments to Regulation S-X is November 5, 2018 (for reporting period end dates of September 30, 2018 and after). |
8. | Subsequent Events. Management has evaluated events and transactions that have occurred since October 31, 2018 through the date the financial statements were issued and determined that there were none that would require recognition or additional disclosure in the financial statements. |
financial statements october 31, 2018 | 33 |
BBH INCOME FUND
DISCLOSURE OF FUND EXPENSES
October 31, 2018 (unaudited)
BBH INCOME FUND
DISCLOSURE OF FUND EXPENSES (continued)
October 31, 2018 (unaudited)
| Beginning Account Value June 27, 2018 | Ending Account Value October 31, 2018 | Expenses Paid During Period June 27, 2018 to October 31, 20181 | ||||||||||||
Class I | ||||||||||||||
Actual | $ | 1,000 | $ | 993 | $ | 1.72 | ||||||||
Hypothetical2 | $ | 1,000 | $ | 1,016 | $ | 1.74 | ||||||||
| 1 | Expenses are equal to the Fund’s annualized expense ratio of 0.50% for Class I shares, multiplied by the average account value over the period and multiplied by 126/365. |
| 2 | Assumes a return of 5% before expenses. For the purposes of the calculation, the applicable annualized expenses ratio for each class of shares is subtracted from the assumed return before expenses. |
financial statements october 31, 2018 | 35 |
BBH INCOME FUND
CONFLICTS OF INTEREST
October 31, 2018 (unaudited)
BBH INCOME FUND
CONFLICTS OF INTEREST (continued)
October 31, 2018 (unaudited)
financial statements october 31, 2018 | 37 |
BBH INCOME FUND
CONFLICTS OF INTEREST (continued)
October 31, 2018 (unaudited)
investment opportunities may be allocated differently among accounts due to the particular characteristics of an account, such as size of the account, cash position, tax status, risk tolerance and investment restrictions or for other reasons.
BBH INCOME FUND
CONFLICTS OF INTEREST (continued)
October 31, 2018 (unaudited)
investment objectives and guidelines. There may be potential conflicts of interest or regulatory issues relating to these transactions which could limit the Investment Adviser’s decision to engage in these transactions for the Fund. BBH or the Investment Adviser may have a potentially conflicting division of loyalties and responsibilities to the parties in such transactions.
financial statements october 31, 2018 | 39 |
BBH INCOME FUND
CONFLICTS OF INTEREST (continued)
October 31, 2018 (unaudited)
a portion of the commissions or commission credits to another firm that provides research to BBH. To the extent that BBH engages in commission sharing arrangements, many of the same conflicts related to traditional soft dollars may exist.
BBH INCOME FUND
CONFLICTS OF INTEREST (continued)
October 31, 2018 (unaudited)
valued by BBH (pursuant to Board-adopted procedures) at fair value, may have the effect of diluting or increasing the economic interest of existing shareholders.
financial statements october 31, 2018 | 41 |
BBH INCOME FUND
ADDITIONAL FEDERAL TAX INFORMATION
October 31, 2018 (unaudited)
TRUSTEES AND OFFICERS OF BBH INCOME FUND
(unaudited)
| Name and Birth Year | | Position(s) Held with the Trust | | Term of Office and Length of Time Served# | | Principal Occupation(s) During Past 5 Years | | Number of Portfolios in Fund Complex Overseen by Trusteeˆ | | Other Public Company or Investment Company Directorships held by Trustee During Past 5 Years | ||
Independent Trustees | ||||||||||||
H. Whitney Wagner Birth Year: 1956 | Chairman of the Board and Trustee | Chairman Since 2014; Trustee Since 2007 and 2006-2007 with the Predecessor Trust | President, Clear Brook Advisors, a registered investment adviser. | 7 | None. | |||||||
Andrew S. Frazier Birth Year: 1948 | Trustee | Since 2010 | Retired. | 7 | Director of Western World Insurance Group, Inc. | |||||||
Mark M. Collins Birth Year: 1956 | Trustee | Since 2011 | Partner of Brown Investment Advisory Incorporated, a registered investment adviser. | 7 | Chairman of Dillon Trust Company. | |||||||
John M. Tesoro Birth Year: 1952 | Trustee | Since 2014 | Retired. | 7 | Trustee, Bridge Builder Trust (8 Funds); Director of Teton Advisors, Inc. (a registered investment adviser). | |||||||
financial statements october 31, 2018 | 43 |
TRUSTEES AND OFFICERS OF BBH INCOME FUND
(unaudited)
| Name, Address and Birth Year | | Position(s) Held with the Trust | | Term of Office and Length of Time Served# | | Principal Occupation(s) During Past 5 Years | | Number of Portfolios in Fund Complex Overseen by Trusteeˆ | | Other Public Company or Investment Company Directorships held by Trustee During Past 5 Years | ||
Interested Trustees | ||||||||||||
Susan C. Livingston+ 50 Post Office Square Boston, MA 02110 Birth Year: 1957 | Trustee | Since 2011 | Partner (since 1998) and Senior Client Advocate (since 2010) for BBH&Co.; Director of BBH Luxembourg S.C.A. (since 1992). | 7 | None. | |||||||
John A. Gehret+ 140 Broadway New York, NY 10005 Birth Year: 1959 | Trustee | Since 2011 | Limited Partner of BBH&Co. (2012-present); Director of BBH Luxembourg Funds (since 2012); Director of BBH Trust Company (Cayman) Ltd. (since 2012). | 7 | None. |
TRUSTEES AND OFFICERS OF BBH INCOME FUND
(unaudited)
| Name, Address and Birth Year | | Position(s) Held with the Trust | | Term of Office and Length of Time Served# | | Principal Occupation(s) During Past 5 Years | ||
Officers | ||||||||
Jean-Pierre Paquin 140 Broadway New York, NY 10005 Birth Year: 1973 | President and Principal Executive Officer | Since 2016 | Partner of BBH&Co. since 2015; joined BBH&Co. in 1996. | |||||
Daniel Greifenkamp 140 Broadway New York, NY 10005 Birth Year: 1969 | Vice President | Since 2016 | Managing Director of BBH&Co. since 2014; joined BBH&Co. in 2011. | |||||
Charles H. Schreiber 140 Broadway New York, NY 10005 Birth Year: 1957 | Treasurer and Principal Financial Officer | Since 2007 2006-2007 with the Predecessor Trust | Senior Vice President of BBH&Co. since 2001; joined BBH&Co. in 1999. | |||||
Paul F. Gallagher 140 Broadway New York, NY 10005 Birth Year: 1959 | Chief Compliance Officer (“CCO”) | Since 2015 | Senior Vice President of BBH&Co. since September 2015; Executive Director, Counsel, Morgan Stanley Smith Barney LLC (2009-September 2015). | |||||
Keith M. Kelley 50 Post Office Square Boston, MA 02110 Birth Year: 1983 | Anti-Money Laundering Officer (“AMLO”) | Since 2016 | Vice President of BBH&Co. since February 2016; joined BBH&Co. in 2016; Director, Legal and Compliance, Morgan Stanley Smith Barney LLC (2014-February 2016); Compliance Manager, State Street Corporation (2013-2014). |
financial statements october 31, 2018 | 45 |
TRUSTEES AND OFFICERS OF BBH INCOME FUND
(unaudited)
| Name, Address and Birth Year | | Position(s) Held with the Trust | | Term of Office and Length of Time Served# | | Principal Occupation(s) During Past 5 Years | ||
Suzan M. Barron 50 Post Office Square Boston, MA 02110 Birth Year: 1964 | Secretary | Since 2009 | Senior Vice President and Senior Investor Services Counsel, BBH&Co. since 2005. | |||||
Crystal Cheung 140 Broadway New York, NY 10005 Birth Year: 1974 | Assistant Treasurer | Since 2018 | Assistant Vice President of BBH&Co. since 2016; joined BBH&Co. in 2014; Financial Reporting Manager, BNY Mellon Corporation (2010-2014). | |||||
Brian J. Carroll 50 Post Office Square Boston, MA 02110 Birth Year: 1985 | Assistant Secretary | Since 2018 | Associate and Investor Services Assistant Counsel of BBH&Co. since 2017; joined BBH&Co. in 2014. |
# | All officers of the Trust hold office for one year and until their respective successors are chosen and qualified (subject to the ability of the Trustees to remove any officer in accordance with the Trust’s By-laws). Mr. Wagner previously served on the Board of Trustees of the Predecessor Trust. |
+ | Ms. Livingston and Mr. Gehret are “interested persons” of the Trust as defined in the 1940 Act because of their positions as Partner and Limited Partner of BBH&Co., respectively. |
ˆ | The Fund Complex consists of the Trust, which has seven series, and each is counted as one “Portfolio” for purposes of this table. |
Administrator Brown Brothers Harriman & Co. 140 Broadway New York, NY 10005 Distributor ALPS Distributors, Inc. 1290 Broadway, Suite 1100 Denver, CO 80203 Shareholder Servicing Agent Brown Brothers Harriman & Co. 140 Broadway New York, NY 10005 1-800-575-1265 | Investment Adviser Brown Brothers Harriman Mutual Fund Advisory Department 140 Broadway New York, NY 10005 |
By telephone: | Call 1-800-575-1265 | |||
By E-mail send your request to: | bbhfunds@bbh.com | |||
On the internet: | www.bbhfunds.com |
Item 2. Code of Ethics.
| As of the period ended October 31, 2018 (the “Reporting Period”), the Registrant has adopted a code of ethics that applies to the Registrant’s principal executive officer and principal financial officer, principal accounting officer or controller or persons performing similar functions. During the Reporting Period, there have been no changes to, amendments to or waivers from, any provision of the code of ethics. A copy of this code of ethics can be obtained upon request, free of charge, by calling (800) 575 - 1265. |
Item 3. Audit Committee Financial Expert.
| The Board of Trustees of the Registrant has determined that Andrew S. Frazier, John M. Tesoro and Mark M. Collins possess the attributes identified in Instruction (b) of Item 3 to Form N-CSR to each qualify as an “audit committee financial expert,” and has designated Andrew S. Frazier, John M. Tesoro and Mark M. Collins as the Registrant’s audit committee financial experts. Messrs. Andrew S. Frazier, John M. Tesoro and Mark M. Collins are “independent” Trustees pursuant to paragraph (a)(2) of Item 3 to Form N-CSR. |
Item 4. Principal Accountant Fees and Services.
| (a) | Audit Fees The aggregate fees billed for each of the last two fiscal years for professional services rendered by the principal accountant for the audit of the Registrant’s annual financial statements or services that are normally provided by the accountant in connection with statutory and regulatory filings or engagements for those fiscal years were $305,000 for 2018 and $302,000 for 2017.
|
| (b) | Audit Related Fees The aggregate fees billed in each of the last two fiscal years for assurance and related services rendered to the Registrant by the principal accountant that are reasonably related to the performance of the audit of the Registrant’s financial statements and are not reported under paragraph (a) of this Item were $0 for 2018 and $0 for 2017.
|
| (c) | Tax Fees The aggregate fees billed in each of the last two fiscal years for professional services rendered to the Registrant by the principal accountant for tax compliance, tax advice and tax planning were $37,869 for 2018 and $36,726 for 2017. These services consisted of (i) review or preparation of U.S. federal, state, local and excise tax returns; (ii) U.S. federal, state and local entity tax planning, advice and assistance regarding statutory, regulatory or administrative developments, and (iii) tax advice regarding tax qualification. |
| (d) | All Other Fees The aggregate fees billed in each of the last two fiscal years for products and services provided by the principal accountant, other than the services reported in paragraphs (a) through (c) of this Item were $63,000 for 2018 and $40,400 for 2017.
|
The other services provided to the Registrant consisted of examinations pursuant to Rule 17f-2 of the Investment Company Act of 1940, as amended and filings of Form N-17f-2 “Certificate of Accounting of Securities and Similar Investments in the Custody of Management Investment Companies” with the U.S. Securities and Exchange Commission (“17f-2 Services”) in addition to audit services, tax services and 17f-2 Services provided to other series of the Registrant.
| |
| (e)(1) | Pursuant to the Registrant’s Audit Committee Charter that has been adopted by the audit committee, the audit committee shall approve all audit and permissible non-audit services to be provided to the Registrant and all permissible non-audit services to be provided to its investment adviser or any entity controlling, controlled by or under common control with the investment adviser that provides ongoing services to the Registrant if the engagement relates directly to the operations and financial reporting of the Registrant. The audit committee has delegated to its Chairman the approval of such services subject to reports to the full audit committee at its next subsequent meeting.
|
| (e)(2) | The percentage of services described in each of paragraphs (b) through (d) of this Item that were approved by the audit committee pursuant to paragraph (c)(7)(i)(C) of Rule 2-01 of Regulation S-X, with respect to: Audit-Related Fees were 0%; Tax Fees were 0%; and Other Fees were 0%.
|
| (f) | Not applicable.
|
| (g) | The aggregate non-audit fees billed by the Registrant's accountant for services rendered to the Registrant, and rendered to the Registrant's investment adviser (not including any sub-adviser whose role is primarily portfolio management and is subcontracted with or overseen by another investment adviser), and any entity controlling, controlled by, or under common control with the investment adviser that provides ongoing services to the Registrant for each of the last two fiscal years of the Registrant were $1,534,502 for 2018 and $1,664,835 for 2017.
|
| (h) | The Registrant’s audit committee has considered whether the provision of non-audit services that were rendered to the Registrant’s investment adviser (not including any subadviser whose role is primarily portfolio management and is subcontracted with or overseen by another investment adviser), and any entity controlling, controlled by, or under common control with the investment adviser that provides ongoing services to the Registrant that were not pre-approved pursuant to paragraph (c)(7)(ii) of Rule 2-01 of Regulation S-X is compatible with maintaining the principal accountant’s independence. |
Item 5. Audit Committee of Listed Registrants.
| Not Applicable |
Item 6. Investments.
| (a) | A Schedule of Investments in securities of unaffiliated issuers as of the close of the Reporting Period is included as part of the report to shareholders filed under Item 1 of this Form N-CSR.
|
| (b) | Not applicable. |
Item 7. Disclosure of Proxy Voting Policies and Procedures for Closed-End Management Investment Companies.
| Not applicable. |
Item 8. Portfolio Managers of Closed-End Management Investment Companies.
| Not applicable. |
Item 9. Purchases of Equity Securities by Closed-End Management Investment Company and Affiliated Purchasers.
| Not applicable. |
Item 10. Submission of Matters to a Vote of Security Holders.
| Not applicable. |
Item 11. Controls and Procedures.
| (a) | The Registrant’s principal executive and financial officers have concluded that the Registrant’s disclosure controls and procedures (as defined in Rule 30a-3(c) under the Investment Company Act of 1940, as amended (the “1940 Act”)) are effective, as of a date within 90 days of the filing date of this Form N-CSR, based on their evaluation of these controls and procedures required by Rule 30a-3(b) under the 1940 Act and Rules 13a-15(b) or 15d-15(b) under the Securities Exchange Act of 1934, as amended (the “Exchange Act”).
|
| (b) | There were no changes in the Registrant's internal control over financial reporting (as defined in Rule 30a-3(d) under the 1940 Act) that occurred during the Registrant's second fiscal quarter of the period covered by this Form N-CSR, that have materially affected, or are reasonably likely to materially affect, the Registrant's internal control over financial reporting. |
Item 12. Disclosure of Securities Lending Activities for Closed-End Management Investment Companies.
| Not applicable. |
Item 13. Exhibits.
| (a)(1) | Not applicable.
|
| (a)(2) | Certifications required by Rule 30a-2(a) under the 1940 Act and Section 302 of the Sarbanes-Oxley Act of 2002 are filed as Exhibit 13(a)(2) to this Form N-CSR.
|
| (a)(3) | Not applicable.
|
| (a)(4) | Not applicable. |
| (b) | Certifications required by Rule 30a-2(b) under the 1940 Act and Section 906 of the Sarbanes-Oxley Act of 2002 are furnished as Exhibit 13(b) to this Form N-CSR. |
SIGNATURES
Pursuant to the requirements of the Securities Exchange Act of 1934 and the Investment Company Act of 1940, the Registrant has duly caused this report to be signed on its behalf by the undersigned, thereunto duly authorized.
(Registrant) BBH Trust
By: (Signature and Title)
/s/ Jean-Pierre Paquin
Jean-Pierre Paquin
Title: President (Principal Executive Officer)
Date: January 7, 2019
Pursuant to the requirements of the Securities Exchange Act of 1934 and the Investment Company Act of 1940, this report has been signed below by the following persons on behalf of the Registrant and in the capacities and on the dates indicated.
By: (Signature and Title)
/s/ Jean-Pierre Paquin
Jean-Pierre Paquin
Title: President (Principal Executive Officer)
Date: January 7, 2019
By: (Signature and Title)
/s/ Charles H. Schreiber
Charles H. Schreiber
Title: Treasurer (Principal Financial Officer)
Date: January 7, 2019