As filed with the Securities and Exchange Commission on June 3, 2008
UNITED STATES
SECURITIES AND EXCHANGE COMMISSION
Washington, DC 20549
FORM N-CSR
CERTIFIED SHAREHOLDER REPORT OF REGISTERED
MANAGEMENT INVESTMENT COMPANIES
Investment Company Act File Number: 811-21833
RMK Multi-Sector High Income Fund, Inc.
(Exact name of Registrant as specified in charter)
Morgan Keegan Tower
Fifty North Front Street
Memphis, Tennessee 38103
(Address of principal executive offices) (Zip code)
Charles D. Maxwell
Morgan Keegan Tower
Fifty North Front Street
Memphis, Tennessee 38103
(Name and address of agent for service)
Registrant’s telephone number, including area code: (901) 524-4100
with copies to:
Donald W. Smith, Esq.
Kirkpatrick & Lockhart Preston Gates Ellis LLP
1601 K Street, N.W.
Washington, DC 20006
Date of fiscal year end: March 31, 2008
Date of reporting period: March 31, 2008
| Item 1. | Reports to Stockholders. |
The following is a copy of the report transmitted to stockholders of RMK Multi-Sector High Income Fund, Inc. (the “Fund”) pursuant to Rule 30e-1 under the Investment Company Act of 1940, as amended (the “1940 Act”) (17 CFR 270.30e-1):
TABLEOF CONTENTS
There is no assurance that the Funds will achieve their investment objectives. The Funds are subject to market risk, which include the possibilities that the market values of the securities owned by the Funds will decline or that the shares of the Funds will trade at lower prices in the market. Accordingly, you can lose money investing in the Funds.
| | | | |
| NOT FDIC INSURED | | MAY LOSE VALUE | | NO BANK GUARANTEE |
i
LETTER TO STOCKHOLDERS
Dear Fellow Stockholders,
We are pleased to present the enclosed combined annual report for RMK Advantage Income Fund, Inc., RMK High Income Fund, Inc., RMK Multi-Sector High Income Fund, Inc. and RMK Strategic Income Fund, Inc. (each a “Fund” and, collectively, the “Funds”). In this report, you will find information on each Fund’s investment objective and strategy and learn how your investment performed during the fiscal year ended March 31, 2008. The portfolio manager will also provide an overview of the market conditions and discuss some of the factors that affected investment performance during the reporting period. In addition, this report includes each Fund’s audited financial statements and portfolio of investments as of March 31, 2008.
Over the past year, we have seen the bond market come under considerable pressure as investors shunned one type of investment after another. At first, investors sold subprime debt and it appeared that this was a problem relating exclusively to the housing slow-down and marginal borrowers. As the summer of 2007 advanced, investors turned their backs on other types of bonds as well, including bonds unrelated to housing and unrelated to marginal borrowers. Bond prices dropped substantially and consequently, so did the value of our Funds. During the second half of 2007, the bond markets for all but government bonds ground to a virtual halt. As the new year dawned, a hoped-for return of normal securities markets did not materialize. During this entire period, our portfolio managers and staff have worked diligently to keep abreast of developments in the markets and to make the best of this difficult situation.
On April 21, 2008, the current Boards of Directors of the Funds unanimously approved new investment advisory agreements with Hyperion Brookfield Asset Management, Inc. (“HBAM”) and the nomination of five new directors of the Funds. The appointment of HBAM as investment adviser of any of the Funds and the election of that Fund’s new board of directors must be approved by the shareholders of that Fund. Morgan Asset Management, Inc. represented to the Funds’ Boards of Directors that it believes the proposed transaction is in the best interest of the Funds’ shareholders. HBAM is a registered investment adviser and it manages more than $21 billion in fixed income assets for institutional and retail investors, such as pension funds, financial institutions, insurance companies, and foundations. HBAM has extensive investment management experience with sectors of the fixed income market including mortgage-backed securities, structured products, core fixed income and corporate high-yield bonds and loans.
As always, we appreciate your continued support of the Regions Morgan Keegan closed-end funds. We remain committed to helping you pursue your financial goals through investments in our fund family. You have our commitment to bring you the highest level of disciplined decision making and personal service to meet your financial needs.
Sincerely,

Brian B. Sullivan, CFA
President
May 22, 2008
1
RMK ADVANTAGE INCOME FUND, INC.
OBJECTIVE & STRATEGY
RMK Advantage Income Fund, Inc. seeks a high level of current income. The Fund seeks capital growth as a secondary investment objective when consistent with its primary investment objective. The Fund invests a majority of its total assets in below investment grade debt securities (commonly referred to as “junk bonds”) that offer attractive yield and capital appreciation potential. The Fund may also invest in investment grade debt securities, up to 15% of its total assets in foreign debt and foreign equity securities and up to 25% of its total assets in domestic equity securities, including common and preferred stocks. The Fund invests in a wide range of below investment grade debt securities, including corporate bonds, mortgage-backed and asset-backed securities and municipal and foreign government obligations, as well as securities of companies in bankruptcy reorganization proceedings or otherwise in the process of debt restructuring. (Below investment grade debt securities are rated Ba1 or lower by Moody’s Investors Service, Inc., BB+ or lower by Standard & Poor’s Ratings Group, comparably rated by another nationally recognized statistical rating organization or, if unrated, determined by the Fund’s investment adviser to be of comparable quality.) The Fund may use leverage through bank borrowings, reverse repurchase agreements or other transactions involving indebtedness or through the issuance of preferred stock. The Fund may leverage up to 33 1/3% of its total assets (in each case including the amount borrowed). The Fund may vary its use of leverage in response to changing market conditions.
INVESTMENT RISKS: Investors in any bond fund should anticipate fluctuations in price. Bond prices and the value of bond funds decline as interest rates rise. Bonds with longer-term maturities generally are more vulnerable to interest rate risk than bonds with shorter-term maturities. Below investment grade bonds involve greater credit risk, which is the risk that the issuer will not make interest or principal payments when due. An economic downturn or period of rising interest rates could adversely affect the ability of issuers, especially issuers of below investment grade debt, to service primary obligations and an unanticipated default could cause the Fund to experience a reduction in value of its shares. The Fund’s investments in mortgage-backed or asset-backed securities that are “subordinated” to other interests in the same pool may increase credit risk to the extent that the Fund as a holder of those securities may only receive payments after the pool’s obligations to other investors have been satisfied. Below investment grade bonds are also subject to greater price volatility and are less liquid, especially during periods of economic uncertainty or change, than higher-rated debt securities. The value of U.S. and foreign equity securities in which the Fund invests will change based on changes in a company’s financial condition and in overall market and economic conditions. Leverage creates an opportunity for an increased return to common stockholders,
(Unaudited)
2
RMK ADVANTAGE INCOME FUND, INC.
but unless the income and capital appreciation, if any, on securities acquired with leverage proceeds exceed the costs of the leverage, the use of leverage will diminish the investment performance of the Fund’s shares. Use of leverage may also increase the likelihood that the net asset value of the Fund and market value of its common shares will be more volatile, and the yield and total return to common stockholders will tend to fluctuate more in response to changes in interest rates and creditworthiness.
MANAGEMENT DISCUSSIONOF FUND PERFORMANCE
For the six months and the fiscal year ended March 31, 2008, the Fund had a total return of -56.60% and - -73.61%, respectively, based on market price and reinvested dividends and other distributions. For the six months and the fiscal year ended March 31, 2008, the Fund had a total return of -49.53% and -68.89%, respectively, based on net asset value and reinvested dividends and other distributions. For the six months and the twelve months ended March 31, 2008, the Lehman Brothers Ba U.S. High Yield Index(1) had a total return of -1.98% and -1.25%, respectively.
The very difficult market conditions for credit-oriented securities that were prevalent at the Fund’s semi-annual update continued into the new year, with the first calendar quarter of 2008 being perhaps the worst market conditions we have seen up to this point. The collapse and subsequent government sponsored rescue of Bear Stearns poignantly illustrates the continuing withdrawal of credit availability and liquidity in the current market environment.
It goes without saying that we have been very disappointed with the Fund’s performance over the past year. In the past, our allocation of assets across a wide variety of collateral and security types had proven beneficial to the Fund’s performance. In this market cycle, however, these assets have suffered from extreme illiquidity along with assets that have in fact suffered actual credit deterioration. Although the headlines are dominated by references to the subprime mortgage crisis and the bursting of the real estate bubble, the most difficult management issue has been the complete disappearance of market making capacity of the primary broker-dealer community. Bear Stearns has in fact exited the market, but as a practical matter, most other primary dealers have either ceased to, or no longer have the capacity to commit capital to any of the credit sensitive sectors.
Lending against all but the most liquid, highly rated assets is, for all practical purposes, no longer available. Consequently, our focus has had to become much narrower. Although there is more potential for attractive returns in the market place today compared to the market environment immediately following the events of September 11, 2001, overall market liquidity concerns have restricted our capacity
(Unaudited)
3
RMK ADVANTAGE INCOME FUND, INC.
to take advantage of the current situation. Financial assets in general continue to be under pricing pressure, especially in the residential mortgage sector.
The Federal Open Market Committee has aggressively lowered short-term lending rates and has introduced a facility to allow primary broker-dealers access to the discount window. These are extremely important big picture developments. The eventual effort should be to provide some liquidity to the mortgage market and, with short-term rates now at a mere 2.0%, force more capital back into risky assets. At this point, there continues to be pervasive concerns about the direction of the economy and the health of our banking system. Such uncertainty continues to pressure market values by simply overwhelming any periodic buy interest with massive supply. However, we are seeing more opportunistic buyers beginning to participate and hopefully this will begin to shift the momentum. At this time, our focus will have to remain on stabilizing asset values and trying to identify those assets that have the highest probability of substantial recovery.

James C. Kelsoe, Jr., CFA
Senior Portfolio Manager
Morgan Asset Management, Inc.
Market forecasts provided in this report may not necessarily come to pass. There is no assurance that the Fund will achieve its investment objectives. These views are subject to change at any time based upon market or other conditions, and Morgan Asset Management, Inc. disclaims any responsibility to update such views. The Fund is subject to market risk, which is the possibility that the market values of securities owned by the Fund will decline and, therefore, the value of the Fund’s shares may be less than what you paid for them. Accordingly, you can lose money investing in the Fund.
INDEX DESCRIPTION
(1) | | The Lehman Brothers Ba U.S. High Yield Index is a broad-based unmanaged index of fixed rate, non-investment grade debt. Pay-in-kind (PIK) bonds, Eurobonds and debt issues from countries designated as emerging markets (e.g., Argentina, Brazil and Venezuela) are excluded, but Canadian and global bonds (SEC registered) of issuers in non-emerging countries are included. Original issue zeroes, step-up coupon structures and 144As are also included. The index is unmanaged and, unlike the Fund, is not affected by cash flows or trading and other expenses. It is not possible to invest directly in an index. |
(Unaudited)
4
RMK ADVANTAGE INCOME FUND, INC.
PORTFOLIO STATISTICS†
AS OF MARCH 31, 2008
| | |
Average Credit Quality | | BB |
Current Yield | | 28.7% |
Yield to Maturity | | 15.8% |
Duration | | 4.2 Years |
Average Effective Maturity | | 5.6 Years |
Percentage of Leveraged Assets | | 11.9% |
Total Number of Holdings | | 167 |
| † | | The Fund’s composition is subject to change. |
CREDIT QUALITY†
AS OF MARCH 31, 2008
| | | | | | |
| %OFDEBTSECURITIES | | %OFDEBTSECURITIES |
AAA | | 16.1% | | B | | 18.9% |
AA | | 1.9% | | CCC | | 13.1% |
A | | 3.2% | | CC | | 4.6% |
BBB | | 12.7% | | C | | 0.9% |
BB | | 8.0% | | Not Rated | | 20.6% |
| | | | | | |
| | | | Total | | 100.0% |
| † | | The Fund’s composition is subject to change. |
ASSET ALLOCATION†
AS OF MARCH 31, 2008
| | |
| %OFTOTALINVESTMENTS |
Corporate Bonds | | 33.1% |
Collateralized Mortgage Obligations | | 20.7% |
Collateralized Debt Obligations | | 20.7% |
Common Stocks | | 5.5% |
Collateralized Loan Obligations | | 4.9% |
Equipment Leases | | 4.2% |
Home Equity Loans | | 3.8% |
Manufactured Housing Loans | | 2.6% |
Certificate-Backed Obligations | | 2.4% |
Residential Mortgage-Backed Securities | | 0.1% |
Municipal Securities | | 0.1% |
Short-Term Investments | | 1.9% |
| | |
Total | | 100.0% |
| † | | The Fund’s composition is subject to change. |
(Unaudited)
5
RMK ADVANTAGE INCOME FUND, INC.
NAV & MARKET PRICE HISTORY*
The graph below illustrates the net asset value and market price history of RMK Advantage Income Fund, Inc. (NYSE: RMA) from the commencement of investment operations on November 8, 2004 to March 31, 2008.
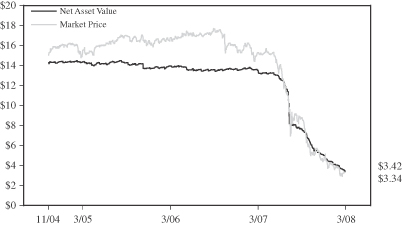
| * | | Net asset value is calculated every day that the New York Stock Exchange is open as of the close of trading (normally 4:00 p.m. Eastern Time) by taking the closing market value of all portfolio securities, cash and other assets owned, subtracting all liabilities, then dividing the result (total net assets) by the total number of shares outstanding. The market price is the last reported price at which a share of the Fund was sold on the New York Stock Exchange. |
(Unaudited)
6
RMK ADVANTAGE INCOME FUND, INC.
PERFORMANCE INFORMATION
| | | | | | | | | |
| | | AVERAGE ANNUAL TOTAL RETURNS | |
| AS OF MARCH 31, 2008 | | SIX
MONTHS* | | | 1 YEAR | | | COMMENCEMENT
OF INVESTMENT
OPERATIONS(1) | |
| MARKET VALUE | | (56.60 | )% | | (73.61 | )% | | (26.08 | )% |
| NET ASSET VALUE | | (49.53 | )% | | (68.89 | )% | | (24.56 | )% |
LEHMAN BROTHERS BA U.S. HIGH YIELD INDEX(2 ) | | (1.98 | )% | | (1.25 | )% | | — | |
| * | | Not annualized for periods less than one year. |
(1) | | The Fund commenced investment operations on November 8, 2004. |
(2) | | The Lehman Brothers Ba U.S. High Yield Index is a broad-based unmanaged index of fixed rate, non-investment grade debt. Pay-in-kind (PIK) bonds, Eurobonds and debt issues from countries designated as emerging markets (e.g., Argentina, Brazil and Venezuela) are excluded, but Canadian and global bonds (SEC registered) of issuers in non-emerging countries are included. Original issue zeroes, step-up coupon structures and 144As are also included. The index is unmanaged and, unlike the Fund, is not affected by cash flows or trading and other expenses. It is not possible to invest directly in an index. |
Performance data quoted represents past performance, which is no guarantee of future results. Investment return and principal value will fluctuate so that an investor’s shares, when redeemed, may be worth more or less than their original cost. Fund performance changes over time and current performance may be lower or higher than what is stated. For the most recent performance, call toll-free 800-564-2188. Total returns assume an investment at the common share market price or net asset value at the beginning of the period, reinvestment of all dividends and other distributions for the period in accordance with the Fund’s dividend reinvestment plan, and sale of all shares at the closing market price (excluding any commissions) or net asset value at the end of the period. Returns shown in the table do not reflect the deduction of taxes that a stockholder would pay on Fund distributions or on the sale of Fund shares. Closed-end funds are not bank deposits or obligations, are not guaranteed by any bank and are not insured or guaranteed by the U.S. government, the Federal Deposit Insurance Corporation, the Federal Reserve Board or any other government agency. Investment in closed-end funds involves investment risk, including possible loss of principal.
(Unaudited)
7
RMK ADVANTAGE INCOME FUND, INC.
PORTFOLIOOF INVESTMENTS
MARCH 31, 2008
| | | | | | | |
Principal
Amount/
Notional
Amount/
Shares | | | | Description | | Value ‡ |
| | | | | | | |
| Asset-Backed Securities–Investment Grade*–16.8% of Net Assets |
| | | | Certificate-Backed Obligations (“CBO”)–2.5% | | | |
| 2,000,000 | | | | CBC Insurance Revenue Securitization LLC 2002-A C, 8.880% 2/15/23 (Acquired 10/25/07, Cost $1,805,651) †# | | $ | 1,595,000 |
| 3,000,000 | | | | Diversified Asset Securitization Holdings III 1A A3L, 5.436% 7/5/36 (Acquired 2/6/07, Cost $2,315,358) †# | | | 900,000 |
| 3,804,831 | | | | MKP CBO I Ltd., 4A CS 2.000% 7/12/40 (Acquired 3/9/05, Cost $3,804,831) †# | | | 247,314 |
| | | | | | | |
| | | | | | | 2,742,314 |
| | | | | | | |
| | | | Collateralized Debt Obligations (“CDO”)–9.7% | | | |
| 3,000,000 | | | | CDO Repack SPC Ltd. 2006-BRGA, 12/5/51 #~ | | | 300 |
| 1,000,000 | | | | Kodiak CDO 2007-2A E, 6.412% 11/7/42 (Acquired 6/29/07, Cost $983,734) †# | | | 45,000 |
| 3,000,000 | | | | Lincoln Park Referenced Link Notes 2001-1, 6.671% 7/30/31
(Acquired 9/12/06, Cost $2,690,592) †# | | | 1,830,000 |
| 1,967,001 | | | | Millstone III-A CDO Ltd., 7/5/46 #~ | | | 197 |
| 6,000,000 | | | | Palmer Square 2A CN, 11/2/45 (Acquired 10/25/05,
Cost $5,971,826) †#~ | | | 15,000 |
| 1,500,000 | | | | Preferred Term Securities XXVIII, Ltd., 4.434% 3/22/38
(Acquired 12/12/07, Cost $1,371,552) †# | | | 1,087,500 |
| 2,991,608 | | | | Pyxis Master Trust 2006-7, 7.709% 10/1/37 (Acquired 11/21/06, Cost $2,991,609) †# | | | 127,143 |
| 8,000,000 | | | | Steers Delaware Business Trust 2007-A, 5.384% 6/20/18 (Acquired 2/9/07–8/24/07, Cost $7,985,838) †# | | | 7,040,000 |
| 6,184,958 | | | | Taberna Preferred Funding Ltd. 2006-6A, 6.096% 12/5/36 (Acquired 6/27/06, Cost $6,153,303) †# | | | 61,850 |
| 3,784,177 | | | | Taberna Preferred Funding Ltd. 2006-7A C1, 1.000% 2/5/37 (Acquired 9/28/06, Cost $3,727,504) †# | | | 75,684 |
| 4,418,330 | | | | Witherspoon CDO Funding Ltd. 2004-1A, 7.500% 9/15/39 # | | | 419,741 |
| | | | | | | |
| | | | | | | 10,702,415 |
| | | | | | | |
| | | | Home Equity Loans (Non-High Loan-To-Value)–1.9% | | | |
| 340,712 | | | | Fremont Home Loan Trust 2004-4 M7, 4.319% 3/25/35 | | | 177,697 |
| 1,710,000 | | | | Irwin Home Equity Corp. 2005-C 2M3, 4.099% 4/25/30 # | | | 719,995 |
| 1,040,000 | | | | Terwin Mortgage Trust 2006-2HGS A2, 4.500% 3/25/37 (Acquired 12/19/07, Cost $628,048) † | | | 364,472 |
| 22,190,409 | | | | United Capital Markets, Inc. 2003-A, 2.300% 11/8/27 interest-only strips (Acquired 12/19/07, Cost $901,444) †# | | | 907,588 |
| | | | | | | |
| | | | | | | 2,169,752 |
| | | | | | | |
The Notes to the Financial Statements are an integral part of, and should be read in conjunction with, the Financial Statements.
8
RMK ADVANTAGE INCOME FUND, INC.
PORTFOLIOOF INVESTMENTS
MARCH 31, 2008
| | | | | | | |
Principal
Amount/
Notional
Amount/
Shares | | | | Description | | Value ‡ |
| | | | | | | |
| Asset-Backed Securities–Investment Grade* (continued) |
| | | | Manufactured Housing Loans–2.7% | | | |
| 3,207,348 | | | | Mid-State Trust 2005-1 B, 7.758% 1/15/40 | | $ | 2,988,440 |
| | | | | | | |
| | | | Total Asset-Backed Securities–Investment Grade*
(cost $54,499,231) | | | 18,602,921 |
| | | | | | | |
| Asset-Backed Securities–Below Investment Grade or Unrated*–24.6% of NetAssets | | | |
| | | | Certificate-Backed Obligations (“CBO”)–0.1% | | | |
| 2,329,301 | | | | Helios Series I Multi-Asset CBO, Ltd. IA C, 7.706% 12/13/36 (Acquired 11/3/06, Cost $952,760) †# | | | 46,586 |
| | | | | | | |
| | | | Collateralized Debt Obligations (“CDO”)–12.5% | | | |
| 2,000,000 | | | | 801 Grand CDO 2006-1 LLC, 8.542% 9/20/16 (Acquired 6/8/07–7/27/07, Cost $1,944,738) †# | | | 1,315,000 |
| 2,000,000 | | | | Aardvark Asset-Backed Securities CDO 2007-1A, 7/6/47 in default #~ | | | 200 |
| 4,000,000 | | | | Acacia CDO, Ltd. 10A, 4.570% 9/7/46 (Acquired 8/3/06, Cost $1,914,575) †# | | | 160,000 |
| 4,000,000 | | | | Aladdin CDO I Ltd. 2006-3A, 7.542% 10/31/13 (Acquired 9/25/06–7/2/07, Cost $2,284,447) †# | | | 410,000 |
| 365,000 | | | | Attentus CDO Ltd. 2006-2A E2, 10/9/41 #~ | | | 5,475 |
| 2,000,000 | | | | Attentus CDO Ltd. 2006-2A F1, 10/9/41 (Acquired 10/12/06, Cost $1,952,100) †#~ | | | 15,000 |
| 910,000 | | | | Attentus CDO Ltd. 2006-2A F2, 10/9/41 #~ | | | 6,825 |
| 3,000,000 | | | | Attentus CDO Ltd. 2007-3A F2, 10/11/42 (Acquired 11/8/07, Cost $2,884,197) †#~ | | | 7,500 |
| 3,115,979 | | | | Broderick CDO Ltd. 2007-3A D, 6.808% 12/6/50 (Acquired 3/8/07, Cost $3,057,905) †# | | | 312 |
| 1,000,000 | | | | Cairn Mezzanine Asset-Backed CDO PLC 2007-3A, 3.688% 8/13/47 # | | | 100 |
| 5,000,000 | | | | Dillon Read CDO Ltd. 2006-1A, 13.000% 12/5/46 (Acquired 11/2/06, Cost $4,392,828) †# | | | 1,287,500 |
| 3,000,000 | | | | Diversified Asset Securitization Holdings II 1A B1, 9.712% 9/15/35 (Acquired 10/31/05–11/8/05, Cost $1,600,358) †# | | | 52,500 |
| 4,436,522 | | | | Duane Park, 11.000% 6/27/16 (Acquired 12/20/07, Cost $1,777,006) †# | | | 831,848 |
| 2,000,000 | | | | Gulf Stream Atlantic CDO Ltd. 2007-1A, 7/13/47 (Acquired 2/28/07, Cost $1,688,637) †#~ | | | 200 |
| 2,897,636 | | | | IMAC CDO Ltd. 2007-2A E, 10/20/50 (Acquired 5/4/07, Cost $2,772,069) †#~ | | | 290 |
| 2,000,000 | | | | IXIS ABS 1 Ltd., 12/12/46 (Acquired 11/15/06, Cost $1,575,120) †#~ | | | 40,000 |
The Notes to the Financial Statements are an integral part of, and should be read in conjunction with, the Financial Statements.
9
RMK ADVANTAGE INCOME FUND, INC.
PORTFOLIOOF INVESTMENTS
MARCH 31, 2008
| | | | | | | |
Principal
Amount/
Notional
Amount/
Shares | | | | Description | | Value ‡ |
| | | | | | | |
| Asset-Backed Securities–Below Investment Grade or Unrated* (continued) | | | |
| | | | Collateralized Debt Obligations (“CDO”) (continued) | | | |
| 13,000,000 | | | | Kenmore Street Synthetic CDO 2006-1A, 7.542% 4/30/14 (Acquired 8/25/06–12/29/06, Cost $7,381,885) †# | | $ | 1,527,500 |
| 1,000,400 | | | | Knollwood CDO Ltd. 2006-2A E, 10.377% 7/13/46 (Acquired 8/24/06, Cost $1,000,387) †# | | | 100 |
| 2,000,000 | | | | Knollwood CDO Ltd. 2006-2A SN, 7/13/46 #~ | | | 200 |
| 4,000,000 | | | | Kodiak CDO 2006-1A, 8/7/37 (Acquired 9/29/06, Cost $3,619,520) †#~ | | | 10,000 |
| 3,133,608 | | | | Kodiak CDO 2006-1A G, 6.662% 8/7/37 (Acquired 12/12/06–2/8/07, Cost $3,051,911) †# | | | 7,834 |
| 4,916,822 | | | | Lancer Funding Ltd. 2007-2A A3, 7/15/47 in default (Acquired 5/24/07, Cost $4,491,518) †#~ | | | 492 |
| 2,889,504 | | | | Lexington Capital Funding Ltd. 2007-3A F, 8.551% 4/10/47 (Acquired 2/9/07, Cost $2,805,283) †# | | | 101,133 |
| 3,000,000 | | | | Linker Finance PLC 16A E, 6.059% 5/19/45 (Acquired 5/19/06, Cost $2,914,316) †# | | | 142,500 |
| 3,117,302 | | | | Newbury Street CDO Ltd. 2007-1A D, 6.858% 3/4/53 (Acquired 3/8/07, Cost $3,073,648) †# | | | 312 |
| 1,961,789 | | | | Norma CDO Ltd. 2007-1A E, 7.339% 3/11/49 (Acquired 3/1/07, Cost $1,942,678) †# | | | 19,618 |
| 2,000,000 | | | | Parcs-R 2007-8, 5.099% 1/25/46 (Acquired 6/21/07, Cost $2,000,000) †# | | | 185,000 |
| 2,000,000 | | | | Pasa Funding Ltd. 2007-1A D, 4/7/52 in default #~ | | | 200 |
| 2,000,000 | | | | Preferred Term Securities II, Ltd., 10.000% 5/22/33 (Acquired 7/29/05, Cost $2,171,007) †# | | | 635,000 |
| 3,000,000 | | | | Preferred Term Securities XXI, Ltd., 10.000% 3/22/38 (Acquired 3/28/06–7/31/07, Cost $2,795,851) †# | | | 585,000 |
| 998,147 | | | | Preferred Term Securities XXI-2TR, 9.999% 3/22/38 (Acquired 6/29/07, Cost $956,773) †# | | | 429,203 |
| 4,000,000 | | | | Preferred Term Securities XXII, Ltd., 9/22/36 (Acquired 8/4/06–2/26/07, Cost $3,947,220) †~ | | | 1,334,400 |
| 3,800,000 | | | | Preferred Term Securities XXIII, Ltd., 12/22/36 (Acquired 12/4/06–2/26/07, Cost $3,731,696) †~ | | | 1,581,940 |
| 3,500,000 | | | | Preferred Term Securities XXVIII, Ltd., 10.000% 3/22/38 (Acquired 12/12/07, Cost $3,453,640) †# | | | 2,432,500 |
| 997,523 | | | | Pyxis Master Trust, 7.709% 10/1/37 (Acquired 11/21/06, Cost $997,523) †# | | | 42,395 |
| 1,250,000 | | | | Regional Diversified Funding, 1/25/36 (Acquired 4/15/05, Cost $1,250,000) †#~ | | | 443,750 |
| 1,923,503 | | | | Sharps CDO 2006-1A D, 5/8/46 (Acquired 1/25/07, Cost $1,825,560) †#~ | | | 14,426 |
The Notes to the Financial Statements are an integral part of, and should be read in conjunction with, the Financial Statements.
10
RMK ADVANTAGE INCOME FUND, INC.
PORTFOLIOOF INVESTMENTS
MARCH 31, 2008
| | | | | | | |
Principal
Amount/
Notional
Amount/
Shares | | | | Description | | Value ‡ |
| | | | | | | |
| Asset-Backed Securities–Below Investment Grade or Unrated* (continued) | | | |
| | | | Collateralized Debt Obligations (“CDO”) (continued) | | | |
| 1,000,000 | | | | Squared CDO Ltd. 2007-1A C, 8.089% 5/11/57 (Acquired 5/11/07, Cost $975,440) †# | | $ | 10,000 |
| 1,023,990 | | | | Tahoma CDO Ltd. 2007-2A D, 7.300% 9/15/47 (Acquired 3/28/07, Cost $955,743) †# | | | 7,680 |
| 1,000,000 | | | | Trapeza CDO I LLC 2006-10A D2, 8.700% 6/6/41 (Acquired 6/15/06, Cost $1,000,000) †# | | | 95,000 |
| 2,000,000 | | | | Trapeza CDO I LLC 2006-10A, 6/6/41 #~ | | | 10,000 |
| 2,000,000 | | | | Trapeza CDO I LLC 2006-11A, 10/10/41 #~ | | | 200 |
| 2,000,000 | | | | Trapeza CDO I LLC 2006-11A F, 10/10/41 #~ | | | 15,000 |
| 2,500,000 | | | | Tricadia CDO Ltd. 2006-5A, 15.000% 6/19/46 (Acquired 3/5/07, Cost $1,928,589) †# | | | 68,750 |
| 2,000,000 | | | | WEBS CDO 2006-1 PS, 4/13/47 (Acquired 12/7/06, Cost $1,800,000) †#~ | | | 20 |
| | | | | | | |
| | | | | | | 13,832,903 |
| | | | | | | |
| | | | Collateralized Loan Obligations (“CLO”)–5.2% | | | |
| 3,000 | | | | Credit Genesis CLO 2005, 6/23/10 (Acquired 6/23/05, Cost $3,000,000) †#~ | | | 1,950,000 |
| 3,000,000 | | | | Eirles Two Ltd. 262, 8.612% 8/3/21 # | | | 1,860,000 |
| 3,500,000 | | | | Eirles Two Ltd. 263, 11.112% 8/3/21 # | | | 1,995,000 |
| | | | | | | |
| | | | | | | 5,805,000 |
| | | | | | | |
| | | | Equipment Leases–4.6% | | | |
| 7,594,200 | | | | Aerco Limited 1X C1, 7/15/23 #~ | | | 189,855 |
| 7,123,631 | | | | Aerco Limited 2A B2, 7/15/25 (Acquired 7/25/06–1/23/07, Cost $3,511,353) †#~ | | | 534,272 |
| 7,247,186 | | | | Aerco Limited 2A C2, 7/15/25 (Acquired 7/5/06–8/17/06, Cost $2,615,561) †#~ | | | 289,887 |
| 705,058 | | | | DVI Receivables Corp. 2001-2 A3, 3.519% 11/8/31 # | | | 267,922 |
| 1,499,164 | | | | DVI Receivables Corp. 2001-2 A4, 4.613% 11/11/09 # | | | 599,665 |
| 5,194,613 | | | | DVI Receivables Corp. 2002-1 A3A, 3.350% 6/11/10 # | | | 1,558,384 |
| 2,768,946 | | | | Guggenheim Equipment Trust 2007-1A, 11.193% 7/15/31 (Acquired 5/10/07–7/31/07, Cost $2,044,343) †# | | | 1,606,044 |
| | | | | | | |
| | | | | | | 5,046,029 |
| | | | | | | |
| | | | Home Equity Loans (Non-High Loan-To-Value)–2.1% | | | |
| 2,766,184 | | | | ACE Securities Corp. 2004-HE3 M11, 6.099% 11/25/34 # | | | 237,892 |
| 7,038,000 | | | | Equifirst Mortgage Loan Trust 2004-3 B2, 6.099% 12/25/34 (Acquired 11/30/04, Cost $5,657,454) †# | | | 1,941,291 |
The Notes to the Financial Statements are an integral part of, and should be read in conjunction with, the Financial Statements.
11
RMK ADVANTAGE INCOME FUND, INC.
PORTFOLIOOF INVESTMENTS
MARCH 31, 2008
| | | | | | | |
Principal
Amount/
Notional
Amount/
Shares | | | | Description | | Value ‡ |
| | | | | | | |
| Asset-Backed Securities–Below Investment Grade or Unrated* (continued) | | | |
| | | | Home Equity Loans (Non-High Loan-To-Value) (continued) | | | |
| 4,000,000 | | | | Meritage Asset Holdings 2005-2 N4, 7.500% 11/25/35 (Acquired 10/26/05, Cost $3,115,314) †# | | $ | 36,000 |
| 1,638,754 | | | | Soundview Home Equity Loan Trust 2005-A B1, 5.599% 4/25/35 (Acquired 6/23/05, Cost $1,420,433) †# | | | 93,245 |
| 1,072,530 | | | | Terwin Mortgage Trust 2005-7SL, 7/25/35 (Acquired 7/29/05, Cost $936,060) †#~ | | | 107 |
| 1,453,593 | | | | Terwin Mortgage Trust 2005-11SL B7, 11/25/36 (Acquired 10/31/05, Cost $1,212,208) †#~ | | | 26,165 |
| 4,000,000 | | | | Terwin Mortgage Trust 2005-R1, 12/28/36 (Acquired 12/21/05, Cost $2,962,244) †#~ | | | 11,000 |
| 6,000,000 | | | | Terwin Mortgage Trust 2006-R3, 6/26/37 (Acquired 6/30/06, Cost $4,966,378) †#~ | | | 600 |
| | | | | | | |
| | | | | | | 2,346,300 |
| | | | | | | |
| | | | Manufactured Housing Loans–0.1% | | | |
| 377,458 | | | | Bombardier Capital Mortgage Securitization Corp. 2001-A M2, 8.265% 12/15/30 # | | | 106,632 |
| | | | | | | |
| | | | Total Asset-Backed Securities–Below Investment Grade or Unrated*
(cost $148,879,312) | | | 27,183,450 |
| | | | | | | |
| Corporate Bonds–Investment Grade*–2.8% of Net Assets | | | |
| | | | Finance–2.2% | | | |
| 3,000,000 | | | | Catlin Insurance Company Ltd., 7.249% 12/31/49 (Acquired 11/2/07, Cost $2,830,075) † | | | 2,504,010 |
| | | | | | | |
| | | | Special Purpose Entities–0.6% | | | |
| 2,000,000 | | | | Fixed Income Pass-Through Trust 2007-C JPM Class B, 5/15/77 (Acquired 6/22/07, Cost $2,040,301) †#~ | | | 660,000 |
| | | | | | | |
| | | | Total Corporate Bonds–Investment Grade*
(cost $4,870,376) | | | 3,164,010 |
| | | | | | | |
| Corporate Bonds–Below Investment Grade or Unrated*–32.6% of Net Assets |
| | | | Apparel–2.7% | | | |
| 3,935,000 | | | | Rafaella Apparel Group Inc., 11.250% 6/15/11 | | | 2,951,250 |
| | | | | | | |
| | | | Automotives–1.7% | | | |
| 1,150,000 | | | | General Motors, 8.375% 7/15/33 | | | 810,750 |
| 4,000,000 | | | | Metaldyne Corp., 11.000% 6/15/12 | | | 1,120,000 |
| | | | | | | |
| | | | | | | 1,930,750 |
| | | | | | | |
The Notes to the Financial Statements are an integral part of, and should be read in conjunction with, the Financial Statements.
12
RMK ADVANTAGE INCOME FUND, INC.
PORTFOLIOOF INVESTMENTS
MARCH 31, 2008
| | | | | | | |
Principal
Amount/
Notional
Amount/
Shares | | | | Description | | Value ‡ |
| | | | | | | |
| Corporate Bonds–Below Investment Grade or Unrated* (continued) |
| | | | Basic Materials–3.0% | | | |
| 1,000,000 | | | | AmeriCast Technologies Inc., 11.000% 12/1/14 (Acquired 11/21/06–3/30/07, Cost $1,025,089) † | | $ | 861,250 |
| 3,400,000 | | | | Key Plastics LLC, 11.750% 3/15/13 (Acquired 3/12/07–6/19/07, Cost $3,413,892) † | | | 2,448,000 |
| | | | | | | |
| | | | | | | 3,309,250 |
| | | | | | | |
| | | | Communications–0.9% | | | |
| 1,975,000 | | | | CCH I Holdings LLC, 11.750% 5/15/14 | | | 997,375 |
| | | | | | | |
| | | | Consulting Services–2.7% | | | |
| 3,700,000 | | | | MSX International Inc., 12.500% 4/1/12 (Acquired 3/30/07–4/23/07, Cost $3,680,910) † | | | 2,960,000 |
| | | | | | | |
| | | | Entertainment–1.8% | | | |
| 2,475,000 | | | | French Lick Resorts & Casino LLC, 10.750% 4/15/14 (Acquired 2/7/07–5/14/07, Cost $2,276,582) † | | | 1,485,000 |
| 825,000 | | | | Six Flags Inc., 9.625% 6/1/14 | | | 466,125 |
| | | | | | | |
| | | | | | | 1,951,125 |
| | | | | | | |
| | | | Finance–2.5% | | | |
| 2,725,000 | | | | Advanta Capital Trust I, 8.990% 12/17/26 | | | 1,764,437 |
| 1,000,000 | | | | Assurance America, 10.500% 12/31/35 (Acquired 2/2/07, Cost $979,603) †# | | | 980,000 |
| 500,000 | | | | Security Capital Assurance Ltd., 6/17/49~ | | | 25,000 |
| | | | | | | |
| | | | | | | 2,769,437 |
| | | | | | | |
| | | | Industrials–1.4% | | | |
| 373,492 | | | | Home Products Inc., pays-in-kind 3/20/17 #~ | | | 73,018 |
| 225,000 | | | | Momentive Performance, 11.500% 12/1/16 | | | 171,281 |
| 2,425,000 | | | | Terphane Holding Corp., 12.500% 6/15/09 (Acquired 4/25/06–10/10/07, Cost $2,403,410) † | | | 1,285,250 |
| | | | | | | |
| | | | | | | 1,529,549 |
| | | | | | | |
| | | | Manufacturing–4.3% | | | |
| 2,120,000 | | | | JB Poindexter & Co. Inc., 8.750% 3/15/14 | | | 1,380,650 |
| 4,650,000 | | | | MAAX Corp., 9.750% 6/15/12 | | | 1,023,000 |
| 2,700,000 | | | | Wolverine Tube, Inc., 10.500% 4/1/09 | | | 2,416,500 |
| | | | | | | |
| | | | | | | 4,820,150 |
| | | | | | | |
| | | | Oil & Natural Gas–1.4% | | | |
| 1,700,000 | | | | Seametric International, 11.625% 5/25/12 (Acquired 5/25/07, Cost $1,683,738) †# | | | 1,568,250 |
| | | | | | | |
The Notes to the Financial Statements are an integral part of, and should be read in conjunction with, the Financial Statements.
13
RMK ADVANTAGE INCOME FUND, INC.
PORTFOLIOOF INVESTMENTS
MARCH 31, 2008
| | | | | | | |
Principal
Amount/
Notional
Amount/
Shares | | | | Description | | Value ‡ |
| | | | | | | |
| Corporate Bonds–Below Investment Grade or Unrated* (continued) |
| | | | Paper Products–1.1% | | | |
| 1,675,000 | | | | Corp Durango SAB de CV, 10.500% 10/5/17 (Acquired 10/10/07–10/26/07, Cost $1,667,414) † | | $ | 1,256,250 |
| | | | | | | |
| | | | Real Estate Services–0.9% | | | |
| 2,150,000 | | | | Realogy Corp., 12.375% 4/15/15 | | | 956,750 |
| | | | | | | |
| | | | Retail–1.8% | | | |
| 1,507,000 | | | | Lazydays RV Center Inc., 11.750% 5/15/12 | | | 1,198,065 |
| 2,050,000 | | | | Uno Restaurant Corp., 10.000% 2/15/11 (Acquired 8/12/05–6/29/06, Cost $1,921,053) † | | | 820,000 |
| | | | | | | |
| | | | | | | 2,018,065 |
| | | | | | | |
| | | | Special Purpose Entities–2.2% | | | |
| 745,000 | | | | Interactive Health LLC, 7.250% 4/1/11 (Acquired 1/13/06–12/11/06, Cost $620,768) † | | | 447,000 |
| 2,525,000 | | | | PNA Intermediate Holding Corp., 10.065% 2/15/13 | | | 1,963,188 |
| | | | | | | |
| | | | | | | 2,410,188 |
| | | | | | | |
| | | | Telecommunications–2.4% | | | |
| 4,175,000 | | | | Primus Telecommunications GP, 8.000% 1/15/14 | | | 1,795,250 |
| 1,250,000 | | | | Securus Technologies Inc., 11.000% 9/1/11 | | | 900,000 |
| | | | | | | |
| | | | | | | 2,695,250 |
| | | | | | | |
| | | | Tobacco–1.8% | | | |
| 2,950,000 | | | | North Atlantic Trading Co., 9.250% 3/1/12 | | | 1,917,500 |
| | | | | | | |
| | | | Total Corporate Bonds–Below Investment Grade or Unrated*
($55,248,438) | | | 36,041,139 |
| | | | | | | |
| Mortgage-Backed Securities–Investment Grade*–10.1% of Net Assets |
| | | | Collateralized Mortgage Obligations–10.1% | | | |
| 2,294,083 | | | | Countrywide Alternative Loan Trust 2005-49CB A5, 5.500% 11/25/35 | | | 2,049,251 |
| 4,292,079 | | | | Countrywide Alternative Loan Trust 2005-56 M4, 3.519% 11/25/35 # | | | 1,991,954 |
| 637,490 | | | | Deutsche Alt-A Securities Inc. Mortgage Loan 2006-AF1 A5, 2.879% 4/25/36 | | | 314,546 |
| 5,000,000 | | | | Deutsche Mortgage Securities, Inc. 2006-RS1 N2, 4.393% 9/27/35 (Acquired 2/5/07, Cost $5,023,994) †# | | | 3,250,000 |
| 3,000,939 | | | | Residential Accredit Loans Inc. 2006-Q08 M4. 3.129% 10/25/46 # | | | 664,198 |
| 177,260,573 | | | | Residential Accredit Loans Inc. 2007-QH8 P, 0.500% 10/25/37 interest-only strips # | | | 726,768 |
The Notes to the Financial Statements are an integral part of, and should be read in conjunction with, the Financial Statements.
14
RMK ADVANTAGE INCOME FUND, INC.
PORTFOLIOOF INVESTMENTS
MARCH 31, 2008
| | | | | | | |
Principal
Amount/
Notional
Amount/
Shares | | | | Description | | Value ‡ |
| | | | | | | |
| Mortgage-Backed Securities–Investment Grade* (continued) |
| | | | Collateralized Mortgage Obligations (continued) | | | |
| 2,394,173 | | | | Structured Asset Investment Loan Trust 2004-7A B, 8/27/34
(Acquired 1/27/06, Cost $2,359,925) †#~ | | $ | 8,140 |
| 5,219,000 | | | | Structured Asset Mortgage Investments Inc. 2006-AR3 1B1, 2.999% 4/25/36 | | | 2,175,274 |
| | | | | | | |
| | | | Total Mortgage-Backed Securities–Investment Grade*
($17,643,851) | | | 11,180,131 |
| | | | | | | |
| Mortgage-Backed Securities–Below Investment Grade or Unrated*–12.0%of Net Assets | | | |
| | | | Collateralized Mortgage Obligations–12.0% | | | |
| 1,842,000 | | | | Countrywide Alternative Loan Trust 2006-OA11 N3, 12.500% 9/25/46 (Acquired 10/10/06, Cost $1,868,610) †# | | | 1,671,615 |
| 921,004 | | | | Countrywide Asset Backed Certificates 2006-SPS2 A, 2.759% 5/25/26 | | | 385,377 |
| 3,000,000 | | | | Greenwich Structured Adjustable Rate Mortgage Products 2005-3A N2, 2.000% 6/27/35 (Acquired 7/25/05, Cost $1,961,040) †# | | | 1,425,000 |
| 7,837,983 | | | | Greenwich Structured Adjustable Rate Mortgage Products 2005-4A N-2, 7/27/45 (Acquired 9/26/05, Cost $4,276,405) †#~ | | | 3,527,092 |
| 3,500,000 | | | | GSAMP Trust 2006-S3 A2, 5.769% 5/25/36 | | | 1,073,975 |
| 1,000,000 | | | | Harborview Corp. 2006-14 N4, 8.350% 3/19/38 (Acquired 3/6/07, Cost $847,352) †# | | | 794,390 |
| 6,000,000 | | | | Harborview Corp. 2006-14 PS, 12/19/36 (Acquired 3/6/07, Cost $1,292,081) †#~ | | | 79,260 |
| 2,000,000 | | | | Harborview Corp. 2006-8A N5, 7/21/36 (Acquired 10/11/06, Cost $885,501) †#~ | | | 576,220 |
| 3,945,679 | | | | Harborview Mortgage Loan Trust 2006-4 B11, 4.309% 5/19/47 (Acquired 5/23/06, Cost $2,495,489) †# | | | 308,157 |
| 5,000,000 | | | | Long Beach Asset Holdings Corp. 2005-WL1 N4, 7.500% 6/25/45 (Acquired 11/7/05–1/27/06, Cost $4,608,640) †# | | | 23,250 |
| 621,222 | | | | Long Beach Mortgage Loan Trust 2001-3 M3, 5.411% 9/25/31 # | | | 51,437 |
| 2,000,000 | | | | Long Beach Mortgage Loan Trust 2005-2 B2, 5.349% 4/25/35 (Acquired 4/24/06, Cost $1,780,705) †# | | | 161,660 |
| 3,476,070 | | | | Long Beach Mortgage Loan Trust 2005-WL2 B3, 5.635% 8/25/35 (Acquired 10/20/06–3/6/07, Cost $2,635,255) †# | | | 87,945 |
| 2,043,149 | | | | Park Place Securities Inc. 2005-WCW1 B, 5.000% 9/25/35 (Acquired 8/4/05, Cost $1,901,614) †# | | | 26,357 |
| 3,000,000 | | | | Park Place Securities Inc. 2005-WCW2 M10, 5.099% 7/25/35 # | | | 173,400 |
| 2,000,000 | | | | Park Place Securities Inc. 2005-WHQ3 M11, 5.099% 6/25/35 # | | | 990,680 |
| 1,000,000 | | | | Park Place Securities Inc. 2005-WHQ4, 5.099% 9/25/35 (Acquired 8/30/05, Cost $712,243) †# | | | 76,700 |
The Notes to the Financial Statements are an integral part of, and should be read in conjunction with, the Financial Statements.
15
RMK ADVANTAGE INCOME FUND, INC.
PORTFOLIOOF INVESTMENTS
MARCH 31, 2008
| | | | | | | |
Principal
Amount/
Notional
Amount/
Shares | | | | Description | | Value ‡ |
| | | | | | | |
| Mortgage-Backed Securities–Below Investment Grade or Unrated*(continued) | | | |
| | | | Collateralized Mortgage Obligations (continued) | | | |
| 5,250,000 | | | | Residential Asset Mortgage Products Inc. 2005-RS4 B2, 5.599% 4/25/35 (Acquired 5/6/05, Cost $4,457,346) †# | | $ | 233,625 |
| 1,930,186 | | | | Residential Asset Mortgage Products Inc. 2005-RS4 B3, 5.599% 4/25/35 (Acquired 5/6/05, Cost $1,560,870) †# | | | 24,320 |
| 1,000,000 | | | | Sharp SP I LLC Trust 2006-A HM3 N3, 12.500% 10/25/46 (Acquired 10/13/06, Cost $1,000,000) †# | | | 867,820 |
| 2,591,000 | | | | Soundview Home Equity Loan Trust 2005-2 B3, 5.599% 7/25/35 (Acquired 8/5/05, Cost $2,065,591) †# | | | 740,586 |
| | | | | | | |
| | | | | | | 13,298,866 |
| | | | | | | |
| | | | Residential Mortgage-Backed Securities–0.1% | | | |
| 9 | | | | Harborview 2006-8, 7/22/36 (Acquired 10/11/06, Cost $0) †#~ | | | 1 |
| 67,000 | | | | Indymac Indx CI-1 Corp., 6/25/46 (Acquired 7/20/06, Cost $1,820,859) †#~ | | | 46,230 |
| | | | | | | |
| | | | | | | 46,231 |
| | | | | | | |
| | | | Total Mortgage-Backed Securities–Below Investment Grade or Unrated*
(cost $42,382,219) | | | 13,345,097 |
| | | | | | | |
| Municipal Securities–0.1% of Net Assets | | | |
| 16,481 | | | | Pima County Arizona Health Care Facilities, Revenue Bonds, 6.000% 6/1/08 | | | 16,124 |
| 31,045 | | | | Pima County Arizona Health Care Facilities, Revenue Bonds, 6.274% 6/1/09 | | | 26,655 |
| 43,907 | | | | Pima County Arizona Health Care Facilities, Revenue Bonds, 6.455% 6/1/10 | | | 33,993 |
| | | | | | | |
| | | | Total Municipal Securities
(cost $86,004) | | | 76,772 |
| | | | | | | |
| Common Stocks–5.9% of Net Assets | | | |
| | | | Communications–0.1% | | | |
| 4,200 | | | | Consolidated Communications Holdings, Inc. | | | 63,546 |
| | | | | | | |
| | | | Consumer Products–0.2% | | | |
| 14,940 | | | | Home Products #~ | | | 448 |
| 202,200 | | | | Insight Health Services Holdings Corp ~ | | | 204,222 |
| | | | | | | |
| | | | | | | 204,670 |
| | | | | | | |
| | | | Energy–0.5% | | | |
| 6,400 | | | | Legacy Reserves LP | | | 127,744 |
The Notes to the Financial Statements are an integral part of, and should be read in conjunction with, the Financial Statements.
16
RMK ADVANTAGE INCOME FUND, INC.
PORTFOLIOOF INVESTMENTS
MARCH 31, 2008
| | | | | | | | |
Principal
Amount/
Notional
Amount/
Shares | | | | Description | | Value ‡ | |
| | | | | | | | |
| Common Stocks (continued) | | | | |
| | | | Energy (continued) | | | | |
| 172,700 | | | | Pinnacle Gas Resources, Inc. ~ | | $ | 436,931 | |
| | | | | | | | |
| | | | | | | 564,675 | |
| | | | | | | | |
| | | | Financial–1.8% | | | | |
| 11,100 | | | | Compass Diversified Trust | | | 145,965 | |
| 29,800 | | | | FSI Realty Trust (Acquired 5/3/07, Cost $298,000) †~ | | | 37,250 | |
| 148,000 | | | | FSI Realty Trust Regulation D (Acquired 5/24/07, Cost $1,396,439) †~ | | | 185,000 | |
| 50,000 | | | | Mid Country (Acquired 5/25/07, Cost $850,000) †#~ | | | 645,000 | |
| 107,100 | | | | Star Asia Financial Ltd. (Acquired 3/2/07–8/1/07, Cost $1,092,800) † | | | 990,675 | |
| | | | | | | | |
| | | | | | | 2,003,890 | |
| | | | | | | | |
| | | | Industrial–1.7% | | | | |
| 15,400 | | | | Aircastle Limited | | | 173,250 | |
| 9,000 | | | | Diana Shipping Inc. | | | 236,520 | |
| 111,695 | | | | Intermet Corporation #~ | | | 13,403 | |
| 28,500 | | | | OceanFreight Inc. | | | 623,295 | |
| 56,200 | | | | Orion Marine Group (Acquired 5/17/07–8/1/07, Cost $774,300) †~ | | | 671,590 | |
| 1,200 | | | | Port Townsend Paper Corp. ~ | | | 198,000 | |
| | | | | | | | |
| | | | | | | 1,916,058 | |
| | | | | | | | |
| | | | Technology–1.6% | | | | |
| 342,600 | | | | Banctec Inc. (Acquired 6/27/07–8/1/07, Cost $2,740,800) †~ | | | 1,713,000 | |
| 4,169 | | | | Taiwan Semiconductor Manufacturing Company Ltd. | | | 42,816 | |
| | | | | | | | |
| | | | | | | 1,755,816 | |
| | | | | | | | |
| | | | Total Common Stocks
(cost $18,613,571) | | | 6,508,655 | |
| | | | | | | | |
| Eurodollar Time Deposits–2.1% of Net Assets | | | | |
| | | | State Street Bank & Trust Company Eurodollar time deposits dated March 31, 2008 1.000% maturing at $2,303,125 on April 1, 2008. | | | 2,303,061 | |
| | | | | | | | |
| | | | Total Investments–107.0% of Net Assets
(cost $344,526,063) | | | 118,405,236 | |
| | | | | | | | |
| | | | Other Assets and Liabilities, net–(7.0%) of Net Assets | | | (7,791,366 | ) |
| | | | | | | | |
| | | | Net Assets | | $ | 110,613,870 | |
| | | | | | | | |
| † | | Securities sold within the terms of a private placement memorandum, exempt from registration under Rule 144A under the Securities Act of 1933, as amended, and may be resold in transactions exempt from registration, normally to qualified institutional buyers. |
The Notes to the Financial Statements are an integral part of, and should be read in conjunction with, the Financial Statements.
17
RMK ADVANTAGE INCOME FUND, INC.
PORTFOLIOOF INVESTMENTS
MARCH 31, 2008
| ‡ | | See Note 2 of the accompanying Notes to the Financial Statements regarding investment valuations. |
| ~ | | Non-income producing securities. In the case of bonds, they missed their last coupon payment. |
| # | | Securities valued at fair value—See Note 2 of the accompanying Notes to the Financial Statements regarding investment valuations. |
| | | Substantially all of the Fund’s investment securities, other than equity securities, are pledged as collateral under the line of credit. |
The Notes to the Financial Statements are an integral part of, and should be read in conjunction with, the Financial Statements.
18
[THIS PAGE INTENTIONALLY LEFT BLANK]
19
RMK HIGH INCOME FUND, INC.
OBJECTIVE & STRATEGY
RMK High Income Fund, Inc. seeks a high level of current income. The Fund seeks capital growth as a secondary investment objective when consistent with its primary investment objective. The Fund invests a majority of its total assets in below investment grade debt securities (commonly referred to as “junk bonds”) that offer attractive yield and capital appreciation potential. The Fund may also invest in investment grade debt securities, up to 15% of its total assets in foreign debt and foreign equity securities and up to 25% of its total assets in domestic equity securities, including common and preferred stocks. The Fund invests in a wide range of below investment grade debt securities, including corporate bonds, mortgage-backed and asset-backed securities and municipal and foreign government obligations, as well as securities of companies in bankruptcy reorganization proceedings or otherwise in the process of debt restructuring. (Below investment grade debt securities are rated Ba1 or lower by Moody’s Investors Service, Inc., BB+ or lower by Standard & Poor’s Ratings Group, comparably rated by another nationally recognized statistical rating organization or, if unrated, determined by the Fund’s investment adviser to be of comparable quality.) The Fund may use leverage through bank borrowings, reverse repurchase agreements or other transactions involving indebtedness or through the issuance of preferred shares. The Fund may leverage up to 33 1/3% of its total assets (in each case including the amount borrowed). The Fund may vary its use of leverage in response to changing market conditions.
INVESTMENT RISKS: Investors in any bond fund should anticipate fluctuations in price. Bond prices and the value of bond funds decline as interest rates rise. Bonds with longer-term maturities generally are more vulnerable to interest rate risk than bonds with shorter-term maturities. Below investment grade bonds involve greater credit risk, which is the risk that the issuer will not make interest or principal payments when due. An economic downturn or period of rising interest rates could adversely affect the ability of issuers, especially issuers of below investment grade debt, to service primary obligations and an unanticipated default could cause the Fund to experience a reduction in value of its shares. The Fund’s investments in mortgage-backed or asset-backed securities that are “subordinated” to other interests in the same pool may increase credit risk to the extent that the Fund as a holder of those securities may only receive payments after the pool’s obligations to other investors have been satisfied. Below investment grade bonds are also subject to greater price volatility and are less liquid, especially during periods of economic uncertainty or change, than higher-rated debt securities. The value of U.S. and foreign equity securities in which the Fund invests will change based on changes in a company’s financial condition and in overall market and economic conditions. Leverage creates an opportunity for an increased return to common stockholders,
(Unaudited)
20
RMK HIGH INCOME FUND, INC.
but unless the income and capital appreciation, if any, on securities acquired with leverage proceeds exceed the costs of the leverage, the use of leverage will diminish the investment performance of the Fund’s shares. Use of leverage may also increase the likelihood that the net asset value of the Fund and market value of its common shares will be more volatile, and the yield and total return to common stockholders will tend to fluctuate more in response to changes in interest rates and credit worthiness.
MANAGEMENT DISCUSSIONOF FUND PERFORMANCE
For the six months and the fiscal year ended March 31, 2008, the Fund had a total return of -55.60% and - -72.40%, respectively, based on market price and reinvested dividends and other distributions. For the six months and the fiscal year ended March 31, 2008, the Fund had a total return of -49.34% and -68.72%, respectively, based on net asset value and reinvested dividends and other distributions. For the six months and the twelve months ended March 31, 2008, the Lehman Brothers Ba U.S. High Yield Index(1) had a total return of -1.98% and -1.25%, respectively.
The very difficult market conditions for credit-oriented securities that were prevalent at the Fund’s semi-annual update continued into the new year, with the first calendar quarter of 2008 being perhaps the worst market conditions we have seen up to this point. The collapse and subsequent government sponsored rescue of Bear Stearns poignantly illustrates the continuing withdrawal of credit availability and liquidity in the current market environment.
It goes without saying that we have been very disappointed with the Fund’s performance over the past year. In the past, our allocation of assets across a wide variety of collateral and security types had proven beneficial to the Fund’s performance. In this market cycle, however, these assets have suffered from extreme illiquidity along with assets that have in fact suffered actual credit deterioration. Although the headlines are dominated by references to the subprime mortgage crisis and the bursting of the real estate bubble, the most difficult management issue has been the complete disappearance of market making capacity of the primary broker-dealer community. Bear Stearns has in fact exited the market, but as a practical matter, most other primary dealers have either ceased to, or no longer have the capacity to commit capital to any of the credit sensitive sectors.
Lending against all but the most liquid, highly rated assets is, for all practical purposes, no longer available. Consequently, our focus has had to become much narrower. Although there is more potential for attractive returns in the market place today compared to the market environment immediately following the events of September 11, 2001, overall market liquidity concerns have restricted our capacity
(Unaudited)
21
RMK HIGH INCOME FUND, INC.
to take advantage of the current situation. Financial assets in general continue to be under pricing pressure, especially in the residential mortgage sector.
The Federal Open Market Committee has aggressively lowered short-term lending rates and has introduced a facility to allow primary broker-dealers access to the discount window. These are extremely important big picture developments. The eventual effort should be to provide some liquidity to the mortgage market and, with short-term rates now at a mere 2.0%, force more capital back into risky assets. At this point, there continues to be pervasive concerns about the direction of the economy and the health of our banking system. Such uncertainty continues to pressure market values by simply overwhelming any periodic buy interest with massive supply. However, we are seeing more opportunistic buyers beginning to participate and hopefully this will begin to shift the momentum. At this time, our focus will have to remain on stabilizing asset values and trying to identify those assets that have the highest probability of substantial recovery.
James C. Kelsoe, Jr., CFA
Senior Portfolio Manager
Morgan Asset Management, Inc.
Market forecasts provided in this report may not necessarily come to pass. There is no assurance that the Fund will achieve its investment objectives. These views are subject to change at any time based upon market or other conditions, and Morgan Asset Management, Inc. disclaims any responsibility to update such views. The Fund is subject to market risk, which is the possibility that the market values of securities owned by the Fund will decline and, therefore, the value of the Fund’s shares may be less than what you paid for them. Accordingly, you can lose money investing in the Fund.
INDEX DESCRIPTION
(1) | | The Lehman Brothers Ba U.S. High Yield Index is a broad-based unmanaged index of fixed rate, non-investment grade debt. Pay-in-kind (PIK) bonds, Eurobonds and debt issues from countries designated as emerging markets (e.g., Argentina, Brazil and Venezuela) are excluded, but Canadian and global bonds (SEC registered) of issuers in non-emerging countries are included. Original issue zeroes, step-up coupon structures and 144As are also included. The index is unmanaged and, unlike the Fund, is not affected by cash flows or trading and other expenses. It is not possible to invest directly in an index. |
(Unaudited)
22
RMK HIGH INCOME FUND, INC.
PORTFOLIO STATISTICS†
AS OF MARCH 31, 2008
| | |
Average Credit Quality | | BB |
Current Yield | | 27.4% |
Yield to Maturity | | 16.1% |
Duration | | 3.7 Years |
Average Effective Maturity | | 4.9 Years |
Percentage of Leveraged Assets | | 12.7% |
Total Number of Holdings | | 165 |
| † | | The Fund’s composition is subject to change. |
CREDIT QUALITY†
AS OF MARCH 31, 2008
| | | | | | |
| %OFDEBTSECURITIES | | %OFDEBTSECURITIES |
AAA | | 19.1% | | B | | 17.5% |
AA | | 1.2% | | CCC | | 17.5% |
A | | 2.1% | | CC | | 4.2% |
BBB | | 10.0% | | C | | 0.8% |
BB | | 6.9% | | Not Rated | | 20.7% |
| | | | | | |
| | | | Total | | 100.0% |
† | | The Fund’s composition is subject to change. |
ASSET ALLOCATION†
AS OF MARCH 31, 2008
| | |
| %OFTOTALINVESTMENTS |
Corporate Bonds | | 33.6% |
Collateralized Mortgage Obligations | | 23.7% |
Collateralized Debt Obligations | | 20.3% |
Common Stocks | | 5.9% |
Equipment Leases | | 4.7% |
Collateralized Loan Obligations | | 3.3% |
Manufactured Housing Loans | | 2.2% |
Certificate-Backed Obligations | | 0.9% |
Home Equity Loans | | 0.5% |
Residential Mortgage-Backed Securities | | 0.1% |
Municipal Securities | | 0.1% |
Short-Term Investments | | 4.7% |
| | |
Total | | 100.0% |
| † | | The Fund’s composition is subject to change. |
(Unaudited)
23
RMK HIGH INCOME FUND, INC.
NAV & MARKET PRICE HISTORY*
The graph below illustrates the net asset value and market price history of RMK High Income Fund, Inc. (NYSE: RMH) from the commencement of investment operations on June 24, 2003 to March 31, 2008.
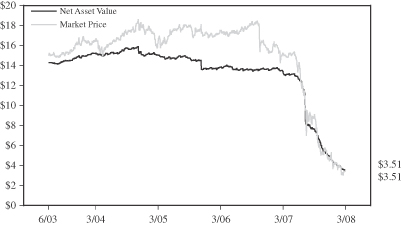
| * | | Net asset value is calculated every day that the New York Stock Exchange is open as of the close of trading (normally 4:00 p.m. Eastern Time) by taking the closing market value of all portfolio securities, cash and other assets owned, subtracting all liabilities, then dividing the result (total net assets) by the total number of shares outstanding. The market price is the last reported price at which a share of the Fund was sold on the New York Stock Exchange. |
(Unaudited)
24
RMK HIGH INCOME FUND, INC.
PERFORMANCE INFORMATION
| | | | | | | | | |
| | | AVERAGE ANNUAL TOTAL RETURNS | |
| AS OF MARCH 31, 2008 | | SIX MONTHS* | | | 1 YEAR | | | COMMENCEMENT
OF INVESTMENT
OPERATIONS(1) | |
| MARKET VALUE | | (55.60 | )% | | (72.40 | )% | | (14.70 | )% |
| NET ASSET VALUE | | (49.34 | )% | | (68.72 | )% | | (14.19 | )% |
LEHMAN BROTHERS BA U.S. HIGH YIELD INDEX(2) | | (1.98 | )% | | (1.25 | )% | | — | |
| * | | Not annualized for periods less than one year. |
(1) | | The Fund commenced investment operations on June 24, 2003. |
(2) | | The Lehman Brothers Ba U.S. High Yield Index is a broad-based unmanaged index of fixed rate, non-investment grade debt. Pay-in-kind (PIK) bonds, Eurobonds and debt issues from countries designated as emerging markets (e.g., Argentina, Brazil and Venezuela) are excluded, but Canadian and global bonds (SEC registered) of issuers in non-emerging countries are included. Original issue zeroes, step-up coupon structures and 144As are also included. The index is unmanaged and, unlike the Fund, is not affected by cash flows or trading and other expenses. It is not possible to invest directly in an index. |
Performance data quoted represents past performance, which is no guarantee of future results. Investment return and principal value will fluctuate so that an investor’s shares, when redeemed, may be worth more or less than their original cost. Fund performance changes over time and current performance may be lower or higher than what is stated. For the most recent performance, call toll-free 800-564-2188. Total returns assume an investment at the common share market price or net asset value at the beginning of the period, reinvestment of all dividends and other distributions for the period in accordance with the Fund’s dividend reinvestment plan, and sale of all shares at the closing market price (excluding any commissions) or net asset value at the end of the period. Returns shown in the table do not reflect the deduction of taxes that a stockholder would pay on Fund distributions or on the sale of Fund shares. Closed-end funds are not bank deposits or obligations, are not guaranteed by any bank and are not insured or guaranteed by the U.S. government, the Federal Deposit Insurance Corporation, the Federal Reserve Board or any other government agency. Investment in closed-end funds involves investment risk, including possible loss of principal.
(Unaudited)
25
RMK HIGH INCOME FUND, INC.
PORTFOLIOOF INVESTMENTS
MARCH 31, 2008
| | | | | | | |
Principal
Amount/
Notional
Amount/
Shares | | | | Description | | Value ‡ |
| | | | | | | |
| Asset-Backed Securities–Investment Grade*–13.0% of Net Assets | | | |
| | | | Certificate-Backed Obligations (“CBO”)–0.9% | | | |
| 2,000,000 | | | | Diversified Asset Securitization Holdings III 1A A3L, 5.436% 7/5/36 (Acquired 2/6/07, Cost $1,543,484) †# | | $ | 600,000 |
| 1,902,416 | | | | MKP CBO I Ltd., 4A CS 2.000% 7/12/40 (Acquired 3/9/05, Cost $1,902,416) †# | | | 123,657 |
| | | | | | | |
| | | | | | | 723,657 |
| | | | | | | |
| | | | Collateralized Debt Obligations (“CDO”)–9.5% | | | |
| 2,000,000 | | | | CDO Repack SPC Ltd. 2006-BRGA, 12/5/51 #~ | | | 200 |
| 1,000,000 | | | | Kodiak CDO 2007-2A E, 6.412% 11/7/42 (Acquired 6/29/07, Cost $983,734) †# | | | 45,000 |
| 2,000,000 | | | | Lincoln Park Referenced Link Notes 2001-1, 6.671% 7/30/31 (Acquired 9/12/06, Cost $1,793,727) †# | | | 1,220,000 |
| 1,967,001 | | | | Millstone III-A CDO Ltd., 7/5/46 #~ | | | 197 |
| 3,000,000 | | | | Palmer Square 2A CN, 11/2/45 (Acquired 10/25/05, Cost $2,985,916) †#~ | | | 7,500 |
| 1,450,000 | | | | Preferred Term Securities XXVIII, Ltd., 4.434% 3/22/38 (Acquired 12/12/07, Cost $1,325,834) †# | | | 1,051,250 |
| 2,991,609 | | | | Pyxis Master Trust 2006-7, 7.709% 10/1/37 (Acquired 11/21/06, Cost $2,991,609) †# | | | 127,143 |
| 6,000,000 | | | | Steers Delaware Business Trust 2007-A, 5.384% 6/20/18 (Acquired 2/9/07–8/24/07, Cost $5,990,559) †# | | | 5,280,000 |
| 4,123,306 | | | | Taberna Preferred Funding Ltd. 2006-6A, 6.096% 12/5/36 (Acquired 6/27/06, Cost $4,102,201) †# | | | 41,233 |
| 2,838,133 | | | | Taberna Preferred Funding Ltd. 2006-7A C1, 1.000% 2/5/37 (Acquired 9/28/06, Cost $2,795,628) †# | | | 56,763 |
| | | | | | | |
| | | | | | | 7,829,286 |
| | | | | | | |
| | | | Home Equity Loans–0.2% | | | |
| 340,712 | | | | Fremont Home Loan Trust 2004-4 M7, 4.319% 3/25/35 | | | 177,697 |
| | | | | | | |
| | | | Manufactured Housing Loans–2.4% | | | |
| 2,087,664 | | | | Mid-State Trust 2005-1 B, 7.758% 1/15/40 | | | 1,945,177 |
| | | | | | | |
| | | | Total Asset-Backed Securities–Investment Grade*
(cost $32,369,980) | | | 10,675,817 |
| | | | | | | |
| Asset-Backed Securities–Below Investment Grade or Unrated*–21.3% of Net Assets | | | |
| | | | Certificate-Backed Obligations (“CBO”)–0.1% | | | |
| 1,552,867 | | | | Helios Series I Multi-Asset CBO, Ltd. IA C, 7.706% 12/13/36 (Acquired 11/3/06, Cost $635,173) †# | | | 31,057 |
| | | | | | | |
The Notes to the Financial Statements are an integral part of, and should be read in conjunction with, the Financial Statements.
26
RMK HIGH INCOME FUND, INC.
PORTFOLIOOF INVESTMENTS
MARCH 31, 2008
| | | | | | | |
Principal
Amount/
Notional
Amount/
Shares | | | | Description | | Value ‡ |
| | | | | | | |
| Asset-Backed Securities–Below Investment Grade or Unrated* (continued) | | | |
| | | | Collateralized Debt Obligations (“CDO”)–12.3% | | | |
| 1,000,000 | | | | 801 Grand CDO 2006-1 LLC, 8.542% 9/20/16 (Acquired 8/4/06, Cost $985,366) †# | | $ | 657,500 |
| 1,000,000 | | | | Aardvark Asset-Backed Securities CDO 2007-1A, 7/6/47 in default #~ | | | 100 |
| 2,000,000 | | | | Acacia CDO, Ltd. 10A, 4.570% 9/7/46 (Acquired 8/3/06, Cost $957,287) †# | | | 80,000 |
| 4,000,000 | | | | Aladdin CDO I Ltd. 2006-3A, 7.542% 10/31/13 (Acquired 8/7/06–7/2/07, Cost $2,303,854) †# | | | 410,000 |
| 270,000 | | | | Attentus CDO Ltd. 2006-2A E2, 10/9/41 #~ | | | 4,050 |
| 2,000,000 | | | | Attentus CDO Ltd. 2006-2A F1, 10/9/41 (Acquired 10/12/06, Cost $1,952,100) †#~ | | | 15,000 |
| 680,000 | | | | Attentus CDO Ltd. 2006-2A F2, 10/9/41 #~ | | | 5,100 |
| 3,000,000 | | | | Attentus CDO Ltd. 2007-3A F2, 10/11/42 (Acquired 1/18/07, Cost $2,884,198) †#~ | | | 7,500 |
| 2,077,319 | | | | Broderick CDO Ltd. 2007-3A D, 6.808% 12/6/50 (Acquired 3/8/07, Cost $2,038,604) †# | | | 208 |
| 1,000,000 | | | | Cairn Mezzanine Asset-Backed CDO PLC 2007-3A, 3.688% 8/13/47 # | | | 100 |
| 4,000,000 | | | | Dillon Read CDO Ltd. 2006-1A, 13.000% 12/5/46 (Acquired 11/2/06, Cost $3,514,261) †# | | | 1,030,000 |
| 3,000,000 | | | | Diversified Asset Securitization Holdings II 1A B1, 9.712% 9/15/35 (Acquired 10/31/05–11/8/05, Cost $1,600,358) †# | | | 52,500 |
| 1,250,000 | | | | Duane Park, 11.000% 6/27/16 (Acquired 12/20/07, Cost $500,675) †# | | | 234,375 |
| 1,000,000 | | | | Gulf Stream Atlantic CDO Ltd. 2007-1A, 7/13/47 (Acquired 2/28/07, Cost $844,318) †#~ | | | 100 |
| 2,897,636 | | | | IMAC CDO Ltd. 2007-2A E, 10/20/50 (Acquired 5/4/07, Cost $2,772,069) †#~ | | | 290 |
| 1,000,000 | | | | IXIS ABS 1 Ltd., 12/12/46 (Acquired 11/15/06, Cost $787,560) †#~ | | | 20,000 |
| 12,000,000 | | | | Kenmore Street Synthetic CDO 2006-1A, 7.542% 4/30/14 (Acquired 8/25/06–12/29/06, Cost $6,277,481) †# | | | 1,410,000 |
| 1,000,387 | | | | Knollwood CDO Ltd. 2006-2A E, 10.377% 7/13/46 (Acquired 8/24/06, Cost $1,000,387) †# | | | 100 |
| 2,000,000 | | | | Knollwood CDO Ltd. 2006-2A SN, 7/13/46 #~ | | | 200 |
| 4,000,000 | | | | Kodiak CDO 2006-1A, 8/7/37 (Acquired 9/29/06, Cost $3,619,520) †#~ | | | 10,000 |
| 3,133,608 | | | | Kodiak CDO 2006-1A G, 6.662% 8/7/37 (Acquired 12/12/06–2/8/07, Cost $3,051,911) †# | | | 7,834 |
| 3,933,458 | | | | Lancer Funding Ltd. 2007-2A A3, 7/15/47 in default (Acquired 5/24/07, Cost $3,593,214) †#~ | | | 393 |
| 2,889,504 | | | | Lexington Capital Funding Ltd. 2007-3A F, 8.551% 4/10/47 (Acquired 2/9/07, Cost $2,805,283) †# | | | 101,133 |
The Notes to the Financial Statements are an integral part of, and should be read in conjunction with, the Financial Statements.
27
RMK HIGH INCOME FUND, INC.
PORTFOLIOOF INVESTMENTS
MARCH 31, 2008
| | | | | | | |
Principal
Amount/
Notional
Amount/
Shares | | | | Description | | Value ‡ |
| | | | | | | |
| Asset-Backed Securities–Below Investment Grade or Unrated* (continued) | | | |
| | | | Collateralized Debt Obligations (“CDO”) (continued) | | | |
| 2,000,000 | | | | Linker Finance PLC 16A E, 6.059% 5/19/45 (Acquired 5/19/06, Cost $1,942,876) †# | | $ | 95,000 |
| 1,039,100 | | | | Newbury Street CDO Ltd. 2007-1A D, 6.858% 3/4/53 (Acquired 3/8/07, Cost $1,024,572) †# | | | 104 |
| 1,961,789 | | | | Norma CDO Ltd. 2007-1A E, 7.339% 3/11/49 (Acquired 3/1/07, Cost $1,942,679) †# | | | 19,618 |
| 1,500,000 | | | | Parcs-R 2007-8, 5.099% 1/25/46 (Acquired 6/21/07, Cost $1,500,000) †# | | | 138,750 |
| 1,000,000 | | | | Pasa Funding Ltd. 2007-1A D, 4/7/52 in default #~ | | | 100 |
| 1,000,000 | | | | Preferred Term Securities II, Ltd., 10.000% 5/22/33 (Acquired 7/29/05, Cost $1,085,503) †# | | | 317,500 |
| 3,000,000 | | | | Preferred Term Securities XXI, Ltd., 10.000% 3/22/38
(Acquired 3/28/06–7/31/07, Cost $2,788,727) †# | | | 585,000 |
| 998,147 | | | | Preferred Term Securities XXI-2TR, 9.999% 3/22/38 (Acquired 6/29/07, Cost $956,773) †# | | | 429,203 |
| 2,400,000 | | | | Preferred Term Securities XXII, Ltd., 9/22/36 (Acquired 2/26/07, Cost $2,372,895) †~ | | | 800,640 |
| 3,200,000 | | | | Preferred Term Securities XXIII, Ltd., 12/22/36 (Acquired 12/4/06–2/26/07, Cost $3,138,533) †~ | | | 1,332,160 |
| 2,500,000 | | | | Preferred Term Securities XXVIII, Ltd., 10.000% 3/22/38 (Acquired 12/12/07, Cost $2,466,885) †# | | | 1,737,500 |
| 997,523 | | | | Pyxis Master Trust, 7.709% 10/1/37 (Acquired 11/21/06,
Cost $997,523) †# | | | 42,395 |
| 1,923,503 | | | | Sharps CDO 2006-1A D, 5/8/46 (Acquired 1/25/07,
Cost $1,825,560) †#~ | | | 14,426 |
| 1,000,000 | | | | Squared CDO Ltd. 2007-1A C, 8.089% 5/11/57 (Acquired 5/11/07, Cost $975,440) †# | | | 10,000 |
| 1,023,991 | | | | Tahoma CDO Ltd. 2007-2A D, 7.300% 9/15/47 (Acquired 3/28/07, Cost $955,743) †# | | | 7,680 |
| 1,316,750 | | | | TPref Funding III Ltd., 1/15/33 (Acquired 7/23/03, Cost $1,289,515) †#~ | | | 391,733 |
| 1,500,000 | | | | Trapeza CDO I LLC 2006-10A, 6/6/41 #~ | | | 7,500 |
| 2,000,000 | | | | Trapeza CDO I LLC 2006-10A D2, 8.700% 6/6/41 (Acquired 6/15/06, Cost $2,000,000) †# | | | 190,000 |
| 2,000,000 | | | | Trapeza CDO I LLC 2006-11A, 10/10/41 #~ | | | 200 |
| 2,000,000 | | | | Trapeza CDO I LLC 2006-11A F, 10/10/41 #~ | | | 15,000 |
| 2,000,000 | | | | WEBS CDO 2006-1 PS, 4/13/47 (Acquired 12/7/06, Cost $1,800,000) †#~ | | | 20 |
| | | | | | | |
| | | | | | | 10,181,012 |
| | | | | | | |
The Notes to the Financial Statements are an integral part of, and should be read in conjunction with, the Financial Statements.
28
RMK HIGH INCOME FUND, INC.
PORTFOLIOOF INVESTMENTS
MARCH 31, 2008
| | | | | | | |
Principal
Amount/
Notional
Amount/
Shares | | | | Description | | Value ‡ |
| | | | | | | |
| Asset-Backed Securities–Below Investment Grade or Unrated* (continued) | | | |
| | | | Collateralized Loan Obligations (“CLO”)–3.5% | | | |
| 1,000 | | | | Credit Genesis CLO 2005, 6/23/10 (Acquired 6/23/05,
Cost $1,000,000) †#~ | | $ | 650,000 |
| 1,500,000 | | | | Eirles Two Ltd. 262, 8.612% 8/3/21 # | | | 930,000 |
| 2,300,000 | | | | Eirles Two Ltd. 263, 11.112% 8/3/21 # | | | 1,311,000 |
| | | | | | | |
| | | | | | | 2,891,000 |
| | | | | | | |
| | | | Equipment Leases–5.1% | | | |
| 6,750,400 | | | | Aerco Limited 1X C1, 7/15/23 #~ | | | 168,760 |
| 7,123,631 | | | | Aerco Limited 2A B2, 7/15/25 (Acquired 7/25/06–1/23/07, Cost $3,511,353) †#~ | | | 534,272 |
| 6,930,122 | | | | Aerco Limited 2A C2, 7/15/25 (Acquired 10/20/05–8/17/06, Cost $2,477,016) †#~ | | | 277,205 |
| 626,718 | | | | DVI Receivables Corp. 2001-2 A3, 3.519% 11/8/31 # | | | 238,153 |
| 879,510 | | | | DVI Receivables Corp. 2001-2 A4, 4.613% 11/11/09 # | | | 351,804 |
| 3,396,478 | | | | DVI Receivables Corp. 2002-1 A3A, 3.350% 6/11/10 # | | | 1,018,943 |
| 2,768,946 | | | | Guggenheim Equipment Trust 2007-1A, 11.193% 7/15/31 (Acquired 5/10/07–7/31/07, Cost $2,044,343) †# | | | 1,606,044 |
| | | | | | | |
| | | | | | | 4,195,181 |
| | | | | | | |
| | | | Home Equity Loans–0.3% | | | |
| 536,290 | | | | Ameriquest Mortgage Securities Inc. 2003-8 MV6, 6.349% 10/25/33 | | | 38,943 |
| 492,609 | | | | Amresco Residential Securities Mortgage Loan Trust 1999-1 B, 11/25/29~ | | | 73,779 |
| 3,000,000 | | | | Meritage Asset Holdings 2005-2 N4, 7.500% 11/25/35 (Acquired 10/26/05, Cost $2,336,490) †# | | | 27,000 |
| 1,638,754 | | | | Soundview Home Equity Loan Trust 2005-A B1, 5.599% 4/25/35 (Acquired 6/23/05, Cost $1,420,433) †# | | | 93,245 |
| 932,634 | | | | Terwin Mortgage Trust 2005-7SL, 7/25/35 (Acquired 7/29/05, Cost $813,974) †#~ | | | 93 |
| 872,156 | | | | Terwin Mortgage Trust 2005-11SL B7, 11/25/36 (Acquired 10/31/05, Cost $642,738) †#~ | | | 15,699 |
| 3,000,000 | | | | Terwin Mortgage Trust 2005-R1, 12/28/36 (Acquired 12/21/05, Cost $2,221,684) †#~ | | | 8,250 |
| 4,000,000 | | | | Terwin Mortgage Trust 2006-R3, 6/26/37 (Acquired 6/30/06, Cost $3,310,911) †#~ | | | 400 |
| | | | | | | |
| | | | | | | 257,409 |
| | | | | | | |
| | | | Total Asset-Backed Securities–Below Investment Grade or Unrated*
(cost $111,811,644) | | | 17,555,659 |
| | | | | | | |
The Notes to the Financial Statements are an integral part of, and should be read in conjunction with, the Financial Statements.
29
RMK HIGH INCOME FUND, INC.
PORTFOLIOOF INVESTMENTS
MARCH 31, 2008
| | | | | | | |
Principal
Amount/
Notional
Amount/
Shares | | | | Description | | Value ‡ |
| | | | | | | |
| Corporate Bonds–Investment Grade*–2.8% of Net Assets | | | |
| | | | Finance–2.0% | | | |
| 2,000,000 | | | | Catlin Insurance Company Ltd., 7.249% 12/31/49 (Acquired 11/2/07, Cost $1,886,717) † | | $ | 1,669,340 |
| | | | | | | |
| | | | Special Purpose Entities–0.8% | | | |
| 2,000,000 | | | | Fixed Income Pass-Through Trust 2007-C JPM Class B, 5/15/77
(Acquired 6/22/07, Cost $2,040,301) †#~ | | | 660,000 |
| | | | | | | |
| | | | Total Corporate Bonds–Investment Grade*
(cost $3,927,018) | | | 2,329,340 |
| | | | | | | |
| Corporate Bonds–Below Investment Grade or Unrated*–33.4% of Net Assets | | | |
| | | | Apparel–2.7% | | | |
| 2,928,000 | | | | Rafaella Apparel Group Inc., 11.250% 6/15/11 | | | 2,196,000 |
| | | | | | | |
| | | | Automotive–1.7% | | | |
| 725,000 | | | | General Motors, 8.375% 7/15/33 | | | 511,125 |
| 3,225,000 | | | | Metaldyne Corp., 11.000% 6/15/12 | | | 903,000 |
| | | | | | | |
| | | | | | | 1,414,125 |
| | | | | | | |
| | | | Basic Materials–4.9% | | | |
| 1,825,000 | | | | AmeriCast Technologies Inc., 11.000% 12/1/14
(Acquired 11/21/06–3/30/07, Cost $1,852,115) † | | | 1,571,781 |
| 2,500,000 | | | | Key Plastics LLC, 11.750% 3/15/13 (Acquired 3/12/07–6/19/07, Cost $2,509,498) † | | | 1,800,000 |
| 850,000 | | | | Noranda Aluminium Holding Corp., 11/15/14 (Acquired 7/17/07–7/23/07, Cost $819,720) †~ | | | 624,750 |
| | | | | | | |
| | | | | | | 3,996,531 |
| | | | | | | |
| | | | Communications–1.9% | | | |
| 3,075,000 | | | | CCH I Holdings LLC, 11.750% 5/15/14 | | | 1,552,875 |
| | | | | | | |
| | | | Entertainment–2.2% | | | |
| 1,650,000 | | | | French Lick Resorts & Casino LLC, 10.750% 4/15/14
(Acquired 2/7/07–5/14/07, Cost $1,515,069) † | | | 990,000 |
| 1,425,000 | | | | Six Flags Inc., 9.625% 6/1/14 | | | 805,125 |
| | | | | | | |
| | | | | | | 1,795,125 |
| | | | | | | |
| | | | Finance–2.8% | | | |
| 2,050,000 | | | | Advanta Capital Trust I, 8.990% 12/17/26 | | | 1,327,375 |
| 1,000,000 | | | | Assurance America, 10.500% 12/31/35 (Acquired 2/2/07, Cost $979,603) †# | | | 980,000 |
| 500,000 | | | | Security Capital Assurance Ltd., 6/17/49~ | | | 25,000 |
| | | | | | | |
| | | | | | | 2,332,375 |
| | | | | | | |
The Notes to the Financial Statements are an integral part of, and should be read in conjunction with, the Financial Statements.
30
RMK HIGH INCOME FUND, INC.
PORTFOLIOOF INVESTMENTS
MARCH 31, 2008
| | | | | | | |
Principal
Amount/
Notional
Amount/
Shares | | | | Description | | Value ‡ |
| | | | | | | |
| Corporate Bonds–Below Investment Grade or Unrated* (continued) | | | |
| | | | Industrials–3.5% | | | |
| 289,584 | | | | Home Products Inc., pays-in-kind 3/20/17 #~ | | $ | 56,614 |
| 2,425,000 | | | | Momentive Performance, 11.500% 12/1/16 | | | 1,846,031 |
| 1,900,000 | | | | Terphane Holding Corp., 12.500% 6/15/09 (Acquired 4/25/06–10/10/07, Cost $1,882,515) † | | | 1,007,000 |
| | | | | | | |
| | | | | | | 2,909,645 |
| | | | | | | |
| | | | Manufacturing–3.7% | | | |
| 1,950,000 | | | | JB Poindexter & Co. Inc., 8.750% 3/15/14 | | | 1,269,938 |
| 3,575,000 | | | | MAAX Corp., 9.750% 6/15/12 | | | 786,500 |
| 1,075,000 | | | | Wolverine Tube, Inc., 10.500% 4/1/09 | | | 962,125 |
| | | | | | | |
| | | | | | | 3,018,563 |
| | | | | | | |
| | | | Paper Products–0.5% | | | |
| 525,000 | | | | Corp Durango SAB de CV, 10.500% 10/5/17
(Acquired 10/10/07–10/15/07, Cost $521,964) † | | | 393,750 |
| | | | | | | |
| | | | Real Estate Services–1.6% | | | |
| 3,050,000 | | | | Realogy Corp., 12.375% 4/15/15 | | | 1,357,250 |
| | | | | | | |
| | | | Retail–1.6% | | | |
| 1,167,000 | | | | Lazydays RV Center Inc., 11.750% 5/15/12 | | | 927,765 |
| 1,075,000 | | | | Uno Restaurant Corp., 10.000% 2/15/11 (Acquired 8/24/05–6/29/06, Cost $1,004,945) † | | | 430,000 |
| | | | | | | |
| | | | | | | 1,357,765 |
| | | | | | | |
| | | | Special Purpose Entities–2.4% | | | |
| 552,000 | | | | Interactive Health LLC, 7.250% 4/1/11 (Acquired 1/13/06–12/11/06, Cost $459,240) † | | | 331,200 |
| 2,075,000 | | | | PNA Intermediate Holding Corp., 10.065% 2/15/13 | | | 1,613,313 |
| | | | | | | |
| | | | | | | 1,944,513 |
| | | | | | | |
| | | | Telecommunications–2.2% | | | |
| 2,925,000 | | | | Primus Telecommunications GP, 8.000% 1/15/14 | | | 1,257,750 |
| 775,000 | | | | Securus Technologies Inc., 11.000% 9/1/11 | | | 558,000 |
| | | | | | | |
| | | | | | | 1,815,750 |
| | | | | | | |
| | | | Tobacco–1.7% | | | |
| 2,175,000 | | | | North Atlantic Trading Co., 9.250% 3/1/12 | | | 1,413,750 |
| | | | | | | |
| | | | Total Corporate Bonds–Below Investment Grade or Unrated*
(cost $43,701,833) | | | 27,498,017 |
| | | | | | | |
The Notes to the Financial Statements are an integral part of, and should be read in conjunction with, the Financial Statements.
31
RMK HIGH INCOME FUND, INC.
PORTFOLIOOF INVESTMENTS
MARCH 31, 2008
| | | | | | | |
Principal
Amount/
Notional
Amount/
Shares | | | | Description | | Value ‡ |
| | | | | | | |
| Mortgage-Backed Securities–Investment Grade*–10.6% of Net Assets | | | |
| | | | Collateralized Mortgage Obligations–10.6% | | | |
| 860,281 | | | | Countrywide Alternative Loan Trust 2005-49CB A5, 5.500% 11/25/35 | | $ | 768,469 |
| 1,482,072 | | | | Countrywide Alternative Loan Trust 2005-56 M4, 3.519% 11/25/35 # | | | 687,829 |
| 53,275,061 | | | | Countrywide Alternative Loan Trust 2006-HY12 A4X, 2.658% 8/25/36 interest-only strips | | | 2,112,836 |
| 3,000,000 | | | | Deutsche Mortgage Securities, Inc. 2006-RS1 N2, 4.393% 9/27/35 (Acquired 2/5/07, Cost $3,014,397) †# | | | 1,950,000 |
| 5,452,749 | | | | Harborview Mortgage Loan Trust 2003-2 1X, 3.368% 10/19/33 interest-only strips | | | 135,108 |
| 2,000,626 | | | | Residential Accredit Loans Inc. 2006-Q08 M4, 3.129% 10/25/46 # | | | 442,799 |
| 99,709,073 | | | | Residential Accredit Loans Inc. 2007-QH8 P, 0.500% 10/25/37 interest-only strips # | | | 408,807 |
| 116,580 | | | | Structured Asset Investment Loan Trust 2004-5A B, 6/27/34
(Acquired 7/8/04, Cost $114,058) †#~ | | | 2,506 |
| 1,795,630 | | | | Structured Asset Investment Loan Trust 2004-7A B, 8/27/34
(Acquired 1/27/06, Cost $1,769,935) †#~ | | | 6,105 |
| 2,500,000 | | | | Structured Asset Mortgage Investments Inc. 2006-AR3 1B1, 2.999% 4/25/36 | | | 1,041,998 |
| 1,305,646 | | | | Structured Asset Trust 2003-S A, 7.500% 12/28/33 (Acquired 12/24/03, Cost $1,294,446) †# | | | 351,610 |
| 56,323,790 | | | | Washington Mutual, Inc. 2007-0A3 CX2P, 0.567% 2/25/47 interest-only strips # | | | 871,329 |
| | | | | | | |
| | | | Total Mortgage-Backed Securities–Investment Grade*
(cost $14,600,709) | | | 8,779,396 |
| | | | | | | |
| Mortgage-Backed Securities–Below Investment Grade or Unrated*–14.9% of Net Assets | | | |
| | | | Collateralized Mortgage Obligations–14.8% | | | |
| 3,905,882 | | | | Countrywide Alternative Loan Trust 2006-6CB B5, 5.575% 5/25/36 # | | | 348,991 |
| 1,000,000 | | | | Countrywide Alternative Loan Trust 2006-OA11 N3, 12.500% 9/25/46 (Acquired 10/10/06, Cost $1,014,446) †# | | | 907,500 |
| 921,004 | | | | Countrywide Asset Backed Certificates 2006-SPS2 A, 2.759% 5/25/26 | | | 385,377 |
| 3,000,000 | | | | Greenwich Structured Adjustable Rate Mortgage Products 2005-3A N2,
2.000% 6/27/35 (Acquired 7/25/05, Cost $1,961,040) †# | | | 1,425,000 |
| 5,878,487 | | | | Greenwich Structured Adjustable Rate Mortgage Products 2005-4A N-2,
Zero Coupon Bond 7/27/45 (Acquired 9/26/05, Cost $3,207,303) †#~ | | | 2,645,319 |
| 2,700,000 | | | | GSAMP Trust 2006-S3 A2, 5.769% 5/25/36 | | | 828,495 |
| 2,000,000 | | | | Harborview Corp. 2006-8A N5, 7/21/36 (Acquired 10/11/06,
Cost $885,501) †#~ | | | 576,220 |
| 1,000,000 | | | | Harborview Corp. 2006-14 N4, 8.350% 3/19/38 (Acquired 3/6/07, Cost $847,378) †# | | | 794,390 |
The Notes to the Financial Statements are an integral part of, and should be read in conjunction with, the Financial Statements.
32
RMK HIGH INCOME FUND, INC.
PORTFOLIOOF INVESTMENTS
MARCH 31, 2008
| | | | | | | |
Principal
Amount/
Notional
Amount/
Shares | | | | Description | | Value ‡ |
| | | | | | | |
| Mortgage-Backed Securities–Below Investment Grade or Unrated* (continued) |
| | | | Collateralized Mortgage Obligations (continued) | | | |
| 5,000,000 | | | | Harborview Corp. 2006-14 PS, 12/19/36 (Acquired 3/6/07,
Cost $1,076,734) †#~ | | $ | 66,050 |
| 2,959,259 | | | | Harborview Mortgage Loan Trust 2006-4 B11, 4.309% 5/19/47 (Acquired 5/23/06, Cost $1,871,617) †# | | | 231,118 |
| 5,000,000 | | | | Long Beach Asset Holdings Corp. 2005-WL1 N4, 7.500% 6/25/45 (Acquired 11/7/05–12/7/06, Cost $4,610,552) †# | | | 23,250 |
| 2,607,053 | | | | Long Beach Mortgage Loan Trust 2005-WL2 B3, 5.635% 8/25/35 (Acquired 10/20/06–3/6/07, Cost $2,042,126) †# | | | 65,958 |
| 3,416,493 | | | | Long Beach Mortgage Loan Trust 2006-A A1, 2.689% 5/25/36 | | | 1,111,952 |
| 2,000,000 | | | | Long Beach Mortgage Loan Trust 2006-A A2, 5.548% 5/25/36 | | | 467,010 |
| 1,021,575 | | | | Park Place Securities Inc. 2005-WCW1 B, 5.000% 9/25/35 (Acquired 8/4/05, Cost $950,806) †# | | | 13,178 |
| 2,000,000 | | | | Park Place Securities Inc. 2005-WCW2 M10, 5.099% 7/25/35 # | | | 115,600 |
| 2,000,000 | | | | Park Place Securities Inc. 2005-WHQ3 M11, 5.099% 6/25/35 # | | | 990,680 |
| 1,000,000 | | | | Park Place Securities Inc. 2005-WHQ4, 5.099% 9/25/35 (Acquired 8/30/05, Cost $712,244) †# | | | 76,700 |
| 1,000,000 | | | | Sharp SP I LLC Trust 2006-A HM3 N3, 12.500% 10/25/46 (Acquired 10/13/06, Cost $1,000,000) †# | | | 867,820 |
| 2,167,000 | | | | Structured Asset Investment Loan Trust 2003-BC1 B2, 9.000% 5/25/32 | | | 262,575 |
| 1,306,112 | | | | Structured Asset Investment Loan Trust 2004-8 B2, 5.000% 9/25/34 | | | 67,813 |
| | | | | | | |
| | | | | | | 12,270,996 |
| | | | | | | |
| | | | Residential Mortgage-Backed Securities–0.1% | | | |
| 7 | | | | Harborview 2006-8, 7/22/36 (Acquired 10/11/06, Cost $1) †#~ | | | 1 |
| 67,000 | | | | Indymac Indx CI-1 Corp., 6/25/46 (Acquired 7/20/06, Cost $1,820,859) †#~ | | | 46,230 |
| | | | | | | |
| | | | | | | 46,231 |
| | | | | | | |
| | | | Total Mortgage-Backed Securities–Below Investment Grade or Unrated*
(cost $32,446,145) | | | 12,317,227 |
| | | | | | | |
| Municipal Securities–0.1% of Net Assets | | | |
| 13,185 | | | | Pima County Arizona Health Care Facilities, Revenue Bonds, 6.000% 6/1/08 | | | 12,899 |
| 24,836 | | | | Pima County Arizona Health Care Facilities, Revenue Bonds, 6.274% 6/1/09 | | | 21,324 |
| 35,126 | | | | Pima County Arizona Health Care Facilities, Revenue Bonds, 6.455% 6/1/10 | | | 27,195 |
| | | | | | | |
| | | | Total Municipal Securities
(cost $68,805) | | | 61,418 |
| | | | | | | |
The Notes to the Financial Statements are an integral part of, and should be read in conjunction with, the Financial Statements.
33
RMK HIGH INCOME FUND, INC.
PORTFOLIOOF INVESTMENTS
MARCH 31, 2008
| | | | | | | |
Principal
Amount/
Notional
Amount/
Shares | | | | Description | | Value ‡ |
| | | | | | | |
| Common Stocks–6.4% of Net Assets | | | |
| | | | Communications–0.2% | | | |
| 15,200 | | | | Citizens Communications Company | | $ | 159,448 |
| | | | | | | |
| | | | Consumer Products–0.2% | | | |
| 11,583 | | | | Home Products #~ | | | 347 |
| 160,000 | | | | Insight Health Services Holdings Corp ~ | | | 161,600 |
| | | | | | | |
| | | | | | | 161,947 |
| | | | | | | |
| | | | Energy–0.7% | | | |
| 10,600 | | | | Legacy Reserves LP | | | 211,576 |
| 128,000 | | | | Pinnacle Gas Resources, Inc. ~ | | | 323,840 |
| | | | | | | |
| | | | | | | 535,416 |
| | | | | | | |
| | | | Financials–1.6% | | | |
| 26,200 | | | | FSI Realty Trust (Acquired 5/3/07, Cost $262,000) †~ | | | 32,750 |
| 72,000 | | | | FSI Realty Trust Regulation D (Acquired 5/24/07, Cost $679,002) †~ | | | 90,000 |
| 38,235 | | | | Mid Country (Acquired 5/25/07, Cost $649,995) †#~ | | | 493,232 |
| 79,300 | | | | Star Asia Financial Ltd. (Acquired 3/2/07–8/1/07, Cost $808,900) † | | | 733,525 |
| | | | | | | |
| | | | | | | 1,349,507 |
| | | | | | | |
| | | | Industrials–2.0% | | | |
| 17,200 | | | | Aircastle Limited | | | 193,500 |
| 6,400 | | | | Diana Shipping Inc. | | | 168,192 |
| 91,386 | | | | Intermet Corporation #~ | | | 10,966 |
| 19,700 | | | | OceanFreight Inc. | | | 430,839 |
| 35,000 | | | | Orion Marine Group (Acquired 5/17/07–8/1/07, Cost $484,050) †~ | | | 418,250 |
| 20,500 | | | | Paragon Shipping Inc. | | | 310,780 |
| 875 | | | | Port Townsend Paper Corp. ~ | | | 144,375 |
| | | | | | | |
| | | | | | | 1,676,902 |
| | | | | | | |
| | | | Technology–1.7% | | | |
| 253,700 | | | | Banctec Inc. (Acquired 6/27/07–8/1/07, Cost $2,029,600) †~ | | | 1,268,500 |
| 9,500 | | | | Ness Technologies, Inc. ~ | | | 90,155 |
| 3,115 | | | | Taiwan Semiconductor Manufacturing Company Ltd. | | | 31,991 |
| | | | | | | |
| | | | | | | 1,390,646 |
| | | | | | | |
| | | | Total Common Stocks
(cost $14,599,137) | | | 5,273,866 |
| | | | | | | |
The Notes to the Financial Statements are an integral part of, and should be read in conjunction with, the Financial Statements.
34
RMK HIGH INCOME FUND, INC.
PORTFOLIOOF INVESTMENTS
MARCH 31, 2008
| | | | | | | | |
Principal
Amount/
Notional
Amount/
Shares | | | | Description | | Value ‡ | |
| | | | | | | | |
| Eurodollar Time Deposits–5.1% of Net Assets | | | | |
| | | | State Street Bank & Trust Company Eurodollar time deposits dated March 31, 2008, 1.000% maturing at $4,186,036 on April 1, 2008. | | $ | 4,185,920 | |
| | | | | | | | |
| | | | Total Investments–107.6% of Net Assets
(cost $257,711,191) | | | 88,676,660 | |
| | | | | | | | |
| | | | Other Assets and Liabilities, net–(7.6%) of Net Assets | | | (6,267,616 | ) |
| | | | | | | | |
| | | | Net Assets | | $ | 82,409,044 | |
| | | | | | | | |
| † | | These securities are sold within the terms of a private placement memorandum, are exempt from registration under Rule 144A under the Securities Act of 1933, as amended, and may be resold in transactions exempt from registration, normally to qualified institutional buyers. |
| ‡ | | See Note 2 of the accompanying Notes to the Financial Statements regarding investment valuations. |
| ~ | | Non-income producing security. In the case of bonds, they missed their last coupon payment. |
| # | | Security valued at fair value—See Note 2 of the accompanying Notes to the Financial Statements regarding investment valuations. |
| | | All of the Fund’s investment securities are pledged as collateral under the line of credit. |
The Notes to the Financial Statements are an integral part of, and should be read in conjunction with, the Financial Statements.
35
RMK MULTI-SECTOR
HIGH INCOME FUND, INC.
OBJECTIVE & STRATEGY
RMK Multi-Sector High Income Fund, Inc. seeks a high level of current income. The Fund seeks capital growth as a secondary investment objective when consistent with its primary investment objective. The Fund invests in a diversified portfolio consisting primarily of debt securities that offer attractive yield and capital appreciation potential. Under normal market conditions, the Fund invests a majority of its total assets in below investment grade debt securities (commonly referred to as “junk bonds”), including up to 20% of the Fund’s total assets in distressed securities. The Fund maintains the flexibility to invest up to 50% of its total assets in investment grade debt securities. The Fund invests up to 30% of its total assets in equity securities of both domestic and foreign issuers and up to 15% of its total assets in a combination of foreign debt and foreign equity securities. The Fund invests in a wide range of debt securities including, corporate bonds, mortgage-backed and asset-backed securities, convertible debt securities, distressed securities, including securities of companies in bankruptcy reorganization proceedings or otherwise in the process of debt restructuring, U.S. government and municipal obligations and foreign government obligations. (Below investment grade debt securities are rated Ba1 or lower by Moody’s Investors Service, Inc., BB+ or lower by Standard & Poor’s Ratings Group, comparably rated by another nationally recognized statistical rating organization or, if unrated, determined by the Fund’s investment adviser to be of comparable quality.) The Fund may use leverage through bank borrowings, reverse repurchase agreements or other transactions involving indebtedness or through the issuance of preferred stock. The Fund may leverage up to 33 1/3% of its total assets (in each case including the amounts obtained through leverage). The Fund may vary its use of leverage in response to changing market conditions.
INVESTMENT RISKS: Investors in any bond fund should anticipate fluctuations in price. Bond prices and the value of bond funds decline as interest rates rise. Bonds with longer-term maturities generally are more vulnerable to interest rate risk than bonds with shorter-term maturities. Below investment grade bonds involve greater credit risk, which is the risk that the issuer will not make interest or principal payments when due. An economic downturn or period of rising interest rates could adversely affect the ability of issuers, especially issuers of below investment grade debt, to service primary obligations and an unanticipated default could cause the Fund to experience a reduction in value of its shares. The Fund’s investments in mortgage-backed or asset-backed securities that are “subordinated” to other interests in the same pool may increase credit risk to the extent that the Fund as a holder of those securities may only receive payments after the pool’s obligations to other investors have been satisfied. Below investment grade bonds are also subject to greater price volatility and are less liquid, especially during periods of economic
(Unaudited)
36
RMK MULTI-SECTOR
HIGH INCOME FUND, INC.
uncertainty or change, than higher-rated debt securities. The value of U.S. and foreign equity securities in which the Fund invests will change based on changes in a company’s financial condition and in overall market and economic conditions. Leverage creates an opportunity for an increased return to common stockholders, but unless the income and capital appreciation, if any, on securities acquired with leverage proceeds exceed the costs of the leverage, the use of leverage will diminish the investment performance of the Fund’s shares. Use of leverage may also increase the likelihood that the net asset value of the Fund and market value of its common shares will be more volatile, and the yield and total return to common stockholders will tend to fluctuate more in response to changes in interest rates and creditworthiness.
MANAGEMENT DISCUSSIONOF FUND PERFORMANCE
For the six months and the fiscal year ended March 31, 2008, the Fund had a total return of -56.41% and - -72.67%, respectively, based on market price and reinvested dividends and other distributions. For the six months and the fiscal year ended March 31, 2008, the Fund had a total return of -52.34% and -72.48%, respectively, based on net asset value and reinvested dividends and other distributions. For the six months and the twelve months ended March 31, 2008, the Lehman Brothers Ba U.S. High Yield Index(1) had a total return of -1.98% and -1.25%, respectively.
The very difficult market conditions for credit-oriented securities that were prevalent at the Fund’s semi-annual update continued into the new year, with the first calendar quarter of 2008 being perhaps the worst market conditions we have seen up to this point. The collapse and subsequent government sponsored rescue of Bear Stearns poignantly illustrates the continuing withdrawal of credit availability and liquidity in the current market environment.
It goes without saying that we have been very disappointed with the Fund’s performance over the past year. In the past, our allocation of assets across a wide variety of collateral and security types had proven beneficial to the Fund’s performance. In this market cycle, however, these assets have suffered from extreme illiquidity along with assets that have in fact suffered actual credit deterioration. Although the headlines are dominated by references to the subprime mortgage crisis and the bursting of the real estate bubble, the most difficult management issue has been the complete disappearance of market making capacity of the primary broker-dealer community. Bear Stearns has in fact exited the market, but as a practical matter, most other primary dealers have either ceased to, or no longer have the capacity to commit capital to any of the credit sensitive sectors.
Lending against all but the most liquid, highly rated assets is, for all practical purposes, no longer available. Consequently, our focus has had to become much
(Unaudited)
37
RMK MULTI-SECTOR
HIGH INCOME FUND, INC.
narrower. Although there is more potential for attractive returns in the market place today compared to the market environment immediately following the events of September 11, 2001, overall market liquidity concerns have restricted our capacity to take advantage of the current situation. Financial assets in general continue to be under pricing pressure, especially in the residential mortgage sector.
The Federal Open Market Committee has aggressively lowered short-term lending rates and has introduced a facility to allow primary broker-dealers access to the discount window. These are extremely important big picture developments. The eventual effort should be to provide some liquidity to the mortgage market and, with short-term rates now at a mere 2.0%, force more capital back into risky assets. At this point, there continues to be pervasive concerns about the direction of the economy and the health of our banking system. Such uncertainty continues to pressure market values by simply overwhelming any periodic buy interest with massive supply. However, we are seeing more opportunistic buyers beginning to participate and hopefully this will begin to shift the momentum. At this time, our focus will have to remain on stabilizing asset values and trying to identify those assets that have the highest probability of substantial recovery.
James C. Kelsoe, Jr., CFA
Senior Portfolio Manager
Morgan Asset Management, Inc.
Market forecasts provided in this report may not necessarily come to pass. There is no assurance that the Fund will achieve its investment objectives. These views are subject to change at any time based upon market or other conditions, and Morgan Asset Management, Inc. disclaims any responsibility to update such views. The Fund is subject to market risk, which is the possibility that the market values of securities owned by the Fund will decline and, therefore, the value of the Fund’s shares may be less than what you paid for them. Accordingly, you can lose money investing in the Fund.
INDEX DESCRIPTION
(1) | | The Lehman Brothers Ba U.S. High Yield Index is a broad-based unmanaged index of fixed rate, non-investment grade debt. Pay-in-kind (PIK) bonds, Eurobonds and debt issues from countries designated as emerging markets (e.g., Argentina, Brazil and Venezuela) are excluded, but Canadian and global bonds (SEC registered) of issuers in non-emerging countries are included. Original issue zeroes, step-up coupon structures and 144As are also included. The index is unmanaged and, unlike the Fund, is not affected by cash flows or trading and other expenses. It is not possible to invest directly in an index. |
(Unaudited)
38
RMK MULTI-SECTOR
HIGH INCOME FUND, INC.
PORTFOLIO STATISTICS†
AS OF MARCH 31, 2008
| | |
Average Credit Quality | | BB |
Current Yield | | 32.4% |
Yield to Maturity | | 15.9% |
Duration | | 4.3 Years |
Average Effective Maturity | | 5.8 Years |
Percentage of Leveraged Assets | | 13.4% |
Total Number of Holdings | | 153 |
† | | The Fund’s composition is subject to change. |
CREDIT QUALITY†
AS OF MARCH 31, 2008
| | | | | | |
| %OFDEBTSECURITIES | | %OFDEBTSECURITIES |
AAA | | 14.2% | | B | | 18.3% |
AA | | 1.8% | | CCC | | 9.8% |
A | | 2.1% | | CC | | 5.5% |
BBB | | 12.3% | | C | | 0.7% |
BB | | 7.9% | | Not Rated | | 27.4% |
| | | | | | |
| | | | Total | | 100.0% |
| † | | The Fund’s composition is subject to change. |
ASSET ALLOCATION†
AS OF MARCH 31, 2008
| | |
| %OFTOTALINVESTMENTS |
Corporate Bonds | | 31.3% |
Collateralized Mortgage Obligations | | 24.4% |
Collateralized Debt Obligations | | 21.4% |
Common Stocks | | 5.9% |
Collateralized Loan Obligations | | 5.5% |
Equipment Leases | | 5.2% |
Manufactured Housing Loans | | 2.2% |
Home Equity Loans | | 1.4% |
Certificate Backed Obligations | | 1.4% |
Residential Mortgage-Backed Securities | | 0.1% |
Short-Term Investments | | 1.2% |
| | |
Total | | 100.0% |
| † | | The Fund’s composition is subject to change. |
(Unaudited)
39
RMK MULTI-SECTOR
HIGH INCOME FUND, INC.
NAV & MARKET PRICE HISTORY*
The graph below illustrates the net asset value and market price history of RMK Multi-Sector High Income Fund, Inc. (NYSE: RHY) from the commencement of investment operations on January 19, 2006 to March 31, 2008.
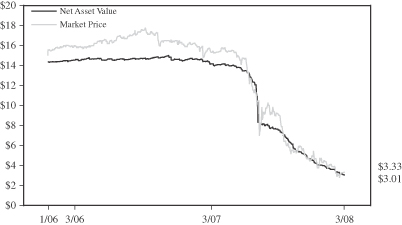
| * | | Net asset value is calculated every day that the New York Stock Exchange is open as of the close of trading (normally 4:00 p.m. Eastern Time) by taking the closing market value of all portfolio securities, cash and other assets owned, subtracting all liabilities, then dividing the result (total net assets) by the total number of shares outstanding. The market price is the last reported price at which a share of the Fund was sold on the New York Stock Exchange. |
(Unaudited)
40
RMK MULTI-SECTOR
HIGH INCOME FUND, INC.
PERFORMANCE INFORMATION
| | | | | | | | | |
| | | AVERAGE ANNUAL TOTAL RETURNS | |
| AS OF MARCH 31, 2008 | | SIX MONTHS* | | | 1 YEAR | | | COMMENCEMENT
OF INVESTMENT
OPERATIONS(1) | |
| MARKET VALUE | | (56.41 | )% | | (72.67 | )% | | (39.20 | )% |
| NET ASSET VALUE | | (52.34 | )% | | (72.48 | )% | | (40.71 | )% |
LEHMAN BROTHERS BA U.S. HIGH YIELD INDEX(2) | | (1.98 | )% | | (1.25 | )% | | — | |
| * | | Not annualized for periods less than one year. |
(1) | | The Fund commenced investment operations on January 19, 2006. |
(2) | | The Lehman Brothers Ba U.S. High Yield Index is a broad-based unmanaged index of fixed rate, non-investment grade debt. Pay-in-kind (PIK) bonds, Eurobonds and debt issues from countries designated as emerging markets (e.g., Argentina, Brazil and Venezuela) are excluded, but Canadian and global bonds (SEC registered) of issuers in non-emerging countries are included. Original issue zeroes, step-up coupon structures and 144As are also included. The index is unmanaged and, unlike the Fund, is not affected by cash flows or trading and other expenses. It is not possible to invest directly in an index. |
Performance data quoted represents past performance, which is no guarantee of future results. Investment return and principal value will fluctuate so that an investor’s shares, when redeemed, may be worth more or less than their original cost. Fund performance changes over time and current performance may be lower or higher than what is stated. For the most recent performance, call toll-free 800-564-2188. Total returns assume an investment at the common share market price or net asset value at the beginning of the period, reinvestment of all dividends and other distributions for the period in accordance with the Fund’s dividend reinvestment plan, and sale of all shares at the closing market price (excluding any commissions) or net asset value at the end of the period. Returns shown in the table do not reflect the deduction of taxes that a stockholder would pay on Fund distributions or on the sale of Fund shares. Closed-end funds are not bank deposits or obligations, are not guaranteed by any bank and are not insured or guaranteed by the U.S. government, the Federal Deposit Insurance Corporation, the Federal Reserve Board or any other government agency. Investment in closed-end funds involves investment risk, including possible loss of principal.
(Unaudited)
41
RMK MULTI-SECTOR
HIGH INCOME FUND, INC.
PORTFOLIOOF INVESTMENTS
MARCH 31, 2008
| | | | | | | |
Principal
Amount/
Notional
Amount/
Shares | | | | Description | | Value ‡ |
| | | | | | | |
| Asset-Backed Securities–Investment Grade*–14.9% of Net Assets | | | |
| | | | Certificate-Backed Obligations (“CBO”)–1.5% | | | |
| 1,000,000 | | | | CBC Insurance Revenue Securitization LLC 2002-A C, 8.880% 2/15/23 (Acquired 10/26/07, Cost $902,826) †# | | $ | 797,500 |
| 3,000,000 | | | | Diversified Asset Securitization Holdings III 1A A3L, 5.436% 7/5/36 (Acquired 2/6/07, Cost $2,315,359) †# | | | 900,000 |
| | | | | | | |
| | | | | | | 1,697,500 |
| | | | | | | |
| | | | Collateralized Debt Obligations (“CDO”)–10.2% | | | |
| 3,000,000 | | | | CDO Repack SPC Ltd. 2006-BRGA, 12/5/51 #~ | | | 300 |
| 2,000,000 | | | | Kodiak CDO 2007-2A E, 6.412% 11/7/42 (Acquired 6/29/07, Cost $1,967,466) †# | | | 90,000 |
| 3,000,000 | | | | Lincoln Park Referenced Link Notes 2001-1, 6.671% 7/30/31 (Acquired 9/12/06, Cost $2,690,593) †# | | | 1,830,000 |
| 4,032,354 | | | | Millstone III-A CDO Ltd., 7/5/46 #~ | | | 403 |
| 1,500,000 | | | | Preferred Term Securities XXVIII, Ltd., 4.434% 3/22/38 (Acquired 12/12/07, Cost $1,371,552) †# | | | 1,087,500 |
| 2,991,609 | | | | Pyxis Master Trust 2006-7, 7.709% 10/1/37 (Acquired 11/21/06, Cost $2,991,609) †# | | | 127,143 |
| 9,000,000 | | | | Steers Delaware Business Trust 2007-A, 5.384% 6/20/18 (Acquired 2/9/07–8/24/07, Cost $8,985,838) †# | | | 7,920,000 |
| 6,184,958 | | | | Taberna Preferred Funding Ltd. 2006-6A, 6.096% 12/5/36 (Acquired 6/27/06, Cost $6,153,303) †# | | | 61,850 |
| 4,730,222 | | | | Taberna Preferred Funding Ltd. 2006-7A C1, 1.000% 2/5/37 (Acquired 9/28/06, Cost $4,659,370) †# | | | 94,604 |
| | | | | | | |
| | | | | | | 11,211,800 |
| | | | | | | |
| | | | Home Equity Loans–0.8% | | | |
| 681,425 | | | | Fremont Home Loan Trust 2004-4 M7, 4.319% 3/25/35 | | | 355,395 |
| 13,585,966 | | | | United Capital Markets, Inc. 2003-A, 2.300% 11/8/27 interest-only strips (Acquired 12/19/07, Cost $551,905) †# | | | 555,666 |
| | | | | | | |
| | | | | | | 911,061 |
| | | | | | | |
| | | | Manufactured Housing Loans–2.4% | | | |
| 2,783,552 | | | | Mid-State Trust 2005-1 B, 7.758% 1/15/40 | | | 2,593,569 |
| | | | | | | |
| | | | Total Asset-Backed Securities–Investment Grade*
(cost $42,427,113) | | | 16,413,930 |
| | | | | | | |
| Asset-Backed Securities–Below Investment Grade or Unrated*–24.8% of Net Assets | | | |
| | | | Collateralized Debt Obligations (“CDO”)–12.7% | | | |
| 2,000,000 | | | | 801 Grand CDO 2006-1 LLC, 8.542% 9/20/16 (Acquired 8/4/06, Cost $1,970,733) †# | | | 1,315,000 |
The Notes to the Financial Statements are an integral part of, and should be read in conjunction with, the Financial Statements.
42
RMK MULTI-SECTOR
HIGH INCOME FUND, INC.
PORTFOLIOOF INVESTMENTS
MARCH 31, 2008
| | | | | | | |
Principal
Amount/
Notional
Amount/
Shares | | | | Description | | Value ‡ |
| | | | | | | |
| Asset-Backed Securities–Below Investment Grade or Unrated* (continued) | | | |
| | | | Collateralized Debt Obligations (“CDO”) (continued) | | | |
| 3,000,000 | | | | Aardvark Asset-Backed Securities CDO 2007-1A, 7/6/47 in default #~ | | $ | 300 |
| 4,000,000 | | | | Acacia CDO, Ltd. 10A, 4.570% 9/7/46 (Acquired 8/3/06, Cost $1,914,575) †# | | | 160,000 |
| 6,000,000 | | | | Aladdin CDO I Ltd. 2006-3A, 7.542% 10/31/13 (Acquired 8/7/06–7/2/07, Cost $3,470,236) †# | | | 615,000 |
| 365,000 | | | | Attentus CDO Ltd. 2006-2A E2, 10/9/41 #~ | | | 5,475 |
| 2,000,000 | | | | Attentus CDO Ltd. 2006-2A F1, 10/9/41 (Acquired 10/12/06, Cost $1,952,100) †#~ | | | 15,000 |
| 910,000 | | | | Attentus CDO Ltd. 2006-2A F2, 10/9/41 #~ | | | 6,825 |
| 4,000,000 | | | | Attentus CDO Ltd. 2007-3A F2, 10/11/42 (Acquired 11/8/07, Cost $3,846,202) †#~ | | | 10,000 |
| 3,115,979 | | | | Broderick CDO Ltd. 2007-3A D, 6.808% 12/6/50 (Acquired 3/8/07, Cost $3,057,906) †# | | | 312 |
| 1,000,000 | | | | Cairn Mezzanine Asset-Backed CDO PLC 2007-3A, 3.688% 8/13/47 # | | | 100 |
| 5,000,000 | | | | Dillon Read CDO Ltd. 2006-1A, 13.000% 12/5/46 (Acquired 11/2/06, Cost $4,392,828) †# | | | 1,287,500 |
| 2,500,000 | | | | Duane Park, 11.000% 6/27/16 (Acquired 12/20/07, Cost $1,001,350) †# | | | 468,750 |
| 2,000,000 | | | | Gulf Stream Atlantic CDO Ltd. 2007-1A, 7/13/47 (Acquired 2/28/07, Cost $1,688,637) †#~ | | | 200 |
| 2,897,636 | | | | IMAC CDO Ltd. 2007-2A E, 10/20/50 (Acquired 5/4/07, Cost $2,772,069) †#~ | | | 290 |
| 3,000,000 | | | | Preferred Term Securities II, Ltd., 10.000% 5/22/33 (Acquired 8/22/07, Cost $1,978,762) †# | | | 952,500 |
| 1,000 | | | | Ischus CDO III, 7/3/46 (Acquired 6/22/07, Cost $610,000) †# | | | 9,000 |
| 2,000,000 | | | | IXIS ABS 1 Ltd., 12/12/46 (Acquired 11/15/06, Cost $1,575,120) †#~ | | | 40,000 |
| 15,000,000 | | | | Kenmore Street Synthetic CDO 2006-1A, 7.542% 4/30/14 (Acquired 8/25/06–12/29/06, Cost $8,524,153) †# | | | 1,762,500 |
| 2,000,774 | | | | Knollwood CDO Ltd. 2006-2A E, 10.377% 7/13/46 (Acquired 8/24/06, Cost $2,000,774) †# | | | 200 |
| 3,000,000 | | | | Knollwood CDO Ltd. 2006-2A SN, 7/13/46 #~ | | | 300 |
| 6,000,000 | | | | Kodiak CDO 2006-1A, 8/7/37 (Acquired 9/29/06, Cost $5,429,282) †#~ | | | 15,000 |
| 3,133,608 | | | | Kodiak CDO 2006-1A G, 6.662% 8/7/37 (Acquired 12/12/06–2/8/07, Cost $3,051,911) †# | | | 7,834 |
| 3,933,458 | | | | Lancer Funding Ltd. 2007-2A A3, 7/15/47 in default (Acquired 5/24/07, Cost $3,593,214) †#~ | | | 393 |
The Notes to the Financial Statements are an integral part of, and should be read in conjunction with, the Financial Statements.
43
RMK MULTI-SECTOR
HIGH INCOME FUND, INC.
PORTFOLIOOF INVESTMENTS
MARCH 31, 2008
| | | | | | | |
Principal
Amount/
Notional
Amount/
Shares | | | | Description | | Value ‡ |
| | | | | | | |
| Asset-Backed Securities–Below Investment Grade or Unrated* (continued) | | | |
| | | | Collateralized Debt Obligations (“CDO”) (continued) | | | |
| 4,671,365 | | | | Lexington Capital Funding Ltd. 2007-3A F, 8.551% 4/10/47 (Acquired 2/9/07, Cost $4,535,208) †# | | $ | 163,498 |
| 5,000,000 | | | | Linker Finance PLC 16A E, 6.059% 5/19/45 (Acquired 5/19/06, Cost $4,857,192) †# | | | 237,500 |
| 3,117,302 | | | | Newbury Street CDO Ltd. 2007-1A D, 6.858% 3/4/53 (Acquired 3/8/07, Cost $3,073,648) †# | | | 312 |
| 1,961,789 | | | | Norma CDO Ltd. 2007-1A E, 7.339% 3/11/49 (Acquired 3/1/07, Cost $1,942,679) †# | | | 19,618 |
| 2,000,000 | | | | Parcs-R 2007-8, 5.099% 1/25/46 (Acquired 6/21/07, Cost $2,000,000) †# | | | 185,000 |
| 2,000,000 | | | | Pasa Funding Ltd. 2007-1A D, 4/7/52 in default #~ | | | 200 |
| 3,000,000 | | | | Preferred Term Securities XXI, Ltd., 10.000% 3/22/38
(Acquired 3/8/06–7/31/07, Cost $2,795,851) †# | | | 585,000 |
| 998,147 | | | | Preferred Term Securities XXI-2TR, 9.999% 3/22/38 (Acquired 6/29/07, Cost $956,773) †# | | | 429,203 |
| 4,600,000 | | | | Preferred Term Securities XXII, Ltd., 9/22/36 (Acquired 8/4/06–2/26/07, Cost $4,540,443) †~ | | | 1,534,560 |
| 3,800,000 | | | | Preferred Term Securities XXIII, Ltd., 12/22/36 (Acquired 12/4/06–2/26/07, Cost $3,731,695) †~ | | | 1,581,940 |
| 3,000,000 | | | | Preferred Term Securities XXVIII, Ltd., 10.000% 3/22/38 (Acquired 12/12/07, Cost $2,960,263) †# | | | 2,085,000 |
| 1,995,046 | | | | Pyxis Master Trust, 7.709% 10/1/37 (Acquired 11/21/06, Cost $1,995,046) †# | | | 84,788 |
| 1,923,503 | | | | Sharps CDO 2006-1A D, 5/8/46 (Acquired 12/5/07, Cost $1,825,560) †#~ | | | 14,426 |
| 1,000,000 | | | | Squared CDO Ltd. 2007-1A C, 8.089% 5/11/57 (Acquired 5/11/07, Cost $975,440) †# | | | 10,000 |
| 1,023,991 | | | | Tahoma CDO Ltd. 2007-2A D, 7.300% 9/15/47 (Acquired 3/28/07, Cost $955,743) †# | | | 7,680 |
| 2,000,000 | | | | Trapeza CDO I LLC 2006-10A, 6/6/41 #~ | | | 10,000 |
| 2,000,000 | | | | Trapeza CDO I LLC 2006-10A D2, 8.700% 6/6/41 (Acquired 6/15/06, Cost $2,000,000) †# | | | 190,000 |
| 2,000,000 | | | | Trapeza CDO I LLC 2006-11A, 10/10/41 #~ | | | 200 |
| 2,000,000 | | | | Trapeza CDO I LLC 2006-11A F, 10/10/41 #~ | | | 15,000 |
| 2,000,000 | | | | Tricadia CDO Ltd. 2006-5A, 15.000% 6/19/46 (Acquired 3/5/07, Cost $1,542,871) †# | | | 55,000 |
| 3,500 | | | | WEBS CDO 2006-1 PS, 4/13/47 (Acquired 12/7/06, Cost $3,150,000) †# | | | 35 |
| | | | | | | |
| | | | | | | 13,881,439 |
| | | | | | | |
The Notes to the Financial Statements are an integral part of, and should be read in conjunction with, the Financial Statements.
44
RMK MULTI-SECTOR
HIGH INCOME FUND, INC.
PORTFOLIOOF INVESTMENTS
MARCH 31, 2008
| | | | | | | |
Principal
Amount/
Notional
Amount/
Shares | | | | Description | | Value ‡ |
| | | | | | | |
| Asset-Backed Securities–Below Investment Grade or Unrated* (continued) | | | |
| | | | Collateralized Loan Obligations (“CLO”)–5.9% | | | |
| 3,000 | | | | Credit Genesis CLO 2005, 6/23/10 (Acquired 8/8/06, Cost $2,970,000) †# | | $ | 1,950,000 |
| 4,000,000 | | | | Eirles Two Ltd. 262, 8.612% 8/3/21 # | | | 2,480,000 |
| 3,500,000 | | | | Eirles Two Ltd. 263, 11.112% 8/3/21 # | | | 1,995,000 |
| | | | | | | |
| | | | | | | 6,425,000 |
| | | | | | | |
| | | | Equipment Leases–5.5% | | | |
| 8,480,190 | | | | Aerco Limited 1X C1, 7/15/23 #~ | | | 212,005 |
| 7,498,559 | | | | Aerco Limited 2A B2, 7/15/25 (Acquired 7/25/06–12/3/07, Cost $3,831,627) †#~ | | | 562,392 |
| 6,341,288 | | | | Aerco Limited 2A C2, 7/15/25 (Acquired 1/31/06–8/17/06, Cost $2,297,201) †#~ | | | 253,652 |
| 3,585,626 | | | | Aviation Capital Group Trust 2000-1A C1, 4.768% 11/15/25 (Acquired 2/1/06, Cost $1,509,738) †# | | | 233,066 |
| 2,072,495 | | | | Aviation Capital Group Trust 2000-1I D1, 8.500% 11/15/25 (Acquired 2/1/06, Cost $1,167,983) †# | | | 321,237 |
| 1,881,847 | | | | DVI Receivables Corp. 1999-2 A4, 11/13/08 #~ | | | 207,003 |
| 1,917,170 | | | | DVI Receivables Corp. 2001-2 A4, 4.613% 11/11/09 # | | | 766,868 |
| 3,286,329 | | | | Guggenheim Equipment Trust 2007-1A, 11.193% 7/15/31 (Acquired 5/10/07–7/31/07, Cost $2,419,643) †# | | | 1,906,136 |
| 63,000,000 | | | | United Capital Aviation Trust 2005-1 B2, 7/15/31 (Acquired 3/30/06, Cost $7,753,710) †#~ | | | 1,575,000 |
| | | | | | | |
| | | | | | | 6,037,359 |
| | | | | | | |
| | | | Home Equity Loans–0.7% | | | |
| 2,596,878 | | | | Equifirst Mortgage Loan Trust 2004-3 N3, 12/25/34 (Acquired 12/7/06, Cost $2,543,224) †#~ | | | 12,984 |
| 3,000,000 | | | | Fremont Home Loan Trust 2005-2 B3, 5.349% 6/25/35 (Acquired 2/13/06, Cost $2,406,142) †# | | | 264,300 |
| 197,358 | | | | Meritage Asset Holdings 2004-2 N6, 9.000% 1/25/35 (Acquired 12/7/06, Cost $195,647) †# | | | 99 |
| 6,102,000 | | | | New Century Home Equity Loan Trust 2006-2 M10, 4.599% 8/25/36 # | | | 375,273 |
| 1,617,062 | | | | Soundview Trust 2005-1N N2, 6.413% 4/25/35 (Acquired 12/7/06, Cost $1,555,324) †#~ | | | 34,605 |
| 1,500,000 | | | | Soundview Trust 2005-1N N3, 4/25/35 (Acquired 12/7/06, Cost $1,477,656) †# | | | 150 |
| 12,798,000 | | | | Terwin Mortgage Trust 2006-R2 A, 3.196% 12/25/36 (Acquired 3/8/06, Cost $10,969,418) †#~ | | | 102,383 |
The Notes to the Financial Statements are an integral part of, and should be read in conjunction with, the Financial Statements.
45
RMK MULTI-SECTOR
HIGH INCOME FUND, INC.
PORTFOLIOOF INVESTMENTS
MARCH 31, 2008
| | | | | | | |
Principal
Amount/
Notional
Amount/
Shares | | | | Description | | Value ‡ |
| | | | | | | |
| Asset-Backed Securities–Below Investment Grade or Unrated* (continued) | | | |
| | | | Home Equity Loans (continued) | | | |
| 7,000,000 | | | | Terwin Mortgage Trust 2006-R3, 6/26/37 (Acquired 6/30/06, Cost $5,794,108) †# | | $ | 700 |
| | | | | | | |
| | | | | | | 790,494 |
| | | | | | | |
| | | | Total Asset-Backed Securities–Below Investment Grade or Unrated*
(cost $172,464,323) | | | 27,134,292 |
| | | | | | | |
| Corporate Bonds–Investment Grade*–3.2% of Net Assets | | | |
| | | | Finance–2.3% | | | |
| 3,000,000 | | | | Catlin Insurance Company Ltd., 7.249% 12/31/49 (Acquired 11/2/07, Cost $2,830,075) † | | | 2,504,010 |
| | | | | | | |
| | | | Special Purpose Entities–0.9% | | | |
| 3,000,000 | | | | Fixed Income Pass-Through Trust 2007-C JPM Class B, 5/15/77 (Acquired 6/22/07, Cost $3,060,454) †#~ | | | 990,000 |
| | | | | | | |
| | | | Total Corporate Bonds–Investment Grade*
($5,890,529) | | | 3,494,010 |
| | | | | | | |
| Corporate Bonds–Below Investment Grade or Unrated*–30.2% of Net Assets | | | |
| | | | Apparel–3.0% | | | |
| 4,344,000 | | | | Rafaella Apparel Group, Inc., 11.250% 6/15/11 | | | 3,258,000 |
| | | | | | | |
| | | | Automotives–1.9% | | | |
| 1,175,000 | | | | General Motors, 8.375% 7/15/33 | | | 828,375 |
| 4,472,000 | | | | Metaldyne Corp., 11.000% 6/15/12 | | | 1,252,160 |
| | | | | | | |
| | | | | | | 2,080,535 |
| | | | | | | |
| | | | Basic Materials–2.9% | | | |
| 600,000 | | | | AmeriCast Technologies Inc., 11.000% 12/1/14
(Acquired 11/21/06–3/30/07, Cost $613,589) † | | | 516,750 |
| 3,720,000 | | | | Key Plastics LLC, 11.750% 3/15/13 (Acquired 3/12/07–6/19/07, Cost $3,734,722) † | | | 2,678,400 |
| | | | | | | |
| | | | | | | 3,195,150 |
| | | | | | | |
| | | | Communications–0.7% | | | |
| 1,500,000 | | | | CCH I Holdings LLC, 11.750% 5/15/14 | | | 757,500 |
| | | | | | | |
| | | | Consulting Services–2.9% | | | |
| 4,000,000 | | | | MSX International Inc., 12.500% 4/1/12 (Acquired 3/30/07–4/23/07, Cost $3,978,937) † | | | 3,200,000 |
| | | | | | | |
The Notes to the Financial Statements are an integral part of, and should be read in conjunction with, the Financial Statements.
46
RMK MULTI-SECTOR
HIGH INCOME FUND, INC.
PORTFOLIOOF INVESTMENTS
MARCH 31, 2008
| | | | | | | |
Principal
Amount/
Notional
Amount/
Shares | | | | Description | | Value ‡ |
| | | | | | | |
| Corporate Bonds–Below Investment Grade or Unrated* (continued) | | | |
| | | | Entertainment–2.0% | | | |
| 2,590,000 | | | | French Lick Resorts & Casino LLC, 10.750% 4/15/14
(Acquired 2/7/07–5/14/07, Cost $2,385,206) † | | $ | 1,554,000 |
| 1,075,000 | | | | Six Flags Inc., 9.625% 6/1/14 | | | 607,375 |
| | | | | | | |
| | | | | | | 2,161,375 |
| | | | | | | |
| | | | Finance–3.6% | | | |
| 3,065,000 | | | | Advanta Capital Trust I, 8.990% 12/17/26 | | | 1,984,588 |
| 2,000,000 | | | | Assurance America, 10.500% 12/31/35 (Acquired 2/2/07, Cost $1,959,208) †# | | | 1,960,000 |
| 500,000 | | | | Security Capital Assurance Ltd., 6/17/49~ | | | 25,000 |
| | | | | | | |
| | | | | | | 3,969,588 |
| | | | | | | |
| | | | Industrials–1.6% | | | |
| 393,957 | | | | Home Products Inc., pays-in-kind 3/20/17 #~ | | | 77,019 |
| 475,000 | | | | Momentive Performance, 11.500% 12/1/16 | | | 361,594 |
| 2,575,000 | | | | Terphane Holding Corp., 12.500% 6/15/09 (Acquired 4/25/06–10/10/07, Cost $2,552,113) † | | | 1,364,750 |
| | | | | | | |
| | | | | | | 1,803,363 |
| | | | | | | |
| | | | Manufacturing–3.3% | | | |
| 4,750,000 | | | | MAAX Corp., 9.750% 6/15/12 | | | 1,045,000 |
| 2,850,000 | | | | Wolverine Tube, Inc., 10.500% 4/1/09 | | | 2,550,750 |
| | | | | | | |
| | | | | | | 3,595,750 |
| | | | | | | |
| | | | Oil & Natural Gas–0.7% | | | |
| 800,000 | | | | Seametric International, 11.625% 5/25/12 (Acquired 5/25/07, Cost $790,481) †# | | | 738,000 |
| | | | | | | |
| | | | Paper Products–0.6% | | | |
| 925,000 | | | | Corp Durango SAB de CV, 10.500% 10/5/17 (Acquired 10/26/07, Cost $919,470) † | | | 693,750 |
| | | | | | | |
| | | | Real Estate Management–0.9% | | | |
| 2,250,000 | | | | Realogy Corp., 12.375% 4/15/15 | | | 1,001,250 |
| | | | | | | |
| | | | Retail–1.8% | | | |
| 1,579,000 | | | | Lazydays RV Center Inc., 11.750% 5/15/12 | | | 1,255,305 |
| 1,715,000 | | | | Uno Restaurant Corp., 10.000% 2/15/11 (Acquired 2/28/06–6/29/06, Cost $1,456,754) † | | | 686,000 |
| | | | | | | |
| | | | | | | 1,941,305 |
| | | | | | | |
| | | | Special Purpose Entities–0.4% | | | |
| 776,000 | | | | Interactive Health LLC, 7.250% 4/1/11 (Acquired 1/31/06–12/11/06, Cost $644,141) † | | | 465,600 |
| | | | | | | |
The Notes to the Financial Statements are an integral part of, and should be read in conjunction with, the Financial Statements.
47
RMK MULTI-SECTOR
HIGH INCOME FUND, INC.
PORTFOLIOOF INVESTMENTS
MARCH 31, 2008
| | | | | | | |
Principal
Amount/
Notional
Amount/
Shares | | | | Description | | Value ‡ |
| | | | | | | |
| Corporate Bonds–Below Investment Grade or Unrated* (continued) | | | |
| | | | Telecommunications–2.1% | | | |
| 3,000,000 | | | | Primus Telecommunications GP, 8.000% 1/15/14 | | $ | 1,290,000 |
| 1,425,000 | | | | Securus Technologies Inc., 11.000% 9/1/11 | | | 1,026,000 |
| | | | | | | |
| | | | | | | 2,316,000 |
| | | | | | | |
| | | | Tobacco–1.8% | | | |
| 3,075,000 | | | | North Atlantic Trading Co., 9.250% 3/1/12 | | | 1,998,750 |
| | | | | | | |
| | | | Total Corporate Bonds–Below Investment Grade or Unrated* ($51,152,389) | | | 33,175,916 |
| | | | | | | |
| Mortgage-Backed Securities–Investment Grade*–8.9% of Net Assets | | | |
| | | | Collateralized Mortgage Obligations–8.9% | | | |
| 860,281 | | | | Countrywide Alternative Loan Trust 2005-49CB A5, 5.500% 11/25/35 | | | 768,469 |
| 1,976,096 | | | | Countrywide Alternative Loan Trust 2005-56 M4, 3.519% 11/25/35 # | | | 917,106 |
| 637,490 | | | | Deutsche Alt-A Securities Inc. Mortgage Loan 2006-AF1 A5,
2.879% 4/25/36 | | | 314,546 |
| 7,000,000 | | | | Deutsche Mortgage Securities, Inc. 2006-RS1 N2, 4.393% 9/27/35 (Acquired 2/5/07, Cost $7,033,590) †# | | | 4,550,000 |
| 2,000,626 | | | | Residential Accredit Loans, Inc. 2006-Q08 M4. 3.129% 10/25/46 # | | | 442,799 |
| 166,181,788 | | | | Residential Accredit Loans Inc. 2007-QH8 P, 0.500% 10/25/37 interest-only strips # | | | 681,345 |
| 4,788,347 | | | | Structured Asset Investment Loan Trust 2004-7A B, 8/27/34 (Acquired 12/7/06, Cost $4,719,829) †#~ | | | 16,280 |
| 5,000,000 | | | | Structured Asset Mortgage Investments Inc. 2006-AR3 1B1, 2.999% 4/25/36 | | | 2,083,995 |
| | | | | | | |
| | | | Total Mortgage-Backed Securities–Investment Grade*
($19,183,816) | | | 9,774,540 |
| | | | | | | |
| Mortgage-Backed Securities–Below Investment Grade or Unrated*–17.2% of Net Assets | | | |
| | | | Collateralized Mortgage Obligations–17.1% | | | |
| 921,004 | | | | Countrywide Asset Backed Certificates 2006-SPS2 A, 2.759% 5/25/26 | | | 385,377 |
| 3,100,000 | | | | First Franklin Trust 2004-FFH4 N4, 1/21/35 (Acquired 1/27/06, Cost $3,037,282) †#~ | | | 310 |
| 6,450,000 | | | | Greenwich Structured Adjustable Rate Mortgage Products 2005-3A N2, 2.000% 6/27/35 (Acquired 2/15/06, Cost $4,116,525) †# | | | 3,063,750 |
| 13,716,470 | | | | Greenwich Structured Adjustable Rate Mortgage Products 2005-4A N-2, 7/27/45 (Acquired 2/15/06, Cost $7,357,387) †#~ | | | 6,172,411 |
The Notes to the Financial Statements are an integral part of, and should be read in conjunction with, the Financial Statements.
48
RMK MULTI-SECTOR
HIGH INCOME FUND, INC.
PORTFOLIOOF INVESTMENTS
MARCH 31, 2008
| | | | | | | |
Principal
Amount/
Notional
Amount/
Shares | | | | Description | | Value ‡ |
| | | | | | | |
| Mortgage-Backed Securities–Below Investment Grade or Unrated* (continued) |
| | | | Collateralized Mortgage Obligations (continued) | | | |
| 3,500,000 | | | | GSAMP Trust 2006-S3 A2, 5.769% 5/25/36 | | $ | 1,073,975 |
| 5,000,000 | | | | Harborview Corp. 2006-8A N5, 7/21/36 (Acquired 10/11/06, Cost $2,213,751) †#~ | | | 1,440,550 |
| 1,000,000 | | | | Harborview Corp. 2006-14 N4, 8.350% 3/19/38 (Acquired 3/6/07, Cost $847,352) †# | | | 794,390 |
| 6,000,000 | | | | Harborview Corp. 2006-14 PS, 12/19/36 (Acquired 3/6/07, Cost $1,292,081) †#~ | | | 79,260 |
| 3,945,679 | | | | Harborview Mortgage Loan Trust 2006-4 B11, 4.309% 5/19/47 (Acquired 5/23/06, Cost $2,495,490) †# | | | 308,158 |
| 4,167,147 | | | | Harborview Mortgage Loan Trust 2006-CB1 2B5, 4.349% 3/25/36 # | | | 699,747 |
| 1,167,903 | | | | Harborview Mortgage Loan Trust 2006-CB1 2B6, 4.349% 3/25/36 # | | | 65,368 |
| 6,000,000 | | | | Long Beach Asset Holdings Corp. 2005-WL1 N4, 7.500% 6/25/45 (Acquired 12/7/06, Cost $5,523,482) †# | | | 27,900 |
| 2,000,000 | | | | Long Beach Mortgage Loan Trust 2005-2 B2, 5.349% 4/25/35 (Acquired 4/24/06, Cost $1,780,705) †# | | | 161,660 |
| 3,476,070 | | | | Long Beach Mortgage Loan Trust 2005-WL2 B3, 5.635% 8/25/35 (Acquired 10/20/06–3/6/07, Cost $2,634,650) †# | | | 87,945 |
| 4,000,000 | | | | Park Place Securities Inc. 2005-WCW2 M11, 5.099% 7/25/35 (Acquired 2/10/06, Cost $3,072,603) †# | | | 121,600 |
| 4,000,000 | | | | Park Place Securities Inc. 2005-WCW3 M10, 5.099% 8/25/35 # | | | 866,520 |
| 3,000,000 | | | �� | Park Place Securities Inc. 2005-WHQ3 M11, 5.099% 6/25/35 # | | | 1,486,020 |
| 2,000,000 | | | | Sharp SP I LLC Trust 2006-A HM3 N3, 12.500% 10/25/46 (Acquired 10/13/06, Cost $2,000,000) †# | | | 1,735,640 |
| 1,306,113 | | | | Structured Asset Investment Loan Trust 2004-8 B2, 5.000% 9/25/34 | | | 67,812 |
| 2,500,000 | | | | Structured Asset Investment Loan Trust 2005-HE1 B1, 5.099% 7/25/35 # | | | 143,500 |
| | | | | | | |
| | | | | | | 18,781,893 |
| | | | | | | |
| | | | Residential Mortgage-Backed Securities–0.1% | | | |
| 9 | | | | Harborview 2006-8, 7/22/36 (Acquired 10/11/06, Cost $0) †# | | | 1 |
| 67,000 | | | | Indymac Indx CI-1 Corp., 6/25/46 (Acquired 7/20/06, Cost $1,820,859) †# | | | 46,230 |
| | | | | | | |
| | | | | | | 46,231 |
| | | | | | | |
| | | | Total Mortgage-Backed Securities–Below Investment Grade or Unrated*
(cost $51,973,697) | | | 18,828,124 |
| | | | | | | |
The Notes to the Financial Statements are an integral part of, and should be read in conjunction with, the Financial Statements.
49
RMK MULTI-SECTOR
HIGH INCOME FUND, INC.
PORTFOLIOOF INVESTMENTS
MARCH 31, 2008
| | | | | | | | |
Principal
Amount/
Notional
Amount/
Shares | | | | Description | | Value ‡ | |
| | | | | | | | |
| Common Stocks–6.3% of Net Assets | | | | |
| | | | Communications–0.1% | | | | |
| 4,800 | | | | Consolidated Communications Holdings, Inc. | | $ | 72,624 | |
| | | | | | | | |
| | | | Consumer Products–0.2% | | | | |
| 15,758 | | | | Home Products #~ | | | 473 | |
| 221,000 | | | | Insight Health Services Holdings Corp ~ | | | 223,210 | |
| | | | | | | | |
| | | | | | | 223,683 | |
| | | | | | | | |
| | | | Energy–0.6% | | | | |
| 7,400 | | | | Legacy Reserves LP | | | 147,704 | |
| 196,750 | | | | Pinnacle Gas Resources, Inc. ~ | | | 497,778 | |
| | | | | | | | |
| | | | | | | 645,482 | |
| | | | | | | | |
| | | | Financials–1.9% | | | | |
| 35,000 | | | | FSI Realty Trust (Acquired 5/3/07, Cost $350,000) †~ | | | 43,750 | |
| 200,000 | | | | FSI Realty Trust Regulation D (Acquired 5/24/07, Cost $1,880,060) †~ | | | 250,000 | |
| 52,941 | | | | Mid Country (Acquired 5/25/07, Cost $899,997) †#~ | | | 682,939 | |
| 120,700 | | | | Star Asia Financial Ltd. (Acquired 3/2/07–8/1/07, Cost $1,237,200) † | | | 1,116,475 | |
| | | | | | | | |
| | | | | | | 2,093,164 | |
| | | | | | | | |
| | | | Industrials–1.7% | | | | |
| 17,200 | | | | Aircastle Limited | | | 193,500 | |
| 10,300 | | | | Diana Shipping Inc. | | | 270,684 | |
| 32,600 | | | | OceanFreight Inc. | | | 712,962 | |
| 39,700 | | | | Orion Marine Group (Acquired 5/17/07–8/1/07, Cost $552,750) †~ | | | 474,415 | |
| 1,300 | | | | Port Townsend Paper Corp. ~ | | | 214,500 | |
| | | | | | | | |
| | | | | | | 1,866,061 | |
| | | | | | | | |
| | | | Technology–1.8% | | | | |
| 385,900 | | | | Banctec Inc. (Acquired 6/27/07–8/1/07, Cost $3,087,200) †~ | | | 1,929,500 | |
| 3,462 | | | | Taiwan Semiconductor Manufacturing Company Ltd. | | | 35,555 | |
| | | | | | | | |
| | | | | | | 1,965,055 | |
| | | | | | | | |
| | | | Total Common Stocks
(cost $17,176,734) | | | 6,866,069 | |
| | | | | | | | |
| Eurodollar Time Deposits–1.3% of Net Assets | | | | |
| | | | State Street Bank & Trust Company Eurodollar time deposits dated March 31, 2008 1.000% maturing at $1,402,062 on April 1, 2008. | | | 1,402,023 | |
| | | | | | | | |
| | | | Total Investments–106.8% of Net Assets
(cost $361,670,624) | | | 117,088,904 | |
| | | | | | | | |
| | | | Other Assets and Liabilities, net–(6.8%) of Net Assets | | | (7,456,389 | ) |
| | | | | | | | |
| | | | Net Assets | | $ | 109,632,515 | |
| | | | | | | | |
The Notes to the Financial Statements are an integral part of, and should be read in conjunction with, the Financial Statements.
50
RMK MULTI-SECTOR
HIGH INCOME FUND, INC.
PORTFOLIOOF INVESTMENTS
MARCH 31, 2008
| † | | Securities sold within the terms of a private placement memorandum, exempt from registration under Rule 144A under the Securities Act of 1933, as amended, and may be resold in transactions exempt from registration, normally to qualified institutional buyers. |
| ‡ | | See Note 2 of the accompanying Notes to the Financial Statements regarding investment valuations. |
| ~ | | Non-income producing security. In the case of bonds, they missed their last coupon payment. |
| # | | Security valued at fair value—See Note 2 of the accompanying Notes to the Financial Statements regarding investment valuations. |
| | | Substantially all of the Fund’s investment securities, other than equity securities, are pledged as collateral under the line of credit. |
The Notes to the Financial Statements are an integral part of, and should be read in conjunction with, the Financial Statements.
51
RMK STRATEGIC INCOME FUND, INC.
OBJECTIVE & STRATEGY
RMK Strategic Income Fund, Inc. seeks a high level of current income. The Fund seeks capital growth as a secondary investment objective when consistent with its primary investment objective. The Fund invests in a diversified portfolio of securities that offers attractive yield and capital appreciation potential and consists primarily of debt securities and secondarily of equity securities. The Adviser will continually analyze the markets for income-producing securities and will periodically reallocate the Fund’s investments among various fixed-income and equity asset classes and between investment grade and below investment grade debt securities (commonly referred to as “junk bonds”) to pursue its investment objectives. As a result, a majority of the Fund’s total assets may be invested in investment grade debt securities at some times and in below investment grade debt securities at other times. The Fund invests in a wide range of debt securities, including corporate bonds, mortgage-backed and asset-backed securities, and municipal and foreign government obligations, as well as securities of companies in bankruptcy reorganization proceedings or otherwise in the process of debt restructuring. The Fund also invests in other securities providing the potential for high income or a combination of high income and capital growth. (Below investment grade debt securities are rated Ba1 or lower by Moody’s Investors Service, Inc., BB+ or lower by Standard & Poor’s Ratings Group, comparably rated by another nationally recognized statistical rating organization or, if unrated, determined by the Fund’s investment adviser to be of comparable quality.) The Fund may use leverage through bank borrowings, reverse repurchase agreements or other transactions involving indebtedness or through the issuance of preferred shares. The Fund may leverage up to 33 1/3% of its total assets (in each case including the amounts obtained through leverage). The Fund may vary its use of leverage in response to changing market conditions.
INVESTMENT RISKS: Investors in any bond fund should anticipate fluctuations in price. Bond prices and the value of bond funds decline as interest rates rise. Bonds with longer-term maturities generally are more vulnerable to interest rate risk than bonds with shorter-term maturities. Below investment grade bonds involve greater credit risk, which is the risk that the issuer will not make interest or principal payments when due. An economic downturn or period of rising interest rates could adversely affect the ability of issuers, especially issuers of below investment grade debt, to service primary obligations and an unanticipated default could cause the Fund to experience a reduction in value of its shares. The Fund’s investments in mortgage-backed or asset-backed securities that are “subordinated” to other interests in the same pool may increase credit risk to the extent that the Fund as a holder of those securities may only receive payments after the pool’s obligations to other investors have been satisfied. Below investment grade bonds are also subject
(Unaudited)
52
RMK STRATEGIC INCOME FUND, INC.
to greater price volatility and are less liquid, especially during periods of economic uncertainty or change, than higher-rated debt securities. The value of U.S. and foreign equity securities in which the Fund invests will change based on changes in a company’s financial condition and in overall market and economic conditions. Leverage creates an opportunity for an increased return to common stockholders, but unless the income and capital appreciation, if any, on securities acquired with leverage proceeds exceed the costs of the leverage, the use of leverage will diminish the investment performance of the Fund’s shares. Use of leverage may also increase the likelihood that the net asset value of the Fund and market value of its common shares will be more volatile, and the yield and total return to common stockholders will tend to fluctuate more in response to changes in interest rates and creditworthiness.
MANAGEMENT DISCUSSIONOF FUND PERFORMANCE
For the six months and the fiscal year ended March 31, 2008, the Fund had a total return of -56.87% and - -74.01%, respectively, based on market price and reinvested dividends and other distributions. For the six months and the fiscal year ended March 31, 2008, the Fund had a total return of -51.95% and -70.24%, respectively, based on net asset value and reinvested dividends and other distributions. For the six months and the twelve months ended March 31, 2008, the Lehman Brothers Ba U.S. High Yield Index(1) had a total return of -1.98% and -1.25%, respectively.
The very difficult market conditions for credit-oriented securities that were prevalent at the Fund’s semi-annual update continued into the new year, with the first calendar quarter of 2008 being perhaps the worst market conditions we have seen up to this point. The collapse and subsequent government sponsored rescue of Bear Stearns poignantly illustrates the continuing withdrawal of credit availability and liquidity in the current market environment.
It goes without saying that we have been very disappointed with the Fund’s performance over the past year. In the past, our allocation of assets across a wide variety of collateral and security types had proven beneficial to the Fund’s performance. In this market cycle, however, these assets have suffered from extreme illiquidity along with assets that have in fact suffered actual credit deterioration. Although the headlines are dominated by references to the subprime mortgage crisis and the bursting of the real estate bubble, the most difficult management issue has been the complete disappearance of market making capacity of the primary broker-dealer community. Bear Stearns has in fact exited the market, but as a practical matter, most other primary dealers have either ceased to, or no longer have the capacity to commit capital to any of the credit sensitive sectors.
Lending against all but the most liquid, highly rated assets is, for all practical purposes, no longer available. Consequently, our focus has had to become much
(Unaudited)
53
RMK STRATEGIC INCOME FUND, INC.
narrower. Although there is more potential for attractive returns in the market place today compared to the market environment immediately following the events of September 11, 2001, overall market liquidity concerns have restricted our capacity to take advantage of the current situation. Financial assets in general continue to be under pricing pressure, especially in the residential mortgage sector.
The Federal Open Market Committee has aggressively lowered short-term lending rates and has introduced a facility to allow primary broker-dealers access to the discount window. These are extremely important big picture developments. The eventual effort should be to provide some liquidity to the mortgage market and, with short-term rates now at a mere 2.0%, force more capital back into risky assets. At this point, there continues to be pervasive concerns about the direction of the economy and the health of our banking system. Such uncertainty continues to pressure market values by simply overwhelming any periodic buy interest with massive supply. However, we are seeing more opportunistic buyers beginning to participate and hopefully this will begin to shift the momentum. At this time, our focus will have to remain on stabilizing asset values and trying to identify those assets that have the highest probability of substantial recovery.
James C. Kelsoe, Jr., CFA
Senior Portfolio Manager
Morgan Asset Management, Inc.
Market forecasts provided in this report may not necessarily come to pass. There is no assurance that the Fund will achieve its investment objectives. These views are subject to change at any time based upon market or other conditions, and Morgan Asset Management, Inc. disclaims any responsibility to update such views. The Fund is subject to market risk, which is the possibility that the market values of securities owned by the Fund will decline and, therefore, the value of the Fund’s shares may be less than what you paid for them. Accordingly, you can lose money investing in the Fund.
INDEX DESCRIPTION
(1) | | The Lehman Brothers Ba U.S. High Yield Index is a broad-based unmanaged index of fixed rate, non-investment grade debt. Pay-in-kind (PIK) bonds, Eurobonds and debt issues from countries designated as emerging markets (e.g., Argentina, Brazil and Venezuela) are excluded, but Canadian and global bonds (SEC registered) of issuers in non-emerging countries are included. Original issue zeroes, step-up coupon structures and 144As are also included. The index is unmanaged and, unlike the Fund, is not affected by cash flows or trading and other expenses. It is not possible to invest directly in an index. |
(Unaudited)
54
RMK STRATEGIC INCOME FUND, INC.
PORTFOLIO STATISTICS†
AS OF MARCH 31, 2008
| | | | |
Average Credit Quality | | BB |
Current Yield | | 27.4% |
Yield to Maturity | | 16.1% |
Duration | | 3.7 Years |
Average Effective Maturity | | 4.9 Years |
Percentage of Leveraged Assets | | 12.7% |
Total Number of Holdings | | 165 |
† | | The Fund’s composition is subject to change. |
CREDIT QUALITY†
AS OF MARCH 31, 2008
| | | | | | |
| %OFDEBTSECURITIES | | %OFDEBTSECURITIES |
AAA | | 19.0% | | B | | 22.0% |
AA | | 1.1% | | CCC | | 16.6% |
A | | 1.9% | | CC | | 3.7% |
BBB | | 12.1% | | C | | 1.1% |
BB | | 6.5% | | Not Rated | | 16.0% |
| | | | | | |
| | | | Total | | 100.0% |
| † | | The Fund’s composition is subject to change. |
ASSET ALLOCATION†
AS OF MARCH 31, 2008
| | |
| %OFTOTALINVESTMENTS |
Corporate Bonds | | 36.0% |
Collateralized Mortgage Obligations | | 27.1% |
Collateralized Debt Obligations | | 13.9% |
Common Stocks | | 4.7% |
Equipment Leases | | 3.6% |
Certificate-Backed Obligations | | 3.5% |
Collateralized Loan Obligations | | 3.2% |
Home Equity Loans | | 3.1% |
Manufactured Housing Loans | | 1.6% |
Residential Mortgage-Backed Securities | | 0.1% |
Municipal Securities | | 0.1% |
Short-Term Investments | | 3.1% |
| | |
Total | | 100.0% |
† | | The Fund’s composition is subject to change. |
(Unaudited)
55
RMK STRATEGIC INCOME FUND, INC.
NAV & MARKET PRICE HISTORY*
The graph below illustrates the net asset value and market price history of RMK Strategic Income Fund, Inc. (NYSE: RSF) from the commencement of investment operations on March 18, 2004 to March 31, 2008.
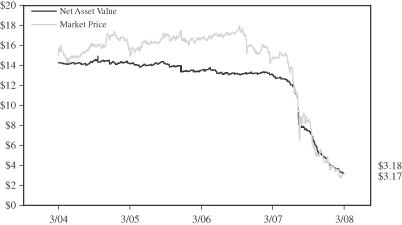
| * | | Net asset value is calculated every day that the New York Stock Exchange is open as of the close of trading (normally 4:00 p.m. Eastern Time) by taking the closing market value of all portfolio securities, cash and other assets owned, subtracting all liabilities, then dividing the result (total net assets) by the total number of shares outstanding. The market price is the last reported price at which a share of the Fund was sold on the New York Stock Exchange. |
(Unaudited)
56
RMK STRATEGIC INCOME FUND, INC.
PERFORMANCE INFORMATION
| | | | | | | | | |
| | | AVERAGE ANNUAL TOTAL RETURNS | |
| AS OF MARCH 31, 2008 | | SIX MONTHS* | | | 1 YEAR | | | COMMENCEMENT
OF INVESTMENT
OPERATIONS(1) | |
| MARKET VALUE | | (56.87 | )% | | (74.01 | )% | | (21.76 | )% |
| NET ASSET VALUE | | (51.95 | )% | | (70.24 | )% | | (20.93 | )% |
LEHMAN BROTHERS BA U.S. HIGH YIELD INDEX(2) | | (1.98 | )% | | (1.25 | )% | | — | |
| * | | Not annualized for periods less than one year. |
(1) | | The Fund commenced investment operations on March 18, 2004. |
(2) | | The Lehman Brothers Ba U.S. High Yield Index is a broad-based unmanaged index of fixed rate, non-investment grade debt. Pay-in-kind (PIK) bonds, Eurobonds and debt issues from countries designated as emerging markets (e.g., Argentina, Brazil and Venezuela) are excluded, but Canadian and global bonds (SEC registered) of issuers in non-emerging countries are included. Original issue zeroes, step-up coupon structures and 144As are also included. The index is unmanaged and, unlike the Fund, is not affected by cash flows or trading and other expenses. It is not possible to invest directly in an index. |
Performance data quoted represents past performance, which is no guarantee of future results. Investment return and principal value will fluctuate so that an investor’s shares, when redeemed, may be worth more or less than their original cost. Fund performance changes over time and current performance may be lower or higher than what is stated. For the most recent performance, call toll-free 800-564-2188. Total returns assume an investment at the common share market price or net asset value at the beginning of the period, reinvestment of all dividends and other distributions for the period in accordance with the Fund’s dividend reinvestment plan, and sale of all shares at the closing market price (excluding any commissions) or net asset value at the end of the period. Returns shown in the table do not reflect the deduction of taxes that a stockholder would pay on Fund distributions or on the sale of Fund shares. Closed-end funds are not bank deposits or obligations, are not guaranteed by any bank and are not insured or guaranteed by the U.S. government, the Federal Deposit Insurance Corporation, the Federal Reserve Board or any other government agency. Investment in closed-end funds involves investment risk, including possible loss of principal.
(Unaudited)
57
RMK STRATEGIC INCOME FUND, INC.
PORTFOLIOOF INVESTMENTS
MARCH 31, 2008
| | | | | | | |
Principal
Amount/
Notional
Amount/
Shares | | | | Description | | Value ‡ |
| | | | | | | |
| Asset-Backed Securities–Investment Grade*–18.5% of Net Assets | | | |
| | | | Certificate-Backed Obligations (“CBO”)–4.5% | | | |
| 5,000,000 | | | | CBC Insurance Revenue Securitization LLC 2002-A C, 8.880% 2/15/23 (Acquired 1/24/07–10/25/07, Cost $4,919,071) †# | | $ | 3,987,500 |
| 1,902,416 | | | | MKP CBO I Ltd., 4A CS 2.000% 7/12/40 (Acquired 3/9/05, Cost $1,902,416) †# | | | 123,657 |
| | | | | | | |
| | | | | | | 4,111,157 |
| | | | | | | |
| | | | Collateralized Debt Obligations (“CDO”)–8.5% | | | |
| 2,000,000 | | | | CDO Repack SPC Ltd. 2006-BRGA, 12/5/51 #~ | | | 200 |
| 1,445,150 | | | | Fort Dequesne CDO Ltd. 2006-1A D, 6.203% 10/26/46 (Acquired 3/8/07, Cost $1,138,876) †# | | | 25,290 |
| 3,610,159 | | | | High Income Trust Securities Inc. 2003-1A B, 3.628% 11/6/37
(Acquired 12/18/06, Cost $2,589,534) †# | | | 279,787 |
| 1,000,000 | | | | Kodiak CDO 2007-2A E, 6.412% 11/7/42 (Acquired 6/29/07, Cost $983,734) †# | | | 45,000 |
| 2,000,000 | | | | Lincoln Park Referenced Link Notes 2001-1, 6.671% 7/30/31 (Acquired 9/12/06, Cost $1,793,727) †# | | | 1,220,000 |
| 2,950,502 | | | | Millstone III-A CDO Ltd., 7/5/46 #~ | | | 295 |
| 3,000,000 | | | | Palmer Square 2A CN, 11/2/45 (Acquired 10/25/05, Cost $2,985,915) †#~ | | | 7,500 |
| 1,000,000 | | | | Preferred Term Securities XXVIII, Ltd., 4.434% 3/22/38 (Acquired 12/12/07, Cost $914,368) †# | | | 725,000 |
| 2,991,609 | | | | Pyxis Master Trust 2006-7, 7.709% 10/1/37 (Acquired 11/21/06, Cost $2,991,609) †# | | | 127,143 |
| 6,000,000 | | | | Steers Delaware Business Trust 2007-A, 5.384% 6/20/18 (Acquired 11/21/06, Cost $5,990,559) †# | | | 5,280,000 |
| 4,123,306 | | | | Taberna Preferred Funding Ltd. 2006-6A, 6.096% 12/5/36 (Acquired 6/27/06, Cost $4,102,201) †# | | | 41,233 |
| 2,838,133 | | | | Taberna Preferred Funding Ltd. 2006-7A C1, 1.000% 2/5/37 (Acquired 9/28/06, Cost $2,795,628) †# | | | 56,763 |
| | | | | | | |
| | | | | | | 7,808,211 |
| | | | | | | |
| | | | Home Equity Loans–3.4% | | | |
| 340,712 | | | | Fremont Home Loan Trust 2004-4 M7, 4.319% 3/25/35 | | | 177,697 |
| 3,915,000 | | | | Lake Country Mortgage Loan Trust 2006-HE1 M8, 5.349% 7/25/34 (Acquired 11/2/06, Cost $2,395,072) †# | | | 2,332,674 |
| 13,594,096 | | | | United Capital Markets, Inc. 2003-A, 2.300% 11/8/27 interest-only strips (Acquired 12/19/07, Cost $552,238) †# | | | 555,999 |
| | | | | | | |
| | | | | | | 3,066,370 |
| | | | | | | |
The Notes to the Financial Statements are an integral part of, and should be read in conjunction with, the Financial Statements.
58
RMK STRATEGIC INCOME FUND, INC.
PORTFOLIOOF INVESTMENTS
MARCH 31, 2008
| | | | | | | |
Principal
Amount/
Notional
Amount/
Shares | | | | Description | | Value ‡ |
| | | | | | | |
| Asset-Backed Securities–Investment Grade* (continued) | | | |
| | | | Manufactured Housing Loans–2.1% | | | |
| 2,087,664 | | | | Mid-State Trust 2005-1 B, 7.758% 1/15/40 | | $ | 1,945,177 |
| | | | | | | |
| | | | Total Asset-Backed Securities–Investment Grade
(cost $43,942,362) | | | 16,930,915 |
| | | | | | | |
| Asset-Backed Securities–Below Investment Grade or Unrated*–20.7% ofNet Assets | | | |
| | | | Certificate-Backed Obligations (“CBO”)–0.1% | | | |
| 2,329,301 | | | | Helios Series I Multi-Asset CBO, Ltd. IA C, 7.706% 12/13/36
(Acquired 11/3/06, Cost $952,760) †# | | | 46,586 |
| | | | | | | |
| | | | Collateralized Debt Obligations (“CDO”)–10.9% | | | |
| 1,000,000 | | | | 801 Grand CDO 2006-1 LLC, 8.542% 9/20/16 (Acquired 8/21/07, Cost $720,254) †# | | | 657,500 |
| 1,000,000 | | | | Aardvark Asset-Backed Securities CDO 2007-1A, 7/6/47 in default #~ | | | 100 |
| 3,000,000 | | | | Acacia CDO, Ltd. 10A, 4.570% 9/7/46 (Acquired 8/3/06, Cost $1,435,931) †# | | | 120,000 |
| 4,000,000 | | | | Aladdin CDO I Ltd. 2006-3A, 7.542% 10/31/13
(Acquired 8/7/06–7/2/07, Cost $2,291,306) †# | | | 410,000 |
| 270,000 | | | | Attentus CDO Ltd. 2006-2A E2, 10/9/41 #~ | | | 4,050 |
| 2,000,000 | | | | Attentus CDO Ltd. 2006-2A F1, 10/9/41 (Acquired 10/12/06, Cost $1,952,100) †# | | | 15,000 |
| 680,000 | | | | Attentus CDO Ltd. 2006-2A F2, 10/9/41 # | | | 5,100 |
| 3,000,000 | | | | Attentus CDO Ltd. 2007-3A F2, 10/11/42 (Acquired 1/18/07, Cost $2,884,128) †#~ | | | 7,500 |
| 2,077,319 | | | | Broderick CDO Ltd. 2007-3A D, 6.808% 12/6/50 (Acquired 3/8/07, Cost $2,038,604) †# | | | 208 |
| 1,000,000 | | | | Cairn Mezzanine Asset-Backed CDO PLC 2007-3A, 3.688% 8/13/47 # | | | 100 |
| 4,000,000 | | | | Dillon Read CDO Ltd. 2006-1A, 13.000% 12/5/46 (Acquired 11/2/06, Cost $3,514,261) †# | | | 1,030,000 |
| 1,750,000 | | | | Duane Park, 11.000% 6/27/16 (Acquired 12/20/07, Cost $700,945) †# | | | 328,125 |
| 4,000,000 | | | | Fiorente Funding Ltd. 2006-1A M1, 11/4/56 (Acquired 12/21/06, Cost $3,551,767) †#~ | | | 10,000 |
| 1,000,000 | | | | Gulf Stream Atlantic CDO Ltd. 2007-1A, 7/13/47 (Acquired 2/28/07, Cost $844,318) †#~ | | | 100 |
| 2,897,636 | | | | IMAC CDO Ltd. 2007-2A E, 10/20/50 (Acquired 5/4/07, Cost $2,772,069) †#~ | | | 290 |
| 1,000,000 | | | | IXIS ABS 1 Ltd., 12/12/46 (Acquired 11/15/06, Cost $787,560) †#~ | | | 20,000 |
| 13,000,000 | | | | Kenmore Street Synthetic CDO 2006-1A, 7.542% 4/30/14 (Acquired 8/25/06–12/29/06, Cost $7,387,248) †# | | | 1,527,500 |
The Notes to the Financial Statements are an integral part of, and should be read in conjunction with, the Financial Statements.
59
RMK STRATEGIC INCOME FUND, INC.
PORTFOLIOOF INVESTMENTS
MARCH 31, 2008
| | | | | | | |
Principal
Amount/
Notional
Amount/
Shares | | | | Description | | Value ‡ |
| | | | | | | |
| Asset-Backed Securities–Below Investment Grade or Unrated* (continued) | | | |
| | | | Collateralized Debt Obligations (“CDO”) (continued) | | | |
| 1,000,387 | | | | Knollwood CDO Ltd. 2006-2A E, 10.377% 7/13/46 (Acquired 8/24/06, Cost $1,000,387) †# | | $ | 100 |
| 3,000,000 | | | | Knollwood CDO Ltd. 2006-2A SN, 7/13/46 #~ | | | 300 |
| 4,000,000 | | | | Kodiak CDO 2006-1A, 8/7/37 (Acquired 9/29/06, Cost $3,619,520) †#~ | | | 10,000 |
| 3,133,608 | | | | Kodiak CDO 2006-1A G, 6.662% 8/7/37 (Acquired 11/13/06, Cost $3,061,970) †# | | | 7,834 |
| 4,916,822 | | | | Lancer Funding Ltd. 2007-2A A3, 7/15/47 in default (Acquired 5/24/07, Cost $4,491,518) †#~ | | | 492 |
| 2,889,504 | | | | Lexington Capital Funding Ltd. 2007-3A F, 8.551% 4/10/47 (Acquired 2/9/07, Cost $2,805,283) †# | | | 101,133 |
| 2,611,190 | | | | Lincoln Avenue Asset-Backed Securities CDO Ltd., 6.365% 7/5/46 (Acquired 7/10/06, Cost $2,599,225) †# | | | 261 |
| 2,000,000 | | | | Linker Finance PLC 16A E, 6.059% 5/19/45 (Acquired 5/19/06, Cost $1,942,876) †# | | | 95,000 |
| 1,039,100 | | | | Newbury Street CDO Ltd. 2007-1A D, 6.858% 3/4/53 (Acquired 3/8/07, Cost $1,024,549) †# | | | 104 |
| 1,961,789 | | | | Norma CDO Ltd. 2007-1A E, 7.339% 3/11/49 (Acquired 3/1/07, Cost $1,942,679) †# | | | 19,618 |
| 1,981,374 | | | | Orchid Structured Finance CDO Ltd. 2006-3A E, 8.396% 1/6/46 (Acquired 3/9/06, Cost $1,981,373) †# | | | 9,907 |
| 1,500,000 | | | | Parcs-R 2007-8, 5.099% 1/25/46 (Acquired 6/21/07, Cost $1,500,000) †# | | | 138,750 |
| 1,000,000 | | | | Pasa Funding Ltd. 2007-1A D, 4/7/52 in default #~ | | | 100 |
| 1,000,000 | | | | Preferred Term Securities II, Ltd., 10.000% 5/22/33 (Acquired 7/29/05, Cost $1,085,503) †# | | | 317,500 |
| 3,000,000 | | | | Preferred Term Securities XXI, Ltd., 10.000% 3/22/38 (Acquired 3/28/06–7/31/07, Cost $2,795,852) †# | | | 585,000 |
| 999,070 | | | | Preferred Term Securities XXI-2TR, 9.999% 3/22/38 (Acquired 6/29/07, Cost $957,657) †# | | | 429,600 |
| 2,400,000 | | | | Preferred Term Securities XXII, Ltd., 9/22/36 (Acquired 2/26/07, Cost $2,372,895) †~ | | | 800,640 |
| 3,200,000 | | | | Preferred Term Securities XXIII, Ltd., 12/22/36 (Acquired 12/4/06–2/26/07, Cost $3,138,533) †~ | | | 1,332,160 |
| 2,000,000 | | | | Preferred Term Securities XXVIII, Ltd., 10.000% 3/22/38 (Acquired 12/12/07, Cost $1,973,509) †# | | | 1,390,000 |
| 997,523 | | | | Pyxis Master Trust, 7.709% 10/1/37 (Acquired 11/21/06, Cost $997,523) †# | | | 42,395 |
The Notes to the Financial Statements are an integral part of, and should be read in conjunction with, the Financial Statements.
60
RMK STRATEGIC INCOME FUND, INC.
PORTFOLIOOF INVESTMENTS
MARCH 31, 2008
| | | | | | | |
Principal
Amount/
Notional
Amount/
Shares | | | | Description | | Value ‡ |
| | | | | | | |
| Asset-Backed Securities–Below Investment Grade or Unrated* (continued) | | | |
| | | | Collateralized Debt Obligations (“CDO”) (continued) | | | |
| 1,000,000 | | | | Regional Diversified Funding, 1/25/36 (Acquired 4/15/05, Cost $1,000,000) †#~ | | $ | 355,000 |
| 2,885,255 | | | | Sharps CDO 2006-1A D, 5/8/46 (Acquired 12/5/07, Cost $2,738,340) †#~ | | | 21,639 |
| 1,000,000 | | | | Squared CDO Ltd. 2007-1A C, 8.089% 5/11/57 (Acquired 5/11/07, Cost $975,440) †# | | | 10,000 |
| 1,500,000 | | | | Trapeza CDO I LLC 2006-10A, 6/6/41 #~ | | | 7,500 |
| 2,000,000 | | | | Trapeza CDO I LLC 2006-10A D2, 8.700% 6/6/41 (Acquired 6/15/06, Cost $2,000,000) †# | | | 190,000 |
| 2,000,000 | | | | Trapeza CDO I LLC 2006-11A, 10/10/41 #~ | | | 200 |
| 2,000,000 | | | | Trapeza CDO I LLC 2006-11A F, 10/10/41 #~ | | | 15,000 |
| 2,000 | | | | WEBS CDO 2006-1 PS, 4/13/47 (Acquired 12/7/06, Cost $1,800,000) †#~ | | | 20 |
| | | | | | | |
| | | | | | | 10,015,826 |
| | | | | | | |
| | | | Collateralized Loan Obligations (“CLO”)–4.2% | | | |
| 1,000 | | | | Credit Genesis CLO 2005, 6/23/10 (Acquired 6/23/05, Cost $1,000,000) †#~ | | | 650,000 |
| 2,000,000 | | | | Eirles Two Ltd. 262, 8.612% 8/3/21 # | | | 1,240,000 |
| 3,500,000 | | | | Eirles Two Ltd. 263, 11.112% 8/3/21 # | | | 1,995,000 |
| | | | | | | |
| | | | | | | 3,885,000 |
| | | | | | | |
| | | | Equipment Leases–4.7% | | | |
| 8,438,000 | | | | Aerco Limited 1X C1, 7/15/23 #~ | | | 210,950 |
| 7,123,631 | | | | Aerco Limited 2A B2, 7/15/25 (Acquired 7/25/06–12/3/07, Cost $3,511,353) †#~ | | | 534,272 |
| 9,511,932 | | | | Aerco Limited 2A C2, 7/15/25 (Acquired 10/20/05–8/17/06, Cost $3,396,949) †#~ | | | 380,477 |
| 626,718 | | | | DVI Receivables Corp. 2001-2 A3, 3.519% 11/8/31 # | | | 238,153 |
| 879,510 | | | | DVI Receivables Corp. 2001-2 A4, 4.613% 11/11/09 # | | | 351,804 |
| 3,346,529 | | | | DVI Receivables Corp. 2002-1 A3A, 3.350% 6/11/10 # | | | 1,003,959 |
| 2,768,946 | | | | Guggenheim Equipment Trust 2007-1A, 11.193% 7/15/31 (Acquired 5/10/07–7/31/07, Cost $2,044,343) †# | | | 1,606,044 |
| | | | | | | |
| | | | | | | 4,325,659 |
| | | | | | | |
| | | | Home Equity Loans–0.7% | | | |
| 330,984 | | | | Aames Mortgage Trust 2001-3 B, 7.130% 11/25/31 # | | | 10,373 |
| 121,028 | | | | ACE Securities Corp. 2004-HS1 M6, 6.099% 2/25/34 | | | 24,004 |
| 921,999 | | | | Amresco Residential Securities Mortgage Loan Trust 1999-1 B, 11/25/29~ | | | 138,089 |
The Notes to the Financial Statements are an integral part of, and should be read in conjunction with, the Financial Statements.
61
RMK STRATEGIC INCOME FUND, INC.
PORTFOLIOOF INVESTMENTS
MARCH 31, 2008
| | | | | | | |
Principal
Amount/
Notional
Amount/
Shares | | | | Description | | Value ‡ |
| | | | | | | |
| Asset-Backed Securities–Below Investment Grade or Unrated* (continued) | | | |
| | | | Home Equity Loans (continued) | | | |
| 2,325,700 | | | | Asset-Backed Securities Corp. Home Equity 2002-HE3 M4,
7.318% 10/15/32 | | $ | 379,957 |
| 3,000,000 | | | | Meritage Asset Holdings 2005-2 N4, 7.500% 11/25/35 (Acquired 10/26/05, Cost $2,336,485) †# | | | 27,000 |
| 2,000,000 | | | | Meritage Mortgage Loan Trust 2005-3 B2, 5.599% 1/25/36 (Acquired 11/21/05, Cost $1,650,358) †# | | | 97,400 |
| 932,634 | | | | Terwin Mortgage Trust 2005-7SL, 7/25/35 (Acquired 7/29/05, Cost $813,974) †#~ | | | 93 |
| 872,156 | | | | Terwin Mortgage Trust 2005-11SL B7, 11/25/36 (Acquired 10/31/05, Cost $695,599) †#~ | | | 15,699 |
| 3,000,000 | | | | Terwin Mortgage Trust 2005-R1, 12/28/36 (Acquired 12/21/05, Cost $2,221,684) †#~ | | | 8,250 |
| 2,000,000 | | | | Terwin Mortgage Trust 2006-R3, 6/26/37 (Acquired 6/30/06, Cost $1,655,458) †#~ | | | 200 |
| | | | | | | |
| | | | | | | 701,065 |
| | | | | | | |
| | | | Manufactured Housing Loans–0.1% | | | |
| 49,560 | | | | Greenpoint Manufactured Housing 2000-1 M2, 8.780% 3/20/30 | | | 34 |
| | | | | | | |
| | | | Total Asset-Backed Securities–Below Investment Grade or Unrated*
(cost $125,423,189) | | | 18,974,170 |
| | | | | | | |
| Corporate Bonds–Investment Grade*–1.8% of Net Assets | | | |
| | | | Finance–1.1% | | | |
| 1,150,000 | | | | Catlin Insurance Company Ltd., 7.249% 12/31/49 (Acquired 11/2/07, Cost $1,084,862) † | | | 959,871 |
| | | | | | | |
| | | | Special Purpose Entities–0.7% | | | |
| 2,000,000 | | | | Fixed Income Pass-Through Trust 2007-C JPM Class B,
5/15/77 (Acquired 6/22/07, Cost $2,040,301) †#~ | | | 660,000 |
| | | | | | | |
| | | | Total Corporate Bonds–Investment Grade
(cost $3,125,163) | | | 1,619,871 |
| | | | | | | |
| Corporate Bonds–Below Investment Grade or Unrated*–43.9% of Net Assets | | | |
| | | | Apparel–3.1% | | | |
| 3,817,000 | | | | Rafaella Apparel Group Inc., 11.250% 6/15/11 | | | 2,862,750 |
| | | | | | | |
| | | | Automotives–1.8% | | | |
| 950,000 | | | | General Motors, 8.375% 7/15/33 | | | 669,750 |
| 3,575,000 | | | | Metaldyne Corp., 11.000% 6/15/12 | | | 1,001,000 |
| | | | | | | |
| | | | | | | 1,670,750 |
| | | | | | | |
The Notes to the Financial Statements are an integral part of, and should be read in conjunction with, the Financial Statements.
62
RMK STRATEGIC INCOME FUND, INC.
PORTFOLIOOF INVESTMENTS
MARCH 31, 2008
| | | | | | | |
Principal
Amount/
Notional
Amount/
Shares | | | | Description | | Value ‡ |
| | | | | | | |
| Corporate Bonds–Below Investment Grade or Unrated* (continued) | | | |
| | | | Basic Materials–5.5% | | | |
| 2,575,000 | | | | AmeriCast Technologies Inc., 11.000% 12/1/14
(Acquired 11/21/06–3/30/07, Cost $2,604,272) † | | $ | 2,217,719 |
| 2,850,000 | | | | Key Plastics LLC, 11.750% 3/15/13 (Acquired 3/12/07–6/19/07, Cost $2,860,239) † | | | 2,052,000 |
| 1,150,000 | | | | Noranda Aluminium Holding Corp., 11/15/14 (Acquired 7/17/07–7/23/07, Cost $1,110,570) †~ | | | 845,250 |
| | | | | | | |
| | | | | | | 5,114,969 |
| | | | | | | |
| | | | Communications–1.9% | | | |
| 3,450,000 | | | | CCH I Holdings LLC, 11.750% 5/15/14 | | | 1,742,250 |
| | | | | | | |
| | | | Consulting Services–2.5% | | | |
| 2,800,000 | | | | MSX International Inc., 12.500% 4/1/12 (Acquired 3/30/07–4/23/07, Cost $2,784,428) † | | | 2,240,000 |
| | | | | | | |
| | | | Entertainment–2.4% | | | |
| 2,000,000 | | | | French Lick Resorts & Casino LLC, 10.750% 4/15/14
(Acquired 2/7/07–5/14/07, Cost $1,836,764) † | | | 1,200,000 |
| 1,675,000 | | | | Six Flags Inc., 9.625% 6/1/14 | | | 946,375 |
| | | | | | | |
| | | | | | | 2,146,375 |
| | | | | | | |
| | | | Finance–2.8% | | | |
| 2,450,000 | | | | Advanta Capital Trust I, 8.990% 12/17/26 | | | 1,586,375 |
| 1,000,000 | | | | Asure Float, 10.500% 12/31/35 (Acquired 2/7/07, Cost $979,593) †# | | | 980,000 |
| 500,000 | | | | Security Capital Assurance Ltd., 6/17/49~ | | | 25,000 |
| | | | | | | |
| | | | | | | 2,591,375 |
| | | | | | | |
| | | | Industrials–3.8% | | | |
| 341,566 | | | | Home Products Inc., pays-in-kind 3/20/17 #~ | | | 66,776 |
| 2,875,000 | | | | Momentive Performance, 11.500% 12/1/16 | | | 2,188,594 |
| 2,240,000 | | | | Terphane Holding Corp., 12.500% 6/15/09 (Acquired 4/25/06–10/10/07, Cost $2,220,551) † | | | 1,187,200 |
| | | | | | | |
| | | | | | | 3,442,570 |
| | | | | | | |
| | | | Manufacturing–5.0% | | | |
| 3,000,000 | | | | JB Poindexter & Co. Inc., 8.750% 3/15/14 | | | 1,953,750 |
| 3,400,000 | | | | MAAX Corp., 9.750% 6/15/12 | | | 748,000 |
| 2,125,000 | | | | Wolverine Tube, Inc., 10.500% 4/1/09 | | | 1,901,875 |
| | | | | | | |
| | | | | | | 4,603,625 |
| | | | | | | |
The Notes to the Financial Statements are an integral part of, and should be read in conjunction with, the Financial Statements.
63
RMK STRATEGIC INCOME FUND, INC.
PORTFOLIOOF INVESTMENTS
MARCH 31, 2008
| | | | | | | |
Principal
Amount/
Notional
Amount/
Shares | | | | Description | | Value ‡ |
| | | | | | | |
| Corporate Bonds–Below Investment Grade or Unrated* (continued) | | | |
| | | | Oil & Natural Gas–1.5% | | | |
| 1,500,000 | | | | Seametric International, 11.625% 5/25/12 (Acquired 5/25/07, Cost $1,485,618) †# | | $ | 1,383,750 |
| | | | | | | |
| | | | Paper Products–1.5% | | | |
| 1,825,000 | | | | Corp Durango SAB de CV, 10.500% 10/5/17
(Acquired 10/10/07–10/15/07, Cost $1,810,001) † | | | 1,368,750 |
| | | | | | | |
| | | | Real Estate Management–1.7% | | | |
| 3,550,000 | | | | Realogy Corp., 12.375% 4/15/15 | | | 1,579,750 |
| | | | | | | |
| | | | Retail–2.2% | | | |
| 1,361,000 | | | | Lazydays RV Center Inc., 11.750% 5/15/12 | | | 1,081,995 |
| 2,390,000 | | | | Uno Restaurant Corp., 10.000% 2/15/11 (Acquired 8/12/05–6/29/06, Cost $2,298,498) † | | | 956,000 |
| | | | | | | |
| | | | | | | 2,037,995 |
| | | | | | | |
| | | | Special Purpose Entities–2.8% | | | |
| 695,000 | | | | Interactive Health LLC, 7.250% 4/1/11 (Acquired 1/13/06–12/11/2006, Cost $585,154) † | | | 417,000 |
| 2,700,000 | | | | PNA Intermediate Holding Corp., 10.065% 2/15/13 | | | 2,099,250 |
| | | | | | | |
| | | | | | | 2,516,250 |
| | | | | | | |
| | | | Telecommunications–3.5% | | | |
| 3,975,000 | | | | Primus Telecommunications GP, 8.000% 1/15/14 | | | 1,709,250 |
| 2,075,000 | | | | Securus Technologies Inc., 11.000% 9/1/11 | | | 1,494,000 |
| | | | | | | |
| | | | | | | 3,203,250 |
| | | | | | | |
| | | | Tobacco–1.9% | | | |
| 2,625,000 | | | | North Atlantic Trading Co., 9.250% 3/1/12 | | | 1,706,250 |
| | | | | | | |
| | | | Total Corporate Bonds–Below Investment Grade or Unrated*
(cost $60,982,986) | | | 40,210,659 |
| | | | | | | |
| Mortgage-Backed Securities–Investment Grade*–14.9% of Net Assets | | | |
| | | | Collateralized Mortgage Obligations–14.9% | | | |
| 573,521 | | | | Countrywide Alternative Loan Trust 2005-49CB A5, 5.500% 11/25/35 | | | 512,313 |
| 1,976,096 | | | | Countrywide Alternative Loan Trust 2005-56 M4, 3.519% 11/25/35 # | | | 917,106 |
| 109,074,694 | | | | Countrywide Alternative Loan Trust 2006-HY12 A4X, 2.658% 8/25/36
interest-only strips | | | 4,325,793 |
| 624,740 | | | | Deutsche Alt-A Securities Inc. Mortgage Loan 2006-AF1 A5,
2.879% 4/25/36 | | | 308,255 |
The Notes to the Financial Statements are an integral part of, and should be read in conjunction with, the Financial Statements.
64
RMK STRATEGIC INCOME FUND, INC.
PORTFOLIOOF INVESTMENTS
MARCH 31, 2008
| | | | | | | |
Principal
Amount/
Notional
Amount/
Shares | | | | Description | | Value ‡ |
| | | | | | | |
| Mortgage-Backed Securities–Investment Grade* (continued) | | | |
| | | | Collateralized Mortgage Obligations (continued) | | | |
| 3,000,000 | | | | Deutsche Mortgage Securities, Inc. 2006-RS1 N2, 4.393% 9/27/35 (Acquired 2/5/07, Cost $3,014,397) †# | | $ | 1,950,000 |
| 4,723,113 | | | | Harborview Mortgage Loan Trust 2004-1 X, 3.024% 4/19/34 interest-only strips | | | 145,609 |
| 13,545,614 | | | | Mellon Residential Funding Corp. 2004-TBC1 X, 0.314% 2/26/34 interest-only strips (Acquired 7/22/04, Cost $879,999) †# | | | 179,344 |
| 3,000,939 | | | | Residential Accredit Loans Inc. 2006-Q08 M4, 3.129% 10/25/46 # | | | 664,198 |
| 110,787,859 | | | | Residential Accredit Loans Inc. 2007-QH8 P, 0.500% 10/25/37 interest-only strips # | | | 454,230 |
| 116,580 | | | | Structured Asset Investment Loan Trust 2004-5A B, 6/27/34 (Acquired 7/8/04–7/9/04, Cost $114,057) †#~ | | | 2,506 |
| 3,000,000 | | | | Structured Asset Mortgage Investments Inc. 2006-AR3 1B1, 2.999% 4/25/36 | | | 1,250,397 |
| 746,710 | | | | Structured Asset Securities Corp. 1999-SP1, 9.000% 5/25/29 | | | 513,368 |
| 227,143,667 | | | | Washington Mutual, Inc. 2006-AR4 PPP, 0.050% 5/25/46 interest-only strips # | | | 74,957 |
| 146,441,853 | | | | Washington Mutual, Inc. 2007-0A3 CX2P, 0.567% 2/25/47 interest-only strips # | | | 2,265,455 |
| | | | | | | |
| | | | Total Mortgage-Backed Securities–Investment Grade*
(cost $19,543,980) | | | 13,563,531 |
| | | | | | | |
| Mortgage-Backed Securities–Below Investment Grade or Unrated*–20.5%of Net Assets | | | |
| | | | Collateralized Mortgage Obligations–20.4% | | | |
| 2,000,000 | | | | Countrywide Alternative Loan Trust 2006-OA11 N3, 12.500% 9/25/46 (Acquired 10/10/06, Cost $2,028,891) †# | | | 1,815,000 |
| 2,511,230 | | | | Countrywide Alternative Loan Trust 2006-6CB B4, 5.575% 5/25/36 # | | | 491,498 |
| 921,004 | | | | Countrywide Asset Backed Certificates 2006-SPS2 A, 2.759% 5/25/26 | | | 385,377 |
| 3,000,000 | | | | Greenwich Structured Adjustable Rate Mortgage Products 2005-3A N2, 2.000% 6/27/35 (Acquired 7/25/05, Cost $1,961,040) †# | | | 1,425,000 |
| 5,878,487 | | | | Greenwich Structured Adjustable Rate Mortgage Products 2005-4A N-2, 7/27/45 (Acquired 9/26/05, Cost $3,207,303) †#~ | | | 2,645,319 |
| 8,300,000 | | | | GSAMP Trust 2006-S3 A2, 5.769% 5/25/36 | | | 2,546,855 |
| 2,000,000 | | | | Harborview Corp. 2006-8A N5, 7/21/36 (Acquired 10/11/06, Cost $885,501) †#~ | | | 576,220 |
The Notes to the Financial Statements are an integral part of, and should be read in conjunction with, the Financial Statements.
65
RMK STRATEGIC INCOME FUND, INC.
PORTFOLIOOF INVESTMENTS
MARCH 31, 2008
| | | | | | | |
Principal
Amount/
Notional
Amount/
Shares | | | | Description | | Value ‡ |
| | | | | | | |
| Mortgage-Backed Securities–Below Investment Grade or Unrated* (continued) |
| | | | Collateralized Mortgage Obligations (continued) | | | |
| 1,000,000 | | | | Harborview Corp. 2006-14 N4, 8.350% 3/19/38 (Acquired 3/6/07, Cost $847,352) †# | | $ | 794,390 |
| 5,000,000 | | | | Harborview Corp. 2006-14 PS, 12/19/36 (Acquired 3/6/07, Cost $1,076,734) †#~ | | | 66,050 |
| 2,959,259 | | | | Harborview Mortgage Loan Trust 2006-4 B11, 4.309% 5/19/47 (Acquired 5/23/06, Cost $1,871,617) †# | | | 231,118 |
| 4,979,598 | | | | Harborview Mortgage Loan Trust 2006-5 B1, 4.309% 7/19/47 # | | | 407,431 |
| 5,000,000 | | | | Long Beach Asset Holdings Corp. 2005-WL1 N4, 7.500% 6/25/45 (Acquired 11/7/05–12/7/06, Cost $4,610,552) †# | | | 23,250 |
| 2,607,053 | | | | Long Beach Mortgage Loan Trust 2005-WL2 B3, 5.635% 8/25/35 (Acquired 10/20/06–3/6/07, Cost $2,042,202) †# | | | 65,958 |
| 7,687,109 | | | | Long Beach Mortgage Loan Trust 2006-A A1, 2.689% 5/25/36 | | | 2,501,893 |
| 8,000,000 | | | | Long Beach Mortgage Loan Trust 2006-A A2, 5.548% 5/25/36 | | | 1,868,040 |
| 1,021,575 | | | | Park Place Securities Inc. 2005-WCW1 B, 5.000% 9/25/35 (Acquired 8/4/05, Cost $950,807) †# | | | 13,178 |
| 5,000,000 | | | | Park Place Securities Inc. 2005-WCW2 M10, 5.099% 7/25/35 # | | | 289,000 |
| 3,000,000 | | | | Park Place Securities Inc. 2005-WHQ3 M11, 5.099% 6/25/35 # | | | 1,486,020 |
| 1,000,000 | | | | Park Place Securities Inc. 2005-WHQ4, 5.099% 9/25/35 (Acquired 8/30/05, Cost $712,244) †# | | | 76,700 |
| 1,000,000 | | | | Sharp SP I LLC Trust 2006-A HM3 N3, 12.500% 10/25/46 (Acquired 10/13/06, Cost $1,000,000) †# | | | 867,820 |
| 1,423,000 | | | | Structured Asset Investment Loan Trust 2003-BC1 B2, 9.000% 5/25/32 | | | 172,425 |
| 523,841 | | | | Structured Asset Securities Corp. 2004-S3 M9, 6.500% 11/25/34 (Acquired 6/5/06, Cost $491,972) †# | | | 45,574 |
| | | | | | | |
| | | | | | | 18,794,116 |
| | | | | | | |
| | | | Residential Mortgage-Backed Securities–0.1% | | | |
| 9 | | | | Harborview 2006-8, 7/22/36 (Cost $0) †#~ | | | 1 |
| 67,000 | | | | Indymac Indx CI-1 Corp., 6/25/46 (Acquired 7/20/06, Cost $1,820,859) †#~ | | | 46,230 |
| | | | | | | |
| | | | | | | 46,231 |
| | | | | | | |
| | | | Total Mortgage-Backed Securities–Below Investment Grade or Unrated*
(cost $43,245,052) | | | 18,840,347 |
| | | | | | | |
| Municipal Securities–0.1% of Net Assets | | | |
| 13,185 | | | | Pima County Arizona Health Care Facilities, Revenue Bonds,
6.000% 6/1/08 | | | 12,899 |
The Notes to the Financial Statements are an integral part of, and should be read in conjunction with, the Financial Statements.
66
RMK STRATEGIC INCOME FUND, INC.
PORTFOLIOOF INVESTMENTS
MARCH 31, 2008
| | | | | | | |
Principal
Amount/
Notional
Amount/
Shares | | | | Description | | Value ‡ |
| | | | | | | |
| Municipal Securities (continued) | | | |
| 24,836 | | | | Pima County Arizona Health Care Facilities, Revenue Bonds,
6.274% 6/1/09 | | $ | 21,324 |
| 35,126 | | | | Pima County Arizona Health Care Facilities, Revenue Bonds,
6.455% 6/1/10 | | | 27,195 |
| | | | | | | |
| | | | Total Municipal Securities
(cost $68,805) | | | 61,418 |
| | | | | | | |
| Common Stocks–6.1% of Net Assets | | | |
| | | | Basic Materials–0.3% | | | |
| 27,000 | | | | Horsehead Holdings (Acquired 4/12/07, Cost $364,500) †~ | | | 312,660 |
| | | | | | | |
| | | | Communications–0.2% | | | |
| 14,100 | | | | Citizens Communications Company | | | 147,909 |
| | | | | | | |
| | | | Consumer Products–0.2% | | | |
| 13,663 | | | | Home Products #~ | | | 410 |
| 189,000 | | | | Insight Health Services Holdings Corp ~ | | | 190,890 |
| | | | | | | |
| | | | | | | 191,300 |
| | | | | | | |
| | | | Energy–0.8% | | | |
| 1,100 | | | | Diamond Offshore Drilling, Inc. | | | 128,040 |
| 11,800 | | | | Legacy Reserves LP | | | 235,528 |
| 151,500 | | | | Pinnacle Gas Resources, Inc. ~ | | | 383,295 |
| | | | | | | |
| | | | | | | 746,863 |
| | | | | | | |
| | | | Financials–1.8% | | | |
| 26,200 | | | | FSI Realty Trust (Acquired 5/3/07, Cost $262,000) †~ | | | 32,750 |
| 92,000 | | | | FSI Realty Trust Regulation D (Acquired 5/24/07, Cost $867,587) †~ | | | 115,000 |
| 15,100 | | | | MFA Mortgage Investments, Inc. | | | 95,130 |
| 42,647 | | | | Mid Country (Acquired 5/25/07, Cost $724,999) †#~ | | | 550,146 |
| 93,500 | | | | Star Asia Financial Ltd. (Acquired 3/2/07–8/1/07, Cost $953,200) † | | | 864,875 |
| | | | | | | |
| | | | | | | 1,657,901 |
| | | | | | | |
| | | | Industrial–1.1% | | | |
| 7,900 | | | | Aircastle Limited | | | 88,875 |
| 91,386 | | | | Intermet Corporation #~ | | | 10,966 |
| 10,800 | | | | OceanFreight Inc. | | | 236,195 |
| 41,300 | | | | Orion Marine Group (Acquired 5/16/07–8/1/2007, Cost $570,600) †~ | | | 493,535 |
| 1,050 | | | | Port Townsend Paper Corp. ~ | | | 173,250 |
| | | | | | | |
| | | | | | | 1,002,821 |
| | | | | | | |
The Notes to the Financial Statements are an integral part of, and should be read in conjunction with, the Financial Statements.
67
RMK STRATEGIC INCOME FUND, INC.
PORTFOLIOOF INVESTMENTS
MARCH 31, 2008
| | | | | | | | |
Principal
Amount/
Notional
Amount/
Shares | | | | Description | | Value ‡ | |
| | | | | | | | |
| Common Stocks (continued) | | | | |
| | | | Technology–1.7% | | | | |
| 298,800 | | | | Banctec Inc. (Acquired 6/27/07–8/1/07, Cost $2,390,400) †~ | | $ | 1,494,000 | |
| 5,193 | | | | Taiwan Semiconductor Manufacturing Company Ltd. | | | 53,332 | |
| | | | | | | | |
| | | | | | | 1,547,332 | |
| | | | | | | | |
| | | | Total Common Stocks
(cost $15,868,049) | | | 5,606,786 | |
| | | | | | | | |
| Eurodollar Time Deposits–4.1% of Net Assets | | | | |
| | | | State Street Bank & Trust Company Eurodollar time deposits dated March 31, 2008, 1.00% maturing at $3,683,833 on April 1, 2008. | | | 3,683,731 | |
| | | | | | | | |
| | | | Total Investments–130.6% of Net Assets
(cost $315,883,317) | | | 119,491,428 | |
| | | | | | | | |
| | | | Other Assets and Liabilities, net–(30.6%) of Net Assets | | | (28,010,652 | ) |
| | | | | | | | |
| | | | Net Assets | | $ | 91,480,776 | |
| | | | | | | | |
| † | | Securities sold within the terms of a private placement memorandum, exempt from registration under Rule 144A under the Securities Act of 1933, as amended, and may be resold in transactions exempt from registration, normally to qualified institutional buyers. |
| ‡ | | See Note 2 of the accompanying Notes to the Financial Statements regarding investment valuations. |
| ~ | | Non-income producing security. In the case of bonds, they missed their last coupon payment. |
| # | | Security valued at fair value—See Note 2 of the accompanying Notes to the Financial Statements regarding investment valuations. |
| | | Substantially all of the Fund’s investment securities, other than equity securities, are pledged as collateral under the line of credit. |
The Notes to the Financial Statements are an integral part of, and should be read in conjunction with, the Financial Statements.
68
[THIS PAGE INTENTIONALLY LEFT BLANK]
69
REGIONS MORGAN KEEGAN FUNDS
STATEMENTSOF ASSETSAND LIABILITES
MARCH 31, 2008
| | | | | | | | | | | | | | | | |
| | | RMK Advantage Income Fund | | | RMK High Income Fund | | | RMK Multi-Sector
High Income
Fund | | | RMK Strategic Income Fund | |
Assets: | | | | | | | | | | | | | | | | |
Investments in securities, at value | | $ | 118,405,236 | | | $ | 88,676,660 | | | $ | 117,088,904 | | | $ | 119,491,428 | |
Dividends and interest receivable | | | 5,112,087 | | | | 4,041,184 | | | | 4,954,490 | | | | 4,903,088 | |
Receivable for investments sold | | | 2,164,085 | | | | 2,138,210 | | | | 4,658,182 | | | | 2,357,832 | |
Prepaid expenses | | | 242,327 | | | | 20,050 | | | | 242,327 | | | | 20,608 | |
Other assets | | | — | | | | 13,524 | | | | — | | | | — | |
| | | | | | | | | | | | | | | | |
Total assets | | | 125,923,735 | | | | 94,889,628 | | | | 126,943,903 | | | | 126,772,956 | |
| | | | | | | | | | | | | | | | |
Liabilities: | | | | | | | | | | | | | | | | |
Loans payable (Note 7) | | | 15,000,000 | | | | 12,000,000 | | | | 17,000,000 | | | | 35,000,000 | |
Interest due on loan payable | | | 96,848 | | | | 21,150 | | | | 97,557 | | | | 113,594 | |
Payable for investments purchased | | | — | | | | 302,979 | | | | — | | | | — | |
Accrued expenses: | | | | | | | | | | | | | | | | |
Advisory fees (Note 4) | | | 83,597 | | | | 55,071 | | | | 83,588 | | | | 74,628 | |
Accounting and administration fees (Note 4) | | | 19,292 | | | | 12,709 | | | | 19,289 | | | | 17,222 | |
Other | | | 110,128 | | | | 88,675 | | | | 110,954 | | | | 86,736 | |
| | | | | | | | | | | | | | | | |
Total liabilities | | | 15,309,865 | | | | 12,480,584 | | | | 17,311,388 | | | | 35,292,180 | |
| | | | | | | | | | | | | | | | |
Net assets | | $ | 110,613,870 | | | $ | 82,409,044 | | | $ | 109,632,515 | | | $ | 91,480,776 | |
| | | | | | | | | | | | | | | | |
Composition of Net Assets: | | | | | | | | | | | | | | | | |
Common stock, $.0001 par value (1,000,000,000 shares authorized for each fund) | | | 3,230 | | | | 2,386 | | | | 3,640 | | | | 2,885 | |
Paid-in capital | | | 461,529,911 | | | | 341,149,059 | | | | 498,818,363 | | | | 405,229,500 | |
Undistributed net investment income | | | (403,258 | ) | | | (353,487 | ) | | | 828,595 | | | | (382,866 | ) |
Accumulated net realized (losses) on investments | | | (124,395,186 | ) | | | (89,354,383 | ) | | | (145,436,363 | ) | | | (116,976,854 | ) |
Net unrealized (depreciation) on investments | | | (226,120,827 | ) | | | (169,034,531 | ) | | | (244,581,720 | ) | | | (196,391,889 | ) |
| | | | | | | | | | | | | | | | |
Net assets | | | 110,613,870 | | | | 82,409,044 | | | | 109,632,515 | | | | 91,480,776 | |
| | | | | | | | | | | | | | | | |
Investments, at identified cost | | $ | 344,526,063 | | | $ | 257,711,191 | | | $ | 361,670,624 | | | $ | 315,883,317 | |
| | | | | | | | | | | | | | | | |
Shares Outstanding and Net Asset Value Per Share: | | | | | | | | | | | | | | | | |
Common shares outstanding | | | 32,296,072 | | | | 23,856,527 | | | | 36,397,815 | | | | 28,851,278 | |
Net asset value per share | | $ | 3.42 | | | $ | 3.45 | | | $ | 3.01 | | | $ | 3.17 | |
The Notes to the Financial Statements are an integral part of, and should be read in conjunction with, the Financial Statements.
70
REGIONS MORGAN KEEGAN FUNDS
STATEMENTSOF OPERATIONS
FOR THE YEAR ENDED MARCH 31, 2008
| | | | | | | | | | | | | | | | |
| | | RMK Advantage
Income Fund | | | RMK High Income Fund | | | RMK Multi-Sector
High Income Fund | | | RMK Strategic
Income Fund | |
Investment Income: | | | | | | | | | | | | | | | | |
Interest income | | $ | 50,748,756 | | | $ | 35,627,859 | | | $ | 53,305,428 | | | $ | 43,742,237 | |
Dividend income | | | 2,005,439 | (a) | | | 1,492,701 | (b) | | | 2,681,001 | (c) | | | 1,620,370 | (d) |
| | | | | | | | | | | | | | | | |
Total investment income | | | 52,754,195 | | | | 37,120,560 | | | | 55,986,429 | | | | 45,362,607 | |
| | | | | | | | | | | | | | | | |
Expenses: | | | | | | | | | | | | | | | | |
Advisory fees | | | 2,367,493 | | | | 1,703,488 | | | | 2,595,194 | | | | 2,050,892 | |
Accounting and administration fees | | | 885,254 | | | | 638,156 | | | | 947,781 | | | | 757,415 | |
Interest expense | | | 5,332,436 | | | | 4,097,363 | | | | 5,982,859 | | | | 5,159,708 | |
Debt issue expense | | | 577,142 | | | | 255,368 | | | | 623,700 | | | | 193,822 | |
Legal fees | | | 209,162 | | | | 171,151 | | | | 194,981 | | | | 182,543 | |
Audit fees | | | 53,250 | | | | 52,500 | | | | 53,250 | | | | 52,500 | |
Transfer agent fees | | | 25,490 | | | | 26,007 | | | | 25,172 | | | | 25,974 | |
Custodian fees | | | 35,831 | | | | 34,251 | | | | 34,655 | | | | 36,003 | |
Registration fees | | | 33,002 | | | | 26,811 | | | | 37,557 | | | | 28,640 | |
Directors’ fees | | | 49,554 | | | | 52,555 | | | | 49,554 | | | | 49,554 | |
Insurance premiums | | | 15,272 | | | | 11,140 | | | | 16,183 | | | | 13,200 | |
Other | | | 55,309 | | | | 50,487 | | | | 51,748 | | | | 55,987 | |
| | | | | | | | | | | | | | | | |
Total Expenses | | | 9,639,195 | | | | 7,119,277 | | | | 10,612,634 | | | | 8,606,238 | |
| | | | | | | | | | | | | | | | |
Expenses voluntarily waived by the Adviser | | | 449,505 | | | | 324,625 | | | | 462,085 | | | | 376,117 | |
| | | | | | | | | | | | | | | | |
Net expenses | | | 9,189,690 | | | | 6,794,652 | | | | 10,150,549 | | | | 8,230,121 | |
| | | | | | | | | | | | | | | | |
Net investment income | | | 43,564,505 | | | | 30,325,908 | | | | 45,835,880 | | | | 37,132,486 | |
| | | | | | | | | | | | | | | | |
Realized and Unrealized Gains/(Losses) on Investments: | | | | | | | | | | | | | | | | |
Net realized (losses) on investments | | | (125,389,829 | ) | | | (89,535,090 | ) | | | (145,656,902 | ) | | | (111,682,423 | ) |
Net realized gains on expiration of options | | | 19,066 | | | | 11,038 | | | | 19,972 | | | | 15,327 | |
Net change in unrealized (depreciation) on investments | | | (188,194,389 | ) | | | (135,395,493 | ) | | | (218,139,646 | ) | | | (160,715,334 | ) |
| | | | | | | | | | | | | | | | |
Change in net assets resulting from operations | | $ | (270,000,647 | ) | | $ | (194,593,637 | ) | | $ | (317,940,696 | ) | | $ | (235,249,944 | ) |
| | | | | | | | | | | | | | | | |
| (a) | | Net of foreign taxes paid of $12,230. |
| (b) | | Net of foreign taxes paid of $9,283. |
| (c) | | Net of foreign taxes paid of $12,691. |
| (d) | | Net of foreign taxes paid of $12,087. |
The Notes to the Financial Statements are an integral part of, and should be read in conjunction with, the Financial Statements.
71
REGIONS MORGAN KEEGAN FUNDS
STATEMENTSOF CHANGESIN NET ASSETS
| | | | | | | | | | | | | | | | |
| | | RMK Advantage Income Fund | | | RMK High Income Fund | |
| | | Year Ended
March 31, 2008 | | | Year Ended
March 31,
2007 | | | Year Ended
March 31, 2008 | | | Year Ended
March 31,
2007 | |
Change in Net Assets: | | | | | | | | | | | | | | | | |
Operations: | | | | | | | | | | | | | | | | |
Net investment income | | $ | 43,564,505 | | | $ | 50,929,520 | | | $ | 30,325,908 | | | $ | 39,814,196 | |
Net realized gains/(losses) on investments | | | (125,370,763 | ) | | | 4,536,263 | | | | (89,524,052 | ) | | | 725,110 | |
Net change in unrealized (depreciation) on investments | | | (188,194,389 | ) | | | (24,493,116 | ) | | | (135,395,493 | ) | | | (17,889,752 | ) |
| | | | | | | | | | | | | | | | |
Change in net assets resulting from operations | | | (270,000,647 | ) | | | 30,972,667 | | | | (194,593,637 | ) | | | 22,649,554 | |
| | | | | | | | | | | | | | | | |
Distributions to Stockholders: | | | | | | | | | | | | | | | | |
Total distributions to stockholders | | | (45,949,636 | ) | | | (53,824,303 | ) | | | (33,665,138 | ) | | | (39,669,226 | ) |
| | | | | | | | | | | | | | | | |
Capital Transactions: | | | | | | | | | | | | | | | | |
Proceeds from sales of shares as a result of reinvested dividends and other distributions (928,527, 1,448,543, 854,103 and 850,816 shares) | | | 9,565,512 | | | | 22,621,138 | | | | 7,408,915 | | | | 13,579,515 | |
| | | | | | | | | | | | | | | | |
Change in net assets from capital transactions | | | 9,565,512 | | | | 22,621,138 | | | | 7,408,915 | | | | 13,579,515 | |
| | | | | | | | | | | | | | | | |
Change in Net Assets | | | (306,384,771 | ) | | | (230,498 | ) | | | (220,849,860 | ) | | | (3,440,157 | ) |
| | | | | | | | | | | | | | | | |
Net Assets: | | | | | | | | | | | | | | | | |
Beginning of period | | | 416,998,641 | | | | 417,229,139 | | | | 303,258,904 | | | | 306,699,061 | |
| | | | | | | | | | | | | | | | |
End of period | | $ | 110,613,870 | | | $ | 416,998,641 | | | $ | 82,409,044 | | | $ | 303,258,904 | |
| | | | | | | | | | | | | | | | |
The Notes to the Financial Statements are an integral part of, and should be read in conjunction with, the Financial Statements.
72
REGIONS MORGAN KEEGAN FUNDS
STATEMENTSOF CHANGESIN NET ASSETS
| | | | | | | | | | | | | | | | |
| | | RMK Multi-Sector
High Income Fund | | | RMK Strategic
Income Fund | |
| | | Year Ended
March 31, 2008 | | | Year Ended
March 31,
2007 | | | Year Ended
March 31, 2008 | | | Year Ended
March 31,
2007 | |
Change in Net Assets: | | | | | | | | | | | | | | | | |
Operations: | | | | | | | | | | | | | | | | |
Net investment income | | $ | 45,835,880 | | | $ | 58,499,119 | | | $ | 37,132,486 | | | $ | 44,236,453 | |
Net realized gains/(losses) on investments | | | (145,636,930 | ) | | | 15,079,185 | | | | (111,667,096 | ) | | | 3,538,612 | |
Net change in unrealized (depreciation) on investments | | | (218,139,646 | ) | | | (29,539,043 | ) | | | (160,715,334 | ) | | | (20,047,226 | ) |
| | | | | | | | | | | | | | | | |
Change in net assets resulting from operations | | | (317,940,696 | ) | | | 44,039,261 | | | | (235,249,944 | ) | | | 27,727,839 | |
| | | | | | | | | | | | | | | | |
Distributions to Stockholders: | | | | | | | | | | | | | | | | |
Total distributions to stockholders | | | (61,741,066 | ) | | | (60,693,200 | ) | | | (40,738,416 | ) | | | (48,020,431 | ) |
| | | | | | | | | | | | | | | | |
Capital Transactions: | | | | | | | | | | | | | | | | |
Proceeds from sales of shares as a result of reinvested dividends and other distributions (3,141,378, 2,061,455, 989,582 and 1,074,450 shares) | | | 20,435,595 | | | | 32,009,545 | | | | 8,239,194 | | | | 16,754,479 | |
| | | | | | | | | | | | | | | | |
Change in net assets from capital transactions | | | 20,435,595 | | | | 32,009,545 | | | | 8,239,194 | | | | 16,754,479 | |
| | | | | | | | | | | | | | | | |
Change in Net Assets | | | (359,246,167 | ) | | | 15,355,606 | | | | (267,749,166 | ) | | | (3,538,113 | ) |
| | | | | | | | | | | | | | | | |
Net Assets: | | | | | | | | | | | | | | | | |
Beginning of period | | | 468,878,682 | | | | 453,523,076 | | | | 359,229,942 | | | | 362,768,055 | |
| | | | | | | | | | | | | | | | |
End of period | | $ | 109,632,515 | | | $ | 468,878,682 | | | $ | 91,480,776 | | | $ | 359,229,942 | |
| | | | | | | | | | | | | | | | |
The Notes to the Financial Statements are an integral part of, and should be read in conjunction with, the Financial Statements.
73
REGIONS MORGAN KEEGAN FUNDS
STATEMENTSOF CASH FLOWS
FOR THE YEAR ENDED MARCH 31, 2008
| | | | | | | | |
| | | RMK Advantage
Income Fund | | | RMK High
Income Fund | |
Cash flows from operating activities | | | | | | | | |
Net decrease in net assets from operations | | $ | (270,000,647 | ) | | $ | (194,593,637 | ) |
Adjustments to reconcile net increase in net assets from operations to net cash provided by operating activities | | | | | | | | |
Purchase of investment securities | | | (263,426,467 | ) | | | (184,205,412 | ) |
Proceeds from disposition of investment securities | | | 364,436,664 | | | | 266,924,376 | |
Purchase of short-term investment securities, net | | | 11,283,567 | | | | 5,847,927 | |
Proceeds from principal payments | | | 10,513,341 | | | | 4,241,930 | |
Change in unrealized appreciation on investment securities | | | 188,194,389 | | | | 135,395,493 | |
Amortization/accretion of premiums/discount on investment securities | | | (1,246,531 | ) | | | (898,504 | ) |
Net realized loss on investment securities | | | 125,370,763 | | | | 89,524,052 | |
Net realized gain on principal payments | | | (1,492,447 | ) | | | (571,501 | ) |
Amortization of debt issue costs | | | 577,142 | | | | 255,368 | |
Decrease in dividends and interest receivable | | | 2,877,037 | | | | 2,139,106 | |
Decrease in receivables for securities sold | | | 10,443,923 | | | | 8,651,038 | |
(Decrease) in interest payable | | | (590,286 | ) | | | (208,850 | ) |
(Decrease) in payables for securities purchased | | | (4,494,669 | ) | | | (2,817,495 | ) |
(Decrease) in advisory fees | | | (234,497 | ) | | | (180,051 | ) |
(Decrease) in accounting and administration fees | | | (54,115 | ) | | | (41,550 | ) |
Increase/(decrease) in accrued expenses | | | (1,763 | ) | | | 17,959 | |
| | | | | | | | |
Net cash provided by operating activities | | | 172,155,404 | | | | 129,480,249 | |
| | | | | | | | |
Cash flows from financing activities | | | | | | | | |
Decrease in loan payable | | | (135,000,000 | ) | | | (103,000,000 | ) |
Cash paid for debt issue costs | | | (771,280 | ) | | | (224,026 | ) |
Cash distributions paid | | | (36,384,124 | ) | | | (26,256,223 | ) |
| | | | | | | | |
Net cash (used in) financing activities | | | (172,155,404 | ) | | | (129,480,249 | ) |
| | | | | | | | |
Net increase/(decrease) in cash | | | — | | | | — | |
| | | | | | | | |
| Cash | | | | | | | | |
Beginning balance | | | — | | | | — | |
| | | | | | | | |
Ending balance | | $ | — | | | $ | — | |
| | | | | | | | |
Supplemental disclosure of cash flow information: Noncash financing activities not included herein consist of reinvestment of dividends and other distributions of $9,565,512 and $7,408,915 for RMK Advantage Income Fund and RMK High Income Fund, respectively. Total cash paid for interest was $5,922,722 and $4,306,213 for RMK Advantage Income Fund and RMK High Income Fund, respectively.
The Notes to the Financial Statements are an integral part of, and should be read in conjunction with, the Financial Statements.
74
REGIONS MORGAN KEEGAN FUNDS
STATEMENTSOF CASH FLOWS
FOR THE YEAR ENDED MARCH 31, 2008
| | | | | | | | |
| | | RMK Multi–Sector High Income Fund | | | RMK Strategic Income Fund | |
Cash flows from operating activities | | | | | | | | |
Net decrease in net assets from operations | | $ | (317,940,696 | ) | | $ | (235,249,944 | ) |
Adjustments to reconcile net increase in net assets from operations to net cash provided by operating activities | | | | | | | | |
Purchase of investment securities | | | (257,917,295 | ) | | | (220,026,366 | ) |
Proceeds from disposition of investment securities | | | 390,571,076 | | | | 300,869,752 | |
Purchase of short-term investment securities, net | | | 2,792,060 | | | | 10,617,431 | |
Proceeds from principal payments | | | 6,897,774 | | | | 5,352,657 | |
Change in unrealized appreciation on investment securities | | | 218,139,646 | | | | 160,715,334 | |
Amortization/accretion of premiums/discount on investment securities | | | (1,393,544 | ) | | | (854,349 | ) |
Net realized loss on investment securities | | | 145,636,930 | | | | 111,667,096 | |
Net realized gain on principal payments | | | (636,363 | ) | | | (675,787 | ) |
Amortization of debt issue costs | | | 623,700 | | | | 193,822 | |
Decrease in dividends and interest receivable | | | 3,194,915 | | | | 2,367,333 | |
Decrease in receivables for securities sold | | | 10,867,068 | | | | 7,762,327 | |
(Decrease) in interest payable | | | (681,195 | ) | | | (1,435,712 | ) |
(Decrease) in payables for securities purchased | | | (4,682,672 | ) | | | (3,384,810 | ) |
(Decrease) in advisory fees | | | (275,114 | ) | | | (204,885 | ) |
(Decrease) in accounting and administration fees | | | (63,488 | ) | | | (47,281 | ) |
Increase/(decrease) in accrued expenses | | | (9,493 | ) | | | 18,020 | |
| | | | | | | | |
Net cash provided by operating activities | | | 195,123,309 | | | | 137,684,638 | |
| | | | | | | | |
Cash flows from financing activities | | | | | | | | |
Decrease in loan payable | | | (153,000,000 | ) | | | (105,000,000 | ) |
Cash paid for debt issue costs | | | (817,838 | ) | | | (185,416 | ) |
Cash distributions paid | | | (41,305,471 | ) | | | (32,499,222 | ) |
| | | | | | | | |
Net cash (used in) financing activities | | | (195,123,309 | ) | | | (137,684,638 | ) |
| | | | | | | | |
Net increase/(decrease) in cash | | | — | | | | — | |
| | | | | | | | |
| Cash | | | | | | | | |
Beginning balance | | | — | | | | — | |
| | | | | | | | |
Ending balance | | $ | — | | | $ | — | |
| | | | | | | | |
Supplemental disclosure of cash flow information: Noncash financing activities not included herein consist of reinvestment of dividends and other distributions of $20,435,595 and $8,239,194 for RMK Multi-Sector High Income and RMK Strategic Income Fund, respectively. Total cash paid for interest was $6,664,054 and $6,595,420 for RMK Multi-Sector High Income Fund and RMK Strategic Income Fund, respectively.
The Notes to the Financial Statements are an integral part of, and should be read in conjunction with, the Financial Statements.
75
REGIONS MORGAN KEEGAN FUNDS
FINANCIAL HIGHLIGHTS
SELECTED DATA FORA SHARE OUTSTANDING THROUGHOUTTHE PERIOD INDICATED:
| | | | | | | | | | | | | | | | | | | | | |
| | | | | | | | | | | | | | | | | | | | | |
| | | Net Asset
Value,
Beginning
of Period | | | Net
Investment
Income | | Net Realized
and Unrealized
Gains/(Losses)
on Investments | | | Total
From
Investment
Operations | | | Dividends
From Net
Investment
Income | | | Distributions
From Capital
Gains | | | Return of
Capital | |
RMK Advantage Income Fund | | | | | | | | | | | | | | | | | | | | | |
Year ended March 31, 2008 | | $ | 13.29 | | | 1.30 | | (9.73 | ) | | (8.43 | ) | | (1.31 | ) | | — | | | (0.13 | ) |
Year ended March 31, 2007 | | $ | 13.95 | | | 1.66 | | (0.56 | ) | | 1.10 | | | (1.70 | ) | | — | | | (0.06 | ) |
Year ended March 31, 2006 | | $ | 14.37 | | | 1.90 | | (0.22 | ) | | 1.68 | | | (1.86 | ) | | (0.24 | ) | | — | |
Period ended March 31, 2005 (e) | | $ | 14.33 | (b) | | 0.57 | | (0.03 | ) | | 0.54 | | | (0.48 | ) | | — | | | — | |
| | | | | | | |
RMK High Income Fund | | | | | | | | | | | | | | | | | | | | | |
Year ended March 31, 2008 | | $ | 13.18 | | | 1.25 | | (9.54 | ) | | (8.29 | ) | | (1.26 | ) | | — | | | (0.18 | ) |
Year ended March 31, 2007 | | $ | 13.85 | | | 1.76 | | (0.67 | ) | | 1.09 | | | (1.73 | ) | | — | | | (0.03 | ) |
Year ended March 31, 2006 | | $ | 15.03 | | | 1.98 | | (0.58 | ) | | 1.40 | | | (1.90 | ) | | (0.68 | ) | | — | |
Year ended March 31, 2005 | | $ | 15.32 | | | 2.15 | | 0.24 | | | 2.39 | | | (2.07 | ) | | (0.61 | ) | | — | |
Period ended March 31, 2004 (f) | | $ | 14.33 | (b) | | 1.11 | | 1.09 | | | 2.20 | | | (1.01 | ) | | (0.17 | ) | | — | |
| | | | | | | |
RMK Multi-Sector High Income Fund | | | | | | | | | | | | | | | | | | | | | |
Year ended March 31, 2008 | | $ | 14.10 | | | 1.34 | | (10.63 | ) | | (9.29 | ) | | (1.55 | ) | | (0.07 | ) | | (0.18 | ) |
Year ended March 31, 2007 | | $ | 14.54 | | | 1.81 | | (0.36 | ) | | 1.45 | | | (1.66 | ) | | (0.23 | ) | | — | |
Period ended March 31, 2006 (g) | | $ | 14.33 | (b) | | 0.21 | | 0.14 | | | 0.35 | | | (0.12 | ) | | — | | | — | |
| | | | | | | |
RMK Strategic Income Fund | | | | | | | | | | | | | | | | | | | | | |
Year ended March 31, 2008 | | $ | 12.89 | | | 1.27 | | (9.55 | ) | | (8.28 | ) | | (1.28 | ) | | — | | | (0.16 | ) |
Year ended March 31, 2007 | | $ | 13.54 | | | 1.63 | | (0.52 | ) | | 1.11 | | | (1.71 | ) | | — | | | (0.05 | ) |
Year ended March 31, 2006 | | $ | 14.23 | | | 1.78 | | (0.20 | ) | | 1.58 | | | (1.89 | ) | | (0.38 | ) | | — | |
Year ended March 31, 2005 | | $ | 14.31 | | | 1.76 | | (0.16 | ) | | 1.60 | | | (1.68 | ) | | — | | | — | |
Period ended March 31, 2004 (h) | | $ | 14.33 | (b) | | 0.02 | | (0.02 | ) | | — | | | — | | | — | | | — | |
| (a) | Total investment return is calculated assuming a purchase of a common share of stock at the opening market price of the first day and a sale at the closing market price on the last day of each period reported. Dividends and other distributions are assumed, for purposes of this calculation, to be reinvested at prices obtained under the Funds’ dividend reinvestment plans. Total investment returns do not reflect brokerage commissions. Past performance is no guarantee of future results. |
| (b) | Net of sales load of $0.675 on initial shares issued. |
| (c) | Not annualized for periods less than one year. |
| (d) | Ratio annualized for the periods less than one year. |
| (e) | From the commencement of investment operations on November 8, 2004. |
| (f) | From the commencement of investment operations on June 24, 2003. |
| (g) | From the commencement of investment operations on January 19, 2006. |
| (h) | From the commencement of investment operations on March 18, 2004. |
| (i) | This voluntary expense decrease is reflected in both the expense and net investment income ratios. |
The Notes to the Financial Statements are an integral part of, and should be read in conjunction with, the Financial Statements.
76
REGIONS MORGAN KEEGAN FUNDS
| | | | | | | | | | | | | | | | | | | | | | | | | | | | | | | |
| | | | | | | | | | | | | | | | | Ratios to Average Net Assets | | | Supplemental Data | |
Total
Distributions | | | Offering Costs
Charged
to Paid-in
Capital | | | Net Asset
Value,
End of
Period | | Total
Return,
Net Asset
Value (c) | | | Common
Share Price,
End of
Period | | Total
Return,
Market
Value (a) (c) | | | Net
Expenses (d) | | | Expense
Waiver/
Reimbur-
sement (i) | | | Net
Investment
Income (d) | | | Net Assets,
End of
Period
(000’s) | | Portfolio
Turnover
Rate | |
| | | | | | | | | | | | | | | | | | | | | | | | | | | | | | | |
| (1.44 | ) | | — | | | $ | 3.42 | | (68.89 | )% | | $ | 3.34 | | (73.61 | )% | | 3.49 | % | | (0.17 | )% | | 16.56 | % | | $ | 110,614 | | 76 | % |
| (1.76 | ) | | — | | | $ | 13.29 | | 6.21 | % | | $ | 15.30 | | 1.53 | % | | 3.23 | % | | — | | | 12.14 | % | | $ | 416,999 | | 94 | % |
| (2.10 | ) | | — | | | $ | 13.95 | | 11.05 | % | | $ | 16.80 | | 23.28 | % | | 2.62 | % | | — | | | 13.45 | % | | $ | 417,229 | | 104 | % |
| (0.48 | ) | | (0.02) | | | $ | 14.37 | | 3.53 | % | | $ | 15.59 | | 7.30 | % | | 0.94 | % | | — | | | 10.52 | % | | $ | 403,663 | | 57 | % |
| | | | | | | | | | |
| | | | | | | | | | | | | | | | | | | | | | | | | | | | | | | |
| (1.44 | ) | | — | | | $ | 3.45 | | (68.72 | )% | | $ | 3.51 | | (72.40 | )% | | 3.56 | % | | (0.17 | )% | | 15.89 | % | | $ | 82,409 | | 74 | % |
| (1.76 | ) | | — | | | $ | 13.18 | | 6.05 | % | | $ | 15.20 | | (3.26 | )% | | 3.47 | % | | — | | | 12.89 | % | | $ | 303,259 | | 100 | % |
| (2.58 | ) | | — | | | $ | 13.85 | | 7.80 | % | | $ | 17.51 | | 24.15 | % | | 2.92 | % | | — | | | 13.66 | % | | $ | 306,699 | | 97 | % |
| (2.68 | ) | | — | | | $ | 15.03 | | 15.46 | % | | $ | 16.50 | | 16.49 | % | | 2.12 | % | | — | | | 14.08 | % | | $ | 313,731 | | 73 | % |
| (1.18 | ) | | (0.03) | | | $ | 15.32 | | 15.50 | % | | $ | 16.67 | | 20.06 | % | | 1.11 | % | | — | | | 10.15 | % | | $ | 299,772 | | 76 | % |
| | | | | | | | | | |
| | | | | | | | | | | | | | | | | | | | | | | | | | | | | | | |
| (1.80 | ) | | — | | | $ | 3.01 | | (72.48 | )% | | $ | 3.33 | | (72.67 | )% | | 3.55 | % | | (0.16 | )% | | 16.03 | % | | $ | 109,633 | | 68 | % |
| (1.89 | ) | | — | | | $ | 14.10 | | 9.45 | % | | $ | 15.71 | | 10.96 | % | | 2.83 | % | | — | | | 12.46 | % | | $ | 468,879 | | 85 | % |
| (0.12 | ) | | (0.02) | | | $ | 14.54 | | 2.27 | % | | $ | 15.98 | | 7.38 | % | | 0.71 | % | | — | | | 6.72 | % | | $ | 453,523 | | 131 | % |
| | | | | | | | | | |
| | | | | | | | | | | | | | | | | | | | | | | | | | | | | | | |
| (1.44 | ) | | — | | | $ | 3.17 | | (70.24 | )% | | $ | 3.18 | | (74.01 | )% | | 3.69 | % | | (0.17 | )% | | 16.64 | % | | $ | 91,481 | | 73 | % |
| (1.76 | ) | | — | | | $ | 12.89 | | 6.18 | % | | $ | 14.81 | | (1.09 | )% | | 3.50 | % | | — | | | 12.17 | % | | $ | 359,230 | | 106 | % |
| (2.27 | ) | | — | | | $ | 13.54 | | 9.95 | % | | $ | 16.70 | | 22.60 | % | | 2.94 | % | | — | | | 12.80 | % | | $ | 362,768 | | 101 | % |
| (1.68 | ) | | — | | | $ | 14.23 | | 10.87 | % | | $ | 15.74 | | 9.68 | % | | 1.70 | % | | — | | | 12.47 | % | | $ | 359,781 | | 69 | % |
| — | | | (0.02 | ) | | $ | 14.31 | | (0.14 | )% | | $ | 16.00 | | 6.67 | % | | 0.87 | % | | — | | | 3.87 | % | | $ | 300,547 | | 0 | % |
77
REGIONS MORGAN KEEGAN FUNDS
NOTESTOTHE FINANCIAL STATEMENTS
RMK Advantage Income Fund, Inc., RMK High Income Fund, Inc., RMK Multi-Sector High Income Fund, Inc. and RMK Strategic Income Fund, Inc. (each a “Fund” and, collectively, the “Funds”) were organized as separate Maryland corporations on September 7, 2004, April 16, 2003, November 14, 2005 and January 16, 2004, respectively. Each Fund is registered under the Investment Company Act of 1940, as amended (the “1940 Act”), as a diversified, closed-end management investment company with its own investment objective.
Each Fund is authorized to issue 1,000,000,000 shares of capital stock with a par value of $0.0001 per share. The Funds’ Boards of Directors are authorized to classify and reclassify any unissued shares of capital stock from time to time by setting or changing the preferences, conversion or other rights, voting powers, restrictions, limitations as to dividends or terms and conditions of redemption of such shares by the Funds. The common shares have no preemptive, conversion, exchange or redemption rights. All common shares have equal voting, dividend, distribution and liquidation rights. The common shares, when issued, will be fully paid and non-assessable. Common stockholders are entitled to one vote per share and all voting rights for the election of directors are non-cumulative. The Funds have no present intentions of offering additional shares, except as described in the Dividend Reinvestment Plan.
Under each Fund’s organizational documents, its officers and directors are indemnified against certain liabilities arising out of the performance of their duties to the Fund. In addition, in the normal course of business, the Funds enter into contracts with their vendors and others that provide for general indemnifications. The Funds’ maximum exposure under these arrangements is unknown, since this would involve the resolution of certain claims, as well as future claims that may be made, against the Funds. Thus, an estimate of the financial impact, if any, of these arrangements cannot be made at this time.
| 2 | Significant Accounting Policies |
The following is a summary of significant accounting policies followed by the Funds in the preparation of their financial statements. These policies are in conformity with accounting principles generally accepted in the United States (“GAAP”).
Investment Valuations—Investments in securities listed or traded on a securities exchange are valued at the last quoted sale price on the exchange where the
78
REGIONS MORGAN KEEGAN FUNDS
security is primarily traded as of the close of business on the New York Stock Exchange, usually 4:00 p.m. Eastern Time, on the valuation date. Equity securities traded on the Nasdaq Stock Market are valued at the Nasdaq Official Closing Price (“NOCP”) provided by Nasdaq each business day. The NOCP is the most recently reported price as of 4:00:02 p.m. Eastern Time, unless that price is outside the range of the “inside” bid and asked price (i.e., the bid and asked prices that dealers quote to each other when trading for their own accounts); in that case, Nasdaq will adjust the price to equal the inside bid or asked price, whichever is closer. Because of delays in reporting trades, the NOCP may not be the last trade to occur before the market closes. Securities traded in the over-the-counter market and listed securities for which no sales were reported for that date are valued at the last quoted bid price.
Equity and debt securities issued in private placements are valued on the bid side by a primary market dealer. Long-term debt securities (including U.S. government securities, listed corporate bonds, other debt and asset-backed securities, and unlisted securities and private placement securities) are generally valued at the latest price furnished by an independent pricing service or primary market dealer. Short-term debt securities with remaining maturities of more than 60 days for which market quotations are readily available are valued by an independent pricing service or primary market dealer. Short-term debt securities with remaining maturities of 60 days or less are valued at cost with interest accrued or discount accreted to the date of maturity, unless such valuation, in the judgment of Morgan Asset Management, Inc. (the “Adviser”)’s Valuation Committee, does not represent market value.
Investments in open-end registered investment companies, if any, are valued at net asset value (“NAV”) as reported by those investment companies. Foreign securities denominated in foreign currencies, if any, are translated from the local currency into U.S. dollars using current exchange rates.
Investments for which market quotations are not readily available, or if available quotations are not believed to be reflective of market value, are valued at fair value as determined by the Adviser’s Valuation Committee using procedures established by and under the supervision of each Fund’s Board of Directors. The values assigned to fair valued investments are based on available information and do not necessarily represent amounts that might ultimately be realized, since such amounts depend on future developments inherent in long-term investments. Further, because of the inherent uncertainty of valuation, those estimated values may differ significantly from the values that would have been used had a ready market for the investments existed, and the differences could be material.
79
REGIONS MORGAN KEEGAN FUNDS
A Fund may use the fair value of a security to calculate its NAV when, for example, (1) a portfolio security is not traded in a public market or the principal market in which the security trades is closed, (2) trading in a portfolio security is suspended and not resumed prior to the normal market close, (3) a portfolio security is not traded in significant volume for a substantial period, or (4) the Adviser determines that the quotation or price for a portfolio security provided by a dealer or independent pricing services is inaccurate.
Among the more specific factors that are considered by the Valuation Committee in determining the fair value of a security are: (1) type of security; (2) financial statements of the issuer; (3) cost at date of purchase (generally used for initial valuation); (4) size of the Fund’s holding; (5) for restricted securities, the discount from market value of unrestricted securities of the same class at the time of purchase; (6) the existence of a shelf registration for restricted securities; (7) information as to any transactions or offers with respect to the security; (8) special reports prepared by analysts; (9) the existence of merger proposals, tender offers or similar events affecting the security; (10) the price and extent of public trading in similar securities of the issuer or comparable companies; (11) the fundamental analytical data relating to the investment; (12) the nature and duration of restrictions on disposition of the securities; and (13) evaluation of the forces which influence the market in which these securities are purchased and sold.
There can be no assurance that a Fund could purchase or sell a portfolio security at the price used to calculate the Fund’s NAV. Changes in the fair valuation of portfolio securities may be less frequent and of greater magnitude than changes in the price of portfolio securities valued at their last sale price, by an independent pricing service, or based on market quotations.
Market instability may also affect the liquidity of the Funds’ portfolios. Under such market conditions, many of the Funds’ portfolio securities may be deemed to be illiquid. “Illiquid securities” are generally those that cannot be sold or disposed of in the ordinary course of business at approximately the prices at which they are valued. This may result in illiquid securities being disposed of at a price different from the recorded value since the market price of illiquid securities generally is more volatile than that of more liquid securities. This illiquidity of portfolio securities may result in the Funds incurring greater losses on the sale of some portfolio securities than under more stable market conditions. Such losses can adversely impact the Funds’ NAVs per share.
In light of the market instability and the complexity of fair value judgments, the Funds, effective August 2007, hired an external valuation consultant to assist the Funds in determining the fair value of certain of the Funds’ portfolio securities under the Adviser’s supervision and in accordance with the Funds’ valuation procedures. Fair valuation procedures are currently being used to value a substantial portion of the assets of the Funds. The “fair value” of securities may be difficult to determine and thus judgment plays a greater role in this valuation process.
80
REGIONS MORGAN KEEGAN FUNDS
The degree of judgment involved in determining the fair value of an investment security is dependent upon the availability of quoted market prices or observable market parameters. When observable market prices and parameters do not exist, judgment is necessary to estimate fair value. The valuation process takes into consideration factors such as interest rate changes, movements in credit spreads, default rate assumptions, prepayment assumptions, type and quality of collateral, security seasoning, and market dislocation. Imprecision in estimating fair value can impact the amount of unrealized appreciation or depreciation recorded for a particular portfolio security and differences in the assumptions used could result in a different determination of fair value, and those differences could be material.
As of March 31, 2008, certain debt securities held by RMK Advantage Income Fund, Inc., RMK High Income Fund Inc., RMK Multi-Sector High Income Fund, Inc. and RMK Strategic Income Fund, Inc. were fair valued and the value of those securities represented approximately 58.7%, 51.3%, 63.3% and 60.5% of net assets, respectively. The following tables reconcile the beginning and ending balances of investments which were fair valued during the fiscal year ended March 31, 2008, including demonstrating the amounts of purchases/(sales), realized gains/(losses), changes in unrealized appreciation/(depreciation), and the effects of accretion/(amortization). Change source to/(from) fair value represents securities that were fair valued during some but not all of the period. For the period in which the securities were not fair valued, they were priced under the Funds’ pricing procedures based on market quotations.
| | | | | | | | | | | | | | | | | | | | |
| | | RMK Advantage Income Fund, Inc. | |
| | | Asset-
Backed
Securities | | | Corporate
Bonds | | | Mortgage-
Backed
Securities | | | Other
Securities | | | Total | |
Fair valued investments at value as of March 31, 2007 | | $ | 235,882,561 | | | $ | 38,898,847 | | | $ | 82,918,594 | | | $ | 14,755,487 | | | $ | 372,455,489 | |
Net purchases/(sales) at cost | | | (26,359,707 | ) | | | (25,105,825 | ) | | | (19,560,821 | ) | | | (1,508,636 | ) | | | (72,534,989 | ) |
Realized gain/(loss) | | | (50,128,767 | ) | | | (4,013,355 | ) | | | (19,273,450 | ) | | | (5,399,425 | ) | | | (78,814,997 | ) |
Change in unrealized appreciation/(depreciation) | | | (127,206,125 | ) | | | 356,692 | | | | (25,556,591 | ) | | | (4,111,409 | ) | | | (156,517,433 | ) |
Accretion/(amortization) | | | (204,146 | ) | | | 54,194 | | | | (927 | ) | | | 46,311 | | | | (104,568 | ) |
Change source to/(from) fair value | | | 7,355,606 | | | | (6,908,837 | ) | | | — | | | | — | | | | 446,769 | |
| | | | | | | | | | | | | | | | | | | | |
Fair valued Investments at value as of March 31, 2008 | | $ | 39,339,422 | | | $ | 3,281,716 | | | $ | 18,526,805 | | | $ | 3,782,328 | | | $ | 64,930,271 | |
| | | | | | | | | | | | | | | | | | | | |
81
REGIONS MORGAN KEEGAN FUNDS
| | | | | | | | | | | | | | | | | | | | |
| | | RMK High Income Fund, Inc. | |
| | | Asset-
Backed
Securities | | | Corporate
Bonds | | | Mortgage-
Backed
Securities | | | Other
Securities | | | Total | |
Fair valued investments at value as of March 31, 2007 | | $ | 160,096,952 | | | $ | 29,788,158 | | | $ | 61,600,911 | | | $ | 11,193,921 | | | $ | 262,679,942 | |
Net purchases/(sales) at cost | | | (18,370,586 | ) | | | (22,410,205 | ) | | | (14,330,048 | ) | | | (908,177 | ) | | | (56,019,016 | ) |
| | | | | |
Realized gain/(loss) | | | (35,171,801 | ) | | | (2,955,333 | ) | | | (18,638,156 | ) | | | (4,698,786 | ) | | | (61,464,076 | ) |
Change in unrealized appreciation/(depreciation) | | | (90,196,056 | ) | | | (738,177 | ) | | | (14,509,423 | ) | | | (2,847,386 | ) | | | (108,291,042 | ) |
Accretion/(amortization) | | | 734,461 | | | | 30,858 | | | | 1,765 | | | | 33,776 | | | | 800,860 | |
Change source to/(from) fair value | | | 6,770,110 | | | | (2,018,340 | ) | | | (210,058 | ) | | | — | | | | 4,541,712 | |
| | | | | | | | | | | | | | | | | | | | |
Fair valued Investments at value as of March 31, 2008 | | $ | 23,863,080 | | | $ | 1,696,961 | | | $ | 13,914,991 | | | $ | 2,773,348 | | | $ | 42,248,380 | |
| | | | | | | | | | | | | | | | | | | | |
| |
| | | RMK Multi-Sector High Income Fund, Inc. | |
| | | Asset-
Backed
Securities | | | Corporate
Bonds | | | Mortgage-
Backed
Securities | | | Other
Securities | | | Total | |
Fair valued investments at value as of March 31, 2007 | | $ | 273,102,547 | | | $ | 47,395,900 | | | $ | 104,112,194 | | | $ | 13,076,830 | | | $ | 437,687,471 | |
Net purchases/(sales) at cost | | | (33,458,650 | ) | | | (29,866,252 | ) | | | (17,963,000 | ) | | | 79,880 | | | | (81,208,022 | ) |
| | | | | |
Realized gain/(loss) | | | (63,584,138 | ) | | | (3,484,294 | ) | | | (33,153,713 | ) | | | (5,084,898 | ) | | | (105,307,043 | ) |
Change in unrealized appreciation/(depreciation) | | | (144,613,123 | ) | | | (2,903,026 | ) | | | (28,921,023 | ) | | | (3,834,648 | ) | | | (180,271,820 | ) |
Accretion/(amortization) | | | (368,895 | ) | | | 134,583 | | | | (165,969 | ) | | | — | | | | (400,281 | ) |
Change source to/(from) fair value | | | 6,405,019 | | | | (7,511,420 | ) | | | — | | | | — | | | | (1,106,401 | ) |
| | | | | | | | | | | | | | | | | | | | |
Fair valued Investments at value as of March 31, 2008 | | $ | 37,482,760 | | | $ | 3,765,491 | | | $ | 23,908,489 | | | $ | 4,237,164 | | | $ | 69,393,904 | |
| | | | | | | | | | | | | | | | | | | | |
| |
| | | RMK Strategic Income Fund, Inc. | |
| | | Asset-
Backed
Securities | | | Corporate
Bonds | | | Mortgage-
Backed
Securities | | | Other
Securities | | | Total | |
Fair valued investments at value as of March 31, 2007 | | $ | 191,523,931 | | | $ | 32,124,871 | | | $ | 80,842,600 | | | $ | 11,454,121 | | | $ | 315,945,523 | |
Net purchases/(sales) at cost | | | (22,538,469 | ) | | | (19,482,146 | ) | | | (18,322,469 | ) | | | (444,630 | ) | | | (60,787,714 | ) |
| | | | | |
Realized gain/(loss) | | | (37,323,701 | ) | | | (1,619,508 | ) | | | (26,662,097 | ) | | | (4,562,424 | ) | | | (70,167,730 | ) |
Change in unrealized appreciation/(depreciation) | | | (109,270,774 | ) | | | (2,015,109 | ) | | | (17,639,588 | ) | | | (3,246,602 | ) | | | (132,172,073 | ) |
Accretion/(amortization) | | | 539,963 | | | | 36,091 | | | | (165,377 | ) | | | 40,523 | | | | 451,200 | |
Change source to/(from) fair value | | | 8,176,377 | | | | (5,953,263 | ) | | | (179,515 | ) | | | — | | | | 2,043,599 | |
| | | | | | | | | | | | | | | | | | | | |
Fair valued Investments at value as of March 31, 2008 | | $ | 31,107,327 | | | $ | 3,090,936 | | | $ | 17,873,554 | | | $ | 3,240,988 | | | $ | 55,312,805 | |
| | | | | | | | | | | | | | | | | | | | |
82
REGIONS MORGAN KEEGAN FUNDS
In September 2006, the Financial Accounting Standards Board (“FASB”) issued its new Standard No. 157, Fair Value Measurements (“FAS 157”). FAS 157 is designed to unify guidance for the measurement of fair value of all types of assets, including financial instruments and certain liabilities, throughout a number of accounting standards. FAS 157 also establishes a hierarchy for measuring fair value in GAAP and expands financial statement disclosures about fair value measurements that are relevant to mutual funds. FAS 157 is effective for financial statements issued for fiscal years beginning after November 15, 2007, and earlier application is permitted. The Adviser is evaluating the application of FAS 157 to each Fund, and is not in a position at this time to estimate the significance of its impact on each Funds’ financial statements. The Funds have chosen not to early adopt this standard.
Investment Transactions and Investment Income—Securities transactions are recorded on the trade date for financial reporting purposes. Realized gains and losses from securities transactions are recorded using the identified cost basis. Dividend income is recorded on the ex-dividend date. Interest income, including amortization of premiums and accretion of discounts, is accrued on a daily basis, adjusted based on management’s assessment of the collectability of such interest. At March 31, 2008, there is no income being accrued related to $11,498,462, $9,069,662, $16,880,794 and $9,484,568 of the value of securities owned by RMK Advantage Income Fund, Inc., RMK High Income Fund, Inc., RMK Multi-Sector High Income Fund, Inc. and RMK Strategic Income Fund, Inc.
Federal Income Taxes—Each Fund is treated as a separate corporation for federal tax purposes. No provision for federal income or excise taxes is required because each Fund intends to continue to qualify each year as a regulated investment company under Subchapter M of Chapter 1 of the Internal Revenue Code of 1986, as amended (the “Code”), and to distribute substantially all its net investment income and net realized capital gains to its stockholders.
Expenses—Expenses directly attributable to a Fund are charged directly to that Fund, while expenses which are attributable to more than one Fund are allocated among the respective Funds based upon relative net assets.
Dividends and Other Distributions to Stockholders—Each Fund declares quarterly and pays monthly dividends to its stockholders from its net investment income and declares and pays distributions from other sources from time to time. Each Fund also pays distributions at least annually from its net realized capital gains, if any. All common shares have equal dividend and other distribution rights. Dividends and other distributions to stockholders are recorded on the ex-distribution date. A notice disclosing the source(s) of a distribution will be provided if payment is made from any source other than net investment income. Any such notice would be provided only for informational purposes in order to comply with the requirements
83
REGIONS MORGAN KEEGAN FUNDS
of Section 19(a) of the 1940 Act and not for tax reporting purposes. The tax composition of each Fund’s distributions for each calendar year is reported on IRS Form 1099-DIV.
The amounts of dividends from net investment income and distributions from net realized capital gains are determined in accordance with federal income tax regulations, which may differ from GAAP. These “book/tax” differences are either considered temporary or permanent in nature. To the extent these differences are permanent in nature (e.g., reclassification of market discounts, net operating losses, paydowns and distributions), they are reclassified within the composition of net assets based on their federal tax treatment; temporary differences do not require reclassification. To the extent distributions from net investment income and net realized capital gains exceed such income and capital gains for tax purposes, they are reported as return of capital.
Restricted Securities—The Funds own investment securities which are unregistered and thus restricted as to resale. These securities are valued by the Funds after giving due consideration to pertinent factors including recent private sales, market conditions and the issuer’s financial performance. Where future disposition of these securities requires registration under the Securities Act of 1933, the Funds have the right to include these securities in such registration, generally without cost to the Funds. The Funds have no right to require registration of unregistered securities. At March 31, 2008, RMK Advantage Income Fund, Inc., RMK High Income Fund, Inc., RMK Multi-Sector High Income Fund, Inc. and RMK Strategic Income Fund, Inc. had restricted securities with an aggregate value of $70,072,344, $45,487,506, $77,529,180 and $59,311,107, respectively, representing 63.3%, 55.2%, 70.7% and 64.8% of the net assets of RMK Advantage Income Fund, Inc., RMK High Income Fund, Inc., RMK Multi-Sector High Income Fund, Inc. and RMK Strategic Income Fund, Inc., respectively.
Repurchase Agreements—The Funds may purchase instruments from financial institutions, such as banks and broker-dealers, subject to the seller’s agreement to repurchase them at an agreed-upon time and price (“repurchase agreement”). The Funds may invest in repurchase agreements with institutions that are deemed by the Adviser to be of good standing and creditworthy. A third party custodian bank takes possession of the underlying securities (“collateral”) of a repurchase agreement, the value of which is required at all times to at least equal the principal amount of the repurchase transaction and accrued interest. In the event of counterparty default on the obligation to repurchase, each Fund has the right to liquidate the collateral and apply the proceeds in satisfaction of the obligation. However, there could be potential losses to the Funds in the event of default or bankruptcy by the counterparty to the agreement if the Funds are delayed or prevented from exercising their rights to dispose of the collateral, including the risk
84
REGIONS MORGAN KEEGAN FUNDS
of possible decline in the value of the collateral during the period while the Funds seek to assert their rights.
Options Writing—When a Fund writes an option, an amount equal to the premium received by the Fund is included in the Statement of Assets and Liabilities as a liability. The amount of the liability is subsequently marked to market to reflect the current value of the option written in accordance with the Fund’s policies on investment valuations discussed above. Premiums received from writing options which expire are treated as realized gains. Premiums received from writing options which are exercised or are closed are added to or offset against the proceeds or amount paid on the transaction to determine the realized gain or loss. If a put option is exercised, the premium reduces the cost basis of the securities purchased by the Fund. The Fund, as writer of an option, may have no control over whether the underlying securities may be sold (call) or purchased (put) and, as a result, bears the market risk of an unfavorable change in the price of the securities underlying the written option in excess of the amounts recorded in the Statements of Assets and Liabilities.
When-Issued and Delayed Delivery Transactions—The Funds may engage in when-issued or delayed delivery transactions. The Funds record when-issued securities on the trade date and maintain security positions such that sufficient liquid assets will be available to make payment for the securities purchased. Securities purchased on a when-issued or delayed delivery basis are marked to market daily and begin earning interest on the settlement date. Losses may occur on these transactions due to changes in market conditions or the failure of counterparties to perform under the contract.
Use of Estimates—The preparation of financial statements in conformity with GAAP requires management to make estimates and assumptions that affect the reported amount of assets and liabilities and disclosure of contingent assets and liabilities as of the date of the financial statements and the reported amounts of revenues and expenses during the reporting period. Actual results could differ from these estimates.
Cash—Cash represents deposits in bank accounts.
Accounting Pronouncements—Effective September 28, 2007, the Funds became subject to FASB Interpretation No. 48, “Accounting for Uncertainty in Income Taxes” (“FIN 48”). FIN 48 requires the evaluation, recognition, measurement, and disclosure in financial statements of tax positions taken on previously filed tax returns or expected to be taken on future returns. Each tax position must meet a recognition threshold that it is “more-likely-than-not” (i.e., has a likelihood of more than 50%), based on the technical merits, that the position will be sustained upon examination by the applicable taxing authority. In evaluating whether a tax position
85
REGIONS MORGAN KEEGAN FUNDS
has met the threshold, a Fund must presume that the position will be examined by the appropriate taxing authority that has full knowledge of all relevant information. A tax position not deemed to meet the “more-likely-than-not” threshold is recorded as a tax expense in the current year.
The Funds have reviewed all taxable years that are open for examination (i.e., not barred by the applicable statute of limitations) by taxing authorities of all major taxing jurisdictions, including the Internal Revenue Service. As of March 31, 2008, open taxable years consisted of the taxable years ended March 31, 2005, through 2008. No examination of any Fund is currently in progress.
Each Fund has reviewed all its open taxable years for all major taxing jurisdictions and concluded that application of FIN 48 resulted in no effect to the Fund’s financial position or results of operations. There is no tax liability resulting from unrecognized tax benefits relating to uncertain income tax positions taken or expected to be taken on any Fund’s tax return for the taxable year ended March 31, 2008. The Funds are also not aware of any tax positions for which it is reasonably possible that the total amounts of unrecognized tax benefits will significantly change in the next twelve months.
| 3 | Below Investment Grade Debt Securities Risk |
The Funds have significant investments in below investment grade debt securities, including mortgage-backed and asset-backed securities. Below investment grade debt securities, commonly known as “junk bonds,” involve a higher degree of credit risk than investment grade debt securities. In the event of an unanticipated default, a Fund would experience a reduction in its income, a decline in the market value of the securities so affected and a decline in the NAV of its shares. During an economic downturn or period of rising interest rates, highly leveraged and other below investment grade issuers have experienced financial stress that could adversely affect their ability to service principal and interest payment obligations, to meet projected business goals and to obtain additional financing. The market prices of below investment grade debt securities are generally less sensitive to interest rate changes than higher-rated investments but are more sensitive to adverse economic or political changes or individual developments specific to the issuer than higher-rated investments. Periods of economic or political uncertainty and change can be expected to result in significant volatility of prices for these securities. Rating services consider these securities to be speculative in nature.
Below investment grade securities may be subject to market conditions, events of default or other circumstances which cause them to be considered “distressed securities.” Distressed securities frequently do not produce income while they are outstanding. The Funds may be required to bear certain extraordinary expenses in
86
REGIONS MORGAN KEEGAN FUNDS
order to protect and recover its investment in certain distressed securities. Therefore, to the extent the Funds seek capital growth through investment in such securities, a Fund’s ability to achieve current income for its stockholders may be diminished. The Funds also are subject to significant uncertainty as to when and in what manner and for what value the obligations evidenced by distressed securities will eventually be satisfied (e.g., through a liquidation of the obligor’s assets, an exchange offer or plan of reorganization involving the securities or a payment of some amount in satisfaction of the obligation). In addition, even if an exchange offer is made or a plan of reorganization is adopted with respect to distressed securities held by the Funds, there can be no assurance that the securities or other assets received by the Funds in connection with such exchange offer or plan of reorganization will not have a lower value or income potential than may have been anticipated when the investment was made. Moreover, any securities received by the Funds upon completion of an exchange offer or plan of reorganization may be restricted as to resale. As a result of the Funds’ participation in negotiations with respect to any exchange offer or plan of reorganization with respect to an issuer of such securities, the Funds may be restricted from disposing of distressed securities.
Mortgage-backed and asset-backed securities are subject to the credit risk associated with the performance of the underlying mortgage properties or other assets. In certain instances, third-party guarantees or other forms of credit support can reduce the credit risk.
| 4 | Agreements and Other Transactions with Affiliates |
Investment Adviser—The Funds have entered into Investment Advisory Agreements with the Adviser, a wholly owned subsidiary of MK Holding, Inc., which is a wholly owned subsidiary of Regions Financial Corporation (“Regions”). Under the terms of the agreements, the Funds are charged an annual advisory fee of 0.65% based on a percentage of each Fund’s average daily total assets minus the sum of accrued liabilities other than debt entered into for purposes of leverage.
The Adviser contractually agreed to waive its fee and, if necessary, reimburse each Fund through October 31, 2008 to the extent each Fund’s annual operating expenses (excluding brokerage, interest expense and taxes) exceed 1.30% of net assets of each Fund. In addition, the Adviser has voluntarily agreed to pay certain extraordinary expenses of the Funds, including legal expenses of pending litigation and the external valuation consultant fees.
Accounting and Administrative Services—The Funds have entered into Accounting and Administrative Services Agreements with Morgan Keegan & Company, Inc. (“Morgan Keegan”), a wholly owned subsidiary of Regions. Under the terms of the agreements, Morgan Keegan provides portfolio accounting services and certain
87
REGIONS MORGAN KEEGAN FUNDS
administrative personnel and services to the Funds for an annual fee of 0.15% based on a percentage of each Fund’s average daily total assets minus the sum of accrued liabilities other than debt entered into for purposes of leverage. Morgan Keegan also provides an employee to serve as the Funds’ Chief Compliance Officer for which Morgan Keegan receives no additional compensation from the Funds.
Directors and Officers—Certain of the officers and directors of the Funds are also officers or directors of the Adviser, Morgan Keegan or Regions. Such officers and directors of the Funds who are “interested persons” as defined in the 1940 Act receive no salary or fees from the Funds.
Each director who is not an interested person as described above (an “Independent Director”) receives from each Fund an annual retainer of $4,000 and a fee of $1,000 per quarterly meeting with reimbursement for related expenses for each meeting of the Board attended. Each chairperson of the Independent Directors Committee and Audit Committee receives from each Fund annual compensation of $500. An additional $1,500 is paid to the Independent Directors for attending special Board meetings in person, and an additional $500 is paid for attending special Board meetings by telephone. For committee meetings that are not held in conjunction with a full Board meeting, an additional $1,000 is paid to the Independent Directors for attending in-person committee meetings, and $500 is paid for attending telephonic committee meetings. No officer or director is entitled to receive pension or retirement benefits from the Funds.
Transactions in options written during the fiscal year ended March 31, 2008 were as follows:
| | | | | | | | | | | | | | | | | | | | | | | | | | | | |
| | | RMK Advantage
Income
Fund | | | RMK High
Income
Fund | | | RMK
Multi-Sector
High Income Fund | | | RMK
Strategic
Income Fund | |
| | | Number of
Contracts | | | Premiums
Received | | | Number of
Contracts | | | Premiums
Received | | | Number of
Contracts | | | Premiums
Received | | | Number of
Contracts | | | Premiums
Received | |
Options outstanding at March 31, 2007 | | 64 | | | $ | 13,753 | | | 52 | | | $ | 11,165 | | | 107 | | | $ | 22,662 | | | 85 | | | $ | 18,324 | |
Options written | | 418 | | | | 58,345 | | | 309 | | | | 40,229 | | | 442 | | | | 57,631 | | | 346 | | | | 44,344 | |
Options terminated in closing purchase transactions | | — | | | | — | | | — | | | | — | | | — | | | | — | | | — | | | | — | |
Options expired | | (160 | ) | | | (19,066 | ) | | (110 | ) | | | (11,038 | ) | | (198 | ) | | | (19,972 | ) | | (137 | ) | | | (15,327 | ) |
Options exercised | | (322 | ) | | | (53,032 | ) | | (251 | ) | | | (40,356 | ) | | (351 | ) | | | (60,321 | ) | | (294 | ) | | | (47,341 | ) |
| | | | | | | | | | | | | | | | | | | | | | | | | | | | |
Options outstanding at March 31, 2008 | | — | | | $ | — | | | — | | | $ | — | | | — | | | $ | — | | | — | | | $ | — | |
| | | | | | | | | | | | | | | | | | | | | | | | | | | | |
88
REGIONS MORGAN KEEGAN FUNDS
During the fiscal year ended March 31, 2008, cost of purchases and proceeds from sales of investment securities (excluding short-term securities and U.S. government obligations) for each Fund were as follows:
| | | | | | | | | | | | |
| | | RMK
Advantage
Income Fund | | RMK
High Income
Fund | | RMK
Multi–Sector
High Income Fund | | RMK
Strategic
Income Fund |
Cost of investments | | $ | 263,426,467 | | $ | 184,205,412 | | $ | 257,917,295 | | $ | 220,026,366 |
Proceeds from sales | | | 374,950,005 | | | 271,166,306 | | | 397,468,850 | | | 306,222,409 |
The Funds are permitted to borrow up to one-third of the value of their total assets, including such borrowings, for investment purposes. Such borrowing is referred to as leveraging and the Funds utilize collateralized bank lines of credit for this purpose. As of March 31, 2008, the Funds’ borrowing arrangements were as follows:
| n | | RMK Advantage Income Fund has a collateralized $30,000,000 bank line of credit, which matures in May 2008. During the year, the terms of the line of credit were amended to reduce the total amount of the line of credit from $160,000,000 and to extend the maturity date from March 2008. The Fund maintains a separate collateral account for assets it pledges as collateral under the line of credit. Generally, the Fund holds all of its investment securities, other than equity securities, in that account and therefore pledges those securities as collateral under the borrowing arrangement; the collateral may be sold. As of March 31, 2008, the outstanding balance on the line of credit was $15,000,000. Borrowings under this agreement bear interest at a variable rate determined by the bank’s conduit program, which has historically been slightly below LIBOR. Fees of 1.00% per annum are paid on the outstanding amount of borrowings. The average balance during the fiscal year ended March 31, 2008 was $99,806,011 or $3.12 per share, based on average shares outstanding of 31,990,420. The average interest rate during the fiscal year ended March 31, 2008 was 5.115%. The maximum amount of borrowings outstanding at any month-end during the period was $150,000,000. |
| n | | RMK High Income Fund has a collateralized $12,000,000 bank line of credit, which matures in May 2008. During the year, the terms of the line of credit were amended to reduce the total amount of the line of credit from $125,000,000 and to extend the maturity date from December 2007. All of |
89
REGIONS MORGAN KEEGAN FUNDS
| | the Fund’s investment securities are pledged as collateral under the borrowing arrangement and the collateral may be sold. As of March 31, 2008, the outstanding balance on the line of credit was $12,000,000. Borrowings under this agreement bear interest at a fixed rate on the date of borrowing at LIBOR plus 0.650% per annum. Fees of 0.075% per annum are paid on the total line of credit, regardless of usage. The average balance during the fiscal year ended March 31, 2008 was $70,605,191 or $3.01 per share, based on average shares outstanding of 23,444,823. The average interest rate during the fiscal year ended March 31, 2008 was 5.485%. The maximum amount of borrowings outstanding at any month-end during the period was $115,000,000. |
| n | | RMK Multi-Sector High Income Fund has a collateralized $30,000,000 bank line of credit, which matures in May 2008. During the year, the terms of the line of credit were amended to reduce the total amount of the line of credit from $180,000,000 and to extend the maturity date from March 2008. The Fund maintains a separate collateral account for assets it pledges as collateral under the line of credit. Generally, the Fund holds all of its investment securities, other than equity securities, in that account and therefore pledges those securities as collateral under the borrowing arrangement; the collateral may be sold. As of March 31, 2008, the outstanding balance on the line of credit was $17,000,000. Borrowings under this agreement bear interest at a variable rate determined by the bank’s conduit program, which has historically been slightly below LIBOR. Fees of 1.00% per annum are paid on the outstanding amount of borrowings. The average balance during the fiscal year ended March 31, 2008 was $111,684,426 or $3.25 per share, based on average shares outstanding of 34,382,045. The average interest rate during the fiscal year ended March 31, 2008 was 5.114%. The maximum amount of borrowings outstanding at any month-end during the period was $170,000,000. |
| n | | RMK Strategic Income Fund has a collateralized $150,000,000 bank line of credit, which matures in July 2008. All of the Fund’s investment securities, other than equity securities, are pledged as collateral under the borrowing arrangement and the collateral may be sold. As of March 31, 2008, the outstanding balance on the line of credit was $35,000,000. Borrowings under this agreement bear interest at a fixed rate on the date of borrowing at LIBOR plus 0.375% per annum. Fees of 0.075% per annum are paid on the total line of credit, regardless of usage. The average balance during the fiscal year ended March 31, 2008 was $91,487,705 or $3.23 per share, based on average shares outstanding of 28,361,712. The average interest rate during the fiscal |
90
REGIONS MORGAN KEEGAN FUNDS
| | year ended March 31, 2008 was 5.372%. The maximum amount of borrowings outstanding at any month-end during the period was $140,000,000. |
Because federal income tax regulations differ in certain respects from GAAP, income and capital gain distributions determined in accordance with tax regulations may differ from net investment income and realized gains recognized for financial reporting purposes. These differences are primarily due to differing treatments for gains/losses on principal payments of mortgage-backed and asset-backed securities, distribution reclassification, return of capital and real estate investment trust adjustments.
Permanent book and tax differences, if any, relating to stockholder distributions will result in reclassifications to paid-in capital or to undistributed capital gains. These reclassifications have no effect on net assets or NAVs per share. Any undistributed net income and realized gain remaining at fiscal year-end is distributed in the following year.
For the year ended March 31, 2008, permanent differences identified and reclassified among the components of net assets were as follows:
| | | | | | | | | | | | | | | | |
| | | RMK Advantage
Income Fund | | | RMK High
Income Fund | | | RMK Multi-Sector
High Income Fund | | | RMK Strategic
Income Fund | |
Undistributed net investment income | | $ | 1,953,308 | | | $ | 2,987,944 | | | $ | 6,563,774 | | | $ | 3,186,636 | |
Accumulated net realized gain/(loss) on investments | | | (692,342 | ) | | | (860,644 | ) | | | (6,563,774 | ) | | | 743,084 | |
Paid in capital | | | (1,260,966 | ) | | | (2,127,300 | ) | | | — | | | | (3,929,720 | ) |
The tax character of distributions as reported on the Statements of Changes in Net Assets for the year ended March 31, 2008 was as follows:
| | | | | | | | | | | | |
| | | RMK Advantage
Income Fund | | RMK High
Income Fund | | RMK Multi-Sector
High Income Fund | | RMK Strategic
Income Fund |
Ordinary Income(1) | | $ | 44,688,670 | | $ | 31,537,838 | | $ | 59,396,292 | | $ | 36,808,696 |
Long-term Capital Gains | | | — | | | — | | | 2,344,774 | | | — |
Return of Capital | | | 1,260,966 | | | 2,127,300 | | | — | | | 3,929,720 |
| | | | | | | | | | | | |
Total Distributions | | $ | 45,949,636 | | $ | 33,665,138 | | $ | 61,741,066 | | $ | 40,738,416 |
| | | | | | | | | | | | |
(1) | | For tax purposes, short-term capital gain distributions are considered ordinary income distributions. |
91
REGIONS MORGAN KEEGAN FUNDS
The tax character of distributions as reported on the Statements of Changes in Net Assets for the year ended March 31, 2007 was as follows:
| | | | | | | | | | | | |
| | | RMK Advantage
Income Fund | | RMK High
Income Fund | | RMK Multi-Sector
High Income Fund | | RMK Strategic
Income Fund |
Ordinary Income(1) | | $ | 53,824,303 | | $ | 39,669,226 | | $ | 60,693,132 | | $ | 46,455,071 |
Long-term Capital Gains | | | — | | | — | | | 68 | | | — |
Return of Capital | | | — | | | — | | | — | | | 1,565,360 |
Total Distributions | | $ | 53,824,303 | | $ | 39,669,226 | | $ | 60,693,200 | | $ | 48,020,431 |
| | | | | | | | | | | | |
(1) | | For tax purposes, short-term capital gain distributions are considered ordinary income distributions. |
For the year ended March 31, 2008, the tax basis components of net assets were as follows:
| | | | | | | | | | | | | | | | |
| | | RMK
Advantage
Income Fund | | | RMK
High
Income Fund | | | RMK
Multi-Sector
High
Income Fund | | | RMK
Strategic
Income Fund | |
Gross Unrealized Appreciation | | $ | 314,997 | | | $ | 351,684 | | | $ | 296,668 | | | $ | 648,245 | |
Gross Unrealized (Depreciation) | | | (226,845,948 | ) | | | (169,763,959 | ) | | | (245,410,014 | ) | | | (197,430,784 | ) |
| | | | | | | | | | | | | | | | |
Net Unrealized Appreciation/(Depreciation) | | | (226,530,951 | ) | | | (169,412,275 | ) | | | (245,113,346 | ) | | | (196,782,539 | ) |
| | | | | | | | | | | | | | | | |
Undistributed Ordinary Income | | | — | | | | — | | | | 1,360,024 | | | | — | |
Capital Loss Carryforwards and Post October Losses | | | (124,388,320 | ) | | | (89,325,423 | ) | | | (145,436,166 | ) | | | (116,969,070 | ) |
Other | | | — | | | | (4,703 | ) | | | — | | | | — | |
| | | | | | | | | | | | | | | | |
Distributable Earnings | | | (350,919,271 | ) | | | (258,742,401 | ) | | | (389,189,488 | ) | | | (313,751,609 | ) |
Paid-in Capital | | | 461,533,141 | | | | 341,151,445 | | | | 498,822,003 | | | | 405,232,385 | |
| | | | | | | | | | | | | | | | |
Net Assets | | $ | 110,613,870 | | | $ | 82,409,044 | | | $ | 109,632,515 | | | $ | 91,480,776 | |
| | | | | | | | | | | | | | | | |
92
REGIONS MORGAN KEEGAN FUNDS
At March 31, 2008, the Funds’ cost of investments for federal tax purposes was as follows:
| | | | | | | | | | | | |
| | | RMK Advantage
Income Fund | | RMK High
Income Fund | | RMK Multi-
Sector High
Income Fund | | RMK Strategic
Income Fund |
Cost of Investments | | $ | 344,936,187 | | $ | 258,088,935 | | $ | 362,202,250 | | $ | 316,273,967 |
Capital Loss Carryforwards—As of March 31, 2008, the following Funds had capital loss carryforwards, which will reduce the Funds’ taxable income arising from future net realized gains on investments, if any, to the extent permitted by the Code, and thus will reduce the amount of the distributions to shareholders which would otherwise be necessary to relieve the Funds of any liability for federal tax. Pursuant to the Code, such capital loss carryforwards will expire as follows:
| | | | | | | | | |
| Fund | | Expiring in
2014 | | Expiring
in 2015 | | Expiring in
2016 |
RMK Advantage Income Fund | | $ | — | | $ | — | | $ | 63,416,568 |
RMK High Income Fund | | | — | | | — | | | 47,702,452 |
RMK Multi-Sector High Income Fund | | | — | | | — | | | 67,821,037 |
RMK Strategic Income Fund | | | 5,339,876 | | | 193,592 | | | 59,889,208 |
Post-October Losses Deferred—Pursuant to federal income tax regulations applicable to investment companies, the Funds have elected to treat net capital losses realized between November 1 and March 31 of each year as occurring on the first day of the following tax year. At March 31, 2008, RMK Advantage Income Fund, Inc., RMK High Income Fund, Inc., RMK Multi-Sector High Income Fund, Inc. and RMK Strategic Income Fund, Inc. had post-October losses of $60,971,752, $41,622,971, $77,615,129 and $51,546,394, respectively.
Beginning in late 2007, lawsuits were filed in the United States District Court for the Western District of Tennessee relating to certain fixed income funds managed by the Adviser, including the Funds. The complaints were filed as putative class actions on behalf of investors who purchased shares of the Funds from December 2004 through February 2008. The complaints name various entities and individuals as defendants including, among others, the Funds, the Adviser, Morgan Keegan, Regions, current directors, certain former directors, certain officers of the Funds and the Funds’ portfolio managers. The complaints allege that the defendants misrepresented or failed to disclose material facts relating to portfolio composition, fair valuation, liquidity and risk in Fund registration statements and other documents. The plaintiffs seek unspecified damages, in some cases damages and reasonable costs and attorneys’ fees. No class has been certified and each of the
93
REGIONS MORGAN KEEGAN FUNDS
cases is at a preliminary stage. One lawsuit was dismissed voluntarily by the plaintiff on April 30, 2008. No estimate of the effect, if any, of these lawsuits on the Funds can be made at this time.
In addition, on March 12, 2008, a derivative action was filed in the United States District Court for the Western District of Tennessee seeking damages on behalf of RMK Multi-Sector High Income Fund, Inc. The complaint in this action alleges that defendants breached duties of care and mismanaged the Fund, among other things. The complaint seeks unspecified damages and reasonable costs and attorneys’ fees. The proceeding is at a preliminary stage.
Similar claims have been made in lawsuits concerning certain open-end funds also managed by the Adviser filed in the United States District Court for the Western District of Tennessee. Defendants are seeking to have the cases involving the Funds and the open-end funds consolidated in a single proceeding.
The Adviser and Morgan Keegan are named as defendants in one or more actions filed in the United States District Courts for the Western District of Tennessee and the Northern District of Alabama under the Employee Retirement Income Security Act of 1974 (“ERISA”). Plaintiffs in the ERISA cases seek to represent classes of participants and beneficiaries of savings and retirement plans (“Plans”) sponsored by Regions. The complaints in these actions allege that the defendants breached fiduciary duties owed to class members and seek recovery of losses incurred by the Plans by reason of the alleged breaches of duty, restitution and other equitable relief, as well as costs and attorneys’ fees. No class has been certified and these proceedings are at a preliminary stage.
Credit Facilities—RMK High Income Fund, Inc., RMK Advantage Income Fund, Inc. and RMK Multi-Sector High Income Fund, Inc. repaid the outstanding balance of each Fund’s bank line of credit on April 22, 2008, May 1, 2008 and May 5, 2008, respectively, and each Fund irrevocably terminated its credit facility. As of May 28, 2008, RMK Strategic Income Fund, Inc.’s outstanding balance on its line of credit was $1,500,000. This credit facility is expected to be repaid in full and the line of credit will be irrevocably terminated by June 30, 2008.
Change of Investment Adviser—The Adviser has entered into an adoption agreement with Hyperion Brookfield Asset Management, Inc. (“HBAM”) under which HBAM, an investment adviser that is registered with the Securities and Exchange Commission, is being proposed by the Adviser to become the new investment adviser of the Funds and of Regions Morgan Keegan Select Short Term Bond Fund, Regions Morgan Keegan Select Intermediate Bond Fund and Regions
94
REGIONS MORGAN KEEGAN FUNDS
Morgan Keegan Select High Income Fund, three open-end funds also managed by the Adviser (the “Transaction”). HBAM has been serving as a valuation consultant to the Funds since August 2007.
The adoption agreement contemplates that, following the approval of new investment advisory agreements by shareholders of the Funds and the election of new boards of directors of the Funds (the “New Boards”), HBAM would become the investment adviser for the Funds, and that the Adviser would no longer serve as the Funds’ investment adviser after the Transaction. The adoption agreement also contemplates the Adviser would support the election of the New Boards, which would consist of individuals proposed by HBAM. The current members of the Funds’ Boards of Directors would no longer serve as directors following the consummation of the Transaction. The adoption agreement contemplates that HBAM also would become the new investment adviser to the open-end funds and that the same slate of nominees would be elected and qualified to serve as a new board of directors of the open-end funds.
On April 21, 2008, the current Boards of Directors of the Funds unanimously approved new investment advisory agreements with HBAM and the nomination of five new directors of the Funds. The appointment of HBAM as investment adviser of any of the Funds and the election of that Fund’s new board of directors must be approved by the shareholders of that Fund. If the new investment advisory agreements are approved and the Transaction is consummated, the existing investment advisory agreements between the Funds and the Adviser will be terminated.
Joint Special and Annual Shareholder Meetings of the Funds are scheduled for July 11, 2008, to vote on the proposed new investment advisory agreements and the election of directors, respectively. Although there is no assurance that the Transaction will be completed, it is anticipated that, subject to shareholder approval of the proposed new investment advisory agreements, the election of the New Boards, and the completion of certain other terms and conditions, the Transaction will close on or about July 14, 2008.
Additional information about the proposed new investment advisory agreements and nominees is being sent to shareholders of the Funds as part of proxy solicitation materials.
95
REPORTOF INDEPENDENT REGISTERED
PUBLIC ACCOUNTING FIRM
To the Board of Directors and Stockholders of RMK Advantage Income Fund, Inc., RMK High Income Fund, Inc., RMK Multi-Sector High Income Fund, Inc. and RMK Strategic Income Fund, Inc.:
In our opinion, the accompanying statements of assets and liabilities, including the portfolios of investments, and the related statements of operations, of changes in net assets, of cash flows and the financial highlights present fairly, in all material respects, the financial position of RMK Advantage Income Fund, Inc., RMK High Income Fund, Inc., RMK Multi-Sector High Income Fund, Inc. and RMK Strategic Income Fund, Inc. (the “Funds”) at March 31, 2008, the results of each of their operations and cash flows for the year then ended, the changes in each of their net assets for each of the two years in the period then ended, and the financial highlights for each of the periods indicated, in conformity with accounting principles generally accepted in the United States of America. These financial statements and financial highlights (hereafter referred to as “financial statements”) are the responsibility of the Funds’ management; our responsibility is to express an opinion on these financial statements based on our audits. We conducted our audits of these financial statements in accordance with the standards of the Public Company Accounting Oversight Board (United States). Those standards require that we plan and perform the audit to obtain reasonable assurance about whether the financial statements are free of material misstatement. An audit includes examining, on a test basis, evidence supporting the amounts and disclosures in the financial statements, assessing the accounting principles used and significant estimates made by management, and evaluating the overall financial statement presentation. We believe that our audits, which included confirmation of securities at March 31, 2008 by correspondence with the custodian and brokers, provide a reasonable basis for our opinion.
As explained in Note 2, the financial statements include securities valued at $64,930,271 (58.7 percent of net assets), $42,248,380 (51.3 percent of net assets), $69,393,904 (63.3 percent of net assets) and $55,312,805 (60.5 percent of net assets) of RMK Advantage Income Fund, Inc., RMK High Income Fund, Inc., RMK Multi-Sector High Income Fund, Inc., and RMK Strategic Income Fund, Inc., respectively, whose fair values have been estimated under procedures established by the Funds’ Board of Directors, in the absence of readily ascertainable market values. These estimated values may differ significantly from the values that would have been used had a ready market for the securities existed, and the differences could be material.

Chicago, Illinois
May 29, 2008
96
BOARDOF DIRECTORSAND OFFICERS
The following tables set forth information concerning the directors and officers of the Funds. All persons named as directors and officers also serve in similar capacities for the other registered investment companies in the Regions Morgan Keegan fund complex overseeing a total of eighteen portfolios. The Regions Morgan Keegan fund complex includes Morgan Keegan Select Fund, Inc., Regions Morgan Keegan Select Funds, RMK Advantage Income Fund, Inc., RMK High Income Fund, Inc., RMK Multi-Sector High Income Fund, Inc. and RMK Strategic Income Fund, Inc.
An asterisk (*) indicates the directors who are “interested persons” of the Funds as defined by the 1940 Act by virtue of their positions with the Adviser, Morgan Keegan and/or Regions, the publicly held parent of the Adviser, or its other subsidiaries.
DIRECTORS
| | |
Name, Address(1), Age,
Position(s) Held with Funds,
Term of Office(2),
Length of Service | | Principal Occupation(s) During Past Five
Years and Other Directorships
Held by Director |
| |
J. Kenneth Alderman* DOB 7/10/1952, Director, Since 2003/2004/2005(3) Chairman, Since 2008 | | Mr. Alderman has been President of Regions Morgan Keegan Trust and Vice-Chairman and Chief Executive Officer of Morgan Asset Management, Inc. since 2002. He has been Executive Vice President of Regions Financial Corporation since 2000. He is a Certified Public Accountant and he holds the Chartered Financial Analyst designation. |
| |
Albert C. Johnson DOB 10/24/1944, Director, Since 2005 | | Mr. Johnson has been an independent financial consultant since 1998. He also has served as a Director of Hibbett Sports, Inc. since 2008 and Books-A-Million, Inc. since 2005. He was Senior Vice President and Chief Financial Officer of Dunn Investment Company (construction) from 1994 to 1998. He also was with Arthur Andersen LLP from 1965 to 1994, retiring as the Managing Partner of the firm’s Birmingham Office. |
97
BOARDOF DIRECTORSAND OFFICERS
| | |
Name, Address(1), Age,
Position(s) Held with Funds,
Term of Office(2),
Length of Service | | Principal Occupation(s) During Past Five
Years and Other Directorships
Held by Director |
| |
James Stillman R. McFadden DOB 9/26/1957, Director, Since 2003/2004/2005(3) | | Mr. McFadden has been Chief Manager of McFadden Communications, LLC (commercial printing) since 2002. He also has served as a director for several private companies since 1997. |
| |
W. Randall Pittman DOB 11/11/1953, Director, Since 2003/2004/2005(3) | | Mr. Pittman has been Vice President of Samford University since 2008. From 2002 to 2008, he was Chief Financial Officer of Emageon Inc. (healthcare information systems). From 1999 to 2002, he was Chief Financial Officer of BioCryst Pharmaceuticals, Inc. (biotechnology). From 1998 to 1999, he was Chief Financial Officer of ScandiPharm, Inc. (pharmaceuticals). From 1995 to 1998, he served as Senior Vice President – Finance of CaremarkRx (pharmacy benefit management). From 1983 to 1995, he held various positions with AmSouth Bancorporation (bank holding company), including Executive Vice President and Controller. |
| |
Mary S. Stone DOB 8/19/1950, Director, Since 2003/2004/2005(3) | | Ms. Stone has been a professor at the University of Alabama Culverhouse School of Accountancy since 1981 and held the Hugh Culverhouse Endowed Chair of Accountancy since 2002. She has served as Director of the Culverhouse School of Accountancy since 2004. She is also a former member of Financial Accounting Standards Advisory Council, AICPA, Accounting Standards Executive Committee and AACSB International Accounting Accreditation Committee. She is a Certified Public Accountant. |
98
BOARDOF DIRECTORSAND OFFICERS
| | |
Name, Address(1), Age,
Position(s) Held with Funds,
Term of Office(2),
Length of Service | | Principal Occupation(s) During Past Five
Years and Other Directorships
Held by Director |
| |
Archie W. Willis, III DOB 11/13/1957, Director, Since 2003/2004/2005(3) | | Mr. Willis has been President of Community Capital (financial advisory and real estate development) since 1999 and Vice President of Community Realty Company (real estate brokerage) since 1999. He was a First Vice President of Morgan Keegan & Company, Inc. from 1991 to 1999. He also has served as a Director of Memphis Telecom, LLC since 2001 and a Member of the Advisory Board of Tri-State Bank of Memphis since 2006. |
(1) | | The address of each director is c/o the Funds, 50 North Front Street, 21st Floor, Memphis, Tennessee 38103. |
(2) | | Each Fund’s Board of Directors is divided into three classes: Class I, Class II and Class III. The terms of office of the Class I, Class II and Class III Directors expire at the Annual Meeting of Stockholders in the year 2010, year 2008 and year 2009, respectively. Each director who is not an interested person of the Fund serves on the Fund’s Audit, Independent Directors and Qualified Legal Compliance Committees. |
(3) | | RMK High Income Fund, RMK Strategic Income Fund, RMK Advantage Income Fund and RMK Multi-Sector High Income Fund commenced investment operations on June 24, 2003, March 18, 2004, November 8, 2004 and January 19, 2006, respectively. |
OFFICERS
| | |
Name, Address(1), Age,
Position(s) Held with Funds,
Term of Office(2),
Length of Service | | Principal Occupation(s) During Past Five Years |
| |
Brian B. Sullivan DOB 1/4/1955, President, Since 2006 | | Mr. Sullivan has served as President and Chief Investment Officer of Morgan Asset Management, Inc. since 2006. From 1999 to 2002 and from 2005 to 2007, Mr. Sullivan has served as President of AmSouth Asset Management, Inc., which merged into Morgan Asset Management, Inc. in late 2007. |
99
BOARDOF DIRECTORSAND OFFICERS
| | |
Name, Address(1), Age,
Position(s) Held with Funds,
Term of Office(2),
Length of Service | | Principal Occupation(s) During Past Five Years |
| |
| | From 1996 to 1999 and from 2002 to 2005, Mr. Sullivan served as Vice President of AmSouth Asset Management, Inc. Since joining AmSouth Bank in 1982 through 1996, Mr. Sullivan served in various capacities including Equity Research Analyst and Chief Fixed Income Officer and was responsible for Employee Benefits Portfolio Management and Regional Trust Investments. He holds the Chartered Financial Analyst designation. |
| |
Thomas R. Gamble DOB 11/22/1942, Vice President, Since 2003/2004/2005(3) | | Mr. Gamble has been an executive at Regions Financial Corporation since 1981. He was a Corporate IRA Manager from 2000 to 2001 and a Senior Vice President and Manager of Employee Benefits at the Birmingham Trust Department of Regions Bank from 1981 to 2000. |
| |
J. Thompson Weller DOB 4/2/1965, Treasurer, Since 2006, and Assistant Secretary, Since 2003/2004/2005(3) | | Mr. Weller has been a Managing Director and Controller of Morgan Keegan & Company, Inc. since 2001. He was Senior Vice President and Controller of Morgan Keegan & Company, Inc. from 1998 to 2001, Controller and First Vice President from 1997 to 1998, Controller and Vice President from 1995 to 1997 and Assistant Controller from 1992 to 1995. Mr. Weller also served as a Business Systems Analyst in the Investment Information Division of Metropolitan Life Insurance Co. from 1991 to 1992. Mr. Weller was also with Arthur Andersen & Co. in 1988 and Andersen Consulting from 1989 to 1991. |
100
BOARDOF DIRECTORSAND OFFICERS
| | |
Name, Address(1), Age,
Position(s) Held with Funds,
Term of Office(2),
Length of Service | | Principal Occupation(s) During Past Five Years |
| |
Charles D. Maxwell DOB 5/14/1954, Secretary and Assistant Treasurer, Since 2003/2004/2005(3) | | Mr. Maxwell has been Executive Managing Director, Chief Financial Officer, Treasurer and Secretary of Morgan Keegan & Company, Inc. since 2006. Mr. Maxwell previously served as Managing Director of Morgan Keegan & Company, Inc. from 1998 to 2006 and Assistant Treasurer and Assistant Secretary of Morgan Keegan & Company, Inc. from 1994 to 2006. Mr. Maxwell has been Secretary and Treasurer of Morgan Asset Management, Inc. since 1993. He was Senior Vice President of Morgan Keegan & Company, Inc. from 1995 to 1997. Mr. Maxwell also was with the accounting firm of Ernst & Young LLP from 1976 to 1986 and served as a Senior Manager from 1984 to 1986. |
| |
Michele F. Wood DOB 4/29/1969, Chief Compliance Officer, Since 2006 | | Ms. Wood has been the Chief Compliance Officer of Morgan Asset Management, Inc. since 2006 and is also a Senior Vice President of Morgan Keegan & Company, Inc. She was a Senior Attorney and First Vice President of Morgan Keegan & Company, Inc. from 2002 to 2006. She was a Staff Attorney with FedEx Corporation from 2001 to 2002 specializing in employment litigation. She was an Associate with Ford & Harrison LLP from 1997 to 2001. |
(1) | | The address of Messrs. Weller and Maxwell and Ms. Wood is 50 North Front Street, Memphis, Tennessee 38103. The address of Messrs. Sullivan and Gamble is 1901 6th Avenue North, 4th Floor, Birmingham, Alabama 35203. |
(2) | | Officers of the Funds are elected and appointed by the Board of Directors and hold office until they resign, are removed or are otherwise disqualified to serve. |
(3) | | RMK High Income Fund, RMK Strategic Income Fund, RMK Advantage Income Fund and RMK Multi-Sector High Income Fund commenced investment operations on June 24, 2003, March 18, 2004, November 8, 2004 and January 19, 2006, respectively. |
101
SUPPLEMENTAL INFORMATION
BOARD APPROVALOFTHE INVESTMENT ADVISORY AGREEMENTS
The continuance of the current investment advisory agreements for RMK Advantage Income Fund, Inc., RMK High Income Fund, Inc., RMK Multi-Sector High Income Fund, Inc. and RMK Strategic Income Fund, Inc. was considered and unanimously approved by each Fund’s Board of Directors on October 26, 2007. A discussion of the material factors and the conclusions that formed the basis for the Boards’ approval is included in the Funds’ Semi-Annual Report for the period ended September 30, 2007.
On April 21, 2008, the Boards of Directors of the Funds unanimously approved new investment advisory agreements with Hyperion Brookfield Asset Management, Inc. (“HBAM”). The appointment of HBAM as investment adviser of any of the Funds must be approved by the shareholders of that Fund. Joint Special Shareholder Meetings of the Funds are scheduled for July 11, 2008, to vote on the proposed new investment advisory agreements. Additional information about the proposed new investment advisory agreements, and the material factors and the conclusions that formed the basis for the Boards’ approval of the proposed new agreements, is being sent to shareholders of the Funds as part of proxy solicitation materials.
102
SUPPLEMENTAL INFORMATION
DIVIDEND REINVESTMENT PLAN
The Funds offer a dividend reinvestment plan (the “Plan”) pursuant to which stockholders, unless they elect otherwise, automatically have dividends and other distributions reinvested in common shares of the Fund by Computershare Trust Company, N.A. and Computershare Shareholder Services, Inc. (together, the “Plan Agent”). Stockholders who elect not to participate in the Plan receive all distributions in cash paid by wire or check mailed directly to the recordholder by the Plan Agent.
How the Plan Works
After a Fund declares a dividend or determines to make other distributions, the Plan Agent will acquire shares for the participants’ accounts, depending upon the circumstances described below, either (i) through receipt of newly-issued shares of the Fund or (ii) by open-market purchases as follows:
| n | | If, on the payment date, the NAV is equal to or less than the market price per share plus estimated brokerage commissions, the Plan Agent will invest the distribution amount in newly-issued shares on behalf of the participants. The number of newly-issued shares to be credited to each participant’s account will be determined by dividing the dollar amount of the distribution by the NAV on the date the shares are issued. However, if the NAV is less than 95% of the market price on the payment date, the dollar amount of the distribution will be divided by 95% of the market price on the payment date. Because common shares may be issued at less than their market price, Plan participants may get a benefit that non-participants do not. |
| n | | If, on the payment date, the NAV is greater than the market value per share plus estimated brokerage commissions, the Plan Agent will invest the distribution amount in shares acquired on behalf of the participants in open-market purchases, which may be made on the New York Stock Exchange (“NYSE”), in the over-the-counter market or in negotiated transactions and may be on such terms as to price, delivery and otherwise as the Plan Agent shall determine. It is possible that the market price for the shares may increase before the Plan Agent has completed its purchases. Therefore, the average purchase price per share the Plan Agent pays may exceed the market price thereof on the payment date. If the market price per share increases so that it equals or exceeds the NAV per share (minus estimated brokerage commissions), the Plan Agent will cease its purchases. Otherwise, the Plan Agent will use all distributions received in cash to purchase shares in the open market on or shortly after the payment date, but in no event more than |
103
SUPPLEMENTAL INFORMATION
| | thirty (30) days after the payment date, except where temporary curtailment or suspension of purchases is necessary to comply with applicable provisions of the federal securities laws. If the Plan Agent is unable to invest the full amount through open-market purchases during the purchase period, the Plan Agent will request that, with respect to the uninvested portion of such amount, the Fund issue new shares at the close of business on the earlier of the last day of the purchase period or the first day during the purchase period on which the NAV per share (minus estimated brokerage commissions) equals or is less than the market price per share. |
Costs of the Plan
The Plan Agent’s fees for the handling of the reinvestment of dividends and other distributions will be paid by the Funds. However, each participant will pay a pro rata share of brokerage commissions incurred with respect to the Plan Agent’s open-market purchases in connection with the reinvestment of dividends and other distributions. If a participant elects to have the Plan Agent sell part or all of his or her shares and remit the proceeds, the participant will be subject to a $15.00 service fee and a $0.12 per share sold processing fee (which includes applicable brokerage commissions the Plan Agent is required to pay). The participant will not be charged any other fees for this service. However, each Fund reserves the right to amend the Plan to include a service fee payable by the participant.
Tax Implications
The automatic reinvestment of dividends or other distributions does not relieve participants of any taxes that may be payable on such distributions. Participants will receive tax information annually for their personal records and to help them prepare their federal income tax returns. For further information as to the tax consequences of participation in the Plan, participants should consult with their own tax advisors.
Right to Withdraw
Participants may withdraw from the Plan by calling the Plan Agent at 800-426-5523, writing to the Plan Agent at 250 Royall Street, Canton, Massachusetts 02021 or completing and returning the transaction form attached to each Plan statement. The withdrawal will be effective immediately if the participant’s notice is received by the Plan Agent not less than ten days prior to any dividend or other distribution record date. Otherwise, the withdrawal will be effective the first trading day after the payment date for the dividend or other distribution with respect to any subsequent dividend or other distribution.
104
SUPPLEMENTAL INFORMATION
PRIVACY POLICY NOTICE
The Funds and their agents (referred to as the “Funds,” “we” or “us”) recognize that consumers (referred to as “you” or “your”) expect us to protect both your assets and financial information. We respect your right to privacy and your expectation that all personal information about you or your account will be maintained in a secure manner. We are committed to maintaining the confidentiality, security and integrity of client and stockholder information. We want you to understand the Funds’ policy that governs the handling of your information, how the Funds gather information, how that information is used and how it is kept secure.
Information the Funds Collect
The Funds collect nonpublic personal information about you from the following sources:
| n | | We may receive information from you, or from your financial representative, on account applications, other forms or electronically (such as through the Funds’ website or other electronic trading mechanisms). Examples of this information include your name, address, social security number, assets and income. |
| n | | We may receive information from you, or from your financial representative, through transactions with us or others, correspondence and other communications. Examples of this information include specific investments and your account balances. |
| n | | We may obtain other personal information from you in connection with providing you a financial product or service. Examples of this information include depository, debit or credit account numbers. |
Information Sharing Policy
The Funds may share the nonpublic personal information about you, as described above, with financial or non-financial companies or other entities, including companies that may be affiliated with the Funds and other nonaffiliated third parties, for the following purposes:
| n | | We may share information when it is necessary and required to process a transaction or to service a customer relationship. For example, information may be shared with a company that provides account record keeping services or a company that provides proxy services to stockholders. |
105
SUPPLEMENTAL INFORMATION
| n | | We may share information when it is required or permitted by law. For example, information may be shared in response to a subpoena or to protect you against fraud or with someone who has established a legal beneficial interest, such as a power of attorney. |
| n | | We may disclose all of the information we collect, as described above, to companies that perform marketing or other services on our behalf or to other financial institutions with whom we have agreements, for the limited purpose of jointly offering, endorsing or sponsoring a financial product or service. For example, we may share information about you for these limited purposes with the bank, broker-dealer or other financial intermediary through whom you purchased the Funds’ products or services, or with providers of marketing, legal, accounting or other professional services. The Funds will not, however, disclose a consumer’s account number or similar form of access number or access code for credit card, deposit or transaction accounts to any non-affiliated third party for use in telemarketing, direct mail or other marketing purposes. |
Except as described above, the Funds do not share customer information. We will not rent, sell, trade or otherwise release or disclose any personal information about you. Any information you provide to us is for the Funds’ use only. If you decide to close your account(s) or become an inactive customer, we will adhere to the privacy policies and practices as described in this notice.
Information Security
When the Funds share nonpublic customer information with third parties hired to facilitate the delivery of certain products or services to our customers, such information is made available for limited purposes and under controlled circumstances designed to protect our customers’ privacy. We require third parties to comply with our standards regarding security and confidentiality of such information. We do not permit them to use that information for their own or any other purposes, or rent, sell, trade or otherwise release or disclose the information to any other party. These requirements are reflected in written agreements between the Funds and the third party service providers.
The Funds protect your personal information in several ways. We maintain physical, electronic and procedural safeguards to guard your nonpublic personal information. Each of the following sections explains an aspect of the Funds’ commitment to protecting your personal information and respecting your privacy.
106
SUPPLEMENTAL INFORMATION
Employee Access to Information
All of the Funds’ employees and agents must adhere to the Funds’ policy on confidentiality. Access to customer information is authorized for business purposes only, and the degree of access is based on the sensitivity of the information and on an employee’s or agent’s need to know the information in order to service a customer’s account or comply with legal requirements.
Visiting the Funds’ Website
| n | | The Funds’ website (www.rmkfunds.com) gathers and maintains statistics about the number of visitors as well as what information is viewed most frequently. This information is used to improve the content and level of service we provide to our clients and stockholders. |
| n | | Information or data entered into a website will be retained. |
| n | | Where registration to a website or re-entering personal information on a website is required, “cookies” are used to improve your online experience. A cookie is a way for websites to recognize whether or not you have visited the site before. It is a small file that is stored on your computer that identifies you each time you re-visit our site so you don’t have to resubmit personal information. Cookies provide faster access into the website. |
| n | | We may also collect non-personally identifiable Internet Protocol (“IP”) addresses for all other visitors to monitor the number of visitors to the site. These non-personally identifiable IP addresses are never shared with any third party. |
E-mail
If you have opted to receive marketing information from the Funds by e-mail, it is our policy to include instructions in all marketing messages on how to unsubscribe from subsequent e-mail programs. Some products or services from the Funds are intended to be delivered and serviced electronically. E-mail communication may be utilized in such cases. If you participate in an employer-sponsored retirement plan, we may, at your employer’s request, send you e-mail on matters pertaining to the retirement plan.
Please do not provide any account or personal information such as social security numbers, account numbers or account balances within your e-mail correspondence to us. We cannot use e-mail to execute transaction instructions, provide personal account information or change account registration. We can, however, use e-mail to provide you with the necessary forms. You can also use customer service to do so. Call us toll-free at 800-564-2188.
107
SUPPLEMENTAL INFORMATION
Surveys/Aggregate Data
Periodically, the Funds may conduct surveys about financial products and services or review elements of customer information in an effort to forecast future business needs. The Funds then generate reports that include aggregate data regarding its customers. Aggregate data classifies customer information in various ways but that does not identify individual customers. These reports may also include information on website traffic patterns and related information. These reports are used for the Funds’ planning, statistical and other corporate purposes. Aggregate data may also be shared with external parties, such as marketing organizations. However, no information is shared by which any individual customer could be identified.
Changes to Our Privacy Statement
The Funds reserve the right to modify or remove parts of this privacy statement at any time. Notice will be provided to you in advance of any changes that would affect your rights under this policy statement.
ANNUAL CERTIFICATIONS
Each Fund is listed on the NYSE. As a result, each Fund is subject to certain corporate governance listing standards promulgated by the NYSE pursuant to which each Fund must include the following information in its annual report. Each Fund has submitted to the NYSE the required annual certification of its Chief Executive Officer. During the fiscal year covered by its last annual report each Fund also has filed the certifications of its Chief Executive Officer and Chief Financial Officer required by Rule 30a-2 under the 1940 Act with the Securities and Exchange Commission.
PROXY VOTING POLICIES & PROCEDURES & RECORDOF VOTING ACTIVITY
The Funds vote proxies related to their portfolio securities according to a set of policies and procedures approved by the Funds’ Boards of Directors. You may view the proxy voting activity for each Fund during the most recent twelve month period ended June 30 as well as a description of the policies and procedures, without charge, by calling 800-564-2188, by visiting the Fund’s website at www.rmkfunds.com or by visiting the SEC’s website at www.sec.gov.
108
SUPPLEMENTAL INFORMATION
QUARTERLY REPORTSON PORTFOLIO HOLDINGS
The Funds file their complete schedules of portfolio holdings as of the first and third quarters of their fiscal years on Form N-Q with the SEC no more than sixty days after the close of those quarters. You may obtain each Fund’s Form N-Q filings, without charge, by calling 800-564-2188 or you may view these filings by visiting the SEC’s website at www.sec.gov. Each Fund’s last Form N-Q filing is available on the Fund’s website at www.rmkfunds.com. Each Fund’s Form N-Q filings may also be reviewed and copied at the SEC’s Public Reference Room in Washington, D.C. Call 800-SEC-0330 for information regarding the operation of the Public Reference Room.
FEDERAL TAX INFORMATION
(UNAUDITED)
For the fiscal year ended March 31, 2008, the amount of long-term capital gain designated by RMK Advantage Income Fund, RMK High Income Fund, RMK Multi-Sector High Income Fund and RMK Strategic Income Fund was $0, $0, $2,434,955 and $0, respectively.
For the fiscal year ended March 31, 2008, 4.49%, 4.73%, 4.38% and 4.40% of the income dividends paid by RMK Advantage Income Fund, RMK High Income Fund, RMK Multi-Sector High Income Fund and RMK Strategic Income Fund, respectively, (1) qualified as “qualified dividend income,” which generally is subject to a maximum tax rate of 15%, for individual stockholders (complete information is reported on Form 1099-DIV) and (2) qualified for the dividends-received deduction available to corporate stockholders.
109
SUPPLEMENTAL INFORMATION
SERVICE PROVIDERS
| | |
| |
INVESTMENT ADVISER Morgan Asset Management, Inc. 1901 6th Avenue North, 4th Floor Birmingham, Alabama 35203 | | ADMINISTRATOR Morgan Keegan & Company, Inc. Morgan Keegan Tower 50 North Front Street Memphis, Tennessee 38103 |
| |
CUSTODIAN State Street Bank & Trust Company 801 Pennsylvania Avenue Kansas City, Missouri 64105 | | LEGAL COUNSEL Kirkpatrick & Lockhart Preston Gates Ellis LLP 1601 K Street, N.W. Washington, DC 20006 |
| |
TRANSFER AGENT Computershare Shareholder Services, Inc. 250 Royall Street Canton, Massachusetts 02021 | | INDEPENDENT REGISTERED PUBLIC ACCOUNTING FIRM PricewaterhouseCoopers LLP One North Wacker Chicago, Illinois 60606 |
This report is for stockholder information. This is not a prospectus intended for use in the purchase or sale of Fund shares. Statements and other information contained in this report are as dated and are subject to change.
110
REGIONS MORGAN KEEGAN FUND COMPLEX
The Regions Morgan Keegan fund complex offers mutual funds with a broad variety of investment objectives to meet the financial needs of all types of investors. With approximately $3.3 billion in assets, the fund complex includes five equity funds, one balanced fund, five bond funds, one tax-exempt bond fund, two money market funds and four closed-end bond funds. You may see an overview of each Fund by visiting the Funds’ website at www.rmkfunds.com. You may also download each Fund’s most recent marketing flyer, prospectus, and annual and semi-annual reports to shareholders.
REGIONS MORGAN KEEGAN SELECT FAMILYOF FUNDS
Regions Morgan Keegan Select Mid Cap Growth Fund
Regions Morgan Keegan Select Growth Fund
Regions Morgan Keegan Select Core Equity Fund
Regions Morgan Keegan Select Mid Cap Value Fund
Regions Morgan Keegan Select Value Fund
Regions Morgan Keegan Select Balanced Fund
Regions Morgan Keegan Select High Income Fund
Regions Morgan Keegan Select Intermediate Bond Fund
Regions Morgan Keegan Select Fixed Income Fund
Regions Morgan Keegan Select Limited Maturity Fixed Income Fund
Regions Morgan Keegan Select Short Term Bond Fund
Regions Morgan Keegan Select Intermediate Tax Exempt Bond Fund
Regions Morgan Keegan Select Treasury Money Market Fund
Regions Morgan Keegan Select Money Market Fund
REGIONS MORGAN KEEGAN CLOSED-END FUNDS
| n | | RMK Advantage Income Fund, Inc. (NYSE: RMA) |
| n | | RMK High Income Fund, Inc. (NYSE: RMH) |
| n | | RMK Multi-Sector High Income Fund, Inc. (NYSE: RHY) |
| n | | RMK Strategic Income Fund, Inc. (NYSE: RSF) |
111

The Fund has adopted a code of ethics as defined in Item 2 of Form N-CSR that applies to the Fund’s principal executive officer and principal financial officer. The Fund has not made any substantial amendments to its code of ethics during the covered period. The Fund also has not granted any waivers from any provisions of the code of ethics during the covered period. A copy of the Fund’s code of ethics is filed as an exhibit pursuant to Item 12(a)(1).
| Item 3. | Audit Committee Financial Expert. |
The Fund’s Board of Directors (the “Board”) has determined that Albert C. Johnson, James Stillman R. McFadden, W. Randall Pittman and Mary S. Stone are audit committee financial experts, as defined in Item 3 of Form N-CSR, serving on its Audit Committee. Messrs. Johnson, McFadden and Pittman and Ms. Stone are independent for purposes of Item 3(a)(2) of this Form N-CSR.
| Item 4. | Principal Accountant Fees and Services. |
(a)-(d) Audit and Non-Audit Fees
Fees incurred with PricewaterhouseCoopers LLP (“PwC”) for professional services rendered for audit and non-audit services provided to the Fund for the fiscal years ended March 31, 2008 and March 31, 2007 were as follows:
| | | | | | |
| | | 2008 | | 2007 |
(a) Audit Fees | | $ | 95,250 | | $ | 42,875 |
(b) Audit-Related Fees | | | 7,500 | | | — |
(c) Tax Fees(1) | | | 4,000 | | | 3,500 |
(d) All Other Fees | | | — | | | — |
| | | | | | |
Total Fees | | $ | 106,750 | | $ | 46,375 |
| | | | | | |
(1) | Consists of fees for professional services rendered for tax compliance, tax advice and tax planning. |
(e)(1) Pre-Approval of Audit and Non-Audit Services
Audit and non-audit services provided to the Fund require pre-approval by the Fund’s Audit Committee. The Audit Committee pre-approves these services on a case-by-case basis. The Audit Committee also must pre-approve those non-audit services provided to the Fund’s investment adviser and any entity controlling, controlled by or under common control with the Fund’s investment adviser (the “Affiliated Service Providers”) that provides ongoing services to the Fund, if the service relates directly to the operations and financial reporting of the Fund. Any individual service that does not exceed $15,000 may be pre-approved by the chair of the Audit Committee. Any proposed service exceeding that cost level requires specific pre-approval by the Audit Committee.
(e)(2) None of the services included under (b)-(d) above was approved by the Audit Committee pursuant to paragraph (c)(7)(i)(C) of Rule 2-01 of Regulation S-X.
(f) Not applicable.
(g) Non-Audit Fees
The aggregate non-audit fees incurred with PwC for professional services rendered to the Fund were $11,500 and $3,500 for the fiscal years ended 2008 and 2007, respectively.
The aggregate non-audit fees incurred with PwC for professional services rendered to the Fund’s Affiliated Service Providers that provide ongoing services to the Fund were $0 and $0 for the fiscal years ended 2008 and 2007, respectively.
(h) Not applicable as there were no non-audit services rendered to the Fund’s Affiliated Service Providers that provide ongoing services to the Fund for the fiscal years ended 2008 and 2007.
| Item 5. | Audit Committee of Listed Registrants. |
The Fund has a separately-designated standing Audit Committee in accordance with Section 3(a)(58)(A) of the Securities Exchange Act of 1934, as amended, consisting of Albert C. Johnson, James Stillman R. McFadden, W. Randall Pittman, Mary S. Stone and Archie W. Willis, III.
| | (a) | This schedule is included as part of the Report to Stockholders filed under Item 1 of this Form N-CSR. |
| Item 7. | Disclosure of Proxy Voting Policies and Procedures for Closed-End Management Investment Companies. |
The Board has delegated to the Fund’s investment adviser, Morgan Asset Management, Inc. (the “Adviser”), the responsibility to vote proxies related to the securities held in the Fund’s portfolio. Under this authority, the Adviser is required to vote proxies related to portfolio securities in the best interests of the Fund and its stockholders. The Board permits the Adviser to contract with a third party to obtain proxy voting and related services, including research of current issues.
The Adviser has implemented written Proxy Voting Policies and Procedures (“Proxy Voting Policy”) that are designed to reasonably ensure that the Adviser votes proxies prudently and in the best interest of its clients for whom the Adviser has voting authority, including the Fund. The Proxy Voting Policy also describes how the Adviser addresses any conflicts that may arise between its interests and those of its clients with respect to proxy voting.
The Adviser’s Proxy Committee is responsible for developing, authorizing, implementing and updating the Proxy Voting Policy, overseeing the proxy voting process and engaging and overseeing any independent third-party vendors as voting delegate to review, monitor and/or vote proxies. In order to apply the Proxy Voting Policy noted above in a timely and consistent manner, the Adviser utilizes Risk Metrics Group ISS Governance Services (“ISS”) to vote proxies in accordance with the Adviser’s voting guidelines.
The Adviser’s guidelines adopt the voting recommendations of ISS except that the Adviser may depart from ISS’s voting recommendations in certain areas if authorized by the Proxy Committee. The Adviser retains final authority and fiduciary responsibility for proxy voting. The Adviser believes that this process is reasonably designed to address material conflicts of interest that may arise between the Adviser and a client as to how proxies are voted.
In the event that an investment professional at the Adviser believes that it is in the best interests of a client or clients to vote proxies in a manner inconsistent with the Adviser’s proxy voting guidelines or in a manner inconsistent with ISS recommendations, the Proxy Committee will review information submitted by the investment professional to determine that there is no material conflict of interest between the Adviser and the client with respect to the voting of the proxy in that manner.
If the Proxy Committee determines that the voting of a proxy as recommended by the investment professional presents a material conflict of interest between the Adviser and the client or clients with respect to the voting of the proxy, the Proxy Committee shall: (i) take no further action, in which case ISS shall vote such proxy in accordance with the proxy voting guidelines or as ISS recommends; (ii) disclose such conflict to the client or clients and obtain written direction from the client as to how to vote the proxy; (iii) suggest that the client or clients engage another party to determine how to vote the proxy; or (iv) engage another independent third party to determine how to vote the proxy.
| Item 8. | Portfolio Managers of Closed-End Management Investment Companies. |
As of May 30, 2008, day-to-day management of the Fund’s portfolio is the responsibility of a team led by James C. Kelsoe, Jr., CFA. The following individuals at the Adviser share primary responsibility for the management of the Fund.
James C. Kelsoe, Jr., CFA – Mr. Kelsoe serves as lead portfolio manager of the Fund. Mr. Kelsoe has been a portfolio manager with the Adviser since 1992. Mr. Kelsoe also serves as portfolio manager of Regions Morgan Keegan Select Short Term Bond Fund, Regions Morgan Keegan Select Intermediate Bond Fund and Regions Morgan Keegan Select High Income Fund, each a series of Morgan Keegan Select Fund, Inc. and RMK Advantage Income Fund, Inc., RMK High Income Fund, Inc. and RMK Strategic Income Fund, Inc., closed-end investment companies traded on the New York Stock Exchange. Mr. Kelsoe is currently a senior portfolio manager for the Adviser, where he is responsible for $662 million in assets under management and serves as a member of the Adviser’s strategy group, which oversees over $29 billion in assets. Mr. Kelsoe has been with the Adviser since 1991. He received a B.S. in Finance from the University of Alabama in 1986 and holds the Chartered Financial Analyst designation.
Accounts Managed by James C. Kelsoe, Jr. as of March 31, 2008:
| | | | | | | | |
| | | Registered Investment
Companies | | Other Pooled
Investment Vehicles | | Other Accounts |
Number of Accounts Managed | | | 7 | | — | | | 13 |
Number of Accounts Managed with Performance-Based Advisory Fees | | | — | | — | | | — |
Assets Managed | | $ | 662,104,697 | | — | | $ | 180,390,877 |
Assets Managed with Performance-Based Advisory Fees | | | — | | — | | | — |
The dollar range of shares of the Fund beneficially owned by James C. Kelsoe, Jr. as of March 31, 2008 was $10,001-$50,000.
David H. Tannehill, CFA – Mr. Tannehill serves as an assistant portfolio manager of the Fund. Mr. Tannehill also serves as an assistant portfolio manager of Regions Morgan Keegan Select Short Term Bond Fund, Regions Morgan Keegan Select Intermediate Bond Fund, Regions Morgan Keegan Select High Income Fund, RMK Advantage Income Fund, Inc., RMK High Income Fund, Inc. and RMK Strategic Income Fund, Inc. Mr. Tannehill has been a portfolio manager for the Adviser since 2004 managing the corporate bond portion of each fund’s portfolio. From 2001 to 2004, Mr. Tannehill was a portfolio manager for Commerce Capital Management, Inc. where he was responsible for managing over $200 million in individual, individual trust and endowment accounts. Mr. Tannehill has eight years prior experience with Morgan Keegan & Company, Inc. in investment research of both equity and fixed-income securities. Mr. Tannehill earned a BBA in 1983 and an MBA in 1984 from the University of Mississippi. He holds the Chartered Financial Analyst designation.
Accounts Managed by David H. Tannehill as of March 31, 2008:
| | | | | | | |
| | | Registered Investment
Companies | | Other Pooled
Investment Vehicles | | Other Accounts |
Number of Accounts Managed | | | 7 | | — | | — |
Number of Accounts Managed with Performance-Based Advisory Fees | | | — | | — | | — |
Assets Managed | | $ | 662,104,697 | | — | | — |
Assets Managed with Performance-Based Advisory Fees | | | — | | — | | — |
The dollar range of shares of the Fund beneficially owned by David H. Tannehill as of March 31, 2008 was $10,001-$50,000.
Managing Conflicts of Interest
Actual or apparent conflicts of interest may arise when a portfolio manager has day-to-day management responsibilities with respect to more than one fund or other account. More specifically, portfolio managers who manage multiple funds and/or other accounts are presented with the following potential conflicts:
| | • | | The management of multiple funds and/or other accounts may result in a portfolio manager devoting unequal time and attention to the management of each fund and/or other account. The Adviser seeks to manage such competing interests for the time and attention of a portfolio manager by having the portfolio manager focus on a particular investment discipline. |
| | • | | If a portfolio manager identifies a limited investment opportunity which may be suitable for more than one fund or other account, a fund may not be able to take full advantage of that opportunity because demand is larger than supply. In this instance, available opportunities are allocated. To deal with these situations, the Adviser and the funds have adopted procedures for allocating portfolio transactions across multiple accounts. |
| | • | | With respect to securities transactions for the funds, the Adviser determines which broker to use to execute each order, consistent with its duty to seek best execution of the transaction. |
| | However, with respect to certain other accounts (such as mutual funds for which the Adviser or an affiliate acts as subadviser, other pooled investment vehicles that are not registered mutual funds, and other accounts managed for organizations and individuals), the Adviser may be limited by the client with respect to the selection of brokers or may be instructed to direct trades through a particular broker. In these cases, the Adviser or its affiliates may place separate, non-simultaneous, transactions for a fund and another account which may temporarily affect the market price of the security or the execution of the transaction, or both, to the detriment of the fund or the other account. |
| | • | | Finally, the appearance of a conflict of interest may arise where the Adviser has an incentive, such as a performance-based management fee, which relates to the management of one fund or account but not all funds and accounts with respect to which a portfolio manager has day-to-day management responsibilities. |
The Adviser and the Fund have adopted certain compliance procedures which are designed to address these types of conflicts. However, there is no guarantee that such procedures will detect each and every situation in which a conflict arises.
Compensation
The Adviser seeks to maintain a compensation program that is competitively positioned to attract and retain high-caliber investment professionals. Portfolio managers receive a base salary, an incentive bonus opportunity, an equity compensation opportunity and a benefits package. Portfolio manager compensation is reviewed and may be modified each year as appropriate to reflect changes in the market, as well as to adjust the factors used to determine bonuses to promote good sustained fund performance. The Adviser evaluates competitive market compensation by reviewing compensation survey results conducted by an independent third party of investment industry compensation. Each portfolio manager’s compensation consists of the following four elements:
Base salary
Each portfolio manager is paid a base salary. In setting the base salary, the Adviser’s intention is to be competitive in light of the particular portfolio manager’s experience and responsibilities.
Annual bonus
Each portfolio manager is eligible to receive an annual cash bonus. A portion of this bonus is determined by the portfolio manager’s investment management results measured against the relevant peer group or index and the remaining portion of this bonus is discretionary, which takes into consideration such factors as the portfolio manager’s support of the firm’s policies and procedures, the portfolio manager’s acquisition of new business and the portfolio manager’s service to existing clients.
Equity-based compensation
Portfolio managers may be awarded options to purchase common shares and/or granted restricted shares of Regions Financial Corporation’s stock from pools determined from time to time by the Remuneration Committee of Regions Financial Corporation’s Board of Directors. Awards of equity-based compensation typically vest over time, so as to create incentives to retain key talent.
| Item 9. | Purchases of Equity Securities by Closed-End Management Investment Company and Affiliated Purchasers. |
There were no reportable purchases for the period covered by this report.
| Item 10. | Submission of Matters to a Vote of Security Holders. |
There have been no material changes to the procedures by which the stockholders may recommend nominees to the Fund’s Board of Directors.
| Item 11. | Controls and Procedures. |
| | (a) | Based on an evaluation of the disclosure controls and procedures (as defined in Rule 30a-3(c) under the 1940 Act), as of a date within 90 days of the filing date of this report, the Fund’s certifying officers have concluded that such disclosure controls and procedures are reasonably designed to ensure that information required to be disclosed by the Fund on Form N-CSR and Form N-Q is accumulated and communicated to the Fund’s management to allow timely decisions regarding required disclosure. |
| | (b) | The Fund’s certifying officers are not aware of any changes in the Fund’s internal controls over financial reporting (as defined in Rule 30a-3(d) under the 1940 Act) that occurred during the second fiscal quarter of the period covered by this report that has materially affected, or are reasonably likely to materially affect, the Fund’s internal controls over financial reporting. |
| | (a)(1) | The code of ethics pursuant to Item 2 is filed herewith. |
| | (a)(2) | The certifications required by Rule 30a-2(a) of the 1940 Act and Section 302 of the Sarbanes-Oxley Act of 2002 (the “Sarbanes-Oxley Act”) are filed herewith. |
| | (b) | The certifications required by Rule 30a-2(b) of the 1940 Act and Section 906 of the Sarbanes-Oxley Act are filed herewith. |
The certifications provided pursuant to Section 906 of the Sarbanes-Oxley Act are not deemed “filed” for purposes of Section 18 of the Securities Exchange Act of 1934 (“Exchange Act”), or otherwise subject to the liability of that section. Such certifications will not be deemed to be incorporated by reference into any filing under the Securities Act of 1933 or the Exchange Act, except to the extent that the Fund specifically incorporates them by reference.
SIGNATURES
Pursuant to the requirements of the Securities Exchange Act of 1934 and the Investment Company Act of 1940, the Fund has duly caused this report to be signed on its behalf by the undersigned, thereunto duly authorized.
| | |
| |
(Fund): | | RMK Multi-Sector High Income Fund, Inc. |
| |
By (Signature and Title): | | /s/ Brian B. Sullivan |
| | Brian B. Sullivan President and Principal Executive Officer |
| |
Date: | | May 30, 2008 |
Pursuant to the requirements of the Securities Exchange Act of 1934 and the Investment Company Act of 1940, this report has been signed below by the following persons on behalf of the Fund and in the capacities and on the dates indicated.
| | |
| |
By (Signature and Title): | | /s/ Brian B. Sullivan |
| | Brian B. Sullivan President and Principal Executive Officer |
| |
Date: | | May 30, 2008 |
| | |
| |
By (Signature and Title): | | /s/ J. Thompson Weller |
| | J. Thompson Weller Treasurer and Principal Financial Officer |
| |
Date: | | May 30, 2008 |