UNITED STATES
SECURITIES AND EXCHANGE COMMISSION
Washington, D.C. 20549
FORM N-CSR
CERTIFIED SHAREHOLDER REPORT OF REGISTERED MANAGEMENT INVESTMENT COMPANIES
Investment Company Act file number: 811-21835
Name of Fund: BlackRock Long-Term Municipal Advantage Trust (BTA)
Fund Address: 100 Bellevue Parkway, Wilmington, DE 19809
Name and address of agent for service: John M. Perlowski, Chief Executive Officer, BlackRock Long-Term Municipal Advantage Trust, 55 East 52nd Street, New York, NY 10055
Registrant’s telephone number, including area code: (800) 882-0052, Option 4
Date of fiscal year end: 04/30/2014
Date of reporting period: 04/30/2014
Item 1 – Report to Stockholders
APRIL 30, 2014
| ANNUAL REPORT | |  |
BlackRock Investment Quality Municipal Trust Inc. (BKN)
BlackRock Long-Term Municipal Advantage Trust (BTA)
BlackRock Municipal 2020 Term Trust (BKK)
BlackRock Municipal Income Trust (BFK)
BlackRock Pennsylvania Strategic Municipal Trust (BPS)
BlackRock Strategic Municipal Trust (BSD)
Not FDIC Insured • May Lose Value • No Bank Guarantee |
Table of Contents
| | | | | Page | |
Shareholder Letter | | | | | 3 | |
Annual Report:
| | | | | | |
Municipal Market Overview | | | | | 4 | |
The Benefits and Risks of Leveraging | | | | | 5 | |
Derivative Financial Instruments | | | | | 5 | |
Trust Summaries | | | | | 6 | |
Financial Statements
| | | | | | |
Schedules of Investments | | | | | 18 | |
Statements of Assets and Liabilities | | | | | 50 | |
Statements of Operations | | | | | 51 | |
Statements of Changes in Net Assets | | | | | 52 | |
Statements of Cash Flows | | | | | 54 | |
Financial Highlights | | | | | 55 | |
Notes to Financial Statements | | | | | 61 | |
Report of Independent Registered Public Accounting Firm | | | | | 72 | |
Automatic Dividend Reinvestment Plan | | | | | 73 | |
Officers and Trustees | | | | | 74 | |
Additional Information | | | | | 77 | |
| 2 | ANNUAL REPORT | APRIL 30, 2014
|
Dear Shareholder,
Markets have remained highly attuned to potential changes in U.S. monetary policy over the past year. This was markedly evident one year ago in May of 2013 when then-Federal Reserve Chairman Bernanke first mentioned the possibility of reducing (or “tapering”) the central bank’s asset purchase programs — comments that were widely misinterpreted as signaling an end to the Fed’s zero-interest-rate policy. U.S. Treasury yields rose sharply following his comments, triggering a steep sell-off across fixed income markets. (Bond prices move in the opposite direction of yields.) Global equities also suffered as investors feared the implications of a potential end to a program that had greatly supported stocks. Emerging markets, which are more sensitive to changes in global liquidity, were especially hurt by the prospect of ebbing cash flows from the United States. Markets broadly rebounded in late June, however, when the Fed’s tone turned more dovish. At the same time, improving economic indicators and better corporate earnings helped extend gains through most of the summer.
Although the tone of economic and financial news was mixed last autumn, it was a surprisingly positive period for most asset classes. Early on, the Fed defied market expectations with its decision to delay tapering, but higher volatility returned in late September 2013 when the U.S. Treasury Department warned that the national debt would soon breach its statutory maximum. The ensuing political brinksmanship led to a partial government shutdown, roiling global financial markets through the first half of October. Equities and other so-called “risk assets” managed to resume their rally when politicians finally engineered a compromise to reopen the government and extend the debt ceiling.
The remainder of 2013 was a generally positive period for stock markets in the developed world, although investors continued to grapple with uncertainty about when and how much the Fed would scale back on stimulus. When the Fed ultimately announced its tapering plans in mid-December, markets reacted positively, as this action signaled the Fed’s perception of real improvement in the economy, and investors were finally released from the anxiety that had gripped them for quite some time.
The start of the new year brought a stark change in sentiment. Heightened volatility in emerging markets — driven by reduced global liquidity, severe currency weakness, high levels of debt and uneven growth — combined with mixed U.S. economic data caused global equities to weaken in January while bond markets found renewed strength from investors seeking relatively safer assets. Although these headwinds persisted, equities were back on the rise in February as investors were encouraged by a one-year extension of the U.S. debt ceiling and market-friendly comments from new Fed Chair Janet Yellen. While U.S. economic data had softened, investors were assuaged by increasing evidence that this was a temporary trend resulting from harsher-than-usual winter weather.
In the final months of the period, signs of decelerating growth in China and geopolitical tensions in Russia and Ukraine made for a bumpy ride, but markets continued their climb as investors focused on improving U.S. economic data, stronger corporate earnings and a still-dovish central bank. Within developed markets, investors shifted from growth to value stocks as the strong performance of growth stocks in 2013 had pushed valuations higher in many of these sectors. Emerging markets also benefited from this broad rotation into cheaper valuations and were further supported by an improving growth outlook for a number of developing countries.
Even though investors were gearing up for a modest shift toward tighter monetary policy from the Fed, equity markets in the developed world posted solid gains for the six- and 12-month periods ended April 30. Emerging markets, however, experienced increased volatility amid heightened risks for the asset class. Interest rate uncertainty posed a headwind for fixed income assets, and higher-quality sectors of the market performed poorly over the reporting period. Conversely, high yield bonds benefited from income-oriented investors’ search for yield in the overall low-rate environment. Short-term interest rates remained near zero, keeping yields on money market securities close to historic lows.
At BlackRock, we believe investors need to think globally, extend their scope across a broad array of asset classes and be prepared to move freely as market conditions change over time. We encourage you to talk with your financial advisor and visit www.blackrock.com for further insight about investing in today’s world.
Sincerely,

Rob Kapito
President, BlackRock Advisors, LLC

|
| In a modest global growth environment, expectations around monetary policy changes continued to be a key theme in financial market performance. |
Rob Kapito
President, BlackRock Advisors, LLC
Total Returns as of April 30, 2014
| | | | 6-month | | 12-month |
U.S. large cap equities
(S&P 500® Index) | | | | | 8.36 | % | | | 20.44 | % |
U.S. small cap equities
(Russell 2000® Index) | | | | | 3.08 | | | | 20.50 | |
International equities
(MSCI Europe, Australasia, Far East Index) | | | | | 4.44 | | | | 13.35 | |
Emerging market equities
(MSCI Emerging Markets Index) | | | | | (2.98 | ) | | | (1.84 | ) |
| 3-month Treasury bill (BofA Merrill Lynch 3-Month U.S. Treasury Bill Index) | | | | | 0.03 | | | | 0.06 | |
U.S. Treasury securities
(BofA Merrill Lynch
10-Year U.S. Treasury Index) | | | | | 0.88 | | | | (5.25 | ) |
U.S. investment grade
bonds (Barclays U.S. Aggregate Bond Index) | | | | | 1.74 | | | | (0.26 | ) |
Tax-exempt municipal
bonds (S&P Municipal
Bond Index) | | | | | 4.24 | | | | 0.46 | |
U.S. high yield bonds
(Barclays U.S. Corporate
High Yield 2% Issuer
Capped Index) | | | | | 4.72 | | | | 6.28 | |
Past performance is no guarantee of future results. Index performance is shown for illustrative purposes only. You cannot invest directly in an index.
THIS PAGE NOT PART OF YOUR FUND REPORT
| 3 |
| |
| Municipal Market Overview |
|
For the Reporting Period Ended April 30, 2014
Municipal Market Conditions
After a strong start to 2013, the municipal market was upturned as investors reacted to statements issued by the U.S. Federal Reserve in May and June relating to the eventual reduction of its bond-buying stimulus program (which ultimately took effect in January 2014). The prospect of U.S. monetary policy tightening sooner than previously expected led to a sharp rise in interest rates and waning municipal bond performance. (Bond prices fall as rates rise.) Municipal bond mutual funds saw strong outflows through the remainder of 2013, before investors again sought the relative safety of the asset class in the New Year. For the 12-month period ended April 30, 2014, net outflows were approximately $60 billion (based on data from the Investment Company Institute).
S&P Municipal Bond Index
Total Returns as of April 30, 2014
6 months: 4.24%
12 months: 0.46% | | | |
High levels of interest rate volatility, particularly on the long-end of the curve resulted in a sharp curtailment of tax-exempt issuance in May of 2013 through the end of the period. However, from a historical perspective, total new issuance for the 12 months ended April 30, 2014 remained relatively strong at $300 billion (but meaningfully lower than the $388 billion issued in the prior 12-month period). A significant portion of new supply during this period was attributable to refinancing activity (roughly 40%) as issuers took advantage of lower interest rates to reduce their borrowing costs.
A Closer Look at Yields
From April 30, 2013 to April 30, 2014, muni yields increased by 65 basis points (“bps”) from 2.84% to 3.49% on AAA-rated 30-year municipal bonds, while increasing 61 bps from 1.69% to 2.30% on 10-year bonds and rising another 49 bps from 0.74% to 1.23% on 5-year issues (as measured by Thomson Municipal Market Data). Overall, the municipal yield curve remained relatively steep over the 12-month period as the spread between 2- and 30-year maturities widened by 59 bps and the spread between 2- and 10-year maturities widened by 55 bps.
During the same time period, U.S. Treasury rates rose by 58 bps on 30-year and 98 bps on 10-year bonds, while moving up 100 bps in 5-years. Accordingly, tax-exempt municipal bonds underperformed Treasuries on the long end of the yield curve as investors sought to reduce interest rate risk later in the period. On the short and intermediate parts of the curve, the outperformance of municipal bonds versus Treasuries was driven largely by a supply/demand imbalance within the municipal market and a rotation from long-duration assets (which are more sensitive to interest rate movements) into short- and intermediate-duration investments (which are less sensitive to interest rate movements). Additionally, municipal bonds benefited from the increased appeal of tax-exempt investing in the new higher tax rate environment. The asset class is known for its lower relative volatility and preservation of principal with an emphasis on income as tax rates rise. The municipal market continues to be an attractive avenue for investors seeking yield in today’s environment. However, opportunities have not been as broad-based as in 2011 and 2012, warranting a more tactical approach going forward.
Financial Conditions of Municipal Issuers Continue to Improve
Following an extended period of nation-wide austerity and de-leveraging as states sought to balance their budgets, 15 consecutive quarters of positive revenue growth coupled with the elimination of more than 750,000 jobs in recent years have put state and local governments in a better financial position. Many local municipalities, however, continue to face increased health care and pension costs passed down from the state level. BlackRock maintains the view that municipal bond defaults will be minimal and remain in the periphery, and that the overall market is fundamentally sound. We continue to recognize that careful credit research, appropriate structure and security selection remain imperative amid uncertainty in a modestly improving economic environment.
Past performance is no guarantee of future results. Index performance is shown for illustrative purposes only. You cannot invest directly in an index.
| 4 | ANNUAL REPORT | APRIL 30, 2014
|
| |
| The Benefits and Risks of Leveraging |
|
The Trusts may utilize leverage to seek to enhance the yield and net asset value (“NAV”) of their common shares (“Common Shares”). However, these objectives cannot be achieved in all interest rate environments.
In general, the concept of leveraging is based on the premise that the financing cost of leverage, which will be based on short-term interest rates, will normally be lower than the income earned by a Trust on its longer-term portfolio investments purchased with the proceeds from leverage. To the extent that the total assets of the Trust (including the assets obtained from leverage) are invested in higher-yielding portfolio investments, the Trust’s shareholders will benefit from the incremental net income. The interest earned on securities purchased with the proceeds from leverage is paid to shareholders in the form of dividends, and the value of these portfolio holdings is reflected in the per share NAV.
To illustrate these concepts, assume a Trust’s Common Shares capitalization is $100 million and it utilizes leverage for an additional $30 million, creating a total value of $130 million available for investment in longer-term income securities. If prevailing short-term interest rates are 3% and longer-term interest rates are 6%, the yield curve has a strongly positive slope. In this case, the Trust’s financing costs on the $30 million of proceeds obtained from leverage are based on the lower short-term interest rates. At the same time, the securities purchased by the Trust with the proceeds from leverage earn income based on longer-term interest rates. In this case, the Trust financing cost of leverage is significantly lower than the income earned on the Trust’s longer-term investments acquired from such leverage proceeds, and therefore the holders of Common Shares (“Common Shareholders”) are the beneficiaries of the incremental net income.
However, in order to benefit Common Shareholders, the return on assets purchased with leverage proceeds must exceed the ongoing costs associated with the leverage. If interest and other costs of leverage exceed the Trust’s return on assets purchased with leverage proceeds, income to shareholders will be lower than if the Trust had not used leverage. Furthermore, the value of the Trust’s portfolio investments generally varies inversely with the direction of long-term interest rates, although other factors can influence the value of portfolio investments. In contrast, the value of the Trust’s obligations under its leverage arrangement generally does not fluctuate in relation to interest rates. As a result, changes in interest rates can influence the Trust’s NAVs positively or negatively. Changes in the future direction of interest rates are very difficult to predict accurately, and there is no assurance that a Trust’s intended leveraging strategy will be successful.
Leverage also will generally cause greater changes in the Trusts’ NAVs, market prices and dividend rates than comparable portfolios without leverage. In a declining market, leverage is likely to cause a greater decline in the net asset value and market price of a Trust’s Common Shares than if the Trust were not leveraged. In addition, the Trust may be required to sell portfolio securities at inopportune times or at distressed values in order to comply with regulatory requirements applicable to the use of leverage or as required by the terms of leverage instruments, which may cause the Trust to incur losses. The use of leverage may limit the Trust’s ability to invest in certain types of securities or use certain types of hedging strategies. The Trust will incur expenses in connection with the use of leverage, all of which are borne by Common Shareholders and may reduce income to the Common Shares.
To obtain leverage, each Trust has issued Variable Rate Demand Preferred Shares (“VRDP Shares”), Variable Rate Muni Term Preferred Shares (“VMTP Shares”) or Auction Market Preferred Shares (“AMPS”) (collectively, “Preferred Shares”) and/or leveraged its assets through the use of tender option bond trusts (“TOBs”) as described in the Notes to Financial Statements.
Under the Investment Company Act of 1940 (the “1940 Act”), each Trust is permitted to issue debt up to 331⁄3% of its total managed assets or equity securities (e.g., Preferred Shares) up to 50% of its total managed assets. A Trust may voluntarily elect to limit its leverage to less than the maximum amount permitted under the 1940 Act. In addition, a Trust may also be subject to certain asset coverage, leverage or portfolio composition requirements imposed by the Preferred Shares’ governing instruments or by agencies rating the Preferred Shares, which may be more stringent than those imposed by the 1940 Act.
Derivative Financial Instruments
The Trusts may invest in various derivative financial instruments, including financial futures contracts, as specified in Note 4 of the Notes to Financial Statements, which may constitute forms of economic leverage. Such derivative financial instruments are used to obtain exposure to a security, index and/or market without owning or taking physical custody of securities or to hedge market and/or interest rate risks. Derivative financial instruments involve risks, including the imperfect correlation between the value of a derivative financial instrument and the underlying asset, possible default of the counterparty to the transaction or illiquidity of the derivative financial instrument. The Trusts’ ability to use a derivative financial instrument successfully depends on the investment advisor’s ability to predict pertinent market movements accurately, which cannot be assured. The use of derivative financial instruments may result in losses greater than if they had not been used, may require a Trust to sell or purchase portfolio investments at inopportune times or for distressed values, may limit the amount of appreciation a Trust can realize on an investment, may result in lower dividends paid to shareholders and/or may cause a Trust to hold an investment that it might otherwise sell. The Trusts’ investments in these instruments are discussed in detail in the Notes to Financial Statements.
| ANNUAL REPORT | APRIL 30, 2014 | 5
|
| |
| Trust Summary as of April 30, 2014 | BlackRock Investment Quality Municipal Trust Inc.
|
Trust Overview
BlackRock Investment Quality Municipal Trust Inc.’s (BKN) (the “Trust”) investment objective is to provide high current income exempt from regular federal income tax consistent with the preservation of capital. The Trust seeks to achieve its investment objective by investing at least 80% of its assets in municipal obligations exempt from federal income taxes (except that the interest may be subject to the federal alternative minimum tax). Under normal market conditions, the Trust invests at least 80% of its assets in securities rated investment grade at the time of investment. The Trust may invest directly in such securities or synthetically through the use of derivatives.
No assurance can be given that the Trust’s investment objective will be achieved.
Performance
• | | For the 12-month period ended April 30, 2014, the Trust returned (1.28)% based on market price and 0.41% based on NAV. For the same period, the closed-end Lipper General & Insured Municipal Debt Funds (Leveraged) category posted an average return of (5.00)% based on market price and (0.78)% based on NAV. All returns reflect reinvestment of dividends and/or distributions. The Trust’s discount to NAV, which widened during the period, accounts for the difference between performance based on price and performance based on NAV. The following discussion relates to performance based on NAV. |
• | | The Trust benefited from income generated from coupon payments on its municipal bond holdings. Exposure to corporate and health care credits contributed positively to returns as these sectors were among the better performing during the period. Exposure to the transportation sector also had a positive impact. While the tobacco sector broadly underperformed the market, the Trust’s select tobacco holdings added to performance. |
• | | As interest rates moved sharply higher early in the period, the Trust’s long duration (high sensitivity to interest rate movements) was the most significant detractor from performance. (Bond prices fall when rates rise.) Concentrated exposure on the long-end of the yield curve was detrimental as rates increased more in the long-end than in the short-end of the curve. The Trust’s exposure to local tax-backed issues also had a negative impact on returns. In the beginning of the period, the Trust’s exposure to Puerto Rico government-related credits, although limited, was a detractor from results as credit spreads on these bonds widened materially due to investors’ lack of confidence and a weak local economy. The Trust sold its exposure to these securities early in the period. |
The views expressed reflect the opinions of BlackRock as of the date of this report and are subject to change based on changes in market, economic or other conditions. These views are not intended to be a forecast of future events and are no guarantee of future results.
Trust Information
Symbol on New York Stock Exchange (“NYSE”) | | | | BKN |
Initial Offering Date | | | | February 19, 1993 |
Yield on Closing Market Price as of April 30, 2014 ($14.86)1 | | | | 6.46% |
Tax Equivalent Yield2 | | | | 11.41% |
Current Monthly Distribution per Common Share3 | | | | $0.08 |
Current Annualized Distribution per Common Share3 | | | | $0.96 |
Economic Leverage as of April 30, 20144 | | | | 36% |
| 1 | | Yield on closing market price is calculated by dividing the current annualized distribution per share by the closing market price. Past performance does not guarantee future results. |
| 2 | | Tax equivalent yield assumes the maximum marginal federal tax rate of 43.4%, which includes the 3.8% Medicare tax. Actual tax rates will vary based on income, exemptions and deductions. Lower taxes will result in lower tax equivalent yields. |
| 3 | | The distribution rate is not constant and is subject to change. |
| 4 | | Represents VMTP Shares and TOBs as a percentage of total managed assets, which is the total assets of the Trust, including any assets attributable to VMTP Shares and TOBs, minus the sum of accrued liabilities. For a discussion of leveraging techniques utilized by the Trust, please see The Benefits and Risks of Leveraging on page 5. |
| 6 | ANNUAL REPORT | APRIL 30, 2014
|
| |
| | BlackRock Investment Quality Municipal Trust Inc.
|
Market Price and Net Asset Value Per Share Summary
|
|
|
| 4/30/14
|
| 4/30/13
|
| Change
|
| High
|
| Low
|
Market Price | | | | $ | 14.86 | | | $ | 16.11 | | | | (7.76 | )% | | $ | 16.24 | | | $ | 12.72 | |
Net Asset Value | | | | $ | 15.34 | | | $ | 16.35 | | | | (6.18 | )% | | $ | 16.41 | | | $ | 13.41 | |
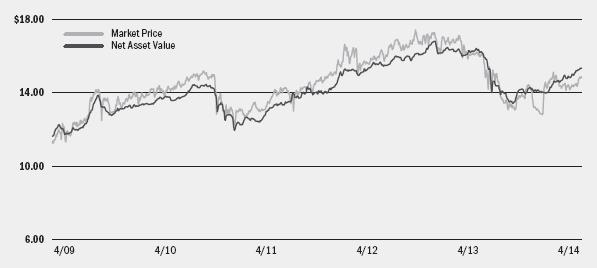
Market Price and Net Asset Value History For the Past Five Years
Overview of the Trust’s Long-Term Investments
Sector Allocation
|
|
|
| 4/30/14
|
| 4/30/13
|
Health | | | | | 24 | % | | | 27 | % |
County/City/Special District/School District | | | | | 15 | | | | 20 | |
Education | | | | | 15 | | | | 11 | |
Transportation | | | | | 14 | | | | 12 | |
Utilities | | | | | 11 | | | | 11 | |
State | | | | | 10 | | | | 11 | |
Corporate | | | | | 8 | | | | 4 | |
Tobacco | | | | | 2 | | | | 2 | |
Housing | | | | | 1 | | | | 2 | |
Credit Quality Allocation1
|
|
|
| 4/30/14
|
| 4/30/13
|
AAA/Aaa | | | | | 6 | % | | | 3 | % |
AA/Aa | | | | | 41 | | | | 35 | |
A | | | | | 37 | | | | 36 | |
BBB/Baa | | | | | 8 | | | | 17 | |
BB/Ba | | | | | 2 | | | | 2 | |
B | | | | | 1 | | | | — | |
Not Rated2 | | | | | 5 | | | | 7 | |
| 1 | | Using the higher of Standard & Poor’s (“S&P’s”) or Moody’s Investors Service (“Moody’s”) ratings. |
| 2 | | The investment advisor has deemed certain of these non-rated securities to be of investment grade quality. As of April 30, 2014 and April 30, 2013, the market value of these securities was $9,623,658, representing 2%, and $18,641,489, representing 4%, respectively, of the Trust’s long-term investments. |
|
|
Call/Maturity Schedule3
|
|
Calendar Year Ended December 31,
| | | | | | |
| |
2014 | | | | | 4 | % |
2015 | | | | | 3 | |
2016 | | | | | 5 | |
2017 | | | | | 3 | |
2018 | | | | | 10 | |
| 3 | | Scheduled maturity dates and/or bonds that are subject to potential calls by issuers over the next five years. |
| ANNUAL REPORT | APRIL 30, 2014 | 7
|
| |
| Trust Summary as of April 30, 2014 | BlackRock Long-Term Municipal Advantage Trust
|
Trust Overview
BlackRock Long-Term Municipal Advantage Trust’s (BTA) (the “Trust”) investment objective is to provide current income exempt from regular federal income tax. The Trust seeks to achieve its investment objective by investing, under normal market conditions, at least 80% of its assets in municipal obligations and derivative instruments with exposure to such municipal obligations, in each case that are exempt from federal income tax (except that the interest may be subject to the federal alternative minimum tax). The Trust invests, under normal market conditions, primarily in long-term municipal bonds with a maturity of more than ten years at the time of investment and, under normal market conditions, the Trust’s municipal bond portfolio will have a dollar-weighted average maturity of greater than 10 years. The Trust may invest directly in such securities or synthetically through the use of derivatives.
No assurance can be given that the Trust’s investment objective will be achieved.
Performance
• | | For the 12-month period ended April 30, 2014, the Trust returned (3.17)% based on market price and 0.28% based on NAV. For the same period, the closed-end Lipper General & Insured Municipal Debt Funds (Leveraged) category posted an average return of (5.00)% based on market price and (0.78)% based on NAV. All returns reflect reinvestment of dividends and/or distributions. The Trust’s discount to NAV, which widened during the period, accounts for the difference between performance based on price and performance based on NAV. The following discussion relates to performance based on NAV. |
• | | During a period in which interest rates increased in earlier half and declined in the latter half, the additional income afforded by the Trust’s use of leverage, a persistently low cost of borrowing and the Trust’s emphasis on credit exposure helped mitigate much of the market-related volatility. The Trust benefited from holding unrated as well as low investment grade and non-investment grade bonds, which exhibited superior performance compared to higher quality investment grade bonds during the period. The Trust’s concentrations in project finance, development district, tobacco, utilities and health care bonds also had a positive impact on results. |
• | | As interest rates moved sharply higher early in the period, the Trust’s duration exposure (sensitivity to interest rate movements) was the most significant detractor from performance. (Bond prices fall when rates rise.) The Trust’s state and local tax-backed and transportation holdings generally produced slightly negative returns for the period. In the beginning of the period, the Trust’s exposure to Puerto Rico government-related credits, although limited, was a detractor from results as credit spreads on these bonds widened materially due to investors’ lack of confidence and a weak local economy. The Trust sold its exposure to these securities during the period. |
The views expressed reflect the opinions of BlackRock as of the date of this report and are subject to change based on changes in market, economic or other conditions. These views are not intended to be a forecast of future events and are no guarantee of future results.
Trust Information
Symbol on NYSE | | | | BTA |
Initial Offering Date | | | | February 28, 2006 |
Yield on Closing Market Price as of April 30, 2014 ($11.29)1 | | | | 6.59% |
Tax Equivalent Yield2 | | | | 11.64% |
Current Monthly Distribution per Common Share3 | | | | $0.062 |
Current Annualized Distribution per Common Share3 | | | | $0.744 |
Economic Leverage as of April 30, 20144 | | | | 36% |
| 1 | | Yield on closing market price is calculated by dividing the current annualized distribution per share by the closing market price. Past performance does not guarantee future results. |
| 2 | | Tax equivalent yield assumes the maximum marginal federal tax rate of 43.4%, which includes the 3.8% Medicare tax. Actual tax rates will vary based on income, exemptions and deductions. Lower taxes will result in lower tax equivalent yields. |
| 3 | | The distribution rate is not constant and is subject to change. |
| 4 | | Represents TOBs as a percentage of total managed assets, which is the total assets of the Trust, including any assets attributable to TOBs, minus the sum of accrued liabilities. For a discussion of leveraging techniques utilized by the Trust, please see The Benefits and Risks of Leveraging on page 5. |
| 8 | ANNUAL REPORT | APRIL 30, 2014
|
| |
| | BlackRock Long-Term Municipal Advantage Trust
|
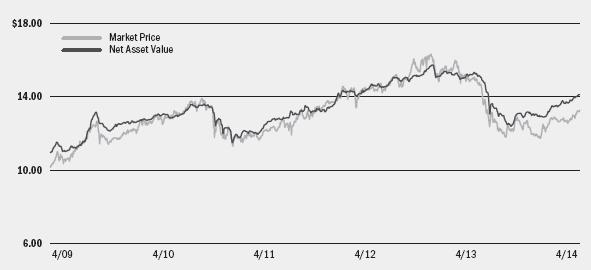
Market Price and Net Asset Value Per Share Summary
|
|
|
| 4/30/14
|
| 4/30/13
|
| Change
|
| High
|
| Low
|
Market Price | | | | $ | 11.29 | | | $ | 12.50 | | | | (9.68 | )% | | $ | 12.55 | | | $ | 9.86 | |
Net Asset Value | | | | $ | 12.02 | | | $ | 12.85 | | | | (6.46 | )% | | $ | 12.88 | | | $ | 10.77 | |
Market Price and Net Asset Value History For the Past Five Years
Overview of the Trust’s Long-Term Investments
Sector Allocation
|
|
|
| 4/30/14
|
| 4/30/13
|
Health | | | | | 22 | % | | | 17 | % |
Utilities | | | | | 18 | | | | 17 | |
Transportation | | | | | 16 | | | | 16 | |
State | | | | | 16 | | | | 7 | |
Education | | | | | 10 | | | | 19 | |
Corporate | | | | | 7 | | | | 4 | |
County/City/Special District/School District | | | | | 5 | | | | 14 | |
Housing | | | | | 3 | | | | 3 | |
Tobacco | | | | | 3 | | | | 3 | |
Credit Quality Allocation1
|
|
|
| 4/30/14
|
| 4/30/13
|
AAA/Aaa | | | | | 14 | % | | | 21 | % |
AA/Aa | | | | | 48 | | | | 48 | |
A | | | | | 19 | | | | 17 | |
BBB/Baa | | | | | 8 | | | | 7 | |
BB/Ba | | | | | 3 | | | | 1 | |
B | | | | | 3 | | | | 1 | |
Not Rated2 | | | | | 5 | | | | 5 | |
| 1 | | Using the higher of S&P’s or Moody’s ratings. |
| 2 | | The investment advisor has deemed certain of these non-rated securities to be of investment grade quality. As of April 30, 2014 and April 30, 2013, the market value of these securities was $1,092,462 and $1,277,033, each representing less than 1%, of the Trust’s long-term investments. |
|
|
Call/Maturity Schedule3
|
|
Calendar Year Ended December 31,
| | | | | | |
| |
2014 | | | | | 4 | % |
2015 | | | | | 8 | |
2016 | | | | | 12 | |
2017 | | | | | 3 | |
2018 | | | | | 3 | |
| 3 | | Scheduled maturity dates and/or bonds that are subject to potential calls by issuers over the next five years. |
| ANNUAL REPORT | APRIL 30, 2014 | 9
|
| |
| Trust Summary as of April 30, 2014 | BlackRock Municipal 2020 Term Trust
|
Trust Overview
BlackRock Municipal 2020 Term Trust’s (BKK) (the “Trust”) investment objectives are to provide current income exempt from regular federal income tax and to return $15 per Common Share (the initial offering price per Common Share) to holders of Common Shares on or about December 31, 2020. The Trust seeks to achieve its investment objectives by investing, under normal market conditions, at least 80% of its assets in municipal bonds exempt from federal income taxes (except that the interest may be subject to the federal alternative minimum tax). The Trust invests, under normal market conditions, at least 80% of its assets in municipal bonds that are investment grade quality at the time of investment. The Trust may invest directly in such securities or synthetically through the use of derivatives.
No assurance can be given that the Trust’s investment objectives will be achieved.
Performance
• | | For the 12-month period ended April 30, 2014, the Trust returned 4.91% based on market price and 1.17% based on NAV. For the same period, the closed-end Lipper Intermediate Municipal Debt Funds category posted an average return of (1.95)% based on market price and 0.41% based on NAV. All returns reflect reinvestment of dividends and/or distributions. The Trust moved from a discount to NAV to a premium by period end, which accounts for the difference between performance based on price and performance based on NAV. The following discussion relates to performance based on NAV. |
• | | The Trust benefited from income generated from coupon payments on its municipal bond holdings. |
• | | The largest detractor from performance was the Trust’s duration exposure (sensitivity to interest rate movements) as tax-exempt municipal rates increased significantly during the first half of the period. (Bond prices fall when rates rise.) However, the Trust is managed to a 2020 maturity date and therefore generally maintains a shorter maturity profile than its Lipper category competitors, which was an advantage to the Trust as rates increased more on the long end of the yield curve. In the beginning of the period, the Trust’s exposure to Puerto Rico government-related credits, although limited, was a detractor from results as credit spreads on these bonds widened materially due to investors’ lack of confidence and a weak local economy. The Trust sold its exposure to these securities early in the period. |
The views expressed reflect the opinions of BlackRock as of the date of this report and are subject to change based on changes in market, economic or other conditions. These views are not intended to be a forecast of future events and are no guarantee of future results.
Trust Information
Symbol on NYSE | | | | BKK |
Initial Offering Date | | | | September 30, 2003 |
Termination Date (on or about) | | | | December 31, 2020 |
Yield on Closing Market Price as of April 30, 2014 ($16.61)1 | | | | 4.50% |
Tax Equivalent Yield2 | | | | 7.95% |
Current Monthly Distribution per Common Share3 | | | | $0.06225 |
Current Annualized Distribution per Common Share3 | | | | $0.74700 |
Economic Leverage as of April 30, 20144 | | | | 18% |
| 1 | | Yield on closing market price is calculated by dividing the current annualized distribution per share by the closing market price. Past performance does not guarantee future results. |
| 2 | | Tax equivalent yield assumes the maximum marginal federal tax rate of 43.4%, which includes the 3.8% Medicare tax. Actual tax rates will vary based on income, exemptions and deductions. Lower taxes will result in lower tax equivalent yields. |
| 3 | | The distribution rate is not constant and is subject to change. |
| 4 | | Represents AMPS and TOBs as a percentage of total managed assets, which is the total assets of the Trust, including any assets attributable to AMPS and TOBs, minus the sum of accrued liabilities. For a discussion of leveraging techniques utilized by the Trust, please see The Benefits and Risks of Leveraging on page 5. |
| 10 | ANNUAL REPORT | APRIL 30, 2014
|
| |
| | BlackRock Municipal 2020 Term Trust
|
Market Price and Net Asset Value Per Share Summary
|
|
|
| 4/30/14
|
| 4/30/13
|
| Change
|
| High
|
| Low
|
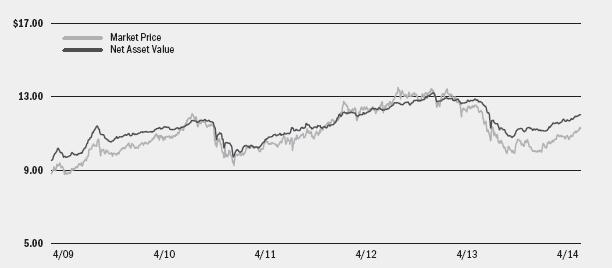
Market Price | | | | $ | 16.61 | | | $ | 16.64 | | | | (0.18 | )% | | $ | 17.08 | | | $ | 15.46 | |
Net Asset Value | | | | $ | 16.22 | | | $ | 16.85 | | | | (3.74 | )% | | $ | 16.87 | | | $ | 15.65 | |
Market Price and Net Asset Value History For the Past Five Years
Overview of the Trust’s Long-Term Investments
Sector Allocation
|
|
|
| 4/30/14
|
| 4/30/13
|
Transportation | | | | | 16 | % | | | 16 | % |
Utilities | | | | | 16 | | | | 15 | |
State | | | | | 15 | | | | 14 | |
Corporate | | | | | 15 | | | | 12 | |
Health | | | | | 12 | | | | 14 | |
County/City/Special District/School District | | | | | 11 | | | | 13 | |
Education | | | | | 7 | | | | 5 | |
Housing | | | | | 5 | | | | 5 | |
Tobacco | | | | | 3 | | | | 6 | |
Credit Quality Allocation1
|
|
|
| 4/30/14
|
| 4/30/13
|
AAA/Aaa | | | | | 9 | % | | | 11 | % |
AA/Aa | | | | | 25 | | | | 23 | |
A | | | | | 44 | | | | 37 | |
BBB/Baa | | | | | 14 | | | | 18 | |
BB/Ba | | | | | 1 | | | | 1 | |
Not Rated2 | | | | | 7 | | | | 10 | |
| 1 | | Using the higher of S&P’s or Moody’s ratings. |
| 2 | | The investment advisor has deemed certain of these non-rated securities to be of investment grade quality. As of April 30, 2014 and April 30, 2013, the market value of these securities was $7,117,114, representing 2%, and $19,936,315, representing 4%, respectively, of the Trust’s long-term investments. |
|
|
Call/Maturity Schedule3
|
|
Calendar Year Ended December 31,
| | | | | | |
| |
2014 | | | | | 4 | % |
2015 | | | | | 3 | |
2016 | | | | | 11 | |
2017 | | | | | 1 | |
2018 | | | | | 3 | |
| 3 | | Scheduled maturity dates and/or bonds that are subject to potential calls by issuers over the next five years. |
| ANNUAL REPORT | APRIL 30, 2014 | 11
|
| |
| Trust Summary as of April 30, 2014 | BlackRock Municipal Income Trust
|
Trust Overview
BlackRock Municipal Income Trust’s (BFK) (the “Trust”) investment objective is to provide current income exempt from regular federal income tax. The Trust seeks to achieve its investment objective by investing primarily in municipal bonds exempt from federal income taxes (except that the interest may be subject to the federal alternative minimum tax). The Trust invests, under normal market conditions, at least 80% of its assets in municipal bonds that are investment grade quality at the time of investment. The Trust may invest directly in such securities or synthetically through the use of derivatives.
No assurance can be given that the Trust’s investment objective will be achieved.
Performance
• | | For the 12-month period ended April 30, 2014, the Trust returned (5.59)% based on market price and (0.72)% based on NAV. For the same period, the closed-end Lipper General & Insured Municipal Debt Funds (Leveraged) category posted an average return of (5.00)% based on market price and (0.78)% based on NAV. All returns reflect reinvestment of dividends and/or distributions. The Trust began the period trading at neither a premium nor discount to NAV and moved to discount by period end, which accounts for the difference between performance based on price and performance based on NAV. The following discussion relates to performance based on NAV. |
• | | As interest rates moved sharply higher early in the period, the Trust’s duration exposure (sensitivity to interest rate movements) was the most significant detractor from performance. (Bond prices fall when rates rise.) The Trust’s state and local tax-backed and transportation holdings generally produced negative returns for the period. In the beginning of the period, the Trust’s exposure to Puerto Rico government-related credits, although limited, was a detractor from results as credit spreads on these bonds widened materially due to investors’ lack of confidence and a weak local economy. The Trust sold its exposure to these securities during the period. |
• | | During a period in which interest rates increased in earlier half and declined in the latter half, the additional income afforded by the Trust’s use of leverage, a persistently low cost of borrowing and the Trust’s emphasis on credit exposure helped mitigate much of the market-related volatility. The Trust benefited from holding unrated as well as low investment grade and non-investment grade bonds, which exhibited superior performance compared to higher quality investment grade bonds during the period. The Trust’s concentrations in utilities, tobacco, project finance and corporate-related debt also had a positive impact on results. |
The views expressed reflect the opinions of BlackRock as of the date of this report and are subject to change based on changes in market, economic or other conditions. These views are not intended to be a forecast of future events and are no guarantee of future results.
Trust Information
Symbol on NYSE | | | | BFK |
Initial Offering Date | | | | July 27, 2001 |
Yield on Closing Market Price as of April 30, 2014 ($13.57)1 | | | | 6.64% |
Tax Equivalent Yield2 | | | | 11.73% |
Current Monthly Distribution per Common Share3 | | | | $0.0751 |
Current Annualized Distribution per Common Share3 | | | | $0.9012 |
Economic Leverage as of April 30, 20144 | | | | 38% |
| 1 | | Yield on closing market price is calculated by dividing the current annualized distribution per share by the closing market price. Past performance does not guarantee future results. |
| 2 | | Tax equivalent yield assumes the maximum marginal federal tax rate of 43.4%, which includes the 3.8% Medicare tax. Actual tax rates will vary based on income, exemptions and deductions. Lower taxes will result in lower tax equivalent yields. |
| 3 | | The distribution rate is not constant and is subject to change. |
| 4 | | Represents VMTP Shares and TOBs as a percentage of total managed assets, which is the total assets of the Trust, including any assets attributable to VMTP Shares and TOBs, minus the sum of accrued liabilities. For a discussion of leveraging techniques utilized by the Trust, please see The Benefits and Risks of Leveraging on page 5. |
| 12 | ANNUAL REPORT | APRIL 30, 2014
|
| |
| | BlackRock Municipal Income Trust
|
Market Price and Net Asset Value Per Share Summary
|
|
|
| 4/30/14
|
| 4/30/13
|
| Change
|
| High
|
| Low
|
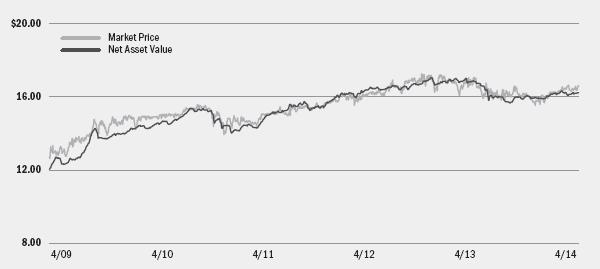
Market Price | | | | $ | 13.57 | | | $ | 15.40 | | | | (11.88 | )% | | $ | 15.58 | | | $ | 11.95 | |
Net Asset Value | | | | $ | 14.27 | | | $ | 15.40 | | | | (7.34 | )% | | $ | 15.44 | | | $ | 12.58 | |
Market Price and Net Asset Value History For the Past Five Years
Overview of the Trust’s Long-Term Investments
Sector Allocation
|
|
|
| 4/30/14
|
| 4/30/13
|
Transportation | | | | | 19 | % | | | 22 | % |
Health | | | | | 18 | | | | 19 | |
Utilities | | | | | 16 | | | | 15 | |
State | | | | | 11 | | | | 12 | |
County/City/Special District/School District | | | | | 11 | | | | 11 | |
Corporate | | | | | 10 | | | | 9 | |
Education | | | | | 9 | | | | 7 | |
Tobacco | | | | | 4 | | | | 3 | |
Housing | | | | | 2 | | | | 2 | |
Credit Quality Allocation1
|
|
|
| 4/30/14
|
| 4/30/13
|
AAA/Aaa | | | | | 11 | % | | | 10 | % |
AA/Aa | | | | | 34 | | | | 35 | |
A | | | | | 28 | | | | 27 | |
BBB/Baa | | | | | 14 | | | | 17 | |
BB/Ba | | | | | 3 | | | | 1 | |
B | | | | | 2 | | | | 2 | |
Not Rated2 | | | | | 8 | | | | 8 | |
| 1 | | Using the higher of S&P’s or Moody’s ratings. |
| 2 | | The investment advisor has deemed certain of these non-rated securities to be of investment grade quality. As of April 30, 2014 and April 30, 2013, the market value of these securities was $10,907,913, representing 1%, and $31,712,268, representing 3%, respectively, of the Trust’s long-term investments. |
|
|
Call/Maturity Schedule3
|
|
Calendar Year Ended December 31,
| | | | | | |
| |
2014 | | | | | 7 | % |
2015 | | | | | 2 | |
2016 | | | | | 6 | |
2017 | | | | | 4 | |
2018 | | | | | 4 | |
| 3 | | Scheduled maturity dates and/or bonds that are subject to potential calls by issuers over the next five years. |
| ANNUAL REPORT | APRIL 30, 2014 | 13
|
| |
| Trust Summary as of April 30, 2014 | BlackRock Pennsylvania Strategic Municipal Trust
|
Trust Overview
BlackRock Pennsylvania Strategic Municipal Trust’s (BPS) (the “Trust”) investment objectives are to provide current income that is exempt from regular federal and Pennsylvania income taxes and to invest in municipal bonds that over time will perform better than the broader Pennsylvania municipal bond market. The Trust seeks to achieve its investment objectives by investing, under normal market conditions, primarily in municipal bonds exempt from federal income taxes (except that the interest may be subject to the federal alternative minimum tax) and Pennsylvania income taxes. The Trust invests, under normal market conditions, at least 80% of its assets in municipal bonds that are investment grade quality at the time of investment. The Trust may invest directly in such securities or synthetically through the use of derivatives.
No assurance can be given that the Trust’s investment objectives will be achieved.
Performance
• | | For the 12-month period ended April 30, 2014, the Trust returned (8.64)% based on market price and (2.24)% based on NAV. For the same period, the closed-end Lipper Pennsylvania Municipal Debt Funds category posted an average return of (2.81)% based on market price and (0.76)% based on NAV. All returns reflect reinvestment of dividends and/or distributions. The Trust’s discount to NAV, which widened during the period, accounts for the difference between performance based on price and performance based on NAV. The following discussion relates to performance based on NAV. |
• | | The largest detractor from performance was the Trust’s duration exposure (sensitivity to interest rate movements) as tax-exempt municipal rates increased significantly during the first half of the period. (Bond prices fall when rates rise.) During the second half of the period, however, intermediate and long-term rates fell, resulting in less significant rate increases for the overall annual period. The Trust’s exposure to the long-end of the yield curve also detracted from performance, especially in the first half of the period when shorter rates (two to five years) rose less than long rates (twenty years and longer). In the beginning of the period, the Trust’s exposure to Puerto Rico government-related credits, although limited, was a detractor from results as credit spreads on these bonds widened materially due to investors’ lack of confidence and a weak local economy. The Trust sold its exposure to these securities early in the period. |
• | | The Trust benefited from income generated from coupon payments on its municipal bond holdings. |
The views expressed reflect the opinions of BlackRock as of the date of this report and are subject to change based on changes in market, economic or other conditions. These views are not intended to be a forecast of future events and are no guarantee of future results.
Trust Information
Symbol on NYSE MKT | | | | BPS |
Initial Offering Date | | | | August 25, 1999 |
Yield on Closing Market Price as of April 30, 2014 ($12.90)1 | | | | 5.67% |
Tax Equivalent Yield2 | | | | 10.34% |
Current Monthly Distribution per Common Share3 | | | | $0.061 |
Current Annualized Distribution per Common Share3 | | | | $0.732 |
Economic Leverage as of April 30, 20144 | | | | 37% |
| 1 | | Yield on closing market price is calculated by dividing the current annualized distribution per share by the closing market price. Past performance does not guarantee future results. |
| 2 | | Tax equivalent yield assumes the maximum marginal federal and state tax rate of 45.14%, which includes the 3.8% Medicare tax. Actual tax rates will vary based on income, exemptions and deductions. Lower taxes will result in lower tax equivalent yields. |
| 3 | | The distribution rate is not constant and is subject to change. |
| 4 | | Represents VRDP Shares and TOBs as a percentage of total managed assets, which is the total assets of the Trust, including any assets attributable to VRDP Shares and TOBs, minus the sum of accrued liabilities. For a discussion of leveraging techniques utilized by the Trust, please see The Benefits and Risks of Leveraging on page 5. |
| 14 | ANNUAL REPORT | APRIL 30, 2014
|
| |
| | BlackRock Pennsylvania Strategic Municipal Trust
|
Market Price and Net Asset Value Per Share Summary
|
|
|
| 4/30/14
|
| 4/30/13
|
| Change
|
| High
|
| Low
|
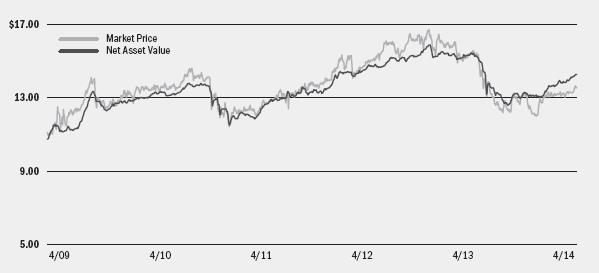
Market Price | | | | $ | 12.90 | | | $ | 15.04 | | | | (14.23 | )% | | $ | 15.69 | | | $ | 11.11 | |
Net Asset Value | | | | $ | 14.18 | | | $ | 15.45 | | | | (8.22 | )% | | $ | 15.51 | | | $ | 12.64 | |
Market Price and Net Asset Value History For the Past Five Years
Overview of the Trust’s Long-Term Investments
Sector Allocation
|
|
|
| 4/30/14
|
| 4/30/13
|
Health | | | | | 24 | % | | | 29 | % |
Education | | | | | 19 | | | | 16 | |
State | | | | | 16 | | | | 17 | |
Transportation | | | | | 13 | | | | 13 | |
Housing | | | | | 11 | | | | 10 | |
County/City/Special District/School District | | | | | 11 | | | | 7 | |
Corporate | | | | | 3 | | | | 3 | |
Utilities | | | | | 3 | | | | 5 | |
Credit Quality Allocation1
|
|
|
| 4/30/14
|
| 4/30/13
|
AAA/Aaa | | | | | 2 | % | | | 1 | % |
AA/Aa | | | | | 63 | | | | 62 | |
A | | | | | 24 | | | | 27 | |
BBB/Baa | | | | | 9 | | | | 8 | |
Not Rated2 | | | | | 2 | | | | 2 | |
| 1 | | Using the higher of S&P’s or Moody’s ratings. |
| 2 | | The investment advisor has deemed certain of these non-rated securities to be of investment grade quality. As of April 30, 2014 and April 30, 2013, the market value of these securities was $537,960 and $561,020, each representing 1%, respectively, of the Trust’s long-term investments. |
|
|
Call/Maturity Schedule3
|
|
Calendar Year Ended December 31,
| | | | | | |
| |
2014 | | | | | 4 | % |
2015 | | | | | 3 | |
2016 | | | | | 5 | |
2017 | | | | | 1 | |
2018 | | | | | 9 | |
| 3 | | Scheduled maturity dates and/or bonds that are subject to potential calls by issuers over the next five years. |
| ANNUAL REPORT | APRIL 30, 2014 | 15
|
| |
| Trust Summary as of April 30, 2014 | BlackRock Strategic Municipal Trust
|
Trust Overview
BlackRock Strategic Municipal Trust’s (BSD) (the “Trust”) investment objectives are to provide current income that is exempt from regular federal income tax and to invest in municipal bonds that over time will perform better than the broader municipal bond market. The Trust seeks to achieve its investment objective by investing, under normal market conditions, at least 80% of its assets in investments exempt from federal income taxes (except that the interest may be subject to the federal alternative minimum tax). The Trust invests at least 80% of its assets in investment grade quality securities at the time of investment and, under normal market conditions, primarily invests in municipal bonds with long-term maturities in order to maintain a weighted average maturity of 15 years or more. The Trust may invest directly in such securities or synthetically through the use of derivatives.
No assurance can be given that the Trust’s investment objectives will be achieved.
Performance
• | | For the 12-month period ended April 30, 2014, the Trust returned (4.99)% based on market price and (0.94)% based on NAV. For the same period, the closed-end Lipper General & Insured Municipal Debt Funds (Leveraged) category posted an average return of (5.00)% based on market price and (0.78)% based on NAV. All returns reflect reinvestment of dividends and/or distributions. The Trust’s discount to NAV, which widened during the period, accounts for the difference between performance based on price and performance based on NAV. The following discussion relates to performance based on NAV. |
• | | As interest rates moved sharply higher early in the period, the Trust’s duration exposure (sensitivity to interest rate movements) was the most significant detractor from performance. (Bond prices fall when rates rise.) The Trust’s state and local tax-backed and transportation holdings generally produced negative returns for the period. In the beginning of the period, the Trust’s exposure to Puerto Rico government-related credits, although limited, was a detractor from results as credit spreads on these bonds widened materially due to investors’ lack of confidence and a weak local economy. The Trust sold its exposure to these securities during the period. Additionally, the Trust’s holdings of various higher quality investment grade bonds generated modestly negative returns. |
• | | During a period in which interest rates increased in earlier half and declined in the latter half, the additional income afforded by the Trust’s use of leverage, a persistently low cost of borrowing and the Trust’s emphasis on credit exposure helped mitigate much of the market-related volatility. The Trust benefited from holding unrated as well as low investment grade and non-investment grade bonds, which exhibited superior performance compared to higher quality investment grade bonds during the period. The Trust’s concentrations in utilities, education, tobacco and corporate-related debt also had a positive impact on results. |
The views expressed reflect the opinions of BlackRock as of the date of this report and are subject to change based on changes in market, economic or other conditions. These views are not intended to be a forecast of future events and are no guarantee of future results.
Trust Information
Symbol on NYSE | | | | BSD |
Initial Offering Date | | | | August 25, 1999 |
Yield on Closing Market Price as of April 30, 2014 ($13.26)1 | | | | 6.70% |
Tax Equivalent Yield2 | | | | 11.84% |
Current Monthly Distribution per Common Share3 | | | | $0.074 |
Current Annualized Distribution per Common Share3 | | | | $0.888 |
Economic Leverage as of April 30, 20144 | | | | 38% |
| 1 | | Yield on closing market price is calculated by dividing the current annualized distribution per share by the closing market price. Past performance does not guarantee future results. |
| 2 | | Tax equivalent yield assumes the maximum marginal federal tax rate of 43.4%, which includes the 3.8% Medicare tax. Actual tax rates will vary based on income, exemptions and deductions. Lower taxes will result in lower tax equivalent yields. |
| 3 | | The distribution rate is not constant and is subject to change. |
| 4 | | Represents VMTP Shares and TOBs as a percentage of total managed assets, which is the total assets of the Trust, including any assets attributable to VMTP Shares and TOBs, minus the sum of accrued liabilities. For a discussion of leveraging techniques utilized by the Trust, please see The Benefits and Risks of Leveraging on page 5. |
| 16 | ANNUAL REPORT | APRIL 30, 2014
|
| |
| | BlackRock Strategic Municipal Trust
|
Market Price and Net Asset Value Per Share Summary
|
|
|
| 4/30/14
|
| 4/30/13
|
| Change
|
| High
|
| Low
|
Market Price | | | | $ | 13.26 | | | $ | 14.97 | | | | (11.42 | )% | | $ | 15.08 | | | $ | 11.66 | |
Net Asset Value | | | | $ | 14.11 | | | $ | 15.28 | | | | (7.66 | )% | | $ | 15.33 | | | $ | 12.38 | |
Market Price and Net Asset Value History For the Past Five Years
Overview of the Trust’s Long-Term Investments
Sector Allocation
|
|
|
| 4/30/14
|
| 4/30/13
|
Transportation | | | | | 21 | % | | | 23 | % |
Health | | | | | 20 | | | | 22 | |
Utilities | | | | | 13 | | | | 12 | |
State | | | | | 11 | | | | 13 | |
Education | | | | | 11 | | | | 9 | |
County/City/Special District/School District | | | | | 10 | | | | 11 | |
Corporate | | | | | 10 | | | | 8 | |
Tobacco | | | | | 4 | | | | 2 | |
Credit Quality Allocation1
|
|
|
| 4/30/14
|
| 4/30/13
|
AAA/Aaa | | | | | 12 | % | | | 13 | % |
AA/Aa | | | | | 36 | | | | 37 | |
A | | | | | 26 | | | | 24 | |
BBB/Baa | | | | | 12 | | | | 16 | |
BB/Ba | | | | | 4 | | | | 2 | |
B | | | | | 3 | | | | 1 | |
Not Rated2 | | | | | 7 | | | | 7 | |
| 1 | | Using the higher of S&P’s or Moody’s ratings. |
| 2 | | The investment advisor has deemed certain of these non-rated securities to be of investment grade quality. As of April 30, 2014 and April 30, 2013, the market value of these securities was $2,878,997 and $5,654,223, each representing 2% and 3% respectively, of the Trust’s long-term investments. |
|
|
Call/Maturity Schedule3
|
|
Calendar Year Ended December 31,
| | | | | | |
| |
2014 | | | | | 4 | % |
2015 | | | | | 3 | |
2016 | | | | | 8 | |
2017 | | | | | 5 | |
2018 | | | | | 7 | |
| 3 | | Scheduled maturity dates and/or bonds that are subject to potential calls by issuers over the next five years. |
| ANNUAL REPORT | APRIL 30, 2014 | 17
|
| |
| Schedule of Investments April 30, 2014 | BlackRock Investment Quality Municipal Trust Inc. (BKN)
(Percentages shown are based on Net Assets)
|
| | | | | | | |
| Municipal Bonds | | | | Par
(000) | | Value |
Alabama — 1.5% | | | | | | | | | | |
City of Birmingham Alabama Special Care Facilities Financing Authority, RB, Children’s Hospital (AGC): | | | | | | | | | | |
6.00%, 6/01/34 | | | | $ | 1,745 | | | $ | 2,015,510 | |
6.00%, 6/01/39 | | | | | 500 | | | | 577,510 | |
City of Hoover Alabama Board of Education, Refunding, Special Tax, Capital Outlay Warrants, 4.25%, 2/15/40 | | | | | 1,275 | | | | 1,287,329 | |
| | | | | | | | | 3,880,349 | |
Arizona — 7.3% | | | | | | | | | | |
Arizona Board of Regents, RB, Arizona State University, Series C, 5.50%, 7/01/26 | | | | | 475 | | | | 550,839 | |
Arizona Health Facilities Authority, Refunding RB, Phoenix Children’s Hospital, Series A, 5.00%, 2/01/42 | | | | | 3,300 | | | | 3,380,718 | |
County of Pima Arizona IDA, Refunding, IDRB, Tucson Electric Power Co. Project, Remarketing, Series B, 5.75%, 9/01/29 | | | | | 1,375 | | | | 1,401,647 | |
County of Pinal Arizona Electric District No. 3, Refunding RB, Electric System, 4.75%, 7/01/31 | | | | | 3,750 | | | | 3,966,750 | |
Salt Verde Financial Corp., RB, Senior: | | | | | | | | | | |
5.00%, 12/01/32 | | | | | 1,035 | | | | 1,134,018 | |
5.00%, 12/01/37 | | | | | 4,585 | | | | 5,021,630 | |
State of Arizona, COP, Department of Administration, Series A (AGM), 5.00%, 10/01/29 | | | | | 1,100 | | | | 1,196,635 | |
University Medical Center Corp. RB, 6.50%, 7/01/39 | | | | | 750 | | | | 827,160 | |
University Medical Center Corp., Refunding RB, 6.00%, 7/01/39 | | | | | 1,600 | | | | 1,726,256 | |
| | | | | | | | | 19,205,653 | |
Arkansas — 2.2% | | | | | | | | | | |
Arkansas State University, RB, Jonesboro Campus, Series B: | | | | | | | | | | |
4.00%, 12/01/28 | | | | | 600 | | | | 625,230 | |
4.88%, 12/01/43 | | | | | 1,010 | | | | 1,057,621 | |
City of Benton Arkansas, RB: | | | | | | | | | | |
4.00%, 6/01/39 | | | | | 1,355 | | | | 1,369,553 | |
4.38%, 6/01/44 | | | | | 725 | | | | 740,167 | |
City of Hot Springs Arkansas, RB, Wastewater, 5.00%, 12/01/38 | | | | | 1,800 | | | | 1,934,676 | |
| | | | | | | | | 5,727,247 | |
California — 17.8% | | | | | | | | | | |
California Health Facilities Financing Authority, RB, Sutter Health, Series B, 5.88%, 8/15/31 | | | | | 2,300 | | | | 2,729,226 | |
Carlsbad California Unified School District, GO, Election of 2006, Series B, 0.00%, 5/01/34 (a) | | | | | 1,500 | | | | 1,255,935 | |
City of San Jose California, Refunding ARB, Series A-1, AMT, 5.75%, 3/01/34 | | | | | 3,000 | | | | 3,336,060 | |
County of Sacramento California, ARB, Senior Series A, 5.00%, 7/01/41 | | | | | 2,100 | | | | 2,212,602 | |
County of Stanislaus California Tobacco Securitization Agency, RB, CAB, County of Stanislaus Tobacco Funding Cop., Sub-Series C, 0.00%, 6/01/55 (b) | | | | | 7,090 | | | | 88,625 | |
| | | | | | | |
| Municipal Bonds | | | | Par
(000) | | Value |
California (concluded) | | | | | | | | | | |
Dinuba California Unified School District, GO, Election of 2006 (AGM): | | | | | | | | | | |
5.63%, 8/01/31 | | | | $ | 250 | | | $ | 271,153 | |
5.75%, 8/01/33 | | | | | 535 | | | | 581,299 | |
Hartnell Community College District California, GO, CAB, Election of 2002, Series D, 0.00%, 8/01/34 (a) | | | | | 2,475 | | | | 1,855,631 | |
| Norwalk-La Mirada Unified School District, GO, Refunding, CAB, Election of 2002, Series E (AGC), 0.00%, 8/01/38 (b) | | | | | 12,000 | | | | 3,537,840 | |
Palomar Community College District, GO, CAB, Election of 2006, Series B: | | | | | | | | | | |
0.00%, 8/01/30 (b) | | | | | 2,270 | | | | 1,113,639 | |
0.00%, 8/01/33 (b) | | | | | 4,250 | | | | 1,439,390 | |
0.00%, 8/01/39 (a) | | | | | 3,000 | | | | 1,830,450 | |
San Diego Community College District, GO, CAB, Election of 2002, 0.00%, 8/01/33 (a) | | | | | 4,200 | | | | 3,573,066 | |
San Jose California Evergreen Community College District, GO, Election of 2010, Series B, 3.50%, 8/01/32 | | | | | 1,800 | | | | 1,709,550 | |
| State of California, GO, Refunding, Various Purposes: | | | | | | | | | | |
5.00%, 2/01/38 | | | | | 2,000 | | | | 2,170,960 | |
(NPFGC), 5.00%, 6/01/37 | | | | | 5,000 | | | | 5,306,200 | |
State of California, GO: | | | | | | | | | | |
5.75%, 4/01/31 | | | | | 3,000 | | | | 3,504,600 | |
6.00%, 3/01/33 | | | | | 2,270 | | | | 2,720,686 | |
6.50%, 4/01/33 | | | | | 2,900 | | | | 3,534,317 | |
5.50%, 3/01/40 | | | | | 3,650 | | | | 4,139,209 | |
| | | | | | | | | 46,910,438 | |
Colorado — 1.6% | | | | | | | | | | |
Denver Health & Hospital Authority, RB, Series A, 4.25%, 12/01/33 (c) | | | | | 385 | | | | 377,955 | |
Park Creek Metropolitan District, Refunding RB, Senior Limited Property Tax (AGM), 6.00%, 12/01/38 | | | | | 750 | | | | 827,392 | |
University of Northern Colorado, Refunding RB, Series A, 4.00%, 6/01/35 | | | | | 3,000 | | | | 3,024,750 | |
| | | | | | | | | 4,230,097 | |
Connecticut — 0.8% | | | | | | | | | | |
Connecticut State Health & Educational Facility Authority, Refunding RB: | | | | | | | | | | |
Hartford Healthcare, Series A, 5.00%, 7/01/32 | | | | | 1,000 | | | | 1,054,090 | |
Lawrence & Memorial Hospital, Series F, 5.00%, 7/01/36 | | | | | 950 | | | | 1,000,787 | |
| | | | | | | | | 2,054,877 | |
Delaware — 0.7% | | | | | | | | | | |
County of Sussex Delaware, RB, NRG Energy, Inc., Indian River Power LLC Project, 6.00%, 10/01/40 | | | | | 1,800 | | | | 1,926,270 | |
District of Columbia — 0.5% | | | | | | | | | | |
Metropolitan Washington Airports Authority, Refunding RB, Series A, 5.00%, 10/01/35 | | | | | 1,155 | | | | 1,244,166 | |
Portfolio Abbreviations
| AGC | Assured Guarantee Corp. | ERB | Education Revenue Bonds | LRB | Lease Revenue Bonds |
| AGM | Assured Guaranty Municipal Corp. | GARB | General Airport Revenue Bonds | M/F | Multi-Family |
| AMBAC | American Municipal Bond Assurance Corp. | GO | General Obligation Bonds | NPFGC | National Public Finance Guarantee Corp. |
| AMT | Alternative Minimum Tax (subject to) | HDA | Housing Development Authority | PILOT | Payment in Lieu of Taxes |
| ARB | Airport Revenue Bonds | HFA | Housing Finance Agency | RB | Revenue Bonds |
| CAB | Capital Appreciation Bonds | HRB | Housing Revenue Bonds | S/F | Single-Family |
| COP | Certificates of Participation | IDA | Industrial Development Authority | SAN | State Aid Notes |
| EDA | Economic Development Authority | IDB | Industrial Development Board | SBPA | Stand-by Bond Purchase Agreements |
| EDC | Economic Development Corp. | IDRB | Industrial Development Revenue Bond | VRDN | Variable Rate Demand Notes |
See Notes to Financial Statements.
| 18 | ANNUAL REPORT | APRIL 30, 2014
|
| |
| Schedule of Investments (continued) | BlackRock Investment Quality Municipal Trust Inc. (BKN)
(Percentages shown are based on Net Assets)
|
| Municipal Bonds | | | | Par
(000) | | Value |
Florida — 11.3% | | | | | | | | | | |
County of Hillsborough Florida IDA, RB, National Gypsum Co., Series A, AMT, 7.13%, 4/01/30 | | | | $ | 3,700 | | | $ | 3,716,650 | |
County of Lee Florida, Refunding ARB, Series A, AMT (AGM), 5.00%, 10/01/28 | | | | | 3,000 | | | | 3,235,170 | |
County of Miami-Dade Florida, RB: | | | | | | | | | | |
CAB, Sub-Series A (NPFGC), 0.00%, 10/01/32 (b) | | | | | 4,225 | | | | 1,643,525 | |
CAB, Sub-Series A (NPFGC), 0.00%, 10/01/33 (b) | | | | | 4,000 | | | | 1,464,960 | |
CAB, Sub-Series A (NPFGC), 0.00%, 10/01/34 (b) | | | | | 4,580 | | | | 1,586,466 | |
CAB, Sub-Series A (NPFGC), 0.00%, 10/01/35 (b) | | | | | 5,000 | | | | 1,640,900 | |
CAB, Subordinate Special Obligation, 0.00%, 10/01/32 (b) | | | | | 5,000 | | | | 1,981,050 | |
CAB, Subordinate Special Obligation, 0.00%, 10/01/33 (b) | | | | | 15,375 | | | | 5,738,411 | |
Series B, AMT, 6.00%, 10/01/32 | | | | | 3,000 | | | | 3,406,410 | |
County of Orange Florida Health Facilities Authority, Refunding RB, Mayflower Retirement Center, 5.00%, 6/01/32 | | | | | 200 | | | | 206,002 | |
County of Orange Florida Tourist Development Tax Revenue, Refunding RB, 4.75%, 10/01/32 | | | | | 5,000 | | | | 5,238,500 | |
| | | | | | | | | 29,858,044 | |
Georgia — 0.6% | | | | | | | | | | |
County of Milledgeville & Baldwin Georgia Development Authority, RB, Georgia College & State University Foundation, 6.00%, 9/01/14 (d) | | | | | 1,500 | | | | 1,544,505 | |
Hawaii — 0.2% | | | | | | | | | | |
Hawaii State Department of Budget & Finance, Refunding RB, Special Purpose, Senior Living, Kahala Nui, 5.25%, 11/15/37 | | | | | 600 | | | | 630,738 | |
Idaho — 1.1% | | | | | | | | | | |
Idaho Health Facilities Authority, Refunding RB, Trinity Health Group, Series B, 6.25%, 12/01/33 | | | | | 2,500 | | | | 2,905,800 | |
Illinois — 11.3% | | | | | | | | | | |
Chicago Public Building Commission, RB, Series A (NPFGC), 7.00%, 1/01/20 (e) | | | | | 5,000 | | | | 6,308,600 | |
City of Chicago Illinois, Refunding ARB, O’Hare International Airport Passenger Facility Charge, Series B, AMT, 4.00%, 1/01/29 | | | | | 6,000 | | | | 5,857,740 | |
City of Chicago Illinois Transit Authority, RB, Sales Tax Receipts, 5.25%, 12/01/40 | | | | | 1,000 | | | | 1,067,570 | |
Illinois Finance Authority, RB: | | | | | | | | | | |
Northwestern Memorial Hospital, Series A, 5.50%, 8/15/14 (d) | | | | | 3,000 | | | | 3,046,560 | |
Rush University Medical Center, Series C, 6.63%, 11/01/39 | | | | | 1,200 | | | | 1,358,388 | |
Illinois Finance Authority, Refunding RB: | | | | | | | | | | |
Friendship Village Schaumburg, Series A, 5.63%, 2/15/37 | | | | | 345 | | | | 318,849 | |
OSF Healthcare System, Series A, 6.00%, 5/15/39 | | | | | 1,490 | | | | 1,658,638 | |
Roosevelt University Project, 6.50%, 4/01/44 | | | | | 1,500 | | | | 1,552,365 | |
Railsplitter Tobacco Settlement Authority, RB: | | | | | | | | | | |
6.25%, 6/01/24 | | | | | 5,000 | | | | 5,533,550 | |
6.00%, 6/01/28 | | | | | 1,700 | | | | 1,972,714 | |
State of Illinois, GO, 5.00%, 2/01/39 | | | | | 1,000 | | | | 1,035,850 | |
| | | | | | | | | 29,710,824 | |
Indiana — 0.5% | | | | | | | | | | |
Indiana Finance Authority, Refunding RB, US Steel Corp. Project, 6.00%, 12/01/26 | | | | | 1,350 | | | | 1,404,945 | |
Iowa — 1.5% | | | | | | | | | | |
Iowa Higher Education Loan Authority, RB, Private College Facility, Buena Vista University Project, 5.00%, 4/01/31 | | | | | 1,355 | | | | 1,447,980 | |
Iowa Higher Education Loan Authority, Refunding RB, Private College Facility, Upper Iowa University Project: | | | | | | | | | | |
5.75%, 9/01/30 | | | | | 965 | | | | 972,546 | |
6.00%, 9/01/39 | | | | | 1,500 | | | | 1,511,625 | |
| | | | | | | | | 3,932,151 | |
| Municipal Bonds | | | | Par
(000) | | Value |
Kansas — 0.5% | | | | | | | | | | |
Kansas Development Finance Authority, Refunding RB, Sisters of Leavenworth, Series A, 5.00%, 1/01/28 | | | | $ | 1,155 | | | $ | 1,248,890 | |
Kentucky — 5.2% | | | | | | | | | | |
County of Louisville & Jefferson Kentucky Metropolitan Government, Refunding RB, Jewish Hospital & St. Mary’s Healthcare, 6.13%, 2/01/18 (d) | | | | | 2,250 | | | | 2,684,925 | |
Kentucky Economic Development Finance Authority, RB, Catholic Health Initiatives, Series A, 5.38%, 1/01/40 | | | | | 3,400 | | | | 3,695,324 | |
Kentucky Economic Development Finance Authority, Refunding RB, Norton Healthcare, Inc., Series B (NPFGC), 0.00%, 10/01/23 (b) | | | | | 8,500 | | | | 5,857,350 | |
Kentucky Public Transportation Infrastructure Authority, RB, Convertible CAB, 1st tier (a): | | | | | | | | | | |
0.00%, 7/01/34 | | | | | 1,000 | | | | 624,800 | |
Series C, 0.00%, 7/01/39 | | | | | 1,395 | | | | 861,106 | |
| | | | | | | | | 13,723,505 | |
Louisiana — 3.2% | | | | | | | | | | |
City of Alexandria Louisiana Utilities, RB, 5.00%, 5/01/39 | | | | | 2,790 | | | | 2,987,253 | |
Louisiana Local Government Environmental Facilities & Community Development Authority, RB: | | | | | | | | | | |
Parish of Plaquemines Project (AGM), 4.00%, 9/01/42 | | | | | 395 | | | | 372,588 | |
Westlake Chemical Corp. Project, Series A-1, 6.50%, 11/01/35 | | | | | 1,565 | | | | 1,740,703 | |
Louisiana Public Facilities Authority, RB: | | | | | | | | | | |
Belle Chasse Educational Foundation Project, 6.50%, 5/01/31 | | | | | 600 | | | | 644,568 | |
Cleco Power LLC Project, Series B, 4.25%, 12/01/38 | | | | | 2,100 | | | | 2,042,124 | |
Terrebonne Levee & Conservation District, RB, Sales Tax, 4.25%, 7/01/32 | | | | | 575 | | | | 584,464 | |
| | | | | | | | | 8,371,700 | |
Maryland — 0.4% | | | | | | | | | | |
Maryland EDC, Refunding RB, CNX Marine Terminals, Inc., 5.75%, 9/01/25 | | | | | 895 | | | | 957,552 | |
Massachusetts — 1.0% | | | | | | | | | | |
Massachusetts Development Finance Agency, Refunding RB, Series A, 5.00%, 9/01/43 | | | | | 2,400 | | | | 2,670,336 | |
Michigan — 3.7% | | | | | | | | | | |
Michigan State Hospital Finance Authority, Refunding RB, Trinity Health Credit Group, Series C, 4.00%, 12/01/32 | | | | | 4,150 | | | | 4,123,398 | |
Royal Oak Hospital Finance Authority, Refunding RB, William Beaumont Hospital, Series V, 8.25%, 9/01/18 (d) | | | | | 2,750 | | | | 3,372,930 | |
State of Michigan Building Authority, Refunding RB, Facilities Program, Series I, 6.25%, 10/15/38 | | | | | 1,875 | | | | 2,177,119 | |
| | | | | | | | | 9,673,447 | |
Minnesota — 3.1% | | | | | | | | | | |
City of Minneapolis Minnesota, Refunding RB, Fairview Health Services, Series B (AGC), 6.50%, 11/15/38 | | | | | 2,250 | | | | 2,640,082 | |
State of Minnesota, RB, Series A, 5.00%, 6/01/38 | | | | | 5,000 | | | | 5,538,250 | |
| | | | | | | | | 8,178,332 | |
Mississippi — 3.4% | | | | | | | | | | |
County of Warren Mississippi, RB, Gulf Opportunity Zone Bonds, International Paper Co. Project, Series A, 5.38%, 12/01/35 | | | | | 600 | | | | 627,516 | |
Mississippi Development Bank, RB, Special Obligation: | | | | | | | | | | |
CAB, Hinds Community College District (AGM), 5.00%, 4/01/36 | | | | | 1,910 | | | | 2,029,146 | |
County of Jackson Limited Tax Note (AGC), 5.50%, 7/01/32 | | | | | 2,655 | | | | 2,876,533 | |
University of Southern Mississippi, RB, Campus Facilities Improvements Project, 5.38%, 9/01/36 | | | | | 3,150 | | | | 3,406,378 | |
| | | | | | | | | 8,939,573 | |
See Notes to Financial Statements.
| ANNUAL REPORT | APRIL 30, 2014 | 19
|
| |
| Schedule of Investments (continued) | BlackRock Investment Quality Municipal Trust Inc. (BKN)
(Percentages shown are based on Net Assets)
|
| Municipal Bonds | | | | Par
(000) | | Value |
Missouri — 3.6% | | | | | | | | | | |
Missouri Development Finance Board, RB,
Annual Appropriation Sewer System, Series B, 5.00%, 11/01/41 | | | | $ | 1,350 | | | $ | 1,405,661 | |
Missouri State Health & Educational Facilities
Authority, RB: | | | | | | | | | | |
A.T. Still University of Health Sciences, 4.25%, 10/01/32 | | | | | 480 | | | | 489,326 | |
A.T. Still University of Health Sciences, 5.00%, 10/01/39 | | | | | 750 | | | | 787,913 | |
A.T. Still University of Health Sciences, 5.25%, 10/01/31 | | | | | 500 | | | | 543,110 | |
Heartland Regional Medical Center, 4.13%, 2/15/43 | | | | | 1,530 | | | | 1,457,998 | |
University of Central Missouri, Series C-2, 4.00%, 10/01/28 | | | | | 600 | | | | 621,444 | |
University of Central Missouri, Series C-2, 5.00%, 10/01/34 | | | | | 1,500 | | | | 1,621,605 | |
Missouri State Health & Educational Facilities Authority, Refunding RB: | | | | | | | | | | |
CoxHealth, Series A, 5.00%, 11/15/38 | | | | | 1,200 | | | | 1,258,452 | |
SSM Health Care, Series A, 4.00%, 6/01/33 (c) | | | | | 1,200 | | | | 1,182,624 | |
| | | | | | | | | 9,368,133 | |
Montana — 2.1% | | | | | | | | | | |
Montana Facility Finance Authority, Refunding RB, Sisters of Charity of Leavenworth Health System, Series A, 4.75%, 1/01/40 | | | | | 700 | | | | 727,083 | |
State of Montana Board of Regents, RB, 5.00%, 11/15/43 | | | | | 3,340 | | | | 3,638,663 | |
Yellowstone County School District No. 2 Billings, GO, 4.50%, 6/15/33 | | | | | 1,000 | | | | 1,095,320 | |
| | | | | | | | | 5,461,066 | |
Nebraska — 2.0% | | | | | | | | | | |
Central Plains Energy Project Nebraska, RB, Gas Project No. 3, 5.00%, 9/01/42 | | | | | 900 | | | | 930,303 | |
City of Omaha Nebraska, RB, Sanitary Sewerage System, 4.00%, 11/15/42 | | | | | 800 | | | | 812,736 | |
Nebraska Public Power District, Refunding RB, Series A: | | | | | | | | | | |
5.00%, 1/01/32 | | | | | 2,535 | | | | 2,804,876 | |
5.00%, 1/01/33 | | | | | 750 | | | | 824,535 | |
| | | | | | | | | 5,372,450 | |
Nevada — 1.0% | | | | | | | | | | |
County of Clark Nevada, Refunding RB: | | | | | | | | | | |
Alexander Dawson School Nevada Project, 5.00%, 5/15/29 | | | | | 1,065 | | | | 1,134,971 | |
Department of Aviation, 4.25%, 7/01/36 | | | | | 1,500 | | | | 1,510,335 | |
| | | | | | | | | 2,645,306 | |
New Jersey — 5.9% | | | | | | | | | | |
County of Middlesex New Jersey Improvement Authority, RB, Heldrich Center Hotel, Sub-Series B, 6.25%, 1/01/37 (f)(g) | | | | | 1,510 | | | | 104,764 | |
New Jersey EDA, RB: | | | | | | | | | | |
4.00%, 6/15/34 (c) | | | | | 1,225 | | | | 1,197,364 | |
4.00%, 6/15/35 (c) | | | | | 600 | | | | 584,496 | |
Cigarette Tax, 5.75%, 6/15/14 (d) | | | | | 3,000 | | | | 3,021,030 | |
Continental Airlines, Inc. Project, AMT, 5.25%, 9/15/29 | | | | | 1,335 | | | | 1,349,191 | |
Continental Airlines, Inc. Project, AMT, 5.63%, 11/15/30 | | | | | 990 | | | | 1,017,443 | |
Goethals Bridge Replacement Project, AMT (AGM), 5.13%, 7/01/42 | | | | | 300 | | | | 315,996 | |
Rutgers — The State University of New Jersey, College Avenue Redevelopment Project, 5.00%, 6/15/38 | | | | | 670 | | | | 735,814 | |
New Jersey Educational Facilities Authority, Refunding RB, University of Medicine & Dentistry, Series B (d): | | | | | | | | | | |
7.13%, 6/01/19 | | | | | 950 | | | | 1,220,845 | |
7.50%, 6/01/19 | | | | | 1,225 | | | | 1,596,775 | |
| Municipal Bonds | | | | Par
(000) | | Value |
New Jersey (concluded) | | | | | | | | | | |
New Jersey Health Care Facilities Financing Authority, Refunding RB, St. Barnabas Health Care System, Series A: | | | | | | | | | | |
4.63%, 7/01/23 | | | | $ | 770 | | �� | $ | 824,986 | |
5.00%, 7/01/25 | | | | | 500 | | | | 555,495 | |
5.63%, 7/01/37 | | | | | 2,560 | | | | 2,750,874 | |
New Jersey Housing & Mortgage Finance Agency, RB, S/F Housing, Series AA, 6.50%, 10/01/38 | | | | | 345 | | | | 348,308 | |
| | | | | | | | | 15,623,381 | |
New York — 9.1% | | | | | | | | | | |
Albany Industrial Development Agency, RB, New Covenant Charter School Project, Series A, 7.00%, 5/01/35 (f)(g) | | | | | 725 | | | | 108,793 | |
City of New York New York, GO, Fiscal 2014, Sub-Series A-1: | | | | | | | | | | |
5.00%, 8/01/29 | | | | | 600 | | | | 677,160 | |
5.00%, 8/01/35 | | | | | 2,380 | | | | 2,600,912 | |
City of New York New York Industrial Development Agency, ARB, American Airlines, Inc., JFK International Airport, AMT, 7.63%, 8/01/25 (h) | | | | | 2,600 | | | | 2,854,228 | |
City of New York New York Industrial Development Agency, RB, PILOT, Queens Baseball Stadium: | | | | | | | | | | |
(AGC), 6.50%, 1/01/46 | | | | | 300 | | | | 333,390 | |
(AMBAC), 5.00%, 1/01/39 | | | | | 1,900 | | | | 1,865,515 | |
County of Westchester New York Healthcare Corp., Refunding RB, Senior Lien, Remarketing, Series A, 5.00%, 11/01/30 | | | | | 1,600 | | | | 1,682,704 | |
Hudson Yards Infrastructure Corp., RB, Series A: | | | | | | | | | | |
(NPFGC), 5.00%, 2/15/47 | | | | | 500 | | | | 509,970 | |
(AGM), 5.00%, 2/15/47 | | | | | 1,250 | | | | 1,280,550 | |
Long Island Power Authority, Refunding RB, Electric System, Series A, 5.75%, 4/01/39 | | | | | 2,475 | | | | 2,813,530 | |
Metropolitan Transportation Authority, RB, Series B, 5.25%, 11/15/39 | | | | | 5,460 | | | | 6,015,009 | |
New York Liberty Development Corp., Refunding RB, 2nd Priority, Bank of America Tower at One Bryant Park Project, Class 3, 6.38%, 7/15/49 | | | | | 1,250 | | | | 1,359,525 | |
Niagara Area Development Corp., Refunding RB, Solid Waste Disposal Facility, Covanta Energy Project, Series A, AMT, 5.25%, 11/01/42 | | | | | 600 | | | | 603,234 | |
State of New York Dormitory Authority, Refunding RB, State University Dormitory Facilities, Series A, 5.00%, 7/01/42 | | | | | 1,195 | | | | 1,288,748 | |
| | | | | | | | | 23,993,268 | |
North Carolina — 3.5% | | | | | | | | | | |
County of Gaston North Carolina Industrial Facilities & Pollution Control Financing Authority, RB, Exempt Facilities, National Gypsum Co. Project, AMT, 5.75%, 8/01/35 | | | | | 2,175 | | | | 2,109,685 | |
North Carolina Medical Care Commission, Refunding RB: | | | | | | | | | | |
Health Care Facilities, Novant Health Obligated Group, Series A, 4.00%, 11/01/46 | | | | | 5,600 | | | | 5,192,544 | |
University Health System, Series D, 6.25%, 12/01/33 | | | | | 1,750 | | | | 2,014,390 | |
| | | | | | | | | 9,316,619 | |
North Dakota — 0.2% | | | | | | | | | | |
City of Fargo North Dakota, Refunding RB, University Facilities Development Foundation Project, 3.00%, 12/01/30 | | | | | 600 | | | | 551,334 | |
Oklahoma — 0.4% | | | | | | | | | | |
Oklahoma Municipal Power Authority, RB, Power Supply System, Series A, 4.00%, 1/01/38 | | | | | 1,050 | | | | 1,054,547 | |
See Notes to Financial Statements.
| 20 | ANNUAL REPORT | APRIL 30, 2014
|
| |
| Schedule of Investments (continued) | BlackRock Investment Quality Municipal Trust Inc. (BKN)
(Percentages shown are based on Net Assets)
|
| Municipal Bonds | | | | Par
(000) | | Value |
Oregon — 4.4% | | | | | | | | | | |
Central Oregon Community College District, GO, 4.00%, 6/01/40 | | | | $ | 800 | | | $ | 797,664 | |
County of Clackamas Oregon Housing Authority, HRB, M/F Housing, Easton Ridge Apartments Project, Series A, 4.00%, 9/01/49 | | | | | 825 | | | | 770,855 | |
County of Umatilla Pendleton Oregon School District No. 16R, GO, Series A: | | | | | | | | | | |
5.00%, 6/15/37 | | | | | 4,225 | | | | 4,730,606 | |
4.00%, 6/15/38 | | | | | 2,365 | | | | 2,388,484 | |
Home Forward, Refunding HRB, M/F Housing, Hamilton W Apartments, 4.00%, 1/01/34 (c) | | | | | 1,020 | | | | 1,009,810 | |
Oregon Health & Science University, RB, Series A, 5.75%, 7/01/39 | | | | | 1,250 | | | | 1,426,613 | |
Oregon State Facilities Authority, Refunding RB, Linfield College Project, Series A, 5.25%, 10/01/40 | | | | | 500 | | | | 519,275 | |
| | | | | | | | | 11,643,307 | |
Pennsylvania — 3.8% | | | | | | | | | | |
County of Allegheny Pennsylvania IDA, Refunding RB, US Steel Corp. Project, 6.55%, 12/01/27 | | | | | 2,535 | | | | 2,737,242 | |
Delaware River Port Authority, RB: | | | | | | | | | | |
4.50%, 1/01/32 | | | | | 3,000 | | | | 3,190,950 | |
Series D (AGM), 5.00%, 1/01/40 | | | | | 3,640 | | | | 3,839,800 | |
Mckeesport Area School District, GO, CAB, Refunding (NPFGC), 0.00%, 10/01/31 (b)(e) | | | | | 500 | | | | 275,075 | |
| | | | | | | | | 10,043,067 | |
Rhode Island — 3.1% | | | | | | | | | | |
Rhode Island Health & Educational Building Corp., RB: | | | | | | | | | | |
City of Newport Issue, Series C, 4.00%, 5/15/33 | | | | | 1,850 | | | | 1,871,460 | |
Hospital Financing, LifeSpan Obligation, Series A (AGC), 7.00%, 5/15/39 | | | | | 3,000 | | | | 3,413,040 | |
Rhode Island Health & Educational Building Corp., Refunding RB, Brown University, 4.50%, 9/01/32 | | | | | 1,200 | | | | 1,304,784 | |
State of Rhode Island, COP, School for the Deaf Project, Series C (AGC), 5.38%, 4/01/28 | | | | | 1,330 | | | | 1,443,010 | |
| | | | | | | | | 8,032,294 | |
Tennessee — 2.6% | | | | | | | | | | |
Chattanooga Health Educational & Housing Facility Board, RB, Catholic Health Initiatives, Series A, 5.25%, 1/01/40 | | | | | 2,945 | | | | 3,174,239 | |
County of Memphis-Shelby Tennessee Sports Authority, Inc., Refunding RB, Memphis Arena Project, Series A: | | | | | | | | | | |
5.25%, 11/01/27 | | | | | 1,135 | | | | 1,230,669 | |
5.38%, 11/01/28 | | | | | 1,000 | | | | 1,086,330 | |
Johnson City Health & Educational Facilities Board, RB, Mountain States Health, Series A, 5.00%, 8/15/42 | | | | | 1,200 | | | | 1,219,452 | |
| | | | | | | | | 6,710,690 | |
Texas — 11.5% | | | | | | | | | | |
County of Harris Texas Health Facilities Development Corp., Refunding RB, Memorial Hermann Healthcare System, Series B (d): | | | | | | | | | | |
7.13%, 12/01/18 | | | | | 1,000 | | | | 1,266,400 | |
7.25%, 12/01/18 | | | | | 2,650 | | | | 3,370,694 | |
County of Harris Texas-Houston Sports Authority, Refunding RB, CAB, Senior Lien, Series A (NPFGC), 0.00%, 11/15/38 (b) | | | | | 5,000 | | | | 1,172,600 | |
County of Matagorda Texas Navigation District No. 1, Refunding RB, Central Power & Light Co. Project, Series A, 6.30%, 11/01/29 | | | | | 2,200 | | | | 2,490,906 | |
County of Midland Texas Fresh Water Supply District No. 1, RB, CAB, City of Midland Project, Series A (b): | | | | | | | | | | |
0.00%, 9/15/36 | | | | | 7,520 | | | | 2,647,040 | |
0.00%, 9/15/38 | | | | | 16,780 | | | | 5,314,394 | |
County of Midland Texas Fresh Water Supply District No. 1, Refunding RB, City of Midland Project, 3.38%, 9/15/32 | | | | | 2,425 | | | | 2,304,841 | |
| Municipal Bonds | | | | Par
(000) | | Value |
Texas (concluded) | | | | | | | | | | |
Love Field Airport Modernization Corp., RB, Southwest Airlines Co. Project, 5.25%, 11/01/40 | | | | $ | 1,545 | | | $ | 1,610,137 | |
Red River Education Financing Corp., RB, Texas Christian University Project, 5.25%, 3/15/38 | | | | | 1,140 | | | | 1,280,847 | |
State of Texas Turnpike Authority, RB, CAB (AMBAC), 0.00%, 8/15/31 (b) | | | | | 15,000 | | | | 5,352,750 | |
Texas Private Activity Bond Surface Transportation Corp., RB, Senior Lien, LBJ Infrastructure Group LLC, LBJ Freeway Managed Lanes Project, 7.00%, 6/30/40 | | | | | 3,000 | | | | 3,478,440 | |
| | | | | | | | | 30,289,049 | |
Vermont — 1.5% | | | | | | | | | | |
Vermont Educational & Health Buildings Financing Agency, RB, Fletcher Allen Health Hospital, Series A, 4.75%, 12/01/36 | | | | | 1,495 | | | | 1,500,352 | |
Vermont Educational & Health Buildings Financing Agency, Refunding RB, Fletcher Allen Health Hospital, Series B (AGM), 5.00%, 12/01/34 | | | | | 2,420 | | | | 2,509,395 | |
| | | | | | | | | 4,009,747 | |
Virginia — 1.7% | | | | | | | | | | |
County of Prince William Virginia IDA, Refunding RB, Novant Health Obligation Group, Series B, 4.00%, 11/01/46 | | | | | 2,800 | | | | 2,655,408 | |
Virginia Small Business Financing Authority, RB, Senior Lien, Elizabeth River Crossings LLC Project, AMT, 6.00%, 1/01/37 | | | | | 1,755 | | | | 1,903,210 | |
| | | | | | | | | 4,558,618 | |
Washington — 0.9% | | | | | | | | | | |
Washington Health Care Facilities Authority, RB, MultiCare Health System, Series B (AGC), 6.00%, 8/15/39 | | | | | 2,100 | | | | 2,315,208 | |
West Virginia — 0.7% | | | | | | | | | | |
City of Wheeling West Virginia Waterworks & Sewerage System, RB, 5.00%, 6/01/38 | | | | | 1,800 | | | | 1,933,092 | |
Wyoming — 0.8% | | | | | | | | | | |
County of Sweetwater Wyoming, Refunding RB, Idaho Power Co. Project, Remarketing, 5.25%, 7/15/26 | | | | | 1,800 | | | | 1,959,642 | |
Total Municipal Bonds — 138.2% | | | | | | | | | 363,810,257 | |
|
Municipal Bonds Transferred to
Tender Option Bond Trusts (i) |
Colorado — 2.1% | | | | | | | | | | |
Colorado Health Facilities Authority, RB, Catholic Health, Series C-7 (AGM), 5.00%, 9/01/36 | | | | | 5,250 | | | | 5,446,350 | |
Massachusetts — 1.2% | | | | | | | | | | |
Massachusetts Water Resources Authority, Refunding RB, General, Series A, 5.00%, 8/01/41 | | | | | 3,070 | | | | 3,297,333 | |
New Jersey — 1.2% | | | | | | | | | | |
New Jersey Transportation Trust Fund Authority, RB, Transportation System, Series B, 5.25%, 6/15/36 (j) | | | | | 2,861 | | | | 3,104,246 | |
New York — 8.9% | | | | | | | | | | |
City of New York New York Municipal Water Finance Authority, RB, Water & Sewer System, Fiscal 2009, Series A, 5.75%, 6/15/40 | | | | | 690 | | | | 790,146 | |
City of New York New York Municipal Water Finance Authority, Refunding RB, Water & Sewer System: | | | | | | | | | | |
2nd General Resolution, Fiscal 2013, Series C, 5.00%, 6/15/47 | | | | | 4,000 | | | | 4,287,610 | |
2nd General Resolution, Series FF-2, 5.50%, 6/15/40 | | | | | 810 | | | | 917,327 | |
Series A, 4.75%, 6/15/30 | | | | | 4,000 | | | | 4,383,120 | |
See Notes to Financial Statements.
| ANNUAL REPORT | APRIL 30, 2014 | 21
|
| |
| Schedule of Investments (continued) | BlackRock Investment Quality Municipal Trust Inc. (BKN)
(Percentages shown are based on Net Assets)
|
Municipal Bonds Transferred to
Tender Option Bond Trusts (i) | | | | Par
(000) | | Value |
New York (concluded) | | | | | | | | | | |
Hudson Yards Infrastructure Corp., RB, Fiscal 2012, Series A, 5.75%, 2/15/47 (j) | | | | $ | 1,750 | | | $ | 1,943,169 | |
New York Liberty Development Corp., RB, 1 World Trade Center Port Authority Consolidated, 5.25%, 12/15/43 | | | | | 4,500 | | | | 4,857,120 | |
State of New York Dormitory Authority, RB, New York University, Series A, 5.00%, 7/01/38 | | | | | 3,359 | | | | 3,667,558 | |
State of New York Thruway Authority, Refunding RB, Transportation, Personal Income Tax, Series A, 5.00%, 3/15/31 | | | | | 2,360 | | | | 2,641,288 | |
| | | | | | | | | 23,487,338 | |
Ohio — 1.7% | | | | | | | | | | |
County of Montgomery Ohio, RB, Catholic Health, Series C-1 (AGM), 5.00%, 10/01/41 | | | | | 1,740 | | | | 1,791,347 | |
Ohio Higher Educational Facility Commission, RB, Cleveland Clinic Health, Series A, 5.25%, 1/01/33 | | | | | 2,600 | | | | 2,858,700 | |
| | | | | | | | | 4,650,047 | |
Municipal Bonds Transferred to
Tender Option Bond Trusts (i) | | | | Par
(000) | | Value |
Texas — 1.0% | | | | | | | | | | |
City of San Antonio Texas Public Service Board, RB, Electric & Gas Systems, Junior Lien, 5.00%, 2/01/43 | | | | $ | 2,380 | | | $ | 2,574,256 | |
Total Municipal Bonds Transferred to
Tender Option Bond Trusts — 16.1% | | | | | | | | | 42,559,570 | |
Total Long-Term Investments
(Cost — $377,797,896) — 154.3% | | | | | | | | | 406,369,827 | |
|
Short-Term Securities | | | | | Shares | | | | | |
FFI Institutional Tax-Exempt Fund, 0.03% (k)(l) | | | | | 7,042,672 | | | | 7,042,672 | |
Total Short-Term Securities
(Cost — $7,042,672) — 2.7% | | | | | | | | | 7,042,672 | |
Total Investments (Cost — $384,840,568) — 157.0% | | | | | | | | | 413,412,499 | |
Liabilities in Excess of Other Assets — (0.2)% | | | | | | | | | (622,888 | ) |
Liability for TOB Trust Certificates, Including Interest Expense and Fees Payable — (9.0%) | | | | | | | | | (23,591,275 | ) |
VMTP Shares, at Liquidation Value — (47.8%) | | | | | | | | | (125,900,000 | ) |
Net Assets Applicable to Common Shares — 100.0% | | | | | | | | $ | 263,298,336 | |
Notes to Schedule of Investments
| (a) | | | | Represents a step-up bond that pays an initial coupon rate for the first period and then a higher coupon rate for the following periods. Rate shown reflects the current yield as of report date. |
| (b) | | | | Zero-coupon bond. |
| (c) | | | | When-issued security. Unsettled when-issued transactions were as follows: |
| Counterparty | | | | Value | | Unrealized
Appreciation |
Goldman Sachs & Co. | | | | $ | 1,182,624 | | | $ | 12,372 | |
Merrill Lynch Pierce | | | | | 1,781,860 | | | | 17,221 | |
Piper Jaffray | | | | | 377,955 | | | | 5,402 | |
Wedbush Morgan Securities | | | | | 1,009,810 | | | | 16,983 | |
| (d) | | | | U.S. government securities, held in escrow, are used to pay interest on this security, as well as to retire the bond in full at the date indicated, typically at a premium to par. |
| (e) | | | | Security is collateralized by municipal or U.S. Treasury obligations. |
| (f) | | | | Non-income producing security. |
| (g) | | | | Issuer filed for bankruptcy and/or is in default of principal and/or interest payments. |
| (h) | | | | Variable rate security. Rate shown is as of report date. |
| (i) | | | | Represent bonds transferred to a TOB. In exchange for which the Trust acquired residual interest certificates. These bonds serve as collateral in a financing transaction. See Note 3 of the Notes to Financial Statements for details of municipal bonds transferred to TOBs. |
| (j) | | | | All or a portion of security is subject to a recourse agreement, which may require the Trust to pay the liquidity provider in the event there is a shortfall between the TOB trust certificates and proceeds received from the sale of the security contributed to the TOB trust. In the case of a shortfall, the aggregate maximum potential amount the Trust could ultimately be required to pay under the agreements, which expire from February 15, 2019 to June 15, 2019 is $3,149,408. |
| (k) | | | | Represents the current yield as of report date. |
| (l) | | | | Investments in issuers considered to be an affiliate of the Trust during the year ended April 30, 2014, for purposes of Section 2(a)(3) of the Investment Company Act of 1940, as amended, were as follows: |
Affiliate
|
|
|
| Shares
Held at
April 30, 2013
|
| Net
Activity
|
| Shares
Held at
April 30, 2014
|
| Income
|
FFI Institutional Tax-Exempt Fund | | | | 4,475,537 | | 2,567,135 | | 7,042,672 | | $1,634 |
| • | | | | Financial futures contracts outstanding as of April 30, 2014 were as follows: |
Contracts
Sold
|
|
|
| Issue
|
| Exchange
|
| Expiration
|
| Notional
Value
|
| Unrealized
Depreciation
|
| (392) | | | | 10-Year U.S Treasury Note | | Chicago Board of Trade | | June 2014 | | $ | 48,773,375 | | | $ | (69,766 | ) |
See Notes to Financial Statements.
| 22 | ANNUAL REPORT | APRIL 30, 2014
|
| |
| Schedule of Investments (concluded) | BlackRock Investment Quality Municipal Trust Inc. (BKN)
|
| • | | | | Fair Value Measurements — Various inputs are used in determining the fair value of investments and derivative financial instruments. These inputs to valuation techniques are categorized into a disclosure hierarchy consisting of three broad levels for financial statement purposes as follows: |
| • | | | | Level 1 — unadjusted price quotations in active markets/exchanges for identical assets or liabilities that the Trust has the ability to access |
| • | | | | Level 2 — other observable inputs (including, but not limited to, quoted prices for similar assets or liabilities in markets that are active, quoted prices for identical or similar assets or liabilities in markets that are not active, inputs other than quoted prices that are observable for the assets or liabilities (such as interest rates, yield curves, volatilities, prepayment speeds, loss severities, credit risks and default rates) or other market-corroborated inputs) |
| • | | | | Level 3 — unobservable inputs based on the best information available in the circumstances, to the extent observable inputs are not available (including the Trust’s own assumptions used in determining the fair value of investments and derivative financial instruments) |
| | | | | The hierarchy gives the highest priority to unadjusted quoted prices in active markets for identical assets or liabilities (Level 1 measurements) and the lowest priority to unobservable inputs (Level 3 measurements). Accordingly, the degree of judgment exercised in determining fair value is greatest for instruments categorized in Level 3. The inputs used to measure fair value may fall into different levels of the fair value hierarchy. In such cases, for disclosure purposes, the fair value hierarchy classification is determined based on the lowest level input that is significant to the fair value measurement in its entirety.
|
| | | | | Changes in valuation techniques may result in transfers into or out of an assigned level within the disclosure hierarchy. In accordance with the Trust’s policy, transfers between different levels of the fair value disclosure hierarchy are deemed to have occurred as of the beginning of the reporting period. The categorization of a value determined for investments and derivative financial instruments is based on the pricing transparency of the investment and derivative financial instrument and is not necessarily an indication of the risks associated with investing in those securities. For information about the Trust’s policy regarding valuation of investments and derivative financial instruments, please refer to Note 2 of the Notes to Financial Statements.
|
| | | | | The following tables summarize the Trust’s investments and derivative financial instruments categorized in the disclosure hierarchy as of April 30, 2014: |
|
|
|
| Level 1
|
| Level 2
|
| Level 3
|
| Total
|
Assets:
|
Investments:
|
Long-Term Investments1 | | | | | — | | | $ | 406,369,827 | | | | — | | | $ | 406,369,827 | |
Short-Term Securities | | | | $ | 7,042,672 | | | | — | | | | — | | | | 7,042,672 | |
Total
| | | | $ | 7,042,672 | | | $ | 406,369,827 | | | | — | | | $ | 413,412,499 | |
| | 1 | See above Schedule of Investments for values in each state or political subdivision. |
|
|
|
| Level 1
|
| Level 2
|
| Level 3
|
| Total
|
Derivative Financial Instruments2
| | | | | | | | | | | |
Liabilities:
| | | | | | | | | | | | | | | | | | |
Interest rate contracts | | | | $ | (69,766 | ) | | | — | | | | — | | | $ | (69,766 | ) |
| | | | | | | | | | | | | | | | | | |
| 2 | Derivative financial instruments are financial futures contracts, which are valued at the unrealized appreciation/depreciation on the instrument. |
| | | | | The carrying amount for certain of the Trust’s assets and/or liabilities approximates fair value for financial statement purposes. As of April 30, 2014, such assets and/or liabilities are categorized within the disclosure hierarchy as follows: |
|
|
|
| Level 1
|
| Level 2
|
| Level 3
|
| Total
|
Assets:
| | | | | | | | | | | |
Cash received for financial futures contracts | | | | $ | 515,000 | | | | — | | | | — | | | $ | 515,000 | |
Liabilities:
| | | | | | | | | | | | | | | | | | |
Bank overdraft | | | | | — | | | $ | (1,738,908 | ) | | | — | | | | (1,738,908 | ) |
TOB trust certificates | | | | | — | | | | (23,584,555 | ) | | | — | | | | (23,584,555 | ) |
VMTP Shares | | | | | — | | | | (125,900,000 | ) | | | — | | | | (125,900,000 | ) |
Total
| | | | $ | 515,000 | | | $ | (151,223,463 | ) | | | — | | | $ | (150,708,463 | ) |
There were no transfers between levels during the year ended April 30, 2014.
See Notes to Financial Statements.
| ANNUAL REPORT | APRIL 30, 2014 | 23
|
| |
| Schedule of Investments April 30, 2014 | BlackRock Long-Term Municipal Advantage Trust (BTA)
(Percentages shown are based on Net Assets)
|
| Municipal Bonds | | | | Par
(000) | | Value |
Alabama — 1.6% | | | | | | | | | | |
County of Jefferson Alabama, RB, Limited Obligation School, Series A, 5.25%, 1/01/19 | | | | $ | 515 | | | $ | 517,539 | |
County of Jefferson Alabama Sewer, Refunding RB: | | | | | | | | | | |
Convertible CAB, Senior Lien, Series C (AGM), 0.00%, 10/01/38 (a) | | | | | 270 | | | | 164,090 | |
Convertible CAB, Senior Lien, Series C (AGM), 0.00%, 10/01/42 (a) | | | | | 235 | | | | 141,907 | |
Sub-Lien, Series D, 6.00%, 10/01/42 | | | | | 1,655 | | | | 1,745,859 | |
| | | | | | | | | 2,569,395 | |
California — 5.9% | | | | | | | | | | |
California Health Facilities Financing Authority, RB: | | | | | | | | | | |
St. Joseph Health System, Series A,
5.75%, 7/01/39 | | | | | 385 | | | | 443,197 | |
Sutter Health, Series B, 6.00%, 8/15/42 | | | | | 1,040 | | | | 1,231,963 | |
California Health Facilities Financing Authority, Refunding RB, Series A: | | | | | | | | | | |
Catholic Healthcare West, 6.00%, 7/01/39 | | | | | 680 | | | | 755,303 | |
St. Joseph Health System, 5.00%, 7/01/33 | | | | | 435 | | | | 475,781 | |
California HFA, RB, S/F Housing, Home Mortgage, Series K, AMT, 5.50%, 2/01/42 | | | | | 250 | | | | 255,233 | |
California Pollution Control Financing Authority, RB (b): | | | | | | | | | | |
County of San Diego California Water Authority Desalination Project Pipeline, 5.00%, 11/21/45 | | | | | 440 | | | | 440,097 | |
Poseidon Resources (Channel Side) LP Desalination Project, AMT, 5.00%, 7/01/37 | | | | | 360 | | | | 360,932 | |
California State Public Works Board, LRB Various Capital Projects: | | | | | | | | | | |
Series I, 5.00%, 11/01/38 | | | | | 355 | | | | 380,514 | |
Sub-Series I-1, 6.38%, 11/01/34 | | | | | 400 | | | | 479,636 | |
California Statewide Communities Development Authority, Refunding RB, Episcopal Communities & Services, 5.00%, 5/15/47 | | | | | 125 | | | | 125,874 | |
City of Los Angeles California Department of Airports, Refunding ARB, Los Angeles International Airport, Series A, 5.25%, 5/15/39 | | | | | 270 | | | | 304,171 | |
City of Stockton California Public Financing Authority, RB, Delta Water Supply Project, Series A, 6.25%, 10/01/38 | | | | | 165 | | | | 183,614 | |
San Diego Community College District California, GO, Election of 2006, 5.00%, 8/01/43 | | | | | 375 | | | | 413,190 | |
San Marcos Unified School District, GO, CAB, SAN, Election of 2010, Series B, 0.00%, 8/01/38 (c) | | | | | 3,725 | | | | 1,156,910 | |
State of California, GO, Various Purposes, 6.50%, 4/01/33 | | | | | 2,000 | | | | 2,437,460 | |
| | | | | | | | | 9,443,875 | |
Colorado — 0.8% | | | | | | | | | | |
Colorado Health Facilities Authority, Refunding RB, Evangelical Lutheran Good Samaritan Society Project, 5.00%, 12/01/42 | | | | | 65 | | | | 66,034 | |
North Range Metropolitan District No. 2, GO, Limited Tax, 5.50%, 12/15/37 | | | | | 1,200 | | | | 1,187,400 | |
| | | | | | | | | 1,253,434 | |
Delaware — 1.3% | | | | | | | | | | |
County of Sussex Delaware, RB, NRG Energy, Inc., Indian River Power LLC Project, 6.00%, 10/01/40 | | | | | 750 | | | | 802,613 | |
Delaware State EDA, RB, Exempt Facilities, Indian River Power LLC Project, 5.38%, 10/01/45 | | | | | 1,240 | | | | 1,265,209 | |
| | | | | | | | | 2,067,822 | |
District of Columbia — 3.7% | | | | | | | | | | |
District of Columbia, RB, Methodist Home District of Columbia, Series A: | | | | | | | | | | |
7.38%, 1/01/30 | | | | | 550 | | | | 551,590 | |
7.50%, 1/01/39 | | | | | 500 | | | | 501,170 | |
District of Columbia, Refunding RB, Kipp Charter School, Series A, 6.00%, 7/01/43 | | | | | 260 | | | | 288,194 | |
| Municipal Bonds | | | | Par
(000) | | Value |
District of Columbia (concluded) | | | | | | | | | | |
District of Columbia, Tax Allocation Bonds, City Market at O Street Project, 5.13%, 6/01/41 | | | | $ | 750 | | | $ | 779,528 | |
District of Columbia Tobacco Settlement Financing Corp., Refunding RB, Asset-Backed, 6.25%, 5/15/24 | | | | | 2,675 | | | | 2,674,679 | |
Metropolitan Washington Airports Authority, Refunding RB, 1st Senior Lien, Series A: | | | | | | | | | | |
5.00%, 10/01/39 | | | | | 170 | | | | 177,529 | |
5.25%, 10/01/44 | | | | | 1,000 | | | | 1,051,870 | |
| | | | | | | | | 6,024,560 | |
Florida — 2.7% | | | | | | | | | | |
Mid-Bay Bridge Authority, RB, Springing Lien, Series A, 7.25%, 10/01/40 | | | | | 1,080 | | | | 1,231,902 | |
Tolomato Community Development District, Refunding, CAB Special Assessment Bonds: | | | | | | | | | | |
0.00%, 5/01/39 (a) | | | | | 95 | | | | 69,544 | |
0.00%, 5/01/40 (a) | | | | | 225 | | | | 134,190 | |
6.65%, 5/01/40 | | | | | 355 | | | | 358,600 | |
Convertible Series A-4, 0.00%, 5/01/40 (a) | | | | | 120 | | | | 52,967 | |
Tolomato Community Development District,
Series A-1 (d)(e): | | | | | | | | | | |
Series 1, 6.65%, 5/01/40 | | | | | 15 | | | | 15,174 | |
Series 2, 6.65%, 5/01/40 | | | | | 815 | | | | 473,401 | |
Series 3, 6.65%, 5/01/40 | | | | | 275 | | | | 3 | |
Village Community Development District No. 10, Special Assessment Bonds, 5.13%, 5/01/43 | | | | | 880 | | | | 861,141 | |
Watergrass Community Development District, Special Assessment Bonds, Series A, 5.38%, 5/01/39 | | | | | 1,745 | | | | 1,138,298 | |
| | | | | | | | | 4,335,220 | |
Guam — 1.2% | | | | | | | | | | |
Guam Government Waterworks Authority, RB, Water & Wastewater System: | | | | | | | | | | |
5.25%, 7/01/33 | | | | | 640 | | | | 670,304 | |
5.50%, 7/01/43 | | | | | 1,065 | | | | 1,120,188 | |
Territory of Guam, GO, Series A, 6.00%, 11/15/19 | | | | | 200 | | | | 216,194 | |
| | | | | | | | | 2,006,686 | |
Illinois — 10.2% | | | | | | | | | | |
City of Chicago Illinois, GARB, O’Hare International Airport, 3rd Lien, Series A, 5.75%, 1/01/39 | | | | | 2,500 | | | | 2,729,275 | |
City of Chicago Illinois, GO, Project | | | | | | | | | | |
Series A, 5.00%, 1/01/34 | | | | | 480 | | | | 484,531 | |
Refunding, 5.25%, 1/01/32 | | | | | 1,090 | | | | 1,130,930 | |
City of Chicago Illinois, Refunding RB, Sales Tax, Series A, 5.25%, 1/01/38 | | | | | 280 | | | | 297,016 | |
City of Chicago Illinois Board of Education, GO, Series A, 5.25%, 12/01/41 | | | | | 1,150 | | | | 1,153,508 | |
City of Chicago Illinois Transit Authority, RB, Sales Tax Receipts, 5.25%, 12/01/40 | | | | | 360 | | | | 384,325 | |
City of Chicago Illinois Waterworks, Refunding RB, 2nd Lien Project, 5.00%, 11/01/42 | | | | | 1,875 | | | | 1,935,281 | |
County of Cook Illinois Community College District No. 508, GO, City College of Chicago, 5.50%, 12/01/38 | | | | | 350 | | | | 385,879 | |
Illinois Finance Authority, RB, Advocate Health Care, Series C, 5.38%, 4/01/44 | | | | | 1,845 | | | | 1,971,641 | |
Illinois Finance Authority, Refunding RB, Central Dupage Health, Series B, 5.50%, 11/01/39 | | | | | 550 | | | | 610,610 | |
Illinois State Toll Highway Authority, RB, Series A, 5.00%, 1/01/38 | | | | | 815 | | | | 859,499 | |
Metropolitan Pier & Exposition Authority, Refunding RB, McCormick Place Expansion Project: | | | | | | | | | | |
Series B (AGM), 5.00%, 6/15/50 | | | | | 1,790 | | | | 1,826,265 | |
Series B-2, 5.00%, 6/15/50 | | | | | 600 | | | | 612,012 | |
Railsplitter Tobacco Settlement Authority, RB, 5.50%, 6/01/23 | | | | | 180 | | | | 209,772 | |
State of Illinois, GO, 5.00%, 2/01/39 | | | | | 745 | | | | 771,708 | |
State of Illinois, RB, Build Illinois, Series B, 5.25%, 6/15/34 | | | | | 215 | | | | 238,308 | |
See Notes to Financial Statements.
| 24 | ANNUAL REPORT | APRIL 30, 2014
|
| |
| Schedule of Investments (continued) | BlackRock Long-Term Municipal Advantage Trust (BTA)
(Percentages shown are based on Net Assets)
|
| Municipal Bonds | | | | Par
(000) | | Value |
Illinois (concluded) | | | | | | | | | | |
University of Illinois, RB, Auxiliary Facilities System, Series A: | | | | | | | | | | |
5.00%, 4/01/39 | | | | $ | 390 | | | $ | 418,688 | |
5.00%, 4/01/44 | | | | | 475 | | | | 507,143 | |
| | | | | | | | | 16,526,391 | |
Indiana — 3.3% | | | | | | | | | | |
City of Valparaiso Indiana, RB, Exempt Facilities, Pratt Paper LLC Project, AMT: | | | | | | | | | | |
6.75%, 1/01/34 | | | | | 365 | | | | 391,466 | |
7.00%, 1/01/44 | | | | | 885 | | | | 955,180 | |
Indiana Finance Authority, RB, Series A: | | | | | | | | | | |
CWA Authority Project, 1st Lien, 5.25%, 10/01/38 | | | | | 1,285 | | | | 1,413,153 | |
Private Activity Bond, Ohio River Bridges East End Crossing Project, AMT, 5.00%, 7/01/44 | | | | | 160 | | | | 161,560 | |
Private Activity Bond, Ohio River Bridges East End Crossing Project, AMT, 5.00%, 7/01/48 | | | | | 520 | | | | 526,838 | |
Sisters of St. Francis Health Services, 5.25%, 11/01/39 | | | | | 290 | | | | 306,426 | |
Indiana Finance Authority, Refunding RB, Parkview Health System, Series A, 5.75%, 5/01/31 | | | | | 600 | | | | 651,426 | |
Indiana Municipal Power Agency, RB, Series B, 6.00%, 1/01/39 | | | | | 350 | | | | 392,984 | |
Indianapolis Local Public Improvement Bond Bank, RB, Series A, 5.00%, 1/15/40 | | | | | 445 | | | | 480,822 | |
| | | | | | | | | 5,279,855 | |
Iowa — 2.3% | | | | | | | | | | |
Iowa Finance Authority, Refunding RB, Midwestern Disaster Area, Iowa Fertilizer Co. Project: | | | | | | | | | | |
5.00%, 12/01/19 | | | | | 340 | | | | 344,114 | |
5.50%, 12/01/22 | | | | | 830 | | | | 843,388 | |
5.25%, 12/01/25 | | | | | 660 | | | | 659,743 | |
Iowa Student Loan Liquidity Corp., Refunding RB, Student Loan, Senior Series A-1, AMT, 5.15%, 12/01/22 | | | | | 810 | | | | 846,134 | |
Iowa Tobacco Settlement Authority, Refunding RB, Asset-Backed, Series C, 5.63%, 6/01/46 | | | | | 1,125 | | | | 957,645 | |
| | | | | | | | | 3,651,024 | |
Kentucky — 0.5% | | | | | | | | | | |
Kentucky Economic Development Finance Authority, RB, Catholic Health Initiatives, Series A, 5.25%, 1/01/45 | | | | | 440 | | | | 472,925 | |
Kentucky Public Transportation Infrastructure Authority, RB, Downtown Crossing Project, Convertible CAB, 1st Tier, Series C, 0.00%, 7/01/43 (a) | | | | | 565 | | | | 344,046 | |
| | | | | | | | | 816,971 | |
Louisiana — 3.7% | | | | | | | | | | |
Louisiana Local Government Environmental Facilities & Community Development Authority, RB, Westlake Chemical Corp. Project: | | | | | | | | | | |
6.75%, 11/01/32 | | | | | 2,000 | | | | 2,219,500 | |
Series A-1, 6.50%, 11/01/35 | | | | | 1,135 | | | | 1,262,426 | |
Tobacco Settlement Financing Corp., Refunding RB, Asset-Backed, Series A: | | | | | | | | | | |
5.50%, 5/15/30 | | | | | 350 | | | | 378,273 | |
5.25%, 5/15/31 | | | | | 300 | | | | 317,433 | |
5.25%, 5/15/32 | | | | | 380 | | | | 399,699 | |
5.25%, 5/15/33 | | | | | 415 | | | | 435,368 | |
5.25%, 5/15/35 | | | | | 945 | | | | 991,778 | |
| | | | | | | | | 6,004,477 | |
Maine — 0.6% | | | | | | | | | | |
Maine Health & Higher Educational Facilities Authority, RB, Maine General Medical Center, 6.75%, 7/01/41 | | | | | 970 | | | | 1,047,493 | |
| Municipal Bonds | | | | Par
(000) | | Value |
Maryland — 1.3% | | | | | | | | | | |
Maryland EDC, RB, Transportation Facilities Project, Series A, 5.75%, 6/01/35 | | | | $ | 970 | | | $ | 1,010,459 | |
Maryland EDC, Refunding RB, CNX Marine Terminals, Inc., 5.75%, 9/01/25 | | | | | 1,000 | | | | 1,069,890 | |
| | | | | | | | | 2,080,349 | |
Michigan — 3.0% | | | | | | | | | | |
City of Detroit Michigan Sewage Disposal System, Refunding RB, Senior Lien: | | | | | | | | | | |
Series A, 5.00%, 7/01/32 | | | | | 545 | | | | 526,034 | |
Series A, 5.25%, 7/01/39 | | | | | 1,970 | | | | 1,916,219 | |
Series B (AGM), 7.50%, 7/01/33 | | | | | 560 | | | | 607,566 | |
Royal Oak Hospital Finance Authority, Refunding RB, William Beaumont Hospital, Series V, 8.25%, 9/01/39 (f) | | | | | 1,400 | | | | 1,717,128 | |
| | | | | | | | | 4,766,947 | |
Missouri — 0.1% | | | | | | | | | | |
Bi-State Development Agency of the Missouri-Illinois Metropolitan District, Refunding RB, Combined Lien, Series A, 5.00%, 10/01/44 | | | | | 85 | | | | 91,906 | |
State of Missouri Health & Educational Facilities Authority, Refunding RB, St. Louis College of Pharmacy Project, 5.50%, 5/01/43 | | | | | 115 | | | | 121,604 | |
| | | | | | | | | 213,510 | |
Nebraska — 0.2% | | | | | | | | | | |
Central Plains Nebraska Energy Project, RB, Gas Project No. 3, 5.25%, 9/01/37 | | | | | 285 | | | | 301,530 | |
New Jersey — 2.2% | | | | | | | | | | |
New Jersey EDA, RB, Continental Airlines, Inc. Project, AMT, 5.13%, 9/15/23 | | | | | 1,410 | | | | 1,426,666 | |
New Jersey EDA, Refunding, Special Assessment Bonds, Kapkowski Road Landfill Project, 5.75%, 4/01/31 | | | | | 785 | | | | 836,810 | |
New Jersey Transportation Trust Fund Authority, RB, Transportation System, Series B, 5.25%, 6/15/36 | | | | | 845 | | | | 916,969 | |
Rutgers—The State University of New Jersey, Refunding RB, Series L: | | | | | | | | | | |
5.00%, 5/01/38 | | | | | 175 | | | | 193,130 | |
5.00%, 5/01/43 | | | | | 185 | | | | 202,530 | |
| | | | | | | | | 3,576,105 | |
New York — 5.9% | | | | | | | | | | |
City of New York New York Industrial Development Agency, ARB, AMT: | | | | | | | | | | |
American Airlines, Inc., JFK International Airport, 7.63%, 8/01/25 (g) | | | | | 4,000 | | | | 4,391,120 | |
British Airways PLC Project, 7.63%, 12/01/32 | | | | | 1,000 | | | | 1,005,090 | |
Metropolitan Transportation Authority, RB, Series B: | | | | | | | | | | |
5.25%, 11/15/38 | | | | | 1,125 | | | | 1,238,378 | |
5.25%, 11/15/39 | | | | | 400 | | | | 440,660 | |
New York Liberty Development Corp., Refunding RB, 2nd Priority, Bank of America Tower at One Bryant Park Project, Class 3, 6.38%, 7/15/49 | | | | | 420 | | | | 456,800 | |
New York State Dormitory Authority, RB, New York University, Series A, 5.25%, 7/01/48 | | | | | 1,000 | | | | 1,109,750 | |
Port Authority of New York & New Jersey, ARB, Special Project, JFK International Air Terminal LLC Project, Series 8, 6.00%, 12/01/42 | | | | | 730 | | | | 801,591 | |
| | | | | | | | | 9,443,389 | |
North Carolina — 0.5% | | | | | | | | | | |
North Carolina Medical Care Commission, RB, Health Care Facilities, Duke University Health System, Series A, 5.00%, 6/01/42 | | | | | 480 | | | | 522,888 | |
North Carolina Medical Care Commission, Refunding RB, First Mortgage, Retirement Facilities Whitestone Project, Series A, 7.75%, 3/01/41 | | | | | 260 | | | | 286,094 | |
| | | | | | | | | 808,982 | |
See Notes to Financial Statements.
| ANNUAL REPORT | APRIL 30, 2014 | 25
|
| |
| Schedule of Investments (continued) | BlackRock Long-Term Municipal Advantage Trust (BTA)
(Percentages shown are based on Net Assets)
|
| Municipal Bonds | | | | Par
(000) | | Value |
Ohio — 3.5% | | | | | | | | | | |
Buckeye Tobacco Settlement Financing Authority, RB, Asset-Backed Bonds, Series A-2, 5.75%, 6/01/34 | | | | $ | 2,295 | | | $ | 1,876,461 | |
County of Allen Ohio Hospital Facilities, Refunding RB, Catholic Healthcare Partners, Series A, 5.25%, 6/01/38 | | | | | 2,650 | | | | 2,833,194 | |
State of Ohio, RB, Ford Motor Co. Project, AMT, 5.75%, 4/01/35 | | | | | 1,000 | | | | 1,014,860 | |
| | | | | | | | | 5,724,515 | |
Pennsylvania — 0.7% | | | | | | | | | | |
Pennsylvania Turnpike Commission, RB, Series A, 5.00%, 12/01/44 | | | | | 520 | | | | 558,922 | |
Philadelphia Hospitals & Higher Education Facilities Authority, RB, Temple University Health System,
Series A, 5.63%, 7/01/42 | | | | | 580 | | | | 554,341 | |
| | | | | | | | | 1,113,263 | |
Texas — 7.0% | | | | | | | | | | |
Brazos River Authority, RB, TXU Electric, Series A, AMT, 8.25%, 10/01/30 (d)(e) | | | | | 1,500 | | | | 41,250 | |
Central Texas Regional Mobility Authority, Refunding RB: | | | | | | | | | | |
Senior Lien, 6.25%, 1/01/46 | | | | | 730 | | | | 798,890 | |
Sub-Lien, 5.00%, 1/01/42 | | | | | 110 | | | | 106,941 | |
City of Dallas Texas Waterworks & Sewer System, Refunding RB, 5.00%, 10/01/35 | | | | | 525 | | | | 588,698 | |
City of Houston Texas Airport System, Refunding ARB, Senior Lien, Series A, 5.50%, 7/01/39 | | | | | 250 | | | | 282,535 | |
County of Harris Texas Cultural Education Facilities Finance Corp., RB, 1st Mortgage, Brazos Presbyterian Homes, Inc. Project, Series B, 7.00%, 1/01/43 | | | | | 210 | | | | 224,303 | |
County of Matagorda Texas Navigation District No. 1, Refunding RB, Central Power & Light Co. Project, Series A, 6.30%, 11/01/29 | | | | | 700 | | | | 792,561 | |
County of Midland Texas Fresh Water Supply District No. 1, RB, CAB, City of Midland Projects, Series A, 0.00%, 9/15/37 (c) | | | | | 5,200 | | | | 1,736,280 | |
County of Tarrant Texas Cultural Education Facilities Finance Corp., RB, Scott & White Healthcare, 6.00%, 8/15/45 | | | | | 1,390 | | | | 1,645,885 | |
Harris County-Houston Sports Authority, Refunding RB, CAB, Series A (NPFGC), 0.00%, 11/15/34 (c) | | | | | 3,000 | | | | 909,900 | |
HFDC of Central Texas, Inc., RB, Village at Gleannloch Farms, Series A, 5.50%, 2/15/27 | | | | | 1,150 | | | | 1,132,279 | |
North Texas Tollway Authority, Refunding RB, 2nd Tier System, Series F, 6.13%, 1/01/31 | | | | | 2,290 | | | | 2,453,277 | |
Texas Private Activity Bond Surface Transportation Corp., RB, Senior Lien, LBJ Infrastructure Group LLC, LBJ Freeway Managed Lanes Project, 7.00%, 6/30/40 | | | | | 500 | | | | 579,740 | |
| | | | | | | | | 11,292,539 | |
Utah — 0.6% | | | | | | | | | | |
Utah State Charter School Finance Authority, RB, Ogden Preparatory Academy, Series A: | | | | | | | | | | |
3.25%, 10/15/36 | | | | | 700 | | | | 565,348 | |
3.25%, 10/15/42 | | | | | 425 | | | | 329,876 | |
| | | | | | | | | 895,224 | |
Virginia — 1.9% | | | | | | | | | | |
Virginia HDA, RB, Rental Housing, Series F, 5.00%, 4/01/45 | | | | | 1,000 | | | | 1,037,890 | |
Virginia Small Business Financing Authority, RB, Senior Lien, Elizabeth River Crossings LLC Project, AMT, 6.00%, 1/01/37 | | | | | 1,875 | | | | 2,033,344 | |
| | | | | | | | | 3,071,234 | |
Washington — 0.7% | | | | | | | | | | |
Washington Health Care Facilities Authority, RB, Catholic Health Initiatives, Series A, 5.75%, 1/01/45 | | | | | 1,020 | | | | 1,133,047 | |
| Municipal Bonds | | | | Par
(000) | | Value |
Wyoming — 0.1% | | | | | | | | | | |
Wyoming Municipal Power Agency, Inc., RB, Series A, 5.00%, 1/01/42 | | | | $ | 100 | | | $ | 102,842 | |
Total Municipal Bonds — 65.5% | | | | | | | | | 105,550,679 | |
|
Municipal Bonds Transferred to
Tender Option Bond Trusts (h)
| | | | | | | | | | |
California — 5.3% | | | | | | | | | | |
Bay Area Toll Authority, Refunding RB, San Francisco Bay Area, Series F-1, 5.63%, 4/01/44 | | | | | 1,090 | | | | 1,192,970 | |
California Educational Facilities Authority, RB, University of Southern California, Series B, 5.25%, 10/01/39 (i) | | | | | 840 | | | | 952,342 | |
City & County of San Francisco California Public Utilities Commission, RB, Water Revenue, Series B, 5.00%, 11/01/39 | | | | | 3,225 | | | | 3,556,659 | |
City of Los Angeles California Department of Airports, Refunding ARB, Los Angeles International Airport, Senior Series A, 5.00%, 5/15/40 | | | | | 2,039 | | | | 2,197,322 | |
San Diego Community College District California, GO, Election of 2002, 5.25%, 8/01/33 | | | | | 553 | | | | 635,953 | |
| | | | | | | | | 8,535,246 | |
Colorado — 3.1% | | | | | | | | | | |
Colorado Health Facilities Authority, Refunding RB, Series A: |
Catholic Health Initiatives, 5.50%, 7/01/34 (i) | | | | | 740 | | | | 838,941 | |
Sisters of Leavenworth Health System, 5.00%, 1/01/40 | | | | | 3,930 | | | | 4,101,034 | |
| | | | | | | | | 4,939,975 | |
Florida — 1.3% | | | | | | | | | | |
County of Miami-Dade Florida, RB, Water & Sewer System, 5.00%, 10/01/34 | | | | | 1,950 | | | | 2,093,317 | |
Illinois — 4.9% | | | | | | | | | | |
City of Chicago Illinois, GARB, O’Hare International Airport, 3rd Lien, Series A (NPFGC), 5.00%, 1/01/33 (i) | | | | | 4,995 | | | | 5,204,890 | |
Illinois Finance Authority, RB, The Carle Foundation, Series A (AGM), 6.00%, 8/15/41 | | | | | 2,340 | | | | 2,639,614 | |
| | | | | | | | | 7,844,504 | |
Indiana — 7.8% | | | | | | | | | | |
Carmel Redevelopment Authority, RB, Performing Arts Center (f): | | | | | | | | | | |
4.75%, 2/01/33 | | | | | 5,365 | | | | 5,630,782 | |
5.00%, 2/01/33 | | | | | 6,580 | | | | 6,951,770 | |
| | | | | | | | | 12,582,552 | |
Massachusetts — 8.0% | | | | | | | | | | |
Massachusetts HFA, Refunding, HRB, Series D, AMT, 5.45%, 6/01/37 | | | | | 5,090 | | | | 5,092,230 | |
Massachusetts School Building Authority, RB, Senior, Series B, 5.00%, 10/15/41 | | | | | 7,112 | | | | 7,743,937 | |
| | | | | | | | | 12,836,167 | |
Nebraska — 3.2% | | | | | | | | | | |
Omaha Public Power District, RB, Sub-Series B (NPFGC), 4.75%, 2/01/36 (i) | | | | | 5,000 | | | | 5,247,700 | |
New Hampshire — 0.5% | | | | | | | | | | |
New Hampshire Health & Education Facilities Authority, RB, Dartmouth College, 5.25%, 6/01/39 (i) | | | | | 660 | | | | 748,660 | |
New York — 23.7% | | | | | | | | | | |
City of New York New York Municipal Water Finance Authority, Refunding RB, Water & Sewer System 2nd General Resolution: | | | | | | | | | | |
Fiscal 2013, Series C, 5.00%, 6/15/47 | | | | | 4,780 | | | | 5,123,694 | |
Series FF-2, 5.50%, 6/15/40 | | | | | 495 | | | | 560,589 | |
Series HH, 5.00%, 6/15/31 (i) | | | | | 2,835 | | | | 3,176,017 | |
See Notes to Financial Statements.
| 26 | ANNUAL REPORT | APRIL 30, 2014
|
| |
| Schedule of Investments (continued) | BlackRock Long-Term Municipal Advantage Trust (BTA)
(Percentages shown are based on Net Assets)
|
Municipal Bonds Transferred to
Tender Option Bond Trusts (h) | | | | Par
(000) | | Value |
New York (concluded) | | | | | | | | | | |
Hudson Yards Infrastructure Corp., RB, Fiscal 2012, Series A, 5.75%, 2/15/47 (i) | | | | $ | 6,509 | | | $ | 7,228,587 | |
New York Liberty Development Corp., RB, 1 World Trade Center Port Authority Consolidated, 5.25%, 12/15/43 | | | | | 6,135 | | | | 6,621,874 | |
New York Liberty Development Corp., Refunding RB, 4 World Trade Center Project, 5.75%, 11/15/51 (i) | | | | | 2,220 | | | | 2,455,520 | |
State of New York Dormitory Authority, ERB, Series B, 5.75%, 3/15/36 | | | | | 11,240 | | | | 13,079,201 | |
| | | | | | | | | 38,245,482 | |
North Carolina — 9.9% | | | | | | | | | | |
University of North Carolina at Chapel Hill, Refunding RB, Series A, 4.75%, 12/01/34 | | | | | 15,170 | | | | 15,980,527 | |
Ohio — 3.2% | | | | | | | | | | |
State of Ohio, Refunding RB, Cleveland Clinic Health System Obligated Group, Series A, 5.50%, 1/01/39 | | | | | 4,634 | | | | 5,217,137 | |
South Carolina — 1.3% | | | | | | | | | | |
State of South Carolina Housing Finance & Development Authority, Refunding RB, S/F Housing, Series B-1, 5.55%, 7/01/39 | | | | | 1,999 | | | | 2,049,354 | |
Texas — 11.1% | | | | | | | | | | |
City of San Antonio Texas Public Service Board, RB, Electric & Gas Systems, Junior Lien, 5.00%, 2/01/43 | | | | | 11,000 | | | | 11,897,820 | |
County of Harris Texas, RB, Senior Lien, Toll Road, Series A, 5.00%, 8/15/38 (i) | | | | | 2,122 | | | | 2,392,440 | |
County of Harris Texas Metropolitan Transit Authority, Refunding RB, Series A, 5.00%, 11/01/41 | | | | | 1,170 | | | | 1,268,058 | |
University of Texas, Refunding RB, Financing System, Series B, 5.00%, 8/15/43 | | | | | 2,175 | | | | 2,403,472 | |
| | | | | | | | | 17,961,790 | |
Municipal Bonds Transferred to
Tender Option Bond Trusts (h) | | | | Par
(000) | | Value |
Utah — 1.2% | | | | | | | | | | |
City of Riverton Utah, RB, IHC Health Services, Inc., 5.00%, 8/15/41 | | | | $ | 1,829 | | | $ | 1,929,489 | |
Virginia — 1.9% | | | | | | | | | | |
Virginia Small Business Financing Authority, Refunding RB, Sentara Healthcare, 5.00%, 11/01/40 | | | | | 2,949 | | | | 3,139,040 | |
Wisconsin — 1.3% | | | | | | | | | | |
Wisconsin Health & Educational Facilities Authority, Refunding RB, Froedtert & Community Health, Inc., Obligated Group, Series C, 5.25%, 4/01/39 (i) | | | | | 1,989 | | | | 2,115,784 | |
Total Municipal Bonds Transferred to
Tender Option Bond Trusts — 87.7% | | | | | | | | | 141,466,724 | |
Total Long-Term Investments
| | | | | | | | | | |
(Cost — $236,636,707) — 153.2% | | | | | | | | | 247,017,403 | |
|
Short-Term Securities | | | | | Shares | | | | | |
FFI Institutional Tax-Exempt Fund, 0.03% (j)(k) | | | | | 787,037 | | | | 787,037 | |
Total Short-Term Securities | | | | | | | | | | |
(Cost — $787,037) — 0.5% | | | | | | | | | 787,037 | |
Total Investments (Cost — $237,423,744) — 153.7% | | 247,804,440 | |
Other Assets Less Liabilities — 1.5% | | | | | | | | | 2,536,323 | |
Liability for TOB Trust Certificates, Including Interest Expense and Fees Payable — (55.2%) | | | | | | | | | (89,072,259 | ) |
Net Assets — 100.0% | | | | | | | | $ | 161,268,504 | |
Notes to Schedule of Investments
| (a) | | | | Represents a step-up bond that pays an initial coupon rate for the first period and then a higher coupon rate for the following periods. Rate shown is as of report date. |
| (b) | | | | Security exempt from registration pursuant to Rule 144A under the Securities Act of 1933, as amended. These securities may be resold in transactions exempt from registration to qualified institutional investors. |
| (c) | | | | Zero-coupon bond. |
| (d) | | | | Non-income producing security. |
| (e) | | | | Issuer filed for bankruptcy and/or is in default of principal and/or interest payments. |
| (f) | | | | U.S. government securities, held in escrow, are used to pay interest on this security, as well as to retire the bond in full at the date indicated, typically at a premium to par. |
| (g) | | | | Variable rate security. Rate shown is as of report date. |
| (h) | | | | Represent bonds transferred to a TOB. In exchange for which the Trust acquired residual interest certificates. These bonds serve as collateral in a financing transaction. See Note 3 of the Notes to Financial Statements for details of municipal bonds transferred to TOBs. |
| (i) | | | | All or a portion of security is subject to a recourse agreement, which may require the Trust to pay the liquidity provider in the event there is a shortfall between the TOB trust certificates and proceeds received from the sale of the security contributed to the TOB trust. In the case of a shortfall, the aggregate maximum potential amount the Trust could ultimately be required to pay under the agreements, which expire from January 1, 2015 to February 15, 2031 is $17,860,441. |
| (j) | | | | Investments in issuers considered to be an affiliate of the Trust during the year ended April 30, 2014, for purposes of Section 2(a)(3) of the Investment Company Act of 1940, as amended, were as follows: |
Affiliate
|
|
|
| Shares
Held at
April 30, 2013
|
| Net
Activity
|
| Shares
Held at
April 30, 2014
|
| Income
|
|
FFI Institutional Tax-Exempt Fund | | | | 920,424 | | (133,387) | | 787,037 | | $478 | |
| (k) | | | | Represents the current yield as of report date. |
| • | | | | Financial futures contracts outstanding as of April 30, 2014 were as follows: |
Contracts Sold
|
|
|
| Issue
|
| Exchange
|
| Expiration
|
| Notional
Value
|
| Unrealized
Depreciation
|
| (49) | | | | 10-Year U.S Treasury Note | | Chicago Board of Trade | | June 2014 | | $ | 6,096,672 | | | $ | (5,612 | ) |
See Notes to Financial Statements.
| ANNUAL REPORT | APRIL 30, 2014 | 27
|
| |
| Schedule of Investments (concluded) | BlackRock Long-Term Municipal Advantage Trust (BTA)
|
| • | | | | Fair Value Measurements — Various inputs are used in determining the fair value of investments and derivative financial instruments. These inputs to valuation techniques are categorized into a disclosure hierarchy consisting of three broad levels for financial statement purposes as follows: |
| • | | | | Level 1 — unadjusted price quotations in active markets/exchanges for identical assets or liabilities that the Trust has the ability to access |
| • | | | | Level 2 — other observable inputs (including, but not limited to, quoted prices for similar assets or liabilities in markets that are active, quoted prices for identical or similar assets or liabilities in markets that are not active, inputs other than quoted prices that are observable for the assets or liabilities (such as interest rates, yield curves, volatilities, prepayment speeds, loss severities, credit risks and default rates) or other market-corroborated inputs) |
| • | | | | Level 3 — unobservable inputs based on the best information available in the circumstances, to the extent observable inputs are not available (including the Trust’s own assumptions used in determining the fair value of investments and derivative financial instruments) |
| | | | | The hierarchy gives the highest priority to unadjusted quoted prices in active markets for identical assets or liabilities (Level 1 measurements) and the lowest priority to unobservable inputs (Level 3 measurements). Accordingly, the degree of judgment exercised in determining fair value is greatest for instruments categorized in Level 3. The inputs used to measure fair value may fall into different levels of the fair value hierarchy. In such cases, for disclosure purposes, the fair value hierarchy classification is determined based on the lowest level input that is significant to the fair value measurement in its entirety. |
| | | | | Changes in valuation techniques may result in transfers into or out of an assigned level within the disclosure hierarchy. In accordance with the Trust’s policy, transfers between different levels of the fair value disclosure hierarchy are deemed to have occurred as of the beginning of the reporting period. The categorization of a value determined for investments and derivative financial instruments is based on the pricing transparency of the investment and derivative financial instrument and is not necessarily an indication of the risks associated with investing in those securities. For information about the Trust’s policy regarding valuation of investments and derivative financial instruments, please refer to Note 2 of the Notes to Financial Statements. |
| | | | | The following tables summarize the Trust’s investments and derivative financial instruments categorized in the disclosure hierarchy as of April 30, 2014: |
|
|
|
| Level 1
|
| Level 2
|
| Level 3
|
| Total
|
Assets:
| | | | | | | | | | | |
Investments:
| | | | | | | | | | | | | | | | | | |
Long-Term Investments1 | | | | | — | | | $ | 247,017,403 | | | | — | | | $ | 247,017,403 | |
Short-Term Securities | | | | $ | 787,037 | | | | — | | | | — | | | | 787,037 | |
Total
| | | | $ | 787,037 | | | $ | 247,017,403 | | | | — | | | $ | 247,804,440 | |
| 1 | See above Schedule of Investments for values in each state or political subdivision. |
|
|
|
| Level 1
|
| Level 2
|
| Level 3
|
| Total
|
Derivative Financial Instruments2
| | | | | | | | | | | |
Liabilities:
| | | | | | | | | | | | | | | | | | |
Interest rate contracts | | | | $ | (5,612 | ) | | | — | | | | — | | | $ | (5,612 | ) |
| 2 | Derivative financial instruments are financial futures contracts, which are valued at the unrealized appreciation/depreciation on the instrument. |
| | | | | The carrying amount for certain of the Trust’s assets and/or liabilities approximates fair value for financial statement purposes. As of April 30, 2014, such assets and/or liabilities are categorized within the disclosure hierarchy as follows: |
|
|
|
| Level 1
|
| Level 2
|
| Level 3
|
| Total
|
Assets:
| | | | | | | | | | | |
Cash pledged for financial futures contracts | | | | $ | 101,000 | | | | — | | | | — | | | $ | 101,000 | |
Liabilities:
| | | | | | | | | | | | | | | | | | |
TOB trust certificates | | | | | — | | | $ | (89,035,874 | ) | | | — | | | | (89,035,874 | ) |
Total
| | | | $ | 101,000 | | | $ | (89,035,874 | ) | | | — | | | $ | (88,934,874 | ) |
There were no transfers between levels during the year ended April 30, 2014.
See Notes to Financial Statements.
| 28 | ANNUAL REPORT | APRIL 30, 2014
|
| |
| Schedule of Investments April 30, 2014 | BlackRock Municipal 2020 Term Trust (BKK)
(Percentages shown are based on Net Assets)
|
| Municipal Bonds | | | | Par
(000) | | Value |
Alabama — 0.7% | | | | | | | | | | |
Alabama 21st Century Authority Tobacco Settlement, Refunding RB, Series A, 5.00%, 6/01/20 | | | | $ | 1,000 | | | $ | 1,145,580 | |
Courtland Alabama IDB, Refunding RB, International Paper Co. Projects, Series A, 4.75%, 5/01/17 | | | | | 1,165 | | | | 1,184,013 | |
| | | | | | | | | 2,329,593 | |
Alaska — 2.0% | | | | | | | | | | |
City of Valdez Alaska, Refunding RB, BP Pinelines Project: | | | | | | | | | | |
Series B, 5.00%, 1/01/21 | | | | | 3,200 | | | | 3,755,072 | |
Series C, 5.00%, 1/01/21 | | | | | 2,500 | | | | 2,933,650 | |
| | | | | | | | | 6,688,722 | |
Arizona — 3.5% | | | | | | | | | | |
City of Phoenix, Arizona IDA, RB, Series A, 4.75%, 7/01/19 (a) | | | | | 640 | | | | 636,486 | |
Phoenix Civic Improvement Corp., Refunding RB, Junior Lien, Series A: | | | | | | | | | | |
5.00%, 7/01/20 | | | | | 1,300 | | | | 1,522,820 | |
5.00%, 7/01/21 | | | | | 5,585 | | | | 6,519,985 | |
Salt Verde Financial Corp., RB, Senior: | | | | | | | | | | |
5.00%, 12/01/18 | | | | | 1,500 | | | | 1,669,215 | |
5.25%, 12/01/20 | | | | | 1,000 | | | | 1,125,580 | |
| | | | | | | | | 11,474,086 | |
California — 9.0% | | | | | | | | | | |
California Health Facilities Financing Authority, RB, Sutter Health, Series B, 5.00%, 8/15/22 | | | | | 815 | | | | 945,270 | |
California Statewide Communities Development Authority, RB, John Muir Health, Series A, 5.00%, 8/15/22 | | | | | 5,000 | | | | 5,406,250 | |
County of Riverside California Asset Leasing Corp., RB, Riverside County Hospital Project (NPFGC), 0.00%, 6/01/25 (b) | | | | | 6,865 | | | | 4,192,044 | |
Los Angeles Regional Airports Improvement Corp. Facilities Lease, Refunding RB, LAXFuel Corp., Los Angeles International Airport, AMT: | | | | | | | | | | |
5.00%, 1/01/19 | | | | | 540 | | | | 618,349 | |
5.00%, 1/01/20 | | | | | 550 | | | | 635,134 | |
Los Angeles Unified School District California, GO, Series I, 5.00%, 7/01/20 | | | | | 3,750 | | | | 4,423,012 | |
State of California, GO, Refunding, Various Purpose, 5.25%, 10/01/22 | | | | | 1,000 | | | | 1,223,550 | |
State of California Department of Water Resources, Refunding RB, Series L, 5.00%, 5/01/20 | | | | | 10,000 | | | | 12,000,000 | |
| | | | | | | | | 29,443,609 | |
Colorado — 1.4% | | | | | | | | | | |
Colorado Health Facilities Authority, Refunding RB, Evangelical Lutheran Good Samaritan Society Project: | | | | | | | | | | |
4.00%, 12/01/19 | | | | | 555 | | | | 600,799 | |
4.00%, 12/01/20 | | | | | 580 | | | | 622,966 | |
E-470 Public Highway Authority Colorado, RB, CAB, Senior Series B (NPFGC), 0.00%, 9/01/22 (b) | | | | | 4,500 | | | | 3,332,205 | |
| | | | | | | | | 4,555,970 | |
District of Columbia — 1.6% | | | | | | | | | | |
Metropolitan Washington Airports Authority, Refunding RB, Series C-2, AMT (AGM), 5.00%, 10/01/24 | | | | | 5,000 | | | | 5,073,750 | |
Florida — 6.6% | | | | | | | | | | |
City of Jacksonville Florida, RB, Better Jacksonville, 5.00%, 10/01/22 | | | | | 5,160 | | | | 5,845,145 | |
County of Broward Florida School Board, COP, Series A (AGM), 5.25%, 7/01/22 | | | | | 1,250 | | | | 1,421,337 | |
County of Miami-Dade Florida, Refunding RB, Series A, AMT, 5.00%, 10/01/20 | | | | | 1,375 | | | | 1,580,301 | |
County of Miami-Dade Florida Expressway Authority, Refunding RB, Toll System, Series A, 5.00%, 7/01/20 | | | | | 500 | | | | 580,980 | |
Habitat Community Development District, Special Assessment Bonds, 5.80%, 5/01/25 | | | | | 1,615 | | | | 1,633,169 | |
| Municipal Bonds | | | | Par
(000) | | Value |
Florida (concluded) | | | | | | | | | | |
Miami Beach Health Facilities Authority, RB, Mount Sinai Medical Center Florida, 6.75%, 11/15/21 | | | | $ | 1,840 | | | $ | 1,895,586 | |
Pine Island Community Development District, RB, 5.30%, 11/01/10 (c)(d) | | | | | 250 | | | | 140,100 | |
State of Florida Board of Education, GO, Refunding, Capital Outlay, Series B, 5.00%, 6/01/20 | | | | | 5,000 | | | | 5,962,100 | |
Stevens Plantation Community Development District, Special Assessment Bonds, Series B, 6.38%, 12/31/49 | | | | | 3,530 | | | | 2,629,215 | |
| | | | | | | | | 21,687,933 | |
Georgia — 2.4% | | | | | | | | | | |
Gainesville & Hall County Development Authority, Refunding RB, ACTS Retirement — Life Communities, Inc. Obligated Group, 5.00%, 11/15/22 | | | | | 6,915 | | | | 7,759,806 | |
Guam — 0.5% | | | | | | | | | | |
Guam Government Waterworks Authority, RB, 5.25%, 7/01/20 | | | | | 250 | | | | 278,773 | |
Guam Power Authority, Refunding RB, Series A (AGM), 5.00%, 10/01/20 | | | | | 1,190 | | | | 1,374,557 | |
| | | | | | | | | 1,653,330 | |
Hawaii — 0.9% | | | | | | | | | | |
State of Hawaii Department of Budget & Finance, Refunding RB, Special Purpose Senior Living, Kahala Nui: | | | | | | | | | | |
5.00%, 11/15/19 | | | | | 1,275 | | | | 1,427,248 | |
5.00%, 11/15/20 | | | | | 1,440 | | | | 1,610,136 | |
| | | | | | | | | 3,037,384 | |
Illinois — 14.2% | | | | | | | | | | |
City of Chicago Illinois, O’Hare International Airport, GARB, Third Lien, Series A (AMBAC): | | | | | | | | | | |
5.00%, 1/01/21 | | | | | 5,000 | | | | 5,334,550 | |
5.00%, 1/01/22 | | | | | 7,000 | | | | 7,462,350 | |
Lake Cook-Dane & McHenry Counties Community Unit School District 220 Illinois, GO, Refunding, (AGM), 5.25%, 12/01/20 | | | | | 1,000 | | | | 1,198,380 | |
Metropolitan Pier & Exposition Authority Illinois, Refunding RB, CAB, McCormick, Series A (NPFGC), 0.00%, 6/15/22 (b) | | | | | 13,455 | | | | 10,208,174 | |
Railsplitter Tobacco Settlement Authority, RB, 5.25%, 6/01/20 | | | | | 10,000 | | | | 11,691,100 | |
State of Illinois, GO, 5.00%, 7/01/20 | | | | | 5,255 | | | | 6,006,570 | |
State of Illinois, RB, Series B: | | | | | | | | | | |
5.00%, 6/15/19 (e) | | | | | 515 | | | | 608,323 | |
5.00%, 6/15/20 | | | | | 1,485 | | | | 1,706,829 | |
State of Illinois Toll Highway Authority, RB, Senior Priority, Series A (AGM), 5.00%, 7/01/15 (e) | | | | | 2,250 | | | | 2,376,630 | |
| | | | | | | | | 46,592,906 | |
Indiana — 5.0% | | | | | | | | | | |
City of Vincennes Indiana, Refunding RB, Southwest Indiana Regional Youth Village, 6.25%, 1/01/24 | | | | | 3,515 | | | | 2,149,879 | |
Indiana Finance Authority, RB, Ohio River Bridges East End Crossing Project, Series B, AMT, 5.00%, 1/01/19 | | | | | 2,465 | | | | 2,666,933 | |
Indiana Municipal Power Agency, Refunding RB, Series A, 5.00%, 1/01/21 | | | | | 600 | | | | 700,830 | |
Indianapolis Airport Authority, Refunding RB, Special Facilities, FedEx Corp. Project, AMT, 5.10%, 1/15/17 | | | | | 10,000 | | | | 10,940,300 | |
| | | | | | | | | 16,457,942 | |
Iowa — 1.6% | | | | | | | | | | |
Iowa Finance Authority, Refunding RB, Midwestern Disaster Area, Iowa Fertilizer Co. Project, 5.00%, 12/01/19 | | | | | 5,320 | | | | 5,384,372 | |
See Notes to Financial Statements.
| ANNUAL REPORT | APRIL 30, 2014 | 29
|
| |
| Schedule of Investments (continued) | BlackRock Municipal 2020 Term Trust (BKK)
(Percentages shown are based on Net Assets)
|
| Municipal Bonds | | | | Par
(000) | | Value |
Kansas — 2.4% | | | | | | | | | | |
County of Wyandotte Kansas, Kansas City Unified Government, RB, Kansas International Speedway (NPFGC), 0.00%, 12/01/20 (b) | | | | $ | 6,440 | | | $ | 4,969,297 | |
Kansas Development Finance Authority, Refunding RB, Adventist Health, 5.25%, 11/15/20 | | | | | 2,500 | | | | 2,901,775 | |
| | | | | | | | | 7,871,072 | |
Kentucky — 2.1% | | | | | | | | | | |
County of Louisville & Jefferson Kentucky, Refunding RB, Catholic Health Initiatives, Series A: | | | | | | | | | | |
3.50%, 12/01/20 | | | | | 2,115 | | | | 2,255,690 | |
5.00%, 12/01/20 | | | | | 1,430 | | | | 1,678,834 | |
Kentucky Housing Corp., RB, Series C, AMT, 4.63%, 7/01/22 | | | | | 2,000 | | | | 2,053,280 | |
Kentucky Public Transportation Infrastructure Authority, RB, CAB, 1st Tier Downtown Crossing Project (b): | | | | | | | | | | |
0.00%, 7/01/19 | | | | | 255 | | | | 214,868 | |
0.00%, 7/01/20 | | | | | 1,000 | | | | 799,030 | |
| | | | | | | | | 7,001,702 | |
Louisiana — 0.6% | | | | | | | | | | |
Parish of DeSoto Louisiana, RB, Series A, AMT, 5.85%, 11/01/27 | | | | | 2,000 | | | | 2,005,480 | |
Maryland — 2.1% | | | | | | | | | | |
Anne Arundel County Consolidated, Special Taxing District, Refunding, Special Tax Bonds, The Villages of Dorchester and Farmington Village Project: | | | | | | | | | | |
4.00%, 7/01/19 | | | | | 285 | | | | 313,001 | |
5.00%, 7/01/20 | | | | | 500 | | | | 576,295 | |
Maryland EDC, RB, Transportation Facilities Project, Series A, 5.13%, 6/01/20 | | | | | 1,250 | | | | 1,349,063 | |
Maryland Health & Higher Educational Facilities Authority, Refunding RB: | | | | | | | | | | |
Charlestown Community, 5.50%, 1/01/21 | | | | | 1,335 | | | | 1,483,305 | |
University of Maryland, Medical System, 5.00%, 7/01/19 | | | | | 670 | | | | 774,647 | |
Maryland State and Local Facilities Loan, GO, First Series B, 5.00%, 3/15/20 | | | | | 2,000 | | | | 2,391,620 | |
| | | | | | | | | 6,887,931 | |
Massachusetts — 1.4% | | | | | | | | | | |
Massachusetts Development Finance Agency, RB, Waste Management, Inc. Project, AMT, 5.45%, 6/01/14 | | | | | 4,500 | | | | 4,520,295 | |
State of Massachusetts Water Pollution Abatement Trust, Refunding RB, MWRA Program, Sub-Series A, 6.00%, 8/01/23 | | | | | 140 | | | | 140,659 | |
| | | | | | | | | 4,660,954 | |
Michigan — 2.9% | | | | | | | | | | |
City of Royal Oak, Michigan Hospital Finance Authority, Refunding RB, Series D, 2.25%, 9/01/20 (f) | | | | | 1,500 | | | | 1,493,220 | |
Kalamazoo Hospital Finance Authority, Refunding RB, Bronson Methodist Hospital, 5.00%, 5/15/20 | | | | | 1,535 | | | | 1,690,511 | |
Lansing Board of Water & Light Utilities, RB, Series A, 3.50%, 7/01/20 | | | | | 1,000 | | | | 1,092,430 | |
State of Michigan, Refunding RB: | | | | | | | | | | |
5.00%, 11/01/20 | | | | | 1,000 | | | | 1,163,590 | |
5.00%, 11/01/21 | | | | | 2,000 | | | | 2,328,560 | |
State of Michigan Building Authority, Refunding RB, Facilities Program: | | | | | | | | | | |
Series 1-A, 5.00%, 10/15/20 | | | | | 325 | | | | 377,273 | |
Series 2-A, 4.00%, 10/15/20 | | | | | 1,205 | | | | 1,326,886 | |
| | | | | | | | | 9,472,470 | |
| Municipal Bonds | | | | Par
(000) | | Value |
Minnesota — 2.2% | | | | | | | | | | |
Minnesota Higher Education Facilities Authority, RB, University of St. Thomas, Series 5-Y, 5.00%, 10/01/24 | | | | $ | 1,250 | | | $ | 1,273,988 | |
State of Michigan Trunk Highway, GO, Series B, 5.00%, 10/01/20 | | | | | 5,000 | | | | 5,998,450 | |
| | | | | | | | | 7,272,438 | |
Missouri — 3.0% | | | | | | | | | | |
City of Kansas City Missouri Airport, Refunding RB, Series A, AMT, 5.00%, 9/01/20 | | | | | 3,000 | | | | 3,492,810 | |
State of Missouri Health & Educational Facilities Authority, Refunding RB, Series A: | | | | | | | | | | |
BJC Health System, 5.00%, 5/15/20 | | | | | 5,500 | | | | 5,760,150 | |
Coxhealth, 5.00%, 11/15/20 | | | | | 500 | | | | 584,615 | |
| | | | | | | | | 9,837,575 | |
Multi-State — 3.4% | | | | | | | | | | |
Centerline Equity Issuer Trust (a)(g): | | | | | | | | | | |
Series A-4-1, 5.75%, 5/15/15 | | | | | 1,000 | | | | 1,044,840 | |
Series A-4-2, 6.00%, 5/15/19 | | | | | 2,500 | | | | 2,875,600 | |
Series B-3-1, 6.00%, 5/15/15 | | | | | 4,000 | | | | 4,180,120 | |
Series B-3-2, 6.30%, 5/15/19 | | | | | 2,500 | | | | 2,906,700 | |
| | | | | | | | | 11,007,260 | |
Nebraska — 1.2% | | | | | | | | | | |
Central Plains Energy Project, RB, Gas Project No. 3, 5.00%, 9/01/20 | | | | | 3,500 | | | | 3,894,660 | |
Nevada — 2.6% | | | | | | | | | | |
County of Clark Nevada, Refunding ARB, Las Vegas McCarran International Airport, Series B: | | | | | | | | | | |
5.00%, 7/01/19 | | | | | 500 | | | | 575,960 | |
5.00%, 7/01/20 | | | | | 1,000 | | | | 1,154,460 | |
County of Clark Nevada, Refunding RB, Alexander Dawson School Nevada Project, 5.00%, 5/15/20 | | | | | 5,000 | | | | 5,350,900 | |
County of Clark Nevada, Refunding, Special Assessment Bonds, Special Improvement District No. 142, 5.00%, 8/01/20 | | | | | 1,490 | | | | 1,581,784 | |
| | | | | | | | | 8,663,104 | |
New Jersey — 4.2% | | | | | | | | | | |
Middlesex County Improvement Authority, RB, George Street Student Housing Project, Series A, 5.00%, 8/15/14 (e) | | | | | 1,000 | | | | 1,014,130 | |
New Jersey EDA, RB, Private Activity Bonds, The Goethals Bridge Replacement Project, AMT, 5.00%, 7/01/20 | | | | | 250 | | | | 286,598 | |
New Jersey EDA, Refunding RB: | | | | | | | | | | |
Cigarette Tax, 5.00%, 6/15/20 | | | | | 2,500 | | | | 2,860,325 | |
School Facilities, Series GG, 5.00%, 9/01/22 | | | | | 2,000 | | | | 2,310,960 | |
New Jersey Educational Facilities Authority, Refunding RB: | | | | | | | | | | |
Seton Hall University, Series D, 5.00%, 7/01/19 | | | | | 1,060 | | | | 1,229,536 | |
Seton Hall University, Series D, 5.00%, 7/01/20 | | | | | 650 | | | | 757,718 | |
University of Medicine & Dentistry, Series B, 6.25%, 12/01/18 (h) | | | | | 2,500 | | | | 3,065,600 | |
New Jersey Health Care Facilities Financing Authority, Refunding RB, AtlantiCare Regional Medical Center, 5.00%, 7/01/20 | | | | | 2,110 | | | | 2,304,099 | |
| | | | | | | | | 13,828,966 | |
New York — 7.2% | | | | | | | | | | |
City of New York New York Industrial Development Agency, ARB, American Airlines, Inc., JFK International Airport, AMT (i): | | | | | | | | | | |
7.63%, 8/01/25 | | | | | 3,885 | | | | 4,264,875 | |
7.75%, 8/01/31 | | | | | 5,000 | | | | 5,502,300 | |
New York Mortgage Agency, Refunding RB, 35th Series, AMT, 4.50%, 10/01/20 | | | | | 2,165 | | | | 2,198,882 | |
See Notes to Financial Statements.
| 30 | ANNUAL REPORT | APRIL 30, 2014
|
| |
| Schedule of Investments (continued) | BlackRock Municipal 2020 Term Trust (BKK)
(Percentages shown are based on Net Assets)
|
| Municipal Bonds | | | | Par
(000) | | Value |
New York (concluded) | | | | | | | | | | |
New York State Energy Research & Development Authority, Refunding RB, Brooklyn Union Gas/Keyspan, Series A, AMT (NPFGC), 4.70%, 2/01/24 | | | | $ | 8,500 | | | $ | 8,936,985 | |
New York State Thruway Authority, Refunding RB, General, Series I, 5.00%, 1/01/20 | | | | | 875 | | | | 1,026,795 | |
Port Authority of New York & New Jersey, ARB, JFK International Air Terminal LLC Project, 5.00%, 12/01/20 | | | | | 1,525 | | | | 1,692,064 | |
| | | | | | | | | 23,621,901 | |
North Carolina — 2.3% | | | | | | | | | | |
North Carolina Eastern Municipal Power Agency, Refunding RB, Series B, 5.00%, 1/01/21 | | | | | 1,550 | | | | 1,744,479 | |
North Carolina Municipal Power Agency No. 1, Refunding RB, Series B, 5.00%, 1/01/20 | | | | | 5,000 | | | | 5,846,800 | |
| | | | | | | | | 7,591,279 | |
Ohio — 1.7% | | | | | | | | | | |
Ohio State Water Development Authority, Refunding RB, Series B, 4.00%, 12/01/33 (i) | | | | | 5,300 | | | | 5,535,691 | |
Oklahoma — 1.0% | | | | | | | | | | |
Canadian County Educational Facilities Authority, RB, Mustang Public Schools Project, 4.50%, 9/01/20 | | | | | 1,500 | | | | 1,673,460 | |
County of Oklahoma Finance Authority, Refunding RB, Epworth Villa Project, Series A, 2.50%, 4/01/15 | | | | | 225 | | | | 223,099 | |
County of Tulsa Oklahoma Industrial Authority, RB, Broken Arrow Public School, 4.00%, 9/01/22 | | | | | 1,100 | | | | 1,217,315 | |
| | | | | | | | | 3,113,874 | |
Pennsylvania — 4.9% | | | | | | | | | | |
East Hempfield Township IDA, RB, Student Services, Inc., Student Housing Project: | | | | | | | | | | |
4.00%, 7/01/19 | | | | | 360 | | | | 373,784 | |
4.00%, 7/01/20 | | | | | 465 | | | | 478,304 | |
Lancaster Industrial Development Authority, Refunding RB, Garden Spot Village Project, 5.00%, 5/01/19 | | | | | 1,300 | | | | 1,400,750 | |
Pennsylvania Economic Development Financing Authority, Refunding RB, Amtrak Project, Series A, AMT, 4.00%, 11/01/20 | | | | | 2,175 | | | | 2,322,204 | |
Pennsylvania Higher Educational Facilities Authority, RB, Shippensburg University Student Services: | | | | | | | | | | |
4.00%, 10/01/19 | | | | | 1,165 | | | | 1,216,912 | |
4.00%, 10/01/20 | | | | | 1,210 | | | | 1,255,060 | |
Pennsylvania Higher Educational Facilities Authority, Refunding RB, Series A: | | | | | | | | | | |
Drexel University, 5.00%, 5/01/20 | | | | | 1,575 | | | | 1,820,810 | |
Widener University, 5.00%, 7/15/20 | | | | | 600 | | | | 672,636 | |
Pennsylvania Housing Finance Agency, Refunding RB, S/F Mortgage, Series 115A, AMT: | | | | | | | | | | |
2.30%, 10/01/19 | | | | | 460 | | | | 460,520 | |
2.55%, 4/01/20 | | | | | 850 | | | | 844,560 | |
2.65%, 10/01/20 | | | | | 865 | | | | 862,319 | |
Pennsylvania IDA, Refunding RB, Economic Development, 5.00%, 7/01/20 | | | | | 1,500 | | | | 1,743,870 | |
Pennsylvania Turnpike Commission, RB, Sub-Series A (AGC), 5.00%, 6/01/22 | | | | | 1,000 | | | | 1,115,250 | |
State Public School Building Authority, RB, Community College Allegheny County Project (AGM), 5.00%, 7/15/20 | | | | | 995 | | | | 1,157,135 | |
Swarthmore Borough Authority, Refunding RB, Swarthmore College Project, 5.00%, 9/15/20 | | | | | 350 | | | | 416,448 | |
| | | | | | | | | 16,140,562 | |
Rhode Island — 1.3% | | | | | | | | | | |
Rhode Island Student Loan Authority, RB, Student Loan Program, Senior Series A, AMT, 5.00%, 12/01/20 | | | | | 3,850 | | | | 4,300,604 | |
| Municipal Bonds | | | | Par
(000) | | Value |
South Carolina — 0.7% | | | | | | | | | | |
South Carolina State Ports Authority, RB, 5.00%, 7/01/20 | | | | $ | 2,000 | | | $ | 2,328,920 | |
Texas — 13.1% | | | | | | | | | | |
Central Texas Regional Mobility Authority, Refunding RB, Senior Lien: | | | | | | | | | | |
5.75%, 1/01/19 | | | | | 800 | | | | 915,400 | |
5.75%, 1/01/20 | | | | | 1,140 | | | | 1,317,703 | |
City of Dallas Texas, Refunding RB, Civic Center Convention Complex (AGC), 5.00%, 8/15/21 | | | | | 2,500 | | | | 2,801,075 | |
City of Frisco Texas, GO, Refunding, 3.00%, 2/15/20 | | | | | 2,250 | | | | 2,420,528 | |
City of Houston Texas, Refunding RB, Subordinate Lien, Series B, 5.00%, 7/01/20 | | | | | 250 | | | | 290,803 | |
Love Field Airport Modernization Corp., RB, Southwest Airlines Co., Love Field Modernization Program Project, 5.00%, 11/01/20 | | | | | 3,715 | | | | 4,161,469 | |
Lower Colorado River Authority, Refunding RB, LCRA Transmission Corp. Project, Series B, 5.00%, 5/15/20 | | | | | 5,000 | | | | 5,766,900 | |
New Hope Cultural Education Facilities Corp., RB, Tarleton State University Project, Series A: | | | | | | | | | | |
4.00%, 4/01/19 | | | | | 345 | | | | 356,033 | |
4.00%, 4/01/20 | | | | | 415 | | | | 424,213 | |
North Texas Tollway Authority, Refunding RB, Series C: | | | | | | | | | | |
5.25%, 1/01/20 | | | | | 1,000 | | | | 1,136,520 | |
5.38%, 1/01/21 | | | | | 5,000 | | | | 5,726,950 | |
Texas Municipal Gas Acquisition & Supply Corp. III, RB, 5.00%, 12/15/20 | | | | | 5,000 | | | | 5,501,000 | |
Texas State Turnpike Authority, RB, CAB, 1st Tier, Series A (AMBAC) (b): | | | | | | | | | | |
0.00%, 8/15/21 | | | | | 7,990 | | | | 6,408,459 | |
0.00%, 8/15/24 | | | | | 8,450 | | | | 5,757,914 | |
| | | | | | | | | 42,984,967 | |
US Virgin Islands — 0.3% | | | | | | | | | | |
Virgin Islands Public Finance Authority, RB, Senior Lien, Matching Fund Loan Note, Series A, 5.25%, 10/01/14 (e) | | | | | 1,000 | | | | 1,020,970 | |
Virginia — 5.1% | | | | | | | | | | |
City of Norfolk Virginia Water Revenue, Refunding RB, 5.00%, 11/01/20 | | | | | 2,000 | | | | 2,390,320 | |
County of Charles City Virginia EDA, RB, Waste Management, Inc. Project, Mandatory Put Bonds, AMT, 5.13%, 8/01/27 (i) | | | | | 10,000 | | | | 10,000,000 | |
County of Hanover Virginia EDC, Refunding RB, Covenant Woods, Series A, 3.00%, 7/01/15 | | | | | 465 | | | | 469,208 | |
County of Russell Virginia IDA, Refunding RB, Appalachian Power, Series K, 4.63%, 11/01/21 | | | | | 2,000 | | | | 2,180,180 | |
Roanoke EDA, Refunding RB, Carilion Clinic Obligation Group, 5.00%, 7/01/20 | | | | | 1,500 | | | | 1,736,340 | |
| | | | | | | | | 16,776,048 | |
Washington — 2.5% | | | | | | | | | | |
County of Snohomish Washington Everett School District No. 2, GO, Refunding, 5.00%, 12/01/20 | | | | | 2,625 | | | | 3,119,734 | |
Washington Health Care Facilities Authority, Refunding RB, Providence Health & Services, Series B: | | | | | | | | | | |
5.00%, 10/01/20 | | | | | 250 | | | | 294,060 | |
5.00%, 10/01/42 (i) | | | | | 4,000 | | | | 4,696,960 | |
| | | | | | | | | 8,110,754 | |
Wisconsin — 0.9% | | | | | | | | | | |
State of Wisconsin, Refunding RB, Series A, 5.25%, 5/01/20 | | | | | 1,000 | | | | 1,178,340 | |
Wisconsin Health & Educational Facilities Authority, Refunding RB, Froedtert & Community Health, Inc., 5.00%, 4/01/20 | | | | | 1,515 | | | | 1,725,009 | |
| | | | | | | | | 2,903,349 | |
Total Municipal Bonds — 118.5% | | | | | | | | | 388,971,934 | |
See Notes to Financial Statements.
| ANNUAL REPORT | APRIL 30, 2014 | 31
|
| |
| Schedule of Investments (continued) | BlackRock Municipal 2020 Term Trust (BKK)
(Percentages shown are based on Net Assets)
|
Municipal Bonds Transferred to
Tender Option Bond Trusts (j) | | | | Par
(000) | | Value |
Illinois — 1.7% | | | | | | | | | | |
City of Chicago Illinois Waterworks, Refunding RB, Second Lien (AGM), 5.00%, 11/01/20 | | | | $ | 5,000 | | | $ | 5,634,000 | |
Total Long-Term Investments
(Cost — $371,808,999) — 120.2% | | | | | | | | | 394,605,934 | |
|
Short-Term Securities
| | | | | Shares | | | | | |
Money Market Funds — 0.7% | | | | | | | | | | |
FFI Institutional Tax-Exempt Fund, 0.03% (k)(l) | | | | | 2,353,008 | | | | 2,353,008 | |
Short-Term Securities | | | | Par
(000) | | Value |
New York — 0.1% | | | | | | | | | | |
City of New York New York Water & Sewer System, Refunding RB, VRDN, Sub-Series A-2 (Mizuho Corporate Bank SBPA), 0.06%, 6/15/44 (m) | | | | $ | 100 | | | $ | 100,000 | |
Total Short-Term Securities
(Cost — $2,453,008) — 0.8% | | | | | | | | | 2,453,008 | |
Total Investments (Cost — $374,262,007) — 121.0% | | | | | | | | | 397,058,942 | |
Other Assets Less Liabilities — 0.8% | | | | | | | | | 2,808,760 | |
Liability for TOB Trust Certificates, Including Interest Expense and Fees Payable — (1.1%) | | | | | | | | | (3,754,407 | ) |
AMPS, at Redemption Value — (20.7%) | | | | | | | | | (67,950,000 | ) |
Net Assets Applicable to Common Shares — 100.0% | | | | | | | | $ | 328,163,295 | |
Notes to Schedule of Investments
| (a) | | | | Security exempt from registration pursuant to Rule 144A under the Securities Act of 1933, as amended. These securities may be resold in transactions exempt from registration to qualified institutional investors. |
| (b) | | | | Zero-coupon bond. |
| (c) | | | | Non-income producing security. |
| (d) | | | | Issuer filed for bankruptcy and/or is in default of principal and/or interest payments. |
| (e) | | | | U.S. government securities, held in escrow, are used to pay interest on this security, as well as to retire the bond in full at the date indicated, typically at a premium to par. |
| (f) | | | | When-issued security. Unsettled when-issued transactions were as follows: |
Counterparty
|
|
|
| Value
|
| Unrealized
Depreciation
|
Morgan Stanley & Co. LLC | | | | $ | 1,493,220 | | | $ | (2,370 | ) |
| (g) | | | | Represents a beneficial interest in a trust. The collateral deposited into the trust is federally tax-exempt revenue bonds issued by various state or local governments, or their respective agencies or authorities. The security is subject to remarketing prior to its stated maturity. |
| (h) | | | | Security is collateralized by municipal or U.S. Treasury obligations. |
| (i) | | | | Variable rate security. Rate shown is as of report date. |
| (j) | | | | Represent bonds transferred to a TOB. In exchange for which the Trust acquired residual interest certificates. These bonds serve as collateral in a financing transaction. See Note 3 of the Notes to Financial Statements for details of municipal bonds transferred to TOBs. |
| (k) | | | | Investments in issuers considered to be an affiliate of the Trust during the year ended April 30, 2014, for purposes of Section 2(a)(3) of the 1940 Act, were as follows: |
Affiliate
|
|
|
| Shares
Held at
April 30, 2013
|
| Net
Activity
|
| Shares
Held at
April 30, 2014
|
| Income
|
|
FFI Institutional Tax-Exempt Fund | | | | 1,959,251 | | 393,757 | | 2,353,008 | | $2,816 | |
| (l) | | | | Represents the current yield as of report date. |
| (m) | | | | Variable rate security. Rate shown is as of report date and maturity shown is the date the principal owed can be recovered through demand. |
| • | | | | Fair Value Measurements — Various inputs are used in determining the fair value of investments. These inputs to valuation techniques are categorized into a disclosure hierarchy consisting of three broad levels for financial statement purposes as follows: |
| • | | | | Level 1 — unadjusted price quotations in active markets/exchanges for identical assets or liabilities that the Trust has the ability to access |
| • | | | | Level 2 — other observable inputs (including, but not limited to, quoted prices for similar assets or liabilities in markets that are active, quoted prices for identical or similar assets or liabilities in markets that are not active, inputs other than quoted prices that are observable for the assets or liabilities (such as interest rates, yield curves, volatilities, prepayment speeds, loss severities, credit risks and default rates) or other market-corroborated inputs) |
| • | | | | Level 3 — unobservable inputs based on the best information available in the circumstances, to the extent observable inputs are not available (including the Trust’s own assumptions used in determining the fair value of investments) |
| | | | | The hierarchy gives the highest priority to unadjusted quoted prices in active markets for identical assets or liabilities (Level 1 measurements) and the lowest priority to unobservable inputs (Level 3 measurements). Accordingly, the degree of judgment exercised in determining fair value is greatest for instruments categorized in Level 3. The inputs used to measure fair value may fall into different levels of the fair value hierarchy. In such cases, for disclosure purposes, the fair value hierarchy classification is determined based on the lowest level input that is significant to the fair value measurement in its entirety. |
See Notes to Financial Statements.
| 32 | ANNUAL REPORT | APRIL 30, 2014
|
| |
| Schedule of Investments (concluded) | BlackRock Municipal 2020 Term Trust (BKK)
|
| | | | | Changes in valuation techniques may result in transfers into or out of an assigned level within the disclosure hierarchy. In accordance with the Trust’s policy, transfers between different levels of the fair value disclosure hierarchy are deemed to have occurred as of the beginning of the reporting period. The categorization of a value determined for investments is based on the pricing transparency of the investment and is not necessarily an indication of the risks associated with investing in those securities. For information about the Trust’s policy regarding valuation of investments, please refer to Note 2 of the Notes to Financial Statements. |
| | | | | The following table summarizes the Trust’s investments categorized in the disclosure hierarchy as of April 30, 2014: |
|
|
|
| Level 1
|
| Level 2
|
| Level 3
|
| Total
|
Assets:
| | | | | | | | | | | | | | | | | | |
Investments:
| | | | | | | | | | | | | | | | | | |
Long-Term Investments1 | | | | | — | | | $ | 394,605,934 | | | | — | | | $ | 394,605,934 | |
Short-Term Securities | | | | $ | 2,353,008 | | | | 100,000 | | | | — | | | | 2,453,008 | |
Total
| | | | $ | 2,353,008 | | | $ | 394,705,934 | | | | — | | | $ | 397,058,942 | |
| 1 | See above Schedule of Investments for values in each state or political subdivision. |
| | | | | The carrying amount for certain of the Trust’s liabilities approximates fair value for financial statement purposes. As of April 30, 2014, TOB trust certificates of $(3,750,000) are categorized as Level 2 within the disclosure hierarchy. |
| | | | | There were no transfers between levels during the year ended April 30, 2014. |
See Notes to Financial Statements.
| ANNUAL REPORT | APRIL 30, 2014 | 33
|
| |
| Schedule of Investments April 30, 2014 | BlackRock Municipal Income Trust (BFK)
(Percentages shown are based on Net Assets)
|
| Municipal Bonds | | | | Par
(000) | | Value |
Alabama — 3.4% | | | | | | | | | | |
Alabama State Docks Department, Refunding RB, 6.00%, 10/01/40 | | | | $ | 4,080 | | | $ | 4,654,219 | |
County of Jefferson Alabama, RB, Limited Obligation School, Series A, 5.25%, 1/01/19 | | | | | 2,910 | | | | 2,924,346 | |
County of Jefferson Alabama Sewer, Refunding RB: | | | | | | | | | | |
Convertible CAB, Senior Lien, Series C (AGM), 0.00%, 10/01/38 (a) | | | | | 1,135 | | | | 689,785 | |
Convertible CAB, Senior Lien, Series C (AGM), 0.00%, 10/01/42 (a) | | | | | 985 | | | | 594,802 | |
Senior Lien, Series A (AGM), 5.00%, 10/01/44 | | | | | 1,555 | | | | 1,577,936 | |
Senior Lien, Series A (AGM), 5.25%, 10/01/48 | | | | | 2,960 | | | | 3,044,449 | |
Sub-Lien, Series D, 6.00%, 10/01/42 | | | | | 5,740 | | | | 6,055,126 | |
Sub-Lien, Series D, 7.00%, 10/01/51 | | | | | 1,765 | | | | 1,994,221 | |
| | | | | | | | | 21,534,884 | |
Arizona — 3.0% | | | | | | | | | | |
Salt Verde Financial Corp., RB, Senior: | | | | | | | | | | |
5.00%, 12/01/32 | | | | | 10,030 | | | | 10,989,570 | |
5.00%, 12/01/37 | | | | | 7,460 | | | | 8,170,416 | |
| | | | | | | | | 19,159,986 | |
California — 14.9% | | | | | | | | | | |
Bay Area Toll Authority, Refunding RB, San Francisco Bay Area Toll Bridge, Series F-1, 5.63%, 4/01/44 | | | | | 4,445 | | | | 4,864,119 | |
California Health Facilities Financing Authority, RB, Sutter Health, Series B, 6.00%, 8/15/42 | | | | | 6,230 | | | | 7,379,933 | |
California Health Facilities Financing Authority, Refunding RB, St. Joseph Health System, Series A, 5.00%, 7/01/33 | | | | | 2,465 | | | | 2,696,094 | |
California Pollution Control Financing Authority, RB (b): | | | | | | | | | | |
County of San Diego California Water Authority Desalination Project Pipeline, 5.00%, 11/21/45 | | | | | 2,415 | | | | 2,415,531 | |
Poseidon Resources (Channel Side) LP Desalination Project, AMT, 5.00%, 7/01/37 | | | | | 2,015 | | | | 2,020,219 | |
Poseidon Resources (Channel Side) LP Desalination Project, AMT, 5.00%, 11/21/45 | | | | | 2,970 | | | | 2,911,224 | |
California State Public Works Board, LRB Various Capital Projects: | | | | | | | | | | |
Series I, 5.00%, 11/01/38 | | | | | 1,495 | | | | 1,602,446 | |
Sub-Series I-1, 6.38%, 11/01/34 | | | | | 2,315 | | | | 2,775,893 | |
California Statewide Communities Development Authority, Refunding RB, Episcopal Communities & Services: | | | | | | | | | | |
5.00%, 5/15/42 | | | | | 650 | | | | 655,551 | |
5.00%, 5/15/47 | | | | | 705 | | | | 709,928 | |
City of Los Angeles California Department of Airports, Refunding ARB, Los Angeles International Airport, Series A: | | | | | | | | | | |
5.25%, 5/15/39 | | | | | 1,560 | | | | 1,757,434 | |
Senior, 5.00%, 5/15/40 | | | | | 11,690 | | | | 12,599,833 | |
City of Stockton California Public Financing Authority, RB, Delta Water Supply Project, Series A, 6.25%, 10/01/40 | | | | | 690 | | | | 771,730 | |
County of Stanislaus California Tobacco Securitization Agency, RB, CAB, County of Stanislaus Tobacco Funding Cop., Sub-Series C, 0.00%, 6/01/55 (c) | | | | | 17,855 | | | | 223,187 | |
Foothill-De Anza Community College District, GO, Election of 2006, Series C, 5.00%, 8/01/40 | | | | | 7,000 | | | | 7,615,650 | |
Murrieta Community Facilities District Special Tax California, Special Tax Bonds, District No. 2, The Oaks Improvement Area A, 6.00%, 9/01/34 | | | | | 5,000 | | | | 5,020,700 | |
Riverside County Transportation Commission, RB, CAB, Senior Lien, Series B (c): | | | | | | | | | | |
0.00%, 6/01/41 | | | | | 5,000 | | | | 1,014,200 | |
0.00%, 6/01/42 | | | | | 6,000 | | | | 1,141,680 | |
0.00%, 6/01/43 | | | | | 5,000 | | | | 894,400 | |
| Municipal Bonds | | | | Par
(000) | | Value |
California (concluded) | | | | | | | | | | |
San Diego Community College District California, GO, Election of 2006, 5.00%, 8/01/43 | | | | $ | 2,115 | | | $ | 2,330,392 | |
San Marcos Unified School District, GO, CAB, Election of 2010, Series B (c): | | | | | | | | | | |
0.00%, 8/01/34 | | | | | 3,500 | | | | 1,339,240 | |
0.00%, 8/01/36 | | | | | 4,000 | | | | 1,371,040 | |
State of California, GO, Various Purposes: | | | | | | | | | | |
6.00%, 3/01/33 | | | | | 4,970 | | | | 5,956,744 | |
6.50%, 4/01/33 | | | | | 20,410 | | | | 24,874,279 | |
| | | | | | | | | 94,941,447 | |
Colorado — 1.7% | | | | | | | | | | |
Colorado Health Facilities Authority, Refunding RB: | | | | | | | | | | |
Catholic Health Initiative, Series A, 5.50%, 7/01/34 | | | | | 4,205 | | | | 4,768,344 | |
Evangelical Lutheran Good Samaritan Society Project, 5.00%, 12/01/42 | | | | | 3,425 | | | | 3,479,492 | |
Park Creek Metropolitan District, Refunding RB, Senior Limited Property Tax, 5.50%, 12/01/37 | | | | | 2,530 | | | | 2,540,474 | |
| | | | | | | | | 10,788,310 | |
Connecticut — 0.4% | | | | | | | | | | |
Connecticut State Health & Educational Facility Authority, RB, Ascension Health Senior Credit, Series A, 5.00%, 11/15/40 | | | | | 2,710 | | | | 2,886,421 | |
Delaware — 2.0% | | | | | | | | | | |
County of Sussex Delaware, RB, NRG Energy, Inc., Indian River Power LLC Project, 6.00%, 10/01/40 | | | | | 2,225 | | | | 2,381,084 | |
Delaware State EDA, RB, Exempt Facilities, Indian River Power LLC Project, 5.38%, 10/01/45 | | | | | 10,080 | | | | 10,284,926 | |
| | | | | | | | | 12,666,010 | |
District of Columbia — 4.4% | | | | | | | | | | |
District of Columbia, Refunding RB, Kipp Charter School, Series A, 6.00%, 7/01/43 | | | | | 1,480 | | | | 1,640,491 | |
District of Columbia Tobacco Settlement Financing Corp., Refunding RB, Asset-Backed, 6.75%, 5/15/40 | | | | | 23,035 | | | | 23,031,775 | |
Metropolitan Washington Airports Authority, Refunding RB, 1st Senior Lien, Series A: | | | | | | | | | | |
5.00%, 10/01/39 | | | | | 990 | | | | 1,033,847 | |
5.25%, 10/01/44 | | | | | 2,465 | | | | 2,592,860 | |
| | | | | | | | | 28,298,973 | |
Florida — 3.4% | | | | | | | | | | |
County of Miami-Dade Florida Aviation, Refunding ARB, Miami International Airport, Series A-1, 5.38%, 10/01/41 | | | | | 2,280 | | | | 2,474,005 | |
County of Orange Florida Health Facilities Authority, Refunding RB, Mayflower Retirement Center: | | | | | | | | | | |
5.00%, 6/01/32 | | | | | 600 | | | | 618,006 | |
5.00%, 6/01/36 | | | | | 125 | | | | 127,990 | |
5.13%, 6/01/42 | | | | | 1,925 | | | | 1,974,915 | |
County of Tampa-Hillsborough Florida Expressway Authority, Refunding RB, Series A, 5.00%, 7/01/37 | | | | | 1,225 | | | | 1,308,704 | |
Miami Beach Health Facilities Authority, RB, Mount Sinai Medical Center Florida, 6.75%, 11/15/21 | | | | | 5,570 | | | | 5,738,270 | |
Mid-Bay Bridge Authority, RB, Springing Lien, Series A, 7.25%, 10/01/40 | | | | | 5,885 | | | | 6,712,725 | |
Stevens Plantation Community Development District, Special Assessment, Series A, 7.10%, 5/01/35 (d)(e) | | | | | 3,590 | | | | 2,676,489 | |
| | | | | | | | | 21,631,104 | |
See Notes to Financial Statements.
| 34 | ANNUAL REPORT | APRIL 30, 2014
|
| |
| Schedule of Investments (continued) | BlackRock Municipal Income Trust (BFK)
(Percentages shown are based on Net Assets)
|
| Municipal Bonds | | | | Par
(000) | | Value |
Georgia — 1.8% | | | | | | | | | | |
DeKalb Private Hospital Authority, Refunding RB, Children’s Healthcare, 5.25%, 11/15/39 | | | | $ | 1,650 | | | $ | 1,828,695 | |
Metropolitan Atlanta Rapid Transit Authority, RB, Sales Tax, 3rd Indenture, Series A, 5.00%, 7/01/39 | | | | | 5,000 | | | | 5,437,500 | |
Richmond County Development Authority, Refunding RB, International Paper Co. Project, Series A, AMT, 6.00%, 2/01/25 | | | | | 4,000 | | | | 4,002,360 | |
| | | | | | | | | 11,268,555 | |
Hawaii — 0.5% | | | | | | | | | | |
State of Hawaii Harbor System, RB, Series A, 5.25%, 7/01/30 | | | | | 2,660 | | | | 2,936,347 | |
Illinois — 18.3% | | | | | | | | | | |
City of Chicago Illinois, GARB, O’Hare International Airport, 3rd Lien, Series C, 6.50%, 1/01/41 | | | | | 11,385 | | | | 13,209,332 | |
City of Chicago Illinois, GO, Series A: | | | | | | | | | | |
Project, 5.00%, 1/01/34 | | | | | 6,270 | | | | 6,329,189 | |
Refunding, 5.25%, 1/01/32 | | | | | 6,155 | | | | 6,386,120 | |
Refunding, 5.00%, 1/01/34 | | | | | 2,500 | | | | 2,528,500 | |
City of Chicago Illinois, Refunding RB, Sales Tax, Series A, 5.25%, 1/01/38 | | | | | 1,605 | | | | 1,702,536 | |
City of Chicago Illinois Board of Education, GO, Series A, 5.25%, 12/01/41 | | | | | 8,680 | | | | 8,706,474 | |
City of Chicago Illinois Transit Authority, RB, Sales Tax Receipts, 5.25%, 12/01/40 | | | | | 2,055 | | | | 2,193,856 | |
City of Chicago Illinois Waterworks, Refunding RB, 2nd Lien Project, 5.00%, 11/01/42 | | | | | 7,625 | | | | 7,870,144 | |
County of Cook Illinois Community College District No. 508, GO, City College of Chicago, 5.50%, 12/01/38 | | | | | 1,525 | | | | 1,681,328 | |
Illinois Finance Authority, RB, Advocate Health Care, Series C, 5.38%, 4/01/44 | | | | | 10,630 | | | | 11,359,643 | |
Illinois Finance Authority, Refunding RB: | | | | | | | | | | |
Ascension Health, Series A, 5.00%, 11/15/37 | | | | | 1,895 | | | | 2,033,866 | |
Ascension Health, Series A, 5.00%, 11/15/42 | | | | | 3,450 | | | | 3,674,940 | |
Central Dupage Health, Series B, 5.50%, 11/01/39 | | | | | 3,160 | | | | 3,508,232 | |
Friendship Village Schaumburg, Series A, 5.63%, 2/15/37 | | | | | 470 | | | | 434,374 | |
Illinois State Toll Highway Authority, RB, Series A, 5.00%, 1/01/38 | | | | | 4,550 | | | | 4,798,430 | |
Metropolitan Pier & Exposition Authority, Refunding RB, McCormick Place Expansion Project: | | | | | | | | | | |
Series B (AGM), 5.00%, 6/15/50 | | | | | 14,710 | | | | 15,008,025 | |
Series B-2, 5.00%, 6/15/50 | | | | | 3,905 | | | | 3,983,178 | |
Railsplitter Tobacco Settlement Authority, RB: | | | | | | | | | | |
5.50%, 6/01/23 | | | | | 885 | | | | 1,031,379 | |
6.00%, 6/01/28 | | | | | 2,245 | | | | 2,605,143 | |
State of Illinois, GO: | | | | | | | | | | |
5.00%, 2/01/39 | | | | | 2,990 | | | | 3,097,192 | |
Series A, 5.00%, 4/01/38 | | | | | 9,030 | | | | 9,344,966 | |
State of Illinois, RB, Build Illinois, Series B, 5.25%, 6/15/34 | | | | | 1,240 | | | | 1,374,428 | |
University of Illinois, RB, Auxiliary Facilities System, Series A: | | | | | | | | | | |
5.00%, 4/01/39 | | | | | 1,565 | | | | 1,680,121 | |
5.00%, 4/01/44 | | | | | 1,910 | | | | 2,039,250 | |
| | | | | | | | | 116,580,646 | |
Indiana — 4.8% | | | | | | | | | | |
Carmel Redevelopment Authority, Refunding RB, Multipurpose, Series A, 4.00%, 2/01/38 | | | | | 2,805 | | | | 2,812,686 | |
City of Valparaiso Indiana, RB, Exempt Facilities, Pratt Paper LLC Project, AMT: | | | | | | | | | | |
6.75%, 1/01/34 | | | | | 1,525 | | | | 1,635,578 | |
7.00%, 1/01/44 | | | | | 3,680 | | | | 3,971,824 | |
City of Vincennes Indiana, Refunding RB, Southwest Indiana Regional Youth Village, 6.25%, 1/01/24 | | | | | 1,695 | | | | 1,036,713 | |
| Municipal Bonds | | | | Par
(000) | | Value |
Indiana (concluded) | | | | | | | | | | |
Indiana Finance Authority, RB, Series A: | | | | | | | | | | |
CWA Authority Project, 1st Lien, 5.25%, 10/01/38 | | | | $ | 6,305 | | | $ | 6,933,798 | |
Private Activity Bond, Ohio River Bridges East End Crossing Project, AMT, 5.00%, 7/01/44 | | | | | 880 | | | | 888,580 | |
Private Activity Bond, Ohio River Bridges East End Crossing Project, AMT, 5.00%, 7/01/48 | | | | | 2,905 | | | | 2,943,201 | |
Sisters of St. Francis Health Services, 5.25%, 11/01/39 | | | | | 1,655 | | | | 1,748,739 | |
Indiana Finance Authority, Refunding RB, Community Health Network Project, Series A, 5.00%, 5/01/42 | | | | | 3,670 | | | | 3,829,461 | |
Indiana Municipal Power Agency, RB, Series B, 6.00%, 1/01/39 | | | | | 2,150 | | | | 2,414,041 | |
Indianapolis Local Public Improvement Bond Bank, RB, Series A, 5.00%, 1/15/40 | | | | | 2,490 | | | | 2,690,445 | |
| | | | | | | | | 30,905,066 | |
Iowa — 2.6% | | | | | | | | | | |
Iowa Finance Authority, RB, Midwestern Disaster Area, Alcoa, Inc. Project, 4.75%, 8/01/42 | | | | | 2,265 | | | | 2,143,619 | |
Iowa Finance Authority, Refunding RB, Midwestern Disaster Area, Iowa Fertilizer Co. Project: | | | | | | | | | | |
5.00%, 12/01/19 | | | | | 1,880 | | | | 1,902,748 | |
5.50%, 12/01/22 | | | | | 4,595 | | | | 4,669,117 | |
5.25%, 12/01/25 | | | | | 2,125 | | | | 2,124,171 | |
Iowa Student Loan Liquidity Corp., Refunding RB, Student Loan, Senior Series A-1, AMT, 5.15%, 12/01/22 | | | | | 3,165 | | | | 3,306,191 | |
Iowa Tobacco Settlement Authority, Refunding RB, Asset-Backed, Series C, 5.63%, 6/01/46 | | | | | 2,920 | | | | 2,485,621 | |
| | | | | | | | | 16,631,467 | |
Kentucky — 0.5% | | | | | | | | | | |
Kentucky Economic Development Finance Authority, RB, Catholic Health Initiatives, Series A, 5.25%, 1/01/45 | | | | | 1,915 | | | | 2,058,300 | |
Kentucky Public Transportation Infrastructure Authority, RB, Downtown Crossing Project, Convertible CAB, 1st Tier, Series C, 0.00%, 7/01/43 (a) | | | | | 2,325 | | | | 1,415,762 | |
| | | | | | | | | 3,474,062 | |
Louisiana — 2.7% | | | | | | | | | | |
Louisiana Local Government Environmental Facilities & Community Development Authority, RB, Westlake Chemical Corp. Project, Series A-1, 6.50%, 11/01/35 | | | | | 6,535 | | | | 7,268,684 | |
Tobacco Settlement Financing Corp., Refunding RB, Asset-Backed, Series A: | | | | | | | | | | |
5.50%, 5/15/30 | | | | | 1,980 | | | | 2,139,944 | |
5.25%, 5/15/31 | | | | | 1,690 | | | | 1,788,206 | |
5.25%, 5/15/32 | | | | | 2,160 | | | | 2,271,974 | |
5.25%, 5/15/33 | | | | | 2,345 | | | | 2,460,093 | |
5.25%, 5/15/35 | | | | | 985 | | | | 1,033,758 | |
| | | | | | | | | 16,962,659 | |
Maryland — 1.3% | | | | | | | | | | |
Maryland EDC, RB, Transportation Facilities Project, Series A, 5.75%, 6/01/35 | | | | | 855 | | | | 890,662 | |
Maryland EDC, Refunding RB, CNX Marine Terminals, Inc., 5.75%, 9/01/25 | | | | | 2,235 | | | | 2,391,204 | |
Maryland Health & Higher Educational Facilities Authority, Refunding RB, Charlestown Community Project, 6.25%, 1/01/41 | | | | | 4,295 | | | | 4,664,370 | |
Montgomery County Housing Opportunities Commission, RB, Series D, AMT, 5.50%, 1/01/38 | | | | | 415 | | | | 420,910 | |
| | | | | | | | | 8,367,146 | |
See Notes to Financial Statements.
| ANNUAL REPORT | APRIL 30, 2014 | 35
|
| |
| Schedule of Investments (continued) | BlackRock Municipal Income Trust (BFK)
(Percentages shown are based on Net Assets)
|
| Municipal Bonds | | | | Par
(000) | | Value |
Massachusetts — 1.0% | | | | | | | | | | |
Massachusetts Development Finance Agency, Refunding RB, Covanta Energy Project, Series C, AMT, 5.25%, 11/01/42 | | | | $ | 2,775 | | | $ | 2,789,957 | |
Massachusetts Health & Educational Facilities Authority, Refunding RB, Partners Healthcare System, Series J1, 5.00%, 7/01/39 | | | | | 3,535 | | | | 3,777,254 | |
| | | | | | | | | 6,567,211 | |
Michigan — 3.4% | | | | | | | | | | |
City of Detroit Michigan Sewage Disposal System, Refunding RB, Senior Lien, Series A: | | | | | | | | | | |
5.00%, 7/01/32 | | | | | 3,065 | | | | 2,958,338 | |
5.25%, 7/01/39 | | | | | 8,665 | | | | 8,428,445 | |
City of Lansing Michigan, RB, Board of Water & Light Utilities System, Series A, 5.50%, 7/01/41 | | | | | 2,870 | | | | 3,252,428 | |
Kalamazoo Hospital Finance Authority, Refunding RB, Bronson Methodist Hospital, 5.50%, 5/15/36 | | | | | 2,700 | | | | 2,854,548 | |
Michigan State Hospital Finance Authority, Refunding RB, Henry Ford Health System, Series A, 5.25%, 11/15/46 | | | | | 4,230 | | | | 4,259,652 | |
| | | | | | | | | 21,753,411 | |
Mississippi — 2.2% | | | | | | | | | | |
City of Gulfport Mississippi, RB, Memorial Hospital at Gulfport Project, Series A, 5.75%, 7/01/31 | | | | | 14,025 | | | | 14,040,428 | |
Missouri — 0.5% | | | | | | | | | | |
Bi-State Development Agency of the Missouri-Illinois Metropolitan District, Refunding RB, Combined Lien, Series A, 5.00%, 10/01/44 | | | | | 495 | | | | 535,219 | |
State of Missouri Health & Educational Facilities Authority, RB, Senior Living Facilities, Lutheran Senior Services, 5.50%, 2/01/42 | | | | | 2,035 | | | | 2,099,509 | |
State of Missouri Health & Educational Facilities Authority, Refunding RB, St. Louis College of Pharmacy Project, 5.50%, 5/01/43 | | | | | 480 | | | | 507,562 | |
| | | | | | | | | 3,142,290 | |
Multi-State — 2.6% | | | | | | | | | | |
Centerline Equity Issuer Trust, 6.80%, 10/31/52 (b)(f) | | | | | 16,000 | | | | 16,443,200 | |
Nebraska — 1.4% | | | | | | | | | | |
Central Plains Energy Project Nebraska, RB, Gas Project No. 3, 5.00%, 9/01/42 | | | | | 2,815 | | | | 2,909,781 | |
Central Plains Nebraska Energy Project, RB, Gas Project No. 3, 5.25%, 9/01/37 | | | | | 1,610 | | | | 1,703,380 | |
County of Douglas Nebraska Hospital Authority No. 2, Refunding RB, Health Facilities, Immanuel Obligation Group, 5.63%, 1/01/40 | | | | | 3,280 | | | | 3,503,204 | |
County of Lancaster Nebraska Hospital Authority No. 1, Refunding RB, Immanuel Obligation Group, Health Facilities, 5.63%, 1/01/40 | | | | | 600 | | | | 640,830 | |
| | | | | | | | | 8,757,195 | |
Nevada — 0.8% | | | | | | | | | | |
County of Clark Nevada, Refunding RB, Alexander Dawson School Nevada Project, 5.00%, 5/15/29 | | | | | 4,550 | | | | 4,848,935 | |
New Jersey — 7.4% | | | | | | | | | | |
County of Middlesex New Jersey Improvement Authority, RB, Heldrich Center Hotel, Sub-Series B, 6.25%, 1/01/37 (d)(e) | | | | | 3,680 | | | | 255,318 | |
New Jersey EDA, RB: | | | | | | | | | | |
Continental Airlines, Inc. Project, AMT, 5.25%, 9/15/29 | | | | | 3,830 | | | | 3,870,713 | |
Continental Airlines, Inc. Project, AMT, 5.63%, 11/15/30 | | | | | 2,035 | | | | 2,091,410 | |
The Goethals Bridge Replacement Project, AMT, 5.38%, 1/01/43 | | | | | 2,285 | | | | 2,405,397 | |
New Jersey EDA, Refunding RB, Special Assessment, Kapkowski Road Landfill Project, 6.50%, 4/01/28 | | | | | 8,000 | | | | 9,227,600 | |
| Municipal Bonds | | | | Par
(000) | | Value |
New Jersey (concluded) | | | | | | | | | | |
New Jersey State Turnpike Authority, RB, Series A: | | | | | | | | | | |
5.00%, 1/01/38 | | | | $ | 2,535 | | | $ | 2,715,517 | |
5.00%, 1/01/43 | | | | | 8,150 | | | | 8,683,499 | |
New Jersey Transportation Trust Fund Authority, RB, Transportation System: | | | | | | | | | | |
Series A, 5.50%, 6/15/41 | | | | | 8,000 | | | | 8,794,400 | |
Series B, 5.25%, 6/15/36 | | | | | 4,810 | | | | 5,219,668 | |
Rutgers — The State University of New Jersey, Refunding RB, Series L: | | | | | | | | | | |
5.00%, 5/01/38 | | | | | 985 | | | | 1,087,046 | |
5.00%, 5/01/43 | | | | | 1,030 | | | | 1,127,603 | |
Tobacco Settlement Financing Corp. New Jersey, Refunding RB, Series 1A, 4.50%, 6/01/23 | | | | | 2,165 | | | | 2,096,629 | |
| | | | | | | | | 47,574,800 | |
New York — 10.7% | | | | | | | | | | |
Albany Industrial Development Agency, RB, New Covenant Charter School Project, Series A, 7.00%, 5/01/35 (d)(e) | | | | | 1,820 | | | | 273,109 | |
City of New York New York Industrial Development Agency, ARB, American Airlines, Inc., JFK International Airport, AMT (g): | | | | | | | | | | |
8.00%, 8/01/28 | | | | | 5,000 | | | | 5,529,150 | |
7.75%, 8/01/31 | | | | | 22,140 | | | | 24,364,184 | |
City of New York New York Transitional Finance Authority, Future Tax Secured Bonds, RB, Fiscal 2012, Sub-Series E-1, 5.00%, 2/01/42 | | | | | 4,805 | | | | 5,182,096 | |
Metropolitan Transportation Authority, RB, Series B: | | | | | | | | | | |
5.25%, 11/15/38 | | | | | 4,640 | | | | 5,107,619 | |
5.25%, 11/15/39 | | | | | 1,650 | | | | 1,817,723 | |
New York Counties Tobacco Trust II, RB, 5.75%, 6/01/43 | | | | | 5,000 | | | | 4,892,600 | |
New York Liberty Development Corp., Refunding RB, 2nd Priority, Bank of America Tower at One Bryant Park Project, Class 3, 6.38%, 7/15/49 | | | | | 2,400 | | | | 2,610,288 | |
New York State Dormitory Authority, RB, Series F, 5.00%, 3/15/35 | | | | | 4,775 | | | | 4,948,285 | |
New York State Dormitory Authority, Refunding RB, Series D, 5.00%, 2/15/37 | | | | | 6,655 | | | | 7,230,924 | |
Niagara Area Development Corp., Refunding RB, Solid Waste Disposal Facility, Covanta Energy Project, Series A, AMT, 5.25%, 11/01/42 | | | | | 1,575 | | | | 1,583,489 | |
Port Authority of New York & New Jersey, ARB, Special Project, JFK International Air Terminal LLC Project, Series 8: | | | | | | | | | | |
6.00%, 12/01/36 | | | | | 2,525 | | | | 2,777,172 | |
6.00%, 12/01/42 | | | | | 1,960 | | | | 2,152,217 | |
| | | | | | | | | 68,468,856 | |
North Carolina — 4.2% | | | | | | | | | | |
County of Gaston North Carolina Industrial Facilities & Pollution Control Financing Authority, RB, Exempt Facilities, National Gypsum Co. Project, AMT, 5.75%, 8/01/35 | | | | | 12,130 | | | | 11,765,736 | |
North Carolina Capital Facilities Finance Agency, Refunding RB, Duke University Project, Series B, 5.00%, 10/01/38 | | | | | 10,000 | | | | 11,132,400 | |
North Carolina Medical Care Commission, RB, Health Care Facilities, Duke University Health System, Series A, 5.00%, 6/01/42 | | | | | 2,750 | | | | 2,995,712 | |
North Carolina Medical Care Commission, Refunding RB, First Mortgage, Retirement Facilities Whitestone Project, Series A, 7.75%, 3/01/41 | | | | | 1,130 | | | | 1,243,407 | |
| | | | | | | | | 27,137,255 | |
See Notes to Financial Statements.
| 36 | ANNUAL REPORT | APRIL 30, 2014
|
| |
| Schedule of Investments (continued) | BlackRock Municipal Income Trust (BFK)
(Percentages shown are based on Net Assets)
|
| Municipal Bonds | | | | Par
(000) | | Value |
Ohio — 2.7% | | | | | | | | | | |
County of Allen Ohio Hospital Facilities, Refunding RB, Catholic Healthcare Partners, Series A, 5.25%, 6/01/38 | | | | $ | 6,125 | | | $ | 6,548,421 | |
County of Franklin Ohio, RB, Health Care Facilities Improvement, OPRS Communities Obligation Group, Series A, 6.13%, 7/01/40 | | | | | 1,280 | | | | 1,340,531 | |
County of Montgomery Ohio, Refunding RB, Catholic Health, Series A, 5.00%, 5/01/39 | | | | | 5,450 | | | | 5,620,095 | |
Pinnacle Community Infrastructure Financing Authority, RB, Facilities, Series A, 6.25%, 12/01/36 | | | | | 3,760 | | | | 3,786,245 | |
| | | | | | | | | 17,295,292 | |
Pennsylvania — 1.3% | | | | | | | | | | |
Pennsylvania Economic Development Financing Authority, RB, Aqua Pennsylvania, Inc. Project, Series B, 5.00%, 11/15/40 | | | | | 3,725 | | | | 3,952,150 | |
Pennsylvania Turnpike Commission, RB, Series A, 5.00%, 12/01/44 | | | | | 2,155 | | | | 2,316,302 | |
Philadelphia Hospitals & Higher Education Facilities Authority, RB, Temple University Health System, Series A, 5.63%, 7/01/42 | | | | | 2,395 | | | | 2,289,045 | |
| | | | | | | | | 8,557,497 | |
South Carolina — 1.1% | | | | | | | | | | |
South Carolina State Ports Authority, RB, 5.25%, 7/01/40 | | | | | 6,455 | | | | 6,884,645 | |
Tennessee — 0.4% | | | | | | | | | | |
City of Chattanooga Tennessee Health Educational & Housing Facility Board, RB, Catholic Health Initiatives, Series A, 5.25%, 1/01/45 | | | | | 2,660 | | | | 2,859,048 | |
Texas — 15.4% | | | | | | | | | | |
Brazos River Authority, RB, TXU Electric, Series A, AMT, 8.25%, 10/01/30 (d)(e) | | | | | 4,370 | | | | 120,175 | |
Central Texas Regional Mobility Authority, Refunding RB: | | | | | | | | | | |
Senior Lien, 6.25%, 1/01/46 | | | | | 4,210 | | | | 4,607,298 | |
Sub-Lien, 5.00%, 1/01/33 | | | | | 700 | | | | 702,492 | |
Sub-Lien, 5.00%, 1/01/42 | | | | | 620 | | | | 602,758 | |
City of Dallas Texas Waterworks & Sewer System, Refunding RB, 5.00%, 10/01/35 | | | | | 2,970 | | | | 3,330,350 | |
City of Houston Texas Airport System, Refunding ARB, Senior Lien, Series A, 5.50%, 7/01/39 | | | | | 3,000 | | | | 3,390,420 | |
City of Houston Texas Utility System, Refunding RB, Combined 1st Lien, Series A (AGC), 6.00%, 11/15/35 | | | | | 16,425 | | | | 19,190,970 | |
County of Harris Texas Cultural Education Facilities Finance Corp., RB, 1st Mortgage, Brazos Presbyterian Homes, Inc. Project, Series B: | | | | | | | | | | |
7.00%, 1/01/43 | | | | | 380 | | | | 405,882 | |
7.00%, 1/01/48 | | | | | 500 | | | | 530,585 | |
County of Harris Texas-Houston Sports Authority, Refunding RB (NPFGC) (c): | | | | | | | | | | |
3rd Lien, Series A-3, 0.00%, 11/15/37 | | | | | 26,120 | | | | 5,975,211 | |
CAB, Junior Lien, Series H, 0.00%, 11/15/35 | | | | | 5,000 | | | | 1,323,850 | |
CAB, Senior Lien, Series A, 0.00%, 11/15/38 | | | | | 12,580 | | | | 2,950,261 | |
County of Matagorda Texas Navigation District No. 1, Refunding RB, AEP Texas Central Co. Project, Series 1, 4.00%, 6/01/30 | | | | | 2,120 | | | | 2,078,003 | |
County of Midland Texas Fresh Water Supply District No. 1, RB, CAB, City of Midland Project, Series A (c): | | | | | | | | | | |
0.00%, 9/15/40 | | | | | 9,780 | | | | 2,780,943 | |
0.00%, 9/15/41 | | | | | 5,420 | | | | 1,442,424 | |
County of Tarrant Texas Cultural Education Facilities Finance Corp., RB, Scott & White Healthcare, 6.00%, 8/15/45 | | | | | 7,930 | | | | 9,389,834 | |
Fort Bend County Industrial Development Corp., RB, NRG Energy Project, Series B, 4.75%, 11/01/42 | | | | | 2,045 | | | | 1,998,149 | |
| Municipal Bonds | | | | Par
(000) | | Value |
Texas (concluded) | | | | | | | | | | |
North Texas Tollway Authority, Refunding RB, 2nd Tier System, Series F, 6.13%, 1/01/31 | | | | $ | 12,180 | | | $ | 13,048,434 | |
San Antonio Energy Acquisition Public Facility Corp., RB, Gas Supply, 5.50%, 8/01/25 | | | | | 6,540 | | | | 7,504,650 | |
Texas Municipal Gas Acquisition & Supply Corp. III, RB, 5.00%, 12/15/32 | | | | | 2,835 | | | | 2,916,875 | |
Texas Private Activity Bond Surface Transportation Corp., RB, Senior Lien: | | | | | | | | | | |
LBJ Infrastructure Group LLC, LBJ Freeway Managed Lanes Project, 7.00%, 6/30/40 | | | | | 6,000 | | | | 6,956,880 | |
NTE Mobility Partners LLC, North Tarrant Express Managed Lanes Project, 6.88%, 12/31/39 | | | | | 6,500 | | | | 7,419,230 | |
| | | | | | | | | 98,665,674 | |
Utah — 0.6% | | | | | | | | | | |
Utah State Charter School Finance Authority, RB, Ogden Preparatory Academy, Series A: | | | | | | | | | | |
3.25%, 10/15/36 | | | | | 1,940 | | | | 1,566,821 | |
3.25%, 10/15/42 | | | | | 3,010 | | | | 2,336,302 | |
| | | | | | | | | 3,903,123 | |
Virginia — 1.5% | | | | | | | | | | |
Virginia Small Business Financing Authority, RB, Senior Lien, Elizabeth River Crossings LLC Project, AMT: | | | | | | | | | | |
5.25%, 1/01/32 | | | | | 3,155 | | | | 3,305,399 | |
6.00%, 1/01/37 | | | | | 5,695 | | | | 6,175,943 | |
| | | | | | | | | 9,481,342 | |
Washington — 0.8% | | | | | | | | | | |
Washington Health Care Facilities Authority, RB, Catholic Health Initiatives, Series A, 5.75%, 1/01/45 | | | | | 4,420 | | | | 4,909,869 | |
Wisconsin — 0.3% | | | | | | | | | | |
State of Wisconsin Health & Educational Facilities Authority, RB, Ascension Health Senior Credit Group, Series E, 5.00%, 11/15/33 | | | | | 1,640 | | | | 1,799,851 | |
Total Municipal Bonds — 124.0% | | | | | | | | | 792,123,005 | |
|
Municipal Bonds Transferred to
Tender Option Bond Trusts (h) |
Alabama — 0.7% | | | | | | | | | | |
City of Birmingham Alabama Special Care Facilities Financing Authority, Refunding RB, Ascension Health, Senior Credit, Series C-2, 5.00%, 11/15/36 | | | | | 4,548 | | | | 4,680,292 | |
California — 5.5% | | | | | | | | | | |
California Educational Facilities Authority, RB, University of Southern California, Series B, 5.25%, 10/01/39 (i) | | | | | 5,115 | | | | 5,799,080 | |
City & County of San Francisco California Public Utilities Commission, RB, Water Revenue, Series B, 5.00%, 11/01/39 | | | | | 18,540 | | | | 20,446,654 | |
Los Angeles Community College District California, GO, Election of 2001, Series A (AGM), 5.00%, 8/01/32 | | | | | 4,500 | | | | 4,987,755 | |
San Diego Community College District California, GO, Election of 2002, 5.25%, 8/01/33 | | | | | 3,260 | | | | 3,746,965 | |
| | | | | | | | | 34,980,454 | |
Colorado — 2.0% | | | | | | | | | | |
Colorado Health Facilities Authority, RB, Catholic Health (AGM): | | | | | | | | | | |
Series C-3, 5.10%, 10/01/41 | | | | | 7,600 | | | | 7,883,252 | |
Series C-7, 5.00%, 9/01/36 | | | | | 4,860 | | | | 5,041,764 | |
| | | | | | | | | 12,925,016 | |
See Notes to Financial Statements.
| ANNUAL REPORT | APRIL 30, 2014 | 37
|
| |
| Schedule of Investments (continued) | BlackRock Municipal Income Trust (BFK)
(Percentages shown are based on Net Assets)
|
Municipal Bonds Transferred to
Tender Option Bond Trusts (h) | | | | Par
(000) | | Value |
Connecticut — 3.2% | | | | | | | | | | |
Connecticut State Health & Educational Facility Authority, RB, Yale University: | | | | | | | | | | |
Series T-1, 4.70%, 7/01/29 | | | | $ | 9,397 | | | $ | 10,276,954 | |
Series X-3, 4.85%, 7/01/37 | | | | | 9,366 | | | | 10,223,968 | |
| | | | | | | | | 20,500,922 | |
Florida — 1.1% | | | | | | | | | | |
County of Miami-Dade Florida, RB, Water & Sewer System, 5.00%, 10/01/34 | | | | | 6,629 | | | | 7,117,278 | |
Massachusetts — 1.9% | | | | | | | | | | |
Massachusetts School Building Authority, RB, Senior, Series B, 5.00%, 10/15/41 | | | | | 4,427 | | | | 4,819,539 | |
Massachusetts Water Resources Authority, Refunding RB, General, Series A, 5.00%, 8/01/41 | | | | | 6,770 | | | | 7,271,318 | |
| | | | | | | | | 12,090,857 | |
New Hampshire — 0.7% | | | | | | | | | | |
New Hampshire Health & Education Facilities Authority, RB, Dartmouth College, 5.25%, 6/01/39 (i) | | | | | 3,988 | | | | 4,525,990 | |
New York — 9.7% | | | | | | | | | | |
City of New York New York Municipal Water Finance Authority, Refunding RB, Water & Sewer System 2nd General Resolution: | | | | | | | | | | |
Series FF-2, 5.50%, 6/15/40 | | | | | 3,075 | | | | 3,482,447 | |
Series HH, 5.00%, 6/15/31 (i) | | | | | 16,393 | | | | 18,367,127 | |
Hudson Yards Infrastructure Corp., RB, Fiscal 2012, Series A, 5.75%, 2/15/47 (i) | | | | | 3,130 | | | | 3,475,496 | |
New York Liberty Development Corp., RB, 1 World Trade Center Port Authority Consolidated, 5.25%, 12/15/43 | | | | | 20,865 | | | | 22,520,846 | |
New York Liberty Development Corp., Refunding RB, 4 World Trade Center Project, 5.75%, 11/15/51 (i) | | | | | 12,610 | | | | 13,947,795 | |
| | | | | | | | | 61,793,711 | |
Texas — 3.0% | | | | | | | | | | |
City of San Antonio Texas Public Service Board, RB, Electric & Gas Systems, Junior Lien, 5.00%, 2/01/43 | | | | | 4,900 | | | | 5,299,938 | |
County of Harris Texas Metropolitan Transit Authority, Refunding RB, Series A, 5.00%, 11/01/41 | | | | | 6,650 | | | | 7,207,337 | |
University of Texas, Refunding RB, Financing System, Series B, 5.00%, 8/15/43 | | | | | 6,001 | | | | 6,630,268 | |
| | | | | | | | | 19,137,543 | |
Municipal Bonds Transferred to
Tender Option Bond Trusts (h) | | | | Par
(000) | | Value |
Utah — 1.2% | | | | | | | | | | |
City of Riverton Utah, RB, IHC Health Services, Inc., 5.00%, 8/15/41 | | | | $ | 7,150 | | | $ | 7,543,986 | |
Virginia — 1.9% | | | | | | | | | | |
University of Virginia, Refunding RB, General, 5.00%, 6/01/40 | | | | | 10,767 | | | | 11,989,681 | |
Washington — 3.5% | | | | | | | | | | |
Central Puget Sound Regional Transit Authority, RB, Series A (AGM), 5.00%, 11/01/32 | | | | | 5,459 | | | | 6,013,582 | |
State of Washington, GO, Various Purposes, Series E, 5.00%, 2/01/34 | | | | | 14,487 | | | | 16,211,122 | |
| | | | | | | | | 22,224,704 | |
Total Municipal Bonds Transferred to
Tender Option Bond Trusts — 34.4% | | | | | | | | | 219,510,434 | |
Total Long-Term Investments
(Cost — $963,244,348) — 158.4% | | | | | | | | | 1,011,633,439 | |
|
Short-Term Securities | | | | | Shares | | | | | |
FFI Institutional Tax-Exempt Fund, 0.03% (j)(k) | | | | | 14,688,018 | | | | 14,688,018 | |
Total Short-Term Securities
(Cost — $14,688,018) — 2.3% | | | | | | | | | 14,688,018 | |
Total Investments (Cost — $977,932,366) — 160.7% | | 1,026,321,457 | |
Other Assets Less Liabilities — 1.4% | | | | | | | | | 9,157,801 | |
Liability for TOB Trust Certificates, Including Interest Expense and Fees Payable — (19.7%) | | | | | | | | | (126,102,415 | ) |
VMTP Shares, at Liquidation Value — (42.4%) | | | | | | | | | (270,800,000 | ) |
Net Assets Applicable to Common Shares — 100.0% | | | | | | | | $ | 638,576,843 | |
Notes to Schedule of Investments
| (a) | | | | Represents a step-up bond that pays an initial coupon rate for the first period and then a higher coupon rate for the following periods. Rate shown is as of report date. |
| (b) | | | | Security exempt from registration pursuant to Rule 144A under the Securities Act of 1933, as amended. These securities may be resold in transactions exempt from registration to qualified institutional investors. |
| (c) | | | | Zero-coupon bond. |
| (d) | | | | Non-income producing security. |
| (e) | | | | Issuer filed for bankruptcy and/or is in default of principal and/or interest payments. |
| (f) | | | | Represents a beneficial interest in a trust. The collateral deposited into the trust is federally tax-exempt revenue bonds issued by various state or local governments, or their respective agencies or authorities. The security is subject to remarketing prior to its stated maturity. |
| (g) | | | | Variable rate security. Rate shown is as of report date. |
| (h) | | | | Represent bonds transferred to a TOB. In exchange for which the Trust acquired residual interest certificates. These bonds serve as collateral in a financing transaction. See Note 3 of the Notes to Financial Statements for details of municipal bonds transferred to TOBs. |
| (i) | | | | All or a portion of security is subject to a recourse agreement, which may require the Trust to pay the liquidity provider in the event there is a shortfall between the TOB trust certificates and proceeds received from the sale of the security contributed to the TOB trust. In the case of a shortfall, the aggregate maximum potential amount the Trust could ultimately be required to pay under the agreements, which expire from October 1, 2016 to November 15, 2019 is $25,997,599. |
See Notes to Financial Statements.
| 38 | ANNUAL REPORT | APRIL 30, 2014
|
| |
| Schedule of Investments (concluded) | BlackRock Municipal Income Trust (BFK)
|
| (j) | | | | Investments in issuers considered to be an affiliate of the Trust during the year ended April 30, 2014, for purposes of Section 2(a)(3) of the Investment Company Act of 1940, as amended, were as follows: |
| Affiliate | | | | Shares
Held at
April 30, 2013 | | Net
Activity | | Shares
Held at
April 30, 2014 | | Income | |
FFI Institutional Tax-Exempt Fund | | | | $2,673,310 | | 12,014,708 | | $14,688,018 | | $4,597 | |
| (k) | | | | Represents the current yield as of report date. |
• | | | | Financial futures contracts outstanding as of April 30, 2014 were as follows: |
Contracts
Sold
|
|
|
| Issue
|
| Exchange
|
| Expiration
|
| Notional
Value
|
| Unrealized
Depreciation
|
| (724) | | | | 10-Year U.S Treasury Note | | Chicago Board of Trade | | June 2014 | | $ | 90,081,438 | | | $ | (225,108 | ) |
| • | | | | Fair Value Measurements — Various inputs are used in determining the fair value of investments and derivative financial instruments. These inputs to valuation techniques are categorized into a disclosure hierarchy consisting of three broad levels for financial statement purposes as follows: |
| • | | | | Level 1 — unadjusted price quotations in active markets/exchanges for identical assets or liabilities that the Trust has the ability to access |
| • | | | | Level 2 — other observable inputs (including, but not limited to, quoted prices for similar assets or liabilities in markets that are active, quoted prices for identical or similar assets or liabilities in markets that are not active, inputs other than quoted prices that are observable for the assets or liabilities (such as interest rates, yield curves, volatilities, prepayment speeds, loss severities, credit risks and default rates) or other market-corroborated inputs) |
| • | | | | Level 3 — unobservable inputs based on the best information available in the circumstances, to the extent observable inputs are not available (including the Trust’s own assumptions used in determining the fair value of investments and derivative financial instruments) |
| | | | | The hierarchy gives the highest priority to unadjusted quoted prices in active markets for identical assets or liabilities (Level 1 measurements) and the lowest priority to unobservable inputs (Level 3 measurements). Accordingly, the degree of judgment exercised in determining fair value is greatest for instruments categorized in Level 3. The inputs used to measure fair value may fall into different levels of the fair value hierarchy. In such cases, for disclosure purposes, the fair value hierarchy classification is determined based on the lowest level input that is significant to the fair value measurement in its entirety. |
| | | | | Changes in valuation techniques may result in transfers into or out of an assigned level within the disclosure hierarchy. In accordance with the Trust’s policy, transfers between different levels of the fair value disclosure hierarchy are deemed to have occurred as of the beginning of the reporting period. The categorization of a value determined for investments and derivative financial instruments is based on the pricing transparency of the investment and derivative financial instrument and is not necessarily an indication of the risks associated with investing in those securities. For information about the Trust’s policy regarding valuation of investments and derivative financial instruments, please refer to Note 2 of the Notes to Financial Statements. |
| | | | | The following tables summarize the Trust’s investments and derivative financial instruments categorized in the disclosure hierarchy as of April 30, 2014: |
| | | | | Level 1 | | Level 2 | | Level 3 | | Total |
Assets:
| | | | | | | | | | | | | | | | | | |
Investments:
| | | | | | | | | | | | | | | | | | |
Long-Term Investments1 | | | | | — | | | $ | 1,011,633,439 | | | | — | | | $ | 1,011,633,439 | |
Short-Term Securities | | | | $ | 14,688,018 | | | | — | | | | — | | | | 14,688,018 | |
Total
| | | | $ | 14,688,018 | | | $ | 1,011,633,439 | | | | — | | | $ | 1,026,321,457 | |
| 1 | See above Schedule of Investments for values in each state or political subdivision. |
| | | | | Level 1 | | Level 2 | | Level 3 | | Total |
Derivative Financial Instruments2
| | | | | | | | | | | | | | | | | | |
Liabilities:
| | | | | | | | | | | | | | | | | | |
Interest rate contracts | | | | $ | (225,108 | ) | | | — | | | | — | | | $ | (225,108 | ) |
| 2 | Derivative financial instruments are financial futures contracts, which are valued at the unrealized appreciation/depreciation on the instrument. |
The carrying amount for certain of the Trust’s assets and/or liabilities approximates fair value for financial statement purposes. As of April 30, 2014, such assets and/or liabilities are categorized within the disclosure hierarchy as follows:
| | | | | Level 1 | | Level 2 | | Level 3 | | Total |
Assets:
| | | | | | | | | | | | | | | | | | |
Cash pledged for financial futures contracts | | | | $ | 989,000 | | | | — | | | | — | | | $ | 989,000 | |
Liabilities:
| | | | | | | | | | | | | | | | | | |
TOB trust certificates | | | | | — | | | $ | (126,072,926 | ) | | | — | | | | (126,072,926 | ) |
VMTP Shares | | | | | — | | | | (270,800,000 | ) | | | — | | | | (270,800,000 | ) |
Total
| | | | $ | 989,000 | | | $ | (396,872,926 | ) | | | — | | | $ | (395,883,926 | ) |
| | | | | There were no transfers between levels during the year ended April 30, 2014. |
See Notes to Financial Statements.
| ANNUAL REPORT | APRIL 30, 2014 | 39
|
| |
| Schedule of Investments April 30, 2014 | BlackRock Pennsylvania Strategic Municipal Trust (BPS)
(Percentages shown are based on Net Assets)
|
Municipal Bonds
| | | | Par
(000) | | Value
|
Pennsylvania — 146.2% |
Corporate — 5.3% | | | | | | | | | | |
County of Beaver Pennsylvania IDA, Refunding RB, First Energy, Nuclear Energy Corp. Project, Mandatory Put Bonds, Series A, 3.38%, 1/01/35 (a) | | | | $ | 200 | | | $ | 203,581 | |
Pennsylvania Economic Development Financing Authority, RB: | | | | | | | | | | |
American Water Co. Project, 6.20%, 4/01/39 | | | | | 210 | | | | 239,207 | |
Aqua Pennsylvania, Inc. Project, Series A, AMT, 6.75%, 10/01/18 | | | | | 600 | | | | 723,054 | |
Pennsylvania Economic Development Financing Authority, Refunding RB, Series A, AMT: | | | | | | | | | | |
Amtrak Project, 5.00%, 11/01/41 | | | | | 160 | | | | 166,403 | |
Aqua Pennsylvania, Inc. Project, 5.00%, 12/01/34 | | | | | 180 | | | | 192,692 | |
| | | | | | | | | 1,524,937 | |
County/City/Special District/School District — 16.4% | | | | | | | | | | |
Allentown Neighborhood Improvement Zone Development Authority, Refunding RB, Series A: | | | | | | | | | | |
5.00%, 5/01/35 | | | | | 190 | | | | 191,872 | |
5.00%, 5/01/42 | | | | | 450 | | | | 450,589 | |
Bristol Township School District, GO, 5.25%, 6/01/43 | | | | | 555 | | | | 603,429 | |
City of Philadelphia Pennsylvania, GO, Refunding, Series A (AGC), 5.00%, 8/01/24 | | | | | 370 | | | | 407,163 | |
City of Pittsburgh Pennsylvania, GO, Series B, 5.00%, 9/01/26 | | | | | 125 | | | | 140,920 | |
County of Lycoming Pennsylvania Water & Sewer Authority, RB (AGM), 5.00%, 11/15/41 | | | | | 100 | | | | 104,017 | |
County of Northampton Pennsylvania IDA, Tax Allocation Bonds, 7.00%, 7/01/32 | | | | | 180 | | | | 187,054 | |
County of York Pennsylvania, GO, Refunding, 5.00%, 3/01/36 | | | | | 100 | | | | 107,864 | |
Falls Township Authority, RB, Water & Sewer Authority, 5.00%, 12/01/37 | | | | | 200 | | | | 213,778 | |
Marple Newtown School District, GO (AGM), 5.00%, 6/01/31 | | | | | 600 | | | | 671,346 | |
Owen J. Roberts School District, GO, 4.75%, 11/15/25 | | | | | 700 | | | | 783,566 | |
Philadelphia School District, GO, Series E, 6.00%, 9/01/38 | | | | | 100 | | | | 109,089 | |
Philipsburg-Osceola Pennsylvania Area School District, GO (AGM), 5.00%, 4/01/41 | | | | | 155 | | | | 164,340 | |
State Public School Building Authority, RB, Community College, Allegheny County Project (AGM), 5.00%, 7/15/34 | | | | | 310 | | | | 331,232 | |
State Public School Building Authority, Refunding RB, Harrisburg School District Project, Series A (AGC), 5.00%, 11/15/33 | | | | | 250 | | | | 260,498 | |
| | | | | | | | | 4,726,757 | |
Education — 25.4% | | | | | | | | | | |
County of Adams Pennsylvania IDA, Refunding RB, Gettysburg College: | | | | | | | | | | |
5.00%, 8/15/24 | | | | | 100 | | | | 110,805 | |
5.00%, 8/15/25 | | | | | 100 | | | | 109,905 | |
County of Cumberland Pennsylvania Municipal Authority, RB, AICUP Financing Program, Dickinson College Project, 5.00%, 11/01/39 | | | | | 200 | | | | 211,512 | |
County of Delaware Pennsylvania Authority, Refunding RB: | | | | | | | | | | |
Haverford College, 5.00%, 11/15/35 | | | | | 415 | | | | 448,627 | |
Villanova University, 5.25%, 12/01/31 | | | | | 100 | | | | 108,807 | |
East Hempfield Township IDA, RB, Student Services, Inc., Student Housing Project at Millersville University of Pennsylvania: | | | | | | | | | | |
5.00%, 7/01/35 | | | | | 100 | | | | 101,019 | |
5.00%, 7/01/45 | | | | | 100 | | | | 99,057 | |
| | | | | | | | | | | |
Municipal Bonds
| | | | Par
(000) | | Value
|
Pennsylvania (continued) |
Education (continued) | | | | | | | | | | |
Pennsylvania Higher Educational Facilities Authority, RB: | | | | | | | | | | |
Drexel University, Series A (NPFGC), 5.00%, 5/01/37 | | | | $ | 150 | | | $ | 158,901 | |
Shippensburg University Student Services, Student Housing, 5.00%, 10/01/44 | | | | | 265 | | | | 264,579 | |
Thomas Jefferson University, 5.00%, 3/01/40 | | | | | 1,000 | | | | 1,052,600 | |
Pennsylvania Higher Educational Facilities Authority, Refunding RB: | | | | | | | | | | |
Drexel University, Series A, 5.25%, 5/01/41 | | | | | 1,180 | | | | 1,258,187 | |
La Salle University, 5.00%, 5/01/37 | | | | | 140 | | | | 143,014 | |
La Salle University, 5.00%, 5/01/42 | | | | | 255 | | | | 260,490 | |
State System of Higher Education, Series AL, 5.00%, 6/15/35 | | | | | 100 | | | | 106,893 | |
Thomas Jefferson University, 4.00%, 3/01/37 | | | | | 70 | | | | 67,056 | |
Trustees of The University of Pennsylvania, Series C, 4.75%, 7/15/35 | | | | | 500 | | | | 519,365 | |
Widener University, Series A, 5.25%, 7/15/33 | | | | | 220 | | | | 230,622 | |
Widener University, Series A, 5.50%, 7/15/38 | | | | | 45 | | | | 47,387 | |
Pennsylvania State University, RB, 5.00%, 3/01/40 | | | | | 1,000 | | | | 1,101,860 | |
Swarthmore Borough Authority, Refunding RB, Swarthmore College Project, 5.00%, 9/15/38 | | | | | 215 | | | | 237,680 | |
University of Pittsburgh Pennsylvania, RB, Capital Project, Series B, 5.00%, 9/15/28 | | | | | 610 | | | | 695,803 | |
| | | | | | | | | 7,334,169 | |
Health — 35.5% | | | | | | | | | | |
County of Berks Pennsylvania Municipal Authority, Refunding RB, Reading Hospital & Medical Center Project, Series A3, 5.50%, 11/01/31 | | | | | 500 | | | | 569,995 | |
County of Centre Pennsylvania Hospital Authority, RB, Mount Nittany Medical Center Project, 7.00%, 11/15/46 | | | | | 390 | | | | 459,619 | |
County of Cumberland Pennsylvania Municipal Authority, Refunding RB: | | | | | | | | | | |
Asbury Pennsylvania Obligated Group, 5.25%, 1/01/41 | | | | | 210 | | | | 198,618 | |
Diakon Lutheran, 6.38%, 1/01/39 | | | | | 500 | | | | 537,960 | |
County of Dauphin Pennsylvania General Authority, Refunding RB, Pinnacle Health System Project, Series A, 6.00%, 6/01/29 | | | | | 500 | | | | 555,300 | |
County of Franklin Pennsylvania IDA, Refunding RB, Chambersburg Hospital Project, 5.38%, 7/01/42 | | | | | 415 | | | | 434,119 | |
County of Montgomery Pennsylvania IDA, RB, Acts Retirement-Life Community, Series A, 4.50%, 11/15/36 | | | | | 165 | | | | 159,548 | |
County of Montgomery Pennsylvania IDA, Refunding RB, Acts Retirement-Life Communities: | | | | | | | | | | |
5.00%, 11/15/27 | | | | | 175 | | | | 185,356 | |
5.00%, 11/15/28 | | | | | 110 | | | | 115,721 | |
County of Union Pennsylvania Hospital Authority, Refunding RB, Evangelical Community Hospital Project, 7.00%, 8/01/41 | | | | | 460 | | | | 534,156 | |
Geisinger Authority Pennsylvania, RB, Health System: | | | | | | | | | | |
Series A, 5.25%, 6/01/39 | | | | | 1,000 | | | | 1,068,360 | |
Series A-1, 5.13%, 6/01/41 | | | | | 1,160 | | | | 1,242,012 | |
Lancaster Industrial Development Authority, Refunding RB: | | | | | | | | | | |
5.38%, 5/01/28 | | | | | 100 | | | | 104,312 | |
5.75%, 5/01/35 | | | | | 120 | | | | 126,461 | |
Pennsylvania Higher Educational Facilities Authority, RB, University of Pennsylvania Health System, Series A, 4.00%, 8/15/39 | | | | | 215 | | | | 206,065 | |
Pennsylvania Higher Educational Facilities Authority, Refunding RB, University of Pittsburgh Medical Center, Series E, 5.00%, 5/15/31 | | | | | 1,000 | | | | 1,063,110 | |
See Notes to Financial Statements.
| 40 | ANNUAL REPORT | APRIL 30, 2014
|
| |
| Schedule of Investments (continued) | BlackRock Pennsylvania Strategic Municipal Trust (BPS)
(Percentages shown are based on Net Assets)
|
Municipal Bonds
| | | | Par
(000) | | Value
|
Pennsylvania (continued) |
Health (continued) | | | | | | | | | | |
Philadelphia Hospitals & Higher Education Facilities Authority, RB, The Children’s Hospital of Philadelphia Project, Series C, 5.00%, 7/01/41 | | | | $ | 940 | | | $ | 1,003,469 | |
South Fork Municipal Authority, Refunding RB, Conemaugh Valley Memorial Hospital, Series B (AGC), 5.38%, 7/01/35 | | | | | 215 | | | | 229,917 | |
Southcentral General Authority, Refunding RB, Wellspan Health Obligation Group, Series A, 6.00%, 6/01/29 | | | | | 1,250 | | | | 1,431,175 | |
| | | | | | | | | 10,225,273 | |
Housing — 16.2% | | | | | | | | | | |
Pennsylvania HFA, RB, S/F Mortgage, Series 114-C: | | | | | | | | | | |
3.65%, 10/01/37 | | | | | 390 | | | | 359,198 | |
3.70%, 10/01/42 | | | | | 640 | | | | 578,310 | |
Pennsylvania HFA, Refunding RB, S/F Mortgage: | | | | | | | | | | |
Series 92-A, AMT, 4.75%, 4/01/31 | | | | | 90 | | | | 90,342 | |
Series 96-A, AMT, 4.70%, 10/01/37 | | | | | 450 | | | | 450,594 | |
Series 97-A, AMT, 4.65%, 10/01/31 | | | | | 1,300 | | | | 1,312,688 | |
Series 99-A, AMT, 5.15%, 4/01/38 | | | | | 210 | | | | 211,537 | |
Series 110-B, 4.75%, 10/01/39 | | | | | 125 | | | | 130,013 | |
Series 113, 4.85%, 10/01/37 | | | | | 775 | | | | 797,917 | |
Series 115-A, AMT, 4.20%, 10/01/33 | | | | | 750 | | | | 738,225 | |
| | | | | | | | | 4,668,824 | |
State — 23.7% | | | | | | | | | | |
Commonwealth of Pennsylvania, GO, 1st Series: | | | | | | | | | | |
5.00%, 11/15/24 | | | | | 1,000 | | | | 1,176,130 | |
5.00%, 4/01/26 | | | | | 245 | | | | 288,076 | |
5.00%, 3/15/28 | | | | | 825 | | | | 943,107 | |
5.00%, 6/01/28 | | | | | 2,160 | | | | 2,474,064 | |
5.00%, 3/15/29 | | | | | 275 | | | | 313,568 | |
Pennsylvania Economic Development Financing Authority, Refunding RB, Unemployment Compensation, Series B, 5.00%, 7/01/23 | | | | | 500 | | | | 526,350 | |
Pennsylvania Turnpike Commission, RB, Oil Franchise Tax, Remarketing, Series C (NPFGC), 5.00%, 12/01/32 | | | | | 1,000 | | | | 1,097,030 | |
| | | | | | | | | 6,818,325 | |
Transportation — 19.3% | | | | | | | | | | |
City of Philadelphia Pennsylvania, ARB, Series A: | | | | | | | | | | |
5.00%, 6/15/40 | | | | | 1,325 | | | | 1,373,694 | |
AMT (AGM), 5.00%, 6/15/37 | | | | | 305 | | | | 310,362 | |
Delaware River Port Authority, RB: | | | | | | | | | | |
5.00%, 1/01/37 | | | | | 315 | | | | 341,879 | |
Series D, 5.00%, 1/01/40 | | | | | 750 | | | | 791,167 | |
Pennsylvania Turnpike Commission, RB: | | | | | | | | | | |
CAB, Sub-Series A-3, 0.00%, 12/01/41 (b) | | | | | 575 | | | | 137,661 | |
CAB, Sub-Series A-3, 0.00%, 12/01/42 (b) | | | | | 660 | | | | 152,137 | |
CAB, Sub-Series A-3 (AGM), 0.00%, 12/01/40 (b) | | | | | 225 | | | | 58,221 | |
Series A, 5.00%, 12/01/38 | | | | | 500 | | | | 541,890 | |
Series A (AMBAC), 5.25%, 12/01/32 | | | | | 870 | | | | 891,863 | |
Sub-Series A, 5.13%, 12/01/26 | | | | | 100 | | | | 110,145 | |
Sub-Series A, 6.00%, 12/01/41 | | | | | 100 | | | | 109,904 | |
Southeastern Pennsylvania Transportation Authority, RB, Capital Grant Receipts: | | | | | | | | | | |
5.00%, 6/01/28 | | | | | 290 | | | | 317,654 | |
5.00%, 6/01/29 | | | | | 385 | | | | 419,442 | |
| | | | | | | | | 5,556,019 | |
Municipal Bonds
| | | | Par
(000) | | Value
|
Pennsylvania (continued) |
Utilities — 4.4% | | | | | | | | | | |
City of Philadelphia Pennsylvania Gas Works, RB, 9th Series, 5.25%, 8/01/40 | | | | $ | 270 | | | $ | 297,748 | |
City of Philadelphia Pennsylvania Water & Wastewater, RB: | | | | | | | | | | |
Series A, 5.25%, 1/01/36 | | | | | 100 | | | | 106,365 | |
Series C (AGM), 5.00%, 8/01/40 | | | | | 350 | | | | 366,215 | |
County of Allegheny Pennsylvania Sanitary Authority, RB, Sewer Improvement, 5.25%, 12/01/41 | | | | | 195 | | | | 211,173 | |
County of Bucks Pennsylvania Water & Sewer Authority, RB, Water System (AGM), 5.00%, 12/01/41 | | | | | 30 | | | | 32,312 | |
County of Delaware Pennsylvania Regional Water Quality Control Authority, RB, Sewer Improvements, 5.00%, 5/01/33 | | | | | 70 | | | | 77,309 | |
Pennsylvania Economic Development Financing Authority, RB, Philadelphia Biosolids Facility, 6.25%, 1/01/32 | | | | | 185 | | | | 189,862 | |
| | | | | | | | | 1,280,984 | |
Total Municipal Bonds in Pennsylvania | | | | | | | | | 42,135,288 | |
|
Guam — 0.5% |
State — 0.5% | | | | | | | | | | |
Territory of Guam, RB, Limited Obligation Bonds, Section 30, Series A, 5.63%, 12/01/29 | | | | | 150 | | | | 163,106 | |
Total Municipal Bonds — 146.7% | | | | | | | | | 42,298,394 | |
|
Municipal Bonds Transferred to
Tender Option Bond Trusts (c) |
Pennsylvania — 5.1% |
Education — 3.3% | | | | | | | | | | |
Pennsylvania Higher Educational Facilities Authority, RB, University of Pennsylvania Health System, Series A, 5.75%, 8/15/41 | | | | | 850 | | | | 948,914 | |
Health — 1.8% | | | | | | | | | | |
Geisinger Authority Pennsylvania, RB, Health System, Series A, 5.13%, 6/01/34 | | | | | 500 | | | | 534,175 | |
Total Municipal Bonds Transferred to
Tender Option Bond Trusts in Pennsylvania — 5.1% | | | | | | | | | 1,483,089 | |
Total Long-Term Investments
(Cost — $41,371,434) — 151.8% | | | | | | | | | 43,781,483 | |
|
| Short-Term Securities | | | | Shares | | |
BIF Pennsylvania Municipal Money Fund, 0.00% (d)(e) | | | | | 1,224,599 | | | | 1,224,599 | |
Total Short-Term Securities
(Cost — $1,224,599) — 4.3% | | | | | | | | | 1,224,599 | |
Total Investments
(Cost — $42,596,033) — 156.1% | | | | | | | | | 45,006,082 | |
Other Assets Less Liabilities — 2.8% | | | | | | | | | 793,087 | |
Liability for TOB Trust Certificates, Including Interest Expense and Fees Payable — (2.3%) | | | | | | | | | (675,168 | ) |
VRDP Shares, at Liquidation Value — (56.6%) | | | | | | | | | (16,300,000 | ) |
Net Assets Applicable to Common Shares — 100.0% | | | | | | | | $ | 28,824,001 | |
See Notes to Financial Statements.
| ANNUAL REPORT | APRIL 30, 2014 | 41
|
| |
| Schedule of Investments (continued) | BlackRock Pennsylvania Strategic Municipal Trust (BPS)
(Percentages shown are based on Net Assets)
|
Notes to Schedule of Investments
| (a) | | | | Variable rate security. Rate shown is as of report date. |
| (b) | | | | Zero-coupon bond. |
| (c) | | | | Represent bonds transferred to a TOB. In exchange for which the Trust acquired residual interest certificates. These bonds serve as collateral in a financing transaction. See Note 3 of the Notes to Financial Statements for details of municipal bonds transferred to TOBs. |
| (d) | | | | Investments in issuers considered to be an affiliate of the Trust during the year ended April 30, 2014, for purposes of Section 2(a)(3) of the Investment Company Act of 1940, as amended, were as follows: |
| Affiliate | | | | Shares
Held at
April 30, 2013 | | Net
Activity | | Shares
Held at
April 30, 2014 | | Income | |
BIF Pennsylvania Municipal Money Fund | | | | 1,396,790 | | (172,191) | | 1,224,599 | | — | |
| (e) | | | | Represents the current yield as of report date. |
| • | | | | Financial futures contracts outstanding as of April 30, 2014 were as follows: |
Contracts
Sold | | | | Issue | | Exchange | | Expiration | | Notional
Value | | Unrealized
Depreciation |
| (47) | | | | 10-Year U.S Treasury Note | | Chicago Board of Trade | | June 2014 | | $ | 5,847,828 | | | $ | (19,018 | ) |
| • | | | | For Trust compliance purposes, the Trust’s sector classifications refer to any one or more of the sector sub-classifications used by one or more widely recognized market indexes or rating group indexes, and/or as defined by the investment advisor. These definitions may not apply for purposes of this report, which may combine such sector sub-classifications for reporting ease. |
| • | | | | Fair Value Measurements — Various inputs are used in determining the fair value of investments and derivative financial instruments. These inputs to valuation techniques are categorized into a disclosure hierarchy consisting of three broad levels for financial statement purposes as follows: |
| • | | | | Level 1 — unadjusted price quotations in active markets/exchanges for identical assets or liabilities that the Trust has the ability to access |
| • | | | | Level 2 — other observable inputs (including, but not limited to, quoted prices for similar assets or liabilities in markets that are active, quoted prices for identical or similar assets or liabilities in markets that are not active, inputs other than quoted prices that are observable for the assets or liabilities (such as interest rates, yield curves, volatilities, prepayment speeds, loss severities, credit risks and default rates) or other market-corroborated inputs) |
| • | | | | Level 3 — unobservable inputs based on the best information available in the circumstances, to the extent observable inputs are not available (including the Trust’s own assumptions used in determining the fair value of investments and derivative financial instruments) |
| | | | | The hierarchy gives the highest priority to unadjusted quoted prices in active markets for identical assets or liabilities (Level 1 measurements) and the lowest priority to unobservable inputs (Level 3 measurements). Accordingly, the degree of judgment exercised in determining fair value is greatest for instruments categorized in Level 3. The inputs used to measure fair value may fall into different levels of the fair value hierarchy. In such cases, for disclosure purposes, the fair value hierarchy classification is determined based on the lowest level input that is significant to the fair value measurement in its entirety. |
| | | | | Changes in valuation techniques may result in transfers into or out of an assigned level within the disclosure hierarchy. In accordance with the Trust’s policy, transfers between different levels of the fair value disclosure hierarchy are deemed to have occurred as of the beginning of the reporting period. The categorization of a value determined for investments and derivative financial instruments is based on the pricing transparency of the investment and derivative financial instrument and is not necessarily an indication of the risks associated with investing in those securities. For information about the Trust’s policy regarding valuation of investments and derivative financial instruments, please refer to Note 2 of the Notes to Financial Statements. |
See Notes to Financial Statements.
| 42 | ANNUAL REPORT | APRIL 30, 2014
|
| |
| Schedule of Investments (concluded) | BlackRock Pennsylvania Strategic Municipal Trust (BPS)
|
| | | | | The following tables summarize the Trust’s investments and derivative financial instruments categorized in the disclosure hierarchy as of April 30, 2014: |
| | | | | Level 1 | | Level 2 | | Level 3 | | Total |
Assets:
| | | | | | | | | | | |
Investments:
| | | | | | | | | | | | | | | | | | |
Long-Term Investments1 | | | | | — | | | $ | 43,781,483 | | | | — | | | $ | 43,781,483 | |
Short-Term Securities | | | | $ | 1,224,599 | | | | — | | | | — | | | | 1,224,599 | |
Total
| | | | $ | 1,224,599 | | | $ | 43,781,483 | | | | — | | | $ | 45,006,082 | |
| 1 | See above Schedule of Investments for values in each sector. |
| | | | | Level 1 | | Level 2 | | Level 3 | | Total |
Derivative Financial Instruments2
| | | | | | | | | | | | | | | | | | |
Liabilities:
| | | | | | | | | | | | | | | | | | |
Interest rate contracts | | | | $ | (19,018 | ) | | | — | | | | — | | | $ | (19,018 | ) |
| 2 | Derivative financial instruments are financial futures contracts, which are valued at the unrealized appreciation/depreciation on the instrument. |
| | | | | The carry amount for certain of the Trust’s assets and/or liabilities approximates fair value for financial statement purposes. As of April 30, 2014, such assets and/or liabilities are categorized within the disclosure hierarchy as follows: |
| | | | | Level 1 | | Level 2 | | Level 3 | | Total |
Assets:
| | | | | | | | | | | | | | | | | | |
Cash pledged for financial futures contracts | | | | $ | 62,000 | | | | — | | | | — | | | $ | 62,000 | |
Liabilities:
| | | | | | | | | | | | | | | | | | |
TOB trust certificates | | | | | — | | | $ | (675,000 | ) | | | — | | | | (675,000 | ) |
VRDP Shares | | | | | — | | | | (16,300,000 | ) | | | — | | | | (16,300,000 | ) |
Total
| | | | $ | 62,000 | | | $ | (16,975,000 | ) | | | — | | | $ | (16,913,000 | ) |
| | | | | There were no transfers between levels during the year ended April 30, 2014. |
See Notes to Financial Statements.
| ANNUAL REPORT | APRIL 30, 2014 | 43
|
| |
| Schedule of Investments April 30, 2014 | BlackRock Strategic Municipal Trust (BSD)
(Percentages shown are based on Net Assets)
|
| Municipal Bonds | | | | Par
(000) | | Value |
Alabama — 2.8% | | | | | | | | | | |
Alabama State Docks Department, Refunding RB, 6.00%, 10/01/40 | | | | $ | 655 | | | $ | 747,185 | |
County of Jefferson Alabama, RB, Limited Obligation School, Series A, 5.25%, 1/01/19 | | | | | 465 | | | | 467,292 | |
County of Jefferson Alabama Sewer, Refunding RB: | | | | | | | | | | |
Convertible CAB, Senior Lien, Series C (AGM), 0.00%, 10/01/38 (a) | | | | | 185 | | | | 112,432 | |
Convertible CAB, Senior Lien, Series C (AGM), 0.00%, 10/01/42 (a) | | | | | 160 | | | | 96,618 | |
Senior Lien, Series A (AGM), 5.00%, 10/01/44 | | | | | 250 | | | | 253,687 | |
Sub-Lien, Series D, 7.00%, 10/01/51 | | | | | 1,115 | | | | 1,259,805 | |
| | | | | | | | | 2,937,019 | |
Alaska — 1.0% | | | | | | | | | | |
Northern Tobacco Securitization Corp., Refunding RB, Tobacco Settlement, Asset-Backed, Series A: | | | | | | | | | | |
4.63%, 6/01/23 | | | | | 625 | | | | 603,156 | |
5.00%, 6/01/46 | | | | | 530 | | | | 384,759 | |
| | | | | | | | | 987,915 | |
Arizona — 1.1% | | | | | | | | | | |
Salt Verde Financial Corp., RB, Senior, 5.00%, 12/01/37 | | | | | 1,000 | | | | 1,095,230 | |
California — 9.6% | | | | | | | | | | |
Bay Area Toll Authority, Refunding RB, San Francisco Bay Area Toll Bridge, Series F-1, 5.63%, 4/01/44 | | | | | 720 | | | | 787,889 | |
California Health Facilities Financing Authority, RB, Sutter Health, Series B, 6.00%, 8/15/42 | | | | | 1,010 | | | | 1,196,426 | |
California Health Facilities Financing Authority, Refunding RB, St. Joseph Health System, Series A, 5.00%, 7/01/33 | | | | | 400 | | | | 437,500 | |
California Pollution Control Financing Authority, RB (b): | | | | | | | | | | |
County of San Diego California Water Authority Desalination Project Pipeline, 5.00%, 11/21/45 | | | | | 390 | | | | 390,086 | |
Poseidon Resources (Channel Side) LP Desalination Project, AMT, 5.00%, 7/01/37 | | | | | 325 | | | | 325,842 | |
Poseidon Resources (Channel Side) LP Desalination Project, AMT, 5.00%, 11/21/45 | | | | | 475 | | | | 465,600 | |
California State Public Works Board, RB: | | | | | | | | | | |
Department of Corrections & Rehabilitation, Series F, 5.25%, 9/01/33 | | | | | 915 | | | | 1,023,757 | |
Various Capital Projects, Series I, 5.00%, 11/01/38 | | | | | 240 | | | | 257,249 | |
Various Capital Projects, Sub-Series I-1, 6.38%, 11/01/34 | | | | | 375 | | | | 449,659 | |
City of Los Angeles California Department of Airports, Refunding ARB, Los Angeles International Airport, Series A: | | | | | | | | | | |
5.25%, 5/15/39 | | | | | 250 | | | | 281,640 | |
Senior, 5.00%, 5/15/40 | | | | | 1,875 | | | | 2,020,931 | |
City of Stockton California Public Financing Authority, RB, Delta Water Supply Project, Series A, 6.25%, 10/01/38 | | | | | 110 | | | | 122,409 | |
County of Stanislaus California Tobacco Securitization Agency, RB, CAB, County of Stanislaus Tobacco Funding Cop., Sub-Series C, 0.00%, 6/01/55 (c) | | | | | 3,095 | | | | 38,687 | |
San Diego Community College District California, GO, Election of 2006, 5.00%, 8/01/43 | | | | | 340 | | | | 374,625 | |
State of California, GO, Various Purposes: | | | | | | | | | | |
6.00%, 3/01/33 | | | | | 800 | | | | 958,832 | |
6.50%, 4/01/33 | | | | | 650 | | | | 792,174 | |
| | | | | | | | | 9,923,306 | |
| Municipal Bonds | | | | Par
(000) | | Value |
Colorado — 1.5% | | | | | | | | | | |
Colorado Health Facilities Authority, Refunding RB, Catholic Health Initiative, Series A, 5.50%, 7/01/34 | | | | $ | 680 | | | $ | 771,099 | |
Park Creek Metropolitan District, Refunding RB, Senior Limited Property Tax, 5.50%, 12/01/37 | | | | | 440 | | | | 441,822 | |
Regional Transportation District, COP, Refunding, Series A, 5.38%, 6/01/31 | | | | | 320 | | | | 349,050 | |
| | | | | | | | | 1,561,971 | |
Delaware — 2.0% | | | | | | | | | | |
County of Sussex Delaware, RB, NRG Energy, Inc., Indian River Power LLC Project, 6.00%, 10/01/40 | | | | | 820 | | | | 877,523 | |
Delaware State EDA, RB, Exempt Facilities, Indian River Power LLC Project, 5.38%, 10/01/45 | | | | | 1,210 | | | | 1,234,599 | |
| | | | | | | | | 2,112,122 | |
District of Columbia — 3.3% | | | | | | | | | | |
District of Columbia, Tax Allocation Bonds, City Market at O Street Project, 5.13%, 6/01/41 | | | | | 690 | | | | 717,165 | |
District of Columbia Tobacco Settlement Financing Corp., Refunding RB, Asset-Backed, 6.50%, 5/15/33 | | | | | 1,340 | | | | 1,435,180 | |
Metropolitan Washington Airports Authority, Refunding RB, 1st Senior Lien, Series A: | | | | | | | | | | |
5.00%, 10/01/39 | | | | | 160 | | | | 167,087 | |
5.25%, 10/01/44 | | | | | 1,000 | | | | 1,051,870 | |
| | | | | | | | | 3,371,302 | |
Florida — 4.4% | | | | | | | | | | |
County of Hillsborough Florida IDA, RB, National Gypsum Co., Series A, AMT, 7.13%, 4/01/30 | | | | | 1,500 | | | | 1,506,750 | |
County of Tampa-Hillsborough Florida Expressway Authority, Refunding RB, Series A, 5.00%, 7/01/37 | | | | | 195 | | | | 208,324 | |
Miami Beach Health Facilities Authority, RB, Mount Sinai Medical Center Florida, 6.75%, 11/15/21 | | | | | 925 | | | | 952,944 | |
Mid-Bay Bridge Authority, RB, Springing Lien, Series A, 7.25%, 10/01/40 | | | | | 950 | | | | 1,083,618 | |
Village Community Development District No. 10, Special Assessment Bonds, 5.13%, 5/01/43 | | | | | 785 | | | | 768,177 | |
| | | | | | | | | 4,519,813 | |
Georgia — 1.4% | | | | | | | | | | |
DeKalb Private Hospital Authority, Refunding RB, Children’s Healthcare, 5.25%, 11/15/39 | | | | | 265 | | | | 293,700 | |
Metropolitan Atlanta Rapid Transit Authority, RB, Sales Tax, 3rd Indenture, Series A, 5.00%, 7/01/39 | | | | | 1,095 | | | | 1,190,812 | |
| | | | | | | | | 1,484,512 | |
Hawaii — 0.5% | | | | | | | | | | |
State of Hawaii Harbor System, RB, Series A, 5.25%, 7/01/30 | | | | | 425 | | | | 469,153 | |
Illinois — 21.3% | | | | | | | | | | |
City of Chicago Illinois Board of Education, GO, Series A, 5.25%, 12/01/41 | | | | | 1,400 | | | | 1,404,270 | |
City of Chicago Illinois, GARB, O’Hare International Airport 3rd Lien: | | | | | | | | | | |
Series A, 5.63%, 1/01/35 | | | | | 800 | | | | 870,512 | |
Series A, 5.75%, 1/01/39 | | | | | 1,500 | | | | 1,637,565 | |
Series C, 6.50%, 1/01/41 | | | | | 1,855 | | | | 2,152,245 | |
City of Chicago Illinois, GO, Project, Series A, 5.00%, 1/01/34 | | | | | 1,000 | | | | 1,009,440 | |
City of Chicago Illinois, GO, Refunding, Series A, 5.25%, 1/01/32 | | | | | 1,000 | | | | 1,037,550 | |
City of Chicago Illinois, Refunding RB, Sales Tax, Series A, 5.25%, 1/01/38 | | | | | 260 | | | | 275,800 | |
City of Chicago Illinois Transit Authority, RB, Sales Tax Receipts, 5.25%, 12/01/40 | | | | | 330 | | | | 352,298 | |
City of Chicago Illinois Waterworks, Refunding RB, 2nd Lien Project, 5.00%, 11/01/42 | | | | | 1,415 | | | | 1,460,492 | |
See Notes to Financial Statements.
| 44 | ANNUAL REPORT | APRIL 30, 2014
|
| |
| Schedule of Investments (continued) | BlackRock Strategic Municipal Trust (BSD)
(Percentages shown are based on Net Assets)
|
| Municipal Bonds | | | | Par
(000) | | Value |
Illinois (concluded) | | | | | | | | | | |
County of Cook Illinois Community College District No. 508, GO, City College of Chicago, 5.50%, 12/01/38 | | | | $ | 245 | | | $ | 270,115 | |
Illinois Finance Authority, Refunding RB: | | | | | | | | | | |
Ascension Health, Series A, 5.00%, 11/15/37 | | | | | 305 | | | | 327,350 | |
Central Dupage Health, Series B, 5.50%, 11/01/39 | | | | | 2,500 | | | | 2,775,500 | |
Friendship Village Schaumburg, Series A, 5.63%, 2/15/37 | | | | | 145 | | | | 134,009 | |
Illinois State Toll Highway Authority, RB, Series A, 5.00%, 1/01/38 | | | | | 730 | | | | 769,858 | |
Metropolitan Pier & Exposition Authority, Refunding RB, McCormick Place Expansion Project: | | | | | | | | | | |
CAB, Series B (AGM), 0.00%, 6/15/44 (c) | | | | | 2,980 | | | | 595,046 | |
Series B (AGM), 5.00%, 6/15/50 | | | | | 1,280 | | | | 1,305,933 | |
Series B-2, 5.00%, 6/15/50 | | | | | 785 | | | | 800,716 | |
Railsplitter Tobacco Settlement Authority, RB: | | | | | | | | | | |
5.50%, 6/01/23 | | | | | 175 | | | | 203,945 | |
6.00%, 6/01/28 | | | | | 940 | | | | 1,090,795 | |
State of Illinois, GO: | | | | | | | | | | |
5.00%, 2/01/39 | | | | | 480 | | | | 497,208 | |
Series A, 5.00%, 4/01/35 | | | | | 1,000 | | | | 1,042,340 | |
Series A, 5.00%, 4/01/38 | | | | | 1,135 | | | | 1,174,589 | |
State of Illinois, RB, Build Illinois, Series B, 5.25%, 6/15/34 | | | | | 200 | | | | 221,682 | |
University of Illinois, RB, Auxiliary Facilities System, Series A: | | | | | | | | | | |
5.00%, 4/01/39 | | | | | 250 | | | | 268,390 | |
5.00%, 4/01/44 | | | | | 310 | | | | 330,978 | |
| | | | | | | | | 22,008,626 | |
Indiana — 5.5% | | | | | | | | | | |
Carmel Redevelopment Authority, Refunding RB, Multipurpose, Series A, 4.00%, 2/01/38 | | | | | 320 | | | | 320,877 | |
City of Valparaiso Indiana, RB, Exempt Facilities, Pratt Paper LLC Project, AMT: | | | | | | | | | | |
6.75%, 1/01/34 | | | | | 245 | | | | 262,765 | |
7.00%, 1/01/44 | | | | | 1,090 | | | | 1,176,437 | |
Indiana Finance Authority, RB, Series A: | | | | | | | | | | |
CWA Authority Project, 1st Lien, 5.25%, 10/01/38 | | | | | 1,020 | | | | 1,121,725 | |
Private Activity Bond, Ohio River Bridges East End Crossing Project, AMT, 5.00%, 7/01/44 | | | | | 140 | | | | 141,365 | |
Private Activity Bond, Ohio River Bridges East End Crossing Project, AMT, 5.00%, 7/01/48 | | | | | 465 | | | | 471,115 | |
Sisters of St. Francis Health Services, 5.25%, 11/01/39 | | | | | 270 | | | | 285,293 | |
Indiana Health Facility Financing Authority, Refunding RB, Methodist Hospital, Inc., 5.38%, 9/15/22 | | | | | 1,060 | | | | 1,061,346 | |
Indiana Municipal Power Agency, RB, Series B, 6.00%, 1/01/39 | | | | | 350 | | | | 392,983 | |
Indianapolis Local Public Improvement Bond Bank, RB, Series A, 5.00%, 1/15/40 | | | | | 400 | | | | 432,200 | |
| | | | | | | | | 5,666,106 | |
Iowa — 2.6% | | | | | | | | | | |
Iowa Finance Authority, RB, Midwestern Disaster Area, Alcoa, Inc. Project, 4.75%, 8/01/42 | | | | | 365 | | | | 345,440 | |
Iowa Finance Authority, Refunding RB, Midwestern Disaster Area, Iowa Fertilizer Co. Project: | | | | | | | | | | |
5.00%, 12/01/19 | | | | | 300 | | | | 303,630 | |
5.50%, 12/01/22 | | | | | 730 | | | | 741,775 | |
5.25%, 12/01/25 | | | | | 145 | | | | 144,943 | |
Iowa Student Loan Liquidity Corp., Refunding RB, Student Loan, Senior Series A-1, AMT, 5.15%, 12/01/22 | | | | | 515 | | | | 537,974 | |
Iowa Tobacco Settlement Authority, Refunding RB, Asset-Backed, Series C, 5.63%, 6/01/46 | | | | | 710 | | | | 604,380 | |
| | | | | | | | | 2,678,142 | |
| Municipal Bonds | | | | Par
(000) | | Value |
Kentucky — 3.7% | | | | | | | | | | |
Kentucky Economic Development Finance Authority, RB, Catholic Health Initiatives, Series A, 5.25%, 1/01/45 | | | | $ | 310 | | | $ | 333,197 | |
Kentucky Economic Development Finance Authority, Refunding RB, Norton Healthcare, Inc., Series B (NPFGC), 0.00%, 10/01/24 (c) | | | | | 5,000 | | | | 3,264,100 | |
Kentucky Public Transportation Infrastructure Authority, RB, Downtown Crossing Project, Convertible CAB, 1st Tier, Series C, 0.00%, 7/01/43 (a) | | | | | 375 | | | | 228,349 | |
| | | | | | | | | 3,825,646 | |
Louisiana — 2.6% | | | | | | | | | | |
Louisiana Local Government Environmental Facilities & Community Development Authority, RB, Westlake Chemical Corp. Project, Series A-1, 6.50%, 11/01/35 | | | | | 1,055 | | | | 1,173,445 | |
Tobacco Settlement Financing Corp., Refunding RB, Asset-Backed, Series A: | | | | | | | | | | |
5.50%, 5/15/30 | | | | | 320 | | | | 345,849 | |
5.25%, 5/15/31 | | | | | 270 | | | | 285,690 | |
5.25%, 5/15/32 | | | | | 345 | | | | 362,885 | |
5.25%, 5/15/33 | | | | | 375 | | | | 393,405 | |
5.25%, 5/15/35 | | | | | 160 | | | | 167,920 | |
| | | | | | | | | 2,729,194 | |
Maryland — 1.9% | | | | | | | | | | |
Maryland EDC, RB, Transportation Facilities Project, Series A, 5.75%, 6/01/35 | | | | | 135 | | | | 140,631 | |
Maryland EDC, Refunding RB, CNX Marine Terminals, Inc., 5.75%, 9/01/25 | | | | | 1,000 | | | | 1,069,890 | |
Maryland Health & Higher Educational Facilities Authority, Refunding RB, Charlestown Community Project, 6.25%, 1/01/41 | | | | | 690 | | | | 749,340 | |
| | | | | | | | | 1,959,861 | |
Massachusetts — 0.4% | | | | | | | | | | |
Massachusetts Development Finance Agency, Refunding RB, Covanta Energy Project, Series C, AMT, 5.25%, 11/01/42 | | | | | 445 | | | | 447,398 | |
Michigan — 4.9% | | | | | | | | | | |
City of Detroit Michigan Sewage Disposal System, Refunding RB, Senior Lien, Series A: | | | | | | | | | | |
5.00%, 7/01/32 | | | | | 495 | | | | 477,774 | |
5.25%, 7/01/39 | | | | | 1,925 | | | | 1,872,448 | |
City of Lansing Michigan, RB, Board of Water & Light Utilities System, Series A, 5.50%, 7/01/41 | | | | | 465 | | | | 526,961 | |
Kalamazoo Hospital Finance Authority, Refunding RB, Bronson Methodist Hospital, 5.50%, 5/15/36 | | | | | 435 | | | | 459,899 | |
Michigan State Hospital Finance Authority, Refunding RB, Henry Ford Health System, Series A, 5.25%, 11/15/46 | | | | | 500 | | | | 503,505 | |
Royal Oak Hospital Finance Authority Michigan, Refunding RB, William Beaumont Hospital, Series V, 8.25%, 9/01/18 (d) | | | | | 1,000 | | | | 1,226,520 | |
| | | | | | | | | 5,067,107 | |
Missouri — 0.5% | | | | | | | | | | |
Bi-State Development Agency of the Missouri-Illinois Metropolitan District, Refunding RB, Combined Lien, Series A, 5.00%, 10/01/44 | | | | | 80 | | | | 86,500 | |
Missouri State Health & Educational Facilities Authority, RB, Senior Living Facilities, Lutheran Senior Services, 5.50%, 2/01/42 | | | | | 330 | | | | 340,461 | |
State of Missouri Health & Educational Facilities Authority, Refunding RB, St. Louis College of Pharmacy Project, 5.50%, 5/01/43 | | | | | 80 | | | | 84,594 | |
| | | | | | | | | 511,555 | |
See Notes to Financial Statements.
| ANNUAL REPORT | APRIL 30, 2014 | 45
|
| |
| Schedule of Investments (continued) | BlackRock Strategic Municipal Trust (BSD)
(Percentages shown are based on Net Assets)
|
| Municipal Bonds | | | | Par
(000) | | Value |
Nebraska — 1.5% | | | | | | | | | | |
Central Plains Energy Project Nebraska, RB, Gas Project No. 3: | | | | | | | | | | |
5.25%, 9/01/37 | | | | $ | 260 | | | $ | 275,080 | |
5.00%, 9/01/42 | | | | | 455 | | | | 470,320 | |
County of Douglas Nebraska Hospital Authority No. 2, Refunding RB, Health Facilities, Immanuel Obligation Group, 5.63%, 1/01/40 | | | | | 720 | | | | 768,996 | |
| | | | | | | | | 1,514,396 | |
Nevada — 0.9% | | | | | | | | | | |
County of Clark Nevada, Refunding RB, Alexander Dawson School Nevada Project, 5.00%, 5/15/29 | | | | | 880 | | | | 937,816 | |
New Jersey — 7.9% | | | | | | | | | | |
County of Middlesex New Jersey Improvement Authority, RB, Heldrich Center Hotel, Sub-Series B, 6.25%, 1/01/37 (e)(f) | | | | | 645 | | | | 44,750 | |
New Jersey EDA, RB: | | | | | | | | | | |
Continental Airlines, Inc. Project, AMT, 5.13%, 9/15/23 | | | | | 1,090 | | | | 1,102,884 | |
Continental Airlines, Inc. Project, AMT, 5.25%, 9/15/29 | | | | | 145 | | | | 146,541 | |
The Goethals Bridge Replacement Project, AMT, 5.38%, 1/01/43 | | | | | 500 | | | | 526,345 | |
New Jersey EDA, Refunding, Special Assessment Bonds, Kapkowski Road Landfill Project, 5.75%, 4/01/31 | | | | | 705 | | | | 751,530 | |
New Jersey State Turnpike Authority, RB: | | | | | | | | | | |
Series A, 5.00%, 1/01/43 | | | | | 1,625 | | | | 1,731,372 | |
Series E, 5.25%, 1/01/40 | | | | | 1,355 | | | | 1,480,324 | |
New Jersey Transportation Trust Fund Authority, RB, Transportation System: | | | | | | | | | | |
Series A, 5.50%, 6/15/41 | | | | | 575 | | | | 632,098 | |
Series B, 5.25%, 6/15/36 | | | | | 775 | | | | 841,007 | |
Rutgers—The State University of New Jersey, Refunding RB, Series L: | | | | | | | | | | |
5.00%, 5/01/38 | | | | | 160 | | | | 176,576 | |
5.00%, 5/01/43 | | | | | 165 | | | | 180,635 | |
Tobacco Settlement Financing Corp. New Jersey, Refunding RB, Series 1A, 4.50%, 6/01/23 | | | | | 540 | | | | 522,947 | |
| | | | | | | | | 8,137,009 | |
New York — 10.5% | | | | | | | | | | |
Albany Industrial Development Agency, RB, New Covenant Charter School Project, Series A, 7.00%, 5/01/35 (e)(f) | | | | | 315 | | | | 47,269 | |
City of New York New York Industrial Development Agency, ARB, AMT: | | | | | | | | | | |
American Airlines, Inc., JFK International Airport, 7.75%, 8/01/31 (g) | | | | | 3,000 | | | | 3,301,380 | |
British Airways PLC Project, 7.63%, 12/01/32 | | | | | 1,000 | | | | 1,005,090 | |
City of New York New York Transitional Finance Authority, Future Tax Secured Bonds, RB, Fiscal 2012, Sub-Series E-1, 5.00%, 2/01/42 | | | | | 770 | | | | 830,429 | |
Metropolitan Transportation Authority, RB, Series B: | | | | | | | | | | |
5.25%, 11/15/38 | | | | | 750 | | | | 825,585 | |
5.25%, 11/15/39 | | | | | 265 | | | | 291,937 | |
New York Liberty Development Corp., Refunding RB, 2nd Priority, Bank of America Tower at One Bryant Park Project, Class 3, 6.38%, 7/15/49 | | | | | 385 | | | | 418,734 | |
New York State Dormitory Authority, RB, Series F, 5.00%, 3/15/35 | | | | | 2,145 | | | | 2,222,842 | |
New York State Dormitory Authority, Refunding RB, General Purpose, Series A, 5.00%, 6/15/31 | | | | | 560 | | | | 627,362 | |
Niagara Area Development Corp., Refunding RB, Solid Waste Disposal Facility, Covanta Energy Project, Series A, AMT, 5.25%, 11/01/42 | �� | | | | 330 | | | | 331,779 | |
| Municipal Bonds | | | | Par
(000) | | Value |
New York (concluded) | | | | | | | | | | |
Port Authority of New York & New Jersey, ARB, Special Project, JFK International Air Terminal LLC Project, Series 8: | | | | | | | | | | |
6.00%, 12/01/36 | | | | $ | 410 | | | $ | 450,947 | |
6.00%, 12/01/42 | | | | | 395 | | | | 433,738 | |
| | | | | | | | | 10,787,092 | |
North Carolina — 0.7% | | | | | | | | | | |
North Carolina Medical Care Commission, RB, Health Care Facilities, Duke University Health System, Series A, 5.00%, 6/01/42 | | | | | 440 | | | | 479,314 | |
North Carolina Medical Care Commission, Refunding RB, First Mortgage, Retirement Facilities Whitestone Project, Series A, 7.75%, 3/01/41 | | | | | 185 | | | | 203,567 | |
| | | | | | | | | 682,881 | |
Ohio — 2.1% | | | | | | | | | | |
County of Franklin Ohio, RB, Health Care Facilities Improvement, OPRS Communities Obligation Group, Series A, 6.13%, 7/01/40 | | | | | 210 | | | | 219,931 | |
County of Montgomery Ohio, Refunding RB, Catholic Health, Series A, 5.00%, 5/01/39 | | | | | 885 | | | | 912,621 | |
State of Ohio, RB, Ford Motor Co. Project, AMT, 5.75%, 4/01/35 | | | | | 1,000 | | | | 1,014,860 | |
| | | | | | | | | 2,147,412 | |
Oregon — 0.7% | | | | | | | | | | |
Oregon State Facilities Authority, RB, Student Housing, CHF-Ashland, Southern Oregon University Project, 5.00%, 7/01/44 | | | | | 715 | | | | 744,630 | |
Pennsylvania — 1.3% | | | | | | | | | | |
Pennsylvania Economic Development Financing Authority, RB, Aqua Pennsylvania, Inc. Project, Series B, 5.00%, 11/15/40 | | | | | 600 | | | | 636,588 | |
Pennsylvania Turnpike Commission, RB, Series A, 5.00%, 12/01/44 | | | | | 345 | | | | 370,823 | |
Philadelphia Hospitals & Higher Education Facilities Authority, RB, Temple University Health System, Series A, 5.63%, 7/01/42 | | | | | 385 | | | | 367,968 | |
| | | | | | | | | 1,375,379 | |
South Carolina — 1.1% | | | | | | | | | | |
South Carolina State Ports Authority, RB, 5.25%, 7/01/40 | | | | | 1,040 | | | | 1,109,222 | |
Tennessee — 0.4% | | | | | | | | | | |
City of Chattanooga Tennessee Health Educational & Housing Facility Board, RB, Catholic Health Initiatives, Series A, 5.25%, 1/01/45 | | | | | 430 | | | | 462,177 | |
Texas — 14.6% | | | | | | | | | | |
Brazos River Authority, RB, TXU Electric, Series A, AMT, 8.25%, 10/01/30 (e)(f) | | | | | 730 | | | | 20,075 | |
Central Texas Regional Mobility Authority, Refunding RB: | | | | | | | | | | |
Senior Lien, 6.25%, 1/01/46 | | | | | 680 | | | | 744,172 | |
Sub-Lien, 5.00%, 1/01/33 | | | | | 115 | | | | 115,409 | |
Sub-Lien, 5.00%, 1/01/42 | | | | | 100 | | | | 97,219 | |
City of Dallas Texas Waterworks & Sewer System, Refunding RB, 5.00%, 10/01/35 | | | | | 475 | | | | 532,632 | |
City of Houston Texas Airport System, ARB, Special Facilities, Continental Airlines, Inc., Series E, AMT, 6.75%, 7/01/29 | | | | | 680 | | | | 680,204 | |
City of Houston Texas Airport System, Refunding ARB, Senior Lien, Series A, 5.50%, 7/01/39 | | | | | 485 | | | | 548,118 | |
City of Houston Texas Utility System, Refunding RB, Combined 1st Lien, Series A (AGC), 6.00%, 11/15/35 | | | | | 2,730 | | | | 3,189,732 | |
Clifton Higher Education Finance Corp., RB, Idea Public Schools, 6.00%, 8/15/43 | | | | | 230 | | | | 255,946 | |
See Notes to Financial Statements.
| 46 | ANNUAL REPORT | APRIL 30, 2014
|
| |
| Schedule of Investments (continued) | BlackRock Strategic Municipal Trust (BSD)
(Percentages shown are based on Net Assets)
|
| Municipal Bonds | | | | Par
(000) | | Value |
Texas (concluded) | | | | | | | | | | |
County of Harris Texas Cultural Education Facilities Finance Corp., RB, 1st Mortgage, Brazos Presbyterian Homes, Inc. Project, Series B, 7.00%, 1/01/48 | | | | $ | 145 | | | $ | 153,870 | |
County of Harris Texas-Houston Sports Authority, Refunding RB, CAB, Senior Lien, Series A (NPFGC), 0.00%, 11/15/38 (c) | | | | | 4,750 | | | | 1,113,970 | |
County of Midland Texas Fresh Water Supply District No. 1, RB, CAB, City of Midland Projects, Series A, 0.00%, 9/15/37 (c) | | | | | 4,935 | | | | 1,647,796 | |
County of Tarrant Texas Cultural Education Facilities Finance Corp., RB, Scott & White Healthcare, 6.00%, 8/15/45 | | | | | 1,270 | | | | 1,503,794 | |
La Joya Independent School District, GO, Refunding, Unlimited Tax, 4.00%, 2/15/32 | | | | | 1,400 | | | | 1,458,142 | |
La Vernia Higher Education Finance Corp., RB, Kipp, Inc., Series A, 6.38%, 8/15/44 | | | | | 500 | | | | 555,085 | |
North Texas Tollway Authority, RB, CAB, Special Project System, Series B, 0.00%, 9/01/37 (c) | | | | | 640 | | | | 178,925 | |
North Texas Tollway Authority, Refunding RB, 2nd Tier System, Series F, 6.13%, 1/01/31 | | | | | 1,025 | | | | 1,098,083 | |
Texas Private Activity Bond Surface Transportation Corp., RB, Senior Lien: | | | | | | | | | | |
LBJ Infrastructure Group LLC, LBJ Freeway Managed Lanes Project, 7.00%, 6/30/40 | | | | | 500 | | | | 579,740 | |
NTE Mobility Partners LLC, North Tarrant Express Managed Lanes Project, 6.88%, 12/31/39 | | | | | 500 | | | | 570,710 | |
| | | | | | | | | 15,043,622 | |
Virginia — 5.9% | | | | | | | | | | |
County of Fairfax Virginia EDA, Refunding RB, Goodwin House, Inc., 5.13%, 10/01/42 | | | | | 1,000 | | | | 1,020,200 | |
University of Virginia, Refunding RB, General, 5.00%, 6/01/40 | | | | | 2,500 | | | | 2,783,750 | |
Virginia Small Business Financing Authority, RB, Senior Lien, Elizabeth River Crossings Opco LLC Project, AMT: | | | | | | | | | | |
5.25%, 1/01/32 | | | | | 250 | | | | 261,918 | |
6.00%, 1/01/37 | | | | | 1,845 | | | | 2,000,810 | |
| | | | | | | | | 6,066,678 | |
Washington — 0.8% | | | | | | | | | | |
Washington Health Care Facilities Authority, RB, Catholic Health Initiatives, Series A, 5.75%, 1/01/45 | | | | | 715 | | | | 794,243 | |
Wisconsin — 2.1% | | | | | | | | | | |
Wisconsin Health & Educational Facilities Authority, RB, Ascension Health Senior Credit Group, Series A, 5.00%, 11/15/31 | | | | | 2,000 | | | | 2,153,580 | |
Wyoming — 1.7% | | | | | | | | | | |
County of Sweetwater Wyoming, Refunding RB, Idaho Power Co. Project, Remarketing, 5.25%, 7/15/26 | | | | | 975 | | | | 1,061,473 | |
Wyoming Municipal Power Agency, Inc., RB, Series A: | | | | | | | | | | |
5.00%, 1/01/42 | | | | | 95 | | | | 97,700 | |
5.38%, 1/01/42 | | | | | 500 | | | | 553,230 | |
| | | | | | | | | 1,712,403 | |
Total Municipal Bonds — 123.2% | | | | | | | | | 127,024,518 | |
|
Municipal Bonds Transferred to
Tender Option Bond Trusts (h) |
Alabama — 0.8% | | | | | | | | | | |
City of Birmingham Alabama Special Care Facilities Financing Authority, Refunding RB, Ascension Health, Senior Credit, Series C-2, 5.00%, 11/15/36 | | | | | 760 | | | | 781,763 | |
Municipal Bonds Transferred to
Tender Option Bond Trusts (h) | | | | Par
(000) | | Value |
California — 5.5% | | | | | | | | | | |
California Educational Facilities Authority, RB, University of Southern California, Series B, 5.25%, 10/01/39 (i) | | | | $ | 855 | | | $ | 969,348 | |
City & County of San Francisco California Public Utilities Commission, RB, Water Revenue, Series B, 5.00%, 11/01/39 | | | | | 2,970 | | | | 3,275,435 | |
Los Angeles Community College District California, GO, Election of 2001, Series A (AGM), 5.00%, 8/01/32 | | | | | 740 | | | | 820,208 | |
San Diego Community College District California, GO, Election of 2002, 5.25%, 8/01/33 | | | | | 553 | | | | 635,953 | |
| | | | | | | | | 5,700,944 | |
Colorado — 2.0% | | | | | | | | | | |
Colorado Health Facilities Authority, RB, Catholic Health (AGM): | | | | | | | | | | |
Series C-3, 5.10%, 10/01/41 | | | | | 1,210 | | | | 1,255,097 | |
Series C-7, 5.00%, 9/01/36 | | | | | 780 | | | | 809,172 | |
| | | | | | | | | 2,064,269 | |
Connecticut — 3.3% | | | | | | | | | | |
Connecticut State Health & Educational Facility Authority, RB, Yale University: | | | | | | | | | | |
Series T-1, 4.70%, 7/01/29 | | | | | 1,580 | | | | 1,727,403 | |
Series X-3, 4.85%, 7/01/37 | | | | | 1,541 | | | | 1,682,149 | |
| | | | | | | | | 3,409,552 | |
Massachusetts — 2.8% | | | | | | | | | | |
Massachusetts School Building Authority, RB, Senior, Series B, 5.00%, 10/15/41 | | | | | 720 | | | | 784,196 | |
Massachusetts Water Resources Authority, Refunding RB, General, Series A, 5.00%, 8/01/41 | | | | | 1,980 | | | | 2,126,619 | |
| | | | | | | | | 2,910,815 | |
New Hampshire — 0.7% | | | | | | | | | | |
New Hampshire Health & Education Facilities Authority, RB, Dartmouth College, 5.25%, 6/01/39 (i) | | | | | 645 | | | | 731,645 | |
New York — 6.8% | | | | | | | | | | |
City of New York New York Municipal Water Finance Authority, Refunding RB, Water & Sewer System, 2nd General Resolution, Series FF-2, 5.50%, 6/15/40 | | | | | 510 | | | | 577,576 | |
Hudson Yards Infrastructure Corp., RB, Fiscal 2012, Series A, 5.75%, 2/15/47 (i) | | | | | 500 | | | | 555,191 | |
New York Liberty Development Corp., RB, 1 World Trade Center Port Authority Consolidated, 5.25%, 12/15/43 | | | | | 3,375 | | | | 3,642,840 | |
New York Liberty Development Corp., Refunding RB, 4 World Trade Center Project, 5.75%, 11/15/51 (i) | | | | | 2,030 | | | | 2,245,363 | |
| | | | | | | | | 7,020,970 | |
Tennessee — 1.3% | | | | | | | | | | |
County of Shelby Tennessee Health Educational & Housing Facilities Board, Refunding RB, St. Jude’s Children’s Research Hospital, 5.00%, 7/01/31 | | | | | 1,280 | | | | 1,366,886 | |
Texas — 5.4% | | | | | | | | | | |
City of San Antonio Texas Public Service Board, RB, Electric & Gas Systems, Junior Lien, 5.00%, 2/01/43 | | | | | 780 | | | | 843,664 | |
County of Harris Texas, RB, Senior Lien, Toll Road, Series A, 5.00%, 8/15/38 (i) | | | | | 2,142 | | | | 2,415,010 | |
County of Harris Texas Metropolitan Transit Authority, Refunding RB, Series A, 5.00%, 11/01/41 | | | | | 1,080 | | | | 1,170,515 | |
University of Texas, Refunding RB, Financing System, Series B, 5.00%, 8/15/43 | | | | | 975 | | | | 1,077,418 | |
| | | | | | | | | 5,506,607 | |
See Notes to Financial Statements.
| ANNUAL REPORT | APRIL 30, 2014 | 47
|
| |
| Schedule of Investments (continued) | BlackRock Strategic Municipal Trust (BSD)
(Percentages shown are based on Net Assets)
|
Municipal Bonds Transferred to
Tender Option Bond Trusts (h) | | | | Par
(000) | | Value |
Utah — 1.2% | | | | | | | | | | |
City of Riverton Utah, RB, IHC Health Services, Inc., 5.00%, 8/15/41 | | | | $ | 1,154 | | | $ | 1,217,792 | |
Virginia — 1.9% | | | | | | | | | | |
University of Virginia, Refunding RB, General, 5.00%, 6/01/40 | | | | | 1,785 | | | | 1,987,148 | |
Washington — 3.6% | | | | | | | | | | |
Central Puget Sound Regional Transit Authority, RB, Series A (AGM), 5.00%, 11/01/32 | | | | | 900 | | | | 991,250 | |
State of Washington, GO, Various Purposes, Series E, 5.00%, 2/01/34 | | | | | 2,400 | | | | 2,685,072 | |
| | | | | | | | | 3,676,322 | |
Total Municipal Bonds Transferred to
Tender Option Bond Trusts — 35.3% | | | | | | | | | 36,374,713 | |
Total Long-Term Investments
(Cost — $154,336,406) — 158.5% | | | | | | | | | 163,399,231 | |
Short-Term Securities | | | | Shares | | Value |
FFI Institutional Tax-Exempt Fund, 0.03% (j)(k) | | | | | 2,167,802 | | | $ | 2,167,802 | |
Total Short-Term Securities
(Cost — $2,167,802) — 2.1% | | | | | | | | | 2,167,802 | |
Total Investments (Cost — $156,504,208) — 160.6% | | | | | | | | | 165,567,033 | |
Other Assets Less Liabilities — 1.3% | | | | | | | | | 1,344,883 | |
Liability for TOB Trust Certificates, Including Interest Expense and Fees Payable — (20.3%) | | | | | | | | | (20,943,208 | ) |
VMTP Shares, at Liquidation Value — (41.6%) | | | | | | | | | (42,900,000 | ) |
Net Assets Applicable to Common Shares — 100.0% | | | | | | | | $ | 103,068,708 | |
Notes to Schedule of Investments
| (a) | | | | Represents a step-up bond that pays an initial coupon rate for the first period and then a higher coupon rate for the following periods. Rate shown is as of report date. |
| (b) | | | | Security exempt from registration pursuant to Rule 144A under the Securities Act of 1933, as amended. These securities may be resold in transactions exempt from registration to qualified institutional investors. |
| (c) | | | | Zero-coupon bond. |
| (d) | | | | U.S. government securities, held in escrow, are used to pay interest on this security, as well as to retire the bond in full at the date indicated, typically at a premium to par. |
| (e) | | | | Non-income producing security. |
| (f) | | | | Issuer filed for bankruptcy and/or is in default of principal and/or interest payments. |
| (g) | | | | Variable rate security. Rate shown is as of report date. |
| (h) | | | | Represent bonds transferred to a TOB. In exchange for which the Trust acquired residual interest certificates. These bonds serve as collateral in a financing transaction. See Note 3 of the Notes to Financial Statements for details of municipal bonds transferred to TOBs. |
| (i) | | | | All or a portion of security is subject to a recourse agreement, which may require the Trust to pay the liquidity provider in the event there is a shortfall between the TOB trust certificates and proceeds received from the sale of the security contributed to the TOB trust. In the case of a shortfall, the aggregate maximum potential amount the Trust could ultimately be required to pay under the agreements, which expire from October 1, 2016 to February 15, 2031 is $4,041,634. |
| (j) | | | | Represents the current yield as of report date. |
| (k) | | | | Investments in issuers considered to be an affiliate of the Trust during the year ended April 30, 2014, for purposes of Section 2(a)(3) of the Investment Company Act of 1940, as amended, were as follows: |
| Affiliate | | | | Shares
Held at
April 30, 2013 | | Net
Activity | | Shares
Held at
April 30, 2014 | | Income | |
FFI Institutional Tax-Exempt Fund | | | | 2,349,913 | | (182,111) | | 2,167,802 | | $577 | |
| • | | | | Financial futures contracts outstanding as of April 30, 2014 were as follows: |
Contracts Sold
|
|
|
| Issue
|
| Exchange
|
| Expiration
|
| Notional
Value
|
| Unrealized
Depreciation
|
| (116) | | | | 10-Year US Treasury Note | | Chicago Board of Trade | | June 2014 | | $ | 14,432,938 | | | $ | (36,391 | ) |
See Notes to Financial Statements.
| 48 | ANNUAL REPORT | APRIL 30, 2014
|
| |
| Schedule of Investments (concluded) | BlackRock Strategic Municipal Trust (BSD)
|
| • | | | | Fair Value Measurements — Various inputs are used in determining the fair value of investments and derivative financial instruments. These inputs to valuation techniques are categorized into a disclosure hierarchy consisting of three broad levels for financial statement purposes as follows: |
| • | | | | Level 1 — unadjusted price quotations in active markets/exchanges for identical assets or liabilities that the Trust has the ability to access |
| • | | | | Level 2 — other observable inputs (including, but not limited to, quoted prices for similar assets or liabilities in markets that are active, quoted prices for identical or similar assets or liabilities in markets that are not active, inputs other than quoted prices that are observable for the assets or liabilities (such as interest rates, yield curves, volatilities, prepayment speeds, loss severities, credit risks and default rates) or other market-corroborated inputs) |
| • | | | | Level 3 — unobservable inputs based on the best information available in the circumstances, to the extent observable inputs are not available (including the Trust’s own assumptions used in determining the fair value of investments and derivative financial instruments) |
| | | | | The hierarchy gives the highest priority to unadjusted quoted prices in active markets for identical assets or liabilities (Level 1 measurements) and the lowest priority to unobservable inputs (Level 3 measurements). Accordingly, the degree of judgment exercised in determining fair value is greatest for instruments categorized in Level 3. The inputs used to measure fair value may fall into different levels of the fair value hierarchy. In such cases, for disclosure purposes, the fair value hierarchy classification is determined based on the lowest level input that is significant to the fair value measurement in its entirety. |
| | | | | Changes in valuation techniques may result in transfers into or out of an assigned level within the disclosure hierarchy. In accordance with the Trust’s policy, transfers between different levels of the fair value disclosure hierarchy are deemed to have occurred as of the beginning of the reporting period. The categorization of a value determined for investments and derivative financial instruments is based on the pricing transparency of the investment and derivative financial instrument and is not necessarily an indication of the risks associated with investing in those securities. For information about the Trust’s policy regarding valuation of investments and derivative financial instruments, please refer to Note 2 of the Notes to Financial Statements. |
| | | | | The following tables summarize the Trust’s investments and derivative financial instruments categorized in the disclosure hierarchy as of April 30, 2014: |
|
| Level 1
|
| Level 2
|
| Level 3
|
| Total
|
Assets:
| | | | | | | | | | | | | | | | |
Investments:
| | | | | | | | | | | | | | | | |
Long-Term Investments1 | | | — | | | $ | 163,399,231 | | | | — | | | $ | 163,399,231 | |
Short-Term Securities | | $ | 2,167,802 | | | | — | | | | — | | | | 2,167,802 | |
Total
| | $ | 2,167,802 | | | $ | 163,399,231 | | | | — | | | $ | 165,567,033 | |
| 1 | See above Schedule of Investments for values in each state or political subdivision. |
|
| Level 1
|
| Level 2
|
| Level 3
|
| Total
|
Derivative Financial Instruments2
| | | | | | | | | | | | | | | | |
Liabilities:
| | | | | | | | | | | | | | | | |
Interest rate contracts | | $ | (36,391 | ) | | | — | | | | — | | | $ | (36,391 | ) |
| 2 | Derivative financial instruments are financial futures contracts, which are valued at the unrealized appreciation/depreciation on the instrument. |
| | | | | The carrying amount for certain of the Trust’s assets and/or liabilities approximates fair value for financial statement purposes. As of April 30, 2014, such assets and/or liabilities are categorized within the disclosure hierarchy as follows: |
|
| Level 1
|
| Level 2
|
| Level 3
|
| Total
|
Assets:
| | | | | | | | | | | | | | | | |
Cash pledged for financial futures contracts | | $ | 208,000 | | | | — | | | | — | | | $ | 208,000 | |
Liabilities:
| | | | | | | | | | | | | | | | |
Bank overdraft | | | — | | | $ | (745,246 | ) | | | — | | | | (745,246 | ) |
TOB trust certificates | | | — | | | | (20,938,550 | ) | | | — | | | | (20,938,550 | ) |
VMTP Shares | | | — | | | | (42,900,000 | ) | | | — | | | | (42,900,000 | ) |
Total
| | $ | 208,000 | | | $ | (64,583,796 | ) | | | — | | | $ | (64,375,796 | ) |
| | | | | There were no transfers between levels during the year ended April 30, 2014. |
See Notes to Financial Statements.
| ANNUAL REPORT | APRIL 30, 2014 | 49
|
| |
| Statements of Assets and Liabilities |
|
April 30, 2014
| | BlackRock
Investment
Quality Municipal
Trust Inc.
(BKN) | BlackRock
Long-Term
Municipal
Advantage Trust
(BTA) | BlackRock
Municipal
2020
Term Trust
(BKK) | BlackRock
Municipal
Income Trust
(BFK) | BlackRock
Pennsylvania
Strategic
Municipal Trust
(BPS) | BlackRock
Strategic
Municipal Trust
(BSD) |
| |
Assets
|
Investments at value — unaffiliated1 | | $ | 406,369,827 | | $ | 247,017,403 | | $ | 394,705,934 | | $ | 1,011,633,439 | | $ | 43,781,483 | | $ | 163,399,231 | |
Investments at value — affiliated2 | | | 7,042,672 | | | 787,037 | | | 2,353,008 | | | 14,688,018 | | | 1,224,599 | | | 2,167,802 | |
| Cash pledged for financial futures contracts | | | 515,000 | | | 101,000 | | | — | | | 989,000 | | | 62,000 | | | 208,000 | |
| Interest receivable | | | 4,906,348 | | | 3,480,274 | | | 5,243,447 | | | 15,131,537 | | | 661,855 | | | 2,418,890 | |
| Investments sold receivable | | | 2,980,387 | | | 10,000 | | | 155,000 | | | — | | | 172,461 | | | 780,388 | |
| Deferred offering costs | | | 49,261 | | | — | | | — | | | 93,390 | | | 101,242 | | | 29,400 | |
| Prepaid expenses | | | 31,546 | | | 11,243 | | | 17,137 | | | 49,748 | | | 12,764 | | | 26,405 | |
| Total assets | | | 421,895,041 | | | 251,406,957 | | | 402,474,526 | | | 1,042,585,132 | | | 46,016,404 | | | 169,030,116 | |
| |
Accrued Liabilities
|
| Investments purchased payable | | | 5,519,941 | | | — | | | 2,132,652 | | | 2,561,285 | | | — | | | 622,778 | |
| Income dividends payable — Common Shares | | | 1,373,357 | | | 832,179 | | | 168,220 | | | 3,360,154 | | | 123,959 | | | 540,563 | |
| Bank overdraft | | | 1,738,908 | | | — | | | — | | | — | | | — | | | 745,246 | |
| Investment advisory fees payable | | | 117,873 | | | 131,332 | | | 163,964 | | | 506,774 | | | 22,471 | | | 81,729 | |
| Officer’s and Trustees’ fees payable | | | 61,095 | | | 18,919 | | | 47,961 | | | 242,271 | | | 7,371 | | | 13,746 | |
| Interest expense and fees payable | | | 6,720 | | | 36,385 | | | 4,407 | | | 29,489 | | | 168 | | | 4,658 | |
| Variation margin payable on financial futures contracts | | | 165,377 | | | 20,672 | | | — | | | 305,441 | | | 19,828 | | | 48,938 | |
| Administration fees payable | | | 50,552 | | | — | | | — | | | — | | | — | | | — | |
| Other accrued expenses payable | | | 78,327 | | | 63,092 | | | 92,560 | | | 129,949 | | | 43,606 | | | 65,200 | |
| Total accrued liabilities | | | 9,112,150 | | | 1,102,579 | | | 2,609,764 | | | 7,135,363 | | | 217,403 | | | 2,122,858 | |
| |
Other Liabilities
|
| TOB trust certificates | | | 23,584,555 | | | 89,035,874 | | | 3,750,000 | | | 126,072,926 | | | 675,000 | | | 20,938,550 | |
VRDP Shares, at liquidation value of $100,000 per share3,4,5 | | | — | | | — | | | — | | | — | | | 16,300,000 | | | — | |
VMTP Shares, at liquidation value of $100,000 per share3,4,5 | | | 125,900,000 | | | — | | | — | | | 270,800,000 | | | — | | | 42,900,000 | |
| Total other liabilities | | | 149,484,555 | | | 89,035,874 | | | 3,750,000 | | | 396,872,926 | | | 16,975,000 | | | 63,838,550 | |
| Total liabilities | | | 158,596,705 | | | 90,138,453 | | | 6,359,764 | | | 404,008,289 | | | 17,192,403 | | | 65,961,408 | |
| |
AMPS at Redemption Value
|
$25,000 per share liquidation preference, plus unpaid dividends3,4,5 | | | — | | | — | | | 67,951,467 | | | — | | | — | | | — | |
Net Assets Applicable to Common Shareholders | | $ | 263,298,336 | | $ | 161,268,504 | | $ | 328,163,295 | | $ | 638,576,843 | | $ | 28,824,001 | | $ | 103,068,708 | |
| |
Net Assets Applicable to Common Shareholders Consist of
|
Paid-in capital5,6,7 | | $ | 238,459,400 | | $ | 191,003,998 | | $ | 292,453,576 | | $ | 604,980,827 | | $ | 28,545,964 | | $ | 103,472,031 | |
| Undistributed net investment income | | | 2,964,057 | | | 1,986,539 | | | 13,764,307 | | | 10,627,072 | | | 370,117 | | | 1,354,019 | |
| Accumulated net realized loss | | | (6,627,286 | ) | | (42,097,117 | ) | | (851,523 | ) | | (25,195,039 | ) | | (2,483,111 | ) | | (10,783,776 | ) |
| Net unrealized appreciation/depreciation | | | 28,502,165 | | | 10,375,084 | | | 22,796,935 | | | 48,163,983 | | | 2,391,031 | | | 9,026,434 | |
Net Assets Applicable to Common Shareholders | | $ | 263,298,336 | | $ | 161,268,504 | | $ | 328,163,295 | | $ | 638,576,843 | | $ | 28,824,001 | | $ | 103,068,708 | |
| Net asset value, per Common Share | | $ | 15.34 | | $ | 12.02 | | $ | 16.22 | | $ | 14.27 | | $ | 14.18 | | $ | 14.11 | |
| |
1 Investments at cost — unaffiliated | | $ | 377,797,896 | | $ | 236,636,707 | | $ | 371,908,999 | | $ | 963,244,348 | | $ | 41,371,434 | | $ | 154,336,406 | |
| |
2 Investments at cost — affiliated | | $ | 7,042,672 | | $ | 787,037 | | $ | 2,353,008 | | $ | 14,688,018 | | $ | 1,224,599 | | $ | 2,167,802 | |
| |
3 Preferred Shares outstanding | | | 1,259 | | | — | | | 2,718 | | | 2,708 | | | 163 | | | 429 | |
| |
4 Preferred Shares authorized, including Auction Market Preferred Shares (“AMPS”) | | | 7,121 | | | — | | | unlimited | | | unlimited | | | unlimited | | | unlimited | |
| |
5 Par value per Preferred Share and Common Share | | $ | 0.01 | | $ | 0.001 | | $ | 0.001 | | $ | 0.001 | | $ | 0.001 | | $ | 0.001 | |
| |
6 Common Shares outstanding | | | 17,166,960 | | | 13,422,247 | | | 20,236,628 | | | 44,742,403 | | | 2,032,115 | | | 7,304,904 | |
| |
7 Common Shares authorized | | | 200 million | | | unlimited | | | unlimited | | | unlimited | | | unlimited | | | unlimited | |
See Notes to Financial Statements.
| 50 | ANNUAL REPORT | APRIL 30, 2014
|
Year Ended April 30, 2014
| | BlackRock
Investment
Quality Municipal
Trust Inc.
(BKN) | BlackRock
Long-Term
Municipal
Advantage
Trust
(BTA) | BlackRock
Municipal
2020
Term Trust
(BKK) | BlackRock
Municipal
Income Trust
(BFK) | BlackRock
Pennsylvania
Strategic
Municipal Trust
(BPS) | BlackRock
Strategic
Municipal Trust
(BSD) |
| |
Investment Income
|
| Interest | | $ | 19,966,880 | | $ | 11,823,519 | | $ | 17,765,864 | | $ | 51,970,735 | | $ | 2,038,460 | | $ | 8,132,507 | |
| Income — affiliated | | | 1,634 | | | 478 | | | 2,816 | | | 4,597 | | | — | | | 577 | |
| Total income | | | 19,968,514 | | | 11,823,997 | | | 17,768,680 | | | 51,975,332 | | | 2,038,460 | | | 8,133,084 | |
| |
Expenses
|
| Investment advisory | | | 1,396,250 | | | 1,549,160 | | | 2,211,196 | | | 6,096,462 | | | 277,674 | | | 981,272 | |
| Administration | | | 598,393 | | | — | | | — | | | — | | | — | | | — | |
| Professional | | | 68,390 | | | 49,236 | | | 85,174 | | | 68,851 | | | 38,169 | | | 54,696 | |
| Accounting services | | | 58,175 | | | 19,558 | | | 54,218 | | | 73,947 | | | 9,638 | | | 29,438 | |
| Transfer agent | | | 33,054 | | | 23,035 | | | 53,779 | | | 53,595 | | | 16,869 | | | 21,532 | |
| Officer and Directors | | | 28,362 | | | 16,744 | | | 36,212 | | | 73,205 | | | 3,110 | | | 10,736 | |
| Remarketing fees on Preferred Shares | | | — | | | — | | | 165,837 | | | — | | | — | | | — | |
| Custodian | | | 24,119 | | | 12,912 | | | 26,561 | | | 44,556 | | | 6,974 | | | 12,998 | |
| Registration | | | 9,270 | | | 9,242 | | | 9,127 | | | 15,506 | | | 893 | | | 9,144 | |
| Printing | | | 8,283 | | | 7,656 | | | 11,910 | | | 15,108 | | | 7,006 | | | 8,519 | |
| Miscellaneous | | | 70,428 | | | 31,423 | | | 73,573 | | | 75,031 | | | 34,168 | | | 64,161 | |
| Total expenses excluding interest expense, fees and amortization of offering costs | | | 2,294,724 | | | 1,718,966 | | | 2,727,587 | | | 6,516,261 | | | 394,501 | | | 1,192,496 | |
Interest expense, fees and amortization of offering costs1 | | | 1,577,752 | | | 631,908 | | | 22,523 | | | 3,915,993 | | | 183,596 | | | 647,355 | |
| Total expenses | | | 3,872,476 | | | 2,350,874 | | | 2,750,110 | | | 10,432,254 | | | 578,097 | | | 1,839,851 | |
| Less fees waived by Manager | | | (1,182 | ) | | (116,998 | ) | | (2,431 | ) | | (3,474 | ) | | (34 | ) | | (451 | ) |
| Total expenses after fees waived | | | 3,871,294 | | | 2,233,876 | | | 2,747,679 | | | 10,428,780 | | | 578,063 | | | 1,839,400 | |
| Net investment income | | | 16,097,220 | | | 9,590,121 | | | 15,021,001 | | | 41,546,552 | | | 1,460,397 | | | 6,293,684 | |
| |
Realized and Unrealized Gain (Loss)
|
| Net realized gain (loss) from: | | | | | | | | | | | | | | | | | | | |
| Investments | | | (2,973,752 | ) | | (1,725,219 | ) | | 649,633 | | | (6,642,278 | ) | | (629,574 | ) | | (1,291,791 | ) |
| Financial futures contracts | | | (33,973 | ) | | (96,575 | ) | | — | | | (262,939 | ) | | 32,680 | | | (25,177 | ) |
| | | | (3,007,725 | ) | | (1,821,794 | ) | | 649,633 | | | (6,905,217 | ) | | (596,894 | ) | | (1,316,968 | ) |
| Net change in unrealized appreciation/depreciation on: | | | | | | | | | | | | | | | | | | | |
| Investments | | | (14,185,321 | ) | | (8,935,965 | ) | | (11,991,297 | ) | | (44,747,732 | ) | | (1,889,405 | ) | | (7,106,599 | ) |
| Financial futures contracts | | | 201,904 | | | (5,612 | ) | | — | | | 353,662 | | | 37,364 | | | 90,447 | |
| | | | (13,983,417 | ) | | (8,941,577 | ) | | (11,991,297 | ) | | (44,394,070 | ) | | (1,852,041 | ) | | (7,016,152 | ) |
| Total realized and unrealized loss | | | (16,991,142 | ) | | (10,763,371 | ) | | (11,341,664 | ) | | (51,299,287 | ) | | (2,448,935 | ) | | (8,333,120 | ) |
| |
Dividends to AMPS Shareholders From
|
| Net investment income | | | — | | | — | | | (155,085 | ) | | — | | | — | | | — | |
Net Increase (Decrease) in Net Assets Applicable to Common Shareholders Resulting from Operations | | $ | (893,922 | ) | $ | (1,173,250 | ) | $ | 3,524,252 | | $ | (9,752,735 | ) | $ | (988,538 | ) | $ | (2,039,436 | ) |
| 1 | | Related to TOBs, VRDP Shares and/or VMTP Shares. |
See Notes to Financial Statements.
| ANNUAL REPORT | APRIL 30, 2014 | 51
|
| |
| Statements of Changes in Net Assets |
|
| | | | BlackRock Investment Quality
Municipal Trust, Inc. (BKN)
|
| | | BlackRock Long-Term
Municipal Advantage Trust (BTA)
|
| | | | Year Ended April 30,
|
| | | Year Ended April 30,
|
Increase (Decrease) in Net Assets Applicable to Common Shareholders:
| | | | 2014 | | 2013 | | | | 2014 | | 2013 |
| |
Operations
|
| Net investment income | | | | $ | 16,097,220 | | | $ | 16,140,893 | | | | | | | $ | 9,590,121 | | | $ | 9,872,508 | |
| Net realized gain (loss) | | | | | (3,007,725 | ) | | | 4,950,889 | | | | | | | | (1,821,794 | ) | | | 1,133,269 | |
| Net change in unrealized appreciation/depreciation | | | | | (13,983,417 | ) | | | 12,247,650 | | | | | | | | (8,941,577 | ) | | | 8,097,727 | |
| Net increase (decrease) in net assets applicable to Common Shareholders resulting from operations | | | | | (893,922 | ) | | | 33,339,432 | | | | | | | | (1,173,250 | ) | | | 19,103,504 | |
| |
Dividends to Common Shareholders From1
|
| Net investment income | | | | | (16,474,796 | ) | | | (16,870,941 | ) | | | | | | | (9,986,152 | ) | | | (10,248,277 | ) |
| |
Capital Share Transactions
|
| Reinvestment of common dividends | | | | | 153,255 | | | | 670,480 | | | | | | | | — | | | | 357,617 | |
| |
Net Assets Applicable to Common Shareholders
|
| Total increase (decrease) in net assets applicable to Common Shareholders | | | | | (17,215,463 | ) | | | 17,138,971 | | | | | | | | (11,159,402 | ) | | | 9,212,844 | |
| Beginning of year | | | | | 280,513,799 | | | | 263,374,828 | | | | | | | | 172,427,906 | | | | 163,215,062 | |
| End of year | | | | $ | 263,298,336 | | | $ | 280,513,799 | | | | | | | $ | 161,268,504 | | | $ | 172,427,906 | |
| Undistributed net investment income, end of year | | | | $ | 2,964,057 | | | $ | 3,309,395 | | | | | | | $ | 1,986,539 | | | $ | 2,046,148 | |
| | | | BlackRock Municipal 2020
Term Trust (BKK)
|
| | | BlackRock Municipal
Income Trust (BFK)
|
| | | | Year Ended April 30,
|
| | | Year Ended April 30,
|
Increase (Decrease) in Net Assets Applicable to Common Shareholders:
| | | | 2014 | | 2013 | | | | 2014 | | 2013 |
| |
Operations
|
| Net investment income | | | | $ | 15,021,001 | | | $ | 18,164,482 | | | | | | | $ | 41,546,552 | | | $ | 41,559,480 | |
| Net realized gain (loss) | | | | | 649,633 | | | | 402,157 | | | | | | | | (6,905,217 | ) | | | 3,460,265 | |
| Net change in unrealized appreciation/depreciation | | | | | (11,991,297 | ) | | | 10,245,492 | | | | | | | | (44,394,070 | ) | | | 36,798,026 | |
| Dividends to AMPS Shareholders from net investment income | | | | | (155,085 | ) | | | (424,074 | ) | | | | | | | | | | | | |
| Net increase in net assets applicable to Common Shareholders resulting from operations | | | | | 3,524,252 | | | | 28,388,057 | | | | | | | | (9,752,735 | ) | | | 81,817,771 | |
| |
Dividends to Common Shareholders From1
|
| Net investment income | | | | | (16,351,196 | ) | | | (18,455,805 | ) | | | | | | | (40,558,222 | ) | | | (43,007,944 | ) |
| |
Capital Share Transactions
|
| Reinvestment of common dividends | | | | | — | | | | — | | | | | | | | 180,644 | | | | 1,400,760 | |
| |
Net Assets Applicable to Common Shareholders
|
| Total increase (decrease) in net assets applicable to Common Shareholders | | | | | (12,826,944 | ) | | | 9,932,252 | | | | | | | | (50,130,313 | ) | | | 40,210,587 | |
| Beginning of year | | | | | 340,990,239 | | | | 331,057,987 | | | | | | | | 688,707,156 | | | | 648,496,569 | |
| End of year | | | | $ | 328,163,295 | | | $ | 340,990,239 | | | | | | | $ | 638,576,843 | | | $ | 688,707,156 | |
| Undistributed net investment income, end of year | | | | $ | 13,764,307 | | | $ | 16,594,511 | | | | | | | $ | 10,627,072 | | | $ | 9,529,224 | |
| 1 | | Determined in accordance with federal income tax regulations. |
See Notes to Financial Statements.
| 52 | ANNUAL REPORT | APRIL 30, 2014
|
| |
| Statements of Changes in Net Assets (concluded) |
|
| | | | BlackRock Pennsylvania
Strategic Municipal Trust (BPS)
|
| | | BlackRock Strategic
Municipal Trust (BSD)
|
| | | | Year Ended April 30,
|
| | | Year Ended April 30,
|
Increase (Decrease) in Net Assets Applicable to Common Shareholders:
| | | | 2014 | | 2013 | | | | 2014 | | 2013 |
| |
Operations
|
| Net investment income | | | | $ | 1,460,397 | | | $ | 1,617,126 | | | | | | | $ | 6,293,684 | | | $ | 6,238,936 | |
| Net realized gain (loss) | | | | | (596,894 | ) | | | 174,030 | | | | | | | | (1,316,968 | ) | | | 605,942 | |
| Net change in unrealized appreciation/depreciation | | | | | (1,852,041 | ) | | | 744,830 | | | | | | | | (7,016,152 | ) | | | 5,852,341 | |
| Dividends to AMPS Shareholders from net investment income | | | | | — | | | | (8,984 | ) | | | | | | | — | | | | — | |
| Net increase (decrease) in net assets applicable to Common Shareholders resulting from operations | | | | | (988,538 | ) | | | 2,527,002 | | | | | | | | (2,039,436 | ) | | | 12,697,219 | |
| |
Dividends to Common Shareholders From1
|
| Net investment income | | | | | (1,583,847 | ) | | | (1,764,339 | ) | | | | | | | (6,495,251 | ) | | | (6,484,152 | ) |
| |
Capital Share Transactions
|
| Reinvestment of common dividends | | | | | — | | | | 54,903 | | | | | | | | — | | | | 81,826 | |
| |
Net Assets Applicable to Common Shareholders
|
| Total increase (decrease) in net assets applicable to Common Shareholders | | | | | (2,572,385 | ) | | | 817,566 | | | | | | | | (8,534,687 | ) | | | 6,294,893 | |
| Beginning of year | | | | | 31,396,386 | | | | 30,578,820 | | | | | | | | 111,603,395 | | | | 105,308,502 | |
| End of year | | | | $ | 28,824,001 | | | $ | 31,396,386 | | | | | | | $ | 103,068,708 | | | $ | 111,603,395 | |
| Undistributed net investment income, end of year | | | | $ | 370,117 | | | $ | 499,650 | | | | | | | $ | 1,354,019 | | | $ | 1,513,919 | |
| 1 | | Determined in accordance with federal income tax regulations. |
See Notes to Financial Statements.
| ANNUAL REPORT | APRIL 30, 2014 | 53
|
Year Ended April 30, 2014
| | | | BlackRock
Investment
Quality Municipal
Trust, Inc.
(BKN) | | BlackRock
Long-Term
Municipal
Advantage Trust
(BTA) | | BlackRock
Municipal
Income Trust
(BFK) | | BlackRock
Pennsylvania
Strategic
Municipal Trust
(BPS) | | BlackRock
Strategic
Municipal Trust
(BSD) |
| |
Cash Provided by Operating Activities
|
| Net increase (decrease) in net assets resulting from operations, excluding dividends to AMPS shareholders | | | | $ | (893,922 | ) | | $ | (1,173,250 | ) | | $ | (9,752,735 | ) | | $ | (988,538 | ) | | $ | (2,039,436 | ) |
Adjustments to reconcile net decrease in net assets
resulting from operations to net cash provided by operating activities: | | | | | | | | | | | | | | | | | | | | | | |
| Decrease in interest receivable | | | | | 264,155 | | | | 323,558 | | | | 124,431 | | | | 95,829 | | | | 23,302 | |
| Decrease in variation margin receivable on financial futures contracts | | | | | 14,906 | | | | — | | | | 30,469 | | | | 2,625 | | | | 6,281 | |
| (Increase) decrease in prepaid expenses | | | | | 16,260 | | | | (1,563 | ) | | | (13,881 | ) | | | (11,149 | ) | | | (20,830 | ) |
| (Increase) decrease in cash pledged for financial futures contracts | | | | | (309,000 | ) | | | (101,000 | ) | | | (561,000 | ) | | | (26,000 | ) | | | (119,000 | ) |
| Increase (decrease) in investment advisory fees payable | | | | | (6,000 | ) | | | 4,622 | | | | (46,800 | ) | | | (3,753 | ) | | | (7,382 | ) |
| Increase (decrease) in interest expense and fees payable | | | | | (6,192 | ) | | | (54,787 | ) | | | (70,646 | ) | | | (2,560 | ) | | | (10,776 | ) |
| Increase (decrease) in administration fees payable | | | | | (2,648 | ) | | | — | | | | — | | | | — | | | | — | |
| Increase (decrease) in other accrued expenses payable | | | | | 3,711 | | | | (4,296 | ) | | | (83,240 | ) | | | 4,491 | | | | 14,752 | |
Increase in variation margin payable on financial
futures contracts | | | | | 165,377 | | | | 20,672 | | | | 305,441 | | | | 19,828 | | | | 48,938 | |
| Increase in Officer’s and Directors’ fees payable | | | | | 4,363 | | | | 2,029 | | | | 14,597 | | | | 439 | | | | 1,279 | |
| Net realized gain (loss) on investments | | | | | 2,973,752 | | | | 1,725,219 | | | | 6,642,278 | | | | 629,574 | | | | 1,291,791 | |
| Net unrealized loss on investments | | | | | 14,185,321 | | | | 8,935,965 | | | | 44,747,732 | | | | 1,889,405 | | | | 7,106,599 | |
| Amortization of premium and accretion of discount on investments | | | | | (2,225,088 | ) | | | 441,837 | | | | (614,634 | ) | | | 156,193 | | | | (24,305 | ) |
| Proceeds from sales of long-term investments | | | | | 124,357,991 | | | | 82,518,302 | | | | 260,968,647 | | | | 12,365,667 | | | | 41,253,214 | |
| Purchases of long-term investments | | | | | (117,820,933 | ) | | | (70,962,622 | ) | | | (208,689,404 | ) | | | (7,654,472 | ) | | | (36,353,522 | ) |
| Net proceeds from sales (purchases) of short-term securities | | | | | (2,567,135 | ) | | | 133,387 | | | | (12,014,708 | ) | | | 172,191 | | | | 382,111 | |
| Cash provided by operating activities | | | | | 18,154,918 | | | | 21,808,073 | | | | 80,986,547 | | | | 6,649,770 | | | | 11,553,016 | |
| |
Cash Used for Financing Activities
|
| Payments on redemption of AMPS | | | | | — | | | | — | | | | — | | | | — | | | | — | |
| Proceeds from TOB trust certificates | | | | | 1,785,000 | | | | 24,494,841 | | | | 20,403,189 | | | | — | | | | 3,809,722 | |
| Repayments of TOB trust certificates | | | | | (5,398,826 | ) | | | (36,971,837 | ) | | | (64,593,277 | ) | | | (5,049,261 | ) | | | (10,246,411 | ) |
| Cash dividends paid to Common Shareholders | | | | | (16,320,688 | ) | | | (9,986,152 | ) | | | (40,600,283 | ) | | | (1,604,168 | ) | | | (6,495,251 | ) |
| Increase (decrease) in bank overdraft | | | | | 1,738,908 | | | | — | | | | — | | | | — | | | | 745,246 | |
| Increase in amortization of deferred offering costs | | | | | 40,688 | | | | — | | | | 142,153 | | | | 3,659 | | | | 45,797 | |
| Cash used for financing activities | | | | | (18,154,918 | ) | | | (22,463,148 | ) | | | (84,648,218 | ) | | | (6,649,770 | ) | | | (12,140,897 | ) |
| |
Cash
|
| Net increase (decrease) in cash | | | | | — | | | | (655,075 | ) | | | (3,661,671 | ) | | | — | | | | (587,881 | ) |
| Cash at beginning of year | | | | | — | | | | 655,075 | | | | 3,661,671 | | | | — | | | | 587,881 | |
| Cash at end of year | | | | | — | | | | — | | | | — | | | | — | | | | — | |
| |
Supplemental Disclosure of Cash Flow Information
|
| Cash paid during the year for interest | | | | $ | 1,543,256 | | | $ | 686,695 | | | $ | 3,844,486 | | | $ | 182,497 | | | $ | 612,334 | |
| |
Non-cash Financing Activities
|
| Capital shares issued in reinvestment of dividends paid to Common Shareholders | | | | $ | 153,255 | | | | — | | | $ | 180,644 | | | | — | | | | — | |
See Notes to Financial Statements.
| 54 | ANNUAL REPORT | APRIL 30, 2014
|
| |
| Financial Highlights | BlackRock Investment Quality Municipal Trust Inc. (BKN)
|
| | | | Year Ended April 30,
|
| | | | 2014 | | 2013 | | 2012 | | 2011 | | 2010 |
| |
Per Share Operating Performance
|
| Net asset value, beginning of year | | | | $ | 16.35 | | | $ | 15.39 | | | $ | 12.75 | | | $ | 13.68 | | | $ | 11.63 | |
Net investment income1 | | | | | 0.94 | | | | 0.94 | | | | 0.98 | | | | 1.04 | | | | 1.07 | |
| Net realized and unrealized gain (loss) | | | | | (0.99 | ) | | | 1.00 | | | | 2.68 | | | | (0.93 | ) | | | 1.96 | |
| Dividends to AMPS Shareholders from net investment income | | | | | — | | | | — | | | | (0.01 | ) | | | (0.03 | ) | | | (0.03 | ) |
| Net increase (decrease) from investment operations | | | | | (0.05 | ) | | | 1.94 | | | | 3.65 | | | | 0.08 | | | | 3.00 | |
Dividends to Common Shareholders from net investment income2 | | | | | (0.96 | ) | | | (0.98 | ) | | | (1.01 | ) | | | (1.01 | ) | | | (0.95 | ) |
| Net asset value, end of year | | | | $ | 15.34 | | | $ | 16.35 | | | $ | 15.39 | | | $ | 12.75 | | | $ | 13.68 | |
| Market price, end of year | | | | $ | 14.86 | | | $ | 16.11 | | | $ | 15.75 | | | $ | 13.08 | | | $ | 14.19 | |
| |
Total Investment Return Applicable to Common Shareholders3
|
| Based on net asset value | | | | | 0.41% | | | | 12.89% | | | | 29.46% | | | | 0.49% | | | | 26.55% | |
| Based on market price | | | | | (1.28)% | | | | 8.69% | | | | 29.15% | | | | (0.61)% | | | | 34.50% | |
| |
Ratios to Average Net Assets Applicable to Common Shareholders
|
| Total expenses | | | | | 1.55% | | | | 1.48% | | | | 1.26% | 4 | | | 1.08% | 4 | | | 1.10% | 4 |
| Total expenses after fees waived and paid indirectly | | | | | 1.55% | | | | 1.48% | | | | 1.26% | 4 | | | 1.08% | 4 | | | 1.10% | 4 |
Total expenses after fees waived and paid indirectly and excluding interest
expense, fees and amortization of offering costs5 | | | | | 0.92% | | | | 0.87% | | | | 0.99% | 4,6 | | | 1.04% | 4 | | | 1.06% | 4 |
| Net investment income | | | | | 6.45% | | | | 5.87% | | | | 6.94% | 4 | | | 7.83% | 4 | | | 8.29% | 4 |
| Dividends to AMPS Shareholders | | | | | — | | | | — | | | | 0.09% | | | | 0.23% | | | | 0.26% | |
| Net investment income to Common Shareholders | | | | | 6.45% | | | | 5.87% | | | | 6.85% | | | | 7.60% | | | | 8.03% | |
| |
Supplemental Data
|
| Net assets applicable to Common Shareholders, end of year (000) | | | | $ | 263,298 | | | $ | 280,514 | | | $ | 263,375 | | | $ | 217,541 | | | $ | 232,471 | |
| AMPS outstanding at $25,000 liquidation preference, end of year (000) | | | | | — | | | | — | | | | — | | | $ | 125,950 | | | $ | 125,950 | |
| VMTP Shares outstanding at $100,000 liquidation value, end of year (000) | | | | $ | 125,900 | | | $ | 125,900 | | | $ | 125,900 | | | | — | | | | — | |
| Portfolio turnover | | | | | 29% | | | | 33% | | | | 47% | | | | 38% | | | | 43% | |
| Asset coverage per AMPS at $25,000 liquidation preference, end of year | | | | | — | | | | — | | | | — | | | $ | 68,183 | | | $ | 71,147 | |
| Asset coverage per VMTP Shares at $100,000 liquidation value, end of year | | | | $ | 309,133 | | | $ | 322,807 | | | $ | 309,194 | | | | — | | | | — | |
| 1 | | Based on average Common Shares outstanding. |
| 2 | | Determined in accordance with federal income tax regulations. |
| 3 | | Total investment returns based on market price, which can be significantly greater or less than the net asset value, may result in substantially different returns. Where applicable, excludes the effects of any sales charges and assumes the reinvestment of dividends and distributions. |
| 4 | | Does not reflect the effect of dividends to AMPS Shareholders. |
| 5 | | Interest expense, fees and amortization of offering costs relate to TOBs and/or VMTP Shares. See Note 3 and Note 9 of the Notes to Financial Statements for details of municipal bonds transferred to TOBs and VMTP Shares, respectively. |
| 6 | | For the year ended April 30, 2012, the total expense ratio after fees waived and paid indirectly and excluding interest expense, fees, amortization of offering costs and remarketing fees was 0.94%. |
See Notes to Financial Statements.
| ANNUAL REPORT | APRIL 30, 2014 | 55
|
| |
| Financial Highlights | BlackRock Long-Term Municipal Advantage Trust (BTA)
|
| | | | Year Ended April 30,
|
| | | | 2014 | | 2013 | | 2012 | | 2011 | | 2010 |
| |
Per Share Operating Performance
|
| Net asset value, beginning of year | | | | $ | 12.85 | | | $ | 12.19 | | | $ | 10.51 | | | $ | 11.27 | | | $ | 9.52 | |
Net investment income1 | | | | | 0.71 | | | | 0.74 | | | | 0.75 | | | | 0.76 | | | | 0.75 | |
| Net realized and unrealized gain (loss) | | | | | (0.80 | ) | | | 0.68 | | | | 1.70 | | | | (0.79 | ) | | | 1.69 | |
| Net increase (decrease) from investment operations | | | | | (0.09 | ) | | | 1.42 | | | | 2.45 | | | | (0.03 | ) | | | 2.44 | |
Dividends from net investment income2 | | | | | (0.74 | ) | | | (0.76 | ) | | | (0.77 | ) | | | (0.73 | ) | | | (0.69 | ) |
| Net asset value, end of year | | | | $ | 12.02 | | | $ | 12.85 | | | $ | 12.19 | | | $ | 10.51 | | | $ | 11.27 | |
| Market price, end of year | | | | $ | 11.29 | | | $ | 12.50 | | | $ | 12.27 | | | $ | 10.20 | | | $ | 10.77 | |
| |
Total Investment Return Applicable to Common Shareholders3
|
| Based on net asset value | | | | | 0.28% | | | | 11.95% | | | | 24.09% | | | | (0.18)% | | | | 26.81% | |
| Based on market price | | | | | (3.17)% | | | | 8.19% | | | | 28.70% | | | | 1.37% | | | | 31.25% | |
| |
Ratios to Average Net Assets Applicable to Common Shareholders
|
| Total expenses | | | | | 1.52% | | | | 1.55% | | | | 1.69% | | | | 1.81% | | | | 1.80% | |
| Total expenses after fees waived and before fees paid indirectly | | | | | 1.44% | | | | 1.37% | | | | 1.42% | | | | 1.43% | | | | 1.40% | |
| Total expenses after fees waived and paid indirectly | | | | | 1.44% | | | | 1.37% | | | | 1.42% | | | | 1.43% | | | | 1.40% | |
Total expenses after fees waived and paid indirectly and excluding interest
expense and fees4 | | | | | 1.03% | | | | 0.92% | | | | 0.86% | | | | 0.78% | | | | 0.75% | |
| Net investment income | | | | | 6.19% | | | | 5.80% | | | | 6.60% | | | | 6.97% | | | | 7.07% | |
| |
Supplemental Data
|
| Net assets, end of year (000) | | | | $ | 161,269 | | | $ | 172,428 | | | $ | 163,215 | | | $ | 140,510 | | | $ | 150,357 | |
| Portfolio turnover | | | | | 27% | | | | 16% | | | | 26% | | | | 12% | | | | 30% | |
| 1 | | Based on average shares outstanding. |
| 2 | | Determined in accordance with federal income tax regulations. |
| 3 | | Total investment returns based on market price, which can be significantly greater or less than the net asset value, may result in substantially different returns. Where applicable, excludes the effects of any sales charges and assumes the reinvestment of dividends and distributions. |
| 4 | | Interest expense and fees relate to TOBS. See Note 3 of the Notes to Financial Statements for details of municipal bonds transferred to TOBs. |
See Notes to Financial Statements.
| 56 | ANNUAL REPORT | APRIL 30, 2014
|
| |
| Financial Highlights | BlackRock Municipal 2020 Term Trust (BKK)
|
| | | | Year Ended April 30,
|
| | | | 2014 | | 2013 | | 2012 | | 2011 | | 2010 |
| |
Per Share Operating Performance
|
| Net asset value, beginning of year | | | | $ | 16.85 | | | $ | 16.36 | | | $ | 14.63 | | | $ | 14.51 | | | $ | 12.04 | |
Net investment income1 | | | | | 0.74 | | | | 0.90 | | | | 1.02 | | | | 1.06 | | | | 1.10 | |
| Net realized and unrealized gain (loss) | | | | | (0.55 | ) | | | 0.52 | | | | 1.48 | | | | (0.15 | ) | | | 2.16 | |
| Dividends to AMPs Shareholders from net investment income | | | | | (0.01 | ) | | | (0.02 | ) | | | (0.02 | ) | | | (0.04 | ) | | | (0.04 | ) |
| Net increase (decrease) from investment operations | | | | | 0.18 | | | | 1.40 | | | | 2.48 | | | | 0.87 | | | | 3.22 | |
Dividends to Common Shareholders from net investment income2 | | | | | (0.81 | ) | | | (0.91 | ) | | | (0.75 | ) | | | (0.75 | ) | | | (0.75 | ) |
| Net asset value, end of year | | | | $ | 16.22 | | | $ | 16.85 | | | $ | 16.36 | | | $ | 14.63 | | | $ | 14.51 | |
| Market price, end of year | | | | $ | 16.61 | | | $ | 16.64 | | | $ | 16.06 | | | $ | 15.06 | | | $ | 14.89 | |
| |
Total Investment Return Applicable to Common Shareholders3
|
| Based on net asset value | | | | | 1.17% | | | | 8.72% | | | | 17.27% | | | | 5.96% | | | | 26.97% | |
| Based on market price | | | | | 4.91% | | | | 9.37% | | | | 11.83% | | | | 6.29% | | | | 23.52% | |
| |
Ratios to Average Net Assets Applicable to Common Shareholders
|
Total expenses4 | | | | | 0.84% | | | | 0.94% | | | | 0.99% | | | | 1.03% | | | | 1.06% | |
Total expenses after fees waived and paid indirectly4 | | | | | 0.84% | | | | 0.94% | | | | 0.99% | | | | 1.03% | | | | 1.06% | |
Total expenses after fees waived and paid indirectly and excluding interest expense and fees, and amortization of offering costs4,5 | | | | | 0.84% | 6 | | | 0.93% | 6 | | | 0.98% | 6 | | | 1.02% | | | | 1.05% | |
Net investment income4 | | | | | 4.61% | | | | 5.38% | | | | 6.57% | | | | 7.26% | | | | 8.08% | |
| Dividends to AMPs Shareholders | | | | | 0.05% | | | | 0.13% | | | | 0.13% | | | | 0.24% | | | | 0.28% | |
| Net investment income to Common Shareholders | | | | | 4.56% | | | | 5.25% | | | | 6.44% | | | | 7.02% | | | | 7.80% | |
| |
Supplemental Data
|
| Net assets applicable to Common Shareholders, end of year (000) | | | | $ | 328,163 | | | $ | 340,990 | | | $ | 331,058 | | | $ | 296,082 | | | $ | 293,549 | |
Preferred Shares outstanding at $25,000 liquidation preference,
end of year (000) | | | | $ | 67,950 | | | $ | 161,250 | | | $ | 173,850 | | | $ | 173,850 | | | $ | 173,850 | |
| Portfolio turnover | | | | | 8% | | | | 14% | | | | 18% | | | | 9% | | | | 6% | |
| Asset coverage per AMPs at $25,000 liquidation preference, end of year | | | | $ | 145,738 | | | $ | 77,867 | | | $ | 72,607 | | | $ | 67,579 | | | $ | 67,215 | |
| 1 | | Based on average Common Shares outstanding. |
| 2 | | Determined in accordance with federal income tax regulations. |
| 3 | | Total investment returns based on market price, which can be significantly greater or less than the net asset value, may result in substantially different returns. Where applicable, excludes the effects of any sales charges and assumes the reinvestment of dividends and distributions. |
| 4 | | Does not reflect the effect of dividends to AMPS Shareholders. |
| 5 | | Interest expense and fees relate to TOBs. See Note 3 of the Notes to Financial Statements for details of municipal bonds transferred to TOBs. |
| 6 | | For the years ended April 30, 2014, April 30, 2013 and April 30, 2012, the total expense ratio after fees waived and paid indirectly and excluding interest expense, fees, amortization of offering costs and remarketing fees was 0.79%, 0.85% and 0.90%, respectively. |
See Notes to Financial Statements.
| ANNUAL REPORT | APRIL 30, 2014 | 57
|
| |
| Financial Highlights | BlackRock Municipal Income Trust (BFK)
|
| | | | Year Ended April 30,
|
| | | | 2014 | | 2013 | | 2012 | | 2011 | | 2010 |
| |
Per Share Operating Performance
|
| Net asset value, beginning of year | | | | $ | 15.40 | | | $ | 14.53 | | | $ | 12.16 | | | $ | 13.23 | | | $ | 10.74 | |
Net investment income1 | | | | | 0.93 | | | | 0.93 | | | | 0.95 | | | | 1.01 | | | | 1.03 | |
| Net realized and unrealized gain (loss) | | | | | (1.15 | ) | | | 0.90 | | | | 2.39 | | | | (1.11 | ) | | | 2.42 | |
| Dividends to AMPS shareholders from net investment income | | | | | — | | | | — | | | | (0.01 | ) | | | (0.02 | ) | | | (0.03 | ) |
| Net increase (decrease) from investment operations | | | | | (0.22 | ) | | | 1.83 | | | | 3.33 | | | | (0.12 | ) | | | 3.42 | |
Dividends to Common Shareholders from net investment income2 | | | | | (0.91 | ) | | | (0.96 | ) | | | (0.96 | ) | | | (0.95 | ) | | | (0.93 | ) |
| Net asset value, end of year | | | | $ | 14.27 | | | $ | 15.40 | | | $ | 14.53 | | | $ | 12.16 | | | $ | 13.23 | |
| Market price, end of year | | | | $ | 13.57 | | | $ | 15.40 | | | $ | 14.83 | | | $ | 12.35 | | | $ | 13.44 | |
| |
Total Investment Return Applicable to Common Shareholders3
|
| Based on net asset value | | | | | (0.72)% | | | | 12.84% | | | | 28.24% | | | | (1.04)% | | | | 32.75% | |
| Based on market price | | | | | (5.59)% | | | | 10.55% | | | | 28.87% | | | | (1.07)% | | | | 30.49% | |
| |
Ratios to Average Net Assets Applicable to Common Shareholders
|
| Total expenses | | | | | 1.71% | | | | 1.71% | | | | 1.45% | 4 | | | 1.26% | 4 | | | 1.26% | 4 |
| Total expenses after fees waived and paid indirectly | | | | | 1.71% | | | | 1.71% | | | | 1.45% | 4 | | | 1.24% | 4 | | | 1.15% | 4 |
Total expenses after fees waived and paid indirectly and excluding interest
expense, fees and amortization of offering costs5 | | | | | 1.07% | | | | 1.05% | | | | 1.14% | 4,6 | | | 1.14% | 4 | | | 1.07% | 4 |
| Net investment income | | | | | 6.81% | | | | 6.13% | | | | 7.06% | 4 | | | 7.84% | 4 | | | 8.37% | 4 |
| Dividends to AMPS Shareholders | | | | | — | | | | — | | | | 0.07% | | | | 0.20% | | | | 0.23% | |
| Net investment income to Common Shareholders | | | | | 6.81% | | | | 6.13% | | | | 6.99% | | | | 7.64% | | | | 8.14% | |
| |
Supplemental Data
|
| Net assets applicable to Common Shareholders, end of year (000) | | | | $ | 638,577 | | | $ | 688,707 | | | $ | 648,497 | | | $ | 541,097 | | | $ | 587,250 | |
| AMPS outstanding at $25,000 liquidation preference, end of year (000) | | | | | — | | | | — | | | | — | | | $ | 270,875 | | | $ | 270,875 | |
| VMTP Shares outstanding at $100,000 liquidation value, end of year (000) | | | | $ | 270,800 | | | $ | 270,800 | | | $ | 270,800 | | | | — | | | | — | |
| Portfolio turnover | | | | | 20% | | | | 13% | | | | 17% | | | | 18% | | | | 32% | |
| Asset coverage per AMPS at $25,000 liquidation preference, end of year | | | | | — | | | | — | | | | — | | | $ | 74,941 | | | $ | 79,201 | |
| Asset coverage per VMTP Shares at $100,000 liquidation value, end of year | | | | $ | 335,811 | | | $ | 354,323 | | | $ | 339,474 | | | | — | | | | — | |
| 1 | | Based on average Common Shares outstanding. |
| 2 | | Determined in accordance with federal income tax regulations. |
| 3 | | Total investment returns based on market price, which can be significantly greater or less than the net asset value, may result in substantially different returns. Where applicable, excludes the effects of any sales charges and assumes the reinvestment of dividends and distributions. |
| 4 | | Does not reflect the effect of dividends to AMPS Shareholders. |
| 5 | | Interest expense, fees and amortization of offering costs relate to TOBs and/or VMTP Shares. See Note 3 and Note 9 of the Notes to Financial Statements for details of municipal bonds transferred to TOBs and VMTP Shares, respectively. |
| 6 | | For the year ended April 30, 2012, the total expense ratio after fees waived and paid indirectly and excluding interest expense, fees, amortization of offering costs and remarketing fees was 1.10%. |
See Notes to Financial Statements.
| 58 | ANNUAL REPORT | APRIL 30, 2014
|
| |
| Financial Highlights | BlackRock Pennsylvania Strategic Municipal Trust (BPS)
|
| | | | Year Ended April 30,
|
| | | | 2014 | | 2013 | | 2012 | | 2011 | | 2010 |
| |
Per Share Operating Performance
|
| Net asset value, beginning of year | | | | $ | 15.45 | | | $ | 15.07 | | | $ | 13.11 | | | $ | 13.86 | | | $ | 11.87 | |
Net investment income1 | | | | | 0.72 | | | | 0.80 | | | | 0.90 | | | | 0.98 | | | | 0.92 | |
| Net realized and unrealized gain (loss) | | | | | (1.21 | ) | | | 0.45 | | | | 1.99 | | | | (0.81 | ) | | | 1.83 | |
| Dividends to AMPS shareholders from net investment income | | | | | — | | | | (0.00 | )2 | | | (0.02 | ) | | | (0.03 | ) | | | (0.04 | ) |
| Net increase (decrease) from investment operations | | | | | (0.49 | ) | | | 1.25 | | | | 2.87 | | | | 0.14 | | | | 2.71 | |
Dividends to Common Shareholders from net investment income3 | | | | | (0.78 | ) | | | (0.87 | ) | | | (0.91 | ) | | | (0.89 | ) | | | (0.72 | ) |
| Net asset value, end of year | | | | $ | 14.18 | | | $ | 15.45 | | | $ | 15.07 | | | $ | 13.11 | | | $ | 13.86 | |
| Market price, end of year | | | | $ | 12.90 | | | $ | 15.04 | | | $ | 15.27 | | | $ | 12.99 | | | $ | 13.88 | |
| |
Total Investment Return Applicable to Common Shareholders4
|
| Based on net asset value | | | | | (2.24)% | | | | 8.45% | | | | 22.57% | | | | 1.07% | | | | 23.80% | |
| Based on market price | | | | | (8.64)% | | | | 4.19% | | | | 25.34% | | | | 0.00% | | | | 49.41% | |
| |
Ratios to Average Net Assets Applicable to Common Shareholders
|
| Total expenses | | | | | 2.08% | | | | 2.09% | 5 | | | 1.72% | 5 | | | 1.56% | 5 | | | 1.60% | 5 |
| Total expenses after fees waived and paid indirectly | | | | | 2.08% | | | | 2.09% | 5 | | | 1.71% | 5 | | | 1.55% | 5 | | | 1.59% | 5 |
Total expenses after fees waived and paid indirectly and excluding interest
expense, fees and amortization of offering costs6 | | | | | 1.42% | | | | 1.44% | 5,7 | | | 1.58% | 5,7 | | | 1.43% | 5 | | | 1.57% | 5 |
| Net investment income | | | | | 5.26% | | | | 5.16% | 5 | | | 6.30% | 5 | | | 7.28% | 5 | | | 6.94% | 5 |
| Dividends to AMPS Shareholders | | | | | — | | | | 0.03% | | | | 0.13% | | | | 0.25% | | | | 0.28% | |
| Net investment income to Common Shareholders | | | | | 5.26% | | | | 5.13% | | | | 6.17% | | | | 7.03% | | | | 6.66% | |
| |
Supplemental Data
|
| Net assets applicable to Common Shareholders, end of year (000) | | | | $ | 28,824 | | | $ | 31,396 | | | $ | 30,579 | | | $ | 26,574 | | | $ | 28,038 | |
| AMPS outstanding at $25,000 liquidation preference, end of year (000) | | | | | — | | | | — | | | $ | 16,325 | | | $ | 16,325 | | | $ | 16,325 | |
| VRDP Shares outstanding at $100,000 liquidation value, end of year (000) | | | | $ | 16,300 | | | $ | 16,300 | | | | — | | | | — | | | | — | |
| Portfolio turnover | | | | | 15% | | | | 14% | | | | 34% | | | | 17% | | | | 19% | |
| Asset coverage per AMPS at $25,000 liquidation preference, end of year | | | | | — | | | | — | | | $ | 71,828 | | | $ | 65,697 | | | $ | 67,939 | |
| Asset coverage per VRDP Shares at $100,000 liquidation value, end of year | | | | $ | 276,834 | | | $ | 292,616 | | | | — | | | | — | | | | — | |
| 1 | | Based on average Common Shares outstanding. |
| 2 | | Amount is greater than $(0.005) per share. |
| 3 | | Determined in accordance with federal income tax regulations. |
| 4 | | Total investment returns based on market price, which can be significantly greater or less than the net asset value, may result in substantially different returns. Where applicable, excludes the effects of any sales charges and assumes the reinvestment of dividends and distributions. |
| 5 | | Does not reflect the effect of dividends to AMPS Shareholders. |
| 6 | | Interest expense, fees and amortization of offering costs relate to TOBs and/or VRDP Shares. See Note 3 and Note 9 of the Notes to Financial Statements for details of municipal bonds transferred to TOBs and VRDP Shares, respectively. |
| 7 | | For the years ended April 30, 2013 and April 30, 2012, the total expense ratio after fees waived and paid indirectly and excluding interest expense, fees, amortization of offering costs and remarketing fees was 1.43% and 1.52%, respectively. |
See Notes to Financial Statements.
| ANNUAL REPORT | APRIL 30, 2014 | 59
|
| |
| Financial Highlights | BlackRock Strategic Municipal Trust (BSD)
|
| | | | Year Ended April 30,
|
| | | | 2014 | | 2013 | | 2012 | | 2011 | | 2010 |
| |
Per Share Operating Performance
|
| Net asset value, beginning of year | | | | $ | 15.28 | | | $ | 14.43 | | | $ | 12.27 | | | $ | 13.00 | | | $ | 10.95 | |
Net investment income1 | | | | | 0.86 | | | | 0.85 | | | | 0.89 | | | | 0.94 | | | | 0.96 | |
| Net realized and unrealized gain (loss) | | | | | (1.14 | ) | | | 0.89 | | | | 2.17 | | | | (0.77 | ) | | | 1.96 | |
| Dividends to AMPS Shareholders from net investment income | | | | | — | | | | — | | | | (0.01 | ) | | | (0.02 | ) | | | (0.03 | ) |
| Net increase (decrease) from investment operations | | | | | (0.28 | ) | | | 1.74 | | | | 3.05 | | | | 0.15 | | | | 2.89 | |
Dividends to Common Shareholders from net investment income2 | | | | | (0.89 | ) | | | (0.89 | ) | | | (0.89 | ) | | | (0.88 | ) | | | (0.84 | ) |
| Net asset value, end of year | | | | $ | 14.11 | | | $ | 15.28 | | | $ | 14.43 | | | $ | 12.27 | | | $ | 13.00 | |
| Market price, end of year | | | | $ | 13.26 | | | $ | 14.97 | | | $ | 14.38 | | | $ | 11.88 | | | $ | 12.95 | |
| |
Total Investment Return Applicable to Common Shareholders3
|
| Based on net asset value | | | | | (0.94)% | | | | 12.29% | | | | 25.65% | | | | 1.19% | | | | 27.36% | |
| Based on market price | | | | | (4.99)% | | | | 10.40% | | | | 29.32% | | | | (1.65)% | | | | 36.87% | |
| |
Ratios to Average Net Assets Applicable to Common Shareholders
|
| Total expenses | | | | | 1.87% | | | | 1.84% | | | | 1.55% | 4 | | | 1.39% | 4 | | | 1.36% | 4 |
| Total expenses after fees waived and paid indirectly | | | | | 1.87% | | | | 1.84% | | | | 1.55% | 4 | | | 1.39% | 4 | | | 1.36% | 4 |
Total expenses after fees waived and paid indirectly and excluding interest
expense, fees and amortization of offering costs5 | | | | | 1.21% | | | | 1.17% | | | | 1.23% | 4,6 | | | 1.28% | 4 | | | 1.26% | 4 |
| Net investment income | | | | | 6.40% | | | | 5.68% | | | | 6.64% | 4 | | | 7.38% | 4 | | | 7.91% | 4 |
| Dividends to AMPS Shareholders | | | | | — | | | | — | | | | 0.07% | | | | 0.19% | | | | 0.22% | |
| Net investment income to Common Shareholders | | | | | 6.40% | | | | 5.68% | | | | 6.57% | | | | 7.19% | | | | 7.69% | |
| |
Supplemental Data
|
| Net assets applicable to Common Shareholders, end of year (000) | | | | $ | 103,069 | | | $ | 111,603 | | | $ | 105,309 | | | $ | 89,481 | | | $ | 94,736 | |
| AMPS outstanding at $25,000 liquidation preference, end of year (000) | | | | | — | | | | — | | | | — | | | $ | 42,975 | | | $ | 42,975 | |
| VMTP Shares outstanding at $100,000 liquidation value, end of year (000) | | | | $ | 42,900 | | | $ | 42,900 | | | $ | 42,900 | | | | — | | | | — | |
| Portfolio turnover | | | | | 22% | | | | 18% | | | | 30% | | | | 20% | | | | 32% | |
| Asset coverage per AMPS at $25,000 liquidation preference, end of year | | | | | — | | | | — | | | | — | | | $ | 77,055 | | | $ | 80,113 | |
| Asset coverage per VMTP Shares at $100,000 liquidation value, end of year | | | | $ | 340,253 | | | $ | 360,148 | | | $ | 345,474 | | | | — | | | | — | |
| 1 | | Based on average Common Shares outstanding. |
| 2 | | Determined in accordance with federal income tax regulations. |
| 3 | | Total investment returns based on market price, which can be significantly greater or less than the net asset value, may result in substantially different returns. Where applicable, excludes the effects of any sales charges and assumes the reinvestment of dividends and distributions. |
| 4 | | Does not reflect the effect of dividends to AMPS Shareholders. |
| 5 | | Interest expense, fees and amortization of offering costs relate to TOBs and/or VMTP Shares. See Note 3 and Note 9 of the Notes to Financial Statements for details of municipal bonds transferred to TOBs and VMTP Shares, respectively. |
| 6 | | For the year ended April 30, 2012, the total expense ratio after fees waived and paid indirectly and excluding interest expense, fees, amortization of offering costs and remarketing fees was 1.19%. |
See Notes to Financial Statements.
| 60 | ANNUAL REPORT | APRIL 30, 2014
|
| |
| Notes to Financial Statements |
|
1. Organization:
BlackRock Investment Quality Municipal Trust Inc. (“BKN”) is organized as a Maryland corporation. BlackRock Long-Term Municipal Advantage Trust (“BTA”), BlackRock Municipal 2020 Term Trust (“BKK”), BlackRock Municipal Income Trust (“BFK”), BlackRock Pennsylvania Strategic Municipal Trust (“BPS”) and BlackRock Strategic Municipal Trust (“BSD”) (collectively, together with BKN, the “Trusts” or individually as the “Trust”) are organized as Delaware statutory trusts. BKN, BKK, BFK and BSD are registered under the 1940 Act, as amended (the “1940 Act”), as diversified, closed-end management investment companies. BTA and BPS are registered under the 1940 Act as non-diversified, closed-end management investment companies. The Board of Directors and the Boards of Trustees of the Trusts are collectively referred to throughout this report as the “Board of Trustees” or the “Board,” and the directors/trustees thereof are collectively referred to throughout this report as “Trustees”. The Trusts determine and make available for publication the NAVs of their Common Shares on a daily basis.
2. Significant Accounting Policies:
The Trusts’ financial statements are prepared in conformity with accounting principles generally accepted in the United States of America (“U.S. GAAP”), which may require management to make estimates and assumptions that affect the reported amounts of assets and liabilities in the financial statements and the reported amounts of increases and decreases in net assets from operations during the reporting period. Actual results could differ from those estimates. The following is a summary of the significant accounting policies followed by the Trusts:
Valuation: U.S. GAAP defines fair value as the price the Trusts would receive to sell an asset or pay to transfer a liability in an orderly transaction between market participants at the measurement date. The Trusts determine the fair values of their financial instruments at market value using independent dealers or pricing services under policies approved by the Board. The BlackRock Global Valuation Methodologies Committee (the “Global Valuation Committee”) is the committee formed by management to develop global pricing policies and procedures and to provide oversight of the pricing function for the Trusts for all financial instruments.
Municipal investments (including commitments to purchase such investments on a “when-issued” basis) are valued on the basis of prices provided by dealers or pricing services. In determining the value of a particular investment, pricing services may use certain information with respect to transactions in such investments, quotations from dealers, pricing matrixes, market transactions in comparable investments and information with respect to various relationships between investments. Financial futures contracts traded on exchanges are valued at their last sale price. Investments in open-end registered investment companies are valued at NAV each business day. Short-term securities with remaining maturities of 60 days or less may be valued at amortized cost, which approximates fair value.
In the event that the application of these methods of valuation results in a price for an investment that is deemed not to be representative of the market value of such investment, or if a price is not available, the investment will be valued by the Global Valuation Committee, or its delegate, in accordance with a policy approved by the Board as reflecting fair value (“Fair Value Assets”). When determining the price for Fair Value Assets, the Global Valuation Committee, or its delegate, seeks to determine the price that each Trust might reasonably expect to receive from the current sale of that asset in an arm’s-length transaction. Fair value determinations shall be based upon all available factors that the Global Valuation Committee, or its delegate, deems relevant consistent with the principles of fair value measurement. The pricing of all Fair Value Assets is subsequently reported to the Board or a committee thereof on a quarterly basis.
Segregation and Collateralization: In cases where a Trust enters into certain investments (e.g., financial futures contracts) or certain borrowings (e.g., TOBs) that would be “senior securities” for 1940 Act purposes, the Trust may segregate or designate on its books and records cash or liquid securities having a market value at least equal to the amount of the Trust’s future obligations under such investments or borrowings. Doing so allows the investment or borrowing to be excluded from treatment as a “senior security.” Furthermore, if required by an exchange or counterparty agreement, the Trust may be required to deliver/deposit cash and/or securities to/with an exchange, or broker-dealer or custodian as collateral for certain investments or obligations.
Investment Transactions and Investment Income: For financial reporting purposes, investment transactions are recorded on the dates the transactions are entered into (the trade dates). Realized gains and losses on investment transactions are determined on the identified cost basis. Dividend income is recorded on the ex-dividend date. Interest income, including amortization and accretion of premiums and discounts on debt securities, is recognized on the accrual basis.
Dividends and Distributions: Dividends from net investment income are declared and paid monthly. Distributions of capital gains are recorded on the ex-dividend date. The character and timing of dividends and distributions are determined in accordance with federal income tax regulations, which may differ from U.S. GAAP. Dividends and distributions to Preferred Shareholders are accrued and determined as described in Note 9.
Income Taxes: It is the Trusts’ policy to comply with the requirements of the Internal Revenue Code of 1986, as amended, applicable to regulated investment companies, and to distribute substantially all of their taxable income to their shareholders. Therefore, no federal income tax provision is required.
Each Trust files U.S. federal and various state and local tax returns. No income tax returns are currently under examination. The statute of limitations on the Trusts’ U.S. federal tax returns remains open for each of the four years ended April 30, 2014. The statutes of limitations on each Trust’s state and local tax returns may remain open for an additional year depending upon the jurisdiction.
Management has analyzed tax laws and regulations and their application to the Trusts’ facts and circumstances and does not believe there are any uncertain tax positions that require recognition of a tax liability.
| ANNUAL REPORT | APRIL 30, 2014 | 61
|
| |
| Notes to Financial Statements (continued) |
|
Deferred Compensation Plan: Under the Deferred Compensation Plan (the “Plan”) approved by each Trust’s Board, the independent Trustees (“Independent Trustees”) may defer a portion of their annual complex wide compensation. Deferred amounts earn an approximate return as though equivalent dollar amounts had been invested in common shares of certain other BlackRock Closed-End Funds selected by the Independent Trustees. This has the same economic effect for the Independent Trustees as if the Independent Trustees had invested the deferred amounts directly in certain other BlackRock Closed-End Funds.
The Plan is not funded and obligations thereunder represent general unsecured claims against the general assets of each Trust. Deferred compensation liabilities are included in officer’s and trustees’ fees payable in the Statements of Assets and Liabilities and will remain as a liability of the Trusts until such amounts are distributed in accordance with the Plan.
Other: Expenses directly related to a Trust are charged to that Trust. Other operating expenses shared by several funds are pro rated among those trusts on the basis of relative net assets or other appropriate methods.
The Trusts have an arrangement with the custodians whereby fees may be reduced by credits earned on uninvested cash balances, which, if applicable, are shown as fees paid indirectly in the Statements of Operations. The custodian imposes fees on overdrawn cash balances, which can be offset by accumulated credits earned or may result in additional custody charges.
3. Securities and Other Investments:
Zero-Coupon Bonds: The Trusts may invest in zero-coupon bonds, which are normally issued at a significant discount from face value and do not provide for periodic interest payments. Zero-coupon bonds may experience greater volatility in market value than similar maturity debt obligations which provide for regular interest payments.
Forward Commitments and When-Issued Delayed Delivery Securities: The Trusts may purchase securities on a when-issued basis and may purchase or sell securities on a forward commitment basis. Settlement of such transactions normally occurs within a month or more after the purchase or sale commitment is made. The Trusts may purchase securities under such conditions with the intention of actually acquiring them, but may enter into a separate agreement to sell the securities before the settlement date. Since the value of securities purchased may fluctuate prior to settlement, the Trusts may be required to pay more at settlement than the security is worth. In addition, the Trusts are not entitled to any of the interest earned prior to settlement. When purchasing a security on a delayed delivery basis, the Trusts assume the rights and risks of ownership of the security, including the risk of price and yield fluctuations. In the event of default by the counterparty, the Trusts’ maximum amount of loss is the unrealized appreciation of unsettled when-issued transactions, which is shown in the Schedules of Investments.
Municipal Bonds Transferred to TOBs: The Trusts leverage their assets through the use of TOBs. A TOB is a special purpose entity established by a third party sponsor, into which a trust, or an agent on behalf of a trust, transfers municipal bonds into a trust (“TOB Trust”). Other trusts managed by the investment advisor may also contribute municipal bonds to a TOB into which a Trust has contributed bonds. A TOB typically issues two classes of beneficial interests: short-term floating rate certificates (“TOB Trust Certificates”), which are sold to third party investors, and residual certificates (“TOB Residuals”), which are generally issued to the participating trusts that contributed the municipal bonds to the TOB Trust. If multiple trusts participate in the same TOB, the rights and obligations under the TOB Residual will be shared among the trusts ratably in proportion to their participation.
The TOB Residuals held by a Trust include the right of a Trust (1) to cause the holders of a proportional share of the TOB Trust Certificates to tender their certificates at par plus accrued interest upon the occurrence of certain mandatory tender events defined in the TOB agreements, and (2) to transfer, subject to a specified number of days’ prior notice, a corresponding share of the municipal bonds from the TOB to a Trust. The TOB may also be collapsed without the consent of a Trust, as the TOB Residual holder, upon the occurrence of certain termination events as defined in the TOB agreements. Such termination events may include the bankruptcy or default of the municipal bond, a substantial downgrade in credit quality of the municipal bond, the inability of the TOB to obtain renewal of the liquidity support agreement, a substantial decline in market value of the municipal bond and a judgment or ruling that interest on the municipal bond is subject to federal income taxation. Upon the occurrence of a termination event, the TOB would generally be liquidated in full with the proceeds typically applied first to any accrued fees owed to the trustee, remarketing agent and liquidity provider, and then to the holders of the TOB Trust Certificates up to par plus accrued interest owed on the TOB Trust Certificates, with the balance paid out to the TOB Residual holder. During the year ended April 30, 2014, no TOBs in which the Trusts participated were terminated without the consent of the Trusts.
The cash received by the TOB from the sale of the TOB Trust Certificates, less transaction expenses, is paid to a Trust. The Trust typically invests the cash received in additional municipal bonds. Each Trust’s transfer of the municipal bonds to a TOB Trust is accounted for as a secured borrowing; therefore, the municipal bonds deposited into a TOB are presented in the Trusts’ Schedules of Investments and the TOB Trust Certificates are shown in other liabilities in the Statements of Assets and Liabilities. The carrying amount of each Trust’s payable to the holder of the TOB Trust Certificates, as reported in Statements of Assets and Liabilities as TOB Trust Certificates, approximates its fair value.
The Trusts may invest in TOBs on either a non-recourse or recourse basis. TOB Trusts are typically supported by a liquidity facility provided by a bank or other financial institution (the “Liquidity Provider”) that allows the holders of the TOB Trust Certificates to tender their certificates in exchange for payment from the Liquidity Provider of par plus accrued interest on any business day prior to the occurrence of the termination events described above. When a Trust invests in TOBS on a non-recourse basis, and the Liquidity Provider is required to make a payment under the liquidity facility due to a termination event, the Liquidity Provider will typically liquidate all or a portion of the municipal securities held in the TOB Trust and then fund, on a net basis, the balance, if any, of the amount owed under the liquidity
| 62 | ANNUAL REPORT | APRIL 30, 2014
|
| |
| Notes to Financial Statements (continued) |
|
facility over the liquidation proceeds (the “Liquidation Shortfall”). If a Trust invests in a TOB on a recourse basis, the Trust will typically enter into a reimbursement agreement with the Liquidity Provider where the Trust is required to repay the Liquidity Provider the amount of any Liquidation Shortfall. As a result, a Trust investing in recourse TOB will bear the risk of loss with respect to any Liquidation Shortfall. If multiple trusts participate in any such TOB, these losses will be shared ratably, including the maximum potential amounts owed by Trusts at April 30, 2014, in proportion to their participation. The recourse TOB Trusts are identified in the Schedules of Investments, including the maximum potential amounts owed by the Trusts at April 30, 2014.
Interest income, including amortization and accretion of premiums and discounts, from the underlying municipal bonds is recorded by the Trusts on an accrual basis. Interest expense incurred on the secured borrowing and other expenses related to remarketing, administration and trustee services to a TOB are shown as interest expense, fees and amortization of offering costs in the Statements of Operations. The TOB Trust Certificates have interest rates that generally reset weekly and their holders have the option to tender such certificates to the TOB for redemption at par at each reset date. At April 30, 2014, the aggregate value of the underlying municipal bonds transferred to TOBs, the related liability for TOB Trust Certificates and the range of interest rates on the liability for TOB Trust Certificates were as follows:
|
|
|
| Underlying
Municipal
Bonds
Transferred
to TOBs
|
| Liability
for TOB Trust
Certificates
|
| Range of
Interest Rates
|
BKN | | | | $ | 42,559,570 | | | $ | 23,584,555 | | | 0.10-0.34% |
BTA | | | | $ | 141,466,724 | | | $ | 89,035,874 | | | 0.10-0.27% |
BKK | | | | $ | 5,634,000 | | | $ | 3,750,000 | | | 0.32% |
BFK | | | | $ | 219,510,434 | | | $ | 126,072,926 | | | 0.09-0.32% |
BPS | | | | $ | 1,483,089 | | | $ | 675,000 | | | 0.11-0.13% |
BSD | | | | $ | 36,374,713 | | | $ | 20,938,550 | | | 0.09-0.32% |
For the year ended April 30, 2014, the Trusts’ average TOB Trust Certificates outstanding and the daily weighted average interest rate, including fees, were as follows:
|
|
|
| Average
TOB Trust
Certificates
Outstanding
|
| Daily
Weighted
Average
Interest
Rate
|
BKN | | | | $ 23,348,449 | | 0.66% |
BTA | | | | $ 85,523,652 | | 0.56% |
BKK | | | | $ 3,750,000 | | 0.60% |
BFK | | | | $136,208,885 | | 0.64% |
BPS | | | | $ 2,215,910 | | 0.61% |
BSD | | | | $ 22,302,477 | | 0.64% |
Should short-term interest rates rise, the Trusts’ investments in TOBs may adversely affect the Trusts’ net investment income and dividends to Common Shareholders. Also, fluctuations in the market value of municipal bonds deposited into the TOB Trust may adversely affect the Trusts’ NAVs per share.
4. Derivative Financial Instruments:
The Trusts engage in various portfolio investment strategies using derivative contracts both to increase the returns of the Trusts and/or to economically hedge their exposure to certain risks such as interest rate risk. These contracts may be transacted on an exchange.
Financial Futures Contracts: The Trusts purchase and/or sell financial futures contracts to gain exposure to, or economically hedge against, changes in interest rates (interest rate risk). Financial futures contracts are agreements between the Trusts and a counterparty to buy or sell a specific quantity of an underlying instrument at a specified price and at a specified date. Depending on the terms of the particular contract, financial futures contracts are settled either through physical delivery of the underlying instrument on the settlement date or by payment of a cash settlement amount on the settlement date.
Upon entering into a financial futures contract, the Trusts are required to deposit initial margin with the broker in the form of cash or securities in an amount that varies depending on a contract’s size and risk profile. The initial margin deposit must then be maintained at an established level over the life of the contract. Securities deposited as initial margin are designated on the Schedules of Investments and cash deposited, if any, is recorded on the Statements of Assets and Liabilities as cash pledged for financial futures contracts. Pursuant to the contract, the Trusts agree to receive from or pay to the broker an amount of cash equal to the daily fluctuation in value of the contract. Such receipts or payments are known as variation margin. Variation margin is recorded by the Trusts as unrealized appreciation or depreciation, and, if applicable, as a receivable or payable for variation margin in the Statements of Assets and Liabilities.
When the contract is closed, the Trusts record a realized gain or loss equal to the difference between the value of the contract at the time it was opened and the value at the time it was closed. The use of financial futures contracts involves the risk of an imperfect correlation in the movements in the price of financial futures contracts, interest rates and the underlying assets.
The following is a summary of the Trusts’ derivative financial instruments categorized by risk exposure:
Fair Values of Derivative Financial Instruments as of April 30, 2014
|
| | | | Derivative Liabilities
|
| | | |
|
| BKN
|
| BTA
|
| BFK
|
| BPS
|
| BSD
|
|
|
|
| Statements of Assets and Liabilities Location
|
|
|
Interest rate contracts:
| | | | | | | | | | | | | | | | | | | | | | | | | | |
Financial futures contracts | | | | Net unrealized depreciation1
| | $ | (69,766 | ) | | $ | (5,612 | ) | | $ | (225,108 | ) | | $ | (19,018 | ) | | $ | (36,391 | ) |
| 1 | | Includes cumulative appreciation/depreciation on financial futures contracts as reported in the Schedules of Investments. Only current day’s variation margin is reported within the Statements of Assets and Liabilities. |
| ANNUAL REPORT | APRIL 30, 2014 | 63
|
| |
| Notes to Financial Statements (continued) |
|
The Effect of Derivative Financial Instruments in the Statements of Operations
Year Ended April 30, 2014
|
|
| | | | Net Realized Gain (Loss) From
|
|
|
|
| BKN
|
| BTA
|
| BFK
|
| BPS
|
| BSD
|
Interest rate contracts:
|
Financial futures contracts | | | | $ | (33,973 | ) | | $ | (96,575 | ) | | $ | (262,939 | ) | | $ | 32,680 | | | $ | (25,177 | ) |
| | | | Net Change in Unrealized Appreciation/Depreciation on
|
|
|
|
| BKN
|
| BTA
|
| BFK
|
| BPS
|
| BSD
|
Interest rate contracts:
| | | | | | | | | | | | | | | | | | | | | | |
Financial futures contracts | | | | $ | 201,904 | | | $ | (5,612 | ) | | $ | 353,662 | | | $ | 37,364 | | | $ | 90,447 | |
For the year ended April 30, 2014, the average quarterly balances of outstanding derivative financial instruments were as follows:
| | | | BKN
|
| BTA
|
| BFK
|
| BPS
|
| BSD
|
Financial futures contracts:
| | | | | | | | | | | | | | | | | | | | | | |
Average number of contracts purchased | | | | | 100 | 1 | | | — | | | | — | | | | — | | | | — | |
Average number of contracts sold | | | | | 174 | | | | 25 | | | | 368 | | | | 23 | | | | 59 | |
Average notional value of contracts purchased | | | | $ | 12,391,918 | 1 | | | — | | | | — | | | | — | | | | — | |
Average notional value of contracts sold | | | | $ | 21,790,578 | | | $ | 3,064,605 | | | $ | 46,045,961 | | | $ | 2,850,840 | | | $ | 7,360,965 | |
| 1 | | Actual contract amount shown due to limited activity |
Counterparty Credit Risk: A derivative contract may suffer a mark-to-market loss if the value of the contract decreases due to an unfavorable change in the market rates or values of the underlying instrument. Losses can also occur if the counterparty does not perform under the contract.
A Trust’s risk of loss from counterparty credit risk on OTC derivatives is generally limited to the aggregate unrealized gain netted against any collateral held by such Trust.
With exchange-traded futures, there is less counterparty credit risk to the Trusts since the exchange or clearinghouse, as counterparty to such instruments, guarantees against a possible default. The clearinghouse stands between the buyer and seller of the contract; therefore, credit risk is limited to failure of the clearinghouse. While offset rights may exist under applicable law, a Trust does not have a contractual right of offset against a clearing broker or clearinghouse in the event of a default (including the bankruptcy or insolvency) of the clearing broker or clearinghouse. Additionally, credit risk exists in exchange-traded futures with respect to initial and variation margin that is held in a clearing broker’s customer accounts. While clearing brokers are required to segregate customer margin from their own assets, in the event that a clearing broker becomes insolvent or goes into bankruptcy and at that time there is a shortfall in the aggregate amount of margin held by the clearing broker for all its clients, typically the shortfall would be allocated on a pro rata basis across all the clearing broker’s customers, potentially resulting in losses to the Trusts.
5. Investment Advisory Agreement and Other Transactions with Affiliates:
The PNC Financial Services Group, Inc. is the largest stockholder and an affiliate, for 1940 Act purposes, of BlackRock, Inc. (“BlackRock”).
Each Trust entered into an Investment Advisory Agreement with BlackRock Advisors, LLC (the “Manager”), the Trusts’ investment advisor, an indirect, wholly owned subsidiary of BlackRock, to provide investment advisory and administration services. The Manager is responsible for the management of each Trust’s portfolio and provides the necessary personnel, facilities, equipment and certain other services necessary to the operations of each Trust. For such services, each Trust pays the Manager a monthly fee based on a percentage of each Trust’s average weekly net assets at the following annual rates:
BKN | | | | | 0.35 | % |
BTA | | | | | 1.00 | % |
BKK | | | | | 0.50 | % |
BFK | | | | | 0.60 | % |
BPS | | | | | 0.60 | % |
BSD | | | | | 0.60 | % |
Average weekly net assets for all of the Trusts, except BTA, is the average weekly value of each Trust’s total assets minus its total accrued liabilities. For BTA, average weekly net assets is the average weekly value of the Trust’s total assets minus its total liabilities.
The Manager entered into a sub-advisory agreement with BlackRock Financial Management, LLC (“BFM”), an affiliate of the Manager. The Manager pays BFM, for services it provides, a monthly fee that is a percentage of the investment advisory fees paid by each Trust to the Manager.
The Manager voluntarily agreed to waive a portion of the investment advisory fees or other expenses on BTA through January 31, 2014 as a percentage of its average daily net assets at the rate of 0.10%. As of the period ended January 31, 2014, the Manager waived the amounts of $116,512, which are included in fees waived by advisor in the Statements of Operations.
BKN has an Administration Agreement with the Manager. The Administration fee paid to the manager is computed at an annual rate of 0.15% of the Trust’s average weekly net assets including proceeds from the issuance of Preferred Shares and TOBs.
| 64 | ANNUAL REPORT | APRIL 30, 2014
|
| |
| Notes to Financial Statements (continued) |
|
The Manager voluntarily agreed to waive its investment advisory fees by the amount of investment advisory fees each Trust pays to the Manager indirectly through its investment in affiliated money market funds. However, the Manager does not waive its investment advisory fees by the amount of investment advisory fees paid in connection with each Trust’s investment in other affiliated investment companies, if any. These amounts are included in fees waived by Manager in the Statements of Operations. For the year ended April 30, 2014, the amounts waived were as follows:
BKN | | | | $ | 1,182 | |
BTA | | | | $ | 486 | |
BKK | | | | $ | 2,431 | |
BFK | | | | $ | 3,474 | |
BPS | | | | $ | 34 | |
BSD | | | | $ | 451 | |
Certain officers and/or Trustees of the Trusts are officers and/or directors of BlackRock or its affiliates. The Trusts reimburse the Manager for a portion of the compensation paid to the Trusts’ Chief Compliance Officer, which is included in Officer and Trustees in the Statements of Operations.
The Trusts may purchase securities from, or sell securities to, an affiliated fund provided the affiliation is solely due to having a common investment adviser, common officers, or common trustees. For the year ended April 30, 2014, the sale transactions for BKN with an affiliated fund in compliance with Rule 17a-7 under the 1940 Act were $2,059,002.
6. Purchases and Sales:
Purchases and sales of investments excluding short-term securities for the year ended April 30, 2014, were as follows:
|
|
|
| Purchases
|
| Sales
|
BKN | | | | $ | 114,768,531 | | | $ | 126,833,378 | |
BTA | | | | $ | 69,045,526 | | | $ | 82,438,302 | |
BKK | | | | $ | 34,670,069 | | | $ | 128,049,455 | |
BFK | | | | $ | 200,533,303 | | | $ | 260,578,647 | |
BPS | | | | $ | 6,904,472 | | | $ | 12,538,128 | |
BSD | | | | $ | 35,252,929 | | | $ | 41,988,602 | |
7. Income Tax Information:
U.S. GAAP requires that certain components of net assets be adjusted to reflect permanent differences between financial and tax reporting. These reclassifications have no effect on net assets or net asset values per share. The following permanent differences as of April 30, 2014 attributable to amortization methods on fixed income securities, non-deductible expenses, the expiration of capital loss carryforwards, the retention of tax-exempt income and distributions received from a regulated investment company were reclassified to the following accounts:
|
|
|
| BKN
|
| BTA
|
| BKK
|
| BFK
|
| BPS
|
| BSD
|
Paid-in capital | | | | $ | (77,663 | ) | | $ | (701,315 | ) | | $ | 1,344,000 | | | $ | (2,721,443 | ) | | $ | (3,659 | ) | | $ | (46,568 | ) |
Undistributed net investment income | | | | $ | 32,238 | | | $ | 336,422 | | | $ | (1,344,924 | ) | | $ | 109,518 | | | $ | (6,083 | ) | | $ | 41,667 | |
Accumulated net realized loss | | | | $ | 45,425 | | | $ | 364,893 | | | $ | 924 | | | $ | 2,611,925 | | | $ | 9,742 | | | $ | 4,901 | |
The tax character of distributions paid during the fiscal years ended April 30, 2014 and April 30, 2013 was as follows:
|
|
|
|
|
| BKN
|
| BTA
|
| BKK
|
| BFK
|
| BPS
|
| BSD
|
Tax-exempt income1 | | | | | 4/30/2014 | | | $ | 17,814,511 | | | $ | 9,985,897 | | | $ | 16,506,002 | | | $ | 43,440,159 | | | $ | 1,747,018 | | | $ | 6,945,294 | |
| | | | | 4/30/2013 | | | | 18,244,178 | | | | 10,246,542 | | | | 18,878,656 | | | | 46,079,263 | | | | 1,905,658 | | | | 6,971,833 | |
Ordinary income2 | | | | | 4/30/2014 | | | | 6,966 | | | | 255 | | | | 279 | | | | 15,089 | | | | 3,152 | | | | 9,104 | |
| | | | | 4/30/2013 | | | | 80,501 | | | | 1,735 | | | | 1,223 | | | | 52,489 | | | | 25,240 | | | | 7,014 | |
Total | | | | | 4/30/2014 | | | $ | 17,821,477 | | | $ | 9,986,152 | | | $ | 16,506,281 | | | $ | 43,455,248 | | | $ | 1,750,170 | | | $ | 6,954,398 | |
| | | | | 4/30/2013 | | | $ | 18,324,679 | | | $ | 10,248,277 | | | $ | 18,879,879 | | | $ | 46,131,752 | | | $ | 1,930,898 | | | $ | 6,978,847 | |
| 1 | | The Trusts designate these amounts paid during the fiscal year ended April 30, 2014 as exempt-interest dividends. |
| 2 | | Ordinary income consists primarily of taxable income recognized from market discount. Additionally, all ordinary income distributions are comprised of interest related dividends and are eligible for exemption from U.S. withholding tax for nonresident aliens and foreign corporations. |
As of April 30, 2014, the tax components of accumulated net earnings (losses) were as follows:
|
|
|
| BKN
|
| BTA
|
| BKK
|
| BFK
|
| BPS
|
| BSD
|
Undistributed tax-exempt income | | | | $ | 2,958,641 | | | $ | 1,432,854 | | | $ | 13,538,207 | | | $ | 9,663,625 | | | $ | 340,365 | | | $ | 1,286,208 | |
Undistributed ordinary income | | | | | — | | | | 12,790 | | | | — | | | | 315,420 | | | | 2,379 | | | | 398 | |
Capital loss carryforwards | | | | | (5,106,868 | ) | | | (40,342,558 | ) | | | (754,685 | ) | | | (15,840,811 | ) | | | (2,360,403 | ) | | | (9,436,524 | ) |
Net unrealized gains3 | | | | | 28,548,552 | | | | 9,939,412 | | | | 22,965,339 | | | | 45,616,125 | | | | 2,369,839 | | | | 8,706,163 | |
Qualified late-year losses4 | | | | | (1,561,389 | ) | | | (777,992 | ) | | | (39,142 | ) | | | (6,158,343 | ) | | | (74,143 | ) | | | (959,568 | ) |
Total
| | | | $ | 24,838,936 | | | $ | (29,735,494 | ) | | $ | 35,709,719 | | | $ | 33,596,016 | | | $ | 278,037 | | | $ | (403,323 | ) |
| 3 | | The differences between book-basis and tax-basis net unrealized gains were attributable primarily to the tax deferral of losses on wash sales, amortization methods of premiums and discounts on fixed income securities, the accrual of income on securities in default, the realization for tax purposes of unrealized gains/losses on certain futures contracts, the timing and recognition of partnership income, treatment of residual interests in tender option bond trusts and the deferral of compensation to Trustees. |
| 4 | | The Trusts have elected to defer certain qualified late-year losses and recognize such losses in the year ending April 30, 2015. |
| ANNUAL REPORT | APRIL 30, 2014 | 65
|
| |
| Notes to Financial Statements (continued) |
|
As of April 30, 2014, the Trusts had capital loss carryforwards available to offset future realized capital gains through the indicated expiration dates as follows:
Expires April 30,
|
|
|
| BKN
|
| BTA
|
| BKK
|
| BFK
|
| BPS
|
| BSD
|
2015 | | | | | — | | | | — | | | | — | | | $ | 606,017 | | | | — | | | | — | |
2016 | | | | | — | | | $ | 22,052,642 | | | | — | | | | 10,207,532 | | | $ | 127,957 | | | | — | |
2017 | | | | $ | 2,716,981 | | | | 6,882,935 | | | | — | | | | 2,065,704 | | | | 929,529 | | | $ | 3,887,588 | |
2018 | | | | | 1,174,679 | | | | 4,821,726 | | | | — | | | | 2,455,638 | | | | 586,549 | | | | 2,381,683 | |
2019 | | | | | — | | | | 951,237 | | | $ | 754,685 | | | | — | | | | — | | | | 2,978,126 | |
No expiration date5 | | | | | 1,215,208 | | | | 5,634,018 | | | | — | | | | 505,920 | | | | 716,368 | | | | 189,127 | |
Total
| | | | $ | 5,106,868 | | | $ | 40,342,558 | | | $ | 754,685 | | | $ | 15,840,811 | | | $ | 2,360,403 | | | $ | 9,436,524 | |
| 5 | | Must be utilized prior to losses subject to expiration. |
During the year ended April 30, 2014, BKK utilized $689,744 of its capital loss carryforwards.
As of April 30, 2014, gross unrealized appreciation and depreciation based on cost for federal income tax purposes were as follows:
|
|
|
| BKN
|
| BTA
|
| BKK
|
| BFK
|
| BPS
|
| BSD
|
|
Tax cost | | | | $ | 361,221,460 | | | $ | 148,726,434 | | | $ | 370,186,932 | | | $ | 854,212,379 | | | $ | 41,954,241 | | | $ | 135,900,118 | |
Gross unrealized appreciation | | | | | 32,319,394 | | | | 14,001,720 | | | | 25,352,061 | | | | 64,204,887 | | | | 2,591,771 | | | | 11,150,434 | |
Gross unrealized depreciation | | | | | (3,712,910 | ) | | | (3,959,588 | ) | | | (2,230,051 | ) | | | (18,168,735 | ) | | | (214,930 | ) | | | (2,422,069 | ) |
Net unrealized appreciation | | | | $ | 28,606,484 | | | $ | 10,042,132 | | | $ | 23,122,010 | | | $ | 46,036,152 | | | $ | 2,376,841 | | | $ | 8,728,365 | |
8. Concentration, Market and Credit Risk:
The Trusts invest a substantial amount of their assets in issuers located in a single state or limited number of states. Please see the Schedules of Investments for concentrations in specific states or U.S. territories.
Many municipalities insure repayment of their bonds, which may reduce the potential for loss due to credit risk. The market value of these bonds may fluctuate for other reasons, including market perception of the value of such insurance, and there is no guarantee that the insurer will meet its obligation.
In the normal course of business, the Trusts invest in securities and enter into transactions where risks exist due to fluctuations in the market (market risk) or failure of the issuer of a security to meet all its obligations (issuer credit risk). The value of securities held by the Trusts may decline in response to certain events, including those directly involving the issuers whose securities are owned by the Trusts; conditions affecting the general economy; overall market changes; local, regional or global political, social or economic instability; and currency and interest rate and price fluctuations. Similar to issuer credit risk, the Trusts may be exposed to counterparty credit risk, or the risk that an entity with which the Trusts have unsettled or open transactions may fail to or be unable to perform on its commitments. The Trusts manage counterparty credit risk by entering into transactions only with counterparties that they believe have the financial resources to honor their obligations and by monitoring the financial stability of those counterparties. Financial assets, which potentially expose the Trusts to market, issuer and counterparty credit risks, consist principally of financial instruments and receivables due from counterparties. The extent of the Trusts’ exposure to market, issuer and counterparty credit risks with respect to these financial assets is generally approximated by their value recorded in the Statements of Assets and Liabilities, less any collateral held by the Trusts.
The Trusts invest a significant portion of their assets in fixed-income securities and/or use derivatives tied to the fixed income markets. See the Schedules of Investments for these securities and/or derivatives. Changes in market interest rates or economic conditions, including the Federal Reserve’s decision in December 2013 to taper its quantitative easing policy, may affect the value and/or liquidity of such investments. Interest rate risk is the risk that prices of bonds and other fixed-income securities will increase as interest rates fall and decrease as interest rates rise. The Trusts may be subject to a greater risk of rising interest rates due to the current period of historically low rates.
As of April 30, 2014, BKN, BTA, BPS and BSD invested a significant portion of their assets in securities in the health sector. BSD invested a significant portion of its assets in securities in the transportation sector. Changes in economic conditions affecting the health or transportation sector would have a greater impact on the Trusts and could affect the value, income and/or liquidity of positions in such securities.
The Trusts may hold a significant amount of bonds subject to calls by the issuers at defined dates and prices. When bonds are called by issuers and the Trusts reinvest the proceeds received, such investments may be in securities with lower yields than the bonds originally held, and correspondingly, could adversely impact the yield and total return performance of a Trust.
On December 10, 2013, regulators published final rules implementing section 619 of the Dodd-Frank Wall Street Reform and Consumer Protection Act (the “Volcker Rule”), which prohibit banking entities from engaging in proprietary trading of certain instruments and limit such entities’ investments in, and relationships with, “covered funds, as defined in the rules.” Banking entities subject to the Volcker Rule are required to fully comply by July 21, 2015. The Volcker Rule may preclude banking entities and their affiliates from (i) sponsoring TOB trust programs (as such programs are presently structured) and (ii) continuing relationships with or services for existing TOB trust programs. As a result, TOB trusts may need
| 66 | ANNUAL REPORT | APRIL 30, 2014
|
| |
| Notes to Financial Statements (continued) |
|
to be restructured or unwound. There can be no assurances that TOB trusts can be restructured, that new sponsors of TOB trusts will develop, or that alternative forms of leverage will be available to the Trusts. Any alternative forms of leverage may be more or less advantageous to the Trusts than existing TOB leverage.
TOB transactions constitute an important component of the municipal bond market. Accordingly, implementation of the Volcker Rule may adversely impact the municipal market, including through reduced demand for and liquidity of municipal bonds and increased financing costs for municipal issuers. Any such developments could adversely affect the Trusts. The ultimate impact of these rules on the TOB market and the overall municipal market is not yet certain.
9. Capital Share Transactions:
BKK, BFK, BPS and BSD are authorized to issue an unlimited number of shares, including Preferred Shares, par value $0.001 per share, all of which were initially classified as Common Shares. BKN is authorized to issue 200 million shares including Preferred Shares, all of which were initially classified as Common Shares, par value $0.01 per share. BTA is authorized to issue an unlimited number of Common Shares, par value $0.001 per share. BTA is also allowed to issue Preferred Shares but has not done so. The Board is authorized, however, to reclassify any unissued Common Shares to Preferred Shares without approval of Common Shareholders.
Common Shares
For the years shown, shares issued and outstanding increased by the following amounts as a result of dividend reinvestment:
| | | | Year Ended April 30,
|
|
|
|
| 2014
|
| 2013
|
BKN | | | | | 10,644 | | | | 41,693 | |
BTA | | | | | — | | | | 28,270 | |
BFK | | | | | 12,577 | | | | 91,781 | |
BPS | | | | | — | | | | 3,536 | |
BSD | | | | | — | | | | 5,389 | |
Shares issued and outstanding remained constant for BKK for the year ended April 30, 2014 and the year ended April 30, 2013.
Preferred Shares
Each Trust’s Preferred Shares rank prior to the Trust’s Common Shares as to the payment of dividends by the Trust and distribution of assets upon dissolution or liquidation of the Trust. The 1940 Act prohibits the declaration of any dividend on the Trust’s Common Shares or the repurchase of the Trust’s Common Shares if the Trust fails to maintain the asset coverage of at least 200% of the liquidation preference of the outstanding Preferred Shares. In addition, pursuant to the Preferred Shares’ governing instruments, the Trusts are restricted from declaring and paying dividends on classes of shares ranking junior to or on parity with the Preferred Shares or repurchasing such shares if the Trusts fail to declare and pay dividends on the Preferred Shares, redeem any Preferred Shares required to be redeemed under the Preferred Shares’ governing instruments or comply with the basic maintenance amount requirement of the agencies rating the Preferred Shares.
The holders of Preferred Shares have voting rights equal to the holders of Common Shares (one vote per share) and will vote together with holders of Common Shares (one vote per share) as a single class. However, the holders of Preferred Shares, voting as a separate class, are also entitled to elect two Trustees for each Trust. In addition, the 1940 Act requires that along with approval by shareholders that might otherwise be required, the approval of the holders of a majority of any outstanding Preferred Shares, voting separately as a class would be required to (a) adopt any plan of reorganization that would adversely affect the Preferred Shares, (b) change a Trust’s sub-classification as a closed-end investment company or change its fundamental investment restrictions or (c) change its business so as to cease to be an investment company.
VRDP Shares
BPS has issued Series W-7 VRDP Shares, $100,000 liquidation value per share, in a privately negotiated offering. The VRDP Shares were offered to qualified institutional buyers as defined pursuant to Rule 144A under the Securities Act of 1933, as amended, (the “Securities Act”) and include a liquidity feature, pursuant to a liquidity agreement, that allows the holders of VRDP Shares to have their shares purchased by the liquidity provider in the event of a failed remarketing. BPS is required to redeem the VRDP Shares owned by the liquidity provider after six months of continuous, unsuccessful remarketing. Upon the occurrence of the first unsuccessful remarketing, BPS is required to segregate liquid assets to fund the redemption. The VRDP Shares are subject to certain restrictions on transfer.
The VRDP Shares outstanding as of the year ended April 30, 2014 were as follows:
| Issue Date
|
| Shares
Issued
|
| Aggregate
Principal
|
| Maturity
Date
|
BPS | 6/14/12 | | 163 | | $16,300,000 | | 7/01/42 |
BPS entered into a fee agreement with the liquidity provider that may require a per annum liquidity fee payable to the liquidity provider. These fees, if applicable, are shown as liquidity fees in the Statements of Operations.
The fee agreement between BPS and the liquidity provider is scheduled to expire on July 9, 2015 unless renewed or terminated in advance.
In the event the fee agreement is not renewed or is terminated in advance, and BPS does not enter into a fee agreement with an alternate liquidity provider, the VRDP Shares will be subject to mandatory purchase by the liquidity provider prior to the termination of the fee agreement. BPS is required to redeem any VRDP Shares purchased by the liquidity provider six months after the purchase date. Immediately after the purchase of any VRDP Shares by the liquidity provider, BPS is required to begin to segregate liquid assets with the Trust’s custodian to fund the redemption. There is no assurance BPS will replace such redeemed VRDP Shares with any other preferred shares or other form of leverage.
BPS is required to redeem its VRDP Shares on the maturity date, unless earlier redeemed or repurchased. Six months prior to the maturity date, BPS is required to begin to segregate liquid assets with the Trust’s
| ANNUAL REPORT | APRIL 30, 2014 | 67
|
| |
| Notes to Financial Statements (continued) |
|
custodian to fund the redemption. In addition, BPS is required to redeem certain of its outstanding VRDP Shares if it fails to maintain certain asset coverage, basic maintenance amount or leverage requirements.
Subject to certain conditions, the VRDP Shares may be redeemed, in whole or in part, at any time at the option of BPS. The redemption price per VRDP Share is equal to the liquidation value per share plus any outstanding unpaid dividends. In the event of an optional redemption of the VRDP Shares prior to the initial termination date of the fee agreement, BPS must pay the respective liquidity provider fees on such redeemed VRDP Shares for the remaining term of the fee agreement up to the initial termination date.
Dividends on the VRDP Shares are payable monthly at a variable rate set weekly by the remarketing agent. Such dividend rates are generally based upon a spread over a base rate and cannot exceed a maximum rate. In the event of a failed remarketing, the dividend rate of the VRDP Shares will be reset to a maximum rate. The maximum rate is determined based on, among other things, the long-term preferred share rating assigned to the VRDP Shares and the length of time that the VRDP Shares fail to be remarketed. At the date of issuance, the VRDP Shares were assigned a long-term rating of Aaa from Moody’s and AAA from Fitch. Subsequent to the issuance of the VRDP Shares, Moody’s completed a review of its methodology for rating securities issued by registered closed-end funds. As of April 30, 2014, the VRDP Shares were assigned a long-term rating of Aa1 from Moody’s under its new ratings methodology. The VRDP Shares continue to be assigned a long-term rating of AAA from Fitch.
For financial reporting purposes, the VRDP Shares are considered debt of the issuer; therefore, the liquidation value, which approximates fair value, of the VRDP Shares is recorded as a liability in the Statements of Assets and Liabilities. Unpaid dividends are included in interest expense and fees payable in the Statements of Assets and Liabilities, and the dividends accrued and paid on the VRDP Shares are included as a component of interest expense, fees and amortization of offering costs in the Statements of Operations. The VRDP Shares are treated as equity for tax purposes. Dividends paid to holders of the VRDP Shares are generally classified as tax-exempt income for tax-reporting purposes.
BPS may incur remarketing fees of 0.10% on the aggregate principal amount of all the VRDP Shares, which, if any, are included in remarketing fees on Preferred Shares in the Statements of Operations. None of BPS’s VRDP Shares were tendered for remarketing during the year ended April 30, 2014.
The annualized dividend rates for the VRDP Shares for the year ended April 30, 2014 were as follows:
Upon issuance of the VRDP Shares on June 14, 2012, BPS announced a special rate period for an approximate three-year term ending June 24, 2015 with respect to its VRDP Shares. The liquidity and fee agreements remain in effect for the duration of the special rate period; however, the VRDP Shares will not be remarketed or subject to optional or mandatory tender events during such time. During the special rate period, BPS is required to maintain the same asset coverage, basic maintenance amount and leverage requirements for the VRDP Shares. During the three-year term of the special rate period, BPS will not pay any liquidity and remarketing fees and instead will pay dividends monthly based on the sum of Securities Industries and Financial Market Association Municipal Swap Index (“SIFMA”) and a percentage per annum based on the long-term ratings assigned to the VRDP Shares.
If BPS redeems the VRDP Shares on a date that is one year or more before the end of the special rate period and the VRDP Shares are rated above A1/A by Moody’s and Fitch respectively, then such redemption is subject to a redemption premium payable to the holder of the VRDP Shares based on the time remaining in the special rate period, subject to certain exceptions for redemptions that are required to maintain minimum asset coverage requirements. After June 24, 2015, the holder of the VRDP Shares and BPS may mutually agree to extend the special rate period. If the special rate period is not extended, the VRDP Shares will revert back to remarketable securities and will be remarketed and available for purchase by qualified institutional investors. No short-term ratings were assigned by Moody’s, Fitch and/or S&P at issuance but will be assigned upon termination of the special rate period when the VRDP Shares revert to remarketable securities.
VMTP Shares
BKN, BFK and BSD (collectively, the “VMTP Trusts”), have issued Series W-7 VMTP Shares, $100,000 liquidation value per share, in a privately negotiated offering and sale of VMTP Shares exempt from registration under the Securities Act.
The VMTP Shares outstanding as of the year ended April 30, 2014 were as follows:
|
|
|
| Issue Date
|
| Shares
Issued
|
| Aggregate
Principal
|
| Term Date
|
BKN | | | | | 12/16/11 | | | | 1,259 | | | $ | 125,900,000 | | | | 1/02/15 | |
BFK | | | | | 12/16/11 | | | | 2,708 | | | $ | 270,800,000 | | | | 1/02/15 | |
BSD | | | | | 12/16/11 | | | | 429 | | | $ | 42,900,000 | | | | 1/02/15 | |
Each VMTP Trust is required to redeem its VMTP Shares on the term date, unless earlier redeemed or repurchased or unless extended. There is no assurance that the term of a Trust’s VMTP Shares will be extended or that a Trust’s VMTP Shares will be replaced with any other preferred shares or other form of leverage upon the redemption or repurchase of the VMTP Shares. Six months prior to term date, each VMTP Trust is required to begin to segregate liquid assets with the Trust’s custodian to fund the redemption. In addition, each VMTP Trust is required to redeem certain of its outstanding VMTP Shares if it fails to maintain certain asset coverage, basic maintenance amount or leverage requirements.
Subject to certain conditions, each Trust’s VMTP Shares may be redeemed, in whole or in part, at any time at the option of the Trust. The redemption price per VMTP Share is equal to the liquidation value per share plus any outstanding unpaid dividends and applicable redemption premium. If the Trust redeems the VMTP Shares on a date that is one year or more prior to the term date and the VMTP Shares are rated above A1/A+
| 68 | ANNUAL REPORT | APRIL 30, 2014
|
| |
| Notes to Financial Statements (continued) |
|
by Moody’s and Fitch, respectively, then such redemption is subject to a prescribed redemption premium (up to 3% of the liquidation preference) payable to the holder of the VMTP Shares based on the time remaining to the term date, subject to certain exceptions for redemptions that are required to maintain minimum asset coverage requirements. The VMTP Shares are subject to certain restrictions on transfer, and a Trust may also be required to register the VMTP Shares for sale under the Securities Act under certain circumstances. In addition, amendments to the VMTP governing document generally require the consent of the holders of VMTP Shares.
Dividends on the VMTP Shares are declared daily and payable monthly at a variable rate set weekly at a fixed rate spread to the SIFMA Municipal Swap Index. The fixed spread is determined based on the long-term preferred share rating assigned to the VMTP Shares by Moody’s and Fitch. At the date of issuance, the VMTP Shares were assigned long-term ratings of Aa1 from Moody’s and AAA from Fitch. Subsequent to the issuance of the VMTP Shares, Moody’s completed a review of its methodology for rating securities issued by registered closed-end funds. As of April 30, 2014, the VMTP Shares were assigned a long-term rating of Aa1 from Moody’s under its new rating methodology. The VMTP Shares continue to be assigned a long-term rating of AAA from Fitch. The dividend rate on the VMTP Shares is subject to a step-up spread if the Trust fails to comply with certain provisions, including, among other things, the timely payment of dividends, redemptions or gross-up payments, and maintaining certain asset coverage and leverage requirements.
The average annualized dividend rates for the VMTP Shares for the year ended April 30, 2014 were as follows:
|
|
|
| Rate
|
BKN | | | | | 1.07 | % |
BFK | | | | | 1.07 | % |
BSD | | | | | 1.07 | % |
For financial reporting purposes, the VMTP Shares are considered debt of the issuer; therefore the liquidation value, which approximates fair value, of the VMTP Shares is recorded as a liability in the Statements of Assets and Liabilities. Unpaid dividends are included in interest expense and fees payable in the Statements of Assets and Liabilities, and the dividends accrued and paid on the VMTP Shares are included as a component of interest expense, fees and amortization of offering costs in the Statements of Operations. The VMTP Shares are treated as equity for tax purposes. Dividends paid to holders of the VMTP Shares are generally classified as tax-exempt income for tax-reporting purposes.
VMTP Shares issued and outstanding remained constant for the year ended April 30, 2014.
Offering Costs: Certain Trusts incurred costs in connection with the issuance of VRDP Shares and/or VMTP Shares. For VRDP Shares, these costs were recorded as a deferred charge and will be amortized over the 30-year life of the VRDP Shares. For VMTP Shares, these costs were recorded as a deferred charge and will be amortized over the 3-year life of the VMTP Shares. Amortization of these costs is included in interest expense, fees and amortization of offering costs in the Statements of Operations.
AMPS
The AMPS are redeemable at the option of BKK in whole or in part, on any dividend payment date at their liquidation preference per share plus any accumulated and unpaid dividends whether or not declared. The AMPS are also subject to mandatory redemption at their liquidation preference plus any accumulated and unpaid dividends, whether or not declared, if certain requirements relating to the composition of the assets and liabilities of BKK, as set forth in BKK’s Statement of Preferences (the “Governing Instrument”) are not satisfied.
From time to time in the future, BKK may effect repurchases of its AMPS at prices below their liquidation preference as agreed upon by the Trust and seller. BKK also may redeem its AMPS from time to time as provided in the applicable Governing Instrument. BKK intends to effect such redemptions and/or repurchases to the extent necessary to maintain applicable asset coverage requirements or for such other reasons as the Board may determine.
In order to provide additional flexibility for BKK to potentially continue to conduct partial redemptions of Preferred Shares in the future, the Board of BKK approved an amendment to BKK’s Governing Instrument. The amendment eliminates a requirement that precluded partial redemptions of Preferred Shares once the number of Preferred Shares outstanding for a particular series fell below 300 shares. The Board of BKK believes the removal of this requirement is in the best interest of BKK and shareholders as it seeks to provide additional flexibility to conduct partial redemptions of Preferred Shares in advance of BKK’s maturity, if such redemption is otherwise determined to be consistent with the best interest of BKK and its shareholders.
The AMPS outstanding as of the year ended April 30, 2014 were as follows:
|
| Series
|
| AMPS
|
| Effective
Yield
|
| Reset
Frequency
Days
|
| Moody’s
Rating
|
BKK | | M-7 | | 906 | | 0.20% | | 7 | | Aa1 |
| | W-7 | | 906 | | 0.20% | | 7 | | Aa1 |
| | F-7 | | 906 | | 0.20% | | 7 | | Aa1 |
Dividends on BKK’s AMPS are cumulative at a rate, which is reset every seven days, based on the results of an auction. If the AMPS fail to clear the auction on an auction date, BKK is required to pay the maximum applicable rate on the AMPS to holders of such shares for successive dividend periods until such time as the shares are successfully auctioned.
| ANNUAL REPORT | APRIL 30, 2014 | 69
|
| |
| Notes to Financial Statements (continued) |
|
The maximum applicable rate on the AMPS is footnoted in the table below. The low, high and average dividend rates on the AMPS for BKK and BPS for the period were as follows:
|
| Series
|
| Low
|
| High
|
| Average
|
BKK | | | M-7 | | | | 0.07 | % | | | 0.36 | % | | | 0.13 | % |
| | | W-7 | | | | 0.07 | % | | | 0.38 | % | | | 0.13 | % |
| | | F-7 | | | | 0.07 | % | | | 0.36 | % | | | 0.13 | % |
Since February 13, 2008, the AMPS of BKK failed to clear any of their auctions. As a result, the AMPS dividend rates were reset to the maximum applicable rate, which ranged from 0.07% to 0.38% for the year ended April 30, 2014. A failed auction is not an event of default for the Trust but it has a negative impact on the liquidity of AMPS. A failed auction occurs when there are more sellers of the Trust’s AMPS than buyers. A successful auction for the Trusts’ AMPS may not occur for some time, if ever, and even if liquidity does resume, holders of AMPS may not have the ability to sell the AMPS at their liquidation preference.
BKK paid commissions of 0.15% on the aggregate principal amount of all shares that fail to clear their auctions and 0.25% on the aggregate principal amount of all shares that successfully clear their auctions. Certain broker dealers have individually agreed to reduce commissions for failed auctions. The commissions paid to these broker dealers are included in remarketing fees on Preferred Shares in the Statements of Operations.
During the year ended April 30, 2014, BKK announced the following redemptions of AMPS at a price of $25,000 per share plus any accrued and unpaid dividends through the redemption date:
|
| Series
| Redemption
Date
| Shares
Redeemed
| Aggregate
Principal
|
BKK | | | W-7 | | | 5/23/2013 | | | 82 | | $ | 2,050,000 | |
| | | F-7 | | | 5/28/2013 | | | 82 | | $ | 2,050,000 | |
| | | M-7 | | | 5/28/2013 | | | 82 | | $ | 2,050,000 | |
| | | W-7 | | | 8/1/2013 | | | 413 | | $ | 10,325,000 | |
| | | F-7 | | | 8/5/2013 | | | 413 | | $ | 10,325,000 | |
| | | M-7 | | | 8/6/2013 | | | 413 | | $ | 10,325,000 | |
| | | F-7 | | | 9/9/2013 | | | 98 | | $ | 2,450,000 | |
| | | M-7 | | | 9/10/2013 | | | 98 | | $ | 2,450,000 | |
| | | W-7 | | | 9/12/2013 | | | 98 | | $ | 2,450,000 | |
| | | F-7 | | | 10/7/2013 | | | 89 | | $ | 2,225,000 | |
| | | M-7 | | | 10/8/2013 | | | 89 | | $ | 2,225,000 | |
| | | W-7 | | | 10/10/2013 | | | 89 | | $ | 2,225,000 | |
| | | W-7 | | | 11/29/2013 | | | 132 | | $ | 3,300,000 | |
| | | F-7 | | | 12/2/2013 | | | 132 | | $ | 3,300,000 | |
| | | M-7 | | | 12/3/2013 | | | 132 | | $ | 3,300,000 | |
| | | M-7 | | | 12/31/2013 | | | 111 | | $ | 2,775,000 | |
| | | W-7 | | | 1/2/2014 | | | 111 | | $ | 2,775,000 | |
| | | F-7 | | | 1/6/2014 | | | 111 | | $ | 2,775,000 | |
| | | W-7 | | | 1/16/2014 | | | 114 | | $ | 2,850,000 | |
| | | F-7 | | | 1/21/2014 | | | 114 | | $ | 2,850,000 | |
| | | M-7 | | | 1/21/2014 | | | 114 | | $ | 2,850,000 | |
| | | W-7 | | | 2/27/2014 | | | 205 | | $ | 5,125,000 | |
| | | F-7 | | | 3/3/2014 | | | 205 | | $ | 5,125,000 | |
| | | M-7 | | | 3/4/2014 | | | 205 | | $ | 5,125,000 | |
During the year ended April 30, 2013, BKK and BPS announced the following redemptions of AMPS at a price of $25,000 per share plus any accrued and unpaid dividends through the redemption date:
|
|
| Series
| Redemption
Date
| Shares
Redeemed
| Aggregate
Principal
|
BKK | | | | F-7 | | | 1/22/13 | | | 142 | | $ | 3,550,000 | |
| | | | M-7 | | | 1/22/13 | | | 142 | | $ | 3,550,000 | |
| | | | W-7 | | | 1/24/13 | | | 142 | | $ | 3,550,000 | |
| | | | F-7 | | | 1/28/13 | | | 26 | | $ | 650,000 | |
| | | | M-7 | | | 1/29/13 | | | 26 | | $ | 650,000 | |
| | | | W-7 | | | 1/31/13 | | | 26 | | $ | 650,000 | |
As of April 30, 2014, there were no AMPS outstanding on BPS.
10. Subsequent Events:
Management’s evaluation of the impact of all subsequent events on the Trusts’ financial statements was completed through the date the financial statements were issued and the following items were noted:
The Trusts paid a net investment income dividend in the following amounts per share on June 2, 2014 to shareholders of record on May 15, 2014 as follows:
| Common
Dividend
Per Share
|
BKN | $ | 0.08000 | |
BTA | $ | 0.06200 | |
BKK | $ | 0.06225 | |
BFK | $ | 0.07510 | |
BPS | $ | 0.06100 | |
BSD | $ | 0.07400 | |
Additionally, the Trusts declared dividends on June 2, 2014 payable to Common Shareholders of record on June 16, 2014 as follows:
| Per Common
Share
|
| Tax-Exempt
Dividends
Declared
|
BKN | $ | 0.08000 | |
BTA | $ | 0.06200 | |
BKK | $ | 0.06225 | |
BFK | $ | 0.07510 | |
BPS | $ | 0.06100 | |
BSD | $ | 0.07400 | |
| 70 | ANNUAL REPORT | APRIL 30, 2014
|
| |
| Notes to Financial Statements (concluded) |
|
The dividends declared on AMPS, VRDP or VMTP Shares for the period May 1, 2014 to May 31, 2014 were as follows:
| Series
|
| AMPS/VRDP/VMTP
Dividends Declared
|
| BKN VMTP Shares | W-7 | | $ | 115,759 |
| BKK AMPS Shares | M-7 | | $ | 2,709 |
| | W-7 | | $ | 3,561 |
| | F-7 | | $ | 2,790 |
| BFK VMTP Shares | W-7 | | $ | 248,988 |
| BPS VRDP Shares | W-7 | | $ | 14,746 |
| BSD VMTP Shares | W-7 | | $ | 39,445 |
On May 16, 2014, BKK announced the following redemption of AMPS at a price of $25,000 per share plus any accrued and unpaid dividends through the redemption date.
|
|
|
| Series
|
| Redemption
Date
|
| Shares
Redeemed
|
| Aggregate
Principal
|
BKK | | | | | W-7 | | | | 6/05/14 | | | | 110 | | | $ | 2,750,000 | |
| | | | | F-7 | | | | 6/09/14 | | | | 110 | | | $ | 2,750,000 | |
| | | | | M-7 | | | | 6/10/14 | | | | 110 | | | $ | 2,750,000 | |
| ANNUAL REPORT | APRIL 30, 2014 | 71
|
| |
Report of Independent Registered Public Accounting Firm
|
To the Shareholders and Board of Directors/Trustees of
BlackRock Investment Quality Municipal Trust Inc.,
BlackRock Long-Term Municipal Advantage Trust,
BlackRock Municipal 2020 Term Trust,
BlackRock Municipal Income Trust,
BlackRock Pennsylvania Strategic Municipal Trust,
and BlackRock Strategic Municipal Trust:
We have audited the accompanying statements of assets and liabilities of BlackRock Investment Quality Municipal Trust Inc., BlackRock Long-Term Municipal Advantage Trust, BlackRock Municipal 2020 Term Trust, BlackRock Municipal Income Trust, BlackRock Pennsylvania Strategic Municipal Trust, and BlackRock Strategic Municipal Trust (collectively, the “Trusts”), including the schedules of investments, as of April 30, 2014, and the related statements of operations for the year then ended, the statements of cash flows for BlackRock Investment Quality Municipal Trust Inc., BlackRock Long-Term Municipal Advantage Trust, BlackRock Municipal Income Trust, BlackRock Pennsylvania Strategic Municipal Trust, and BlackRock Strategic Municipal Trust for the year then ended, the statements of changes in net assets for each of the two years in the period then ended and the financial highlights for each of the periods presented. These financial statements and financial highlights are the responsibility of the Trusts’ management. Our responsibility is to express an opinion on these financial statements and financial highlights based on our audits.
We conducted our audits in accordance with the standards of the Public Company Accounting Oversight Board (United States). Those standards require that we plan and perform the audit to obtain reasonable assurance about whether the financial statements and financial highlights are free of material misstatement. The Trusts are not required to have, nor were we engaged to perform, an audit of their internal control over financial reporting. Our audits included consideration of internal control over financial reporting as a basis for designing audit procedures that are appropriate in the circumstances, but not for the purpose of expressing an opinion on the effectiveness of the Trusts’ internal control over financial reporting. Accordingly, we express no such opinion. An audit also includes examining, on a test basis, evidence supporting the amounts and disclosures in the financial statements, assessing the accounting principles used and significant estimates made by management, as well as evaluating the overall financial statement presentation. Our procedures included confirmation of securities owned as of April 30, 2014, by correspondence with the custodian and brokers; where replies were not received from brokers, we performed other auditing procedures. We believe that our audits provide a reasonable basis for our opinion.
In our opinion, the financial statements and financial highlights referred to above present fairly, in all material respects, the financial position of BlackRock Investment Quality Municipal Trust Inc., BlackRock Long-Term Municipal Advantage Trust, BlackRock Municipal 2020 Term Trust, BlackRock Municipal Income Trust, BlackRock Pennsylvania Strategic Municipal Trust and BlackRock Strategic Municipal Trust as of April 30, 2014, the results of their operations for the year then ended, their cash flows for BlackRock Investment Quality Municipal Trust Inc., BlackRock Long-Term Municipal Advantage Trust, BlackRock Municipal Income Trust, BlackRock Pennsylvania Strategic Municipal Trust, and BlackRock Strategic Municipal Trust for the year then ended, the changes in their net assets for each of the two years in the period then ended and the financial highlights for each of the periods presented, in conformity with accounting principles generally accepted in the United States of America.
Deloitte & Touche LLP
Boston, Massachusetts
June 25, 2014
| 72 | ANNUAL REPORT | APRIL 30, 2014
|
| |
| Automatic Dividend Reinvestment Plan |
|
Pursuant to each Trust’s Dividend Reinvestment Plan (the “Reinvestment Plan”), Common Shareholders are automatically enrolled to have all distributions of dividends and capital gains reinvested by Computershare Trust Company, N.A. (the “Reinvestment Plan Agent”) in the respective Trust’s shares pursuant to the Reinvestment Plan. Shareholders who do not participate in the Reinvestment Plan will receive all distributions in cash paid by check and mailed directly to the shareholders of record (or if the shares are held in street or other nominee name, then to the nominee) by the Reinvestment Plan Agent, which serves as agent for the shareholders in administering the Reinvestment Plan.
After BKN, BTA, BFK, BPS and BSD declare a dividend or determine to make a capital gain distribution, the Reinvestment Plan Agent will acquire shares for the participants’ accounts, depending upon the following circumstances, either (i) through receipt of unissued but authorized shares from the Trusts (“newly issued shares”) or (ii) by purchase of outstanding shares on the open market or on the Trust���s primary exchange (“open-market purchases”). If, on the dividend payment date, the net asset value per share (“NAV”) is equal to or less than the market price per share plus estimated brokerage commissions (such condition often referred to as a “market premium”), the Reinvestment Plan Agent will invest the dividend amount in newly issued shares acquired on behalf of the participants. The number of newly issued shares to be credited to each participant’s account will be determined by dividing the dollar amount of the dividend by the NAV on the date the shares are issued. However, if the NAV is less than 95% of the market price on the dividend payment date, the dollar amount of the dividend will be divided by 95% of the market price on the dividend payment date. If, on the dividend payment date, the NAV is greater than the market price per share plus estimated brokerage commissions (such condition often referred to as a “market discount”), the Reinvestment Plan Agent will invest the dividend amount in shares acquired on behalf of the participants in open-market purchases. If the Reinvestment Plan Agent is unable to invest the full dividend amount in open-market purchases, or if the market discount shifts to a market premium during the purchase period, the Reinvestment Plan Agent will invest any un-invested portion in newly issued shares. Investments in newly issued shares made in this manner would be made pursuant to the same process described above and the date of issue for such newly issued shares will substitute for the dividend payment date.
After BKK declares a dividend or determines to make a capital gain distribution, the Reinvestment Plan Agent will acquire shares for the participants’ account by the purchase of outstanding shares on the open market, on BKK’s primary exchange (“open market purchases”). BKK will not issue any new shares under the Reinvestment Plan.
Participation in the Reinvestment Plan is completely voluntary and may be terminated or resumed at any time without penalty by notice if received and processed by the Reinvestment Plan Agent prior to the dividend record date. Additionally, the Reinvestment Plan Agent seeks to process notices received after the record date but prior to the payable date and such notices often will become effective by the payable date. Where late notices are not processed by the applicable payable date, such termination or resumption will be effective with respect to any subsequently declared dividend or other distribution.
The Reinvestment Plan Agent’s fees for the handling of the reinvestment of dividends and distributions will be paid by each Trust. However, each participant will pay a pro rata share of brokerage commissions incurred with respect to the Reinvestment Plan Agent’s open market purchases in connection with the reinvestment of dividends and distributions. The automatic reinvestment of dividends and distributions will not relieve participants of any federal income tax that may be payable on such dividends or distributions.
Each Trust reserves the right to amend or terminate the Reinvestment Plan. There is no direct service charge to participants in the Reinvestment Plan. However, each Trust reserves the right to amend the Reinvestment Plan to include a service charge payable by the participants. Participants that request a sale of shares are subject to a $2.50 sales fee and a $0.15 per share fee. Per share fees include any applicable brokerage commissions the Reinvestment Plan Agent is required to pay. All correspondence concerning the Reinvestment Plan should be directed to Computershare Trust Company, N.A. through the internet at http://www.computershare.com/blackrock, or in writing to Computershare, P.O. Box 30170, College Station, TX 77842-3170, Telephone: (800) 699-1236. Overnight correspondence should be directed to the Reinvestment Plan Agent at Computershare, 211 Quality Circle, Suite 210, College Station, TX 77845.
| ANNUAL REPORT | APRIL 30, 2014 | 73
|
Name, Address
and Year of Birth | | | | Position(s)
Held with
Trusts | | Length
of Time
Served as
a Trustee2 | | Principal Occupation(s) During Past Five Years | | Number of BlackRock-
Advised Registered
Investment Companies
(“RICs”) Consisting of
Investment Portfolios
(“Portfolios”) Overseen | | Public
Directorships |
Independent Trustees1 |
Richard E. Cavanagh
55 East 52nd Street
New York, NY 10055
1946 | | | | Chairman of
the Board
and Trustee | | Since
1994 | | Trustee, Aircraft Finance Trust from 1999 to 2009; Director, The Guardian Life Insurance Company of America since 1998; Director, Arch Chemical (chemical and allied products) from 1999 to 2011; Trustee, Educational Testing Service from 1997 to 2009 and Chairman thereof from 2005 to 2009; Senior Advisor, The Fremont Group since 2008 and Director thereof since 1996; Faculty Member/Adjunct Lecturer, Harvard University since 2007; President and Chief Executive Officer, The Conference Board, Inc. (global business research organization) from 1995 to 2007. | | 82 RICs consisting of
82 Portfolios | | None |
| |
Karen P. Robards
55 East 52nd Street
New York, NY 10055
1950 | | | | Vice Chairperson of the Board, Chairperson of the Audit Committee
and Trustee | | Since
2007 | | Partner of Robards & Company, LLC (financial advisory firm) since 1987; Co-founder and Director of the Cooke Center for Learning and Development (a not-for-profit organization) since 1987; Director of Care Investment Trust, Inc. (health care real estate investment trust) from 2007 to 2010; Investment Banker at Morgan Stanley from 1976 to 1987. | | 82 RICs consisting of
82 Portfolios | | AtriCure, Inc.
(medical devices); Greenhill & Co., Inc. |
| |
Michael J. Castellano
55 East 52nd Street
New York, NY 10055
1946 | | | | Trustee and Member of the Audit Committee | | Since
2011 | | Chief Financial Officer of Lazard Group LLC from 2001 to 2011; Chief Financial Officer of Lazard Ltd from 2004 to 2011; Director, Support Our Aging Religious (non-profit) since 2009; Director, National Advisory Board of Church Management at Villanova University since 2010; Trustee, Domestic Church Media Foundation since 2012. | | 82 RICs consisting of
82 Portfolios | | None |
| |
Frank J. Fabozzi3
55 East 52nd Street
New York, NY 10055
1948 | | | | Trustee and Member of the Audit Committee | | Since
1993 | | Editor of and Consultant for The Journal of Portfolio Management since 2006; Professor of Finance, EDHEC Business School since 2011; Professor in the Practice of Finance and Becton Fellow, Yale University School of Management from 2006 to 2011; Adjunct Professor of Finance and Becton Fellow, Yale University from 1994 to 2006. | | 115 RICs consisting of
237 Portfolios | | None |
| |
Kathleen F. Feldstein
55 East 52nd Street
New York, NY 10055
1941 | | | | Trustee | | Since
2005 | | President of Economics Studies, Inc. (private economic consulting firm) since 1987; Chair, Board of Trustees, McLean Hospital from 2000 to 2008 and Trustee Emeritus thereof since 2008; Member of the Board of Partners Community Healthcare, Inc. from 2005 to 2009; Member of the Corporation of Partners HealthCare since 1995; Trustee, Museum of Fine Arts, Boston since 1992; Member of the Visiting Committee to the Harvard University Art Museum since 2003; Director, Catholic Charities of Boston since 2009. | | 82 RICs consisting of
82 Portfolios | | The McClatchy Company (publishing) |
| |
James T. Flynn
55 East 52nd Street
New York, NY 10055
1939 | | | | Trustee and Member of the Audit Committee | | Since
2007 | | Chief Financial Officer of JPMorgan & Co., Inc. from 1990 to 1995. | | 82 RICs consisting of
82 Portfolios | | None |
| |
Jerrold B. Harris
55 East 52nd Street
New York, NY 10055
1942 | | | | Trustee | | Since
2007 | | Trustee, Ursinus College since 2000; Director, Ducks Unlimited, Inc. (conservations) since 2013; Director, Troemner LLC (scientific equipment) since 2000; Director of Delta Waterfowl Foundation from 2010 to 2012; President and Chief Executive Officer, VWR Scientific Products Corporation from 1990 to 1999. | | 82 RICs consisting of
82 Portfolios | | BlackRock Kelso Capital Corp. (business development company) |
| |
R. Glenn Hubbard
55 East 52nd Street
New York, NY 10055
1958 | | | | Trustee | | Since
2004 | | Dean, Columbia Business School since 2004; Faculty member, Columbia Business School since 1988. Director, KKR Financial Corporation (finance) from 2004 to 2014. | | 82 RICs consisting of
82 Portfolios | | ADP (data and information services); Metropolitan Life Insurance Company (insurance) |
| 74 | ANNUAL REPORT | APRIL 30, 2014
|
| |
| Officers and Trustees (continued) |
|
Name, Address
and Year of Birth | | | | Position(s)
Held with
Trusts | | Length
of Time
Served as
a Trustee2 | | Principal Occupation(s) During Past Five Years | | Number of BlackRock-
Advised Registered
Investment Companies
(“RICs”) Consisting of
Investment Portfolios
(“Portfolios”) Overseen | | Public
Directorships |
Independent Trustees1 (concluded) |
| |
W. Carl Kester
55 East 52nd Street
New York, NY 10055
1951 | | | | Trustee and Member of the Audit Committee | | Since
2007 | | George Fisher Baker Jr. Professor of Business Administration, Harvard Business School since 2008; Deputy Dean for Academic Affairs from 2006 to 2010; Chairman of the Finance Unit, 2005 to 2006; Senior Associate Dean and Chairman of the MBA Program from 1999 to 2005; Member of the faculty of Harvard Business School since 1981. | | 82 RICs consisting of
82 Portfolios | | None |
| |
| | | | | 1 Independent Trustees serve until their resignation, removal or death, or until December 31 of the year in which they turn 74. The maximum age limitation may be waived as to any Trustee by action of a majority of the Trustees upon finding good cause thereof. In 2013, the Board of Trustees unanimously approved extending the mandatory retirement age for James T. Flynn by one additional year, which the Board believed would be in the best interest of shareholders. Mr. Flynn can serve until December 31 of the year in which he turns 75. Mr. Flynn turns 75 in 2014. |
| | | | | 2 Date shown is the earliest date a person has served for the Trusts covered by this annual report. Following the combination of Merrill Lynch Investment Managers, L.P. (“MLIM”) and BlackRock, Inc. (“BlackRock”) in September 2006, the various legacy MLIM and legacy BlackRock fund boards were realigned and consolidated into three new fund boards in 2007. As a result, although the chart shows certain Trustees as joining the Trusts’ board in 2007, those Trustees first became members of the boards of other legacy MLIM or legacy BlackRock funds as follows: Richard E. Cavanagh, 1994; Frank J. Fabozzi, 1988; Kathleen F. Feldstein, 2005; James T. Flynn, 1996; Jerrold B. Harris, 1999; R. Glenn Hubbard, 2004; W. Carl Kester, 1995 and Karen P. Robards, 1998. |
| | | | | 3 Dr. Fabozzi is also a board member of the BlackRock Equity-Liquidity Complex. |
| | | | | | | | | | | | | | | | | | | | | | | |
Interested Trustees4 | | |
| |
Paul L. Audet
55 East 52nd Street
New York, NY 10055
1953 | | | | Trustee | | Since
2011 | | Senior Managing Director of BlackRock and Head of U.S. Mutual Funds since 2011; Head of BlackRock’s Real Estate business from 2008 to 2011; Member of BlackRock’s Global Operating and Corporate Risk Management Committees since 2008; Head of BlackRock’s Global Cash Management business from 2005 to 2010; Acting Chief Financial Officer of BlackRock from 2007 to 2008; Chief Financial Officer of BlackRock from 1998 to 2005. | | 144 RICs consisting of
333 Portfolios | | None |
| |
Henry Gabbay
55 East 52nd Street
New York, NY 10055
1947 | | | | Trustee | | Since
2007 | | Consultant, BlackRock from 2007 to 2008; Managing Director, BlackRock from 1989 to 2007; Chief Administrative Officer, BlackRock Advisors, LLC from 1998 to 2007; President of BlackRock Funds and BlackRock Allocation Target Shares (formerly BlackRock Bond Allocation Target Shares) from 2005 to 2007; Treasurer of certain closed-end funds in the BlackRock fund complex from 1989 to 2006. | | 144 RICs consisting of
333 Portfolios | | None |
| |
| | | | | 4 Mr. Audet is an “interested person,” as defined in the 1940 Act, of the Trusts based on his position with BlackRock and its affiliates as well as his ownership of BlackRock securities. Mr. Gabbay is an “interested person” of the Trusts based on his former positions with BlackRock and its affiliates as well as his ownership of BlackRock and The PNC Financial Services Group, Inc. securities. Mr. Audet and Mr. Gabbay are also Directors of two complexes of BlackRock registered open-end funds, the BlackRock Equity-Liquidity Complex and the BlackRock Equity-Bond Complex. Interested Trustees of the BlackRock Closed-End Complex serve until their resignation, removal or death, or until December 31 of the year in which they turn 72. The maximum age limitation may be waived as to any Trustee by action of a majority of the Trustees upon finding a good cause thereof. |
| ANNUAL REPORT | APRIL 30, 2014 | 75
|
| |
| Officers and Trustees (concluded) |
|
Name, Address
and Year of Birth | | | | Position(s)
Held with
Trusts | | Length of
Time Served | | Principal Occupation(s) During Past Five Years |
Officers1 |
| |
John M. Perlowski
55 East 52nd Street
New York, NY 10055
1964 | | | | President and Chief Executive Officer | | Since
2011 | | Managing Director of BlackRock since 2009; Global Head of BlackRock Fund Services since 2009; Managing Director and Chief Operating Officer of the Global Product Group at Goldman Sachs Asset Management, L.P. from 2003 to 2009; Treasurer of Goldman Sachs Mutual Funds from 2003 to 2009 and Senior Vice President thereof from 2007 to 2009; Director of Goldman Sachs Offshore Funds from 2002 to 2009; Director of Family Resource Network (charitable foundation) since 2009. |
| |
Brendan Kyne
55 East 52nd Street
New York, NY 10055
1977 | | | | Vice
President | | Since
2009 | | Managing Director of BlackRock, Inc. since 2010; Director of BlackRock, Inc. from 2008 to 2009; Head of Americas Product Development for BlackRock since 2013, Head of Product Development and Management for BlackRock’s U.S. Retail Group from 2009 to 2013 and Co-head thereof from 2007 to 2009; Vice President of BlackRock, Inc. from 2005 to 2008. |
| |
Robert W. Crothers
55 East 52nd Street
New York, NY 10055
1981 | | | | Vice
President | | Since
2012 | | Director of BlackRock since 2011; Vice President of BlackRock from 2008 to 2010. |
| |
Neal Andrews
55 East 52nd Street
New York, NY 10055
1966 | | | | Chief
Financial
Officer | | Since
2007 | | Managing Director of BlackRock since 2006; Senior Vice President and Line of Business Head of Fund Accounting and Administration at PNC Global Investment Servicing (U.S.) Inc. from 1992 to 2006. |
| |
Jay Fife
55 East 52nd Street
New York, NY 10055
1970 | | | | Treasurer | | Since
2007 | | Managing Director of BlackRock since 2007; Director of BlackRock in 2006; Assistant Treasurer of the MLIM and Fund Asset Management, L.P. advised funds from 2005 to 2006; Director of MLIM Fund Services Group from 2001 to 2006. |
| |
Brian Kindelan
55 East 52nd Street
New York, NY 10055
1959 | | | | Chief Compliance Officer and
Anti-Money Laundering Officer | | Since
2007 | | Chief Compliance Officer of the BlackRock-advised funds since 2007; Managing Director and Senior Counsel of BlackRock since 2005. |
| |
Janey Ahn
55 East 52nd Street
New York, NY 10055
1975 | | | | Secretary | | Since
2012 | | Director of BlackRock since 2009; Vice President of BlackRock from 2008 to 2009; Assistant Secretary of the Funds from 2008 to 2012. |
| | | | | 1 Officers of the Trusts serve at the pleasure of the Boards. |
Investment Advisor
BlackRock Advisors, LLC
Wilmington, DE 19809
| | | | Custodian and
Accounting Agent
State Street Bank and
Trust Company
Boston, MA 02110
| | AMPS Auction Agent
The Bank of New York
Mellon
New York, NY 10286
| | VRDP Liquidity Provider
Citibank, N.A.
New York, NY 10179 | | Independent Registered
Public Accounting Firm
Deloitte & Touche LLP
Boston, MA 02116
| | | | |
Sub-Advisor
BlackRock Financial
Management, Inc.
New York, NY 10022
| | | | Transfer Agent
Common Shares:
Computershare Trust
Company, N.A.
Canton, MA 02021
| | VRDP Tender and Paying
Agent and VMTP Redemption
and Paying Agent
The Bank of New York Mellon
New York, NY 10289
| | VRDP Remarketing Agent
CitiGroup Global Markets, Inc.
New York, NY 10179 | | Legal Counsel
Skadden, Arps, Slate,
Meagher & Flom LLP
New York, NY 10036
Address of the Trusts
100 Bellevue Parkway
Wilmington, DE 19809 | | | | |
| Effective June 6, 2014, Brian Kindelan resigned as Chief Compliance Officer and Anti-Money Laundering Officer of the Trusts and Charles Park became Chief Compliance Officer and Anti-Money Laundering Officer of the Trusts. Mr. Park joined BlackRock in 2009 and is the current Chief Compliance Officer of BlackRock’s iShares exchange traded funds. |
| 76 | ANNUAL REPORT | APRIL 30, 2014
|
Trust Certification
Certain Trusts are listed for trading on the NYSE and have filed with the NYSE their annual chief executive officer certification regarding compliance with the NYSE’s listing standards. The Trusts filed with the SEC the certification of its chief executive officer and chief financial officer required by section 302 of the Sarbanes-Oxley Act.
Dividend Policy
Each Trust’s dividend policy is to distribute all or a portion of its net investment income to its shareholders on a monthly basis. In order to provide shareholders with a more stable level of dividend distributions, the Trusts may at times pay out less than the entire amount of net investment income earned in any particular month and may at times in any particular month pay out such accumulated but undistributed income in addition to net investment income earned in that month. As a result, the dividends paid by the Trusts for any particular month may be more or less than the amount of net investment income earned by the Trusts during such month. The Trusts’ current accumulated but undistributed net investment income, if any, is disclosed in the Statements of Assets and Liabilities, which comprises part of the financial information included in this report.
General Information
The Trusts do not make available copies of their Statements of Additional Information because the Trusts’ shares are not continuously offered, which means that the Statement of Additional Information of each Trust has not been updated after completion of the respective Trust’s offerings and the information contained in each Trust’s Statement of Additional Information may have become outdated.
During the period, other than as described above, there were no material changes in the Trusts’ investment objectives or policies or to the Trusts’ charters or by-laws that would delay or prevent a change of control of the Trusts that were not approved by the shareholders or in the principal risk factors associated with investment in the Trusts. There have been no changes in the persons who are primarily responsible for the day-to-day management of the Trusts’ portfolios.
Quarterly performance, semi-annual and annual reports, current net asset value and other information regarding the Trusts may be found on BlackRock’s website, which can be accessed at http://www.blackrock.com. This reference to BlackRock’s website is intended to allow investors public access to information regarding the Trusts and does not, and is not intended to, incorporate BlackRock’s website in this report.
| ANNUAL REPORT | APRIL 30, 2014 | 77
|
| |
| Additional Information (concluded) |
|
General Information (concluded)
Electronic Delivery
Electronic copies of most financial reports are available on the Trusts’ web-site or shareholders can sign up for e-mail notifications of quarterly statements, annual and semi-annual reports by enrolling in the Trusts’ electronic delivery program.
Shareholders Who Hold Accounts with Investment Advisors, Banks or Brokerages:
Please contact your financial advisor to enroll. Please note that not all investment advisors, banks or brokerages may offer this service.
Householding
The Trusts will mail only one copy of shareholder documents, including annual and semi-annual reports and proxy statements, to shareholders with multiple accounts at the same address. This practice is commonly called “householding” and is intended to reduce expenses and eliminate duplicate mailings of shareholder documents. Mailings of your shareholder documents may be householded indefinitely unless you instruct us otherwise. If you do not want the mailing of these documents to be combined with those for other members of your household, please call the Trusts at (800) 882-0052.
Availability of Quarterly Schedule of Investments
The Trusts file their complete schedule of portfolio holdings with the SEC for the first and third quarters of each fiscal year on Form N-Q. The Trusts’ Forms N-Q are available on the SEC’s website at http://www.sec.gov and may also be reviewed and copied at the SEC’s Public Reference Room in Washington, DC. Information on how to access documents on the SEC’s website without charge may be obtained by calling (800) SEC-0330. The Trusts’ Forms N-Q may also be obtained upon request and without charge by calling (800) 882-0052.
Availability of Proxy Voting Policies and Procedures
A description of the policies and procedures that the Trusts use to determine how to vote proxies relating to portfolio securities is available (1) without charge, upon request, by calling (800) 882-0052; (2) at
http://www.blackrock.com; and (3) on the SEC’s website at http://www.sec.gov.
Availability of Proxy Voting Record
Information about how the Trusts voted proxies relating to securities held in the Trusts’ portfolios during the most recent 12-month period ended June 30 is available upon request and without charge (1) at http://www.blackrock.com or by calling (800) 882-0052 and (2) on the SEC’s website at http://www.sec.gov.
Availability of Trust Updates
BlackRock will update performance and certain other data for the Trusts on a monthly basis on its website in the “Closed-end Funds” section of http://www.blackrock.com as well as certain other material information as necessary from time to time. Investors and others are advised to periodically check the website for updated performance information and the release of other material information about the Trusts. This reference to BlackRock’s website is intended to allow investors public access to information regarding the Trusts and does not, and is not intended to, incorporate BlackRock’s website in this report.
BlackRock Privacy Principles
BlackRock is committed to maintaining the privacy of its current and former fund investors and individual clients (collectively, “Clients”) and to safeguarding their non-public personal information. The following information is provided to help you understand what personal information BlackRock collects, how we protect that information and why in certain cases we share such information with select parties.
If you are located in a jurisdiction where specific laws, rules or regulations require BlackRock to provide you with additional or different privacy-related rights beyond what is set forth below, then BlackRock will comply with those specific laws, rules or regulations.
BlackRock obtains or verifies personal non-public information from and about you from different sources, including the following: (i) information we receive from you or, if applicable, your financial intermediary, on applications, forms or other documents; (ii) information about your transactions with us, our affiliates, or others; (iii) information we receive from a consumer reporting agency; and (iv) from visits to our websites.
BlackRock does not sell or disclose to non-affiliated third parties any non-public personal information about its Clients, except as permitted by law or as is necessary to respond to regulatory requests or to service Client accounts. These non-affiliated third parties are required to protect the confidentiality and security of this information and to use it only for its intended purpose.
We may share information with our affiliates to service your account or to provide you with information about other BlackRock products or services that may be of interest to you. In addition, BlackRock restricts access to non-public personal information about its Clients to those BlackRock employees with a legitimate business need for the information. BlackRock maintains physical, electronic and procedural safeguards that are designed to protect the non-public personal information of its Clients, including procedures relating to the proper storage and disposal of such information.
| 78 | ANNUAL REPORT | APRIL 30, 2014
|
[THIS PAGE INTENTIONALLY LEFT BLANK]
This report is transmitted to shareholders only. It is not a prospectus. Past performance results shown in this report should not be considered a representation of future performance. Certain Trusts have leveraged their Common Shares, which creates risks for Common Shareholders, including the likelihood of greater volatility of net asset value and market price of the Common Shares, and the risk that fluctuations in the dividend rates of the Preferred Shares, including AMPS, which are currently set at the maximum reset rate as a result of failed auctions, may reduce the Common Shares’ yield. Statements and other information herein are as dated and are subject to change.
CEMUNI6-4/14-AR | | | | | 
| |
Item 2 – Code of Ethics – The registrant (or the “Fund”) has adopted a code of ethics, as of the end of the period covered by this report, applicable to the registrant’s principal executive officer, principal financial officer, principal accounting officer or controller, or persons performing similar functions. During the period covered by this report, there have been no amendments to or waivers granted under the code of ethics. A copy of the code of ethics is available without charge at www.blackrock.com.
Item 3 – Audit Committee Financial Expert – The registrant’s board of directors (the “board of directors”), has determined that (i) the registrant has the following audit committee financial experts serving on its audit committee and (ii) each audit committee financial expert is independent:
Michael Castellano
Frank J. Fabozzi
James T. Flynn
W. Carl Kester
Karen P. Robards
The registrant’s board of directors has determined that W. Carl Kester and Karen P. Robards qualify as financial experts pursuant to Item 3(c)(4) of Form N-CSR.
Prof. Kester has a thorough understanding of generally accepted accounting principles, financial statements and internal control over financial reporting as well as audit committee functions. Prof. Kester has been involved in providing valuation and other financial consulting services to corporate clients since 1978. Prof. Kester’s financial consulting services present a breadth and level of complexity of accounting issues that are generally comparable to the breadth and complexity of issues that can reasonably be expected to be raised by the registrant’s financial statements.
Ms. Robards has a thorough understanding of generally accepted accounting principles, financial statements and internal control over financial reporting as well as audit committee functions. Ms. Robards has been President of Robards & Company, a financial advisory firm, since 1987. Ms. Robards was formerly an investment banker for more than 10 years where she was responsible for evaluating and assessing the performance of companies based on their financial results. Ms. Robards has over 30 years of experience analyzing financial statements. She also is a member of the audit committee of one publicly held company and a non-profit organization.
Under applicable securities laws, a person determined to be an audit committee financial expert will not be deemed an “expert” for any purpose, including without limitation for the purposes of Section 11 of the Securities Act of 1933, as a result of being designated or identified as an audit committee financial expert. The designation or identification as an audit committee financial expert does not impose on such person any duties, obligations, or liabilities greater than the duties, obligations, and liabilities imposed on such person as a member of the audit committee and board of directors in the absence of such designation or identification. The designation or identification of a person as an audit committee financial expert does not affect the duties, obligations, or liability of any other member of the audit committee or board of directors.
Item 4 – Principal Accountant Fees and Services
The following table presents fees billed by Deloitte & Touche LLP (“D&T”) in each of the last two fiscal years for the services rendered to the Fund:
| | (a) Audit Fees | (b) Audit-Related Fees1 | (c) Tax Fees2 | (d) All Other Fees3 |
| Entity Name | Current Fiscal Year End | Previous Fiscal Year End | Current Fiscal Year End | Previous Fiscal Year End | Current Fiscal Year End | Previous Fiscal Year End | Current Fiscal Year End | Previous Fiscal Year End |
| BlackRock Long-Term Municipal Advantage Trust | $32,263 | $31,563 | $0 | $0 | $10,800 | $10,800 | $0 | $0 |
The following table presents fees billed by D&T that were required to be approved by the registrant’s audit committee (the “Committee”) for services that relate directly to the operations or financial reporting of the Fund and that are rendered on behalf of BlackRock Advisors, LLC (“Investment Adviser” or “BlackRock”) and entities controlling, controlled by, or under common control with BlackRock (not including any sub-adviser whose role is primarily portfolio management and is subcontracted with or overseen by another investment adviser) that provide ongoing services to the Fund (“Fund Service Providers”):
| | Current Fiscal Year End | Previous Fiscal Year End |
| (b) Audit-Related Fees1 | $0 | $0 |
| (c) Tax Fees2 | $0 | $0 |
| (d) All Other Fees3 | $2,555,000 | $2,865,000 |
1 The nature of the services includes assurance and related services reasonably related to the performance of the audit of financial statements not included in Audit Fees.
2 The nature of the services includes tax compliance, tax advice and tax planning.
3 Aggregate fees borne by BlackRock in connection with the review of compliance procedures and attestation thereto performed by D&T with respect to all of the registered closed-end funds and some of the registered open-end funds advised by BlackRock.
(e)(1) Audit Committee Pre-Approval Policies and Procedures:
The Committee has adopted policies and procedures with regard to the pre-approval of services. Audit, audit-related and tax compliance services provided to the registrant on an annual basis require specific pre-approval by the Committee. The Committee also must approve other non-audit services provided to the registrant and those non-audit services provided to the Investment Adviser and Fund Service Providers that relate directly to the operations and the financial reporting of the registrant. Certain of these non-audit services that the Committee believes are (a) consistent with the SEC’s auditor independence rules and (b) routine and recurring services that will not impair the independence of the independent accountants may be approved by the Committee without consideration on a specific case-by-case basis (“general pre-approval”). The term of any general pre-approval is 12 months from the date of the pre-approval, unless the Committee provides for a different period. Tax or other non-audit services provided to the registrant which have a direct impact on the operations or financial reporting of the registrant will only be deemed pre-approved provided that any individual project does not exceed $10,000 attributable to the registrant or $50,000 per project. For this purpose, multiple projects will be aggregated to determine if they exceed the previously mentioned cost levels.
Any proposed services exceeding the pre-approved cost levels will require specific pre-approval by the Committee, as will any other services not subject to general pre-approval (e.g.,
unanticipated but permissible services). The Committee is informed of each service approved subject to general pre-approval at the next regularly scheduled in-person board meeting. At this meeting, an analysis of such services is presented to the Committee for ratification. The Committee may delegate to the Committee Chairman the authority to approve the provision of and fees for any specific engagement of permitted non-audit services, including services exceeding pre-approved cost levels.
(e)(2) None of the services described in each of Items 4(b) through (d) were approved by the Committee pursuant to the de minimis exception in paragraph (c)(7)(i)(C) of Rule 2-01 of Regulation S-X.
(f) Not Applicable
(g) The aggregate non-audit fees paid to the accountant for services rendered by the accountant to the registrant, the Investment Adviser and the Fund Service Providers were:
| Entity Name | Current Fiscal
Year End | Previous Fiscal Year End |
| BlackRock Long-Term Municipal Advantage Trust | $10,800 | $10,800 |
Additionally, SSAE 16 Review (Formerly, SAS No. 70) fees for the current and previous fiscal years of $2,555,000 and $2,865,000, respectively, were billed by D&T to the Investment Adviser.
(h) The Committee has considered and determined that the provision of non-audit services that were rendered to the Investment Adviser, and the Fund Service Providers that were not pre-approved pursuant to paragraph (c)(7)(ii) of Rule 2-01 of Regulation S-X is compatible with maintaining the principal accountant’s independence.
Item 5 – Audit Committee of Listed Registrants
(a) The following individuals are members of the registrant’s separately-designated standing audit committee established in accordance with Section 3(a)(58)(A) of the Securities Exchange Act of 1934 (15 U.S.C. 78c(a)(58)(A)):
Michael Castellano
Frank J. Fabozzi
James T. Flynn
W. Carl Kester
Karen P. Robards
(b) Not Applicable
Item 6 – Investments
(a) The registrant’s Schedule of Investments is included as part of the Report to Stockholders filed under Item 1 of this Form.
(b) Not Applicable due to no such divestments during the semi-annual period covered since the previous Form N-CSR filing.
Item 7 – Disclosure of Proxy Voting Policies and Procedures for Closed-End Management Investment Companies – The board of directors has delegated the voting of proxies for the Fund’s portfolio securities to the Investment Adviser pursuant to the Investment Adviser’s proxy voting guidelines. Under these guidelines, the Investment Adviser will vote proxies related to Fund securities in the best interests of the Fund and its stockholders. From time to time, a vote may present a conflict between the interests of the Fund’s stockholders, on the one hand, and those of the Investment Adviser, or any affiliated person of the Fund or the Investment Adviser, on the other. In such event, provided that the Investment Adviser’s Equity Investment Policy Oversight Committee, or a sub-committee thereof (the “Oversight Committee”) is aware of the real or potential conflict or material non-routine matter and if the Oversight Committee does not reasonably believe it is able to follow its general voting guidelines (or if the particular proxy matter is not addressed in the guidelines) and vote impartially, the Oversight Committee may retain an independent fiduciary to advise the Oversight Committee on how to vote or to cast votes on behalf of the Investment Adviser’s clients. If the Investment Adviser determines not to retain an independent fiduciary, or does not desire to follow the advice of such independent fiduciary, the Oversight Committee shall determine how to vote the proxy after consulting with the Investment Adviser’s Portfolio Management Group and/or the Investment Adviser’s Legal and Compliance Department and concluding that the vote cast is in its client’s best interest notwithstanding the conflict. A copy of the Fund’s Proxy Voting Policy and Procedures are attached as Exhibit 99.PROXYPOL. Information on how the Fund voted proxies relating to portfolio securities during the most recent 12-month period ended June 30 is available without charge, (i) at www.blackrock.com and (ii) on the SEC’s website at http://www.sec.gov.
Item 8 – Portfolio Managers of Closed-End Management Investment Companies – as of April 30, 2014.
(a)(1) The registrant is managed by a team of investment professionals comprised of Theodore R. Jaeckel, Jr., CFA, Managing Director at BlackRock and Walter O’Connor, Managing Director at BlackRock. Each is a member of BlackRock’s municipal tax-exempt management group. Each is jointly responsible for the day-to-day management of the registrant’s portfolio, which includes setting the registrant’s overall investment strategy, overseeing the management of the registrant and selection of its investments. Messrs. Jaeckel and O’Connor have been members of the registrant’s portfolio management team since 2006 and 2006, respectively.
| Portfolio Manager | Biography |
| Theodore R. Jaeckel, Jr. | Managing Director of BlackRock since 2006; Managing Director of Merrill Lynch Investment Managers, L.P. (“MLIM”) from 2005 to 2006; Director of MLIM from 1997 to 2005. |
| Walter O’Connor | Managing Director of BlackRock since 2006; Managing Director of MLIM from 2003 to 2006; Director of MLIM from 1998 to 2003. |
(a)(2) As of April 30, 2014:
| | (ii) Number of Other Accounts Managed and Assets by Account Type | (iii) Number of Other Accounts and Assets for Which Advisory Fee is Performance-Based |
(i) Name of Portfolio Manager | Other Registered Investment Companies | Other Pooled Investment Vehicles | Other Accounts | Other Registered Investment Companies | Other Pooled Investment Vehicles | Other Accounts | |
| Theodore R. Jaeckel, Jr. | 63 | 0 | 0 | 0 | 0 | 0 |
| | $25.09 Billion | $0 | $0 | $0 | $0 | $0 |
| Walter O’Connor | 63 | 0 | 0 | 0 | 0 | 0 |
| | $25.09 Billion | $0 | $0 | $0 | $0 | $0 |
(iv) Potential Material Conflicts of Interest
BlackRock has built a professional working environment, firm-wide compliance culture and compliance procedures and systems designed to protect against potential incentives that may favor one account over another. BlackRock has adopted policies and procedures that address the allocation of investment opportunities, execution of portfolio transactions, personal trading by employees and other potential conflicts of interest that are designed to ensure that all client accounts are treated equitably over time. Nevertheless, BlackRock furnishes investment management and advisory services to numerous clients in addition to the Fund, and BlackRock may, consistent with applicable law, make investment recommendations to other clients or accounts (including accounts which are hedge funds or have performance or higher fees paid to BlackRock, or in which portfolio managers have a personal interest in the receipt of such fees), which may be the same as or different from those made to the Fund. In addition, BlackRock, Inc. its affiliates and significant shareholders and any officer, director, shareholder or employee may or may not have an interest in the securities whose purchase and sale BlackRock recommends to the Fund. BlackRock, Inc. or any of its affiliates or significant shareholders, or any officer, director, shareholder, employee or any member of their families may take different actions than those recommended to the Fund by BlackRock with respect to the same securities. Moreover, BlackRock may refrain from rendering any advice or services concerning securities of companies of which any of BlackRock, Inc.’s (or its affiliates’ or significant shareholders’) officers, directors or employees are directors or officers, or companies as to which BlackRock, Inc. or any of its affiliates or significant shareholders or the officers, directors and employees of any of them has any substantial economic interest or possesses material non-public information. Certain portfolio managers also may manage accounts whose investment strategies may at times be opposed to the strategy utilized for a fund. It should also be noted that a portfolio manager may be managing certain hedge fund and/or long only accounts, or may be part of a team managing certain hedge fund and/or long only accounts, subject to incentive fees. Such portfolio managers may therefore be entitled to receive a portion of any incentive fees earned on such accounts. Currently, the portfolio managers of this fund are not entitled to receive a portion of incentive fees of other accounts.
As a fiduciary, BlackRock owes a duty of loyalty to its clients and must treat each client fairly. When BlackRock purchases or sells securities for more than one account, the trades must be allocated in a manner consistent with its fiduciary duties. BlackRock attempts to allocate investments in a fair and equitable manner among client accounts, with no account receiving preferential treatment. To this end, BlackRock, Inc. has adopted policies that are intended to ensure reasonable efficiency in client transactions and provide BlackRock with sufficient
flexibility to allocate investments in a manner that is consistent with the particular investment discipline and client base, as appropriate.
(a)(3) As of April 30, 2014:
Portfolio Manager Compensation Overview
The discussion below describes the portfolio managers’ compensation as of April 30, 2014.
BlackRock’s financial arrangements with its portfolio managers, its competitive compensation and its career path emphasis at all levels reflect the value senior management places on key resources. Compensation may include a variety of components and may vary from year to year based on a number of factors. The principal components of compensation include a base salary, a performance-based discretionary bonus, participation in various benefits programs and one or more of the incentive compensation programs established by BlackRock.
Base compensation. Generally, portfolio managers receive base compensation based on their position with the firm.
Discretionary Incentive Compensation
Discretionary incentive compensation is a function of several components: the performance of BlackRock, Inc., the performance of the portfolio manager’s group within BlackRock, the investment performance, including risk-adjusted returns, of the firm’s assets under management or supervision by that portfolio manager relative to predetermined benchmarks, and the individual’s performance and contribution to the overall performance of these portfolios and BlackRock. In most cases, these benchmarks are the same as the benchmark or benchmarks against which the performance of the Funds or other accounts managed by the portfolio managers are measured. Among other things, BlackRock’s Chief Investment Officers make a subjective determination with respect to each portfolio manager’s compensation based on the performance of the Funds and other accounts managed by each portfolio manager relative to the various benchmarks. Performance of fixed income funds is measured on a pre-tax and/or after-tax basis over various time periods including 1-, 3- and 5- year periods, as applicable. With respect to these portfolio managers, such benchmarks for the Fund and other accounts are: a combination of market-based indices (e.g., Standard & Poor’s Municipal Bond Index), certain customized indices and certain fund industry peer groups.
Distribution of Discretionary Incentive Compensation. Discretionary incentive compensation is distributed to portfolio managers in a combination of cash and BlackRock, Inc. restricted stock units which vest ratably over a number of years. For some portfolio managers, discretionary incentive compensation is also distributed in deferred cash awards that notionally track the returns of select BlackRock investment products they manage and that vest ratably over a number of years. The BlackRock, Inc. restricted stock units, upon vesting, will be settled in BlackRock, Inc. common stock. Typically, the cash portion of the discretionary incentive compensation, when combined with base salary, represents more than 60% of total compensation for the portfolio managers. Paying a portion of discretionary incentive compensation in BlackRock, Inc. stock puts compensation earned by a portfolio manager for a given year “at risk” based on
BlackRock’s ability to sustain and improve its performance over future periods. Providing a portion of discretionary incentive compensation in deferred cash awards that notionally track the BlackRock investment products they manage provides direct alignment with investment product results.
Long-Term Incentive Plan Awards — From time to time long-term incentive equity awards are granted to certain key employees to aid in retention, align their interests with long-term shareholder interests and motivate performance. Equity awards are generally granted in the form of BlackRock, Inc. restricted stock units that, once vested, settle in BlackRock, Inc. common stock. Messrs. Jaeckel and O’Connor have unvested long-term incentive awards.
Deferred Compensation Program — A portion of the compensation paid to eligible United States-based BlackRock employees may be voluntarily deferred at their election for defined periods of time into an account that tracks the performance of certain of the firm’s investment products. Any portfolio manager who is either a managing director or director at BlackRock with compensation above a specified threshold is eligible to participate in the deferred compensation program.
Other compensation benefits. In addition to base salary and discretionary incentive compensation, portfolio managers may be eligible to receive or participate in one or more of the following:
Incentive Savings Plans — BlackRock, Inc. has created a variety of incentive savings plans in which BlackRock, Inc. employees are eligible to participate, including a 401(k) plan, the BlackRock Retirement Savings Plan (RSP), and the BlackRock Employee Stock Purchase Plan (ESPP). The employer contribution components of the RSP include a company match equal to 50% of the first 8% of eligible pay contributed to the plan capped at $5,000 per year, and a company retirement contribution equal to 3-5% of eligible compensation up to the Internal Revenue Service limit ($260,000 for 2014). The RSP offers a range of investment options, including registered investment companies and collective investment funds managed by the firm. BlackRock, Inc. contributions follow the investment direction set by participants for their own contributions or, absent participant investment direction, are invested into a target date fund that corresponds to, or is closest to, the year in which the participant attains age 65. The ESPP allows for investment in BlackRock, Inc. common stock at a 5% discount on the fair market value of the stock on the purchase date. Annual participation in the ESPP is limited to the purchase of 1,000 shares of common stock or a dollar value of $25,000 based on its fair market value on the purchase date. All of the eligible portfolio managers are eligible to participate in these plans.
(a)(4) Beneficial Ownership of Securities – As of April 30, 2014.
| Portfolio Manager | Dollar Range of Equity Securities
of the Fund Beneficially Owned |
| Theodore R. Jaeckel, Jr. | None |
| Walter O’Connor | None |
(b) Not Applicable
Item 9 – Purchases of Equity Securities by Closed-End Management Investment Company and Affiliated Purchasers – Not Applicable due to no such purchases during the period covered by this report.
Item 10 – Submission of Matters to a Vote of Security Holders – There have been no material changes to these procedures.
Item 11 – Controls and Procedures
(a) – The registrant’s principal executive and principal financial officers, or persons performing similar functions, have concluded that the registrant’s disclosure controls and procedures (as defined in Rule 30a-3(c) under the Investment Company Act of 1940, as amended (the “1940 Act”)) are effective as of a date within 90 days of the filing of this report based on the evaluation of these controls and procedures required by Rule 30a-3(b) under the 1940 Act and Rule 13a-15(b) under the Securities Exchange Act of 1934, as amended.
(b) – There were no changes in the registrant’s internal control over financial reporting (as defined in Rule 30a-3(d) under the 1940 Act) that occurred during the second fiscal quarter of the period covered by this report that have materially affected, or are reasonably likely to materially affect, the registrant’s internal control over financial reporting.
Item 12 – Exhibits attached hereto
(a)(1) – Code of Ethics – See Item 2
(a)(2) – Certifications – Attached hereto
(a)(3) – Not Applicable
(b) – Certifications – Attached hereto
Pursuant to the requirements of the Securities Exchange Act of 1934 and the Investment Company Act of 1940, the registrant has duly caused this report to be signed on its behalf by the undersigned, thereunto duly authorized.
BlackRock Long-Term Municipal Advantage Trust
| | By: | /s/ John M. Perlowski |
| | | John M. Perlowski |
| | | Chief Executive Officer (principal executive officer) of |
| | | BlackRock Long-Term Municipal Advantage Trust |
Date: July 1, 2014
Pursuant to the requirements of the Securities Exchange Act of 1934 and the Investment Company Act of 1940, this report has been signed below by the following persons on behalf of the registrant and in the capacities and on the dates indicated.
| | By: | /s/ John M. Perlowski |
| | | John M. Perlowski |
| | | Chief Executive Officer (principal executive officer) of |
| | | BlackRock Long-Term Municipal Advantage Trust |
Date: July 1, 2014
| | By: | /s/ Neal J. Andrews |
| | | Neal J. Andrews |
| | | Chief Financial Officer (principal financial officer) of |
| | | BlackRock Long-Term Municipal Advantage Trust |
Date: July 1, 2014