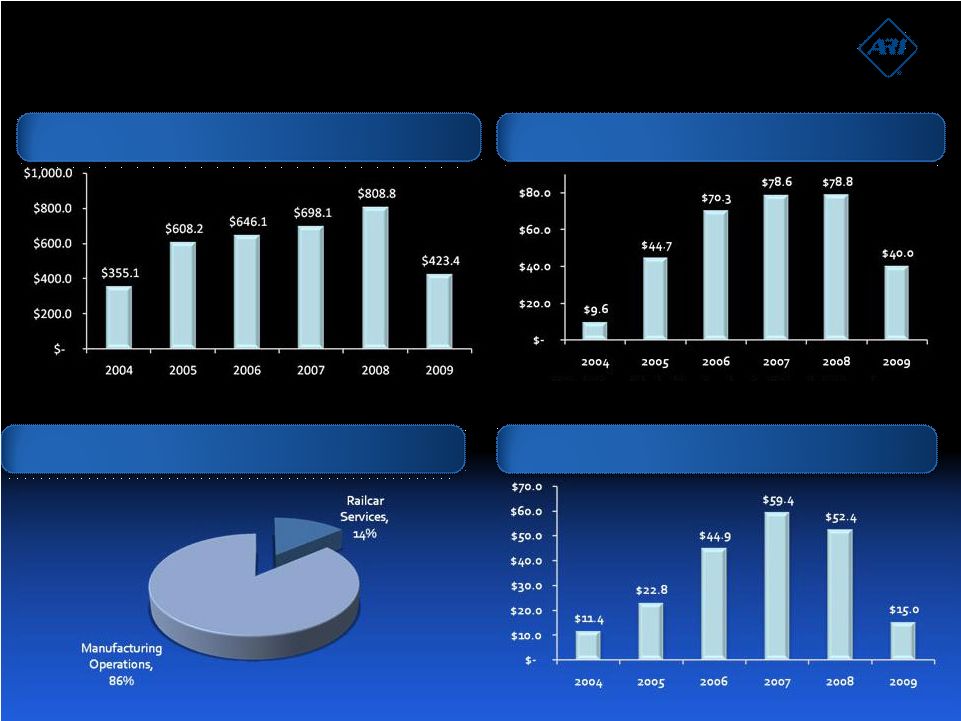
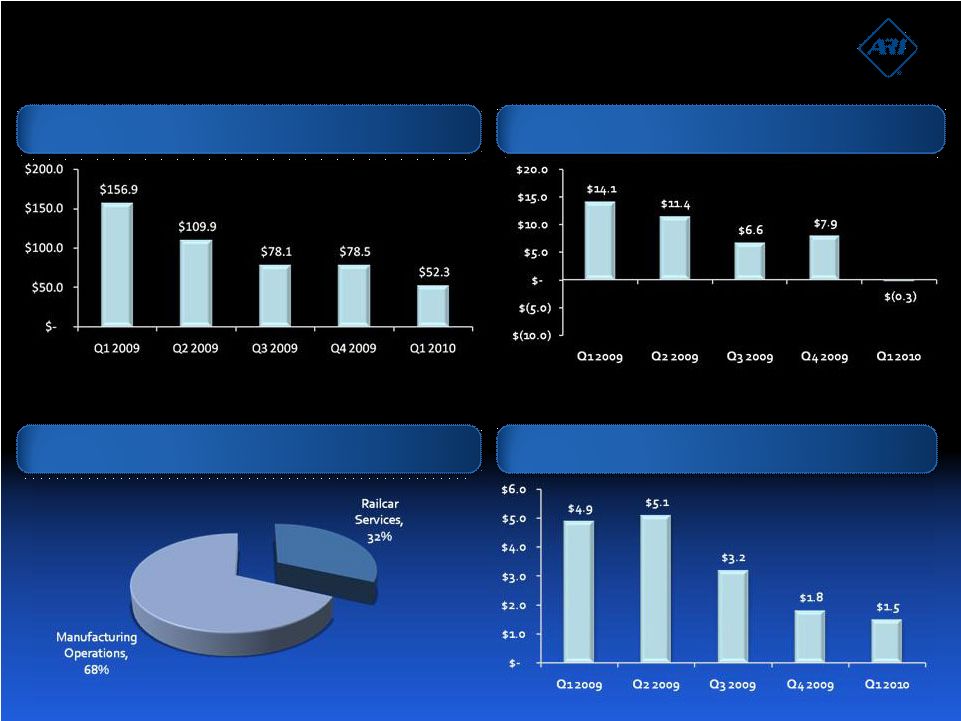
2004 2005 2006 2007 2008 2009 Net (loss) earnings $ 1,921 $ 14,768 $ 35,204 $ 37,264 $ 31,382 $ 15,458 Income tax (benefit) expense 2,191 9,356 20,752 22,104 18,403 6,568 Interest expense 3,667 4,846 1,372 17,027 20,299 20,909 Interest income (4,422) (1,658) (1,504) (13,829) (7,835) (6,613) Depreciation 5,865 6,521 10,674 14,085 20,148 23,405 EBITDA $ 9,222 $ 33,833 $ 66,498 $ 76,651 $ 82,397 $ 59,727 Expense related to stock option compensation $ - $ - $ 8,116 $ 1,628 $ 109 $ - Expense (income) related to stock appreciation rights compensation - - - 299 (47) 1,174 Gain on asset conversion, net - - (4,323) - - - Retirement benefit plan expense - 10,911 - - - - Other (income) loss on short-term investment activity - - - - (3,657) (20,858) Adjusted EBITDA $ 9,222 $ 44,744 $ 70,291 $ 78,578 $ 78,802 $ 40,043 Exhibit A – EBITDA Reconciliation Q1 2009 Q2 2009 Q3 2009 Q4 2009 Q1 2010 Net (loss) earnings $ 2,726 $ 1,132 $ 1,092 $ 10,508 $ (7,023) Income tax (benefit) expense 1,743 724 (1,223) 5,324 (4,396) Interest expense 5,140 5,136 5,286 5,347 5,321 Interest income (1,183) (1,802) (1,925) (1,703) (730) Depreciation 5,644 5,969 5,864 5,928 5,915 EBITDA $ 14,070 $ 11,159 $ 9,094 $ 25,404 $ (913) Expense related to stock option compensation $ - $ - $ - $ - $ - Expense (income) related to stock appreciation rights compensation (35) 236 651 322 700 Gain on asset conversion, net - - - - - Retirement benefit plan expense - - - - - Other (income) loss on short-term investment activity 96 (13) (3,115) (17,826) (81) Adjusted EBITDA $ 14,131 $ 11,382 $ 6,630 $ 7,900 $ (294) Annual Reconciliation Quarterly Reconciliation In Thousands, unaudited |