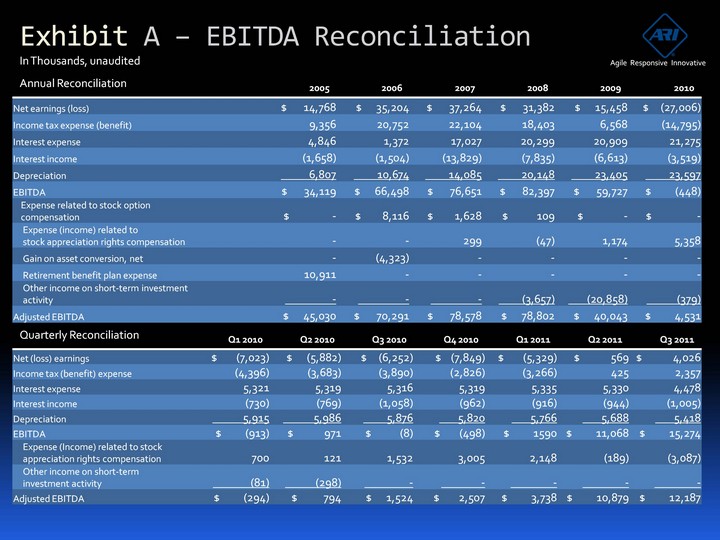
| 2005 2006 2007 2008 2009 2010 Net earnings (loss) $ 14,768 $ 35,204 $ 37,264 $ 31,382 $ 15,458 $ (27,006) Income tax expense (benefit) 9,356 20,752 22,104 18,403 6,568 (14,795) Interest expense 4,846 1,372 17,027 20,299 20,909 21,275 Interest income (1,658) (1,504) (13,829) (7,835) (6,613) (3,519) Depreciation 6,807 10,674 14,085 20,148 23,405 23,597 EBITDA $ 34,119 $ 66,498 $ 76,651 $ 82,397 $ 59,727 $ (448) Expense related to stock option compensation $ - $ 8,116 $ 1,628 $ 109 $ - $ - Expense (income) related to stock appreciation rights compensation - - 299 (47) 1,174 5,358 Gain on asset conversion, net - (4,323) - - - - Retirement benefit plan expense 10,911 - - - - - Other income on short-term investment activity - - - (3,657) (20,858) (379) Adjusted EBITDA $ 45,030 $ 70,291 $ 78,578 $ 78,802 $ 40,043 $ 4,531 Exhibit A - EBITDA Reconciliation Q1 2010 Q2 2010 Q3 2010 Q4 2010 Q1 2011 Q2 2011 Q3 2011 Net (loss) earnings $ (7,023) $ (5,882) $ (6,252) $ (7,849) $ (5,329) $ 569 $ 4,026 Income tax (benefit) expense (4,396) (3,683) (3,890) (2,826) (3,266) 425 2,357 Interest expense 5,321 5,319 5,316 5,319 5,335 5,330 4,478 Interest income (730) (769) (1,058) (962) (916) (944) (1,005) Depreciation 5,915 5,986 5,876 5,820 5,766 5,688 5,418 EBITDA $ (913) $ 971 $ (8) $ (498) $ 1590 $ 11,068 $ 15,274 Expense (Income) related to stock appreciation rights compensation 700 121 1,532 3,005 2,148 (189) (3,087) Other income on short-term investment activity (81) (298) - - - - - Adjusted EBITDA $ (294) $ 794 $ 1,524 $ 2,507 $ 3,738 $ 10,879 $ 12,187 Annual Reconciliation Quarterly Reconciliation In Thousands, unaudited Agile Responsive Innovative |