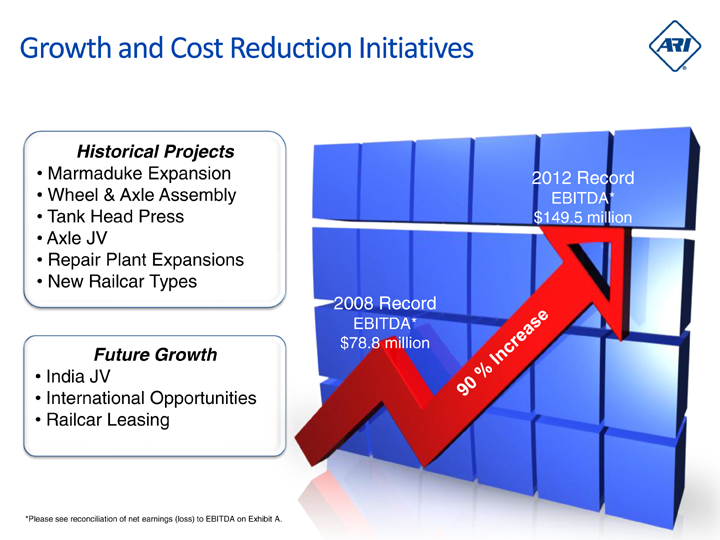
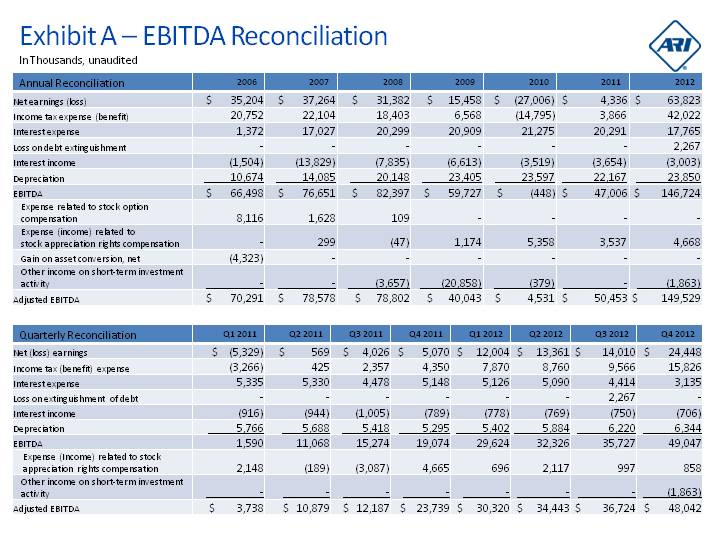
| 2006 2007 2008 2009 2010 2011 2012 Net earnings (loss) $ 35,204 $ 37,264 $ 31,382 $ 15,458 $ (27,006) $ 4,336 $ 63,823 Income tax expense (benefit) 20,752 22,104 18,403 6,568 (14,795) 3,866 42,022 Interest expense 1,372 17,027 20,299 20,909 21,275 20,291 17,765 Loss on debt extinguishment - - - - - - 2,267 Interest income (1,504) (13,829) (7,835) (6,613) (3,519) (3,654) (3,003) Depreciation 10,674 14,085 20,148 23,405 23,597 22,167 23,850 EBITDA $ 66,498 $ 76,651 $ 82,397 $ 59,727 $ (448) $ 47,006 $ 146,724 Expense related to stock option compensation 8,116 1,628 109 - - - - Expense (income) related to stock appreciation rights compensation - 299 (47) 1,174 5,358 3,537 4,668 Gain on asset conversion, net (4,323) - - - - - - Other income on short-term investment activity - - (3,657) (20,858) (379) - (1,863) Adjusted EBITDA $ 70,291 $ 78,578 $ 78,802 $ 40,043 $ 4,531 $ 50,453 $ 149,529 Exhibit A - EBITDA Reconciliation Q1 2011 Q2 2011 Q3 2011 Q4 2011 Q1 2012 Q2 2012 Q3 2012 Q4 2012 Net (loss) earnings $ (5,329) $ 569 $ 4,026 $ 5,070 $ 12,004 $ 13,361 $ 14,010 $ 24,448 Income tax (benefit) expense (3,266) 425 2,357 4,350 7,870 8,760 9,566 15,826 Interest expense 5,335 5,330 4,478 5,148 5,126 5,090 4,414 3,135 Loss on extinguishment of debt - - - - - - 2,267 - Interest income (916) (944) (1,005) (789) (778) (769) (750) (706) Depreciation 5,766 5,688 5,418 5,295 5,402 5,884 6,220 6,344 EBITDA 1,590 11,068 15,274 19,074 29,624 32,326 35,727 49,047 Expense (Income) related to stock appreciation rights compensation 2,148 (189) (3,087) 4,665 696 2,117 997 858 Other income on short-term investment activity - - - - - - - (1,863) Adjusted EBITDA $ 3,738 $ 10,879 $ 12,187 $ 23,739 $ 30,320 $ 34,443 $ 36,724 $ 48,042 Annual Reconciliation Quarterly Reconciliation In Thousands, unaudited |