Exhibit 99.2
PRO FORMA VALUATION REPORT MUTUAL HOLDING COMPANY STOCK OFFERING MUTUAL FEDERAL BANCORP, INC. CHICAGO, ILLINOIS Dated As of: November 4, 2005 |
Prepared By:
RP® Financial, LC.
1700 North Moore Street
Suite 221
Arlington, Virginia 22209
RP® FINANCIAL, LC.
Financial Services Industry Consultants
November 4, 2005
Boards of Directors
Mutual Federal Bancorp, MHC
Mutual Federal Bancorp, Inc.
Mutual Federal Savings and Loan Association of Chicago
2212 W. Cermak Road
Chicago, Illinois 60608-3999
Members of the Boards of Directors:
At your request, we have completed and hereby provide an independent appraisal (“Appraisal”) of the estimated pro forma market value of the common stock which is to be offered in connection with the Stock Issuance Plan (the “Plan”) described below.
This Appraisal is furnished pursuant to the requirements of 563b.7 and has been prepared in accordance with the “Guidelines for Appraisal Reports for the Valuation of Savings and Loan Associations Converting from Mutual to Stock Form of Organization” of the Office of Thrift Supervision (“OTS”), including the most recent revisions as of October 21, 1994, and applicable interpretations thereof.
Description of Stock Issuance Plan
Mutual Federal Bancorp, MHC (the “MHC” or “Mutual MHC”) is a federally chartered mutual holding company regulated by the OTS. The MHC was formed in November 2001 in conjunction with the mutual holding company reorganization of Mutual Federal Savings and Loan Association of Chicago, Chicago, Illinois, (“Mutual Federal” or the “Association”), whereby the Association became a 100% wholly owned stock subsidiary of the MHC. No stock was issued publicly in the mutual holding company reorganization. Pursuant to the Plan, a wholly-owned mid-tier stock holding company will be formed, to be known as Mutual Federal Bancorp, Inc. (“Mutual Bancorp” or the “Company”) and Mutual Federal will become a wholly-owned subsidiary of the Company. The Company will offer for sale up to 30.0% of its common stock (the “Minority Stock Issuance”) to the Association’s Eligible Account Holders, Qualified Tax-Exempt Employee Plans, Supplemental Eligible Account Holders and Voting Members. Any shares that are not sold in the Subscription Offering may be offered for sale in a Community Offering and subsequently, if appropriate, to the public in a Syndicated Community Offering. The remaining 70% of the shares of the Company will be issued to the MHC.
Washington Headquarters
Rosslyn Center Telephone: (703) 528-1700
1700 North Moore Street, Suite 2210 Fax No.: (703) 528-1788
Arlington, VA 22209
Boards of Directors
November 4, 2005
Page 2
Concurrent with the completion of the public stock offering, the Company will retain up to 50% of the net stock proceeds. The MHC will own a controlling interest in the Company and the Company will be the sole subsidiary of the MHC. The Company will own 100% of the outstanding stock of Mutual Federal. The Company’s initial activity will be ownership of its subsidiary, Mutual Federal, investment of the net cash proceeds retained at the holding company level and extending a loan to the ESOP.
RP Financial, LC.
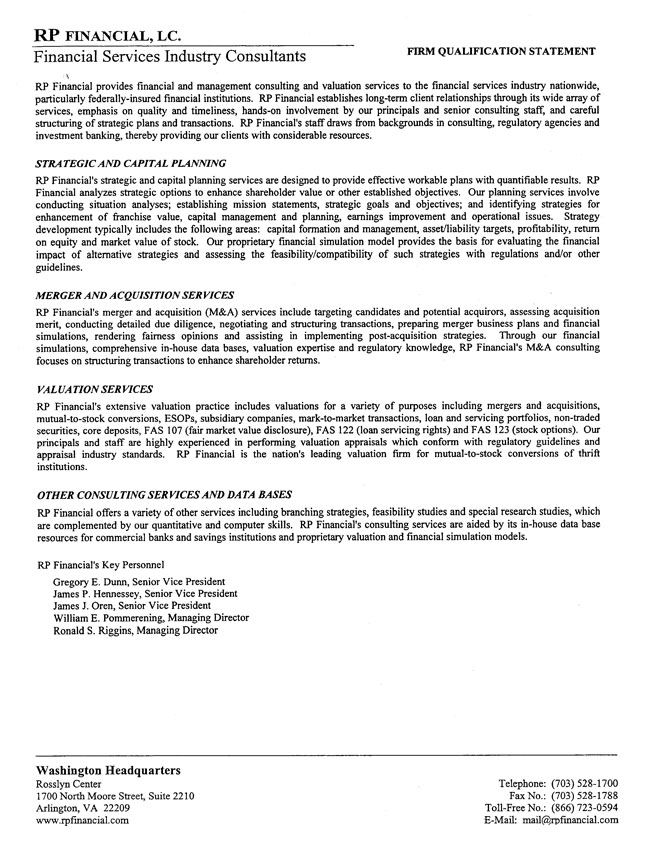
RP Financial, LC. ("RP Financial") is a financial consulting firm serving the financial services industry nationwide that, among other things, specializes in financial valuations and analyses of business enterprises and securities, including the pro forma valuation for savings institutions converting from mutual-to-stock form. The background and experience of RP Financial is detailed in Exhibit V-1. We believe that, except for the fee we will receive for our appraisal, we are independent of the Association, the Company and the MHC and the other parties engaged by the Association to assist in the stock issuance process.
Valuation Methodology
In preparing our appraisal, we have reviewed the Association’s, the Company’s and the MHC’s regulatory applications, including the prospectus as filed with the OTS and the Securities and Exchange Commission ("SEC"). We have conducted a financial analysis of the Association that has included a review of its audited financial information for the years ended December 31, 2000 through December 31, 2004 and for the nine months ended September 30, 2005, various unaudited information and internal financial reports through September 30, 2005 and due diligence related discussions with the Association’s management; Crowe Chizek and Company LLC, the Company’s independent auditor; Vedder, Price, Kaufman & Kammholz, P.C., the Company’s counsel in connection with the plan of stock issuance; and Sandler O”Neill & Partners, L.P., the Company’s financial and marketing advisor in connection with the stock offering. All conclusions set forth in the Appraisal were reached independently from such discussions. In addition, where appropriate, we have considered information based on other available published sources that we believe are reliable. While we believe the information and data gathered from all these sources are reliable, we cannot guarantee the accuracy and completeness of such information.
We have investigated the competitive environment within which the Association operates and have assessed the Association’s relative strengths and weaknesses. We have kept abreast of the changing regulatory and legislative environment for financial institutions and analyzed the potential impact on the Association and the industry as a whole. We have analyzed the potential effects of the minority stock offering on the Association’s operating characteristics and financial performance as they relate to the pro forma market value. We have reviewed the economy in the Association’s primary market area and have compared the Association’s financial performance and condition with publicly-traded thrifts in mutual holding company form, as well as all publicly-traded thrifts. We have reviewed market conditions for stocks in general and market conditions for thrift stocks in particular, including the market for existing thrift issues and the
Boards of Directors
November 4, 2005
Page 3
market for initial public offerings by thrifts. We have considered the market for the stocks of all publicly-traded mutual holding companies. We have also considered the expected market for the Company’s public shares. We have excluded from such analyses thrifts subject to announced or rumored acquisition, mutual holding company institutions that have announced their intent to pursue second-step conversions, and/or those institutions that exhibit other unusual characteristics.
Our Appraisal is based on the Association’s representation that the information contained in the regulatory applications and additional information furnished to us by the Association, its independent auditors, legal counsel and other authorized agents are truthful, accurate and complete. We did not independently verify the financial statements and other information provided by the Association, its independent auditors, legal counsel and other authorized agents nor did we independently value the assets or liabilities of the Association. The valuation considers the Association only as a going concern and should not be considered as an indication of the Association’s liquidation value.
Our appraised value is predicated on a continuation of the current operating environment for the Association, the MHC and the Company and for all thrifts and their holding companies. Changes in the local, state and national economy, the legislative and regulatory environment for financial institutions and mutual holding companies, the stock market, interest rates, and other external forces (such as natural disasters or significant world events) may occur from time to time, often with great unpredictability, and may materially impact the value of thrift stocks as a whole or the Company’s value alone. It is our understanding that there are no current plans for pursuing a second-step conversion or for selling control of the Company or the Association following the offering. To the extent that such factors can be foreseen, they have been factored into our analysis.
Pro forma market value is defined as the price at which the Company’s stock, immediately upon completion of the offering, would change hands between a willing buyer and a willing seller, neither being under any compulsion to buy or sell and both having reasonable knowledge of relevant facts.
Valuation Conclusion
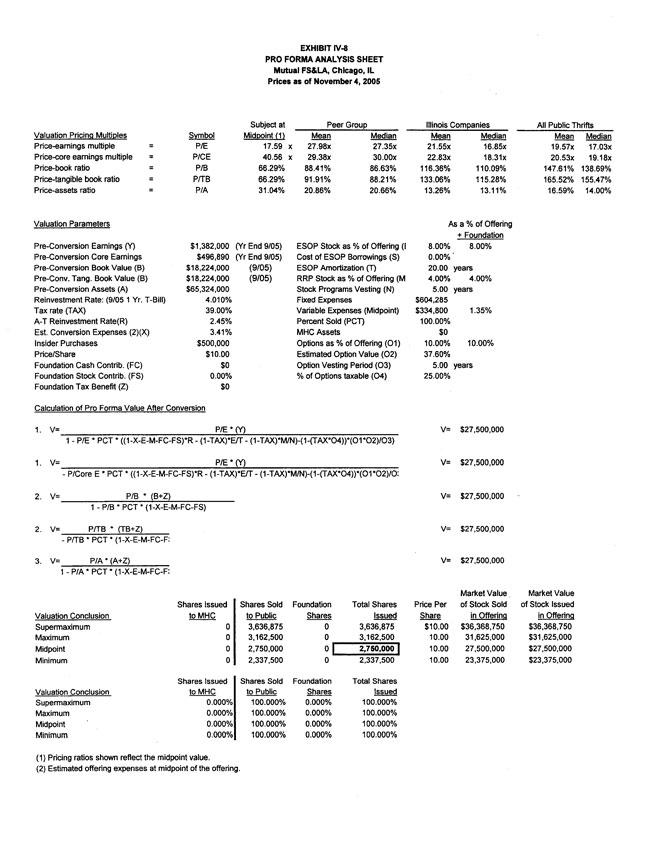
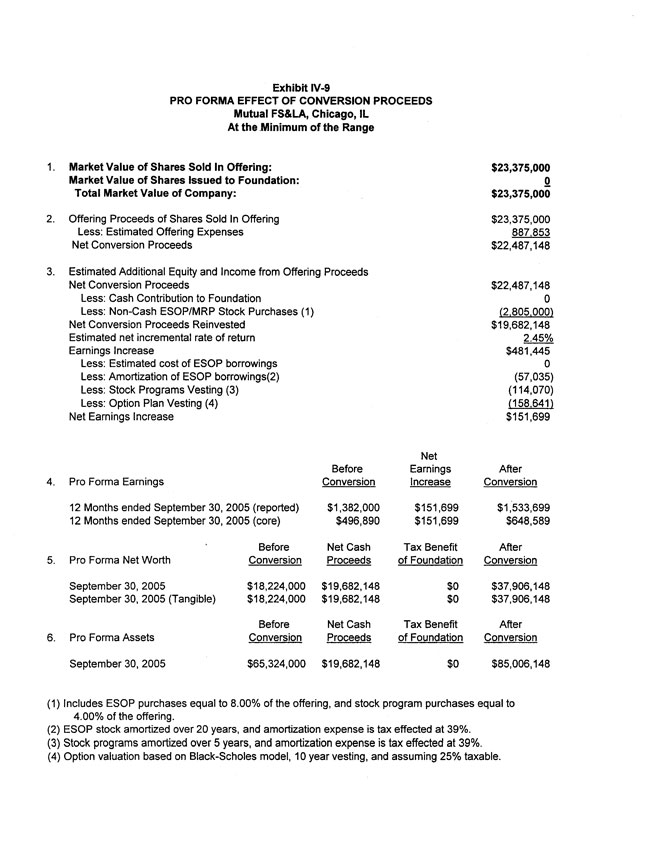
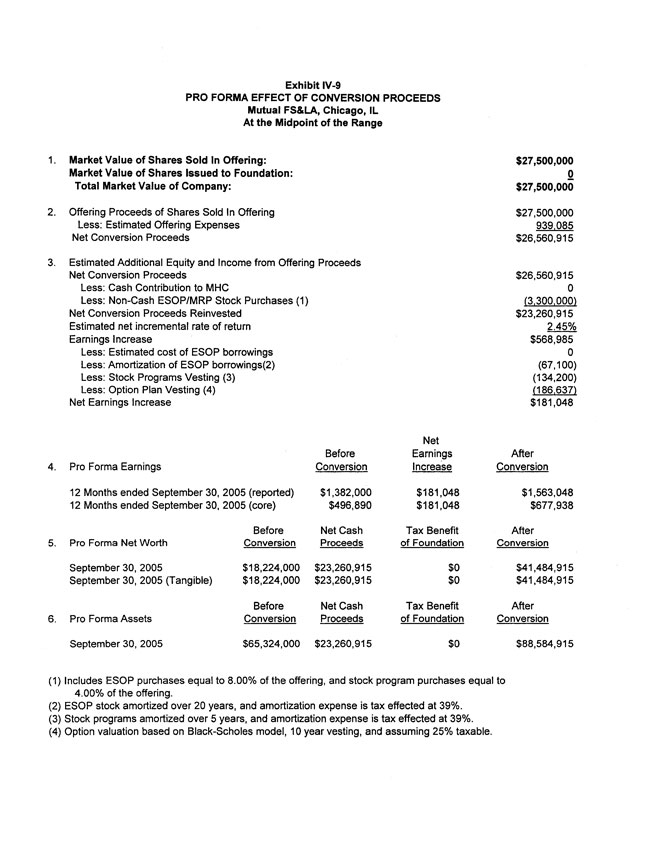
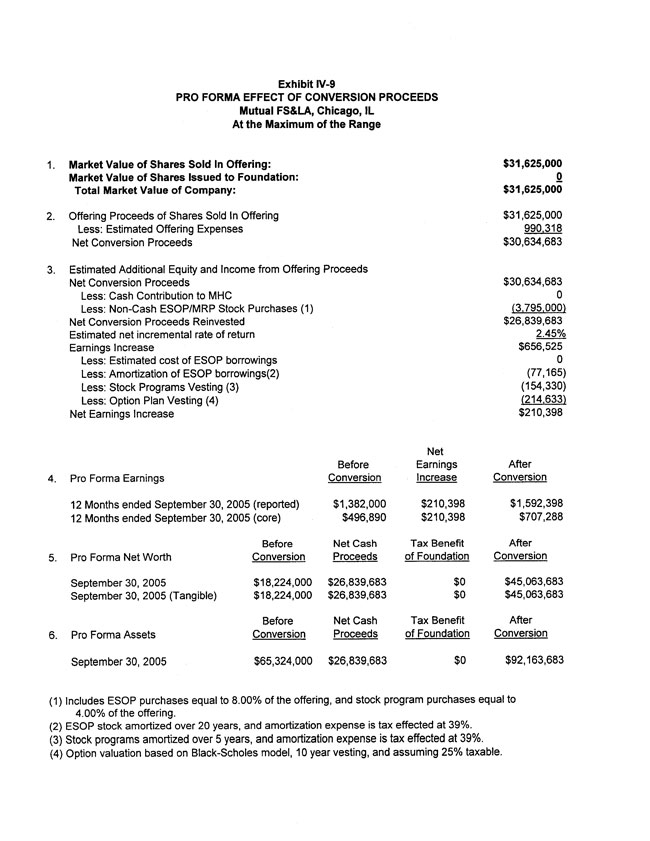
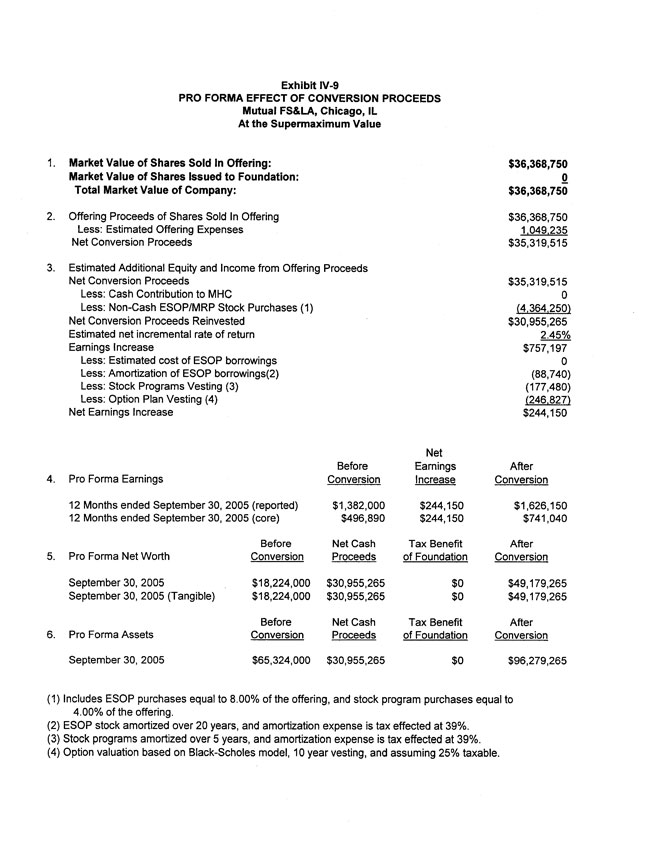
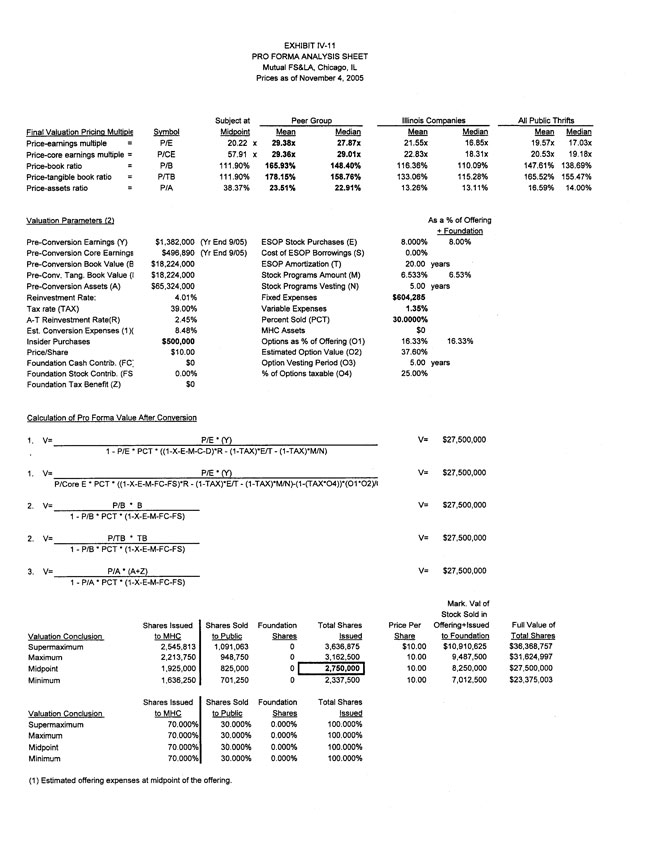
It is our opinion that, as of November 4, 2005, the aggregate market value of the Company’s common stock at the midpoint of the valuation range, assuming a full conversion offering, is $27,500,000. Based on the foregoing valuation, the Board has determined to offer 30.0% of the full value for sale in the minority stock offering. The offering and reorganization will thus incorporate the following range of value of stock issuance:
Boards of Directors
November 4, 2005
Page 4
| | | Total Shares | | MHC Shares | | Shares Sold in the Offering | |
Shares(1) | | | | | | | |
| Supermaximum | | | 3,636,875 | | | 2,545,812 | | | 1,091,063 | |
| Maximum | | | 3,162,500 | | | 2,213,750 | | | 948,750 | |
| Midpoint | | | 2,750,000 | | | 1,925,000 | | | 825,000 | |
| Minimum | | | 2,337,500 | | | 1,636,250 | | | 701,250 | |
Distribution of Shares(2) | | | | | | | | | | |
| Supermaximum | | | 100.00 | % | | 70.00 | % | | 30.00 | % |
| Maximum | | | 100.00 | % | | 70.00 | % | | 30.00 | % |
| Midpoint | | | 100.00 | % | | 70.00 | % | | 30.00 | % |
| Minimum | | | 100.00 | % | | 70.00 | % | | 30.00 | % |
Aggregate Market Value | | | | | | | | | | |
| Supermaximum | | $ | 36,368,750 | | $ | 25,458,120 | | $ | 10,910,630 | |
| Maximum | | $ | 31,625,000 | | $ | 22,137,750 | | $ | 9,487,500 | |
| Midpoint | | $ | 27,500,000 | | $ | 19,250,000 | | $ | 8,250,000 | |
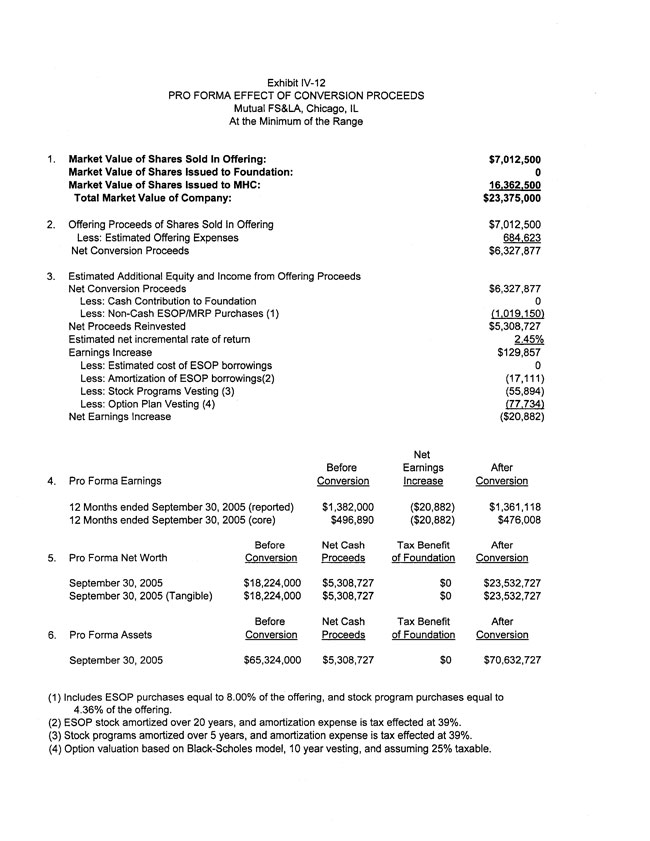
| Minimum | | $ | 23,375,000 | | $ | 16,362,500 | | $ | 7,012,500 | |
(1) Based on offering price of $10.00 per share.
(2) Assumes that 30.0% of the total shares issued are sold to the public.
Limiting Factors and Considerations
Our valuation is not intended, and must not be construed, as a recommendation of any kind as to the advisability of purchasing shares of the common stock. Moreover, because such valuation is necessarily based upon estimates and projections of a number of matters, all of which are subject to change from time to time, no assurance can be given that persons who purchase shares of common stock in the conversion will thereafter be able to buy or sell such shares at prices related to the foregoing valuation of the pro forma market value thereof.
RP Financial's valuation was determined based on the financial condition and operations of Mutual Federal as of September 30, 2005, the date of the financial data included in the regulatory applications and prospectus.
RP Financial is not a seller of securities within the meaning of any federal and state securities laws and any report prepared by RP Financial shall not be used as an offer or solicitation with respect to the purchase or sale of any securities. RP Financial maintains a policy which prohibits the company, its principals or employees from purchasing stock of its client institutions.
Boards of Directors
November 4, 2005
Page 5
The valuation will be updated as provided for in the conversion regulations and guidelines. These updates will consider, among other things, any developments or changes in the Association's financial performance and condition, management policies, and current conditions in the equity markets for thrift stocks. These updates may also consider changes in other external factors which impact value including, but not limited to: various changes in the legislative and regulatory environment, the stock market and the market for thrift stocks, and interest rates. Should any such new developments or changes be material, in our opinion, to the valuation of the shares, appropriate adjustments to the estimated pro forma market value will be made. The reasons for any such adjustments will be explained in the update at the date of the release of the update.
Respectfully submitted,
RP FINANCIAL, LC.
William E. Pommerening
CEO and Managing Director
James J. Oren
Senior Vice President
TABLE OF CONTENTS
MUTUAL FEDERAL SAVINGS AND LOAN ASSOCIATION OF CHICAGO
Chicago, Illinois
| DESCRIPTION | PAGE NUMBER |
CHAPTER ONE | OVERVIEW AND FINANCIAL ANALYSIS |
| Introduction | 1.1 |
| Current Organizational Structure | 1.1 |
| Stock Issuance Plan | 1.2 |
| Strategic Overview | 1.2 |
| Balance Sheet Trends | 1.4 |
| Income and Expense Trends | 1.8 |
| Interest Rate Risk Management | 1.12 |
| Lending Activities and Strategy | 1.13 |
| Asset Quality | 1.14 |
| Funding Composition and Strategy | 1.15 |
| Subsidiaries and Other Activities | 1.16 |
| Legal Proceedings | 1.16 |
CHAPTER TWO | MARKET AREA |
| Introduction | 2.1 |
| National Economic Factors | 2.2 |
| Economic and Interest Rate Environment | 2.3 |
| Market Area Demographics | 2.4 |
| Local Economy | 2.6 |
| Competition | 2.7 |
| Summary | 2.9 |
CHAPTER THREE | PEER GROUP ANALYSIS |
| Peer Group Selection | 3.1 |
| Basis of Comparison | 3.2 |
| Mutual Federal Peer Group | 3.3 |
| Financial Condition | 3.6 |
| Income and Expense Components | 3.9 |
| Loan Composition | 3.13 |
| Credit Risk | 3.15 |
| Interest Rate Risk | 3.15 |
| Summary | 3.18 |
TABLE OF CONTENTS
MUTUAL FEDERAL SAVINGS AND LOAN ASSOCIATION OF CHICAGO
Chicago, Illinois
(continued)
| | | | | | |
| DESCRIPTION | | | | | PAGE NUMBER |
CHAPTER FOUR | VALUATION ANALYSIS |
| Introduction | 4.1 |
| Appraisal Guidelines | 4.1 |
| RP Financial Approach to the Valuation | 4.1 |
| Valuation Analysis | 4.3 |
| | 1. | Financial Condition | 4.3 |
| | 2. | Profitability, Growth and Viability of Earnings | 4.5 |
| | 3. | Asset Growth | 4.7 |
| | 4. | Primary Market Area | 4.7 |
| | 5. | Dividends | 4.8 |
| | 6. | Liquidity of the Shares | 4.9 |
| | 7. | Marketing of the Issue | 4.10 |
| | | | A. | The Public Market | 4.10 |
| | | | B. | The New Issue Market | 4.15 |
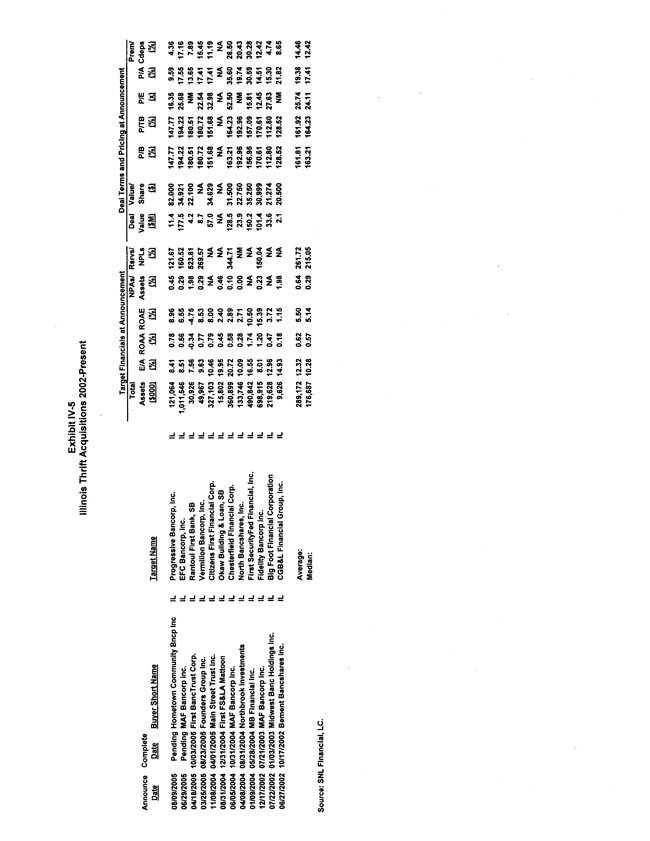
| | | | C. | The Acquisition Market | 4.18 |
| | 8. | Management | 4.19 |
| | 9. | Effect of Government Regulation and Regulatory Reform | 4.19 |
| Summary of Adjustments | 4.20 |
| Basis of Valuation - Fully-Converted Pricing Ratios | 4.20 |
| Valuation Approaches: Fully-Converted Basis | 4.21 |
| | 1. | Price-to-Earnings ("P/E") | 4.24 |
| | 2. | Price-to-Book ("P/B") | 4.25 |
| | 3. | Price-to-Assets ("P/A") | 4.28 |
| Comparison to Recent Offerings | 4.29 |
| Valuation Conclusion | 4.29 |
LIST OF TABLES
MUTUAL FEDERAL SAVINGS AND LOAN ASSOCIATION OF CHICAGO
Chicago, Illinois
TABLE NUMBER | DESCRIPTION | PAGE |
| 1.1 | Historical Balance Sheets | 1.5 |
| 1.2 | Historical Income Statements | 1.9 |
| 2.1 | Summary Demographic Data | 2.5 |
| 2.2 | Primary Market Area Employment Sectors | 2.6 |
| 2.3 | Market Area Unemployment Trends | 2.7 |
| 2.4 | Deposit Summary | 2.8 |
| 3.1 | Peer Group of Publicly-Traded Thrifts | 3.5 |
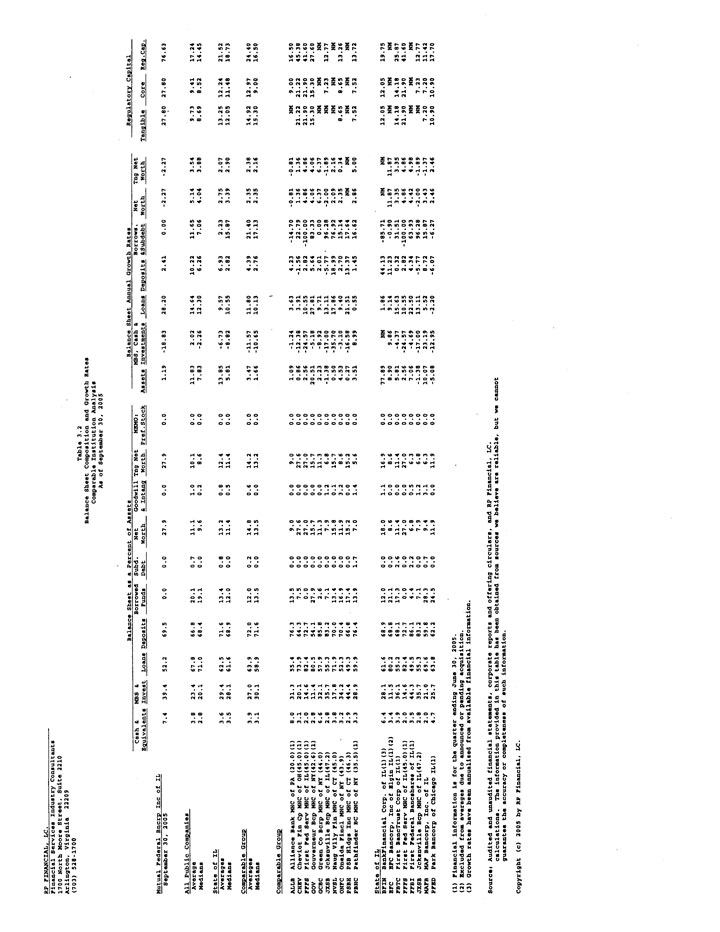
| 3.2 | Balance Sheet Composition and Growth Rates | 3.7 |
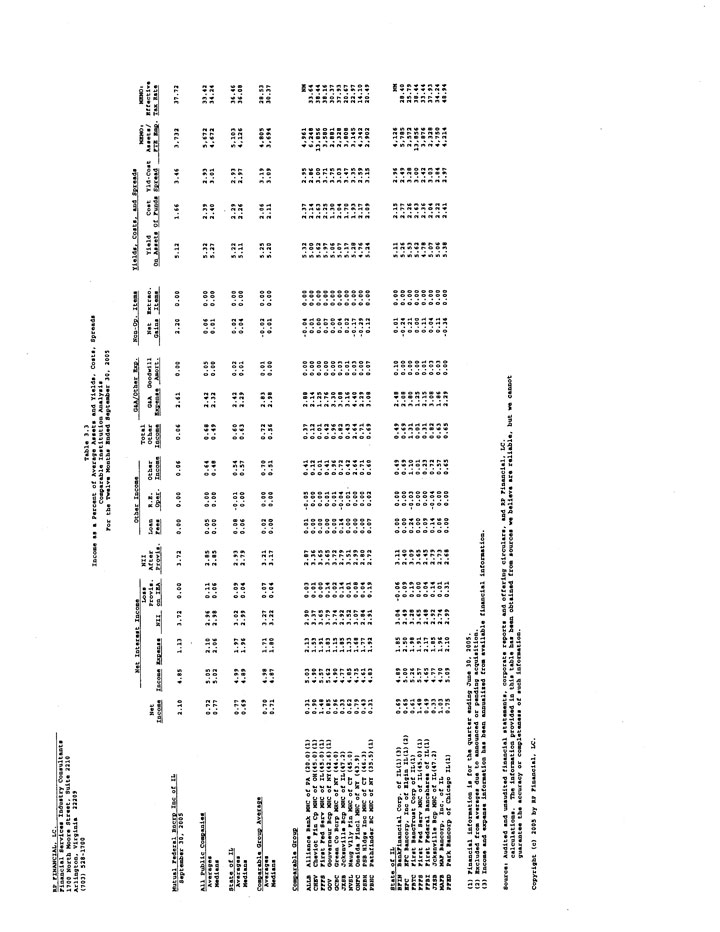
| 3.3 | Income as a Percent of Average Assets and Yields, Costs, Spreads | 3.10 |
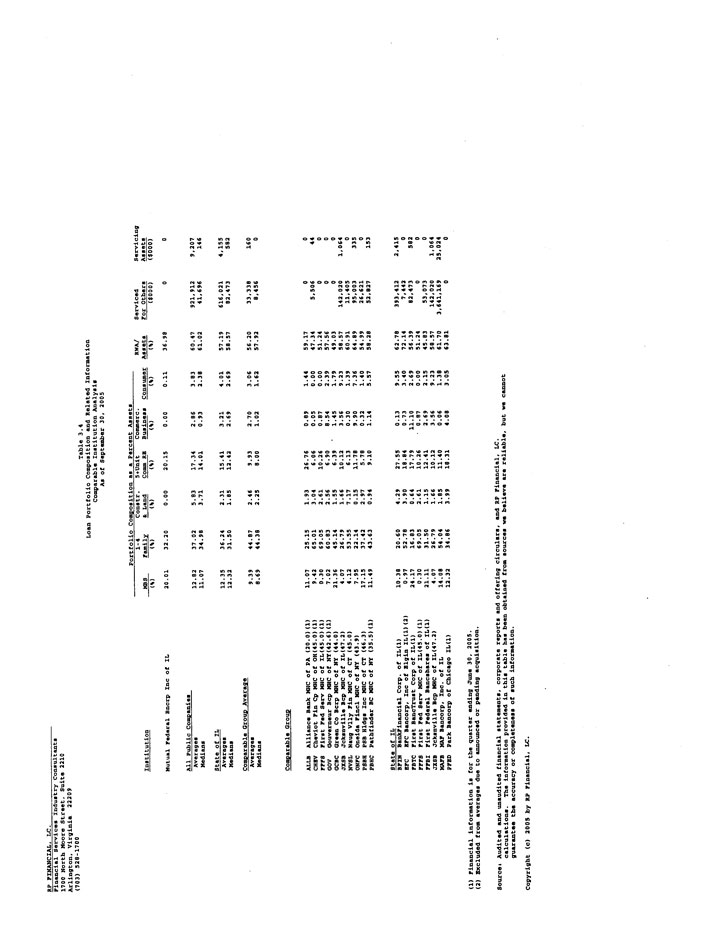
| 3.4 | Loan Portfolio Composition Comparative Analysis | 3.14 |
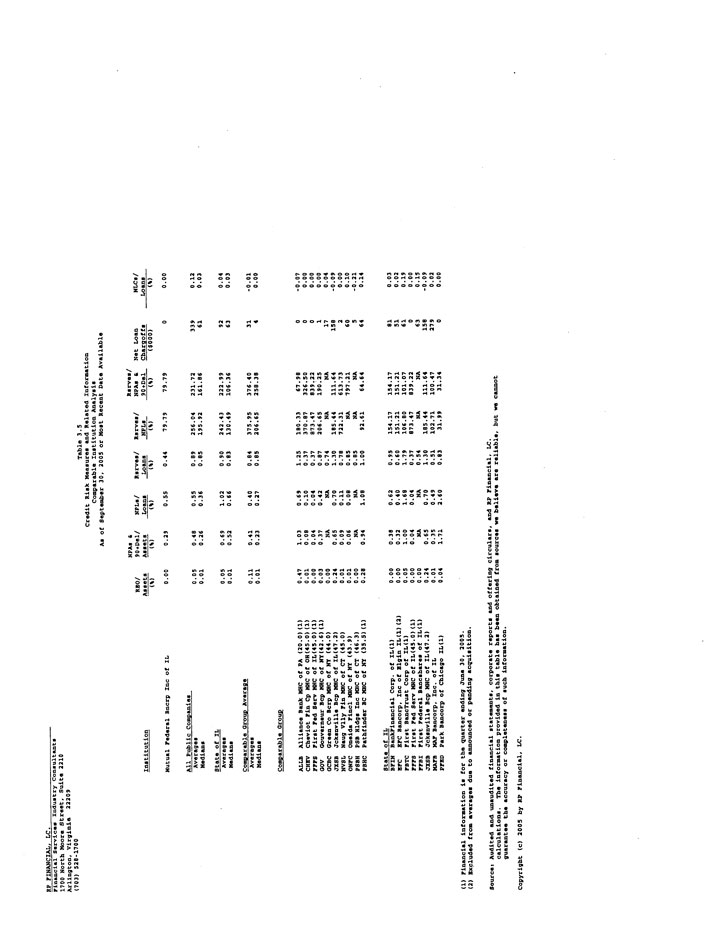
| 3.5 | Credit Risk Measures and Related Information | 3.16 |
| 3.6 | Interest Rate Risk Measures and Net Interest Income Volatility | 3.17 |
| 4.1 | Market Area Unemployment Rates | 4.8 |
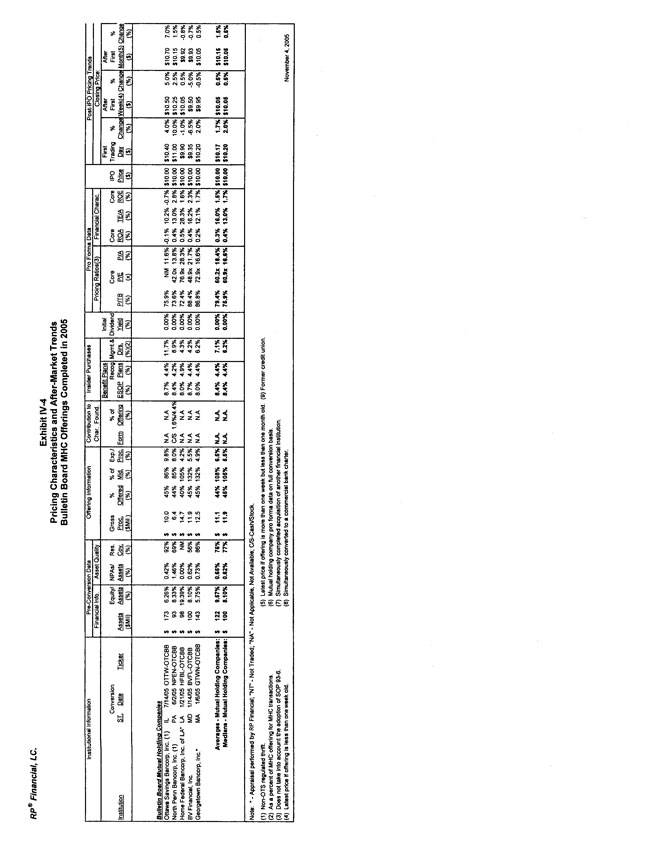
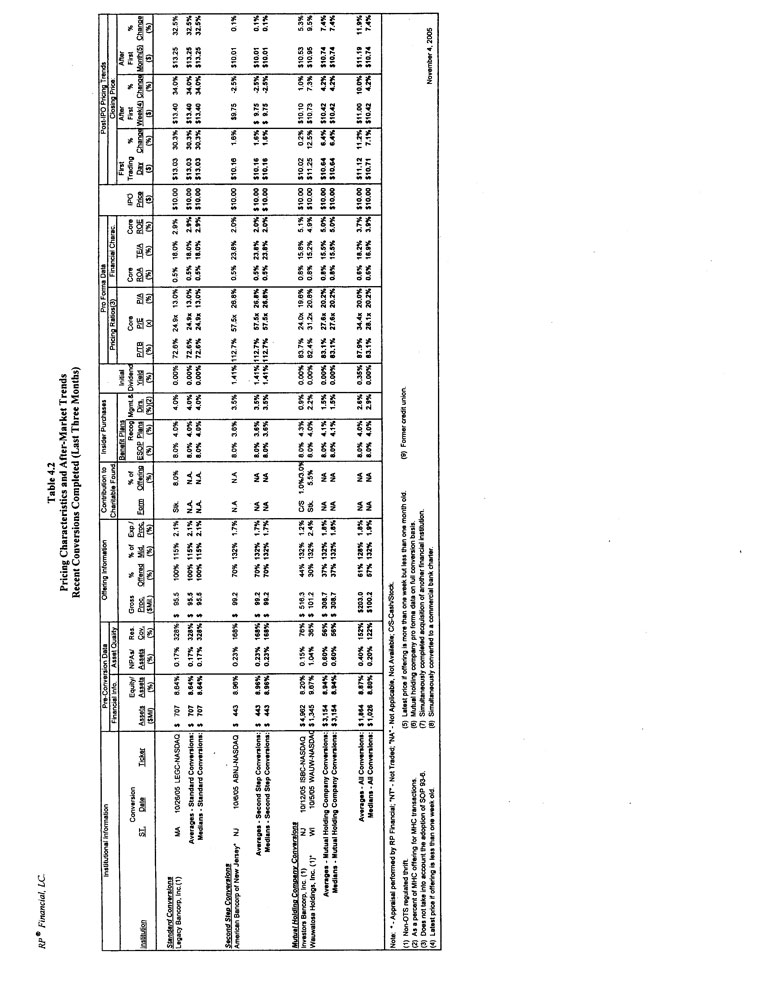
| 4.2 | Recent Conversion Pricing Characteristics | 4.17 |
| 4.3 | Recent OTC Listed Thrift Conversions | 4.18 |
| 4.4 | Valuation Adjustments | 4.20 |
| 4.5 | Calculation of Implied Per Share Data | 4.22 |
| 4.6 | Derivation of Estimated Core Net Income | 4.25 |
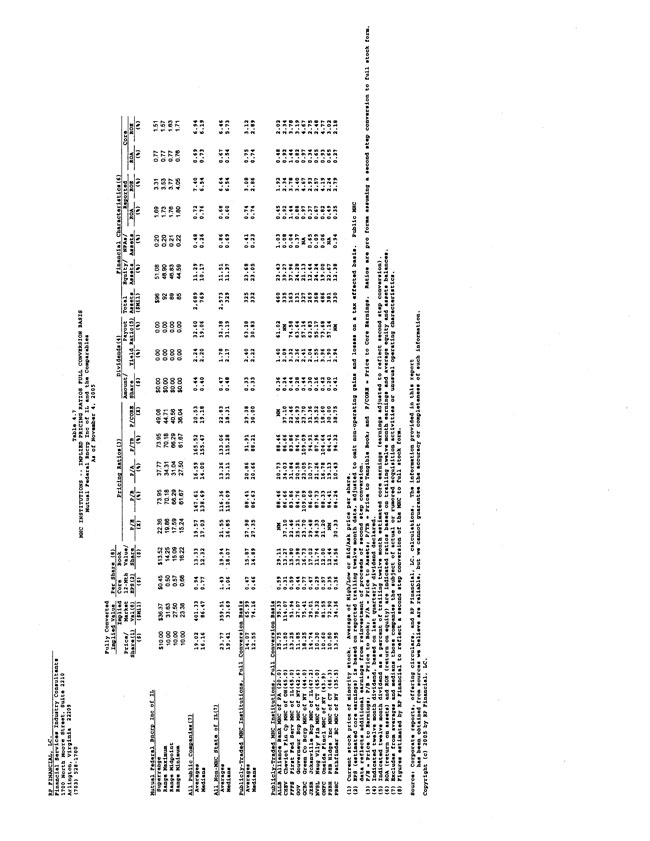
| 4.7 | MHC Institutions - Implied Pricing Ratios, Full Conversion Basis | 4.26 |
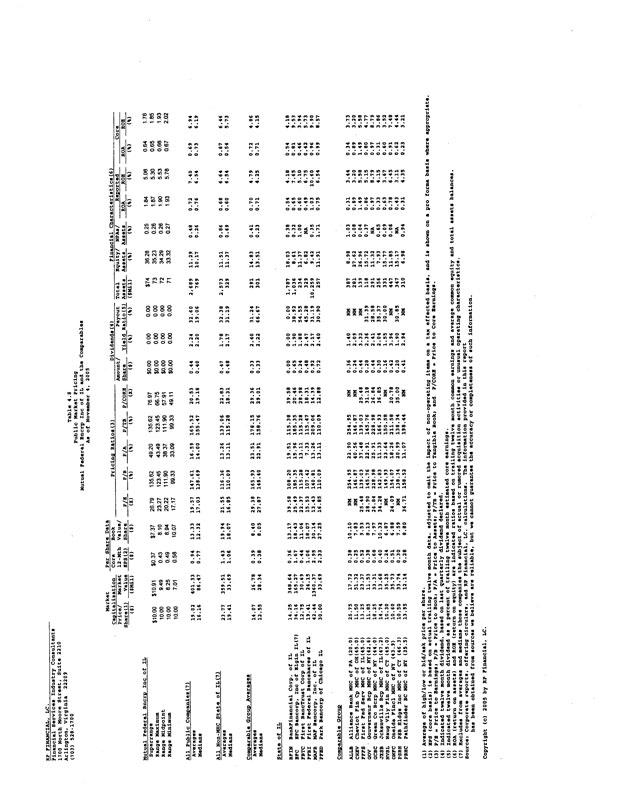
| 4.8 | Pricing Table: MHC Public Market Pricing | 4.27 |
RP Financial, LC.
Page 1.1
I. OVERVIEW AND FINANCIAL ANALYSIS
Introduction
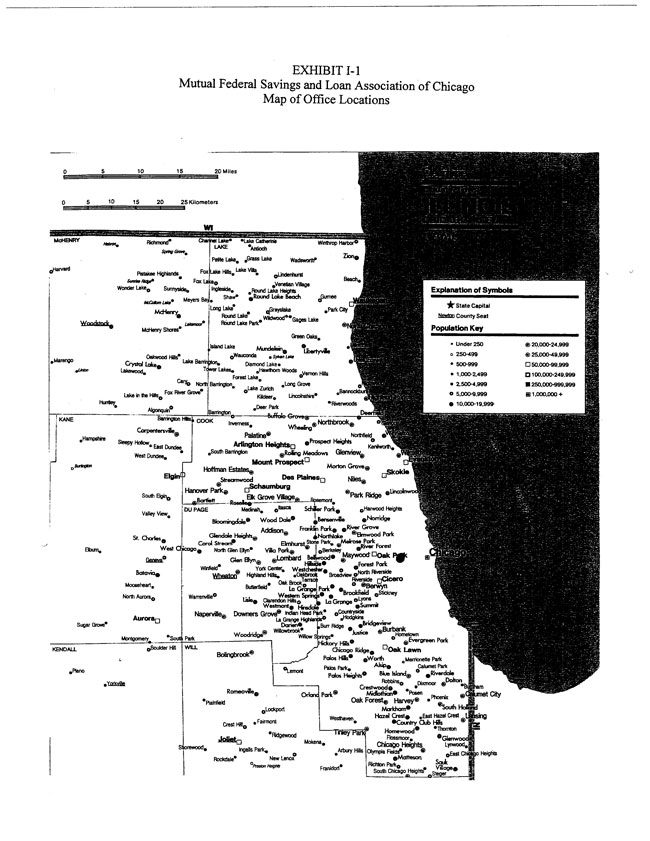
The Association operates from a single office location in the central portion of Cook County, Chicago, Illinois. A map of the MHC’s branch office is provided in Exhibit I-1. The Association is currently 100% owned by the MHC. After completion of the stock offering, the MHC is expected to own 70% of the outstanding shares of common stock of Mutual Bancorp, which will be the federally chartered mid-tier stock holding company for the Association. Upon completion of the offering, Mutual Bancorp will own 100% of the common stock of the Association. At September 30, 2005, Mutual Federal had $65.3 million in assets, $45.4 million in deposits and consolidated equity of $18.2 million, equal to 28.6% of total assets, all of which was tangible capital. Mutual Federal’s audited financial statements are included by reference as Exhibit I-2.
Current Organizational Structure
The Association was originally founded in 1905 as a state-chartered mutual savings and loan association and today is a federally chartered mutual savings and loan association. In November 2001, the Association reorganized into the two-tier mutual holding company structure. In conjunction with the reorganization, the MHC was formed and concurrently was issued all the capital stock of the Association. At the same time, the Association converted to a capital stock savings and loan association and became a wholly owned subsidiary of the MHC. No stock was issued publicly pursuant to the reorganization. The Association transferred $251,000 of retained earnings to the MHC as an initial capitalization, of which $1,000 was used to purchase 100% of the common stock of the Association and the remaining $250,000 was held as cash. Cash dividends were paid by the Association to the MHC in the amount of $1.0 million in 2004 and again in the nine months ended September 30, 2005, for $300,000. The MHC is a federally chartered mutual holding company and conducts its operations primarily through the Association. Operations of the MHC have been minimal to date, except for owning the common stock of the Association, and will continue to be after the stock offering.
RP Financial, LC.
Page 1.2
Stock Issuance Plan
In July of 2005, the Board of Directors of Mutual Federal adopted a stock issuance plan (the “plan”). Pursuant to the plan, Mutual Bancorp will issue a majority of its common stock to the MHC and sell a minority of its common stock to the public. In connection with the offering Mutual Federal Bancorp, the MHC will form Mutual Federal Bancorp, Inc., as a federally chartered corporation. Concurrent with the completion of the public stock offering, Mutual Bancorp will retain up to 50% of the net stock proceeds and will contribute 50% of the net offering proceeds to the Association.
The MHC will own a controlling interest in Mutual Bancorp of at least 50%, and Mutual Bancorp will be the sole subsidiary of the MHC. Mutual Bancorp will own 100% of the Association’s outstanding stock. Mutual Bancorp’s initial activity will be ownership of its subsidiary, the Association, extending a loan to the employee stock ownership plan (“ESOP”), and contributing additional capital to the Association. Subsequent activities of the Company may include investing in securities, financing possible acquisitions of other financial institutions, acquisitions of other financial service providers and/or stock repurchases.
Strategic Overview
The primary aspects of the Association’s business strategy includes operating as a community oriented financial institution, with Mutual Federal striving to meet the banking and personal financial services needs of the communities in which it operates. The Association’s operating strategy includes the goal of expanding the branch office network. Currently operating from only one office, the Association intends to continue to evaluate new branch opportunities, which could be gained through either acquisition of other financial institutions or through de novo branching. This would permit expansion of the primary market area and allow for a higher level of service to current and new customers. Mutual Federal also intends to continue a strategy to maintain emphasis on one-to four- family residential mortgage lending, while continuing to originate multi-family real estate loans on properties in the local market area. The additional capital raised as part of the offering will also permit the Association to originate larger balance loans and service borrowers with larger lending needs.
RP Financial, LC.Page 1.3
The Association’s strategies also include expanding and strengthening Mutual Federal’s customer base by offering new products and services to current and potential customers, which can be supported by the additional capital. There will also be continued emphasis on maintaining low levels of non-performing assets through adequate lending policies and procedures, along with sufficient dedication to asset management and collection efforts. Furthermore, the capital raised will enable the Association to establish stock benefit plans for management and employees, which will permit the Association to attract and retain qualified personnel. Finally, Mutual Federal intends to continue increasing and diversifying the sources of non-interest income.
Over the past several years, while total assets have remained relatively stable, the Association has been successful in expanding the balance of loans receivable, funded with available liquid funds. Net income has been supported by gains on the sale of Freddie Mac stock, while the operating expense ratio has trended upward due to the lack of asset growth and inflationary pressures on expenses. The sole branch retail deposit office contains $45 million of deposits, providing a beneficial economy of scale in terms of operating costs. A relatively moderate loans-to-assets ratio of 52% has to some extent limited revenue. In recent periods, the Company’s net interest income ratio has remained relatively strong, as the balance of fixed rate loans in portfolio has maintained asset yields, and the high capital ratio has limited the level of interest expense. Non-interest income has remained relatively low in comparison to industry averages, reflecting the limited diversification of operations, and the lack of a substantial balance of retail customer transaction account deposits that would provide additional fee income.
The Association’s Board of Directors has elected to complete a public stock offering to improve the competitive position of the Association. The capital realized from the minority stock offering will increase the operating flexibility and overall financial strength of Mutual Federal. The additional capital realized from stock proceeds will increase liquidity and leverage capacity to support funding of future loan growth and other interest-earning assets. Mutual Federal’s higher capital position resulting from the infusion of stock proceeds will also serve to reduce interest rate risk, through enhancing the Association’s interest-earning-assets-to-interest-bearing-liabilities ("IEA/IBL") ratio. The additional funds realized from the stock offering will provide an alternative funding source to deposits and borrowings in meeting the Association’s
RP Financial, LC.Page 1.4
future funding needs, which may facilitate a reduction in the Association’s funding costs. Additionally, Mutual Federal’s higher equity-to-assets ratio will also better position the Association to take advantage of expansion opportunities as they arise. Such expansion would most likely occur through the establishment or acquisition of additional banking offices or customer facilities that would provide for further penetration in the markets currently served by the Association or nearby surrounding markets. The Association will also be positioned better to pursue growth through acquisition of other financial service providers following the stock offering, given its strengthened capital position. At this time, the Association has no specific plans for expansion other than through establishing additional branches and the possibility of an acquisition. The projected use of the proceeds is highlighted below.
| o | Mutual Federal Bancorp, Inc. The Company is expected to retain up to 50% of the net offering proceeds. Over time, the funds may be utilized for various corporate purposes, possibly including acquisitions, infusing additional equity into the Association, repurchases of common stock, and the payment of regular and/or special cash dividends. |
| o | Mutual Federal. At least 50% of the net conversion proceeds will be infused into the Association. Cash proceeds (i.e., net proceeds less deposits withdrawn to fund stock purchases) infused into the Association are anticipated to become part of general operating funds, and are expected to be primarily utilized to fund growth of loans and investments. |
Overall, it is the Association's objective to pursue growth that will serve to increase returns, while, at the same time, growth will not be pursued that could potentially compromise the overall risk associated with Mutual Federal’s operations. The Association has acknowledged that it intends to operate with excess capital in the near term, operating with a below market return on equity (“ROE”), until such time as the new capital can be leveraged in a safe and sound manner over an extended period of time.
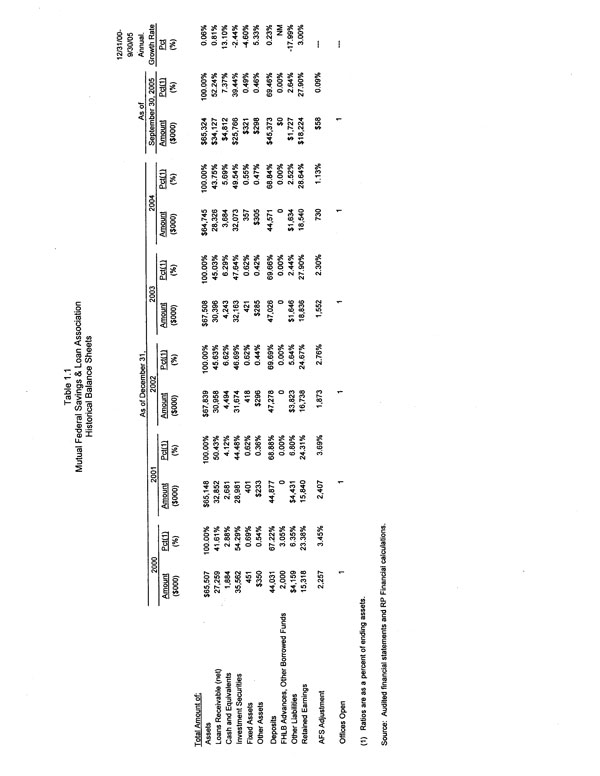
Balance Sheet Trends
Table 1.1 shows the Association’s historical balance sheet data for the past five fiscal years and through September 30, 2005. From December 31, 2000 to September 30, 2005, Mutual Federal’s assets increased at a minimal 0.06% annual rate. Within the asset base, the balance of loans receivable increased, while investment securities declined. Earning assets are funded with
RP Financial, LC.Page 1.5
RP Financial, LC.
Page 1.6
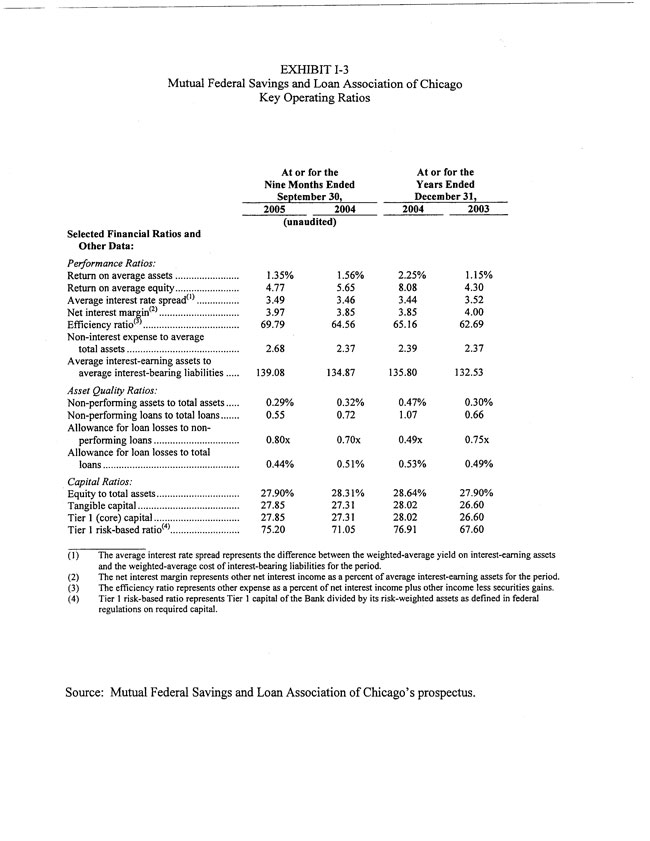
deposits and retained earnings. A summary of Mutual Federal’s key operating ratios for the past five fiscal years and through September 30, 2005 is presented in Exhibit I-3.
Mutual Federal’s loans receivable portfolio increased at a 0.81% annual rate from year end 2000 through September 30, 2005 with the highest portion of the growth realized during 2005. The growth for fiscal 2005 was due to increase lending efforts by Association personnel, continued strong demand for loans in the local market area served, given the low interest rate environment, along with the strategy of retaining essentially all loan originations for portfolio. Growth was recorded in all loan types, including multi-family residential mortgage and one-to-four family residential mortgage loans. Overall, the loans receivable balance increased from $27.3 million at year end 2000 to $34.1 million as of September 30, 2005. Mutual Federal’s focus on one- to four-family residential real estate mortgage and multifamily real estate lending is reflected in its loan portfolio composition, as these two loan types totaled 99.78% of total loans receivable at September 30, 2005. Over the same time period, the Association also had a small number of loans secured by deposit accounts as an accommodation to customers.
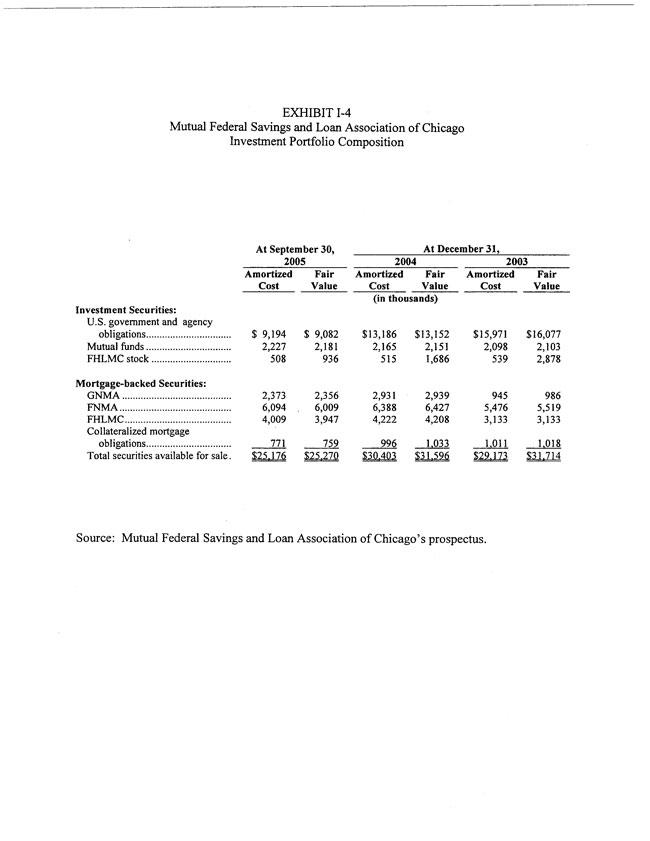
The intent of the Association’s investment policy is to provide adequate liquidity and to generate a favorable return within the context of supporting Mutual Federal’s overall credit and interest rate risk objectives. It is anticipated that proceeds retained at the holding company level will primarily be invested into investments with short-term maturities. Over the past five fiscal years and through September 30, 2005, the Association’s level of cash and equivalents ranged from 7.4% of assets at September 30, 2005 to a low of 2.9% of assets at December 31, 2000. Such assets totaled $4.8 million, or 7.4% of assets at September 30, 2005. Cash and cash equivalents are maintained for liquidity purposes for use in daily business operations. Investment securities (inclusive of FHLB stock) ranged from a high of 54.3% of assets at year end 2000 to a low of 39.4% of assets at September 30, 2005. Mortgage-backed securities (“MBS”) comprise the most significant component of the Association’s investment portfolio, with the portfolio consisting substantially of securities guaranteed or insured by a federal agency or government sponsored enterprises (“GSEs”). As of September 30, 2005, the portfolio consisted of $13.1 million of pass through certificates issued by Fannie Mae, Freddie Mac and Ginnie Mae and included collateralized mortgage obligations. All of the MBS were classified as available-for-sale, and the estimated fair value of such assets was approximately $176,000 (pre-
RP Financial, LC.
Page 1.7
tax basis) less than the amortized cost on the Association’s books. At September 30, 2005, 38.9% of the MBS were backed by adjustable rate mortgage loans, while 61.1% were backed by fixed rate mortgage loans. MBS are generally purchased as a means to deploy excess liquidity at more favorable yields than other investment alternatives that are consistent with Mutual Federal’s investment philosophy.
Beyond the Association’s investment in MBS, investment securities held by Mutual Federal at September 30, 2005 consisted of U.S. Government and agency obligations ($9.1 million), mutual funds ($2.2 million), FHLMC stock ($0.9 million), and FHLB stock ($0.5 million). The Association has engaged in periodic sale of the Freddie Mac stock since fiscal 2001 in order to lower the level of investment in this asset and to lock-in unrealized gains in the investment. As such, the fair market value of such investment was relatively minor at September 30, 2005 in comparison to earlier periods. To facilitate management of interest rate risk, the US Government and Agency Securities have a maturity of no more than 10 years. Exhibit I-4 provides historical details of the Association’s investments.
Operating for approximately 40 years from the current single office location, Mutual Federal reported a minimal investment in fixed assets as of September 30, 2005, equal to $321,000, or 0.49% of assets. This low level of investment in fixed asset permits additional investment in earning assets by the Association.
Over the past five fiscal years and through September 30, 2005, Mutual Federal’s funding needs have been substantially met through retail deposits, borrowings, internal cash flows and retained earnings. As shown in Table 1.1, from year end 2000 through September 30, 2005 the Association’s deposits increased at an annual rate of 0.23%. The minimal asset growth rate resulted in an increase in the ratio of deposits-to-assets from 67.2% at year end 2000 to 69.5% at September 30, 2005. Savings accounts equaled 51.4% and certificates of deposit accounts equaled 47.7% of the Association’s total deposits at September 30, 2005, versus a comparable ratio of 52.1% and 47.6% at year end 2003. Certificates of deposits and regular savings accounts have been the largest source of funds for Association activities; however such accounts provide minimal levels of non-interest income. Mutual Federal began offering non-interest bearing checking accounts in 2003, and as of September 30, 2005, non-interest-bearing checking
RP Financial, LC.
Page 1.8
accounts equaled only $410,000, or 0.9% of total deposits for the Association. Mutual Federal currently does not offer money market accounts to its customers.
Borrowings serve as an alternative funding source for the Company to address funding needs for growth and to support control of deposit costs. In the recent past, the Company has not used borrowings, although if needed, the Association may obtain advances from the Federal Home Loan Bank of Chicago provided certain standards related to creditworthiness are met.
Since year end 2000, retention of earnings and the adjustment for accumulated other comprehensive income translated into an annual capital growth rate of 3.0% for the Association. Capital growth outpaced the Association’s asset growth rate, as Mutual Federal’s equity-to-assets ratio increased from 23.4% at year end 2000 to 27.9% at September 30, 2005. All of the Association’s equity was tangible. The addition of stock proceeds will serve to strengthen the Association’s capital position and competitive posture within its market area, as well as possibly support expansion into other nearby markets if favorable growth opportunities are presented.
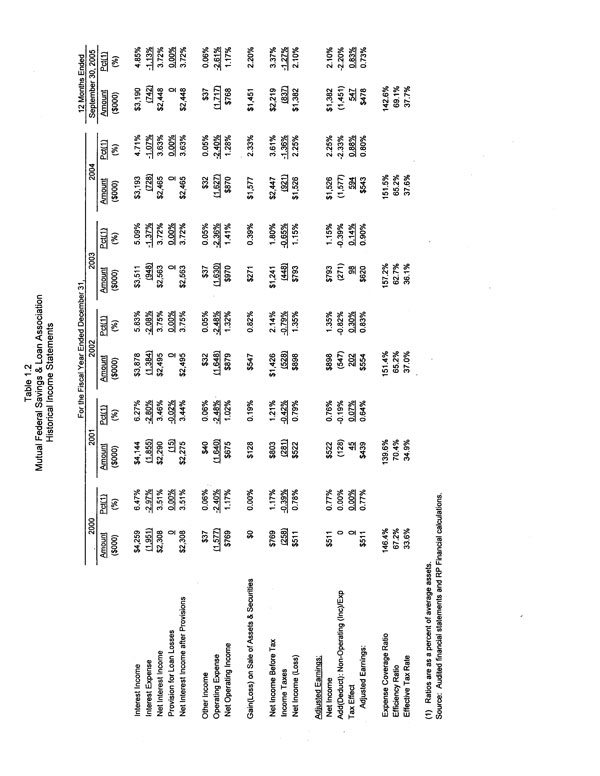
Income and Expense Trends
Table 1.2 shows the Association’s historical income statements for the past five fiscal years and the twelve months ended September 30, 2005. The Association reported positive earnings over that time period, ranging from a high of 2.25% of average assets in fiscal 2004 to a low of 0.74% of average assets during the fiscal year ended December 31, 2001. In general, the Association has reported an increasing level of earnings, on a return on average assets basis, over this time period. This has been largely attributable to significant levels of gains recognized on the sale of Freddie Mac stock, particularly since fiscal year 2002. At the same time, Mutual Federal has maintained the level of net interest income in the low interest rate environment that has existed in the past several years, and has experienced a moderate increase in the level of operating expenses. Net interest income and operating expenses represent the primary components of Mutual Federal’s core earnings.
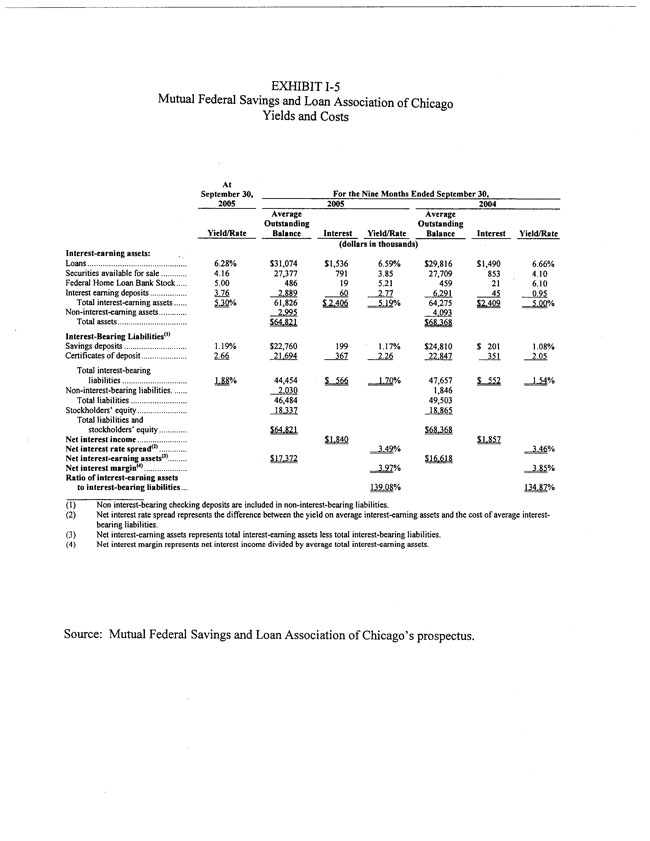
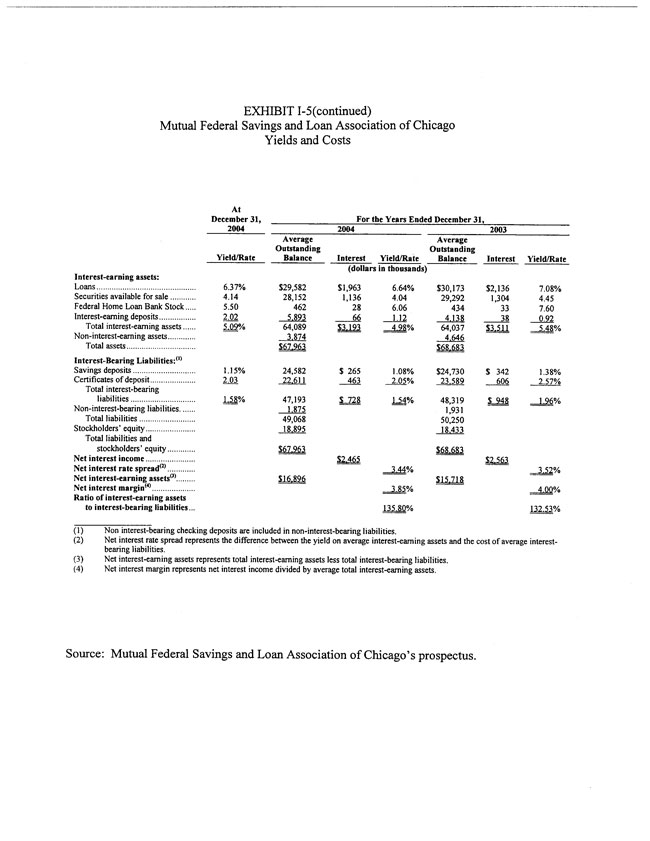
Mutual Federal maintained a relatively strong, but generally constant net interest income ratio throughout the period shown in Table 1.2, reflecting the yield-cost spreads maintained in the balance sheet (see Exhibit I-5). Over the past five years and the twelve months ended
RP Financial, LC.Page 1.9
RP Financial, LC.
Page 1.10
September 30, 2005, the Association’s net interest income to average assets ratio ranged from a high of 3.72% during 2003 and for the twelve months ended September 30, 2005 to a low of 3.44% during 2001. The higher net interest income ratio has resulted because of the higher capital position that the Association maintains compared to industry averages, which reduces interest expense levels. The decline in the interest expense ratio was in part attributable to the low interest rate environment of the past several years, notwithstanding that the Federal Reserve began raising interest rates in mid-2003. The Federal Reserve action has resulted in a flattening of the yield curve, limiting increases in yields earned on longer-term assets. Overall, the Association’s interest income ratio declined from 6.47% of average assets during 2000 to 4.85% of average assets during the most recent twelve month period, a decline of 162 basis points. Comparatively, over the same time period, the Association’s interest expense ratio declined from 2.97% of average assets to 1.13% of average assets, a decline of 184 basis points. The Association’s historical net interest rate spreads and yields and costs are set forth in Exhibits I-3 and I-5.
Non-interest operating income has not been a noticeable earnings contributor for the Association because of the lack of significant balances of checking accounts that would contribute deposit account fee and service charge income. The Association began offering checking accounts approximately two years ago, and maintained approximately $410,000 of such accounts at September 30, 2005. The Association’s limited level of other banking products and services also contribute to the current low level of non-interest income. Over the past five years and the twelve months ended September 30, 2005, non-interest operating income ranged from a low of 0.05% of average assets during 2002 through 2004, to a high of 0.06% of average assets during 2001 and for the twelve months ended September 30, 2005.
Operating expenses represent a major component of the Association’s income statement, ranging from a low of 2.40% of average assets during 2002 to a high of 2.61% of average assets for the twelve months ended September 30, 2005. Expenses have been increasing at a moderate pace from December 31, 2000 to the twelve months ended September 30, 2005 due to the increase in compensation and employee benefits and overall cost of business operations. The moderate increase in operating expenses and the lack of asset growth within the Association has resulted in the operating expense ratio of 2.61% for the twelve months ended September 30,
RP Financial, LC.
Page 1.11
2005 and ultimately has affected the level of earnings for Mutual Federal. Upward pressure will be placed on the Association’s operating expense ratio following the stock offering, due to expenses associated with operating as a publicly-traded company, including expenses related to the stock benefit plans. At the same time, the increase in capital realized from the stock offering will increase the Association’s capacity to leverage operating expenses through pursuing a more aggressive growth strategy.
Overall, the general trends in the Association’s net interest income ratio and operating expense ratio since fiscal 2000 reflect a slight decline in core earnings, as indicated by the Association’s expense coverage ratio (net interest income divided by operating expenses). Mutual Federal’s expense coverage ratio equaled 146.4 times in 2000, versus a comparable ratio of 142.6 times for the twelve months ended September 30, 2005. The reduction in the expense coverage ratio was the result of an increase in the operating expense ratio, offset in part by a smaller increase in the net interest income ratio. Similarly, Mutual Federal’s efficiency ratio (operating expenses, net of amortization of intangibles, as a percent of the sum of net interest income and other operating income) of 69.1% for the twelve months ended September 30, 2005 was less favorable than the 67.2% efficiency ratio maintained for fiscal 2000.
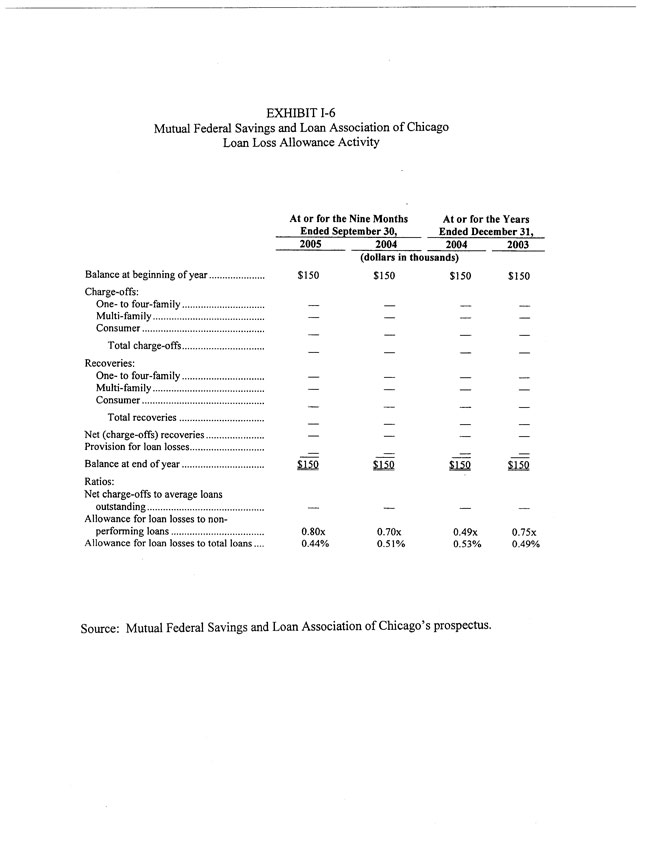
Over the past five fiscal years, maintenance of favorable credit quality measures has served to limit the amount of loss provisions established during the period. Since fiscal 2000, the only loan loss provisions booked by the Association totaled $15,000 in fiscal 2001. As of September 30, 2005, the Association maintained valuation allowances of $150,000, equal to 0.44% of net loans receivable and 79.8% of non-accruing loans. Exhibit I-6 sets forth the Company’s loan loss allowance activity during the past five and three-quarter fiscal years.
Non-operating gains and losses have been a significant factor in the Association’s earnings since 2001 and reached a high of $1.6 million or 2.33% of average assets in 2004. These gains are attributed to Mutual Federal’s periodic sales of Freddie Mac stock, which have been completed in order to realize gains in the value of this investment. However, the gains realized from the sale of investment securities are not considered to be part of the Association’s core earnings, given the volatile and non-recurring nature of such income.
RP Financial, LC.
Page 1.12
The Association recorded an effective tax rate of 37.7% for the twelve months ended September 30, 2005, a rate that was in line with recent historical trends. As set forth in the prospectus, the Association’s effective statutory tax rate equals 39%.
Interest Rate Risk Management
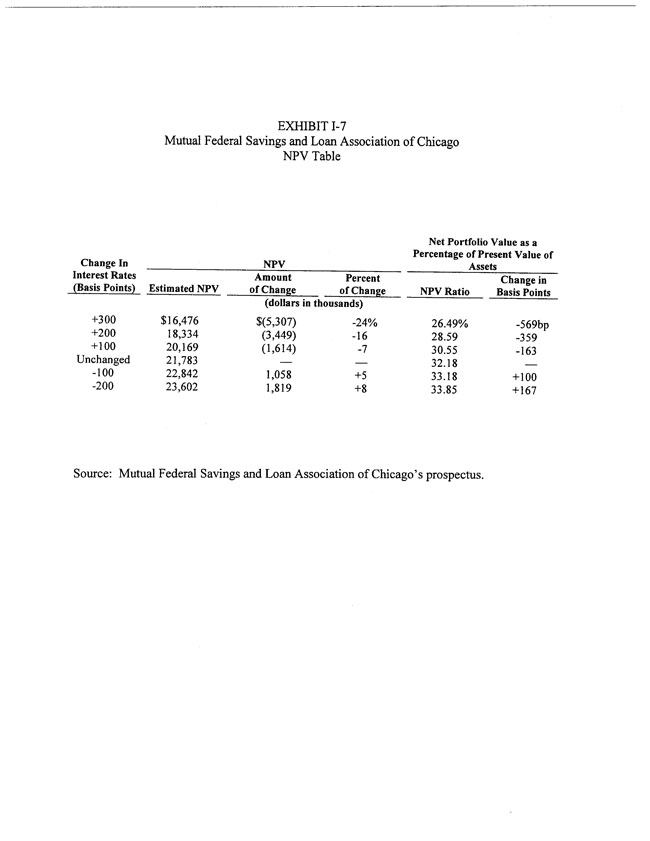
The Association’s balance sheet is liability-sensitive in the short-term (less than one year) and, thus, the net interest margin will typically be adversely affected during periods of rising and higher interest rates. As of June 30, 2005, the Net Portfolio Value (“NPV”) analysis provided by the OTS indicated that a 200 basis point instantaneous and sustained increase in interest rates would result in a 16% decline in the Association’s NPV (see Exhibit I-7). Mutual Federal utilizes the results provided by the OTS of the interest rate sensitivity to provide certain analyses of interest rate risk positions.
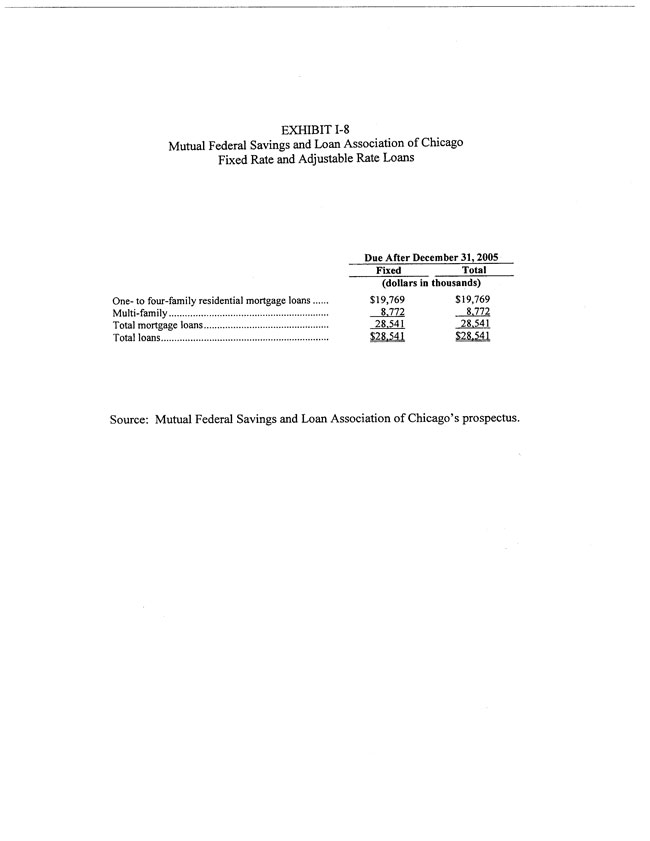
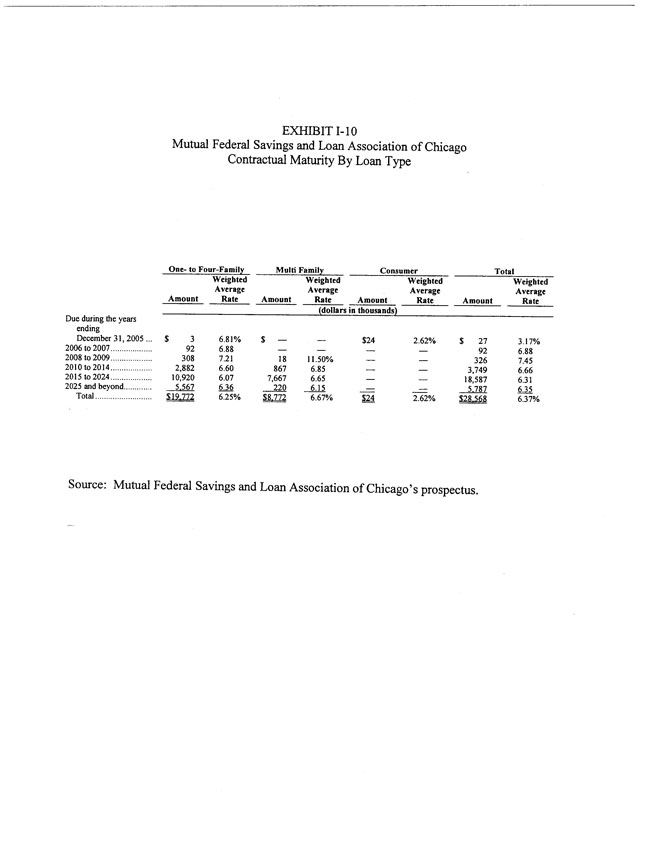
The Association implements certain strategies to manage interest rate risk, particularly with respect to seeking to limit the repricing mismatch between interest rate sensitive assets and liabilities. The Association manages interest rate risk by maintaining a high equity-to-assets ratio, maintaining a balance of short term cash and cash equivalents, investing in adjustable rate mortgage-backed securities and diversifying into shorter-term fixed rate residential loans and second mortgage loans. As of September 30, 2005, all of the Association’s total loans due after December 31, 2005 were fixed rate in nature, consisting of balances of 1-4 family residential mortgage loans and loans secured by multi-family property (see Exhibit I-8).
On the liability side of the balance sheet, management of interest rate risk has been pursued through maintaining a significant balance of savings accounts, and offering attractive rates on certain longer term time deposits in low and declining interest rate environments.
The infusion of stock proceeds will serve to reduce the Association’s interest rate risk exposure, as most of the net proceeds will be redeployed into interest-earning assets and the increase in the Association’s capital will lessen the proportion of interest rate sensitive liabilities funding assets.
RP Financial, LC.
Page 1.13
Lending Activities and Strategy
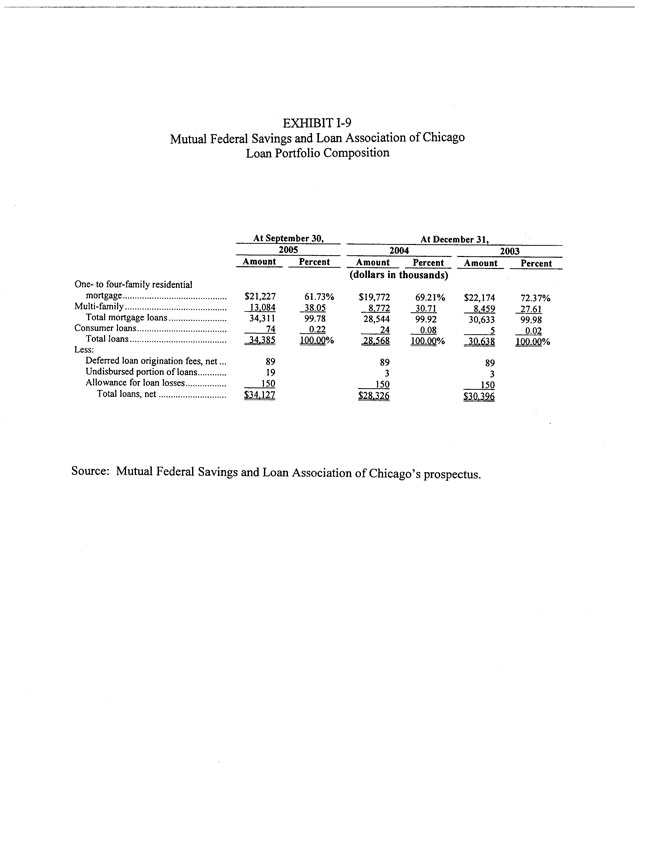
Mutual Federal’s lending activities have traditionally emphasized the origination of first mortgage loans for the purchase or refinancing of 1-4 family residential mortgage loans (including second mortgage loans), and these loans continue to comprise the largest component of the Association’s loan portfolio. Beyond 1-4 family loans, lending diversification by the Association has emphasized multi-family real estate loans and a very small amount of consumer loans. Going forward, the Association’s lending strategy is to pursue further diversification of the loan portfolio, such as home equity loans. However, the origination and purchase of 1-4 family residential mortgage loans is expected to remain as the Association’s most prominent lending activity. Exhibit I-9 provides historical detail of Mutual Federal’s loan portfolio composition over the past two fiscal years and as of September 30, 2005 and Exhibit I-10 provides the contractual maturity of the Association’s loan portfolio by loan type as of December 31, 2004.
Mutual Federal originates fixed rate 1-4 family residential mortgage loans, and the current practice is to retain substantially all originations for its own portfolio. Such loans totaled $21.2 million, or 61.7% of total loans as of September 30, 2005. Included within these 1-4 family loans were $544,000 in second mortgage loans. For residential lending activities, the Association requires a loan-to-value (“LTV”) ratio of 80% or less for 1-4 family loans and second mortgage loans. All of the Association’s 1-4 family and second mortgage lending volume consist of fixed rate loans, as Mutual Federal does not offer adjustable rate mortgage loans. Fixed rate residential loans are generally originated with terms of up to 20 years and for owner occupied 1-4 family residential loans, 30 years. The second mortgage loans are made with maturities of 15 years or less and are secured by the borrower’s property. Loan origination activities are generally obtained through in-house loan representatives, existing or past customers and referrals.
The second largest loan type in Mutual Federal’s loan portfolio consists of multi-family and mixed use real estate loans. These loans are generally secured by small apartment buildings with less than 10 units and may contain commercial units such as storefronts. Multi-family loans totaled $13.1 million, or 38.1% of total loans as of September 30, 2005, an increase from $8.5 million as of December 31, 2003. Mutual Federal originates multi-family loans up to a
RP Financial, LC.
Page 1.14
maximum LTV ratio of 75% of the lower of the sale price or the appraised value of the mortgaged property securing the loan and up to 80% if owner occupied. At September 30, 2005, the Association’s largest multi-family loan was a $1.3 million loan. Growth of multi-family loans is expected to continue to be an area of lending emphasis for the Association, in which most of the growth will be realized through continued originations by in-house loan personnel.
Mutual Federal also offers a small number of consumer loans, secured by deposits to the Association’s customers. Consumer loans amounted to $74,000, or 0.2% of Mutual Federal’s total loan portfolio at September 30, 2005. The Association does not engage in lending activities secured by non-residential real estate, commercial business assets or property under construction.
Loan origination activities are primarily concentrated in Cook County. The Association’s loans are all underwritten, processed, and serviced at Mutual Federal’s single office location. Due to adequate lending opportunities in the communities served by the Association, and since the Association retains loans for portfolio Mutual Federal has not engaged in loan purchases in recent years.
Asset Quality
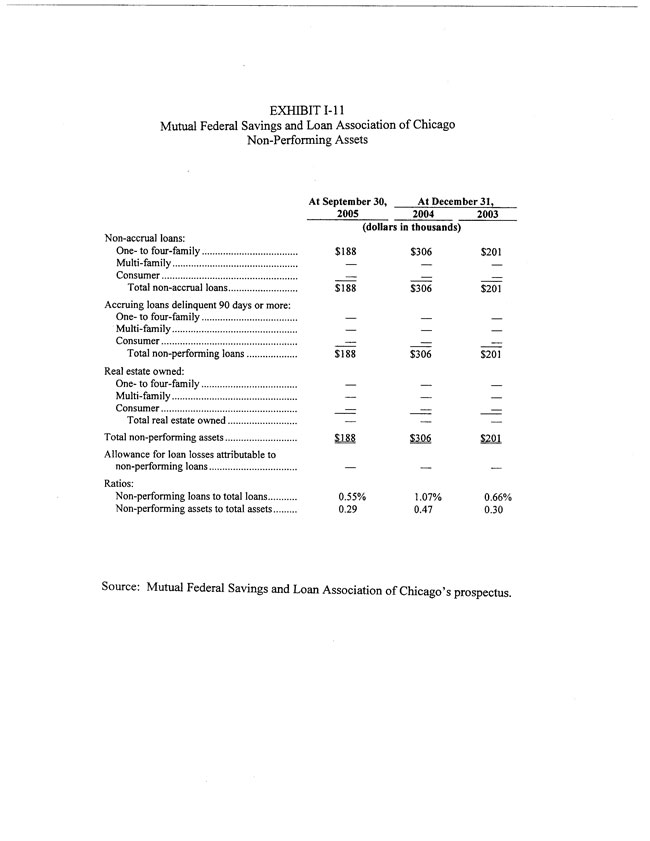
The Association’s conservative lending practices have generally supported favorable credit quality measures. Over the past two fiscal years and at September 30, 2005, Mutual Federal’s balance of non-performing assets ranged from a high of 0.47% of assets at year end 2004 to a low of 0.29% of assets at September 30, 2005. As shown in Exhibit I-11, the Association’s balance of non-performing assets at September 30, 2005 consisted of $0.2 million of non-accruing loans, equal to 0.55% of total assets. The non-accruing loan balance included loans secured by residential real estate.
To track the Association’s asset quality and the adequacy of valuation allowances, Mutual Federal has established detailed asset classification policies and procedures which are consistent with regulatory guidelines. Detailed asset classifications are reviewed quarterly by senior management. Pursuant to these procedures, when needed, the Association establishes additional valuation allowances to cover anticipated losses in classified or non-classified assets, and to replace loan charge-offs. The required level of valuation allowances is based on historical loss experience, the types and amounts of loans in portfolio, adverse situations that may affect
RP Financial, LC.
Page 1.15
borrower’s ability to repay, estimated values of underlying collateral, peer group information and prevailing economic conditions. As of September 30, 2005, the Association maintained valuation allowances of $150,000, equal to 0.44% of net loans receivable and 79.79% of non-performing loans.
Funding Composition and Strategy
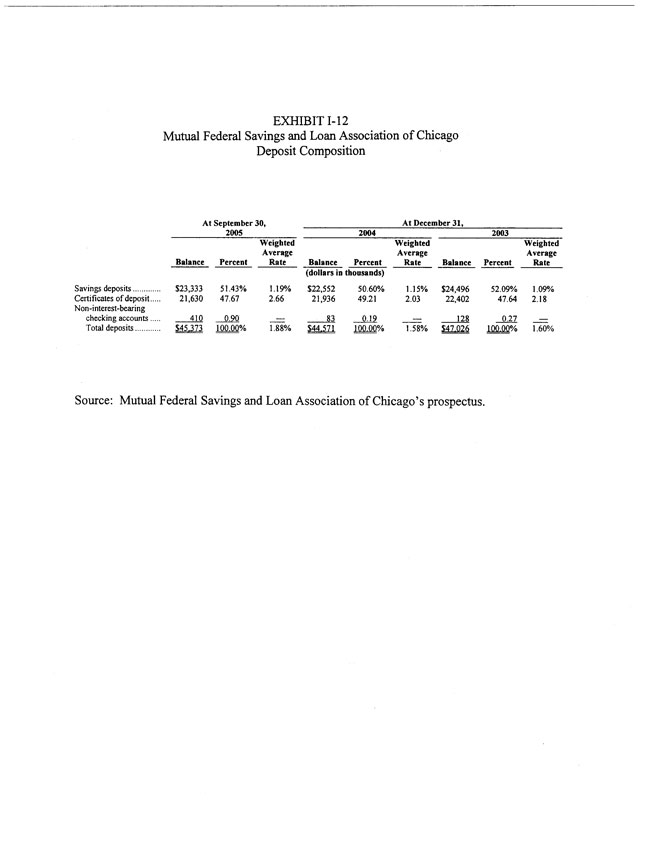
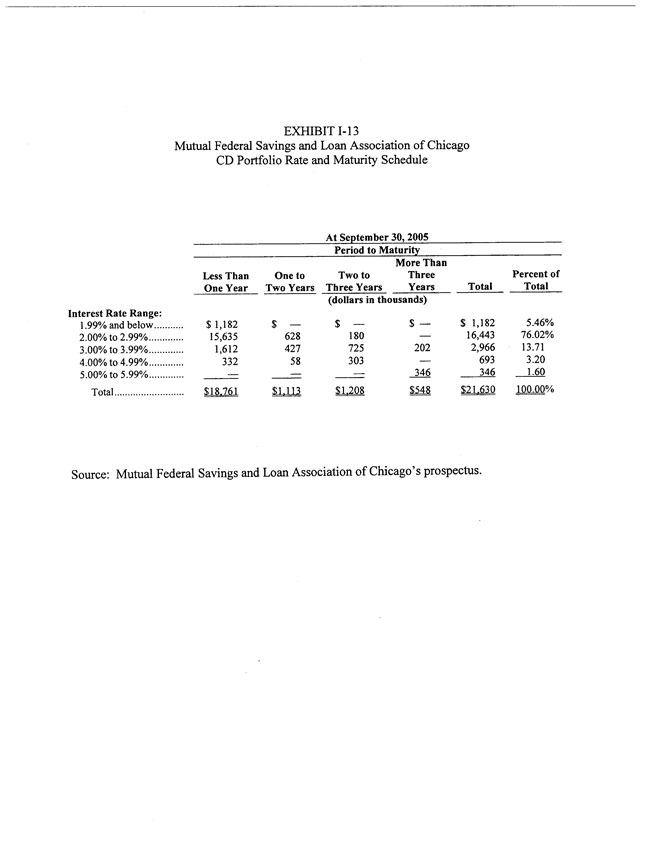
Deposits have been the Company’s sole source of interest bearing funds since fiscal 2000. As of September 30, 2005, deposits totaled $45.4 million, which reflects 0.23% compounded annual growth since the end of fiscal 2000. Exhibit I-12 sets forth the Association’s deposit composition for the past two years and at September 30, 2005 and Exhibit I-13 provides the interest rate and maturity composition of the CD portfolio at September 30, 2005. Lower costing savings accounts totaling $23.3 million comprised approximately 51% of the Association’s deposits at September 30, 2005 (see Exhibit I-12). The Association introduced non-interest-bearing or checking accounts in 2003. These accounts contributed only $410,000 or 0.90% to the total deposit base but have been growing since they were introduced to Mutual Federal’s customers in 2003. The transaction and savings accounts are beneficial to the Association in terms of lower cost liabilities and interest rate risk characteristics.
The balance of the deposit base is comprised of CDs, the majority of which have remaining maturities of one year or less. As of September 30, 2005, the CD portfolio totaled $21.6 million or 47.7% of total deposits. A total of $18.8 million or 86.7% of the CDs were scheduled to mature in one year or less. As of September 30, 2005, jumbo CDs (CD accounts with balances of $100,000 or more) amounted to $6.2 million or 28.6% of total CDs. The Association currently does not maintain any brokered CDs.
Borrowings serve as an alternative funding source for the Association to facilitate management of funding costs and interest rate risk. Due to Mutual Federal’s current level of available funds for operations, the Association has not needed to use borrowings. If in time the Association feels borrowings are necessary, such advances would be obtained from the Federal Home Loan Bank of Chicago.
RP Financial, LC.
Page 1.16
Subsidiaries and Other Activities
Mutual Federal will be the only subsidiary of Mutual Bancorp. The only subsidiary of Mutual Federal is EMEFES Service Corporation. EMEFES Service Corporation was established to provide insurance brokerage services to the Association’s customers. For the nine months ended September 30, 2005, EMEFES Service Corporation had earned $3,000 in brokerage commissions.
Legal Proceedings
Mutual Federal is involved in routine legal proceedings occurring in the ordinary course of business which, in the aggregate, are believed by management to be immaterial to the financial condition of the Association.
RP® Financial, LC.
Page 2.1
II. MARKET AREA
Introduction
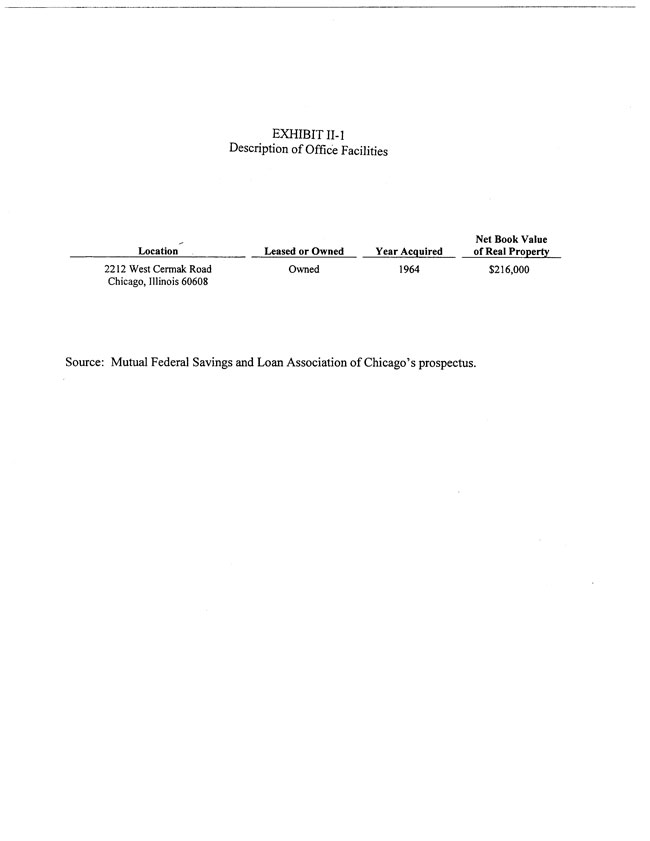
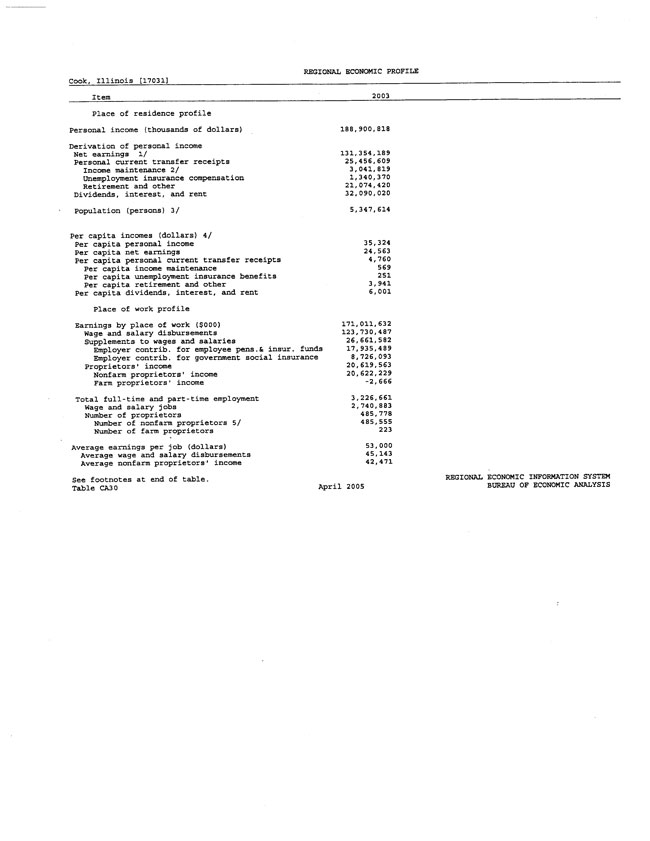
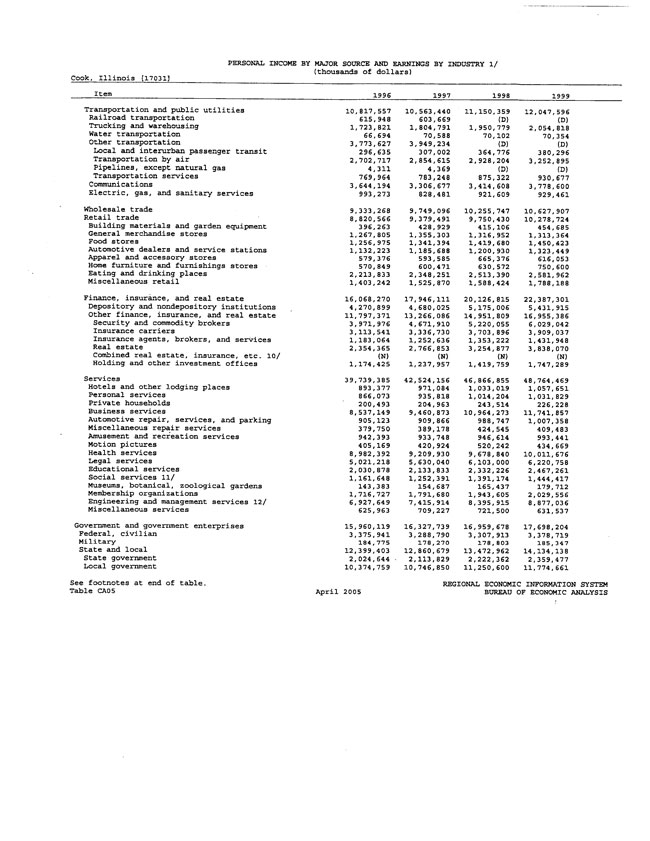
The Association conducts operations in the central portion of Cook County, Illinois, southwest of central Chicago, through its single office location at 2212 West Cermak Road. The Association’s primary lending market, as defined by the CRA delineated area, consists of the area bounded by Interstate 290 to the north, Halsted Street to the east, 55th Street to the south, and Harlem Street to the west. A description of the Association’s single office facility is shown in Exhibit II-1. The remaining business operations are conducted in surrounding areas. The population of Cook County was 5.4 million as of 2005, representing a slight increase from the 2000 census, and thus the Chicago MSA represents one of the largest metropolitan statistical areas in the United States, with a largely diversified economy, employment base, and population base. The Association’s immediate market area is characterized by mostly residential properties and a high proportion of Hispanic residents.
The Association holds only a minor market share of deposits in Cook County (approximately 0.03%), and thus has potential for additional growth if given the opportunity to establish a wider branch office network with greater access to customers. Mutual Federal competes with a large number of national, regional and locally-based financial institutions. The primary larger financial institution competitors include JPMorgan Chase Bank N.A., LaSalle Bank N.A., Harris Trust and Savings Bank, Northern Trust Company, Corus Bank, N.A.., and CitiBank, FSB. In addition, the Association faces competition from mortgage banking companies, consumer finance companies, investment houses, mutual funds, insurance companies and other financial intermediaries. Over the past several years, the competitive factors have intensified with the growth of electronic delivery systems (particularly the Internet).
Future growth opportunities for the Association depend on future performance of the regional and local economy, demographic growth trends and the nature and intensity of the competitive environment. These factors have been briefly examined in the following pages to help determine the growth potential that exists for the Association, the relative economic health of the Association’s market area, and the relative impact on value.
RP® Financial, LC.
Page 2.2
National Economic Factors
The business potential of a financial institution is partially dependent on the future operating environment and growth opportunities for the banking industry and the economy as a whole. Trends in the national economy, such as employment and gross national product growth, generally improved during 2005, although there remains uncertainty about the near term future, particularly in the areas of the unknown resolution of the war in Iraq, the impact of the hurricanes that hit the Gulf Coast region, the current unstable price of oil, and the ability of the current presidential administration to push forward agenda items, including a modification to the social security program, all of which have the potential to impact future economic growth. The current and projected size of government spending and deficits also, has the ability to impact the longer-term economic performance of the country. The major stock exchange indices remained relatively stable during the most recent twelve month period, with market concerns consisting primarily of fears over world events, corporate earnings performance and future growth prospects. Various other indicators show a relatively strong economy, such as consumer spending and improving industrial capacity utilization.
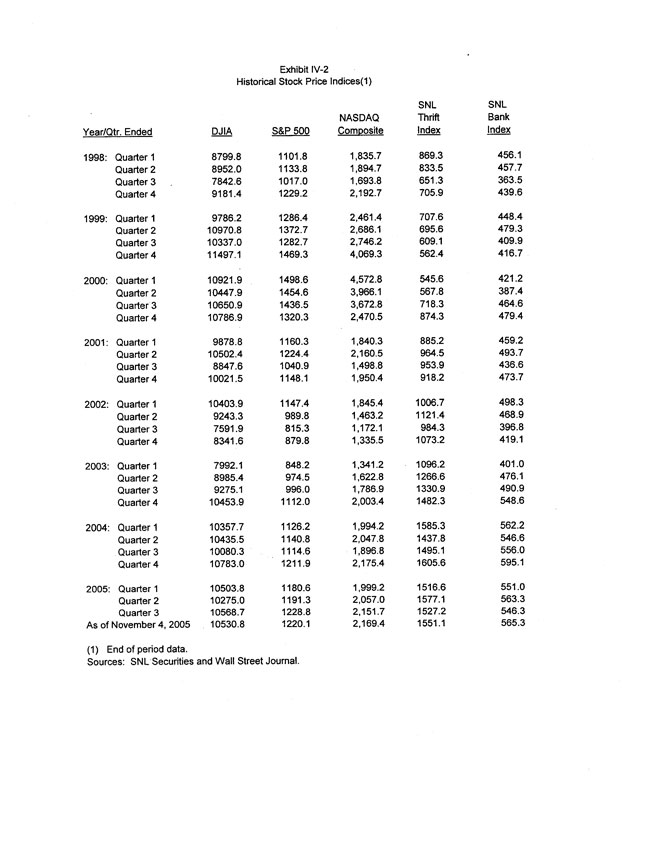
As an indication of the changes in the nation's stock markets over the last twelve months, as of September 30, 2005, the Dow Jones Industrial Average closed at 10568.70, an increase of 4.6% from September 30, 2004, while the NASDAQ Composite Index stood at 2151.69, an increase of 11.84% over the same time period. The Standard & Poors 500 Index totaled 1228.81 as of September 30, 2005, an increase of 9.3%.
Regarding factors that most directly impact the banking and financial services industries, in general, the housing market has remained very strong in relation to general economic performance, as housing starts, housing prices and land values have continued to increase at rates far above the inflation rate. While currently there is more uncertainty about the future volumes of financial institution lending activity, due primarily to the recent pattern of rising short-term interest rates, specific regions of the country remain quite strong in terms of both residential and commercial development. This represents a key positive factor for Mutual Federal’s business strategy, as the Association is active in the residential housing market in the local market area.
RP® Financial, LC.
Page 2.3
Economic and Interest Rate Environment
The future success of Mutual Federal’s operations is partially dependent upon various national and local economic trends. Trends in the national economy have improved during 2005, representing a more positive trend over the slow pace of growth experienced by the nation since the fall of 2000. Inflation has been increasing the last few years because of the effect of energy costs and is now at an annual rate of 4.7% for September 2005. The economic slowdown of 2000 to 2002, the results of the reaction to the September 11 attacks, and other actions by the federal government has eliminated the previous Federal budget surplus and has caused a record budget deficit for fiscal 2004 and 2005. The economic recovery has also kept unemployment rates at relatively low levels, which remained at 5.1% as of September 2005. However, a large number of potential workers have stopped seeking employment and thus were not counted among the unemployed. The unemployment rate is expected to increase somewhat due to the impact of the hurricanes that affected the Gulf Coast. During 2005 the economy has showed signs of recovery, although certain sectors of the economy remain stagnant. The GDP increased by 3.3% in the second quarter of 2005 and a revised 3.8% in the first quarter of 2005, indicating continued strength to the economy.
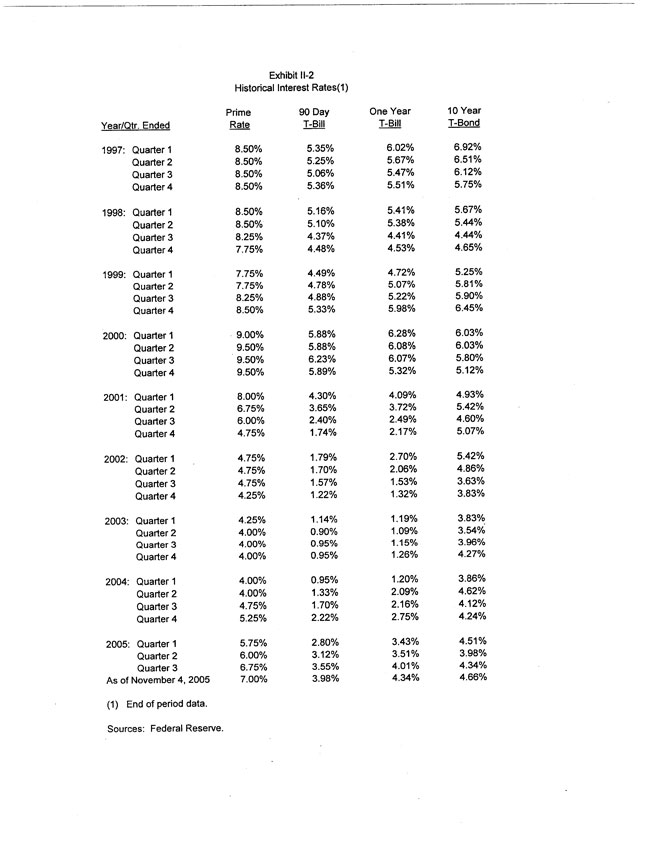
Short term U.S. Treasury interest rates have increased over the past year. Following a period of time at which the Federal Reserve kept key market interest rates at historical lows not seen since the 1950s, the Fed has begun slowly, but steadily increasing the federal funds and overnight interest rates in order to ward off any possibility of inflation. As of the latest Fed rate increase, effective in September 2005, the Fed Funds rate was 3.75%, up from 1.00% in early 2004, but down from 6.50% at the beginning of 2001, while the Discount Rate stood at 4.75%, up from 2.00% in early 2004, but down from 6.00% at January 1, 2001. Current indication from the Fed leads many analysts to predict that the future direction for interest rates will still be upward, however at a moderate pace. The effect of these interest rate cuts has been most evident in short term rates, which have increased more than longer term rates, resulting in a flatter treasury yield curve. As of September 30, 2005, one- and ten-year U.S. government bonds were yielding 4.09% and 4.39%, respectively, compared to 2.21% and 4.14%, respectively, as of September 30, 2004. See Exhibit II-2 for historical interest rate trends.
RP® Financial, LC.
Page 2.4
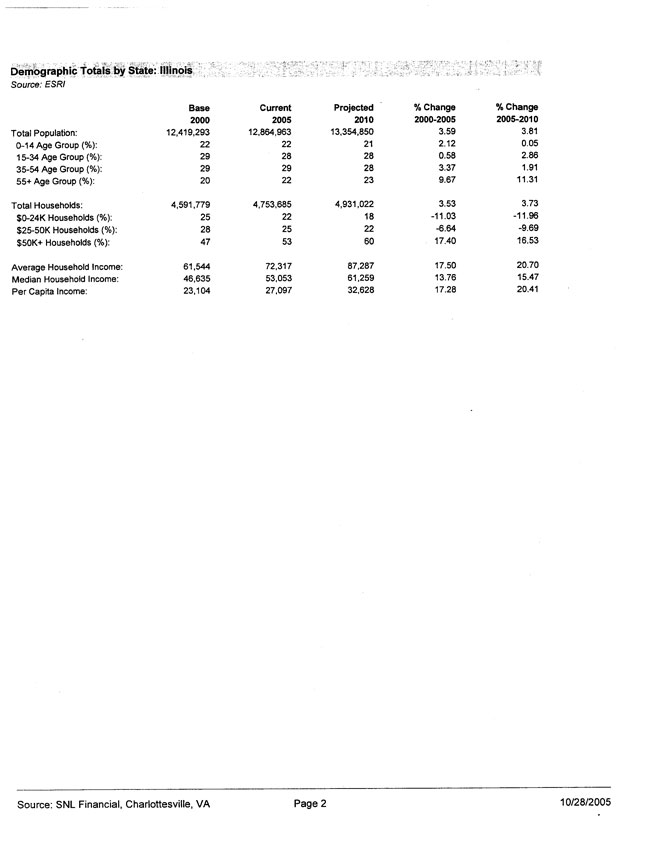
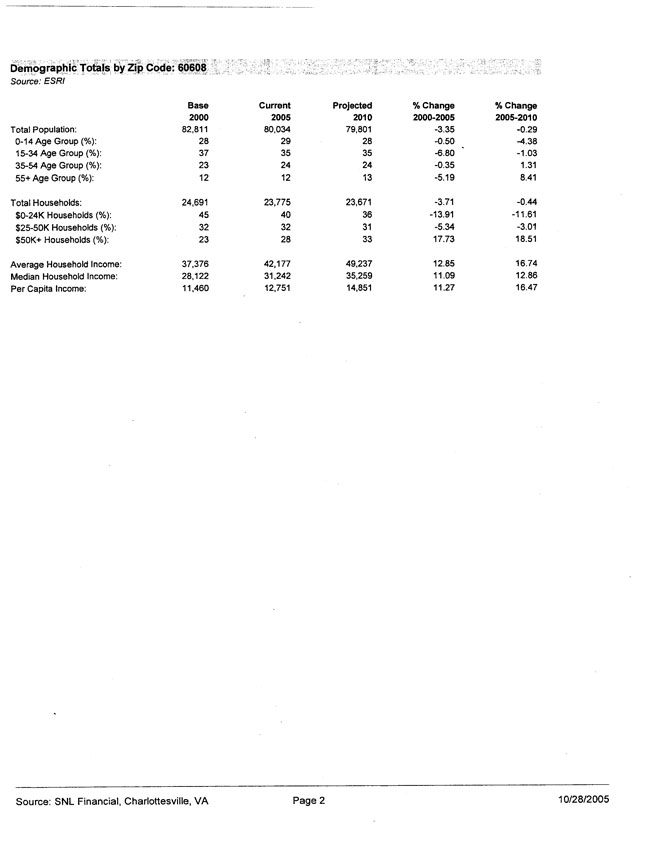
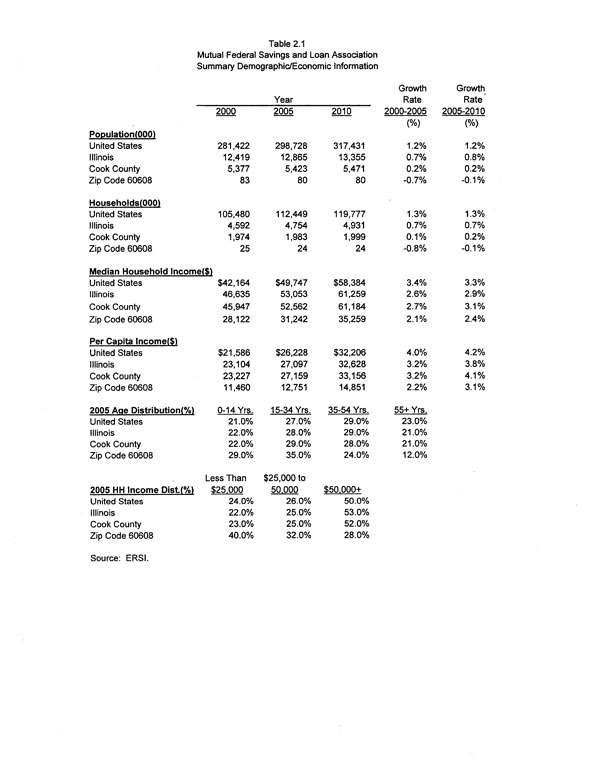
Market Area Demographics
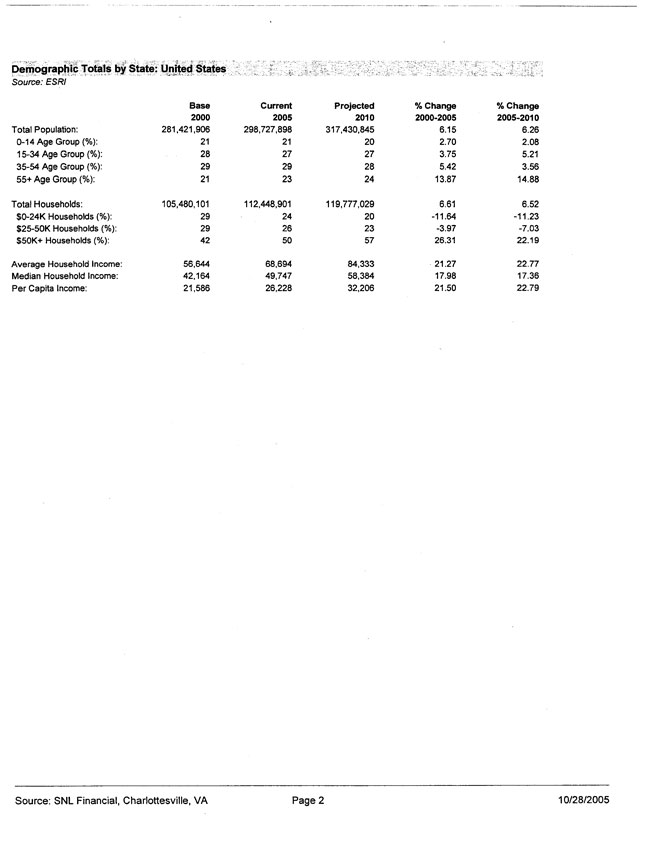
Table 2.1 presents information regarding the demographic and economic trends for the Association’s market area county and immediate zip code for the office location from 2000 to 2005 and projected through 2010, with additional data provided in Exhibit II-3. Data for the nation and the State of Illinois is included for comparative purposes. While Cook County maintained a population of approximately 5.4 million as of 2005, the Association’s zip code of 60608 contained a total population of approximately 80,000 as of the same date. Cook County reported annual population growth of 0.2% from 2000 to 2005, a rate lower than the statewide rate of 0.7% annually, and the Association’s zip code of 60608 reported a population decline of 0.7% annually, an unfavorable statistic. These trends are projected to continue over the next five years through 2010.
These population trends represent a less than desirable trend for the Association as the market area has revealed relatively weak performance. The larger overall population base of Cook County provides an adequate source of business for financial institutions, although the Association is a smaller institution that faces many competitors in the local market area. As shown in Table 2.1, the number and growth of households performed somewhat better over the same time period, although this reflects a national trend towards a lower average household size and an increase in the number of households overall. In addition, the population and household growth trends described above are forecast to remain relatively constant over the next five years, indicating that the Association’s business prospects are expected to remain stable in the foreseeable future. The unfavorable demographic trends also provide support for the need to seek an acquisition partner that would provide the Association with customers in a different local market area, one with better demographic trends.
Table 2.1 also details the age distribution of the residents of Cook County and the Association’s zip code of 60608, and reveals that, overall the immediate market area zip code has a younger age distribution of residents in comparison to Cook County and the state of Illinois as a whole. In particular, zip code 60608 reported a higher proportion of residents with ages under 34 years, than the comparative areas.
RP® Financial, LC.
Page 2.6
Examination of another characteristic of the Association’s market area, median household income and per capita income, revealed that the immediate market area zip code had materially lower per capita and household income levels in comparison to Cook County as a whole and the state overall. For example, per capita income in zip code 60608 was less than half of the Cook County and statewide averages. The relatively low income levels indicate the potential for reduced levels of financial institution deposits, deposit growth and overall need for financial institution services. Local household income distribution data also revealed a noticeably lower overall income level in the local zip code served.
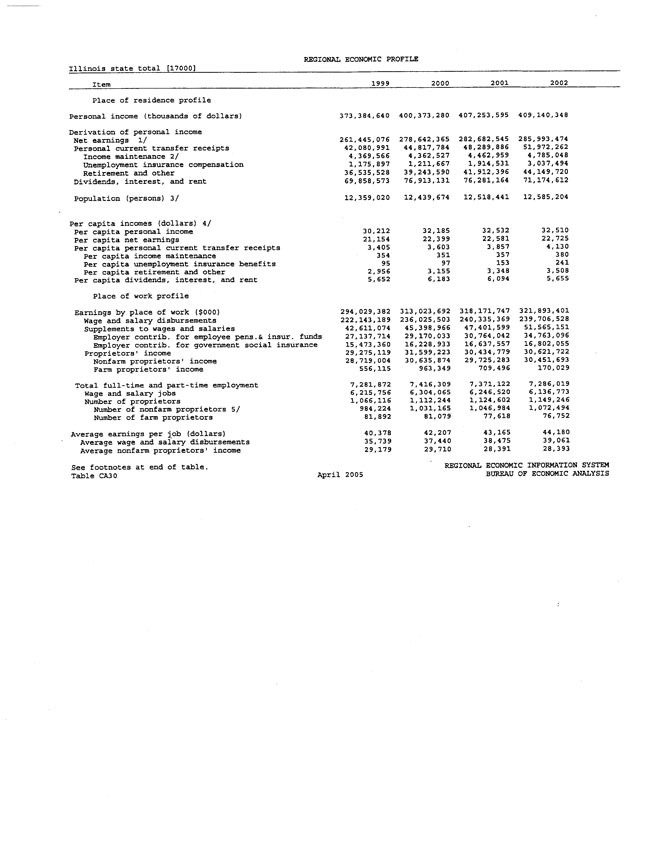
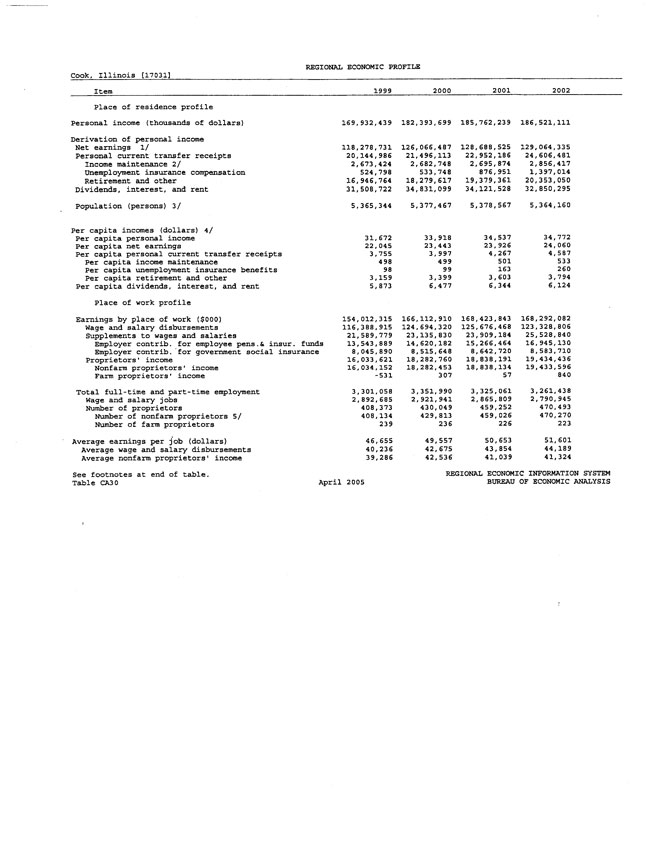
Local Economy
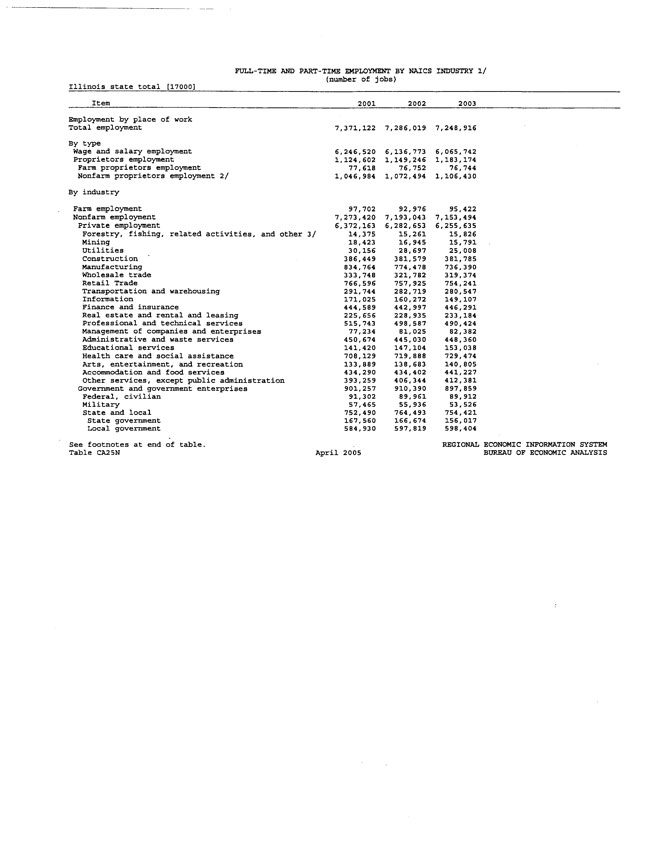
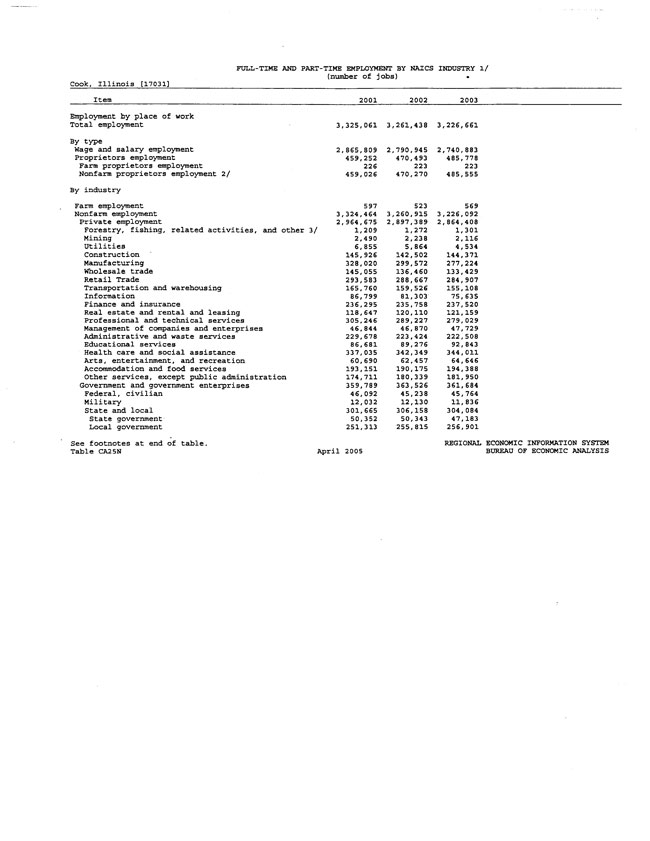
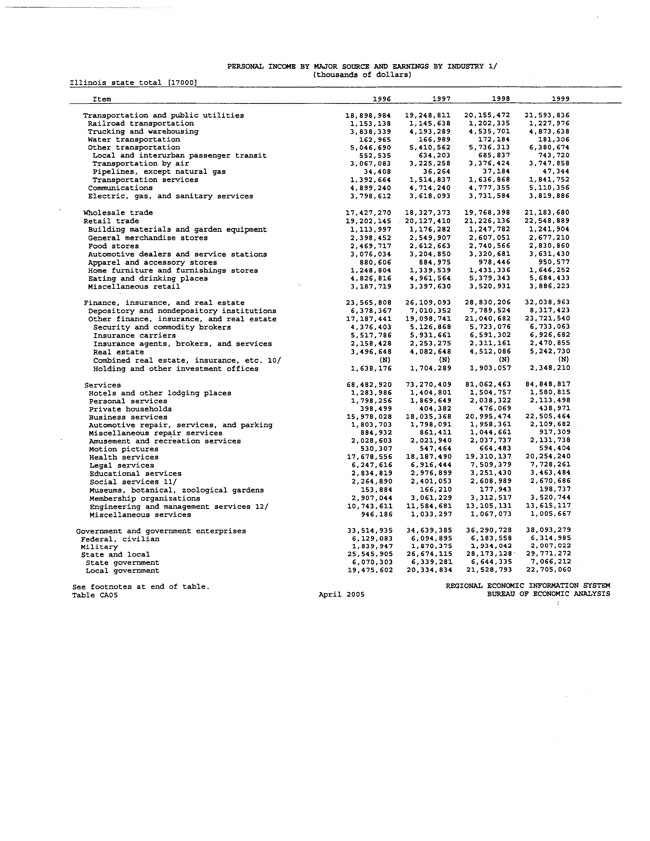
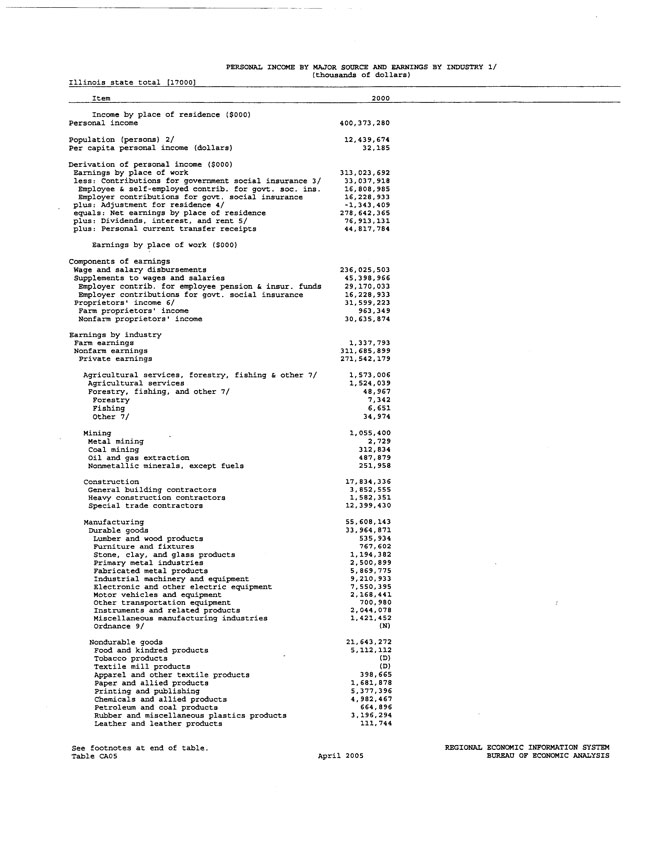
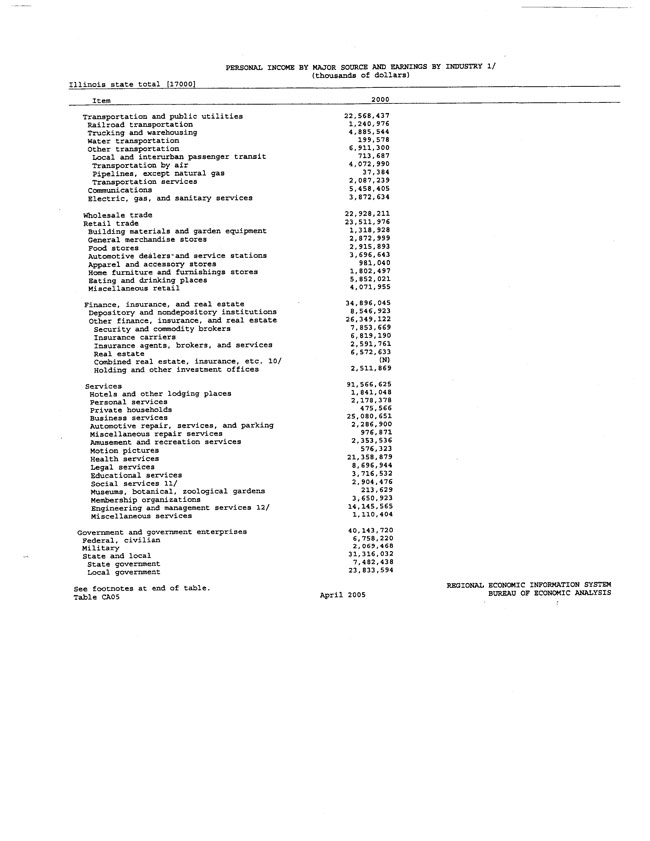
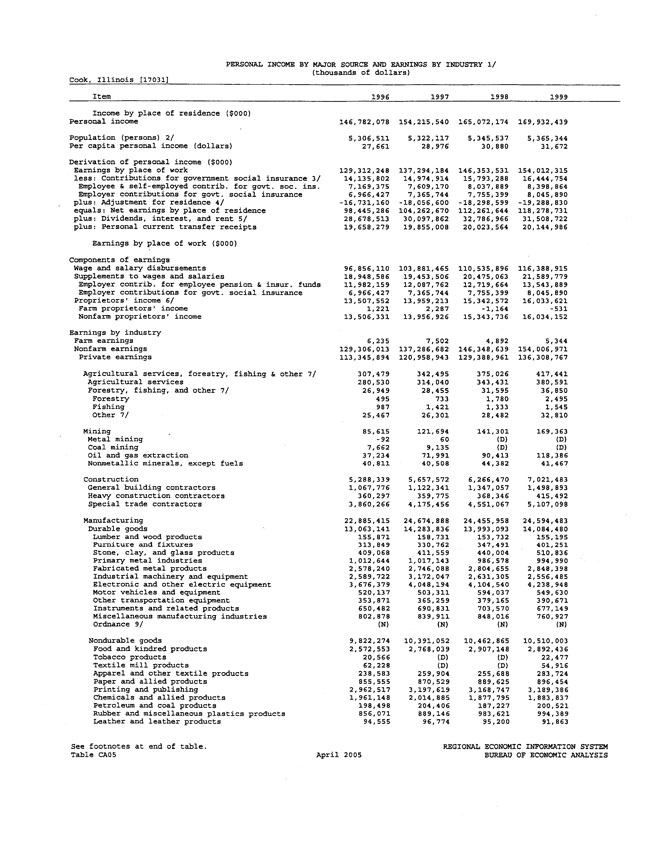
Due to the overall large size of the Chicago metropolitan area population base and economy, the Association operates in a very diversified economic and demographic area, where all economic sectors are fully represented. As shown in Table 2.2 below, the State of Illinois and Cook County both reported the largest proportion of employment in services, wholesale/retail trade, and government, indicative of a relatively diversified employment base. The state of Illinois recorded a higher level of manufacturing employment, while Cook County recorded a higher level of finance, insurance, and real estate. Overall, however, the employment base of Cook County was similar to the statewide averages, indicative of the large economy in the Chicago area. See Exhibit II-4 for additional details.
Table 2.2
Primary Market Area Employment Sectors
(Percent of Labor Force)
| Employ. Sectors | | Illinois | | Cook County | |
| Services | | | 40.0 | % | | 44.2 | % |
| Wholesale/Ret. Trade | | | 14.8 | | | 13.0 | |
| Government | | | 12.4 | | | 11.2 | |
| Manufacturing | | | 10.2 | | | 8.6 | |
| Finance, Ins., Real Estate | | | 9.4 | | | 11.1 | |
| Transportation/Public Util. | | | 4.2 | | | 5.0 | |
| Construction | | | 5.3 | | | 4.5 | |
| Agriculture | | | 1.3 | | | 0.2 | |
| Other | | | 2.4 | | | 2.2 | |
| | | | 100.0 | % | | 100.0 | % |
Source: REIS DataSource.
RP® Financial, LC.
Page 2.7
As shown in Table 2.3, similar to national trends, the unemployment rate in Illinois and Cook County decreased in the last twelve months. Both Illinois and Cook County had unemployment rates above the national average, however, an unfavorable sign as it reflects a certain weakness to the job market for workforce employers.
Table 2.3
Market Area Unemployment Trends
| Region | | | August 2004 Unemployment | | | August 2005 Unemployment | |
| United States | | | 5.4 | % | | 4.9 | % |
| Illinois | | | 6.2 | % | | 5.7 | % |
Cook County | | | 6.5 | % | | 6.4 | % |
Source: U.S. Bureau of Labor Statistics.
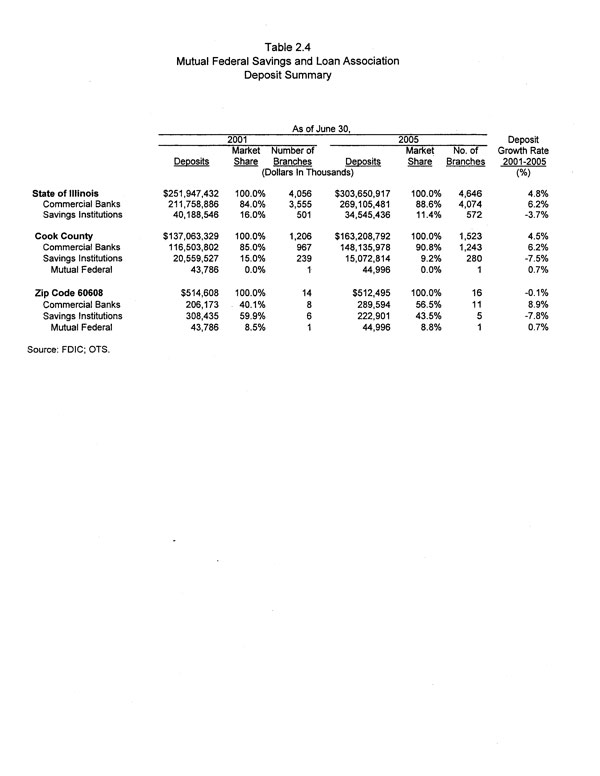
Competition
Due to the overall size of the Cook County market in which the Association operates, Mutual Federal holds a minimal market share of deposits of 0.03% (see Table 2.4). With the current market share below 1%, additional deposit growth in the market area is likely achievable, particularly as Mutual Federal competes with a number of regional and super-regional competitors, along with a number of locally-based financial institutions. However, within the specific zip code of 60608, Mutual Federal holds an 8.8% market share of deposits, and is one of 16 financial institutions operating in the zip code. The major deposit competitors in the zip code 60608 areas are Citibank, FSB, Metropolitan Bank and Trust Co., JPMorgan Chase Bank, N.A., and Washington Federal Bank for Savings. This indicates that additional local deposit market share may be more difficult to obtain.
Table 2.4 displays deposit trends for thrifts and commercial banks in Illinois, Cook County and zip code 60608. Since 2001, deposit growth in Illinois has been positive for commercial banks, but recently has been decreasing for savings institutions. Commercial banks continue to maintain the majority of deposit funds in the state of Illinois, approximately 88% of all deposits as of the most recent date.
RP® Financial, LC.
Page 2.8
RP® Financial, LC.
Page 2.9
Within zip code 60608, the location of the Association’s office, Mutual Federal recorded an increase in the market share of deposits of 0.3% since 2001, representing an annualized growth rate of 0.7%, while the zip code total deposits decreased by an annual rate of 0.1% over the four-year period. This resulted in an increase in Mutual Federal’s deposit market share from 8.5% in 2001 to 8.8% in 2005. Overall, commercial banks increased deposits in zip code 60608 at an annual rate of 8.9%, while savings institutions recorded a decline in deposits at an annual rate of 7.8%. Commercial banks have approximately 56% of deposit funds in zip code 60608. These deposit base characteristics indicate that the local market surrounding the Association’s office is relatively stable, with little growth potential.
Summary
The overall condition of the primary market area can be characterized as stable, with minimal growth potential in the immediate zip code area served and moderate growth potential in the general market area surrounding the Association’s office facility, based on regional population and economic projections. The overall total population base within the Association’s market area does provide the potential for additional banking customers, particularly in light of the current market share of deposits held by the Association. Going forward, in view of the local demographic and economic trends and the numbers and types of competitors in the market area, the competition for deposits is expected to remain substantial, which will result in Mutual Federal having to pay competitive deposit rates, provide high quality service and consider providing electronic banking capabilities to increase local market share. In addition, the Association also will have to engage in sufficient levels of marketing activities.
RP Financial, LC.
Page 3.1
III. PEER GROUP ANALYSIS
This chapter presents an analysis of Mutual Federal’s operations’ versus a group of comparable companies (the "Peer Group") selected from the universe of all publicly-traded savings institutions. The primary basis of the pro forma market valuation of Mutual Federal is provided by these public companies. Factors affecting the Association’s pro forma market value such as financial condition, credit risk, interest rate risk, and recent operating results can be readily assessed in relation to the Peer Group. Current market pricing of the Peer Group, subject to appropriate adjustments to account for differences between Mutual Federal and the Peer Group, will then be used as a basis for the valuation of the Mutual Federal to-be-issued common stock.
Peer Group Selection
The mutual holding company form of ownership has been in existence in its present form since 1991. As of the date of this appraisal, there were approximately 34 publicly-traded institutions (those traded on the NYSE, AMEX, or NASDAQ), operating as subsidiaries of MHCs. We believe there are a number of characteristics of MHC shares that make them different from the shares of fully-converted companies. These factors include: (1) lower aftermarket liquidity in the MHC shares since less than 50% of the shares are available for trading; (2) guaranteed minority ownership interest, with no opportunity of exercising voting control of the institution in the MHC form of organization; (3) the potential impact of "second-step" conversions on the pricing of public MHC institutions; (4) the regulatory policies regarding the dividend waiver by MHC institutions; and (5) most MHCs have formed mid-tier holding companies, facilitating the ability for stock repurchases, thus improving the liquidity of the stock on an interim basis. We believe that each of these factors has an impact on the pricing of the shares of MHC institutions, and that such factors are not reflected in the pricing of fully-converted public companies.
Given the unique characteristics of the MHC form of ownership, RP Financial concluded that the appropriate Peer Group for the Mutual Federal valuation should be comprised of subsidiary institutions of mutual holding companies. The selection of publicly-traded mutual
RP Financial, LC.
Page 3.2
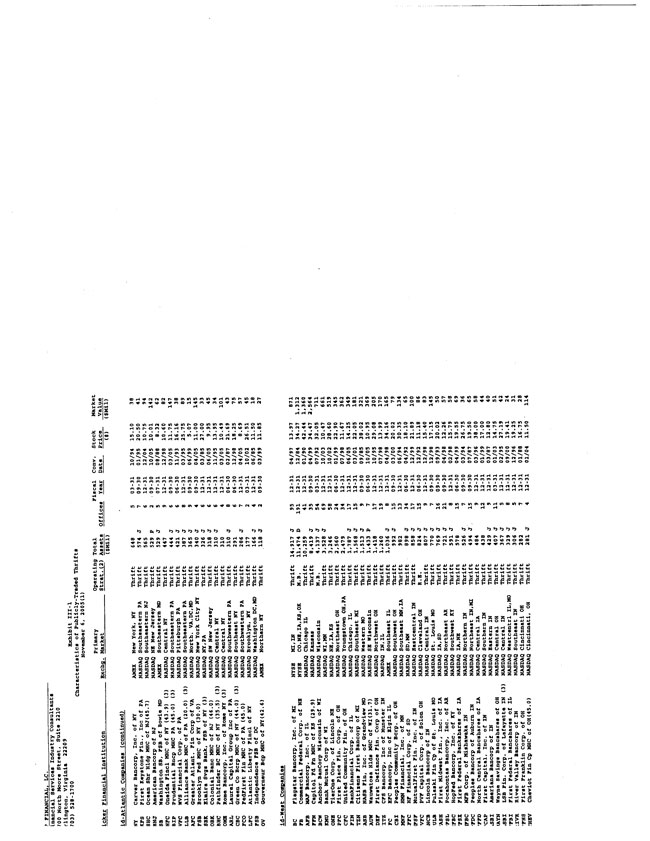
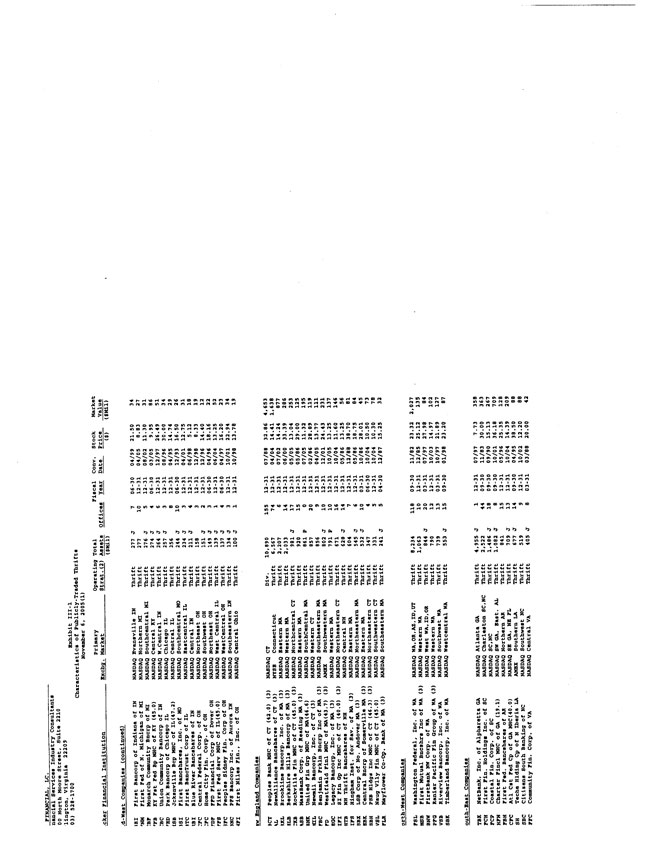
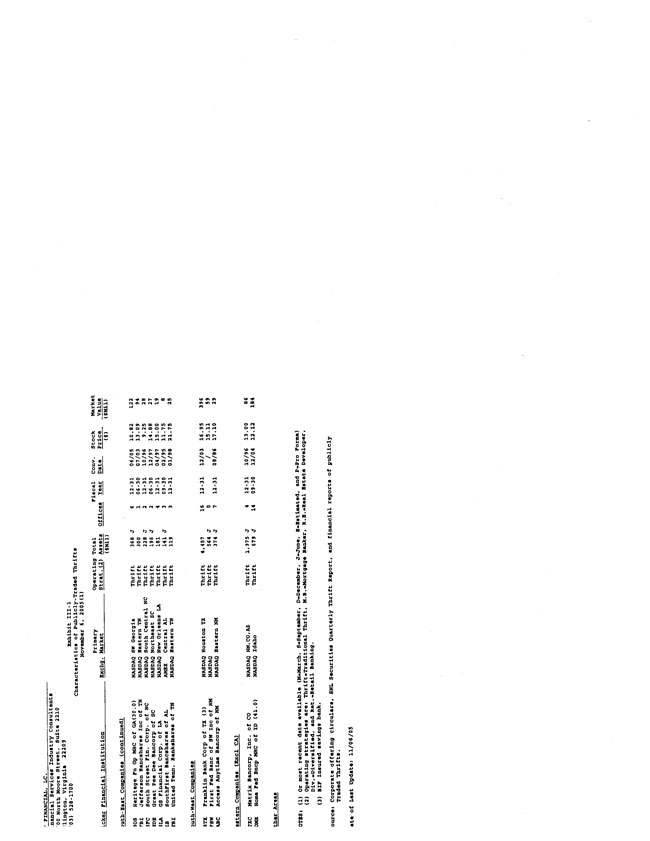
holding companies for the Association’s Peer Group is consistent with the regulatory guidelines and other recently completed MHC transactions. Further, the Peer Group should be comprised of only those MHC institutions whose common stock is either listed on a national exchange or is NASDAQ listed, since the market for companies trading in this fashion is regular and reported. We believe non-listed MHC institutions are inappropriate for the Peer Group, since the trading activity for thinly-traded stocks is typically highly irregular in terms of frequency and price and may not be a reliable indicator of market value. We have excluded from the Peer Group those public MHC institutions that are currently pursuing a second-step conversion and/or companies whose market prices appear to be distorted by speculative factors or unusual operating conditions. MHCs which have recently completed a minority stock offering have been excluded as well, due to the lack of a seasoned trading history and insufficient quarterly financial data that includes the impact of the offering proceeds. The universe of all publicly-traded thrift institutions is included as Exhibit III-1.
Basis of Comparison
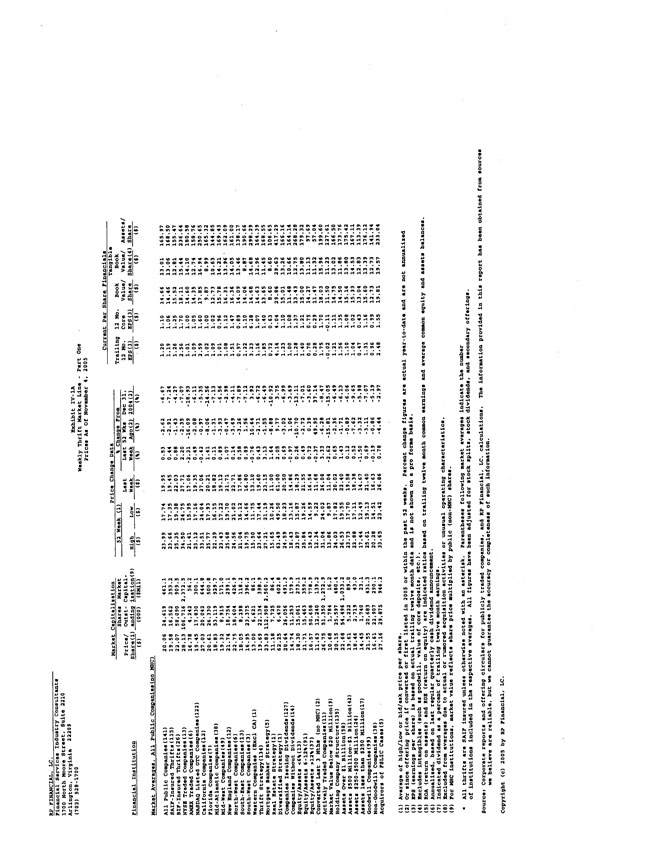
This appraisal includes two sets of financial data and ratios for the Peer Group institutions. The first set of financial data reflects the actual book value, earnings, assets and operating results reported by the Peer Group institutions in its public filings inclusive of the minority ownership interest outstanding to the public. The second set of financial data, discussed at length in the following chapter, places the Peer Group institutions on equal footing by restating their financial data and pricing ratios on a "fully-converted" basis through assuming the sale of the majority shares held by the MHCs in public offerings based on their current trading prices and standard assumptions for a thrift conversion offering. Throughout the appraisal, the adjusted figures will be specifically identified as being on a “fully-converted” basis. Unless so noted, the figures referred to in the appraisal will be actual financial data reported by the Peer Group institutions.
Both sets of financial data have their specific use and applicability to the appraisal. The actual financial data, as reported by the Peer Group companies and reflective of the minority interest outstanding, will be used in Chapter III to make financial comparisons between the Peer Group and the Association. The differences between the Peer Group's reported financial data
RP Financial, LC.
Page 3.3
and the financial data of Mutual Federal are not significant enough to distort the conclusions of the comparison (in fact, such differences are greater in a standard conversion appraisal). The adjusted financial data (fully-converted basis) will be more fully described and quantified in the pricing analysis discussed in Chapter IV. The fully-converted pricing ratios are considered critical to the valuation analysis in Chapter IV, because they place each Peer Group institution on a fully-converted basis (making their pricing ratios comparable to the pro forma valuation conclusion reached herein), eliminate distortion in pricing ratios between Peer Group institutions that have sold different percentage ownership interests to the public, and reflect the implied pricing ratios being placed on the Peer Group institutions in the market today to reflect the unique trading characteristics of publicly-traded MHC institutions.
Mutual Federal Peer Group
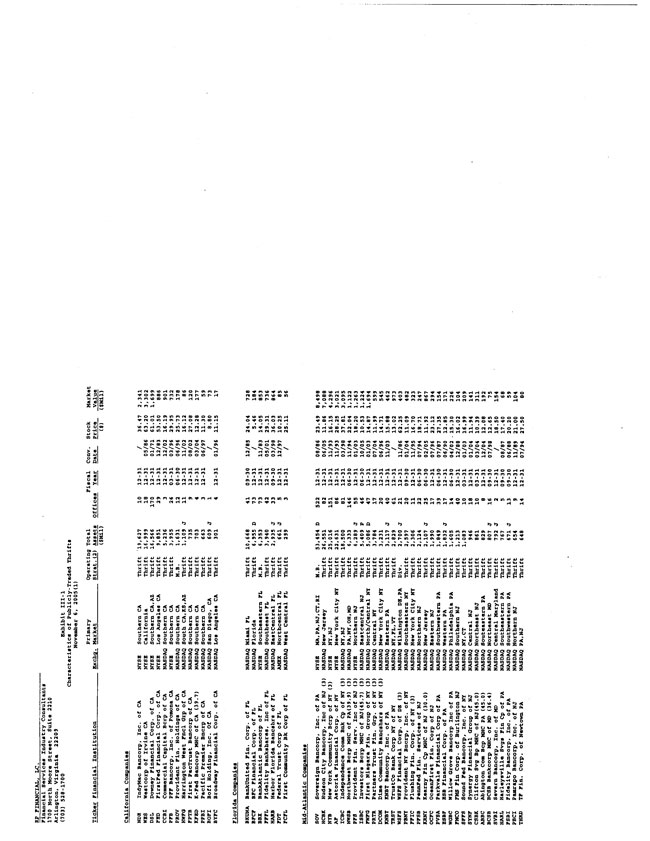
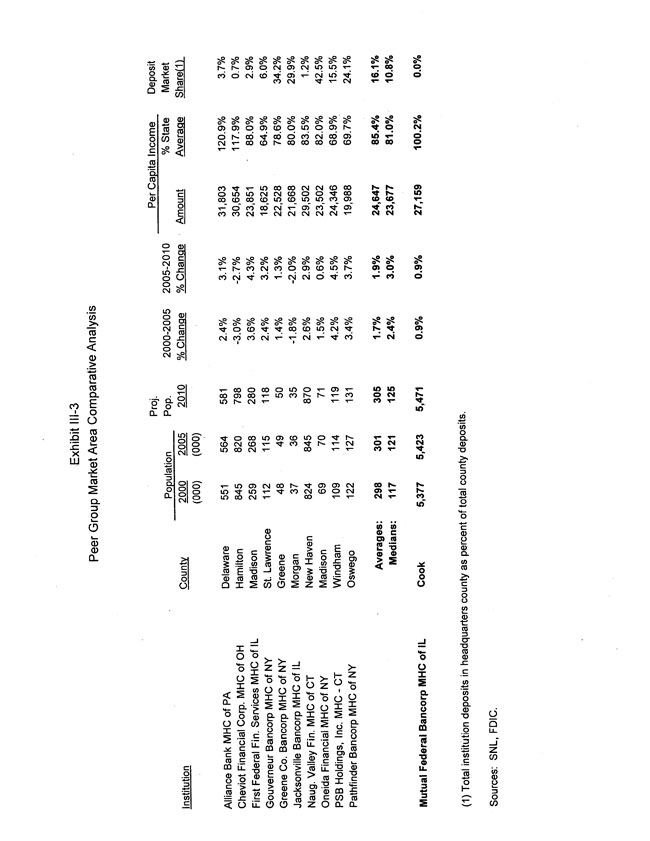
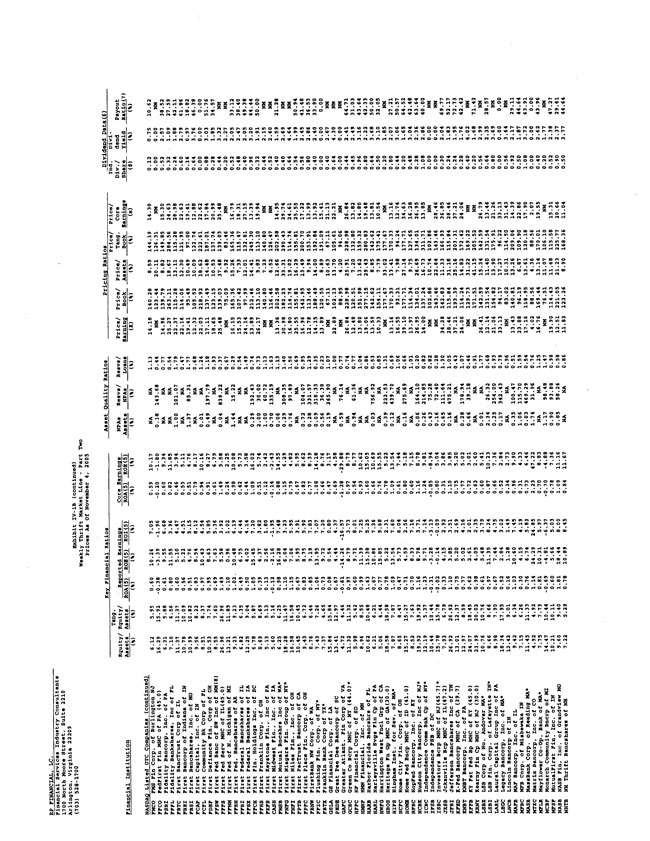
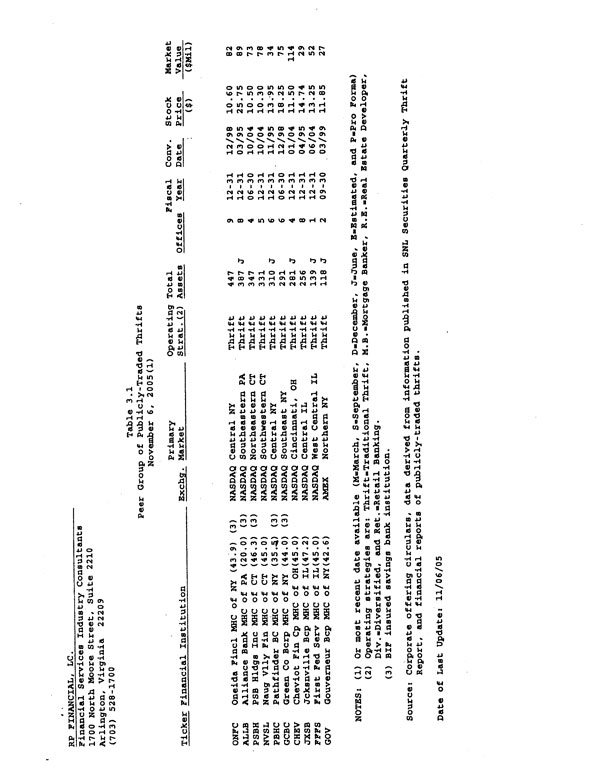
Under ideal circumstances, the Peer Group would be comprised of ten publicly-traded Illinois-based MHC institutions with capital, earnings, credit quality and interest rate risk comparable to Mutual Federal. However, given the limited number of publicly-traded institutions in the MHC form of ownership, the selection criteria was necessarily broad-based and not confined to a particular geographic market area. In light of the asset size of the Association, the selection criteria used for the Peer Group was the ten smallest publicly-traded MHCs in terms of asset size that have been in publicly traded form for at least a year. The asset sizes of the Peer Group companies ranged from $118 million to $447 million. The universe of all publicly-traded MHC institutions, exclusive of institutions that have announced second-step conversions, is included as Exhibit III-2 and Exhibit III-3 provides summary demographic and deposit market share data for the primary market areas served by each of the Peer Group companies.
Unlike the universe of fully-converted publicly-traded thrifts, which includes approximately 141 companies, the universe of public MHC institutions is small, thereby reducing the prospects of a highly comparable Peer Group. Nonetheless, because the trading characteristics of public MHC institution shares are significantly different from those of fully-converted companies, public MHC institutions were the most appropriate group to consider as Peer Group candidates for this valuation. Relying solely on full stock public companies for the
RP Financial, LC.
Page 3.4
Peer Group would not capture the difference in current market pricing for public MHC institutions and thus could lead to distorted valuation conclusions. The federal regulatory agencies have previously concurred with this selection procedure of the Peer Group for MHC valuations. To account for differences between Mutual Federal and the MHC Peer Group in reaching a valuation conclusion, it will be necessary to make certain valuation adjustments. The following discussion addresses financial similarities and differences between Mutual Federal and the Peer Group.
Table 3.1 on the following page lists key general characteristics of the Peer Group companies. Although there are differences among several of the Peer Group members, by and large they are well-capitalized and profitable institutions and their decision to reorganize in MHC form suggests a commonality of operating philosophy. Importantly, the trading prices of the Peer Group companies reflect the unique operating and other characteristics of public MHC institutions. While the Peer Group is not exactly comparable to Mutual Federal, we believe such companies form a good basis for the valuation of Mutual Federal, subject to certain valuation adjustments.
In aggregate, the Peer Group companies maintain a higher level of capitalization relative to the universe of all public thrifts (14.83% of assets versus 11.29% for the all public average), generate lower earnings on a return on average assets basis (0.70% ROAA versus 0.72% for the all public average), and generate a lower return on equity (4.79% ROE versus 7.40% for the all public average). The summary table below underscores the key differences, particularly in the average pricing ratios between full stock and MHC institutions, both as reported and on a fully-converted basis.
RP Financial, LC.
Page 3.5
RP Financial, LC.
Page 3.6
| | | All Publicly-Traded | | Peer Group Reported Basis | | Fully Converted Basis (Pro Forma) | |
| Financial Characteristics (Averages) | | | | | | | |
| Assets ($Mil) | | $ | 2,689 | | $ | 291 | | $ | 325 | |
| Equity/Assets (%) | | | 11.29 | % | | 14.83 | % | | 23.68 | % |
| Return on Assets (%) | | | 0.72 | | | 0.70 | | | 0.74 | |
| Return on Equity (%) | | | 7.40 | | | 4.79 | | | 3.08 | |
Pricing Ratios (Averages)(1) | | | | | | | | | | |
| Price/Earnings (x) | | | 19.57x | | | 29.38x | | | 27.98x | |
| Price/Book (%) | | | 147.61 | % | | 165.93 | % | | 88.41 | % |
| Price/Assets (%) | | | 16.59 | | | 23.51 | | | 20.86 | |
| (1) | Based on market prices as of November 4, 2005. |
The following sections present a comparison of the Association’s financial condition, income and expense trends, loan composition, interest rate risk and credit risk versus the figures reported by the Peer Group. The conclusions drawn from the comparative analysis are then factored into the valuation analysis discussed in the final chapter.
Financial Condition
Table 3.2 shows comparative balance sheet measures for Mutual Federal and the Peer Group. The Mutual Federal and Peer Group ratios reflect balances as of September 30, 2005, unless otherwise indicated for the Peer Group companies. The Mutual Federal net worth base of 27.9% was well above the Peer Group's average net worth ratio of 14.8%. The Association’s pro forma capital position will increase more with the addition of stock proceeds and will continue to be above the Peer Group’s ratio following the stock offering. Tangible equity-to-assets ratios for the Association and the Peer Group equaled 27.9% and 14.2%, respectively, as goodwill and intangibles maintained by the Association and the Peer Group equaled 0.0% and 0.6% of assets, respectively. The increase in the Mutual Federal pro forma capital position will be favorable from a risk perspective and in terms of future earnings potential that could be realized through leverage and lower funding costs. At the same time, the Association’s higher pro forma capitalization will also result in a relatively lower return on equity. Both the Association’s and the Peer Group's capital ratios reflected capital surpluses with respect to the regulatory capital
RP Financial, LC.Page 3.7
RP Financial, LC.
Page 3.8
requirements, with the Association’s ratios currently exceeding the Peer Group’s ratios. On a pro forma basis, the differences between the Association’s and the Peer Group’s regulatory capital ratios will be less significant.
The interest-earning asset compositions for the Association and the Peer Group were somewhat similar, with loans constituting the bulk of interest-earning assets for both Mutual Federal and the Peer Group. The Association’s loans-to-assets ratio of 52.2% was lower than the comparable Peer Group ratio of 63.9%. Comparatively, the Association’s cash and investments-to-assets ratio of 46.8% was higher than the comparable ratio for the Peer Group of 30.9%, as the Association reported higher ratios of mortgage-backed and other investment securities and cash and cash equivalents. Overall, the Association’s interest-earning assets amounted to 99.0% of assets, which exceeded the comparable Peer Group ratio of 94.8%. It is important to indicate that a number of the Peer Group companies have invested in bank owned life insurance, which provides a return to the institution, but the asset is not included as an earning asset on the institutions’ financial statements.
The Association’s funding liabilities reflected a funding strategy similar to the Peer Group's funding composition. The Association’s deposits equaled 69.5% of assets, which was below the comparable Peer Group ratio of 72.0%. Comparatively, borrowings accounted for a higher portion of the Peer Group’s interest-bearing funding composition, as indicated by borrowings-to-assets ratios of 0.0% and 12.0% for Mutual Federal and the Peer Group, respectively. Total interest-bearing liabilities maintained by the Association and the Peer Group, as a percent of assets, equaled 69.5% and 84.0%, respectively, with Mutual Federal’s lower ratio a result of the Association’s higher capital ratio. Following the increase in capital provided by the net proceeds of the stock offering, the Association’s ratio of interest-bearing liabilities as a percent of assets will be even lower in comparison to the Peer Group’s ratio.
A key measure of balance sheet strength for a thrift institution is its IEA/IBL ratio. Presently, the Association maintains a more favorable IEA/IBL ratio than the Peer Group, based on IEA/IBL ratios of 142.5% and 112.9% for the Association and the Peer Group, respectively. The additional capital realized from stock proceeds should serve to provide Mutual Federal with an even higher IEA/IBL ratio, as the increase in capital provided by the infusion of stock
RP Financial, LC.
Page 3.9
proceeds will serve to lower the level of interest-bearing liabilities funding assets and will be primarily deployed into interest-earning assets.
The growth rate section of Table 3.2 shows annual growth rates for key balance sheet items. The Mutual Federal growth rates are based on growth for the nine months ended September 30, 2005 (annualized), while the Peer Group's growth rates are based on annual growth for the twelve months ended September 30, 2005 or the most recent period available. Mutual Federal recorded a 1.2% increase in assets, versus asset growth for the Peer Group of 3.5%. Asset growth experienced by the Association was the result of an 18.8% decline in cash and investments and a 28.2% increase in loans. The Peer Group’s asset growth was largely realized through an 11.8% increase in loans, offset in part by a decline in cash and investments of 11.6%. Following the stock offering, the Association’s growth capacity will continue to be higher than the Peer Group’s, as the result of the increase in leverage capacity that will be provided by the infusion of the net stock proceeds.
The Association’s asset growth was funded with only a 2.4% increase in deposits, and no use of borrowings. Deposit growth of 4.4% and a 21.4% increase in borrowings funded the Peer Group’s asset growth. The Association reported a decline in capital of 2.3% versus an increase of 2.4% for the Peer Group. Mutual Federal’s capital declined due the payment of dividends to the MHC in the amount of $300,000 during the nine month period, offset in part by net income recorded during the period. The Peer Group’s moderate capital growth was due to capital management factors such as dividend payments and stock repurchases. The increase in capital realized from stock proceeds, as well as possible dividend payments and stock repurchases, will initially depress the Association’s capital growth rate following the stock offering.
Income and Expense Components
Table 3.3 displays comparable statements of operations for the Association and the Peer Group, based on earnings for the twelve months ended September 30, 2005, unless otherwise indicated for the Peer Group companies. Mutual Federal and the Peer Group reported net income to average assets ratios of 2.10% and 0.70%, respectively. A higher level of net interest income, lower loan loss provisions and lower operating expenses, offset by somewhat lower non
RP Financial, LC.Page 3.10
RP Financial, LC.
Page 3.11
interest income, accounted for the Association’s higher return. The Association also maintained an earnings disadvantage with respect to its tax position for the twelve month period.
The Association’s stronger net interest income ratio was realized through maintenance of a lower interest expense ratio. Interest expense ratios for the Association and the Peer Group equaled 1.13% and 1.71% of average assets, respectively. The Association’s lower interest expense ratio was supported by a lower cost of funds (1.66% versus 2.06% for the Peer Group), reflecting the Association’s lower utilization of borrowings and lower deposit funding costs, and by a much lower level of interest-bearing liabilities funding assets. The Peer Group reported a somewhat higher interest income ratio that was realized through earning a higher yield on interest-earning assets (5.25% versus 5.12% for the Association), which was supported by the Peer Group’s interest-earning asset composition that reflected a higher concentration of loans than maintained by the Association, and the Peer Group’s loan portfolio composition that reflected a greater degree of diversification into higher yielding types of loans than maintained by the Association. Overall, Mutual Federal and the Peer Group reported net interest income to average assets ratios of 3.72% and 3.27%, respectively.
In another area of core earnings, the Peer Group maintained a higher level of operating expenses than the Association, representing a favorable comparison for Mutual Federal. For the period covered in Table 3.3, the Association and the Peer Group reported operating expense to average assets ratios of 2.61% and 2.83%, respectively. The Association’s lower operating expense ratio was achieved in spite of maintaining a lower ratio of assets per employee in comparison to the Peer Group. Assets per full time equivalent employee equaled $3.7 million for the Association versus $4.8 million for the Peer Group. Operating from a single office location provides a level of efficiency in terms of leveraging operating expenses. On a post-offering basis, the Association’s operating expenses can be expected to increase with the addition of stock benefit plans and certain expenses that result from being a publicly-traded company, with such expenses already impacting the Peer Group's operating expenses. At the same time, the Association’s capacity to leverage operating expenses will be comparable to or greater than the Peer Group’s leverage capacity following the increase in capital realized from the infusion of net stock proceeds.
RP Financial, LC.
Page 3.12
When viewed together, net interest income and operating expenses provide considerable insight into a thrift's earnings strength, since those sources of income and expenses are typically the most prominent components of earnings and are generally more predictable than losses and gains realized from the sale of assets or other non-recurring activities. In this regard, as measured by their expense coverage ratios (net interest income divided by operating expenses), the Association’s earnings were stronger than the Peer Group’s. Expense coverage ratios posted by Mutual Federal and the Peer Group equaled 1.43x and 1.16x, respectively. An expense coverage ratio of greater than 1.0x indicates that an institution is able to sustain pre-tax profitability without having to rely on non-interest sources of income.
Sources of non-interest operating income provided a higher relative contribution to the Peer Group’s earnings, with such income amounting to 0.06% and 0.72% of the Association’s and the Peer Group’s average assets, respectively. Taking non-interest operating income into account in comparing the Association’s and the Peer Group's earnings, the Mutual Federal efficiency ratio (operating expenses, net of amortization of intangibles, as a percent of the sum of non-interest operating income and net interest income) of 69.1% was more favorable than the Peer Group's efficiency ratio of 70.9%. The Association’s more favorable efficiency ratio was realized through earning a higher level of net interest income and a lower operating expense ratio, which more than offset the Association’s lower non-interest income ratio.
Loan loss provisions had a larger impact on the Peer Group’s earnings, with loss provisions established by Mutual Federal and the Peer Group equaling 0.00% and 0.07% of average assets, respectively. The lower level of loss provisions established by Mutual Federal was indicative of the lower degree of diversification into less risky types of lending (see Table 3.4), as well as the Association’s lower ratio of total loans-to-assets.
Net gains realized from the sale of assets and net other non-recurring income or expense items were a large contributor to the Association's earnings, with such gains amounting to 2.20% of average assets, while the Peer Group recorded a net loss on non-recurring items of 0.02% of average asset. The Association’s sale of Freddie Mac common stock largely contributes to Mutual Federal’s net gains. However, given the generally non-recurring nature of gains and losses resulting from the sale of loans, investments and other assets, the net gains reflected in the
RP Financial, LC.
Page 3.13
Association’s and the Peer Group's earnings will be discounted in evaluating the relative strengths and weaknesses of their respective earnings. Extraordinary items were not a factor in either the Association’s or the Peer Group's earnings.
Taxes had a larger impact on the Association’s earnings, as the Association recorded an effective tax rate of 37.72% for the twelve month period. Comparatively, the Peer Group had an effective tax rate of 28.53%.
Loan Composition
Table 3.4 presents data related to the Association’s and the Peer Group’s loan portfolio compositions and investment in mortgage-backed securities. The Association’s loan portfolio composition reflected a lower concentration of 1-4 family permanent mortgage loans and mortgage-backed securities than maintained by the Peer Group (52.2% versus 54.3% for the Peer Group). The Association’s lower ratio was attributable to maintaining a lower concentration of 1-4 family loans relative to the comparable Peer Group ratio. However, the Association had a much higher concentration of MBS of 20.01%, compared to the Peer Group’s level of 9.39%. Loans serviced for others represented a higher off-balance sheet item for the Peer Group, equaling 11.5% of the Peer Group’s assets, while the Association maintained a zero balance of loans serviced for others. The Peer Group’s balance of loans serviced for others translated into modest balances of servicing intangibles.
Diversification into higher risk types of lending was more significant for the Association on average due to the Association’s emphasis on loans secured by multi-family property Such loans represented the most significant area of lending diversification for Mutual Federal (20.15% of assets), followed by consumer loans (0.11% of assets). The Peer Group’s lending diversification also consisted primarily of commercial real estate/multi-family loans and consumer loans, with those portfolios equaling 9.9% and 3.1% of assets, respectively. Overall, the Association maintained a greater degree of lending diversification (20.3% of assets), versus 18.2% of assets for the Peer Group. The Peer Group’s higher loans-to-assets ratio (64%) and only slightly less diversification into higher risk types of loans translated into a higher risk-weighted assets-to-assets ratio of 56.2%, as compared to the Association’s ratio of 37.0%.
RP Financial, LC.Page 3.14
RP Financial, LC.
Page 3.15
Credit Risk
Overall, the credit risk associated with the Association’s loan portfolio was considered to be similar to the Peer Group’s, as the Association’s somewhat more favorable credit quality measures for non-performing loans was offset by the Association’s lower reserve coverage ratios. As shown in Table 3.5, the Mutual Federal ratio of non-performing assets and accruing loans that are more than 90 days past due as a percent of assets was less than the comparable Peer Group ratio (0.29% versus 0.41% for the Peer Group). In contrast, Mutual Federal’s non-performing loans-to-loans ratio, which does not include accruing loans that are more than 90 days past due, was higher than the Peer Group's ratio (0.55% versus 0.40% for the Peer Group). The Association maintained a much lower level of loss reserves as a percent of non-performing loans (79.8% versus 376.4% for the Peer Group), while the Peer Group maintained a higher level of reserves as a percent of loans (0.84% versus 0.44% for the Association). The Association did not report any net loan chargeoffs, while the Peer Group reported a minimal amount.
Interest Rate Risk
Table 3.6 reflects various key ratios highlighting the relative interest rate risk exposure of the Association versus the Peer Group companies. In terms of balance sheet composition, the Mutual Federal interest rate risk characteristics were considered to be more favorable than the Peer Group’s. Most notably, the Association’s higher tangible capital position and higher IEA/IBL ratio indicate a greater dependence on the yield-cost spread to sustain the net interest margin. In addition, the Association is currently following a strategy of retaining for portfolio long-term fixed rate mortgage loans secured by 1-4 family residential property. A lower level of non-interest earning assets represented an advantage for the Association with respect to capacity to generate net interest income and, in turn, limit the interest rate risk associated with the balance sheet. On a pro forma basis, the infusion of stock proceeds should provide the Association with balance sheet interest rate risk characteristics that are more favorable to the Peer Group’s measures.
To analyze interest rate risk associated with the net interest margin, we reviewed quarterly changes in net interest income as a percent of average assets for Mutual Federal and the Peer Group. In general, the more significant fluctuations in the Association’s ratios implied
RP Financial, LC.
Page 3.16
RP Financial, LC.
Page 3.17
RP Financial, LC.
Page 3.18
there was a greater degree of interest rate risk associated with net interest income compared to the Peer Group’s, based on the interest rate environment that prevailed during the period covered in Table 3.6. The stability of the Association’s net interest margin should be enhanced by the infusion of stock proceeds, as interest rate sensitive liabilities will be funding a lower portion of the Mutual Federal asset base and the proceeds will be substantially deployed into interest-earning assets.
Summary
Based on the above analysis, RP Financial concluded that the Peer Group forms a reasonable basis for determining the pro forma market value of Mutual Federal. Such general characteristics as asset size, capital position, the composition of interest-earning assets, funding composition, core earnings measures, loan composition, credit quality and exposure to interest rate risk all tend to support the reasonability of the Peer Group from a financial standpoint. Those areas where differences exist will be addressed in the form of valuation adjustments to the extent necessary.
RP Financial, LC.
Page 4.1
IV. VALUATION ANALYSIS
Introduction
This chapter presents the valuation analysis and methodology used to determine the estimated pro forma market value of Mutual Federal for purposes of pricing the minority stock. The valuation incorporates the appraisal methodology promulgated by the OTS and adopted in practice by the FDIC for standard conversions and mutual holding company offerings, particularly regarding selection of the Peer Group, fundamental analysis on both the Association and the Peer Group, and determination of the Association’s pro forma market value utilizing the market value approach.
Appraisal Guidelines
The OTS written appraisal guidelines specify the market value methodology for estimating the pro forma market value of an institution. The FDIC, state banking agencies and other Federal agencies have endorsed the OTS appraisal guidelines as the appropriate guidelines involving mutual-to-stock conversions. As previously noted, the appraisal guidelines for MHC offerings are somewhat different, particularly in the Peer Group selection process. Specifically, the regulatory agencies have indicated that the Peer Group should be based on the pro forma fully-converted pricing characteristics of publicly-traded MHCs, rather than on already fully-converted publicly-traded stock thrifts, given the unique differences in stock pricing of MHCs and fully-converted stock thrifts. Pursuant to this methodology: (1) a peer group of comparable publicly-traded MHC institutions is selected; (2) a financial and operational comparison of the subject company to the peer group is conducted to discern key differences; and (3) the pro forma market value of the subject company is determined based on the market pricing of the peer group, subject to certain valuation adjustments based on key differences. In addition, the pricing characteristics of recent conversions and MHC offerings must be considered.
RP Financial Approach to the Valuation
The valuation analysis herein complies with such regulatory approval guidelines. Accordingly, the valuation incorporates a detailed analysis based on the Peer Group, discussed in
RP Financial, LC.
Page 4.2
Chapter III, which constitutes "fundamental analysis" techniques. Additionally, the valuation incorporates a "technical analysis" of recently completed conversions and stock offerings of comparable MHCs, including closing pricing and aftermarket trading of such offerings. It should be noted that these valuation analyses, based on either the Peer Group or the recent conversions and MHC transactions, cannot possibly fully account for all the market forces which impact trading activity and pricing characteristics of a stock on a given day.
The pro forma market value determined herein is a preliminary value for the Association’s to-be-issued stock. Throughout the MHC process, RP Financial will: (1) review changes in the Association’s operations and financial condition; (2) monitor the Association’s operations and financial condition relative to the Peer Group to identify any fundamental changes; (3) monitor the external factors affecting value including, but not limited to, local and national economic conditions, interest rates, and the stock market environment, including the market for thrift stocks; and (4) monitor pending MHC offerings, and to a lesser extent, standard conversion offerings, both regionally and nationally. If material changes should occur prior to close of the offering, RP Financial will evaluate if updated valuation reports should be prepared reflecting such changes and their related impact on value, if any. RP Financial will also prepare a final valuation update at the closing of the offering to determine if the prepared valuation analysis and resulting range of value continues to be appropriate.
The appraised value determined herein is based on the current market and operating environment for the Association and for all thrifts. Subsequent changes in the local and national economy, the legislative and regulatory environment, the stock market, interest rates, and other external forces (such as natural disasters or major world events), which may occur from time to time (often with great unpredictability) may materially impact the market value of all thrift stocks, including the Mutual Federal value, the market value of the stocks of public MHC institutions, or the Mutual Federal value alone. To the extent a change in factors impacting the Association’s value can be reasonably anticipated and/or quantified, RP Financial has incorporated the estimated impact into its analysis.
RP Financial, LC.
Page 4.3
Valuation Analysis
A fundamental analysis discussing similarities and differences relative to the Peer Group was presented in Chapter III. The following sections summarize the key differences between the Association and the Peer Group and how those differences affect the pro forma valuation. Emphasis is placed on the specific strengths and weaknesses of the Association relative to the Peer Group in such key areas as financial condition, profitability, growth and viability of earnings, asset growth, primary market area, dividends, liquidity of the shares, marketing of the issue, management, and the effect of government regulations and/or regulatory reform. We have also considered the market for thrift stocks, in particular new issues, to assess the impact on value of Mutual Federal coming to market at this time.
1. Financial Condition
The financial condition of an institution is an important determinant in pro forma market value because investors typically look to such factors as liquidity, capital, asset composition and quality, and funding sources in assessing investment attractiveness. The similarities and differences in the Association’s and the Peer Group's financial strength are noted as follows:
| · | Overall A/L Composition. Loans funded by retail deposits were the primary components of both the Mutual Federal and the Peer Group balance sheets. The Association’s interest-earning asset composition exhibited a lower concentration of loans and the Mutual Federal loan portfolio composition reflected a lower degree of diversification into higher risk and higher yielding types of loans. Overall, in comparison to the Peer Group, the Association’s asset composition provided for a lower yield earned on interest-earning assets and a lower risk weighted assets-to-assets ratio. The Mutual Federal funding composition reflected a lower level of deposits and a lower level of borrowings than the comparable Peer Group ratios, which translated in a lower cost of funds for the Association. Overall, as a percent of assets, the Association maintained a higher level of interest-earning assets and a lower level of interest-bearing liabilities than indicated for the Peer Group, which resulted in a higher IEA/IBL ratio for the Association. The infusion of stock proceeds will increase the Association’s capital position and, in turn, provide Mutual Federal with an IEA/IBL ratio that is higher than the Peer Group’s ratio. At the same time, the composition of the Association’s assets and liabilities will continue to provide for a more favorable interest rate spread than maintained by the Peer Group. For valuation purposes, RP Financial concluded that no adjustment was warranted for the Association’s overall asset/liability composition. |
RP Financial, LC.
Page 4.4
| · | Credit Quality. The Association maintained a lower ratio of non-performing assets-to-assets and a higher ratio of non-performing loans-to-loans. Loss reserves maintained as a percent of non-performing loans were higher for the Peer Group, and the Peer Group maintained higher reserves as a percent of loans. Net loan charge-offs as a percent of loans were lower for the Association than the Peer Group. As noted above, the Association maintained a lower risk weighted assets-to-assets ratio than the Peer Group, reflecting the Association’s lower loans-to-assets ratio and lending diversification which is limited to multi-family residential real estate secured loans, which are risk-weighted at the same rate as 1-4 family residential loans. Overall, in comparison to the Peer Group, the Association’s measures imply a similar degree of credit risk exposure and, thus, RP Financial concluded that no adjustment was warranted for the Association’s credit quality. |
| · | Balance Sheet Liquidity. The Association operated with a higher level of cash and investment securities relative to the Peer Group (46.8% of assets versus 30.9% for the Peer Group). Following the infusion of the stock proceeds, the Association’s cash and investments ratio is expected to increase as the proceeds will initially be deployed into investments. Mutual Federal’s future borrowing capacity was considered to be greater than the Peer Group's, in light of the lower level of borrowings maintained by the Association in comparison to the Peer Group. Overall, balance sheet liquidity for the Association and the Peer Group was viewed as adequate, even with the higher ratios maintained by the Association, thus, RP Financial concluded that no adjustment was warranted for balance sheet liquidity. |
| · | Funding Liabilities. The Association’s interest-bearing funding composition reflected a lower level of deposits compared to the Peer Group’s ratio, and no borrowings, versus a level of borrowings for the Peer Group. The Association’s overall funding composition provided for a lower cost of funds than maintained by the Peer Group. In total, the Association maintained a lower level of interest-bearing liabilities than the Peer Group, which was attributable to Mutual Federal’s higher capital position. Following the stock offering, the increase in the Association’s capital position should increase the Association’s advantage in terms of interest-bearing liabilities as maintained by the Peer Group. At the same time, the Association’s funding composition can be expected to result in a lower cost of funds than maintained by the Peer Group. Overall, RP Financial concluded that a slight upward adjustment was warranted for Mutual Federal’s funding composition. |
| · | Capital. Mutual Federal operates with a higher equity-to-assets ratio than the Peer Group. Following the stock offering, the Association’s pro forma capital position will be significantly higher than the Peer Group's equity-to-assets ratio, resulting in greater leverage potential and reduce the level of interest-bearing liabilities utilized to fund assets. Overall, RP Financial concluded that a slight upward valuation adjustment was warranted for the Association’s pro forma capital position. |
RP Financial, LC.
Page 4.5
On balance, the Mutual Federal balance sheet strength was considered to be more attractive than the Peer Group's, as implied by the Association’s asset/liability composition, funding composition, liquidity, credit quality and capital ratios. Accordingly, we concluded that a slight upward valuation adjustment was warranted for the Association’s financial condition.
2. Profitability, Growth and Viability of Earnings
Earnings are a key factor in determining pro forma market value, as the level and risk characteristics of an institution's earnings stream and the prospects and ability to generate future earnings heavily influence the multiple that the investment community will pay for earnings. The major factors considered in the valuation are described below.
| · | Reported Earnings. Supported by significant gains on asset sales, the Association reported higher earnings on an ROAA basis (2.10% of average assets versus 0.70% for the Peer Group). Higher levels of net interest income, lower loss provisions, lower operating expenses and higher non-operating gains on sale accounted for the Association’s higher return. Higher non-interest operating income and a lower effective tax rate represented earnings advantages for the Peer Group. Reinvestment and leveraging of the net stock proceeds should enhance returns for Mutual Federal, but the pick-up in earnings will be somewhat offset by the increase in operating expenses that will result from the implementation of the stock benefit plans and expenses related to operating as a publicly-traded company with shareholders. Overall, the Association’s reported earnings were considered to be more attractive than the Peer Group’s and, thus, RP Financial concluded that a slight upward adjustment was appropriate for the Association’s reported earnings. |
| · | Core Earnings. The Association’s reported earnings were substantially supported by non-operating income in the form of gains on the sale of Freddie Mac stock, while the Peer Group reported a minimal amount of non-operating expense. Excluding the gains on sale, Mutual Federal’s adjusted, or core earnings, approximated $497,000 for the twelve months ended September 30, 2005, or 0.76% of average assets, versus core earnings of 0.71% of average assets for the Peer Group. Notwithstanding the similar core ROA, the Association’s level of net income represents a less favorable financial performance when taking into account Mutual Federal’s much higher equity base. The Association’s higher net interest income ratio and lower level of operating expenses translated into an expense coverage ratio that was more favorable than the Peer Group’s ratio (1.43x versus 1.16x for the Peer Group). The Mutual Federal efficiency ratio of 69.1% was also slightly more favorable than the Peer Group’s efficiency ratio of 70.9%. Overall, these measures, as well as the expected earnings benefits the Association should realize from the redeployment of stock proceeds into interest-earning assets will somewhat be negated by expenses associated with the stock benefit plans and operating as a publicly-traded company, indicate that the |
RP Financial, LC.
Page 4.6
| | Association’s earnings are somewhat lower than the Peer Group’s core earnings. Therefore, RP Financial concluded that a slight downward adjustment was warranted for the Association’s core earnings. |
| · | Interest Rate Risk. Quarterly changes in the Association’s and the Peer Group's net interest income to average assets ratios indicated that a slightly higher degree of volatility was associated with Mutual Federal’s net interest margin. The Peer Group’s higher level of non-interest income implied a lower dependence on the yield-cost spread to sustain net interest income, while the Association benefits from a higher, interest free capital base. On a pro forma basis, the Association’s capital position and IEA/IBL ratio will be enhanced by the infusion of stock proceeds and should lessen the current advantages indicated for the Peer Group’s ratios. Overall, RP Financial concluded that the interest rate risk associated with the Association’s earnings was comparable to the Peer Group’s earnings interest rate risk exposure and no valuation adjustment was necessary for this factor. |
| · | Credit Risk. Loan loss provisions were a slightly larger factor in the Peer Group’s earnings (0.07% of average assets versus 0.00% of average assets for the Association). Other credit risk measures generally implied the Association’s credit risk exposure was similar to the Peer Group’s, in terms of future exposure to credit quality related losses. Overall, RP Financial concluded that no adjustment was warranted for this factor. |
| · | Earnings Growth Potential. The infusion of stock proceeds will increase the Association’s earnings growth potential with respect to leverage capacity and provide the Association with additional liquidity for purposes of funding loan growth. Opportunities to increase earnings through loan and deposit growth are considered to be somewhat less favorable in terms of Mutual Federal’s resources and existing products and services, which are more limited than the Peer Group. The Association’s primary market area provides access to a large potential customer base, however the Association lacks a branch network or other delivery systems such as a diverse product line and a website to market its products and services. There are also demographic and economic limitations that are associated with the primary market area zip code served by Mutual Federal. Overall, the Association’s earnings growth potential appears to be less comparable to the Peer Group's, and, thus, we concluded that a slight downward adjustment was warranted for this factor. |
| · | Return on Equity. The Association’s estimated pro forma return on assets and pro forma equity ratio is expected to result in a pro forma return on equity that is below the Peer Group’s average return on equity. In view of the lower capital growth rate that will be implied by Mutual Federal’s pro forma ROE, we concluded that a moderate downward adjustment was warranted for the Association’s ROE. |
RP Financial, LC.
Page 4.7
Overall, a moderate downward adjustment was applied for the Association’s profitability, growth and viability of earnings, based on the expected post-conversion structure of the Association’s income statement, reported earnings, core earnings and return on equity.
3. Asset Growth
Mutual Federal experienced a 1.1% increase in assets during the most recent twelve month period, versus a 3.5% asset growth rate posted by the Peer Group. Asset growth by the Association was channeled into an increase in loans, while cash and investments declined. The Peer Group’s asset growth was mostly realized through loan growth, which was supplemented with a decrease in cash and investments. The Association will realize an increase in its pro forma capital position from the infusion of stock proceeds, which will provide Mutual Federal with substantially greater leverage capacity as currently maintained by the Peer Group. However, the Association currently operates with a more limited product and services line than the overall Peer Group, operates from a single office location, and does not operate a website or maintain other types of delivery systems. The Association has also not expanded its operations or asset size over the past several years, in spite of maintaining a relatively high capital ratio. Accordingly, we believe that a slight downward adjustment was warranted for this factor.
4. Primary Market Area
The general condition of an institution's market area has an impact on value, as future success is in part dependent upon opportunities for profitable activities in the local market served. The Association’s primary market area is the west central portion of Cook County, limited to the local area surrounding the single office location. The area served by the office location contains primarily residential real estate properties, with a mixture of commercial property. The moderate economic activity in the primary market area zip code 60608 has resulted in declining population trends and low household and per capita income levels.
In general the Peer Group companies operate in smaller, but faster growing markets than served by the Association. The Peer Group companies maintained a stronger competitive position than Mutual Federal, as indicated by the higher deposit market share that was maintained by the Peer Group companies on average, 16.1% versus 0.03% for the Association,
RP Financial, LC.
Page 4.8
however this statistic is affected by the very large Cook County/Chicago area deposit base. Summary demographic, economic and deposit market share data for the Association and the Peer Group companies is provided in Exhibit III-3. As shown in Table 4.1, August 2005 unemployment rates for the markets served by the Peer Group companies were, in general, lower than Cook County’s unemployment rate for August 2005. On balance, we concluded that no adjustment was appropriate for the Association’s market area.
Table 4.1
Market Area Unemployment Rates
Mutual Federal and the Peer Group Companies(1)
| | County | August 2005 Unemployment |
| Mutual Federal - IL | Cook | 6.4% |
Peer Group | | 5.2% |
Alliance Bank MHC - PA | Delaware | 4.6% |
| Cheviot Financial Corp. MHC of OH | Hamilton | 5.4 |
| First Fed Services MHC - IL | Madison | 5.5 |
| Gouverneur Bancorp MHC - NY | St. Lawrence | 5.3 |
| Greene Co. Bancorp MHC - NY | Greene | 4.4 |
| Jacksonville SB MHC - IL | Morgan | 5.5 |
| Naugatuck Valley MHC - CT | New Haven | 5.8 |
| Oneida Financial MHC - NY | Madison | 4.4 |
| PSB Holdings, Inc. MHC - CT | Windham | 5.5 |
| Pathfinder Bancorp MHC - NY | Oswego | 5.5 |
(1) Unemployment rates are not seasonally adjusted.
Source: U.S. Bureau of Labor Statistics.
5. Dividends
At this time the Association has not established a dividend policy. Future declarations of dividends by the Board of Directors will depend upon a number of factors, including investment opportunities, growth objectives, financial condition, profitability, tax considerations, minimum capital requirements, regulatory limitations, stock market characteristics and general economic conditions.
RP Financial, LC.
Page 4.9
All ten of the Peer Group companies pay regular cash dividends, with implied dividend yields ranging from 1.40% to 3.96%. The average dividend yield on the stocks of the Peer Group institutions equaled 2.40% as of November 4, 2005. As of that same date, approximately 87% of all publicly-traded thrifts had adopted cash dividend policies (see Exhibit IV-1), exhibiting an average yield of 2.52%. The dividend paying thrifts generally maintain higher than average profitability ratios, facilitating their ability to pay cash dividends.
Our valuation adjustment for dividends for Mutual Federal also considered the regulatory policy with regard to waiver of dividends by the MHC. Under current policy, any waiver of dividends by an FDIC regulated MHC requires that the minority stockholders’ ownership interest be reduced in a second-step conversion to reflect the cumulative waived dividend account. Comparatively, no adjustment for waived dividends is required for OTS regulated companies in a second-step conversion. As an MHC operating under OTS regulation, the Association will be subject to the same regulatory dividend policy as a large majority of the Peer Group companies (nine of the Peer Group companies operate under OTS regulation for purposes of the dividend waiver). Accordingly, we believe that to the extent Mutual Federal’s pro forma market value would be influenced by the OTS’ dividend policy regarding MHC institutions, it has been sufficiently captured in the pricing of the Peer Group companies.
Overall, the Association’s capacity to pay dividends will be similar to the Peer Group’s, as the result of its pro forma earnings and capital levels. Accordingly, we concluded that no adjustment was warranted for purposes of the Association’s dividend policy.
6. Liquidity of the Shares
Pursuant to OTS written appraisal guidelines, the Peer Group is by definition composed of companies that are traded in the public markets. Nine of the Peer Group members trade on the NASDAQ system, and one trades on the AMEX. Typically, the number of shares outstanding and market capitalization provides an indication of how much liquidity there will be in a particular stock. The market capitalization of the Peer Group companies, based on the shares issued and outstanding to public shareholders (i.e., excluding the majority ownership interest owned by the respective MHCs) ranged from $11.5 million to $51.3 million as of November 4, 2005, with average and median market values of $26.8 million and $28.3 million, respectively.
RP Financial, LC.
Page 4.10
The shares issued and outstanding to the public shareholders of the Peer Group members ranged from 688,000 to 4.5 million, with average and median shares outstanding of 2.2 million and 1.8 million, respectively. The Association’s minority stock offering is expected to have a pro forma market value that is well below the Peer Group average and median, while the number of public shares outstanding for the Association is also expected to be below the mean number of shares outstanding maintained by the individual Peer Group companies. It is anticipated that the Association’s stock will be listed for trading on the OTC Bulletin Board following the stock offering, which generally suggests lower liquidity than on NASDAQ or other exchange listings. Overall, we anticipate that the Association’s public stock will have a less liquid trading market as the Peer Group companies on average and, therefore, concluded a moderate downward adjustment was necessary for this factor.
7. Marketing of the Issue
Three separate markets exist for thrift stocks: (1) the after-market for public companies, both fully-converted stock companies and MHCs, in which trading activity is regular and investment decisions are made based upon financial condition, earnings, capital, ROE, dividends and future prospects; (2) the new issue market in which converting thrifts are evaluated on the basis of the same factors but on a pro forma basis without the benefit of prior operations as a publicly-held company and stock trading history; and (3) the thrift acquisition market. All three of these markets were considered in the valuation of the Association’s to-be-issued stock.
A. The Public Market
The value of publicly-traded thrift stocks is easily measurable, and is tracked by most investment houses and related organizations. Exhibit IV-1 provides pricing and financial data on all publicly-traded thrifts. In general, thrift stock values react to market stimuli such as interest rates, inflation, perceived industry health, projected rates of economic growth, regulatory issues and stock market conditions in general. Exhibit IV-2 displays historical stock market trends for various indices and includes historical stock price index values for thrifts and commercial banks. Exhibit IV-3 displays historical stock price indices for thrifts only.
RP Financial, LC.
Page 4.11
In terms of assessing general stock market conditions, the performance of the overall stock market has been mixed over the past year. Higher oil prices and allegations of improprieties in the insurance industry pressured the Dow Jones Industrial Average (“DJIA”) to its lowest level of the year in late-October 2004. Lower oil prices reversed the downward trend in stocks at the close of October. The election outcome, a rise in consumer confidence and a strong jobs report for October extended the stock market rally into mid-November, as the DJIA hit a seven month high. Concerns about the falling dollar and a sharp rise in October producer prices temporarily dampened the stock market rally in late-November, but then stocks recovered in early-December on a sharp decline on oil prices. Some favorable economic data, including a strong report on December consumer confidence and a five-month low in new unemployment claims, helped to extend the rally through the end of the year as the DJIA move to a three and one-half year high.
The broader stock market started 2005 in a downward trend, as investors reacted negatively to some disappointing economic data and indications by the Federal Reserve that it was likely to keep raising rates because of wariness about inflation. Concerns about slowing profit growth, weaker than expected growth in the fourth quarter of 2004 and the elections in Iraq extended the downward trend through mid-January. After three straight weekly declines, the DJIA edged higher in the last week of January on some upbeat earnings reports and a better than expected consumer confidence index. The positive trend in the broader stock market continued during the first half of February, as the Federal Reserve’s quarter-point rate increase contained no surprises, oil prices declined and January retail sale beat expectations. The broader stock market had an uneven performance during the second half of February, reflecting concerns about inflation, higher oil prices and a weak dollar.
Despite surging oil prices, the DJIA moved back into positive territory for the year in early-March 2005. Strong job growth reflected in the February employment data and better than expected retail sales for February were factors that contributed to the positive move in stocks during the first week of March. Higher oil prices and interest rates pressured stocks lower in mid-March, as rising commodity prices rekindled inflation fears. The downturn in stocks continued going into the second half of March, as stocks were weighed down by news of a record U.S. trade deficit in 2004, General Motors’ warning that earnings would be significantly
RP Financial, LC.
Page 4.12
below an earlier forecast and record high oil prices. Increased expectations of higher interest rates further depressed stocks in late-March, as the Federal Reserve surprised investors by signaling for the first time in more than four years that it was concerned with inflation. As expected, the Federal Reserve concluded its March meeting by raising its target for the federal funds rate to 2.75% from 2.5%. After dropping to a two-month low, a decline in oil prices helped lift the DJIA to its biggest one-day gain for the year at the end of March 2005. However, the first quarter of 2005 still showed a decline in the DJIA for the third year in a row.
Weaker-than-expected job growth reflected in the March 2005 employment data pushed stocks lower at the start of the second quarter. Following a brief rally in early-April, the broader stock market moved to a five-month low in mid-April. The sell-off was based on concerns of a slowing U.S. economy, higher inflation and rising oil prices. Comparatively, economic data which showed a decline in initial jobless claims, a pick-up in Mid-Atlantic manufacturing activity and strong new home sales combined with some favorable first quarter earnings reports fueled a sharp rise in the stock market heading into late-April. A stronger-than-expected employment report for April, optimism about interest rates and a big planned purchase of General Motors shares helped to lift stocks in early-May. Gains in the broader stock market generally continued through the balance of May, as oil prices dropped and the economy showed signs of sustaining growth with low inflation following an upward revision in GDP growth for the first quarter while an accompanying inflation measure remained unrevised. The positive trend in the broader stock market was sustained through the first half of June, fueled by economic data which showed steady growth and mild inflation. After moving to a three-month high in mid-June, stocks declined at the end of the second quarter on continued worries over oil prices, slowing economic growth and the Federal Reserve’s plans for raising interest rates further.
The broader stock market rebounded at the start of the third quarter of 2005, as investors reacted favorably to falling oil prices and job growth reflected in the June employment data. Favorable inflation data for June and some positive third quarter earnings reports sustained the rally into the latter part of July. Stocks posted further gains in early-August on optimism about the economy, corporate profits and interest rates. Concerns that rising oil prices would reduce consumer spending and hurt corporate earnings produced a downward trend in the stock
RP Financial, LC.
Page 4.13
market during the second half of August, with the DJIA posting a 1.5% loss for the month of August. The stock market showed resiliency in aftermath of Hurricane Katrina, as oil prices fell following the Energy Department’s decision to release some of the Strategic Petroleum Reserve.
Lower oil prices and an upbeat report from the Federal Reserve that showed the economy kept growing in July and August helped to extend the rebound in the stock market heading into mid-September. The rebound in the broader stock market paused in mid-September, as Hurricane Rita, higher oil prices and a quarter point rate increase by the Federal Reserve contributed to the DJIA posting its worst weekly loss in three months for the trading week ending September 23rd. Stocks rebounded mildly at the close of the third quarter, which helped the DJIA to a 2.9% gain for the third quarter. As an indication of the general trends in the nation's stock markets over the past year, as of November 4, 2005, the DJIA closed at 10530.8, an increase of 1.4% from one year ago and a decline of 2.3% year-to-date, and the NASDAQ closed at 2169.4 an increase of 6.4% from one year ago and a decline of 0.3% year-to-date. The Standard & Poors 500 Index closed at 1220.1 on November 4, 2005 an increase of 4.6% from one year ago and an increase of 0.7% year-to-date.
The market for thrift stocks has been mixed during the past twelve months, but, in general, thrift stocks have appreciated and declined in conjunction with the broader market. Thrift stocks followed the broader stock market lower at the close of the third quarter of 2004 and then rebounded in conjunction with the broader stock market rally at the start of the fourth quarter. After trading in a narrow range into mid-October, thrift stocks moved lower on some disappointing third quarter earnings and lower guidance on future earnings due to margin compression resulting from a flatter yield curve. The rally in the boarder stock market and the Federal Reserve’s indication that inflation risks were well contained fueled gains in the thrift sector during the first half of November. Trading activity in thrift stocks was mixed during late-November, as the rally lost steam on some profit taking and higher than expected inflation data for October. Thrift issues followed the broader market higher in early-December and then declined modestly into a narrow trading range through late-December. The year end rally in the broader stock market provided a slight boost to thrift prices as well.
RP Financial, LC.
Page 4.14
The market for thrift stocks was mixed at the start of 2005, but, in general, thrift stocks eased lower during January. Fourth quarter earnings for the thrift sector were generally in line with expectations, but concerns about higher interest rates and margin compression hindered thrift stocks throughout most of January. Thrift stocks followed the broader market higher in early-February, but then eased slightly in mid-February as long-term interest rates spiked-up following an unexpected surge in the January 2005 wholesale core inflation rate. Comparatively, tame inflation data reflected in the January consumer price index provided a boost to the thrift sector in late-February. Thrift stocks followed the broader market higher in early-March, as long-term interest rates declined slightly. Likewise, thrift stocks declined in conjunction with broader market during mid-March on the spike-up in long-term interest rates and signals from the Federal Reserve that it was becoming more concerned about inflation. Thrift stocks participated in the broader market rally at the close of the first quarter, with the SNL Thrift Index posting a one-day gain of 1.3% compared to 1.1% gain for the DJIA.
Thrift issues started the second quarter of 2005 trading in a narrow range and then followed the broader market lower in mid-April reflecting concerns that first quarter earnings in the thrift sector would show the negative effects of net interest margin compression resulting from the flattening of the yield curve. Acquisition speculation involving some large thrifts and a strong report on new home sales in March provided a boost to thrift stocks in late-April. Thrift stocks continued to show strength at the beginning of May, as long-term Treasury yields headed higher on news that the U.S. Treasury Department was considering bringing back the 30-year Treasury bond. Surprisingly strong job growth cooled off the thrift rally at the end of the first week of May. Thrift stocks rebounded in mid-May on strength in the broader market and a smaller than expected increase in the April consumer price index, which served to ease inflation concerns. Tame inflation data in the revised first quarter GDP report provided a boost to thrift stocks in late-May.
A weak employment report for May 2005 and concerns of an inverted yield curve provided for a mild pull back in thrift issues in early-June. Thrift stocks strengthened in mid-June, supported by a decline in the May consumer price index which served to calm inflation fears. Stocks in general also moved higher in mid-June on news that consumer confidence was up in June, reflecting the impact of a decline in the national unemployment rate and lower
RP Financial, LC.
Page 4.15
gasoline prices. Thrift stocks traded in a narrow range at the end of the second quarter, outperforming the broader market as acquisition activity in the financial services sector largely offset factors that were negatively impacting stocks in general such as higher oil prices.
Strength in the broader stock market and some positive second quarter earnings reports in the thrift sector supported a positive trend in thrift stocks at the beginning of the third quarter of 2005. Thrift stocks settled into a narrow trading range in late-July and early-August, as higher short-term interest rates provided for further flattening of the Treasury yield curve. Weakness in the broader market combined with a flatter yield curved pressured thrift stocks lower in mid- and late-August. Similar to the broader market, the market for thrift issues showed mixed results in early-September amid ongoing concerns about the long-term economic impact of Hurricane Katrina. Strength in the broader market and speculation of the Federal Reserve taking a pause in increasing rates supported a mild rally in thrift stocks going into mid-September. Likewise, thrift issues sold off in conjunction with the broader stock market going into late-September, as investors reacted negatively to the Federal Reserve hiking interest rates by another quarter point and the threat of Hurricane Rita hurting energy production. In contrast to the rebound in the broader stock market, thrift issues continued their slide at the end of the third quarter as a sharp decline in September consumer confidence weighted heavily on the thrift sector. On November 4, 2005, the SNL Index for all publicly-traded thrifts closed at 1,551.1, an increase of 1.6% from one year ago and a decline of 3.4% year-to-date. The SNL MHC Index closed at 2,977.8 on November 4, 2005, an increase of 3.1% from one year ago and an increase of 1.7% year-to-date.
B. The New Issue Market
In addition to thrift stock market conditions in general, the new issue market for converting thrifts is also an important consideration in determining the Association’s pro forma market value. The new issue market is separate and distinct from the market for seasoned thrift stocks in that the pricing ratios for converting issues are computed on a pro forma basis, specifically: (1) the numerator and denominator are both impacted by the conversion offering amount, unlike existing stock issues in which price change affects only the numerator; and (2) the pro forma pricing ratio incorporates assumptions regarding source and use of proceeds,
RP Financial, LC.
Page 4.16
effective tax rates, stock plan purchases, etc. which impact pro forma financials, whereas pricing for existing issues are based on reported financials. The distinction between pricing of converting and existing issues is perhaps no clearer than in the case of the price/book ("P/B") ratio in that the P/B ratio of a converting mutual thrift will result in a discount to book value whereas in the current market for existing thrifts the P/B ratio often reflects a premium to book value. Therefore, it is appropriate to also consider the market for new issues, both at the time of the conversion and in the aftermarket.
After experiencing a softer market in the first part of 2005, particularly with respect to mutual holding company offerings where a number of new issues traded below their IPO prices, speculative interest in converting thrifts lessened and the new issue market for converting issues has shown signs of stabilizing in recent months. As shown in Table 4.2, one full conversion, one second step conversion of a mutual holding company and two mutual holding company offerings were completed during the past three months. The mutual holding company offerings involved large companies (assets in excess of $1 billion) that are considered to be less relevant for purposes of our analysis. On a fully-converted basis, the average closing pro forma price/tangible book ratio of the two recent MHC offerings equaled 83.1%, and these two companies experienced a moderate run-up in after market trading prices as shown in Table 4.2.
Perhaps more relevant to the interest in the Association’s offering are the results of the five small MHC offerings completed in 2005. These offering involved smaller companies whose stock were traded on the bulletin boards - like the Association’s will be upon completion of the conversion offering (see Exhibit IV-4). As shown in Table 4.3, the most recent three offerings closed their offering at 92% of the midpoint valuation, were priced at an average fully converted P/B ratio of 73.9% and traded only slightly higher than their initial offering price.
RP Financial, LC.
Page 4.17
RP Financial, LC.
Page 4.18
Table 4.3
Mutual Federal Savings and Loan Association of Chicago
Recent OTC Listed Thrift Conversions
| Comp. Date | Company | Gross Proceeds | % of Midpt. | Valuation P/B | 1 Mnth Trading |
7/14/05 | Ottawa Svgs Bncrp, IL | $10.0 | 86% | 75.9% | 7.0% |
| 6/2/05 | North Penn Bancorp, PA | 6.4 | 85% | 73.6% | 1.5% |
1/21/05 | Home Federal, LA | 14.7 | 105% | 72.4% | (0.8%) |
| | Averages | $10.4 | 92% | 73.9% | 2.6% |
Based on these results, we concluded that smaller MHC offerings that will be listed on the OTC Bulletin Board have greatly diminished in attractiveness to the market. Lack of liquidity, the MHC structure, and uncertainty regarding long term prospects have combined to limit the marketability of IPO shares for smaller size offerings like the Association.
C. The Acquisition Market
Also considered in the valuation was the potential impact on the Mutual Federal stock price of recently completed and pending acquisitions of other savings institutions operating in Illinois. As shown in Exhibit IV-5, there were ten Illinois thrift acquisitions completed from June 1, 2003 through year-to-date 2005, and there are currently two pending acquisitions of Illinois savings institutions. To the extent that acquisition speculation may impact the Association’s valuation, we have largely taken this into account in selecting companies which operate in the MHC form of ownership. Accordingly, the Peer Group companies are considered to be subject to the same type of acquisition speculation that may influence the Mutual Federal trading price.
* * * * * * * * * * *
In determining our valuation adjustment for marketing of the issue, we considered trends in both the overall thrift market, the new issue market including the new issue market for MHC shares and the local acquisition market for thrift stocks. Taking these factors and trends into account, RP Financial concluded that a moderate downward adjustment was appropriate in
RP Financial, LC.
Page 4.19
the valuation analysis for purposes of marketing of the issue. This adjustment is due to recent data suggesting lack of investor interest in smaller sized offerings.
8. Management
The Mutual Federal management team appears to have experience and expertise in all of the key areas of the Association’s operations. Exhibit IV-6 provides summary resumes of the Mutual Federal Board of Directors and senior management. The financial characteristics of the Association suggest that the Board and management team have been effective in implementing an operating strategy that can be well managed by the Association’s present organizational structure. The Association currently does not have any senior management positions that are vacant.
Similarly, the returns, capital positions and other operating measures of the Peer Group companies are indicative of well-managed financial institutions, which have Boards and management teams that have been effective in implementing competitive operating strategies. Therefore, on balance, we concluded no valuation adjustment relative to the Peer Group was appropriate for this factor.
9. Effect of Government Regulation and Regulatory Reform
In summary, as a federally-insured savings and loan association operating in the MHC form of ownership, the Association will operate in substantially the same regulatory environment as the Peer Group members -- all of whom are adequately capitalized institutions and are operating with no apparent restrictions. Exhibit IV-7 reflects the Association’s pro forma regulatory capital ratios. There was one difference noted between Mutual Federal and one Peer Group company operating under the FDIC regulatory policy. This difference relates to the treatment of dividend waivers (see the discussion above for "Dividends"). Since this factor was already accounted for in the "Dividends" section of this appraisal, no further adjustment has been applied for the effect of government regulation and regulatory reform.
RP Financial, LC.
Page 4.20
Summary of Adjustments
Overall, based on the factors discussed above, we concluded that the Association’s pro forma market value should reflect the following valuation adjustments relative to the Peer Group:
Table 4.4
Mutual Federal Savings and Loan Association of Chicago
Valuation Adjustments
| Key Valuation Parameters: | Valuation Adjustment |
| Financial Condition | Slight Upward |
| Profitability, Growth and Viability of Earnings | Moderate Downward |
| Asset Growth | Slight Downward |
| Primary Market Area | No Adjustment |
| Dividends | No Adjustment |
| Liquidity of the Shares | Moderate Downward |
| Marketing of the Issue | Moderate Downward |
| Management | No Adjustment |
| Effect of Government Regulations and Regulatory Reform | No Adjustment |
Basis of Valuation - Fully-Converted Pricing Ratios
As indicated in Chapter III, the valuation analysis included in this section places the Peer Group institutions on equal footing by restating their financial data and pricing ratios on a "fully-converted" basis. We believe there are a number of characteristics of MHC shares that make them different from the shares of fully-converted companies. These factors include: (1) lower aftermarket liquidity in the MHC shares since less than 50% of the shares are available for trading; (2) no opportunity for public shareholders to exercise voting control; (3) the potential pro forma impact of second-step conversions on the pricing of MHC institutions; (4) the regulatory policies regarding the dividend waiver policy by MHC institutions; and (5) the middle-tier structure maintained by most MHCs that facilitates the ability for stock repurchases. The above characteristics of MHC shares have provided MHC shares with different trading characteristics versus fully-converted companies. To account for the unique trading characteristics of MHC shares, RP Financial has placed the financial data and pricing ratios of the Peer Group on a fully-converted basis to make them comparable for valuation purposes.
RP Financial, LC.
Page 4.21
Using the per-share and pricing information of the Peer Group on a fully-converted basis accomplishes a number of objectives. First, such figures eliminate distortions that result when trying to compare institutions that have different public ownership interests outstanding. Secondly, such an analysis provides ratios that are comparable to the pricing information of fully-converted public companies, and more importantly, are directly applicable to determining the pro forma market value range of the 100% ownership interest in Mutual Federal as an MHC. Lastly, such an analysis allows for consideration of the potential dilutive impact of dividend waiver policies adopted by the Federal agencies. This technique is validated by the investment community's evaluation of MHC pricing, which also incorporates the pro forma impact of a second-step conversion based on the current market price.
To calculate the fully-converted pricing information for MHCs, the reported financial information for the public MHCs must incorporate the following assumptions, based on completed second step conversions to date: (1) all shares owned by the MHC are assumed to be sold at the current trading price in a second step-conversion; (2) the gross proceeds from such a sale were adjusted to reflect reasonable offering expenses and standard stock based benefit plan parameters that would be factored into a second-step conversion of MHC institutions; (3) net proceeds are assumed to be reinvested at market rates on a tax effected basis; and (4) the public ownership interest is adjusted to reflect the pro forma impact of the waived dividends pursuant to applicable regulatory policy. Book value per share and earnings per share figures for the public MHCs were adjusted by the impact of the assumed second step-conversion, resulting in an estimation of book value per share and earnings per share figures on a fully-converted basis. Table 4.5 on the following page shows the calculation of per share financial data (fully-converted basis) for each of the ten public MHC institutions that form the Peer Group.
Valuation Approaches: Fully-Converted Basis
In applying the accepted valuation methodology promulgated by the OTS and adopted by the FDIC, i.e., the pro forma market value approach, including the fully-converted analysis described above, we considered the three key pricing ratios in valuing the Mutual Federal to-be-issued stock -- price/earnings ("P/E"), price/book ("P/B"), and price/assets ("P/A") approaches -- all performed on a pro forma basis including the effects of the stock proceeds. In computing the
RP Financial, LC.
Page 4.22
RP Financial, LC.
Page 4.23
pro forma impact of the conversion and the related pricing ratios, we have incorporated the valuation parameters disclosed in the Mutual Federal prospectus for the reinvestment rate, effective tax rate and stock benefit plan assumptions (summarized in Exhibits IV-8 and IV-9). Pursuant to the minority stock offering, we have also incorporated the valuation parameters disclosed in the Mutual Federal prospectus for offering expenses. The assumptions utilized in the pro forma analysis in calculating the Association’s full conversion value were consistent with the assumptions utilized for the minority stock offering, except expenses were assumed to include the sale of all shares by the marketing firm.
In our estimate of value, we assessed the relationship of the pro forma pricing ratios relative to the Peer Group, recent conversions and MHC offerings.
RP Financial's valuation placed an emphasis on the following:
| · | P/E Approach. The P/E approach is generally the best indicator of long-term value for a stock. Given the similarities between the Association’s and the Peer Group's earnings composition and overall financial condition, the P/E approach was carefully considered in this valuation. At the same time, recognizing that (1) the earnings multiples will be evaluated on a pro forma fully-converted basis for the Association as well as for the Peer Group; and (2) the Peer Group on average has had the opportunity to realize the benefit of reinvesting the minority offering proceeds, we also gave weight to the other valuation approaches. |
| · | P/B Approach. P/B ratios have generally served as a useful benchmark in the valuation of thrift stocks, particularly in the context of an initial public offering, as the earnings approach involves assumptions regarding the use of proceeds. RP Financial considered the P/B approach to be a valuable indicator of pro forma value, taking into account the pricing ratios under the P/E and P/A approaches. We have also modified the P/B approach to exclude the impact of intangible assets (i.e., price/tangible book value or “P/TB”), in that the investment community frequently makes this adjustment in its evaluation of this pricing approach. |
| · | P/A Approach. P/A ratios are generally a less reliable indicator of market value, as investors typically assign less weight to assets and attribute greater weight to book value and earnings. Furthermore, this approach as set forth in the regulatory valuation guidelines does not take into account the amount of stock purchases funded by deposit withdrawals, thus understating the pro forma P/A ratio. At the same time, the P/A ratio is an indicator of franchise value, and, in the case of highly capitalized institutions, high P/A ratios may limit the investment community's willingness to pay market multiples for earnings or book value when ROE is expected to be low. |
RP Financial, LC.
Page 4.24
The Association will adopt Statement of Position ("SOP") 93-6, which will cause earnings per share computations to be based on shares issued and outstanding excluding unreleased ESOP shares. For purposes of preparing the pro forma pricing analyses, we have reflected all shares issued in the offering, including all ESOP shares, to capture the full dilutive impact, particularly since the ESOP shares are economically dilutive, receive dividends and can be voted. However, we did consider the impact of the adoption of SOP 93-6 in the valuation.
Based on the application of the three valuation approaches, taking into consideration the valuation adjustments discussed above, RP Financial concluded that as of November 4, 2005, the pro forma market value of Mutual Federal’s full conversion offering equaled $27,500,000 at the midpoint, equal to 2,750,000 shares at $10.00 per share.
1. Price-to-Earnings ("P/E"). The application of the P/E valuation method requires calculating the Association’s pro forma market value by applying a valuation P/E multiple (fully-converted basis) to the pro forma earnings base. In applying this technique, we considered both reported earnings and a recurring earnings base, that is, earnings adjusted to exclude any one-time non-operating items, plus the estimated after-tax earnings benefit of the reinvestment of the net proceeds. The Association’s reported earnings equaled $1,382,000 for the twelve months ended September 30, 2005. In deriving Mutual Federal’s core earnings, the adjustment made to reported earnings including eliminating net gains on the sale of Freddie Mac stock, which equaled $885,000 on an after tax basis for the twelve months ended September 30, 2005. As shown in Table 4.6, on a tax affected basis, assuming an effective marginal tax rate of 39% for the gains or losses eliminated, the Association’s core earnings were determined to equal $497,000 for the twelve months ended September 30, 2005. (Note: see Exhibit IV-10 for the adjustments applied to the Peer Group's earnings in the calculation of core earnings).
RP Financial, LC.Page 4.25
Table 4.6
Mutual Federal Savings and Loan Association of Chicago
Derivation of Estimated Core Net Income
| | | Amount | |
| | | ($000) | |
| Net income - Twelve Months Ended Sept. 30, 2005 | | $ | 1,382 | |
| Deduct: Gains on sale of Freddie Mac Stock | | | (1,451 | ) |
| Addback: Tax benefit @39% | | | 566 | |
| Estimated core net income | | $ | 497 | |
(1) Tax effected at 40%.
Based on the Association’s reported and estimated core earnings, and incorporating the impact of the pro forma assumptions discussed previously, the Association’s pro forma reported and core P/E multiples (fully-converted basis) at the $27.5 million midpoint value equaled 17.59 times and 40.56 times, respectively, which provided for a discount of 37.1% on a reported earnings basis and a 38.1% premium on a core earnings basis relative to the Peer Group's average reported and core P/E multiples (fully-converted basis) of 27.98 times and 29.38 times, respectively (see Table 4.7). The implied discount and premium reflected in the Association’s pro forma P/E multiples take into consideration the pro forma P/B and P/A ratios.
On an MHC reported basis, Mutual Federal’s reported and core P/E multiples at the midpoint value of $27.5 million and the indicated minority stock offering equaled 20.22 times and 57.91 times, respectively. The Association’s reported and core P/E multiples provided for a discount of 31.2% on a reported earnings basis and a 97.24% premium on a core earnings basis relative to the Peer Group’s average reported and core P/E multiples of 29.38 times and 29.36 times, respectively. The Association’s implied MHC pricing ratios relative to the MHC pricing ratios for the Peer Group are shown in Table 4.8, and the pro forma calculations are detailed in Exhibits IV-11 and Exhibit IV-12.
2. Price-to-Book ("P/B"). The application of the P/B valuation method requires calculating the Association’s pro forma market value by applying a valuation P/B ratio, as derived from the Peer Group’s P/B ratio (fully-converted basis), to the Mutual Federal pro forma book value (fully-converted basis). Based on the $27.5 million midpoint valuation, the Mutual Federal pro forma P/B and P/TB ratios equaled 66.29%. In comparison to the average P/B and
RP Financial, LC.
Page 4.26
RP Financial, LC.
Page 4.27
RP Financial, LC.
Page 4.28
P/TB ratios for the Peer Group of 88.41% and 91.91%, these pro forma ratios reflected a discount of 25.0% on a P/B basis and a discount of 27.9% on a P/TB basis. RP Financial considered the discounts under the P/B approach to be reasonable, in light of the previously referenced valuation adjustments and the nature of the calculation of the P/B ratio which mathematically results in a ratio discounted to book value. Moreover, should the offering close at the supermaximum valuation, the resulting discount under the P/TB approach would narrow to 16.4% and under the core P/E approach the discount would equal 19.5%. In light of recent trends in the new issue market, where most recent offerings have closed at the super range maximums and recent aftermarket trades have been relatively muted, we concluded that the resulting discounts under the P/TB and core P/E approaches were appropriate measures of value should the offering indeed oversubscribe.
On an MHC reported basis, the Association’s P/B and P/TB ratios at the $27.5 million midpoint value and the indicated minority stock offering equaled 111.90%, respectively. In comparison to the average P/B and P/TB ratios indicated for the Peer Group of 165.93% and 178.15%, respectively, the Mutual Federal ratios were discounted by 32.6% on a P/B basis and 37.2% on a P/TB basis. At the supermaximum valuation of $36.4 million, the Association’s P/B and P/TB ratios on an MHC reported basis equaled 135.62%, respectively. In comparison to the Peer Group’s average P/B and P/TB ratios, the Association’s P/B and P/TB ratios at the top of the supermaximum valuation reflected discounts of 18.3% and 23.9%, respectively.
3. Price-to-Assets ("P/A"). The P/A valuation methodology determines market value by applying a valuation P/A ratio (fully-converted basis) to the Association’s pro forma asset base, conservatively assuming no deposit withdrawals are made to fund stock purchases. In all likelihood there will be deposit withdrawals, which results in understating the pro forma P/A ratio which is computed herein. At the midpoint of the valuation range, the Mutual Federal full conversion value equaled 31.04% of pro forma assets. Comparatively, the Peer Group companies exhibited an average P/A ratio (fully-converted basis) of 20.86%, which implies a premium of 48.8% has been applied to the Association’s pro forma P/A ratio (fully-converted basis).
RP Financial, LC.
Page 4.29
On an MHC reported basis, the Mutual Federal pro forma P/A ratio at the $27.5 million midpoint value and the minority stock offering equaled 38.37%. In comparison to the Peer Group's average P/A ratio of 23.51%, the pro forma P/A ratio indicated a premium of 63.2%.
Comparison to Recent Offerings
As indicated at the beginning of this chapter, RP Financial’s analysis of recent conversion and MHC offering pricing characteristics at closing and in the aftermarket has been limited to a “technical” analysis and, thus, the pricing characteristics of recent conversion offerings can not be a primary determinate of value. Particular focus was placed on the P/TB approach in this analysis, since the P/E multiples do not reflect the actual impact of reinvestment and the source of the stock proceeds (i.e., external funds vs. deposit withdrawals). The two recently completed MHC offerings closed at an average price/tangible book ratio of 83.1% (fully-converted basis) and, on average, appreciated 10.0% during the first week of trading. In comparison, the Association’s P/TB ratio of 66.29% at the midpoint value reflects an implied discount of 20.2% relative to the average closing P/TB ratio of the recent MHC offerings. At the top of the super range, the Association’s P/TB ratio of 74.0% reflected an implied discount of 11.0% relative to the average closing P/TB ratio of the recent MHC offerings. The current average fully-converted P/TB ratio of the two recent MHC offerings that are quoted on NASDAQ (Investors Bancorp of NJ and Wauwatosa Holdings of WI) equaled 85.4%, based on closing market prices as of November 4, 2005. In comparison to the current P/TB ratio of these publicly-traded MHC offerings, the Association’s P/TB ratio at the midpoint value reflects an implied discount of 22.4% and at the top of the supermaximum valuation the discount narrows to 13.4%.
Valuation Conclusion
Based on the foregoing, it is our opinion that, as of November 4, 2005, the estimated aggregate pro forma market value of the shares to be issued immediately following the conversion, including shares issued publicly as well as to the MHC, equaled $27,500,000 at the midpoint, equal to 2,750,000 shares offered at a per share value of $10.00.
Pursuant to conversion guidelines, the 15% offering range indicates a minimum value of $23,375,000 and a maximum value of $31,625,000. Based on the $10.00 per share offering price
RP Financial, LC.
Page 4.30
determined by the Board, this valuation range equates to total shares outstanding of 2,337,500 at the minimum and 3,162,500 at the maximum. In the event the appraised value is subject to an increase, the aggregate pro forma market value may be increased up to a supermaximum value of $36,368,750 without a resolicitation. Based on the $10.00 per share offering price, the supermaximum value would result in total shares outstanding of 3,636,875. The Board of Directors has established a public offering range such that the public ownership of the Association will constitute a 30.00% ownership interest. Accordingly, the offering to the public of the minority stock will equal $7,012,500 at the minimum, $8,250,000 at the midpoint, $9,487,500 at the maximum and $10,910,630 at the supermaximum of the valuation range. Based on the public offering range, the public ownership of shares will represent 30.00% of the shares issued throughout the valuation range. The pro forma valuation calculations relative to the Peer Group (fully-converted basis) are shown in Table 4.7 and are detailed in Exhibit IV-8 and Exhibit IV-9; the pro forma valuation calculations relative to the Peer Group based on reported financials are shown in Table 4.8 and are detailed in Exhibits IV-11 and IV-12.
EXHIBITS
LIST OF EXHIBITS
Exhibit Number | Description |
| I-1 | Map of Office Locations |
| I-2 | Audited Financial Statements |
| I-3 | Key Operating Ratios |
| I-4 | Investment Portfolio Composition |
| I-5 | Yields and Costs |
| I-6 | Loan Loss Allowance Activity |
| I-7 | NPV Table |
| I-8 | Fixed Rate and Adjustable Rate Loans |
| I-9 | Loan Portfolio Composition |
| I-10 | Contractual Maturity By Loan Type |
| I-11 | Non-Performing Assets |
| I-12 | Deposit Composition |
I-13 | CD Interest Rates and Maturity Schedule |
| II-1 | Description of Office Facilities |
| II-2 | Historical Interest Rates |
| II-3 | Demographic Data in the Primary Market Area |
| II-4 | Economic Data in the Primary Market Area |
LIST OF EXHIBITS(continued)
| III-1 | General Characteristics of Publicly-Traded Institutions |
| III-2 | Public Market Pricing of MHC Institutions |
III-3 | Peer Group Market Area Comparative Analysis |
| IV-1 | Stock Prices: As of March 4, 2005 |
| IV-2 | Historical Stock Price Indices |
| IV-3 | Historical Thrift Stock Indices |
| IV-4 | Recent Bulletin Board Conversion Data |
| IV-5 | Market Area Acquisition Activity |
| IV-6 | Director and Senior Management Summary Resumes |
| IV-7 | Pro Forma Regulatory Capital Ratios |
| IV-8 | Pro Forma Analysis Sheets - Full Conversion Basis |
| IV-9 | Pro Forma Effect of Conversion Proceeds - Full Conversion Basis |
| IV-10 | Peer Group Core Earnings Analysis |
| IV-11 | Pro Forma Analysis Sheets - MHC Conversion Basis |
| IV-12 | Pro Forma Effect of Conversion Proceeds - MHC Conversion Basis |
| V-1 | Firm Qualifications Statement |