Exhibit 99.1
MLP Investor Conference
May 23, 2012
Joseph W. Craft, III Chief Executive Officer
Forward-Looking Statements
This presentation contains forward-looking statements and information that are based on the beliefs of Alliance Resource Partners, L.P. and Alliance Holdings GP, L.P. (the “Partnerships”) and those of their respective general partners (the “General Partners”), as well as assumptions made by and information currently available to them. When used in this presentation, words such as “anticipate,” “project,” “expect,” “plan,” “goal,” “forecast,” “intend,” “could,” “believe,” “may,” and similar expressions and statements regarding the plans and objectives of the Partnerships for future operations, are intended to identify forward-looking statements.
Although the Partnerships and their General Partners believe that such expectations reflected in such forward-looking statements are reasonable at the time such statements are made, neither the Partnerships nor the General Partners can give assurances that such expectations will prove to be correct. Such statements are subject to a variety of risks, uncertainties and assumptions. If one or more of these risks or uncertainties materialize, or if underlying assumptions prove incorrect, actual results may vary materially from those the Partnerships anticipated, estimated, projected or expected.
The Partnerships have no obligation to publicly update or revise any forward-looking statement, whether as a result of new information, future events or otherwise.
Alliance Overview
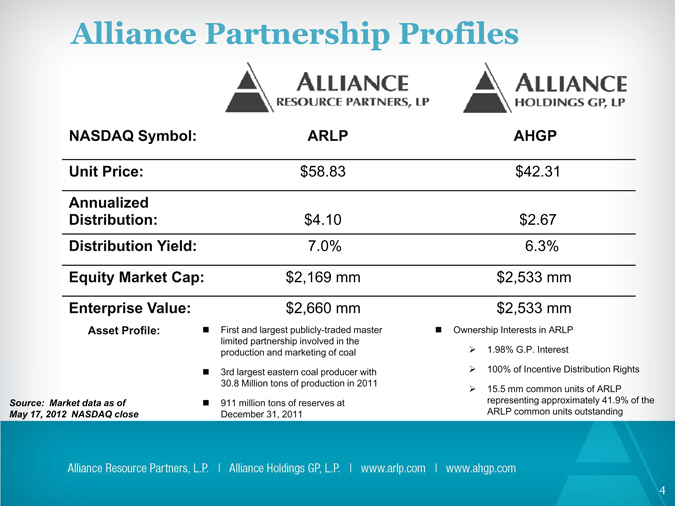
Alliance Partnership Profiles
NASDAQ Symbol: ARLP AHGP
Unit Price: $58.83 $42.31
Annualized
Distribution: $4.10 $2.67
Distribution Yield: 7.0% 6.3%
Equity Market Cap: $2,169 mm $2,533 mm
Enterprise Value: $2,660 mm $2,533 mm
Asset Profile: First and largest publicly-traded master Ownership Interests in ARLP
limited partnership involved in the 1.98% G.P. Interest production and marketing of coal
3rd largest eastern coal producer with 100% of Incentive Distribution Rights 30.8 Million tons of production in 2011
15.5 mm common units of ARLP
Source: Market data as of 911 million tons of reserves at representing approximately 41.9% of the May 17, 2012 NASDAQ close December 31, 2011 ARLP common units outstanding
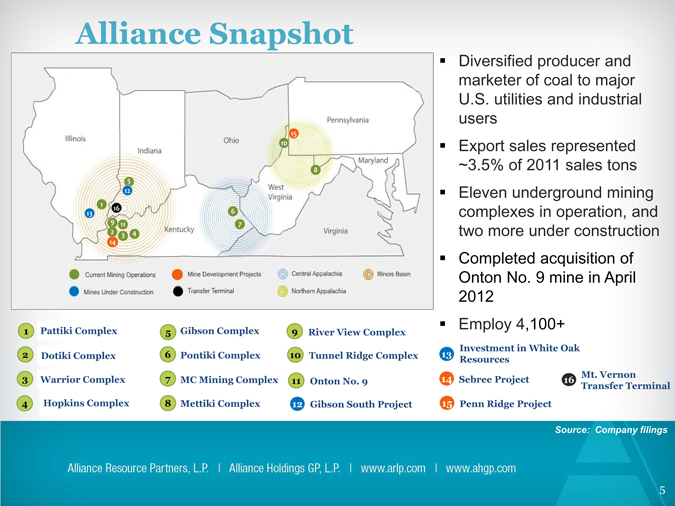
Alliance Snapshot
Diversified producer and marketer of coal to major U.S. utilities and industrial users Export sales represented ~3.5% of 2011 sales tons Eleven underground mining complexes in operation, and two more under construction Completed acquisition of Onton No. 9 mine in April 2012 Employ 4,100+
1 | | Pattiki Complex 5 Gibson Complex 9 River View Complex |
2 | | Dotiki Complex 6 Pontiki Complex 10 Tunnel Ridge Complex |
3 | | Warrior Complex 7 MC Mining Complex 11 Onton No. 9 |
4 | | Hopkins Complex 8 Mettiki Complex 12 Gibson South Project |
Investment in White Oak
13
Resources
14 Mt. Vernon
Sebree Project 166
Transfer Terminal
15 Penn Ridge Project
Alliance Strategy
The Alliance Strategy for Success
Our Mission –
Create Sustainable Growth in Cash Flow
Deliver Consistent Increases in Unitholder Distributions
The Alliance Strategy for Success
Focus on ~
Safety First
Strong customer relationships
Expanding market opportunities
Low cost producing regions
High return organic development projects
Disciplined acquisitions
Alliance Results
9
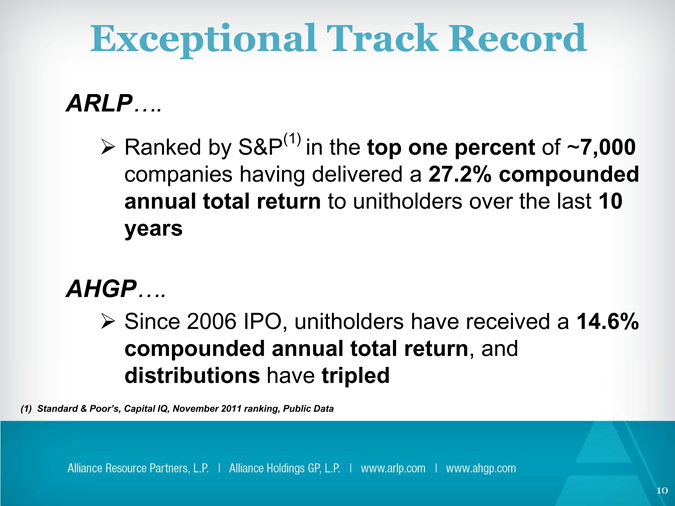
Exceptional Track Record
ARLP….
Ranked by S&P(1) in the top one percent of ~7,000 companies having delivered a 27.2% compounded annual total return to unitholders over the last 10 years
AHGP….
Since 2006 IPO, unitholders have received a 14.6% compounded annual total return, and distributions have tripled
(1) | | Standard & Poor’s, Capital IQ, November 2011 ranking, Public Data |
10
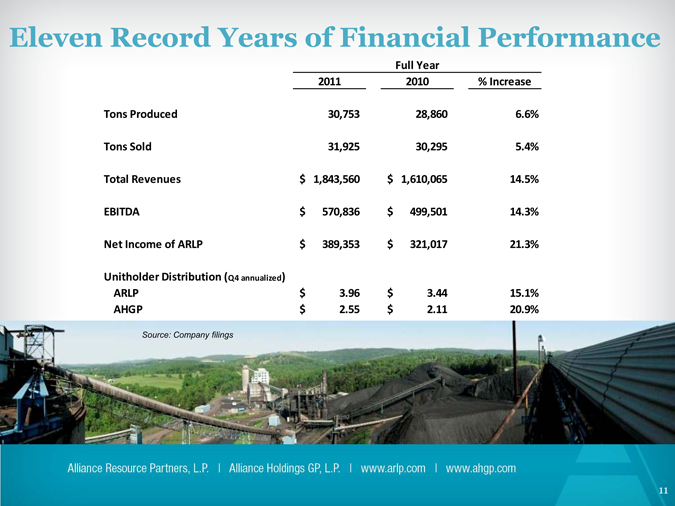
Eleven Record Years of Financial Performance
Full Year
2011 2010 % Increase Tons Produced 30,753 28,860 6.6% Tons Sold 31,925 30,295 5.4% Total Revenues $ 1,843,560 $ 1,610,065 14.5% EBITDA $ 570,836 $ 499,501 14.3% Net Income of ARLP $ 389,353 $ 321,017 21.3%
Unitholder Distribution (Q4 annualized)
ARLP $ 3.96 $ 3.44 15.1% AHGP $ 2.55 $ 2.11 20.9%
Source: Company filings
11
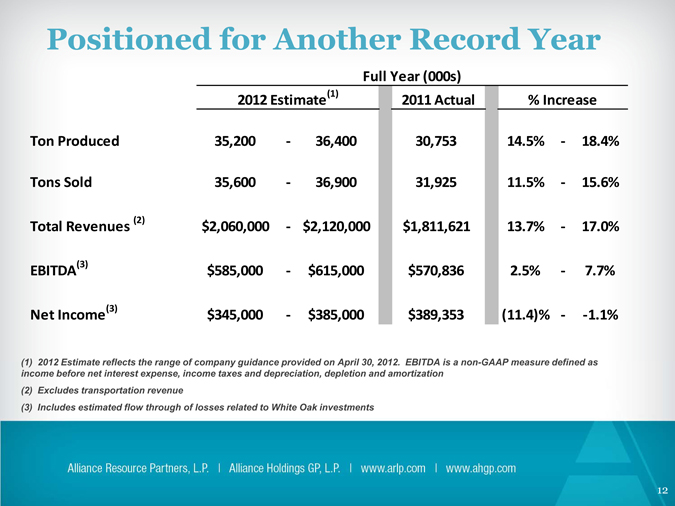
Positioned for Another Record Year
Full Year (000s)
2012 Estimate(1) 2011 Actual % Increase
Ton Produced 35,200 ? 36,400 30,753 14.5% ? 18.4%
Tons Sold 35,600 ? 36,900 31,925 11.5% ? 15.6%
Total Revenues $2,060,000 ? $2,120,000 $1,811,621 13.7% ? 17.0%
EBITDA(3) $585,000 ? $615,000 $570,836 2.5% ? 7.7%
Net Income(3) $345,000 ? $385,000 $389,353 (11.4)% ? ?1.1%
(1) 2012 Estimate reflects the range of company guidance provided on April 30, 2012. EBITDA is a non-GAAP measure defined as income before net interest expense, income taxes and depreciation, depletion and amortization (2) Excludes transportation revenue (3) Includes estimated flow through of losses related to White Oak investments
12
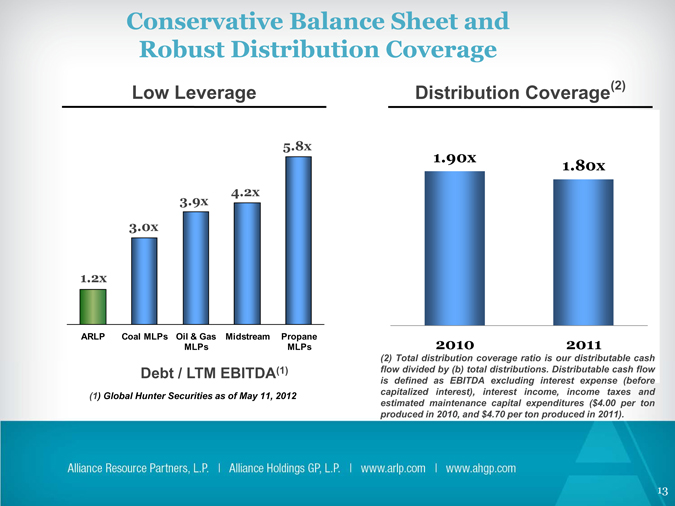
Conservative Balance Sheet and Robust Distribution Coverage
Low Leverage
5.8x
4.2x
3.9x
3.0x 1.2x
ARLP Coal MLPs Oil & Gas Midstream Propane MLPs MLPs
Debt / LTM EBITDA(1)
(1) | | Global Hunter Securities as of May 11, 2012 |
Distribution Coverage(2)
1.90x
1.80x
2010 2011
(2) Total distribution coverage g ratio is our distributable cash flow divided by (b) total distributions. Distributable cash flow is defined as EBITDA excluding interest expense (before capitalized interest), interest income, income taxes and estimated maintenance capital expenditures ($4.00 per ton produced in 2010, and $4.70 per ton produced in 2011).
13
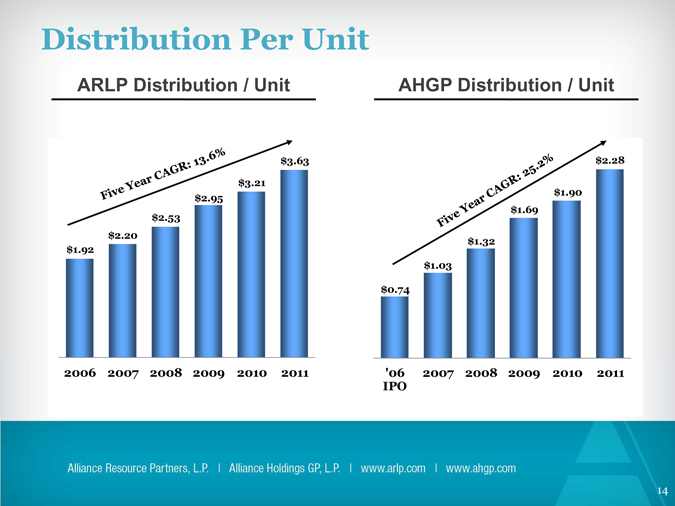
Distribution Per Unit
ARLP Distribution / Unit
$3.63
$3.21
$2.95
$2.53
$2.20 $1.92
2006 2007 2008 2009 2010 2011
Debt / LTM EBITDA(1)
AHGP Distribution / Unit
$2.28
$1.90 $1.69
$1.32
$1.03
$0.74
‘06 2007 2008 2009 2010 2011 IPO
14
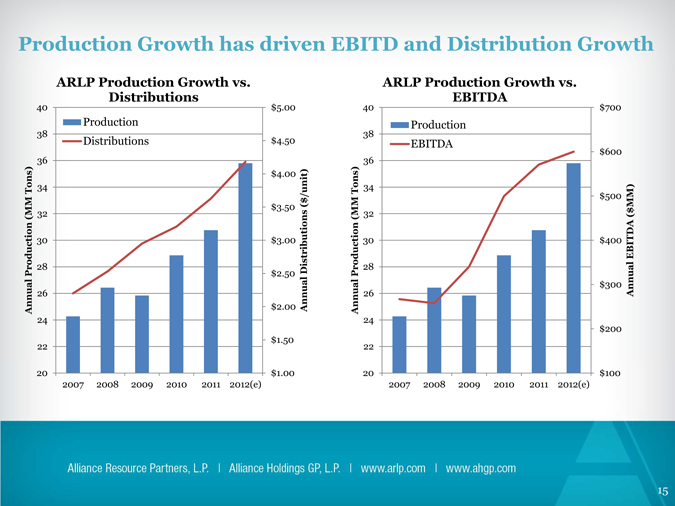
Production Growth has driven EBITD and Distribution Growth
ARLP Production Growth vs.
40 Distributions $5.00 Production 38 Distributions $4. 50 36
$4.00
Tons) 34
/unit) ( $ MM 32 $3.50s (
30 $3.00
28 Distribution Production $2.50 al al 26 Annu $2.00 Annu
24
$1.50 22
20 $1.00 2007 2008 2009 2010 2011 2012(e)
ARLP Production Growth vs.
40 EBITDA $700
38 Production EBITDA
36 $600
Tons) 34 $500 MM) MM 32 ( $ (
30 $400 EBITDA
Production 28 al $300 nual Annu 26 An
24 $200 22
20 $100 2007 2008 2009 2010 2011 2012(e)
15
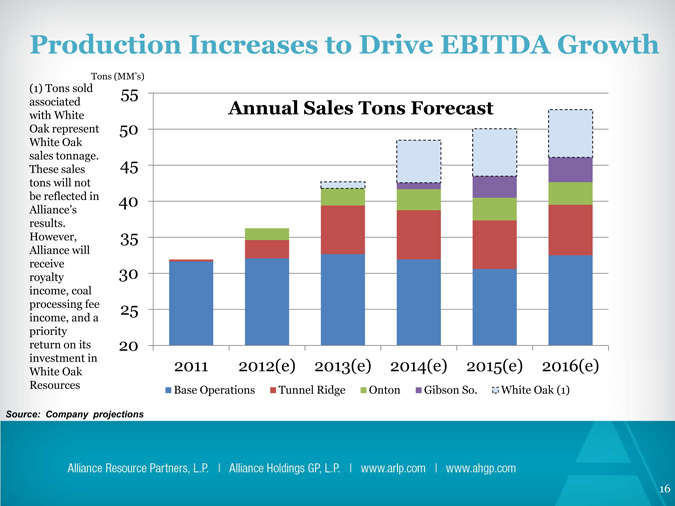
Production Increases to Drive EBITDA Growth
55
Annual Sales Tons Forecast
50 45 40 35 30 25
20
2011 2012(e) 2013(e) 2014(e) 2015(e) 2016(e)
Tons (MM’s)
(1) Tons sold associated with White Oak represent White Oak sales tonnage. These sales tons will not be reflected in Alliance’s results. However, Alliance will receive royalty income, coal processing fee income, and a priority return on its investment in White Oak Resources
Source: Company projections
16
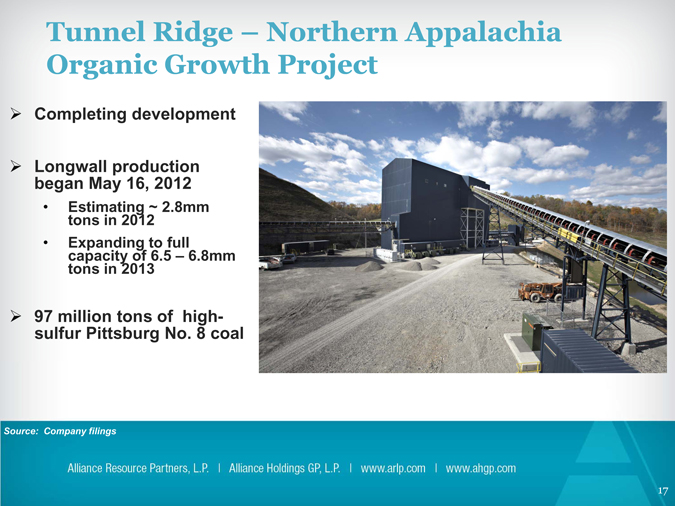
Tunnel Ridge – Northern Appalachia Organic Growth Project
Completing development
Longwall production began May 16, 2012
• Estimating tons in 2012 ~ 2.8mm
• Expanding to full capacity of 6.5 – 6.8mm tons in 2013
97 million tons of high-sulfur Pittsburg No. 8 coal
Source: Company filings
17
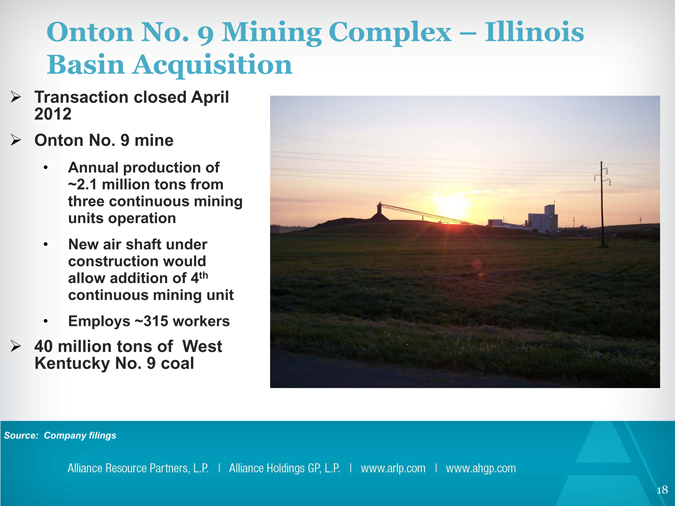
Onton No. 9 Mining Complex – Illinois Basin Acquisition
Transaction closed April 2012 Onton No. 9 mine
• Annual production of ~2.1 million tons from three continuous mining units operation
• New air shaft under construction would allow addition of 4th continuous mining unit
• Employs ~315 workers 40 million tons of West Kentucky No. 9 coal
Source: Company filings
18
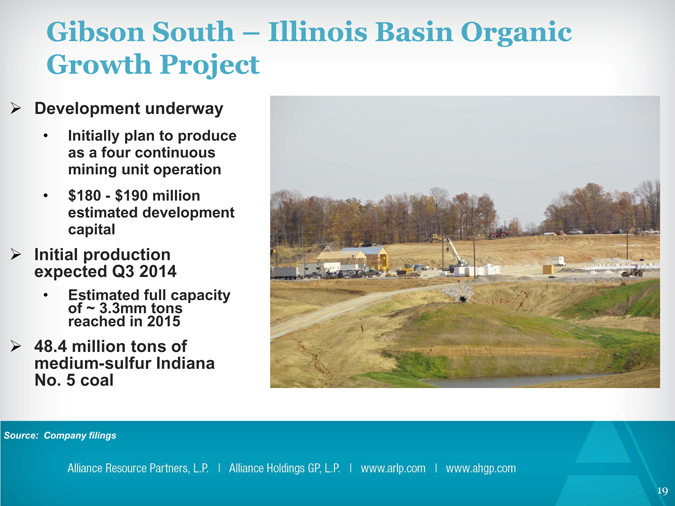
Gibson South – Illinois Basin Organic Growth Project
Development underway
• Initially plan to produce as a four continuous mining unit operation
• $180—$190 million estimated development capital Initial production expected Q3 2014
• Estimated full capacity of reached ~ 3.3mm in 2015 tons 48.4 million tons of medium-sulfur Indiana No. 5 coal
Source: Company filings
19
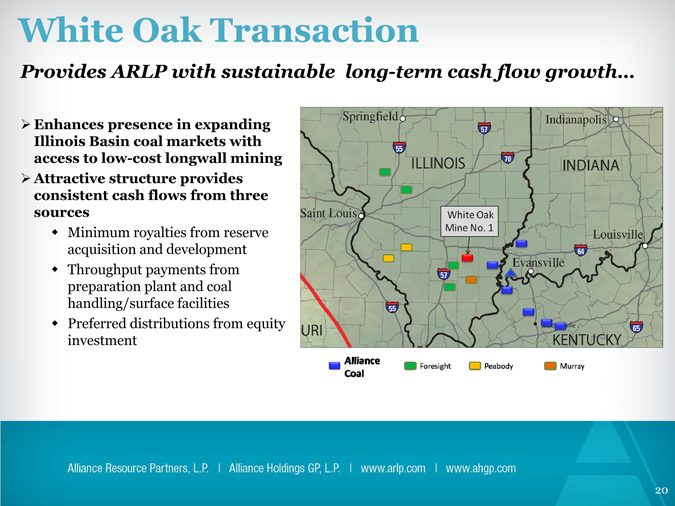
White Oak Transaction
Provides ARLP with sustainable long-term cash flow growth…
Enhances presence in expanding Illinois Basin coal markets with access to low-cost longwall mining
Attractive structure provides consistent cash flows from three sources
Minimum royalties from reserve acquisition and development Throughput payments from preparation plant and coal handling/surface facilities Preferred distributions from equity investment
20
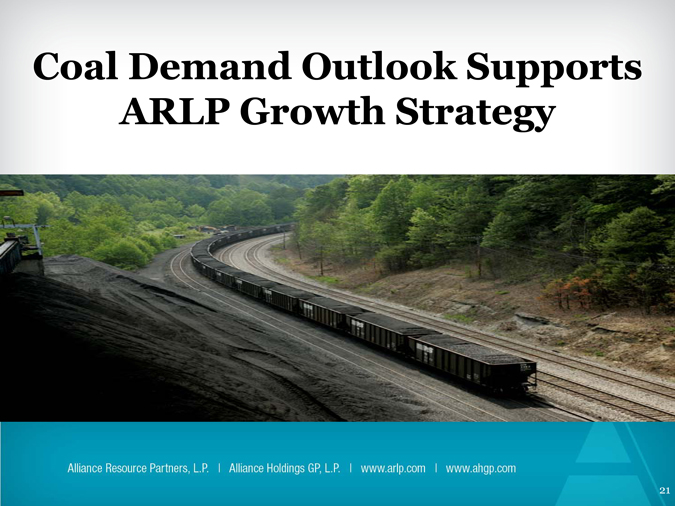
Coal Demand Outlook Supports ARLP Growth Strategy
21
Headline Risks Factored into ARLP Demand Forecast
Government Regulation
Plant Closings
Natural Gas Switching
Weather
22
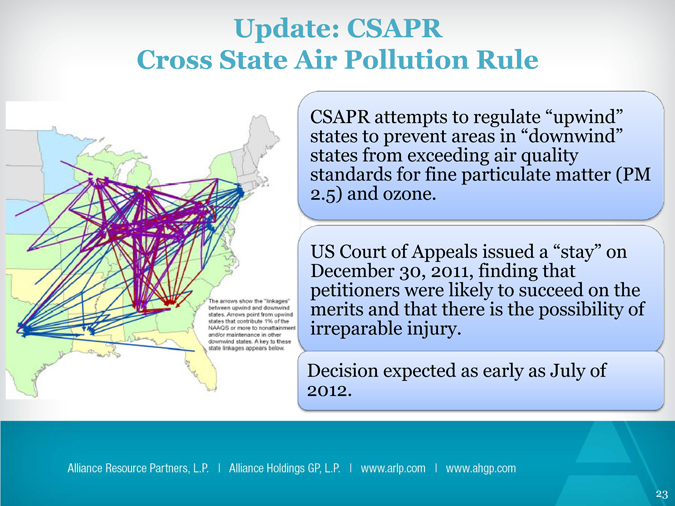
Update: CSAPR Cross State Air Pollution Rule
CSAPR attempts to regulate “upwind” states to prevent areas in “downwind” states from exceeding air quality standards for fine particulate matter (PM 2.5) and ozone.
US Court of Appeals issued a “stay” on December 30, 2011, finding that petitioners were likely to succeed on the merits and that there is the possibility of irreparable injury.
Decision expected as early as July of 2012.
23
Update: MATS Rule Mercury and Air Toxics Standards
Percent of Mercury Deposition that Originates from Outside the United States
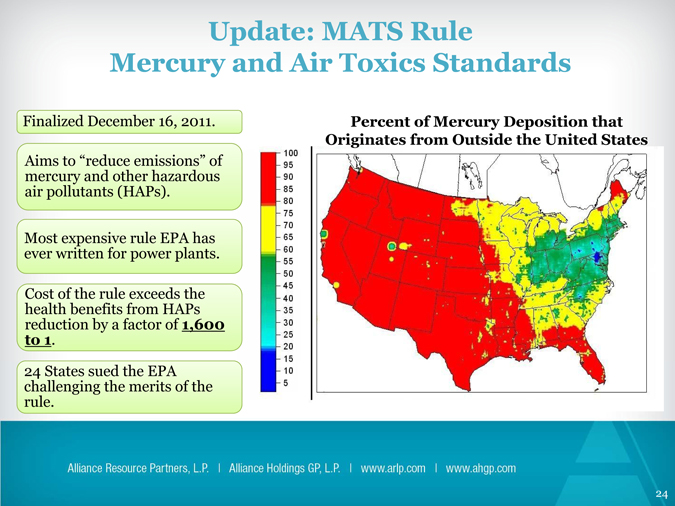
Finalized December 16, 2011.
Aims to “reduce emissions” of mercury and other hazardous air pollutants (HAPs).
Most expensive rule EPA has ever written for power plants.
Cost of the rule exceeds the health benefits from HAPs reduction by a factor of 1,600 to 1.
24 States sued the EPA challenging the merits of the rule.
24
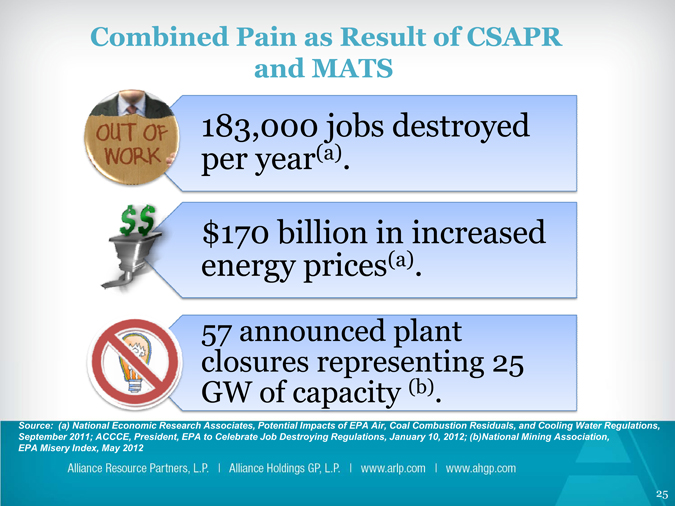
Combined Pain as Result of CSAPR and MATS
183,000 jobs destroyed per year(a).
$170 billion in increased energy prices(a).
57 announced plant closures representing 25 GW of capacity (b).
Source: (a) National Economic Research Associates, Potential Impacts of EPA Air, Coal Combustion Residuals, and Cooling Water Regulations, September 2011; ACCCE, President, EPA to Celebrate Job Destroying Regulations, January 10, 2012; (b)National Mining Association, EPA Misery Index, May 2012
25
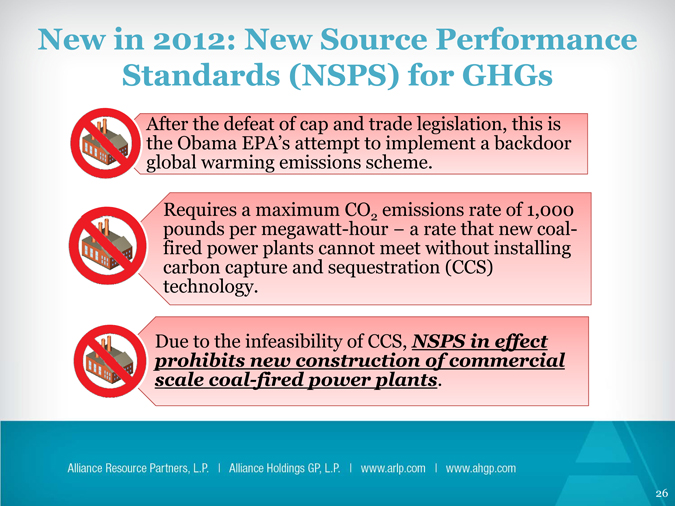
New in 2012: New Source Performance Standards (NSPS) for GHGs
After the defeat of cap and trade legislation, this is the Obama EPA’s attempt to implement a backdoor global warming emissions scheme.
RequiresRe quires a maximum CO2 emissions rate of 1,000 pounds per megawatt-hour a rate that new coal-fired power plants cannot meet without installing carbon capture and sequestration (CCS) technology.
Due to the infeasibility of CCS, NSPS in effect prohibits new construction of commercial scale coal-fired power plants.
26
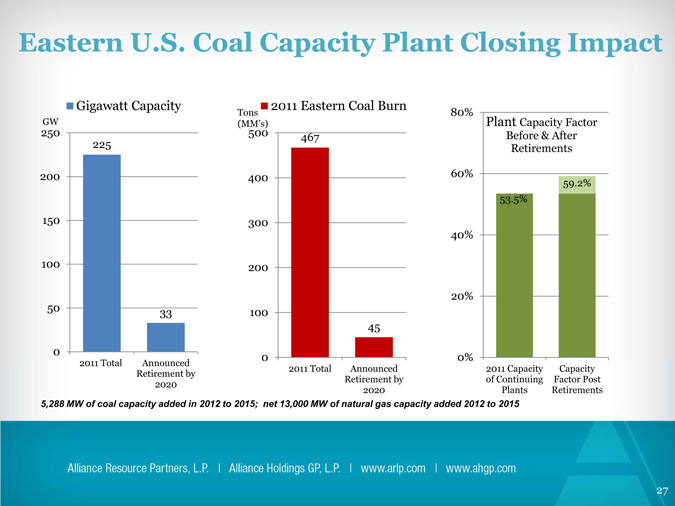
Eastern U.S. Coal Capacity Plant Closing Impact
Gigawatt Capacity
GW 250
225 200 150 100
50 33
0
2011 Total Announced
Retirement by 2020
2011 Eastern Coal Burn
Tons (MM’s)
500 467 400 300 200
100
45
0
2011 Total Announced Retirement by 2020
80%
Plant Capacity Factor Before & After Retirements
60% 59.2% 53.5%
40%
20%
0%
2011 Capacity Capacity of Continuing Factor Post Plants Retirements
5,288 MW of coal capacity added in 2012 to 2015; net 13,000 MW of natural gas capacity added 2012 to 2015
27
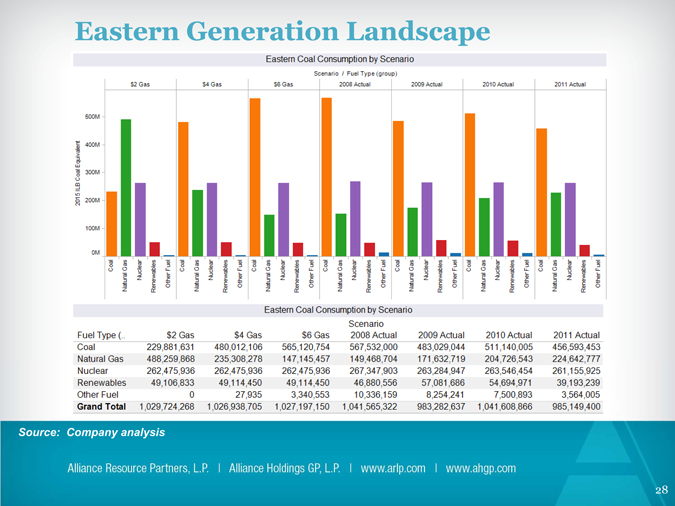
Eastern Generation Landscape
Source: Company analysis
28
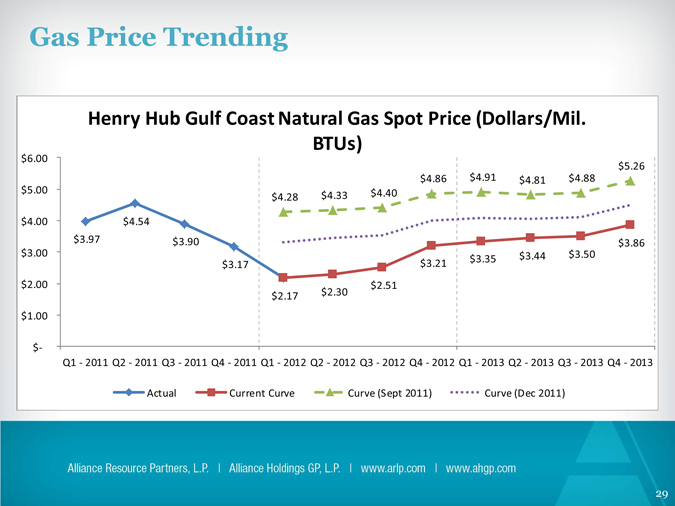
Gas Price Trending
Henry Hub Gulf Coast Natural Gas Spot Price (Dollars/Mil. BTUs)
$6.00 $5.26 $4.86 $4.91 $4.81 $4.88 $5.00 $4.40 $4.28 $4.33
$4.00 $4.54 $3.97 $3.90 $3.86 $3.00 $3.44 $3.50 $3.35 $3.17 $3.21 $2.00 $2.51 $2.17 $2.30 $1.00
$?
Q1 2011 ? Q2 2011 ? Q3 2011 ? Q4 2011 ? Q1 2012 ? Q2 2012 ? Q3 2012 ? Q4 2012 ? Q1 2013 ? Q2 2013 ? Q3 2013 ? Q4 2013 ?
Actual Current Curve Curve (Sept 2011) Curve (Dec 2011)
29
Gas Overview
J.P.Morgan – North America Equity Research:
• E&P research team expects gas to reach $4/Mcf by November 2012. Analyst The key reasons are:
1. There are fewer gas rigs running. Gas production from 1 gas rig equals ~2 liquids rich gas rigs (based on Chesapeake Data). With lower productivity in Haynesville and Marcellus better gas production discipline could be expected.
2. US E&P gas production growth is slowing down.
3. Gas was at $3.50/Mcf in Nov ‘11 but is now sub $2 level because of the unprecedented surplus due to combined effects of a warm winter and production growth – the surplus needs to be pulled down by November.
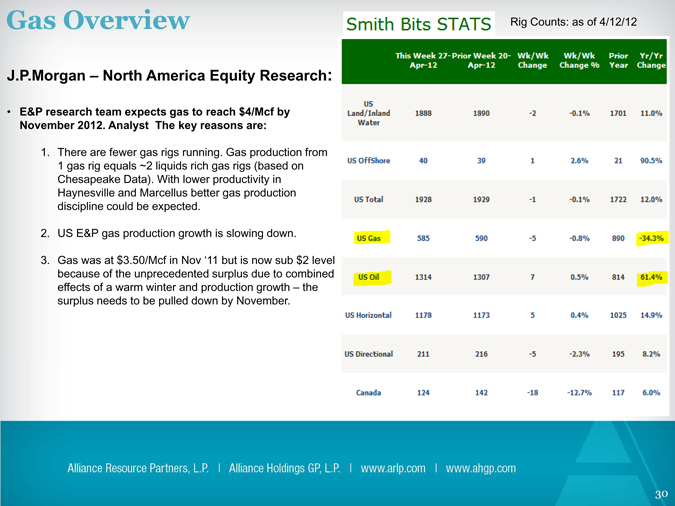
Rig Counts: as of 4/12/12
30
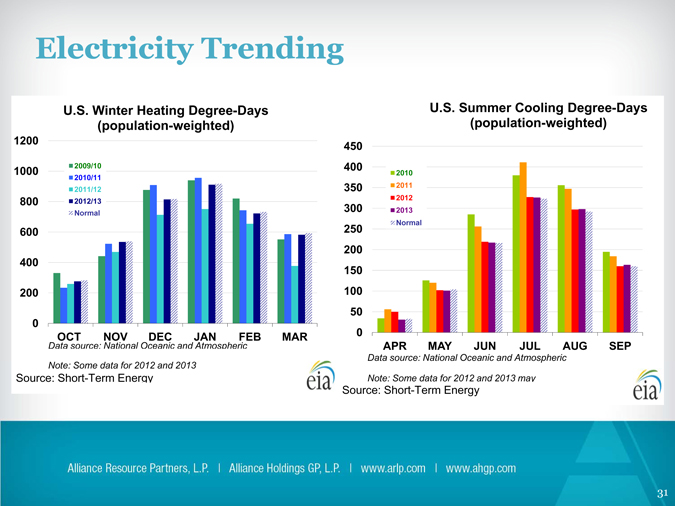
Electricity Trending
U.S. Winter Heating Degree-Days (population-weighted) 1200
1000 2009/10 2010/11 2011/12 800 2012/13 Normal
600 400 200
0
Data OCT source: NOV National Oceanic DEC and JAN Atmospheric FEB MAR
Note: Some data for 2012 and 2013
Source: Short-Term Energy
U.S. Summer Cooling Degree-Days (population-weighted) 450 400
2010 350 2011 2012 300 2013 Normal
250 200 150 100 50 0
APR MAY JUN JUL AUG SEP
Data source: National Oceanic and Atmospheric
Note: Some data for 2012 and 2013 may
Source: Short-Term Energy
31
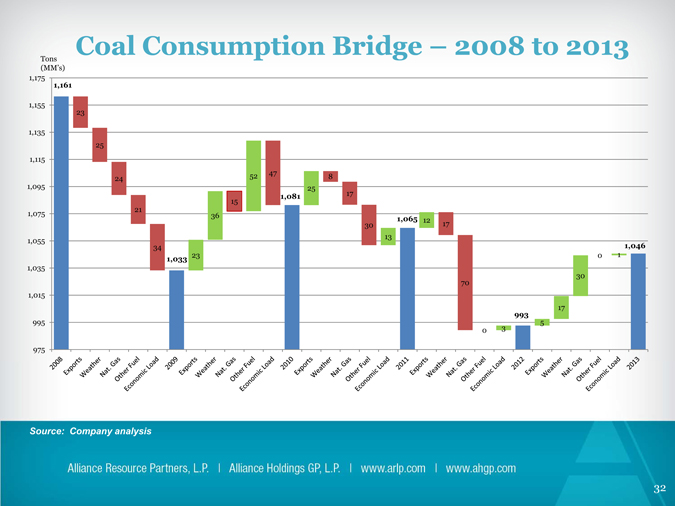
Tons Coal Consumption Bridge – 2008 to 2013
(MM’s) 1,175
1,161
1,155 23 1,135 25 1,115
52 47
24 8 1,095 25 17
1,081
15 21 1,075 36
1,065 12
30 17 13 1,055
34 1,046
23 0 1
1,033
1,035
70 30 1,015
993 17 995 5
0 3 975
Source: Company analysis
32
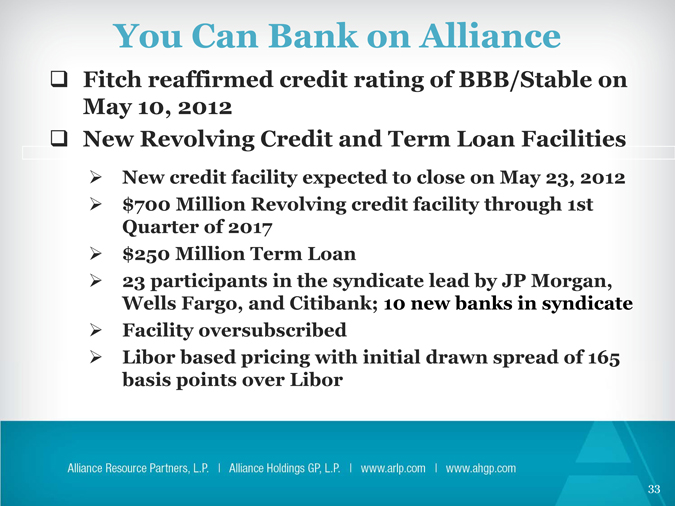
You Can Bank on Alliance
Fitch reaffirmed credit rating of BBB/Stable on May 10, 2012
New Revolving Credit and Term Loan Facilities
New credit facility expected to close on May 23, 2012
$700 Million Revolving credit facility through 1st Quarter of 2017
$250 Million Term Loan
23 participants in the syndicate lead by JP Morgan, Wells Fargo, and Citibank; 10 new banks in syndicate
Facility oversubscribed
Libor based pricing with initial drawn spread of 165 basis points over Libor
33

Why Alliance?
The MLP Coal Investment leveraging….
Solid coal demand
Low cost producer
Well contracted sales position
Strong balance sheet
Clear strategic focus
Exceptional track record
Visible growth profile
Growth in distribution with MLP sector leading coverage ratio
34
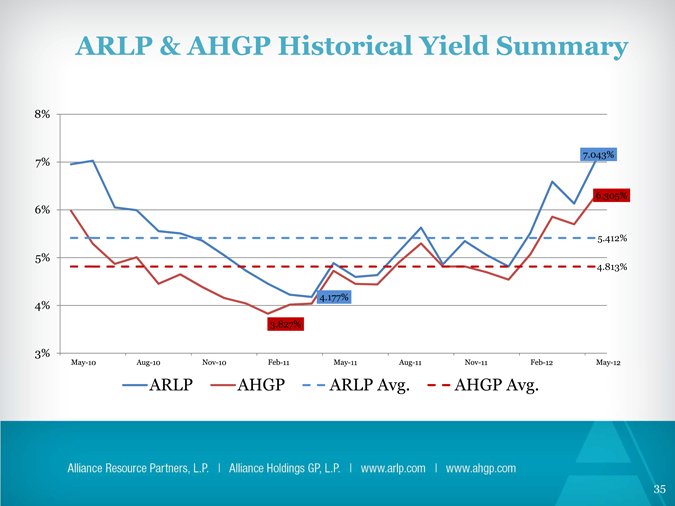
ARLP & AHGP Historical Yield Summary
8%
7.043% 7%
6.305% 6%
5.412%
5% 4.813%
4.177% 4%
3.827%
3%
ARLP AHGP ARLP Avg. AHGP Avg.
35
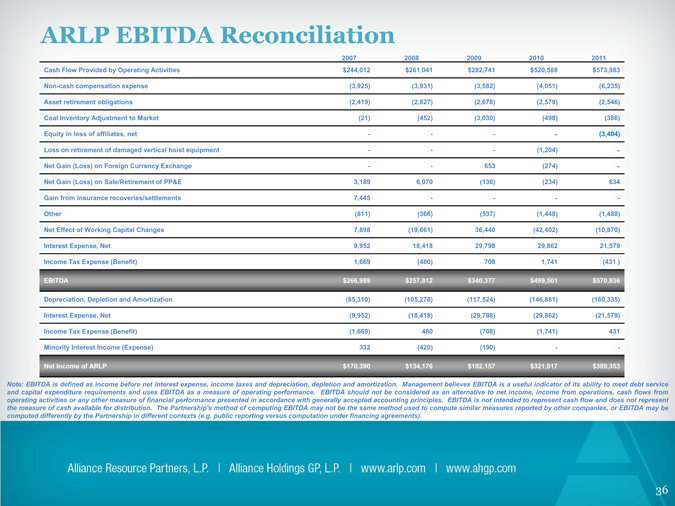
ARLP EBITDA Reconciliation
2007 2008 2009 2010 2011 Cash Flow Provided by Operating Activities $244,012 $261,041 $282,741 $520,588 $573,983
Non-cash compensation expense (3,925) (3,931) (3,582) (4,051) (6,235) Asset retirement obligations (2,419) (2,827) (2,678) (2,579) (2,546) Coal Inventory Adjustment to Market (21) (452) (3,030) (498) (386)
Equity in loss of affiliates, net———(3,404) Loss on retirement of damaged vertical hoist equipment—— (1,204) -Net Gain (Loss) on Foreign Currency Exchange—- 653 (274) -Net Gain (Loss) on Sale/Retirement of PP&E 3,189 6,070 (136) (234) 634
Gain from insurance recoveries/settlements 7,445—— -Other (811) (366) (537) (1,448) (1,488) Net Effect of Working Capital Changes 7,898 (19,661) 36,440 (42,402) (10,870) Interest Expense, Net 9,952 18,418 29,798 29,862 21,579 Income Tax Expense (Benefit) 1,669 (480) 708 1,741 (431 )
EBITDA $266,989 $257,812 $340,377 $499,501 $570,836
Depreciation, Depletion and Amortization (85,310) (105,278) (117,524) (146,881) (160,335) Interest Expense, Net (9,952) (18,418) (29,798) (29,862) (21,579) Income Tax Expense (Benefit) (1,669) 480 (708) (1,741) 431 Minority Interest Income (Expense) 332 (420) (190)—-
Net Income of ARLP $170,390 $134,176 $192,157 $321,017 $389,353
Note:: EBITDA is defined as income before net interest expense, income taxes and depreciation, depletion and amortization. Management believes EBITDA is a useful indicator of its ability to meet debt service and capital expenditure requirements and uses EBITDA as a measure of operating performance. EBITDA should not be considered as an alternative to net income, income from operations, cash flows from operating activities or any other measure of financial performance presented in accordance with generally accepted accounting principles. EBITDA is not intended to represent cash flow and does not represent the measure of cash available for distribution. The Partnership’s method of computing EBITDA may not be the same method used to compute similar measures reported by other companies, or EBITDA may be computed differently by the Partnership in different contexts (e.g. public reporting versus computation under financing agreements).
36
Coal Keeps the Lights On
37