Exhibit 99.2
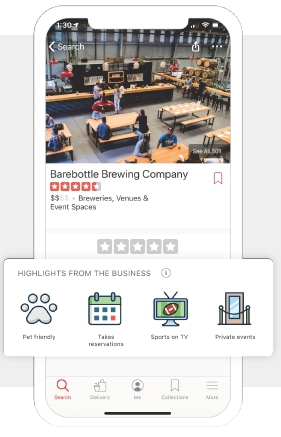
Yelp drives customers to local businesses
| |
 | | |
| | | |
| | | |
| | 
Location:
Bernal Heights
San Francisco, CA Advertiser since:
May 2017 Current products:
Cost-Per-Click Ads | Enhanced Profile Page
Business Highlights | Request A Quote
Call to Action | Connect |
| | | |
| | | |
| | | |

I like Yelp because it has allowed us as total newcomers, located in an out-of-the-way section of the city, to quickly establish a following and reputation for excellent beer, space, and service. That would have been unthinkable 10 years ago, and it’s allowed us to grow 40%+ since we opened three years ago. I also like advertising on Yelp because we have a very unique brewery space, and it gets us consideration for people looking to host parties and corporate events. Last, but not least, I really appreciate the “Request A Quote” feature because it’s a transparent way to show that the business owner cares about, and is responsive to, their customers. I wear my “100% response rate in 10-minutes or less” response time badge with pride.

Michael Seitz
Co-founder
Barebottle Brewing Company
| Star rating as of August 8, 2019 |  |
Second Quarter 2019 Highlights
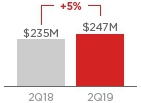
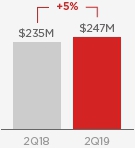
| > | Net revenue was $247 million, up 5% from the second quarter of 2018, consistent with our outlook, driven primarily by growth in Advertising revenue |
| | |
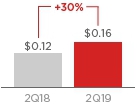
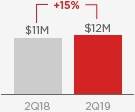
| > | Net income was $12 million, or $0.16 per diluted share, compared to Net income of $11 million, or $0.12 per diluted share, in the second quarter of 2018 |
| | |
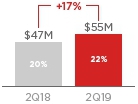
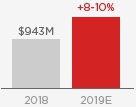
| > | Adjusted EBITDA1 grew to $55 million, an increase of $8 million, or 17%, over the second quarter of 2018. Adjusted EBITDA margin increased two percentage points to 22% and exceeded our outlook range |
| | |
| > | Cash provided by operating activities was $57 millionfor the second quarter of 2019, and we ended the second quarter with cash, cash equivalents and marketable securities of $458 million |
| | |
| > | Shares repurchased totaled approximately 8.8 millionin the second quarter at an aggregate cost of $295 million, helping to reduce our outstanding shares by 12% since the start of the year |
| | |
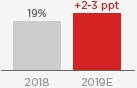
| > | We reiterate our Business Outlook for 2019. We continue to expect Net revenue growth of 8-10% for 2019 with Adjusted EBITDA margins increasing by 2-3 percentage points over 2018 levels |
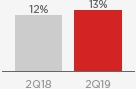
| Net revenue | | Earnings per diluted share | | Adjusted EBITDA1
and Adjusted EBITDA Margin |
 | |  | |  |
| | | | |
| App unique devices | | Paying advertising locations | | Cumulative reviews |
 | |  | |  |
Note: Reported figures are rounded; the year-over-year percentage changes are calculated based on reported financial statements and metrics
1 -Refer to the accompanying financial tables for further details and a reconciliation of the non-GAAP measures presented. | |
Dear fellow
shareholders,
As we celebrate Yelp’s 15th anniversary this summer, and as we anticipate exceeding the $1 billion revenue threshold this year,we are making substantial progress on the business transition we designed to propel Yelp far into the future.Building on Yelp’s established consumer brand, strong mobile growth, and proven local sales model, we are elevating our focus on advertisers and business owners, and closely integrating product and marketing into our go-to-market strategy. Yelp’s considerable assets and the successful execution of our strategic plan have the potential to deliver strong and sustainable long-term growth, increasing profitability, and significant returns for shareholders in the years ahead.
In addition to the financial highlights of the second quarter—which include growing earnings per diluted share by 30% year over year—we are highly encouraged by our team’s strong execution, which has set the stage for accelerating revenue growth in the second half of the year.Specifically:
| > | changes in our go-to-market strategy have begun to generate revenue growth without the expansion of our Local advertising sales force; |
| | |
| > | a shift in product development focus is delivering new offerings and greater value for business owners, which in turn are contributing to growth in customers and revenue; |
| | |
| > | product and customer success initiatives are reducing churn and improving revenue retention, even as more of our advertisers are on non-term contracts; |
| | |
| > | experiences like Yelp Reservations and Yelp Waitlist are drawing increasing mobile app usage and consumer engagement, allowing us to scale back on user acquisition spend; and |
| | |
| > | improvements in customer acquisition, revenue retention and expense management are contributing to margins and balance sheet strength, enabling us to return $295 million to shareholders through share repurchases in the second quarter, and reduce shares outstanding by 12% from the start of the year. |

As of the end of July, these gains have also driven a 10% year-over-year increase in the advertising budget dollars that clients have placed with us—historically a close proxy for future ad revenue—reinforcing our confidence in achieving year-over-year revenue growth of 8-10% and 2-3 percentage points of improvement in Adjusted EBITDA margins for this year.
The headway we have made in the first half of 2019 reflects our commitment to executing on the priorities outlined in our long-term plan. While it is still early in our transition, we are proud of our team’s progress. Thanks to their hard work and focus,we believe we are already tracking towards our long-term financial targets.We look forward to sharing more about the progress we are making on our transition in the months ahead.
Driving strong revenue growth
Driving more value to our business customers
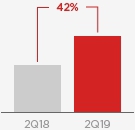
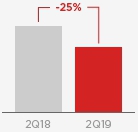
The transition to non-term advertising has increased the number of advertising campaign starts compared to prior years. To increase retention, we are improving ad performance.We increased lead volume, delivering 42% more paid clicks to advertisers in the second quarter of 2019 compared to a year earlier, which helped drive a 25% year-to-year reduction in average cost per click (“CPC”) across the platform. Advertisers also now have the ability to refine keywords and choose more campaign objectives. We believe these product improvements and the increased value we are delivering are contributing to the customer and revenue retention improvements we have seen this year.Advertiser budget retention has improved in each month of the first half, and we believe the gains we have achieved as of the second quarter, if sustained, will continue to deliver meaningful revenue and profitability benefits.
Volume of Ad Clicks
Average Cost Per Click
Expanding Yelp’s product offerings
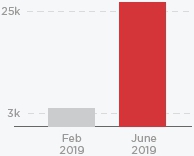
Introducing new business products and solutions is a key part of our strategy and an important contributor to future growth.Since the start of 2019, we launched Yelp Verified License and Business Highlights, which together attracted more than 25,000 active paying locations by the end of the second quarter.These introductory products are designed to help businesses communicate their unique stories and differentiate themselves, while delivering incremental revenue from both new and existing advertisers. In the second quarter, the majority of customers purchasing these new products also bought or had an existing CPC ad campaign.
Product expansion is driving momentum in our sales channels. Launching Verified License and Business Highlights has created new opportunities for our sales reps to initiate conversations with business owners, driving local sales force productivity.These offerings also drove an all-time record number of paying advertising starts in the Self Serve channel.In fact, more than half of the revenue generated by Verified License and Business Highlights in the second quarter came from advertisers who self-provisioned via the Self Serve channel. Over time, we believe that a growing array of always-on, entry-level products—delivered in part via an expanded Self Serve acquisition channel—will create meaningful opportunities for our Client Partner and marketing teams to increase the number of advertisers and grow revenue.
Verified License and Business Highlights are not only great for business owners, they also improve the value of Yelp for millions of consumers. These features are helping consumers discover businesses that are licensed, that guarantee their work, or that offer free estimates, thus increasing consumers’ confidence in transacting with these service professionals and merchants. We plan to deliver additional products that help business owners tell their stories, promote their offerings, and connect with consumers. For example,in June we introduced Yelp Portfolios, which enables service professionals to highlight projects they have completed with detailed photos, descriptions, and pricing.
Verified License &
Business Highlights
Active Locations
Launched Yelp
Portfolios in June


Capturing the multi-location opportunity
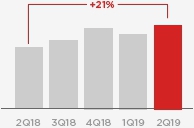
Revenue from multi-location advertisers increased 21% year over year in the second quarter, with growth across mid-market, franchise, and especially national advertisers.We continue to win new business from recognized national brands that are attracted by Yelp’s high-intent leads and compelling cost per store visit. Our momentum with these accounts has also been propelled by new ad units, enhanced lead attribution through third parties, and increased sales coverage.
Offer Ads are a good example of how we are innovating to meet enterprise advertisers’ unique needs.This summer, several of the largest restaurant businesses began using limited-time Offer Ads to reach Yelp’s audience of engaged consumers at their time of purchase to promote new or seasonal menu items. Early results from those campaigns have been strong, delivering meaningful incremental store visits at very attractive acquisition costs.
In the first half of this year, we won mandates from several of the National Retail Federation’s Top 100 restaurants and retailers, and the growth of our multi-location sales force will allow us to extend our coverage of large advertisers into additional categories, such as local services. Our strength among multi-location advertisers has not only been driven by onboarding new clients, it has also been driven by high-teens percentage growth in spending from existing advertisers in the second quarter of 2019 compared to the prior year period. As a result,annual revenue retention in our multi-location business exceeded 100% this quarter.
Multi-location
revenue composition
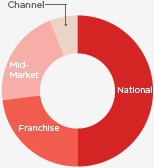
Multi-location revenue
grew 21% y-y in 2Q19
Winning in our key categories
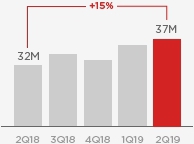
We continued to drive traffic across categories by delighting consumers with compelling experiences in the Restaurants category, which helped us sustain mid-teens year-over-year growth in App Unique Devicesin the second quarter. Attracting users with these proprietary offerings has allowed us to spend less on consumer marketing, which we reduced by more than half in the second quarter of 2019 versus the second quarter of 2018.The average number of diners seated via Yelp per month more than doubled to 2.4 million in the second quartercompared to the same period in the prior year, as Yelp Reservations and Yelp Waitlist delivered more diners for the restaurants offering these experiences, and we continued to significantly increase the supply of restaurant locations over the same period.
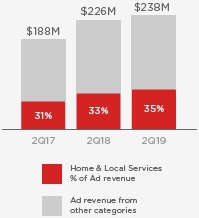
In our largest revenue category, Home & Local Services, our focus on delivering more value to advertisers helped grow revenue several times faster than all other categories combined.We increased all types of paid leads in the category by more than 75% from June 2018 to June 2019, and reduced the average price paid for clicks by one third from the start of 2019. We are now beginning to see the retention benefits of these initiatives. Additionally, as we moved into the category’s strongest season, projects submitted via Request A Quote accelerated, up nearly 40% year over year in the second quarter.
Delivering improved long-term profitability
Our successful efforts to drive revenue retention and advertiser conversion, our growing product portfolio, and the strength of our multi-location business, all helped improve daily revenue generated per sales rep in the second quarter. Combined with tight management of expenses, these advances in our business model drove a two-percentage point year-over-year increase in Adjusted EBITDA margin to 22% in the second quarter, asmore than 60% of the incremental revenue dollars we generated from the prior year translated into Adjusted EBITDA.
Monthly Average App
Unique Devices +15% y-y
Home & Local Services
grew faster than all other
categories combined
We are particularly encouraged to achieve these results without growing overall sales headcount. We drove more growth through the Self Serve channel with marketing and new products, and as previously discussed, we have begun to shift the mix of our sales force toward multi-location clients, revenue retention, and beyond our San Francisco headquarters.
Returning capital to our shareholders
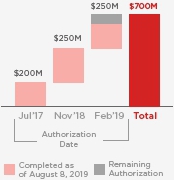
We continued to make good on our commitment to return capital to our shareholders in the second quarter by repurchasing 8.8 million shares for a total of $295 million at an average price of just under $34 per share. From the start of the year to the end of the second quarter,we returned $398 million to shareholders through share repurchases, exceeding our $250 million buyback target for the first half, and reducing our outstanding shares by 12%. Since initiating our repurchase program in August 2017, we have now returned more than $600 million to shareholders as part of a purposeful program to reduce dilution and manage capital effectively, and we currently expect to continue buying back stock in the second half of 2019.
CFO Transition
Today, we also announced that Lanny will be stepping down as CFO, effective September 2, 2019, to accept an executive role at another company. Over the last three years, he has put in place a strong financial discipline that has allowed us to grow to nearly $1 billion in annual revenue, while significantly increasing profit, and returning more than $600 million to shareholders. His numerous contributions have helped lay the foundation for accelerating revenue growth and continued margin expansion in the years to come. Finance VP James Miln will become interim CFO upon Lanny’s departure. James contributed to the development and execution of Yelp’s long-term strategic plan and financial model, and he brings to the role more than a decade of leadership experience in financial planning, business analysis, and investor relations. The Board and management team have also initiated a search for a new CFO with support from Russell Reynolds Associates. We wish Lanny well in his next endeavor.
Returned >$600M to
shareholders via buybacks
In summary,
We have made tangible progress on the business transition that began last year. The results so far give us confidence that the work we are doing today will drive stronger growth, profitability, and shareholder value.
Signed,
 |  |
| Jeremy Stoppelman | Lanny Baker |
Financial Review
& Business Outlook
Our 2019 financial results reflect our adoption of ASC 842, which we adopted on a modified retrospective basis on January 1, 2019.
Second Quarter Results
Net revenue grew to $247 million in the second quarter of 2019, an increase of 5% over the second quarter of 2018, in the middle of our second quarter business outlook range of 4-6%.
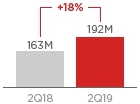
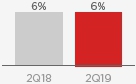
Advertising revenue was $238 millionin the second quarter of 2019, a 5% increase over the second quarter of 2018, driven by year-over-year growth in the number of Paying advertising locations and improved productivity from our advertising sales force.The number of Paying advertising locations in the second quarter grew 6% year-over-year to 549,000and reflects a sequential increase of 20,000 locations from the first quarter of 2019. Paying advertising accounts were 197,000 for the second quarter of 2019, a sequential increase of 5,000 accounts from the first quarter of 2019.
Transactions revenue was $3 millionin the second quarter of 2019 compared to $4 million in the second quarter of 2018. The prior year included approximately $1 million related to transition services rendered in conjunction with the transition of Eat24 to Grubhub.
Other services revenue was $6 millionfor the second quarter of 2019, up 15% from $5 million in the second quarter of 2018. The growth was primarily due to an increase in the number of restaurant customers using our Yelp Reservations and Yelp Waitlist products.
| | Three Months Ended June 30, |
| | 2019 | | 2018 |
| Net revenue by product | | | | | | |
| Advertising | | $ | 237,842 | | $ | 226,168 |
| Transactions | | | 3,147 | | | 3,520 |
| Other services | | | 5,966 | | | 5,175 |
| Total net revenue | | $ | 246,955 | | $ | 234,863 |
Net Revenue
Operating expenses & Adjusted EBITDA
Cost of revenue was $15 millionin the second quarter of 2019, up $0.3 million, or 2%, compared to the second quarter of 2018, owing primarily to an increase in website infrastructure expense. Gross profit was $232 million, up 5% from the second quarter of 2018, while Gross margin of 94% remained consistent with the first quarter of 2019 and second quarter of 2018.
Sales and marketing expenses totaled $122 millionin the second quarter of 2019, up 1% from the second quarter of 2018, primarily resulting from higher commissions. The average number of advertising sales employees during the second quarter of 2019 declined by 1% compared to the second quarter of 2018, driven by a mid-single digit year-over-year decrease in our local advertising sales team. An increase in overall employee costs was partially offset by lower marketing expenses in the second quarter of 2019, primarily due to continued efforts to optimize our marketing spend.
We expect overall sales headcount to decline modestly by the end of 2019, as our decreasing reliance on growing Local sales headcount to drive revenue growth more than offsets the growth of our multi-location sales teams.
Product development expenses were $55 millionin the second quarter, up 3% compared to the second quarter of 2018, as a result of employee costs associated with increased headcount. We continue to expand our product and engineering teams to support our increased focus on business-owner products and marketplace transaction features, as well as to continue enhancing the Yelp consumer experience.
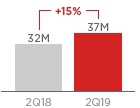
General and administrative expenses were $31 millionin the second quarter, up 8% compared to the second quarter of 2018, due to increases in employee, consulting, facilities, and other overhead costs required to support the growth of the business.
COR % of Revenue
S&M % of Revenue

PD % of Revenue

G&A % of Revenue
Total costs and expenses were $235 millionin the second quarter, up from $227 million in the second quarter of 2018.
Net income was $12 millionin the second quarter of 2019 compared to a net income of $11 million in the second quarter of 2018.
Diluted earnings per share was $0.16in the second quarter of 2019, a 30% year over year increase, driven by a 15% increase in Net income, as well as an 11% reduction in weighted average diluted shares outstanding resulting from our share repurchases.
Adjusted EBITDA was $55 millionin the second quarter of 2019, which exceeded our second quarter outlook range and represented a 17% increase from $47 million in the second quarter of 2018. Adjusted EBITDA margin improved to 22% in the second quarter of 2019 compared with 20% in the year-ago quarter, driven by controlled growth in operating expenses. Stock-based compensation expense was $30 million in the second quarter of 2019, 6% higher than in the same quarter of 2018.
Net Income
Adjusted EBITDA

Balance sheet and cash flow
At the end of June 2019,Yelp held $458 million in cash, cash equivalents and marketable securities on its consolidated balance sheet, with no debt.In the second quarter, we spent $295 million to repurchase 8.8 million shares under our $500 million share repurchase authorization. During the quarter, we also used $10 million in cash to cover employee tax liabilities associated with the vesting of restricted stock units that were settled through net share withholding. Reflecting these activities,outstanding shares were reduced by 12% from the beginning of the year.
Second Quarter and Full Year 2019 Business Outlook
Based on the underlying trends across the business, including the 10% year-over-year increase in the client advertising budgets that we have in hand today, we are reaffirming our Business Outlook for 2019.We continue to expect full-year 2019 Net revenue to grow by 8% to 10% compared with 2018, and we expect Adjusted EBITDA margins to expand by 2 to 3 percentage points compared to 2018.
For the third quarter of 2019, we also expect Net revenue to grow by 8% to 10% compared with the third quarter of 2018, and we expect Adjusted EBITDA margins to expand by 1 to 2 percentage points compared to the third quarter of 2018.
| | Third Quarter 2019 | | Full Year 2019 |
| Net revenue growth (y-y) | | 8% to 10% | | 8% to 10% |
Increase in Adjusted EBITDA*
as a % of Net revenue | | 1ppt to 2ppt | | 2ppt to 3ppt |
Stock-based compensation expense as a % of
Net revenue | | ~12% | | 11% to 12% |
Depreciation and amortization
as a % of Net revenue | | ~5% | | 4% to 5% |
| * | Yelp has not reconciled its Adjusted EBITDA outlook to GAAP Net income (loss) because it does not provide an outlook for GAAP Net income (loss) due to the uncertainty and potential variability of Other income, net and Provision for (benefit from) income taxes, which are reconciling items between Adjusted EBITDA and GAAP Net income (loss). Because Yelp cannot reasonably predict such items, a reconciliation of the non-GAAP financial measure outlook to the corresponding GAAP measure is not available without unreasonable effort. We caution, however, that such items could have a significant impact on the calculation of GAAP Net income (loss). For more information regarding the non-GAAP financial measures discussed in this release, please see “Non-GAAP Financial Measures” and “Reconciliation of GAAP to Non-GAAP Financial Measures” below. |
Net Revenue Outlook
Adjusted EBITDA Outlook
Quarterly Earnings Webcast
Yelp will host a live webcast today at 2:00 p.m. PDT to discuss the second quarter 2019 financial results and our Business Outlook for the year.The webcast can be accessed on the Yelp Investor Relations website at yelp-ir.com. A replay of the webcast will be available at the same website.
About Yelp
Yelp Inc. (www.yelp.com) connects people with great local businesses. With unmatched local business information, photos and review content, Yelp provides a one-stop local platform for consumers to discover, connect, and transact with local businesses of all sizes by making it easy to request a quote, join a waitlist, and make a reservation, appointment, or purchase. Yelp was founded in San Francisco in July 2004.
Condensed Consolidated
Balance Sheets(In thousands, except share data; unaudited)
| | June 30, 2019 | | December 31, 2018 |
| Assets | | | | | | |
| Current assets: | | | | | | |
| Cash and cash equivalents | | $ | 139,464 | | $ | 332,764 |
| Short-term marketable securities | | | 272,754 | | | 423,096 |
| Accounts receivable, net | | | 95,732 | | | 87,305 |
| Prepaid expenses and other current assets | | | 23,338 | | | 17,104 |
| Total current assets | | | 531,288 | | | 860,269 |
| Long-term marketable securities | | | 45,379 | | | - |
| Property, equipment and software, net | | | 114,105 | | | 114,800 |
| Operating lease right-of-use assets | | | 217,798 | | | - |
| Goodwill | | | 105,313 | | | 105,620 |
| Intangibles, net | | | 11,588 | | | 13,359 |
| Restricted cash | | | 22,082 | | | 22,071 |
| Other non-current assets | | | 35,880 | | | 59,444 |
| Total assets | | $ | 1,083,433 | | $ | 1,175,563 |
| Liabilities and Stockholders’ Equity | | | | | | |
| Current liabilities: | | | | | | |
| Accounts payable | | $ | 2,882 | | $ | 6,540 |
| Accrued liabilities | | | 71,708 | | | 54,522 |
| Operating lease liabilities - current | | | 56,500 | | | - |
| Deferred revenue | | | 4,617 | | | 3,843 |
| Total current liabilities | | | 135,707 | | | 64,905 |
| Operating lease liabilities - long-term | | | 197,272 | | | - |
| Other long-term liabilities | | | 3,999 | | | 35,140 |
| Total liabilities | | | 336,978 | | | 100,045 |
| Stockholders' equity | | | | | | |
| Common stock | | | - | | | - |
| Additional paid-in capital | | | 1,194,486 | | | 1,139,462 |
| Treasury stock | | | (5,952) | | | - |
| Accumulated other comprehensive loss | | | (11,163) | | | (11,021) |
| Accumulated deficit | | | (430,916) | | | (52,923) |
| Total stockholders' equity | | | 746,455 | | | 1,075,518 |
| Total liabilities and stockholders' equity | | $ | 1,083,433 | | $ | 1,175,563 |
| The condensed consolidated balance sheet as of June 30, 2019 reflects the adoption of the new accounting standard ASC 842, Leases, which we adopted on a modified retrospective basis on January 1, 2019. | | |
Condensed Consolidated Statements
of Operations(In thousands, except per share data; unaudited)
| | Three Months Ended June 30, | | Six Months Ended June 30, |
| | 2019 | | 2018 | | 2019 | | 2018 |
| Net revenue | | $ | 246,955 | | $ | 234,863 | | $ | 482,897 | | $ | 457,937 |
| Costs and expenses: | | | | | | | | | | | | |
| Cost of revenue (1) | | | 14,975 | | | 14,708 | | | 29,240 | | | 29,440 |
| Sales and marketing (1) | | | 122,045 | | | 120,653 | | | 246,361 | | | 240,294 |
| Product development (1) | | | 54,566 | | | 52,789 | | | 112,641 | | | 104,282 |
| General and administrative (1) | | | 30,932 | | | 28,583 | | | 62,224 | | | 60,590 |
| Depreciation and amortization | | | 12,240 | | | 10,509 | | | 24,116 | | | 20,537 |
| Total costs and expenses | | | 234,758 | | | 227,242 | | | 474,582 | | | 455,143 |
| Income from operations | | | 12,197 | | | 7,621 | | | 8,315 | | | 2,794 |
| Other income, net | | | 3,891 | | | 3,424 | | | 8,582 | | | 6,028 |
| Income before income taxes | | | 16,088 | | | 11,045 | | | 16,897 | | | 8,822 |
| Provision for income taxes | | | (3,785) | | | (341) | | | (3,229) | | | (404) |
| Net income attributable to common stockholders | | $ | 12,303 | | $ | 10,704 | | $ | 13,668 | | $ | 8,418 |
Net income per share attributable to common stockholders |
| Basic | | $ | 0.16 | | $ | 0.13 | | $ | 0.17 | | $ | 0.10 |
| Diluted | | $ | 0.16 | | $ | 0.12 | | $ | 0.17 | | $ | 0.09 |
Weighted-average shares used to compute net income per share attributable to common stockholders |
| Basic | | | 75,601 | | | 83,769 | | | 78,620 | | | 83,792 |
| Diluted | | | 78,530 | | | 88,651 | | | 81,742 | | | 89,088 |
| | | | | | | |
(1) Includes stock-based compensation expense as follows: |
| | Three Months Ended June 30, | | Six Months Ended June 30, |
| | 2019 | | 2018 | | 2019 | | 2018 |
| Cost of revenue | | $ | 1,118 | | $ | 1,153 | | $ | 2,361 | | $ | 2,184 |
| Sales and marketing | | | 7,774 | | | 8,055 | | | 15,461 | | | 15,573 |
| Product development | | | 15,247 | | | 13,907 | | | 31,322 | | | 27,342 |
| General and administrative | | | 6,313 | | | 5,690 | | | 12,626 | | | 11,440 |
| Total stock-based compensation | | $ | 30,452 | | $ | 28,805 | | $ | 61,770 | | $ | 56,539 |
Condensed Consolidated Statements
of Cash Flows(In thousands; unaudited)
| | Six Months Ended June 30, |
| | 2019 | | 2018 |
| Operating activities | | | | | | |
| Net income attributable to common stockholders | | $ | 13,668 | | $ | 8,418 |
| Adjustments to reconcile net income to net cash provided by operating activities: | | | | | | |
| Depreciation and amortization | | | 24,116 | | | 20,537 |
| Provision for doubtful accounts | | | 8,716 | | | 12,918 |
| Stock-based compensation | | | 61,770 | | | 56,539 |
| Noncash lease cost | | | 21,433 | | | - |
| Deferred income taxes | | | (1,912) | | | - |
| Other adjustments | | | (1,632) | | | (221) |
| Changes in operating assets and liabilities: | | | | | | |
| Accounts receivable | | | (17,143) | | | (15,208) |
| Prepaid expenses and other assets | | | (5,335) | | | (6,924) |
| Operating lease liabilities | | | (20,299) | | | - |
| Accounts payable, accrued liabilities and other liabilities | | | 14,464 | | | (15,122) |
| Net cash provided by operating activities | | | 97,846 | | | 60,937 |
| Investing activities | | | | | | |
| Purchases of marketable securities | | | (289,100) | | | (403,324) |
| Maturities of marketable securities | | | 397,197 | | | 290,000 |
| Release of escrow deposit | | | 28,750 | | | - |
| Purchases of property, equipment and software | | | (19,214) | | | (25,157) |
| Other investing activities | | | 276 | | | 34 |
| Net cash provided by (used in) investing activities | | | 117,909 | | | (138,447) |
| Financing activities | | | | | | |
| Proceeds from issuance of common stock for employee stock-based plans | | | 11,198 | | | 16,221 |
| Repurchases of common stock | | | (397,613) | | | (65,789) |
| Taxes paid related to net share settlement of equity awards | | | (22,605) | | | (27,953) |
| Net cash used in financing activities | | | (409,020) | | | (77,521) |
| Effect of exchange rate changes on cash, cash equivalents and restricted cash | | | (24) | | | 209 |
| Change in cash, cash equivalents, and restricted cash | | | (193,289) | | | (154,822) |
| Cash, cash equivalents, and restricted cash - Beginning of period | | | 354,835 | | | 566,404 |
| Cash, cash equivalents, and restricted cash - End of period | | $ | 161,546 | | $ | 411,582 |
Reconciliation of GAAP to Non-GAAP
Financial Measures(In thousands; unaudited)
| | Three Months Ended June 30, | | Six Months Ended June 30, |
| | 2019 | | 2018 | | 2019 | | 2018 |
| Reconciliation of GAAP net income to EBITDA and adjusted EBITDA |
| GAAP net income | | $ | 12,303 | | $ | 10,704 | | $ | 13,668 | | $ | 8,418 |
| Provision for income taxes | | | 3,785 | | | 341 | | | 3,229 | | | 404 |
| Other income, net | | | (3,891) | | | (3,424) | | | (8,582) | | | (6,028) |
| Depreciation and amortization | | | 12,240 | | | 10,509 | | | 24,116 | | | 20,537 |
| EBITDA | | | 24,437 | | | 18,130 | | | 32,431 | | | 23,331 |
| | | | | | | | | | | | | |
| Stock-based compensation | | | 30,452 | | | 28,805 | | | 61,770 | | | 56,539 |
| Adjusted EBITDA | | $ | 54,889 | | $ | 46,935 | | $ | 94,201 | | $ | 79,870 |
| | | | | | | | | | | | | |
| Net revenue | | $ | 246,955 | | $ | 234,863 | | $ | 482,897 | | $ | 457,937 |
| Adjusted EBITDA margin | | | 22% | | | 20% | | | 20% | | | 17% |
Non-Financial Metrics
| | | | | | | | | | | | | | | | | | | |
| | 2Q17 | | 3Q17 | | 4Q17 | | 1Q18 | | 2Q18 | | 3Q18 | | 4Q18 | | 1Q19 | | 2Q19 |
| Key operational metrics (thousands) | | | | | | | | | | | | | | | | | | |
| App Unique Devices1 | | 27,987 | | 30,162 | | 28,845 | | 30,115 | | 32,062 | | 34,025 | | 32,891 | | 35,001 | | 36,737 |
| Paying Advertising Locations2 | | 448 | | 463 | | 478 | | 508 | | 517 | | 524 | | 541 | | 529 | | 549 |
| Paying Advertising Accounts3 | | 148 | | 155 | | 163 | | 177 | | 194 | | 194 | | 191 | | 192 | | 197 |
| Sales Headcount | | 2,750 | | 3,050 | | 3,300 | | 3,300 | | 3,350 | | 3,700 | | 3,850 | | 3,450 | | 3,300 |
| Active Claimed Local Business Locations4 | | 3,357 | | 3,538 | | 3,682 | | 3,877 | | 4,053 | | 4,203 | | 4,342 | | 4,491 | | 4,628 |
| Other non-financial metrics (thousands) | | | | | | | | | | | | | | | | | | |
| Cumulative Reviews | | 134,591 | | 142,036 | | 148,328 | | 155,328 | | 162,969 | | 170,865 | | 177,385 | | 184,386 | | 191,735 |
| Desktop Unique Visitors1 | | 82,998 | | 83,592 | | 76,748 | | 73,668 | | 73,939 | | 68,807 | | 62,140 | | 62,779 | | 61,797 |
| Mobile Web Unique Visitors1 | | 74,101 | | 73,508 | | 64,221 | | 69,901 | | 72,328 | | 74,789 | | 69,148 | | 68,891 | | 76,650 |
| Total Headcount | | 4,600 | | 5,050 | | 5,200 | | 5,250 | | 5,300 | | 5,700 | | 6,000 | | 5,550 | | 5,400 |
| Repeat Rate5 | | 76% | | 78% | | 77% | | 71% | | 69% | | 72% | | 74% | | 71% | | 71% |
| Percentage of advertising revenue by category | | | | | | | | | | | | | | | | | |
| Home & Local Services | | 31% | | 31% | | 31% | | 32% | | 33% | | 34% | | 33% | | 33% | | 35% |
| Restaurants | | 14% | | 15% | | 14% | | 14% | | 14% | | 14% | | 14% | | 14% | | 13% |
| Beauty & Fitness | | 13% | | 12% | | 12% | | 12% | | 12% | | 12% | | 12% | | 12% | | 12% |
| Health | | 11% | | 11% | | 11% | | 11% | | 10% | | 10% | | 10% | | 10% | | 10% |
| Shopping | | 9% | | 9% | | 9% | | 8% | | 8% | | 8% | | 9% | | 8% | | 8% |
| Other | | 22% | | 22% | | 22% | | 23% | | 22% | | 21% | | 22% | | 23% | | 21% |
Note: Desktop unique visitors and mobile website unique visitors are calculated using Google Analytics, while we calculate App Unique Devices internally. For further discussion of the differences in how these metrics are calculated and their limitations, please review the “Key Metrics—Traffic” section of our most recent Quarterly Report on Form 10-Q
| 1 | On a monthly average basis |
| | |
| 2 | All business locations associated with a business account from which we recognize revenue in a given month, averaged for the quarter |
| | |
| 3 | Paying advertising accounts comprise all business accounts from which we recognize advertising revenue in a given three-month period |
| | |
| 4 | Represents the number of claimed local business locations that are both (a) active on Yelp and (b) associated with an active business account as of a given date. We consider a claimed local business to be active if it has not closed, been removed from our platform, or merged with another claimed local business location. |
| | |
| 5 | Repeat rate as defined as the percentage of existing Paying advertising accounts from which we recognized advertising revenue at some point in the immediately preceding 12-month period |
For more information about the Company, including the factors that could affect the Company’s operating results, is included under the captions “Risk Factors” and “Management’s Discussion and Analysis of Financial Condition and Results of Operations” in the Company’s most recent Quarterly or Annual Report filed with the SEC, available at www.yelp-ir.com or the SEC’s website at www.sec.gov

Non-GAAP Financial Measures
This letter and statements made during the above referenced webcast may include information relating to EBITDA, Adjusted EBITDA and Adjusted EBITDA margin, each of which the Securities and Exchange Commission has defined as a “non-GAAP financial measure.”
We define EBITDA as net income (loss), adjusted to exclude: provision for (benefit from) income taxes; other income, net; and depreciation and amortization.
We define Adjusted EBITDA as net income (loss), adjusted to exclude: provision for (benefit from) income taxes; other income, net; depreciation and amortization; stock-based compensation expense; any gain (loss) on the disposal of a business unit; and restructuring and integration costs. We define Adjusted EBITDA margin as Adjusted EBITDA divided by net revenue.
EBITDA, Adjusted EBITDA and Adjusted EBITDA margin are key measures used by Yelp management and the board of directors to understand and evaluate core operating performance and trends, to prepare and approve Yelp’s annual budget and to develop short- and long-term operational plans. The presentation of this financial information, which is not prepared under any comprehensive set of accounting rules or principles, is not intended to be considered in isolation or as a substitute for the financial information prepared and presented in accordance with generally accepted accounting principles in the United States (“GAAP”).
EBITDA and Adjusted EBITDA have limitations as analytical tools, and you should not consider them in isolation or as substitutes for analysis of Yelp’s financial results as reported under GAAP. Some of these limitations are:
>although depreciation and amortization are non-cash charges, the assets being depreciated and amortized may have to be replaced in the future, and EBITDA and Adjusted EBITDA do not reflect cash capital expenditure requirements for such replacements or for new capital expenditure requirements;
>EBITDA and Adjusted EBITDA do not reflect changes in, or cash requirements for, Yelp’s working capital needs;
>Adjusted EBITDA does not consider the potentially dilutive impact of equity-based compensation;
>EBITDA and Adjusted EBITDA do not reflect tax payments that may represent a eduction in cash available to Yelp;
>Adjusted EBITDA does not take into account any restructuring and integration costs; and
>other companies, including those in Yelp’s industry, may calculate EBITDA and Adjusted EBITDA differently, which reduces their usefulness as comparative measures.
Because of these limitations, you should consider EBITDA, Adjusted EBITDA and Adjusted EBITDA margin alongside other financial performance measures, including various cash flow metrics, Net income (loss) and Yelp’s other GAAP results.
Forward-Looking Statements
This letter contains, and statements made during the above-referenced webcast will contain, forward-looking statements relating to, among other things, the future performance of Yelp and its consolidated subsidiaries that are based on Yelp’s current expectations, forecasts and assumptions and involve risks and uncertainties. These statements include, but are not limited to, statements regarding:
>Yelp’s expected financial results for the third quarter and full year 2019, including the potential for accelerating revenue growth in the second half of 2019, as well as its revenue growth and Adjusted EBITDA margin targets for the 2019 to 2023 period;
>Yelp’s large market opportunity and ability to deliver and sustain long-term growth, increasing profitability, and significant returns for shareholders;
>Yelp’s investment and other priorities for 2019 and beyond, including its hiring plans and product, marketing and go-to-market initiatives, as well as its ability to execute against those priorities and the resulting impact on its operating results;
>Yelp’s ability to sustain recent growth of advertising spend and continue to deliver meaningful revenue and profitability benefits;
>Yelp’s ability to transition the business and execute on the priorities out lined in Yelp’s long-term plan;
>Yelp’s ability to deliver additional products that help business owners tell their stories, promote their offerings, and connect with consumers;
>Yelp’s shift in the mix of its sales force toward multi-location clients, revenue retention, and beyond its San Francisco headquarters, and the resulting boost to sales force productivity and overall profitability that it expects to benefit its margins for years to come;
>market trends and Yelp’s ability to respond to and capitalize on such trends;
>Yelp’s plans and ability to create shareholder value and return capital to shareholders, including through its share repurchase program and plans to continue to buy back shares in the second half of 2019.
Yelp’s actual results could differ materially from those predicted or implied by such forward-looking statements and reported results should not be considered as an indication of future performance. Factors that could cause or contribute to such differences include, but are not limited to:
>Yelp’s limited operating history in an evolving industry;
>Yelp’s ability to generate sufficient revenue to maintain profitability, particularly in light of its significant ongoing sales and marketing expenses, its ongoing investments in Yelp Reservations, Yelp Waitlist and Yelp WiFi Marketing, and the sale of Eat24;
>Yelp’s ability to successfully manage the acquisition and integration of new businesses, solutions or technologies, as well as to monetize the acquired products, solutions or technologies;
>Yelp’s reliance on traffic to its website from search engines like Google and Bing and the quality and reliability of such traffic;
>Yelp’s ability to generate and maintain sufficient high quality content from its users;
>maintaining a strong brand and managing negative publicity that may arise;
>maintaining and expanding Yelp’s base of advertisers, particularly as an increasing portion of advertisers have the ability to cancel their ad campaigns at any time;
>Yelp’s ability to timely upgrade and develop its systems, infrastructure and customer service capabilities; and
>Yelp’s ability to purchase shares under the stock repurchase purchase program, or the modification, suspension or termination of that program.
Factors that could cause or contribute to such differences also include, but are not limited to, those factors that could affect Yelp’s business, operating results and stock price included under the captions “Risk Factors” and “Management’s Discussion and Analysis of Financial Condition and Results of Operations” in Yelp’s most recent Annual Report on Form 10-K or Quarterly Report on Form 10-Q at http://www.yelp-ir.com or the SEC’s website at www.sec.gov.
Undue reliance should not be placed on the forward-looking statements in this letter or the above-referenced webcast, which are based on information available to Yelp on the date hereof. Such forward-looking that may be announced and/or completed after the date hereof. Yelp assumes no obligation to update such statements.