
EXHIBIT 99.2 Q3 2019 Letter to Shareholders Nov 07, 2019 | yelp-ir.com
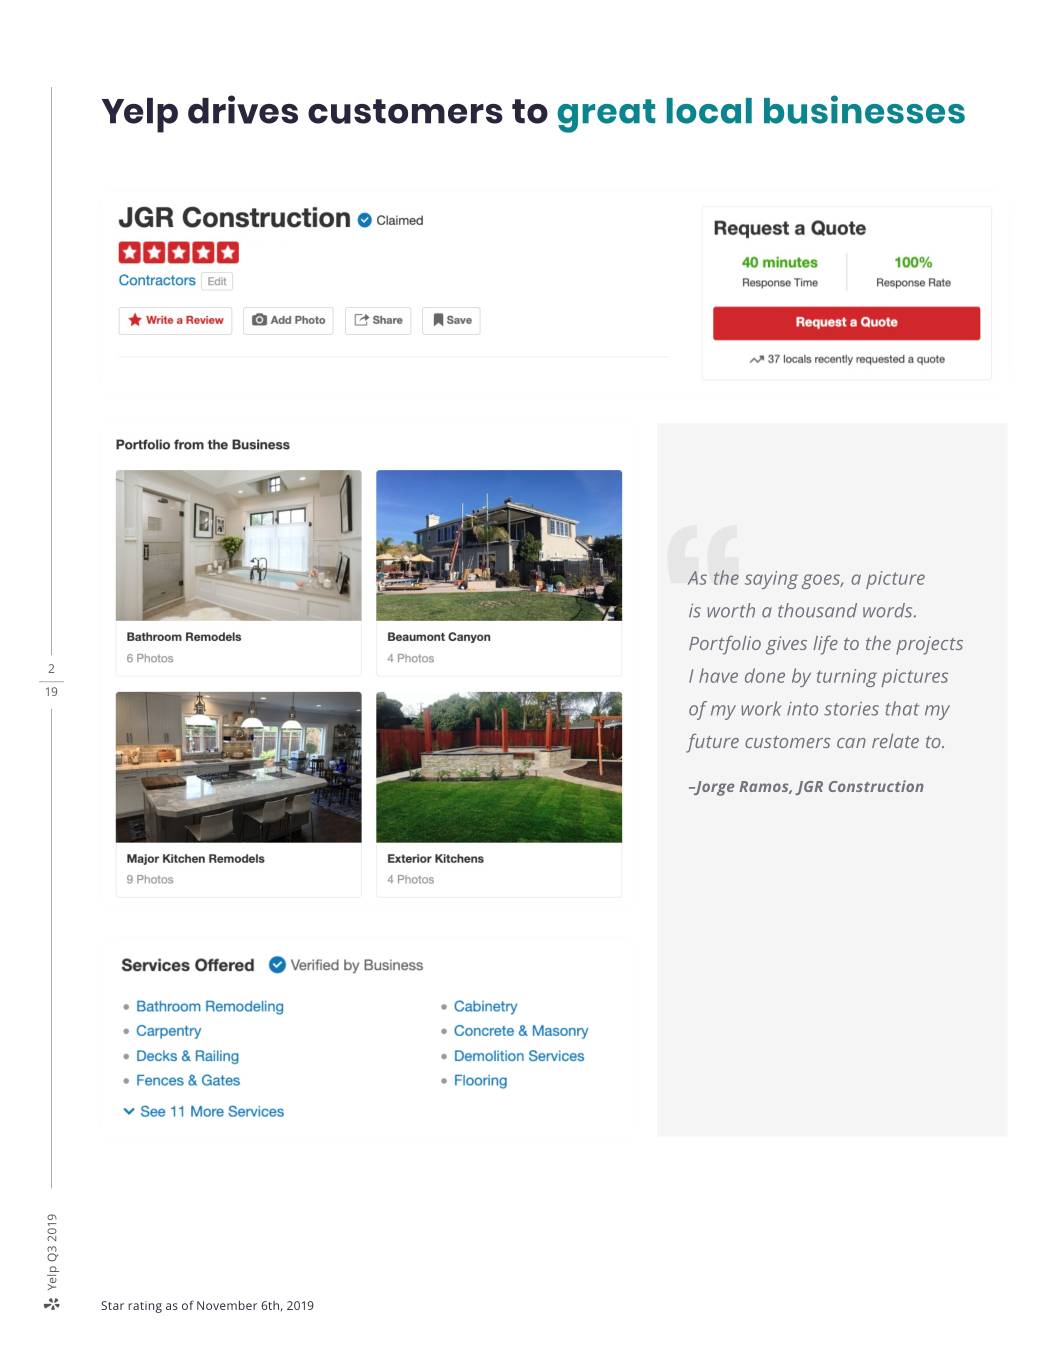
Yelp drives customers to great local businesses As the saying goes, a picture is worth a thousand words. Portfolio gives life to the projects 2 I have done by turning pictures 19 of my work into stories that my future customers can relate to. “–Jorge Ramos, JGR Construction Yelp Q3 2019 Star rating as of November 6th, 2019
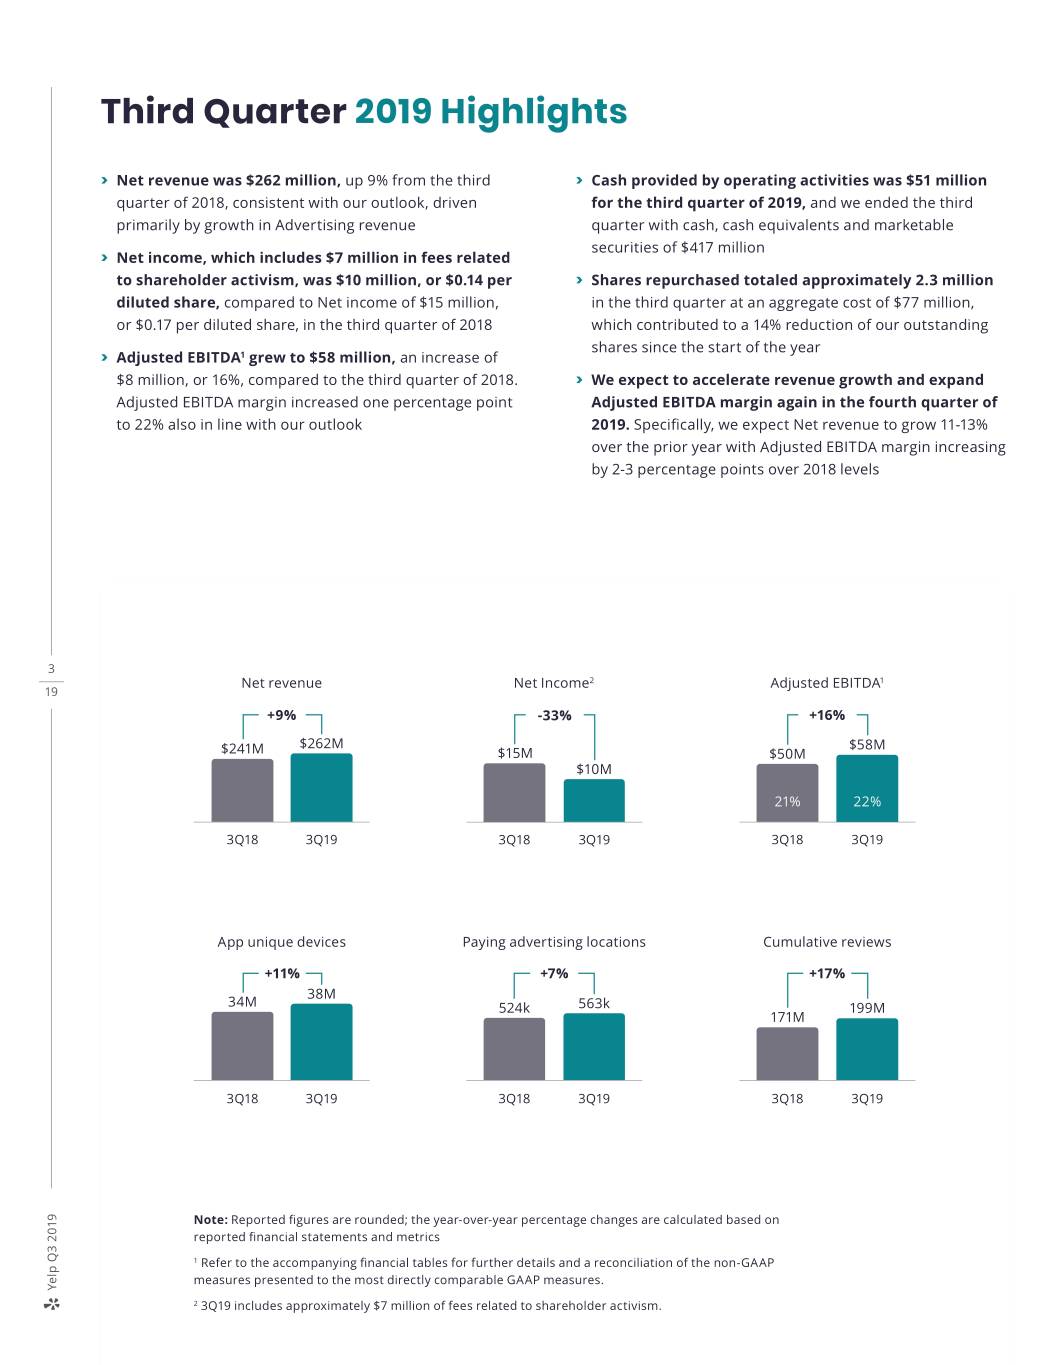
Third Quarter 2019 Highlights > Net revenue was $262 million, up 9% from the third > Cash provided by operating activities was $51 million quarter of 2018, consistent with our outlook, driven for the third quarter of 2019, and we ended the third primarily by growth in Advertising revenue quarter with cash, cash equivalents and marketable securities of $417 million > Net income, which includes $7 million in fees related to shareholder activism, was $10 million, or $0.14 per > Shares repurchased totaled approximately 2.3 million diluted share, compared to Net income of $15 million, in the third quarter at an aggregate cost of $77 million, or $0.17 per diluted share, in the third quarter of 2018 which contributed to a 14% reduction of our outstanding 1 shares since the start of the year > Adjusted EBITDA grew to $58 million, an increase of $8 million, or 16%, compared to the third quarter of 2018. > We expect to accelerate revenue growth and expand Adjusted EBITDA margin increased one percentage point Adjusted EBITDA margin again in the fourth quarter of to 22% also in line with our outlook 2019. Specifically, we expect Net revenue to grow 11-13% over the prior year with Adjusted EBITDA margin increasing by 2-3 percentage points over 2018 levels 3 Net revenue Net Income2 Adjusted EBITDA1 19 +9% -33% +16% $262M $58M $241M $15M $50M $10M 21% 22% 3Q18 3Q19 3Q18 3Q19 3Q18 3Q19 App unique devices Paying advertising locations Cumulative reviews +11% +7% +17% 38M 34M 524k 563k 199M 171M 3Q18 3Q19 3Q18 3Q19 3Q18 3Q19 Note: Reported figures are rounded; the year-over-year percentage changes are calculated based on reported financial statements and metrics 1 Refer to the accompanying financial tables for further details and a reconciliation of the non-GAAP measures presented to the most directly comparable GAAP measures. Yelp Q3 2019 2 3Q19 includes approximately $7 million of fees related to shareholder activism.
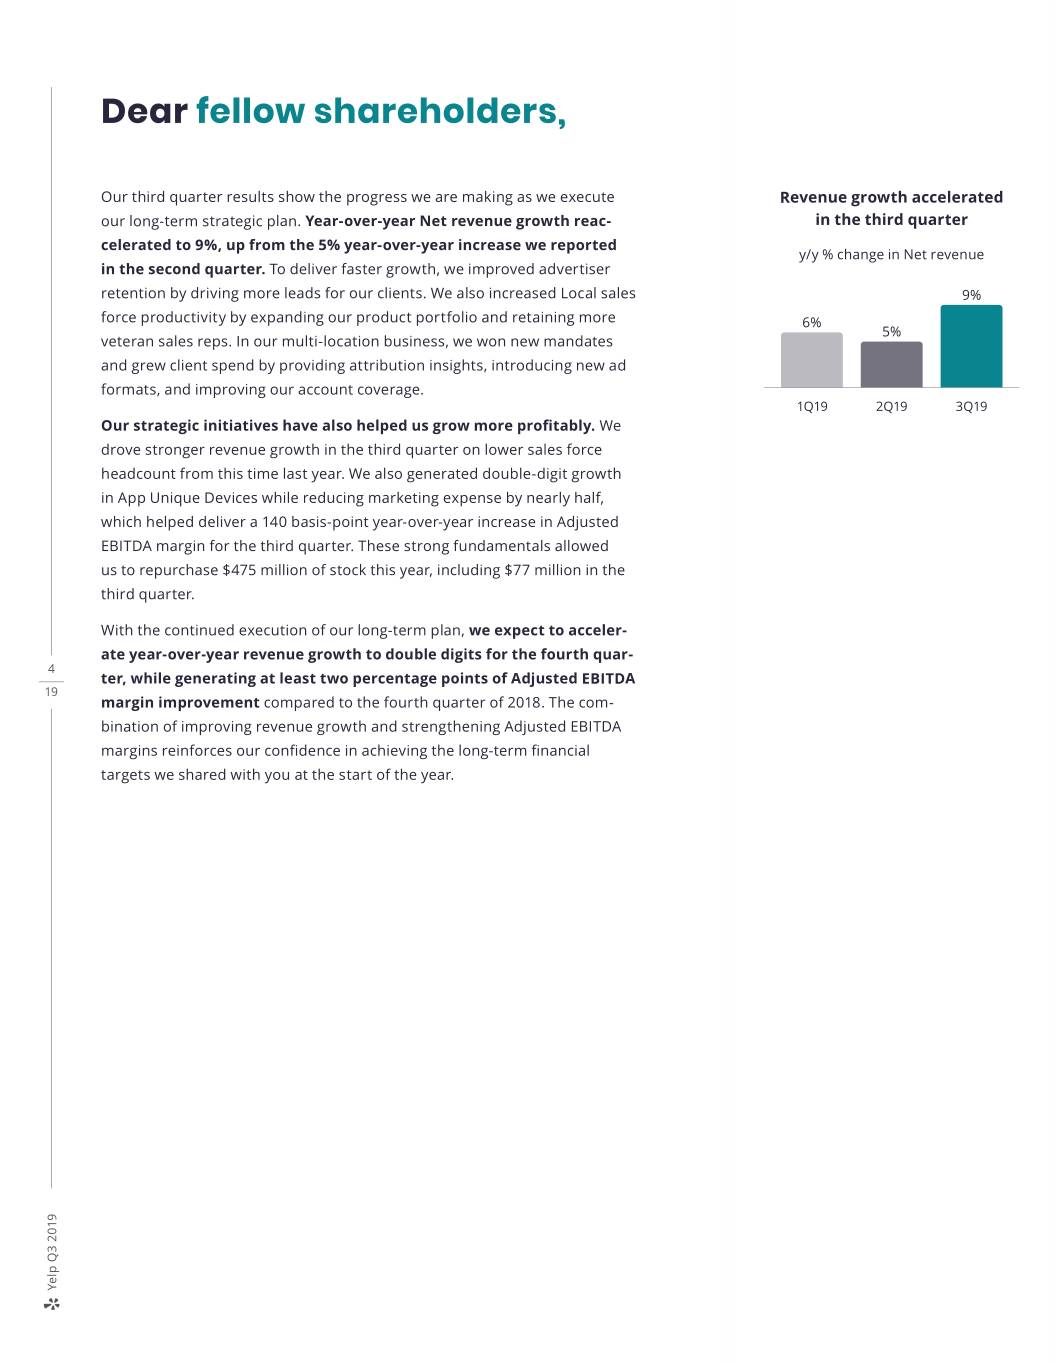
Dear fellow shareholders, Our third quarter results show the progress we are making as we execute Revenue growth accelerated our long-term strategic plan. Year-over-year Net revenue growth reac- in the third quarter celerated to 9%, up from the 5% year-over-year increase we reported y/y % change in Net revenue in the second quarter. To deliver faster growth, we improved advertiser retention by driving more leads for our clients. We also increased Local sales 9% force productivity by expanding our product portfolio and retaining more 6% 5% veteran sales reps. In our multi-location business, we won new mandates and grew client spend by providing attribution insights, introducing new ad formats, and improving our account coverage. 1Q19 2Q19 3Q19 Our strategic initiatives have also helped us grow more profitably. We drove stronger revenue growth in the third quarter on lower sales force headcount from this time last year. We also generated double-digit growth in App Unique Devices while reducing marketing expense by nearly half, which helped deliver a 140 basis-point year-over-year increase in Adjusted EBITDA margin for the third quarter. These strong fundamentals allowed us to repurchase $475 million of stock this year, including $77 million in the third quarter. With the continued execution of our long-term plan, we expect to acceler- ate year-over-year revenue growth to double digits for the fourth quar- 4 ter, while generating at least two percentage points of Adjusted EBITDA 19 margin improvement compared to the fourth quarter of 2018. The com- bination of improving revenue growth and strengthening Adjusted EBITDA margins reinforces our confidence in achieving the long-term financial targets we shared with you at the start of the year. Yelp Q3 2019
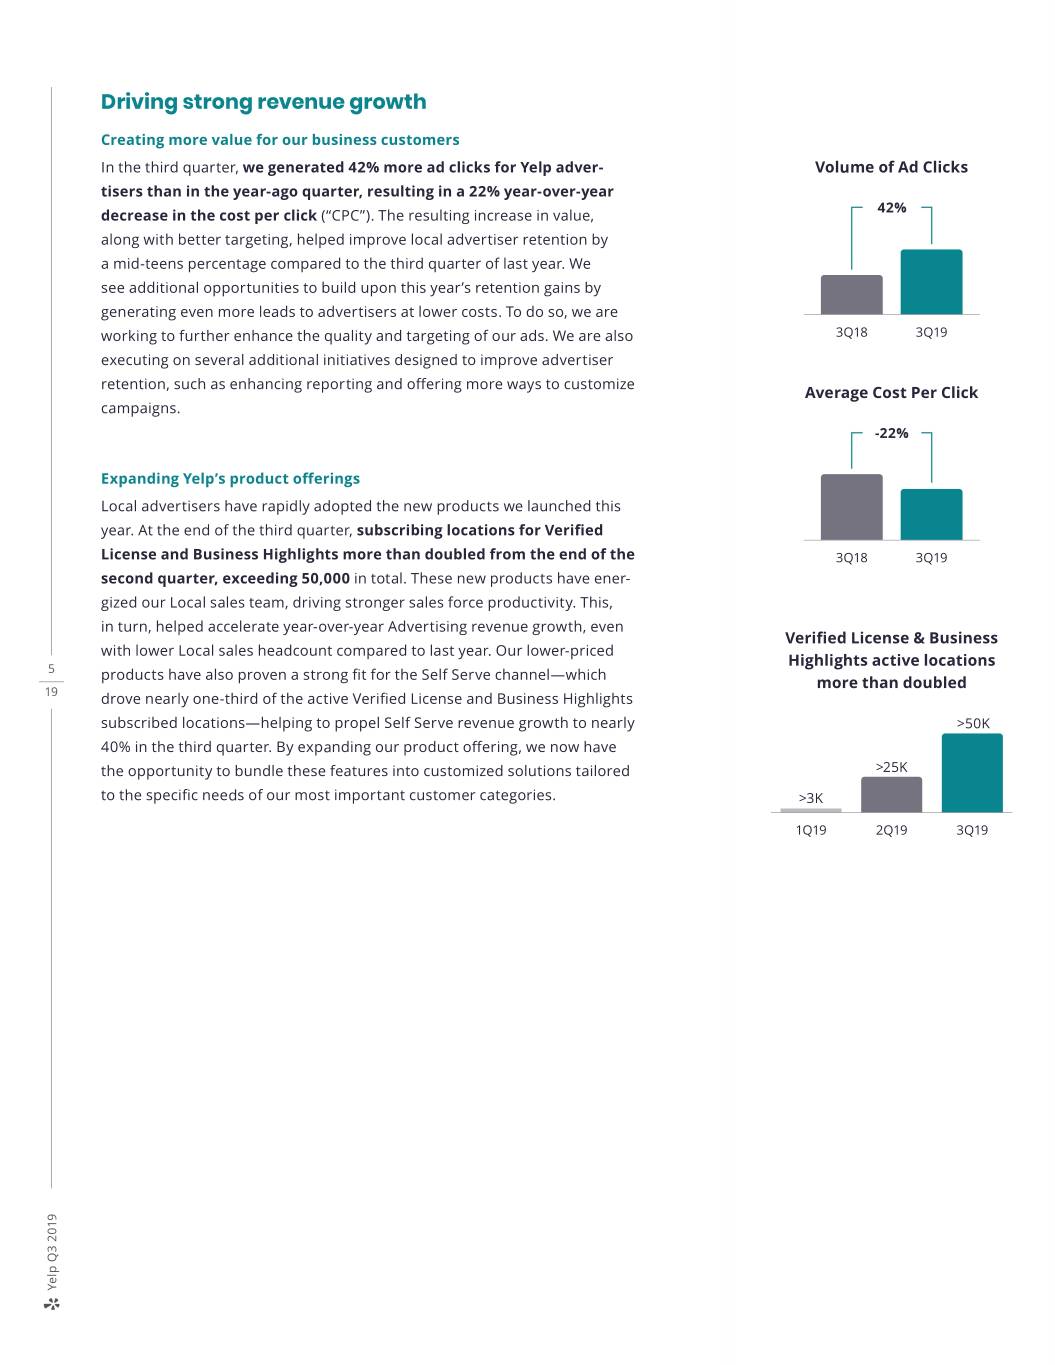
Driving strong revenue growth Creating more value for our business customers In the third quarter, we generated 42% more ad clicks for Yelp adver- Volume of Ad Clicks tisers than in the year-ago quarter, resulting in a 22% year-over-year 42% decrease in the cost per click (“CPC”). The resulting increase in value, along with better targeting, helped improve local advertiser retention by a mid-teens percentage compared to the third quarter of last year. We see additional opportunities to build upon this year’s retention gains by generating even more leads to advertisers at lower costs. To do so, we are working to further enhance the quality and targeting of our ads. We are also 3Q18 3Q19 executing on several additional initiatives designed to improve advertiser retention, such as enhancing reporting and offering more ways to customize Average Cost Per Click campaigns. -22% Expanding Yelp’s product offerings Local advertisers have rapidly adopted the new products we launched this year. At the end of the third quarter, subscribing locations for Verified License and Business Highlights more than doubled from the end of the 3Q18 3Q19 second quarter, exceeding 50,000 in total. These new products have ener- gized our Local sales team, driving stronger sales force productivity. This, in turn, helped accelerate year-over-year Advertising revenue growth, even Verified License & Business with lower Local sales headcount compared to last year. Our lower-priced Highlights active locations 5 products have also proven a strong fit for the Self Serve channel—which more than doubled 19 drove nearly one-third of the active Verified License and Business Highlights subscribed locations—helping to propel Self Serve revenue growth to nearly >50K 40% in the third quarter. By expanding our product offering, we now have the opportunity to bundle these features into customized solutions tailored >25K to the specific needs of our most important customer categories. >3K 1Q19 2Q19 3Q19 Yelp Q3 2019
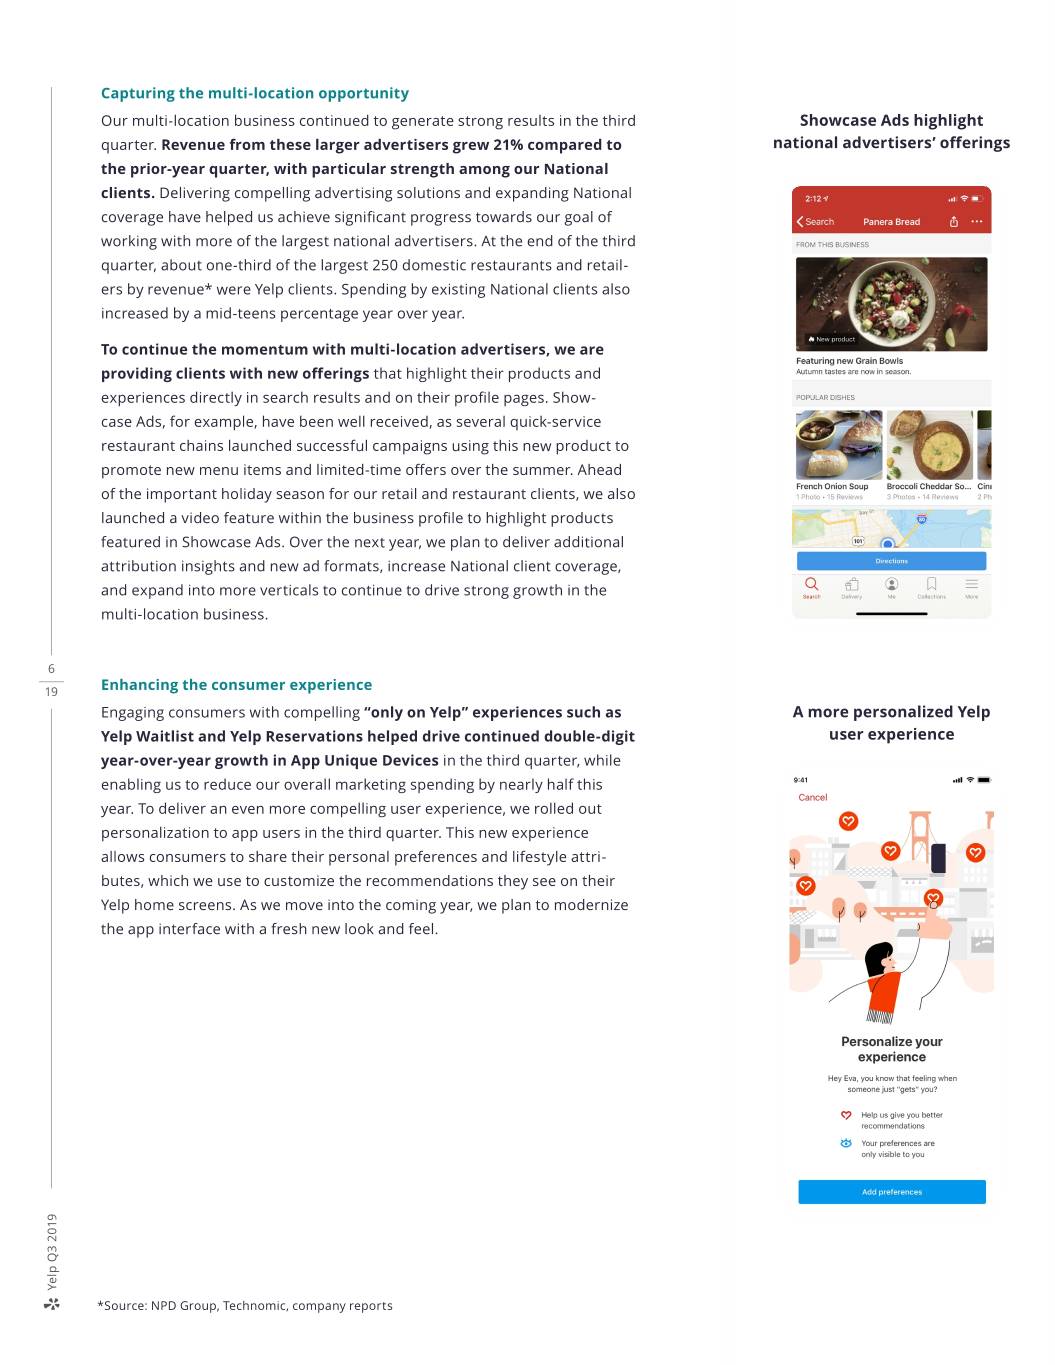
Capturing the multi-location opportunity Our multi-location business continued to generate strong results in the third Showcase Ads highlight quarter. Revenue from these larger advertisers grew 21% compared to national advertisers’ offerings the prior-year quarter, with particular strength among our National clients. Delivering compelling advertising solutions and expanding National coverage have helped us achieve significant progress towards our goal of working with more of the largest national advertisers. At the end of the third quarter, about one-third of the largest 250 domestic restaurants and retail- ers by revenue* were Yelp clients. Spending by existing National clients also increased by a mid-teens percentage year over year. To continue the momentum with multi-location advertisers, we are providing clients with new offerings that highlight their products and experiences directly in search results and on their profile pages. Show- case Ads, for example, have been well received, as several quick-service restaurant chains launched successful campaigns using this new product to promote new menu items and limited-time offers over the summer. Ahead of the important holiday season for our retail and restaurant clients, we also launched a video feature within the business profile to highlight products featured in Showcase Ads. Over the next year, we plan to deliver additional attribution insights and new ad formats, increase National client coverage, and expand into more verticals to continue to drive strong growth in the multi-location business. 6 19 Enhancing the consumer experience Engaging consumers with compelling “only on Yelp” experiences such as A more personalized Yelp Yelp Waitlist and Yelp Reservations helped drive continued double-digit user experience year-over-year growth in App Unique Devices in the third quarter, while enabling us to reduce our overall marketing spending by nearly half this year. To deliver an even more compelling user experience, we rolled out personalization to app users in the third quarter. This new experience allows consumers to share their personal preferences and lifestyle attri- butes, which we use to customize the recommendations they see on their Yelp home screens. As we move into the coming year, we plan to modernize the app interface with a fresh new look and feel. Yelp Q3 2019 *Source: NPD Group, Technomic, company reports
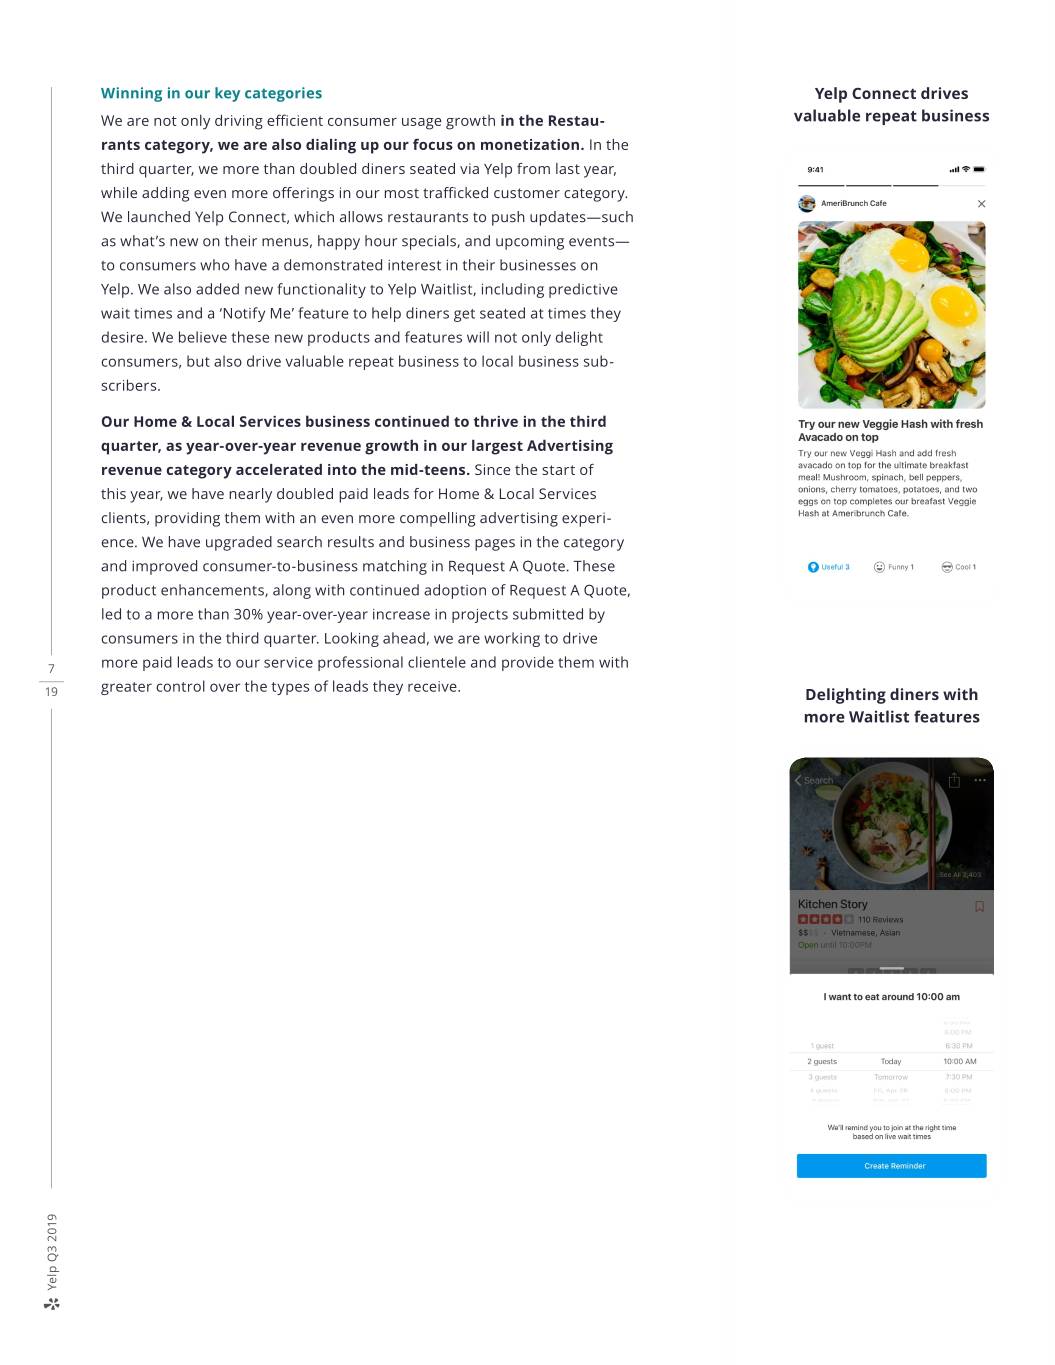
Winning in our key categories Yelp Connect drives We are not only driving efficient consumer usage growth in the Restau- valuable repeat business rants category, we are also dialing up our focus on monetization. In the third quarter, we more than doubled diners seated via Yelp from last year, while adding even more offerings in our most trafficked customer category. We launched Yelp Connect, which allows restaurants to push updates—such as what’s new on their menus, happy hour specials, and upcoming events— to consumers who have a demonstrated interest in their businesses on Yelp. We also added new functionality to Yelp Waitlist, including predictive wait times and a ‘Notify Me’ feature to help diners get seated at times they desire. We believe these new products and features will not only delight consumers, but also drive valuable repeat business to local business sub- scribers. Our Home & Local Services business continued to thrive in the third quarter, as year-over-year revenue growth in our largest Advertising revenue category accelerated into the mid-teens. Since the start of this year, we have nearly doubled paid leads for Home & Local Services clients, providing them with an even more compelling advertising experi- ence. We have upgraded search results and business pages in the category and improved consumer-to-business matching in Request A Quote. These product enhancements, along with continued adoption of Request A Quote, led to a more than 30% year-over-year increase in projects submitted by consumers in the third quarter. Looking ahead, we are working to drive 7 more paid leads to our service professional clientele and provide them with greater control over the types of leads they receive. 19 Delighting diners with more Waitlist features Yelp Q3 2019
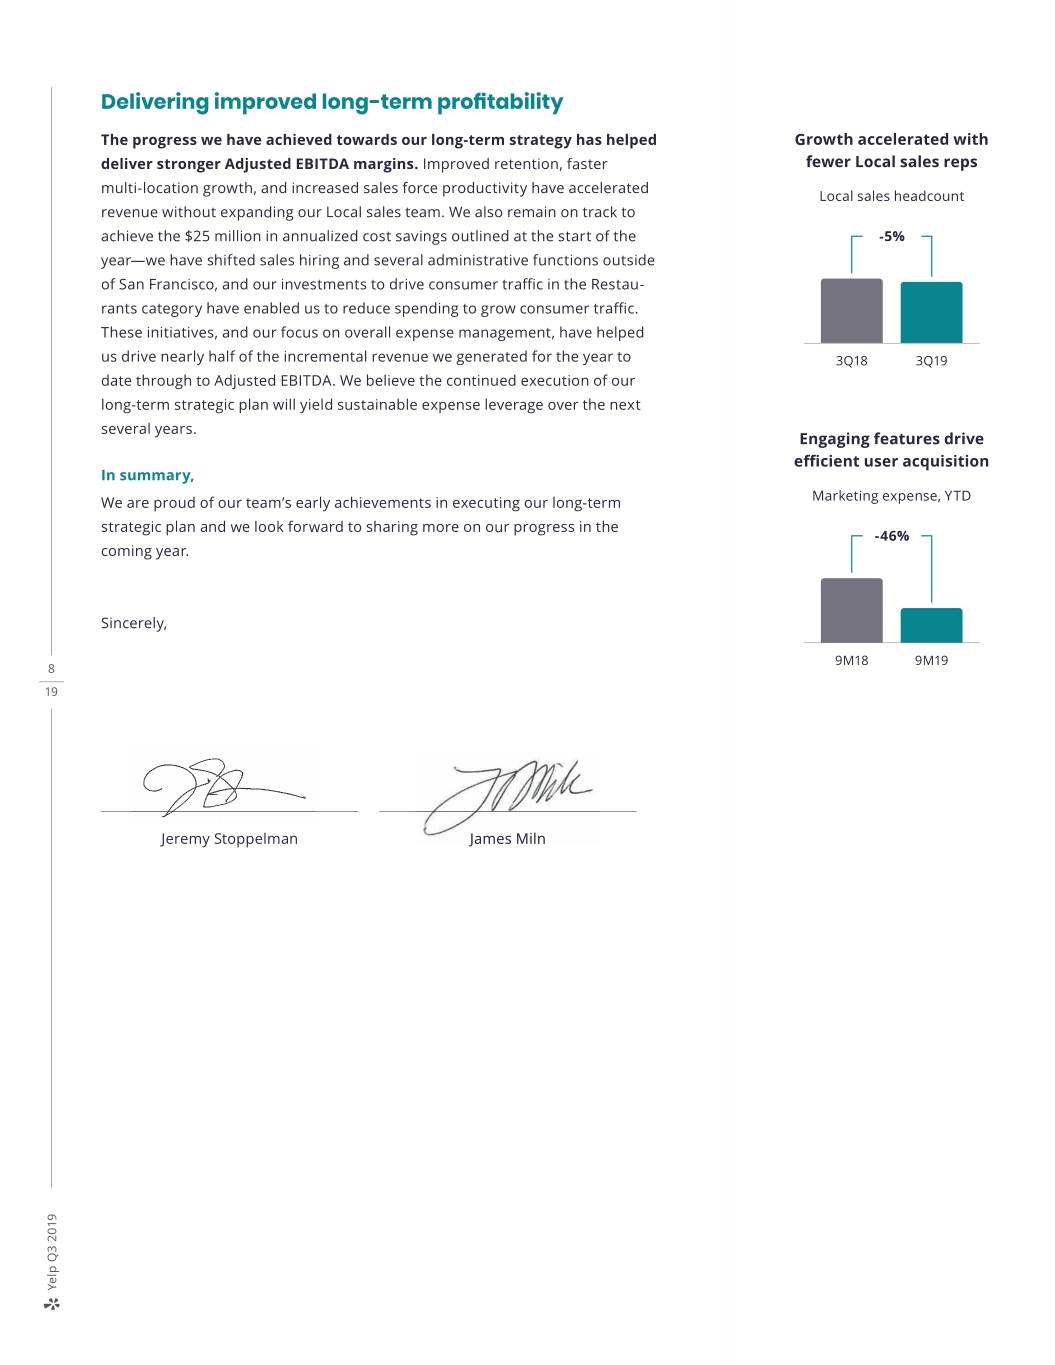
Delivering improved long-term profitability The progress we have achieved towards our long-term strategy has helped Growth accelerated with deliver stronger Adjusted EBITDA margins. Improved retention, faster fewer Local sales reps multi-location growth, and increased sales force productivity have accelerated Local sales headcount revenue without expanding our Local sales team. We also remain on track to achieve the $25 million in annualized cost savings outlined at the start of the -5% year—we have shifted sales hiring and several administrative functions outside of San Francisco, and our investments to drive consumer traffic in the Restau- rants category have enabled us to reduce spending to grow consumer traffic. These initiatives, and our focus on overall expense management, have helped us drive nearly half of the incremental revenue we generated for the year to 3Q18 3Q19 date through to Adjusted EBITDA. We believe the continued execution of our long-term strategic plan will yield sustainable expense leverage over the next several years. Engaging features drive efficient user acquisition In summary, We are proud of our team’s early achievements in executing our long-term Marketing expense, YTD strategic plan and we look forward to sharing more on our progress in the -46% coming year. Sincerely, 9M18 9M19 8 19 Jeremy Stoppelman James Miln Yelp Q3 2019
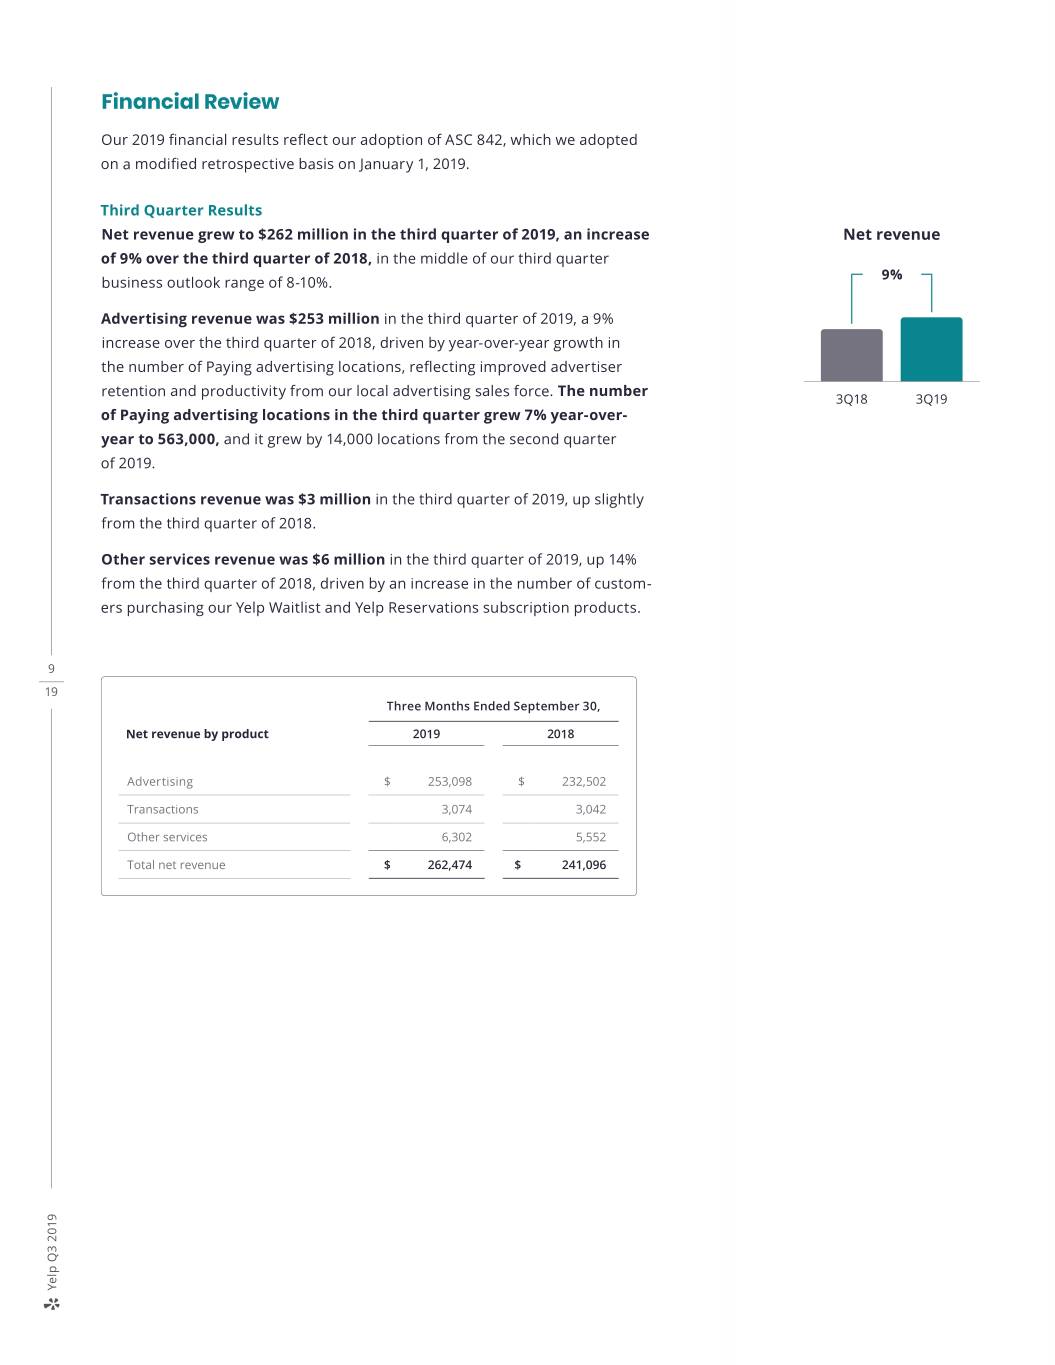
Financial Review Our 2019 financial results reflect our adoption of ASC 842, which we adopted on a modified retrospective basis on January 1, 2019. Third Quarter Results Net revenue grew to $262 million in the third quarter of 2019, an increase Net revenue of 9% over the third quarter of 2018, in the middle of our third quarter 9% business outlook range of 8-10%. Advertising revenue was $253 million in the third quarter of 2019, a 9% increase over the third quarter of 2018, driven by year-over-year growth in the number of Paying advertising locations, reflecting improved advertiser retention and productivity from our local advertising sales force. The number 3Q18 3Q19 of Paying advertising locations in the third quarter grew 7% year-over- year to 563,000, and it grew by 14,000 locations from the second quarter of 2019. Transactions revenue was $3 million in the third quarter of 2019, up slightly from the third quarter of 2018. Other services revenue was $6 million in the third quarter of 2019, up 14% from the third quarter of 2018, driven by an increase in the number of custom- ers purchasing our Yelp Waitlist and Yelp Reservations subscription products. 9 19 Three Months Ended September 30, Net revenue by product 2019 2018 Advertising $ 253,098 $ 232,502 Transactions 3,074 3,042 Other services 6,302 5,552 Total net revenue $ 262,474 $ 241,096 Yelp Q3 2019
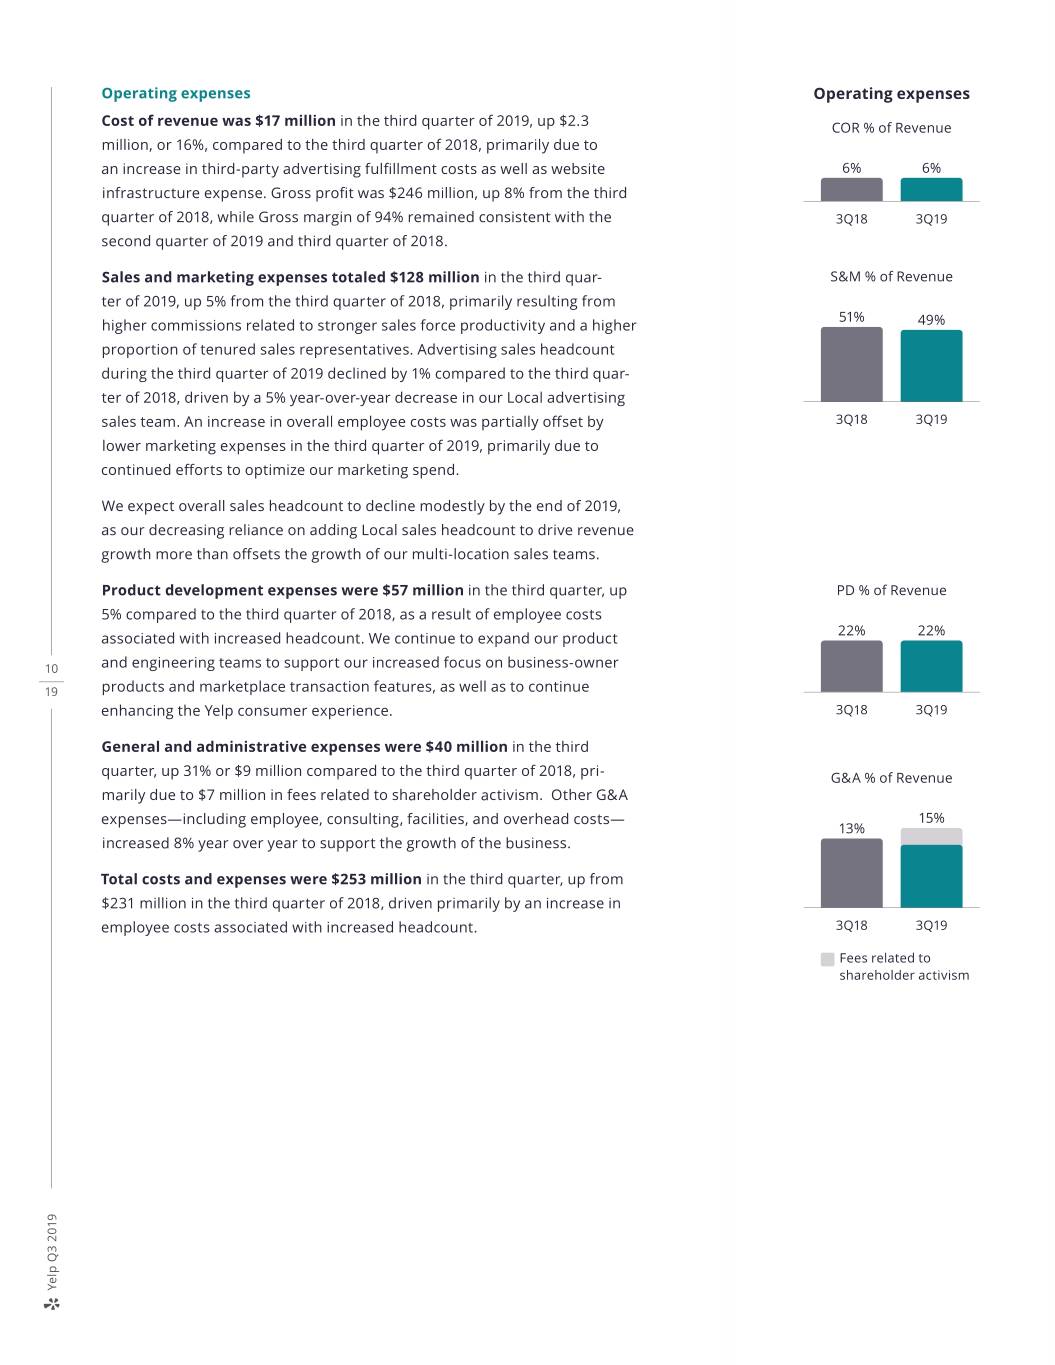
Operating expenses Operating expenses Cost of revenue was $17 million in the third quarter of 2019, up $2.3 COR % of Revenue million, or 16%, compared to the third quarter of 2018, primarily due to an increase in third-party advertising fulfillment costs as well as website 6% 6% infrastructure expense. Gross profit was $246 million, up 8% from the third quarter of 2018, while Gross margin of 94% remained consistent with the 3Q18 3Q19 second quarter of 2019 and third quarter of 2018. Sales and marketing expenses totaled $128 million in the third quar- S&M % of Revenue ter of 2019, up 5% from the third quarter of 2018, primarily resulting from 51% higher commissions related to stronger sales force productivity and a higher 49% proportion of tenured sales representatives. Advertising sales headcount during the third quarter of 2019 declined by 1% compared to the third quar- ter of 2018, driven by a 5% year-over-year decrease in our Local advertising sales team. An increase in overall employee costs was partially offset by 3Q18 3Q19 lower marketing expenses in the third quarter of 2019, primarily due to continued efforts to optimize our marketing spend. We expect overall sales headcount to decline modestly by the end of 2019, as our decreasing reliance on adding Local sales headcount to drive revenue growth more than offsets the growth of our multi-location sales teams. Product development expenses were $57 million in the third quarter, up PD % of Revenue 5% compared to the third quarter of 2018, as a result of employee costs 22% 22% associated with increased headcount. We continue to expand our product 10 and engineering teams to support our increased focus on business-owner 19 products and marketplace transaction features, as well as to continue enhancing the Yelp consumer experience. 3Q18 3Q19 General and administrative expenses were $40 million in the third quarter, up 31% or $9 million compared to the third quarter of 2018, pri- G&A % of Revenue marily due to $7 million in fees related to shareholder activism. Other G&A expenses—including employee, consulting, facilities, and overhead costs— 15% 13% increased 8% year over year to support the growth of the business. Total costs and expenses were $253 million in the third quarter, up from $231 million in the third quarter of 2018, driven primarily by an increase in employee costs associated with increased headcount. 3Q18 3Q19 Fees related to shareholder activism Yelp Q3 2019
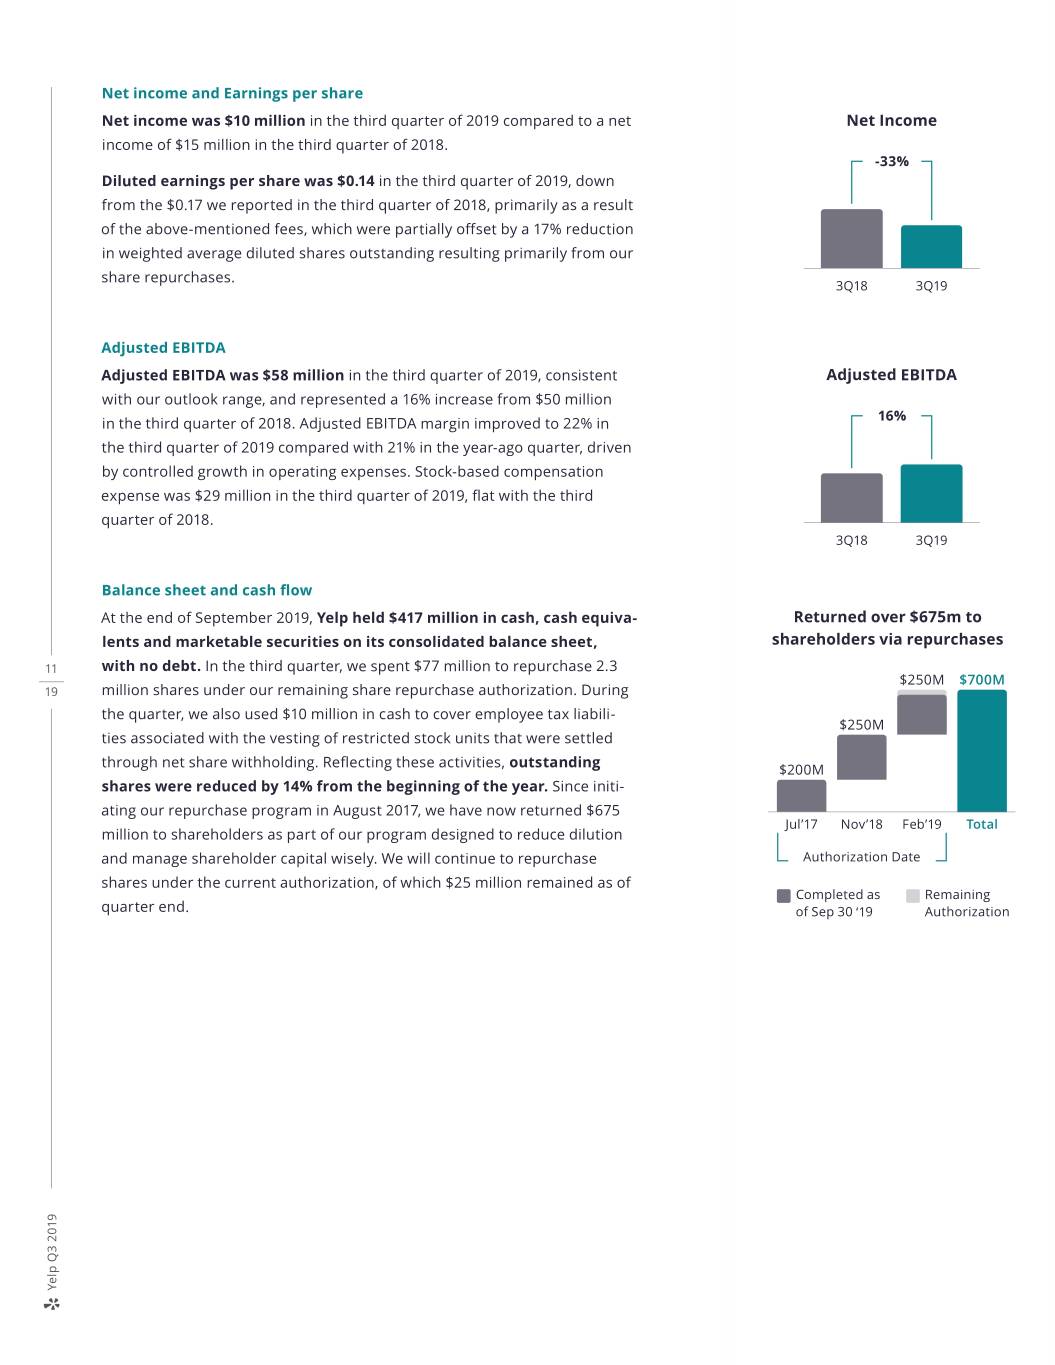
Net income and Earnings per share Net income was $10 million in the third quarter of 2019 compared to a net Net Income income of $15 million in the third quarter of 2018. -33% Diluted earnings per share was $0.14 in the third quarter of 2019, down from the $0.17 we reported in the third quarter of 2018, primarily as a result of the above-mentioned fees, which were partially offset by a 17% reduction in weighted average diluted shares outstanding resulting primarily from our share repurchases. 3Q18 3Q19 Adjusted EBITDA Adjusted EBITDA was $58 million in the third quarter of 2019, consistent Adjusted EBITDA with our outlook range, and represented a 16% increase from $50 million 16% in the third quarter of 2018. Adjusted EBITDA margin improved to 22% in the third quarter of 2019 compared with 21% in the year-ago quarter, driven by controlled growth in operating expenses. Stock-based compensation expense was $29 million in the third quarter of 2019, flat with the third quarter of 2018. 3Q18 3Q19 Balance sheet and cash flow At the end of September 2019, Yelp held $417 million in cash, cash equiva- Returned over $675m to lents and marketable securities on its consolidated balance sheet, shareholders via repurchases 11 with no debt. In the third quarter, we spent $77 million to repurchase 2.3 $250M $700M 19 million shares under our remaining share repurchase authorization. During the quarter, we also used $10 million in cash to cover employee tax liabili- $250M ties associated with the vesting of restricted stock units that were settled through net share withholding. Reflecting these activities, outstanding $200M shares were reduced by 14% from the beginning of the year. Since initi- ating our repurchase program in August 2017, we have now returned $675 Jul’17 Nov’18 Feb’19 Total million to shareholders as part of our program designed to reduce dilution and manage shareholder capital wisely. We will continue to repurchase Authorization Date shares under the current authorization, of which $25 million remained as of Completed as Remaining quarter end. of Sep 30 ‘19 Authorization Yelp Q3 2019
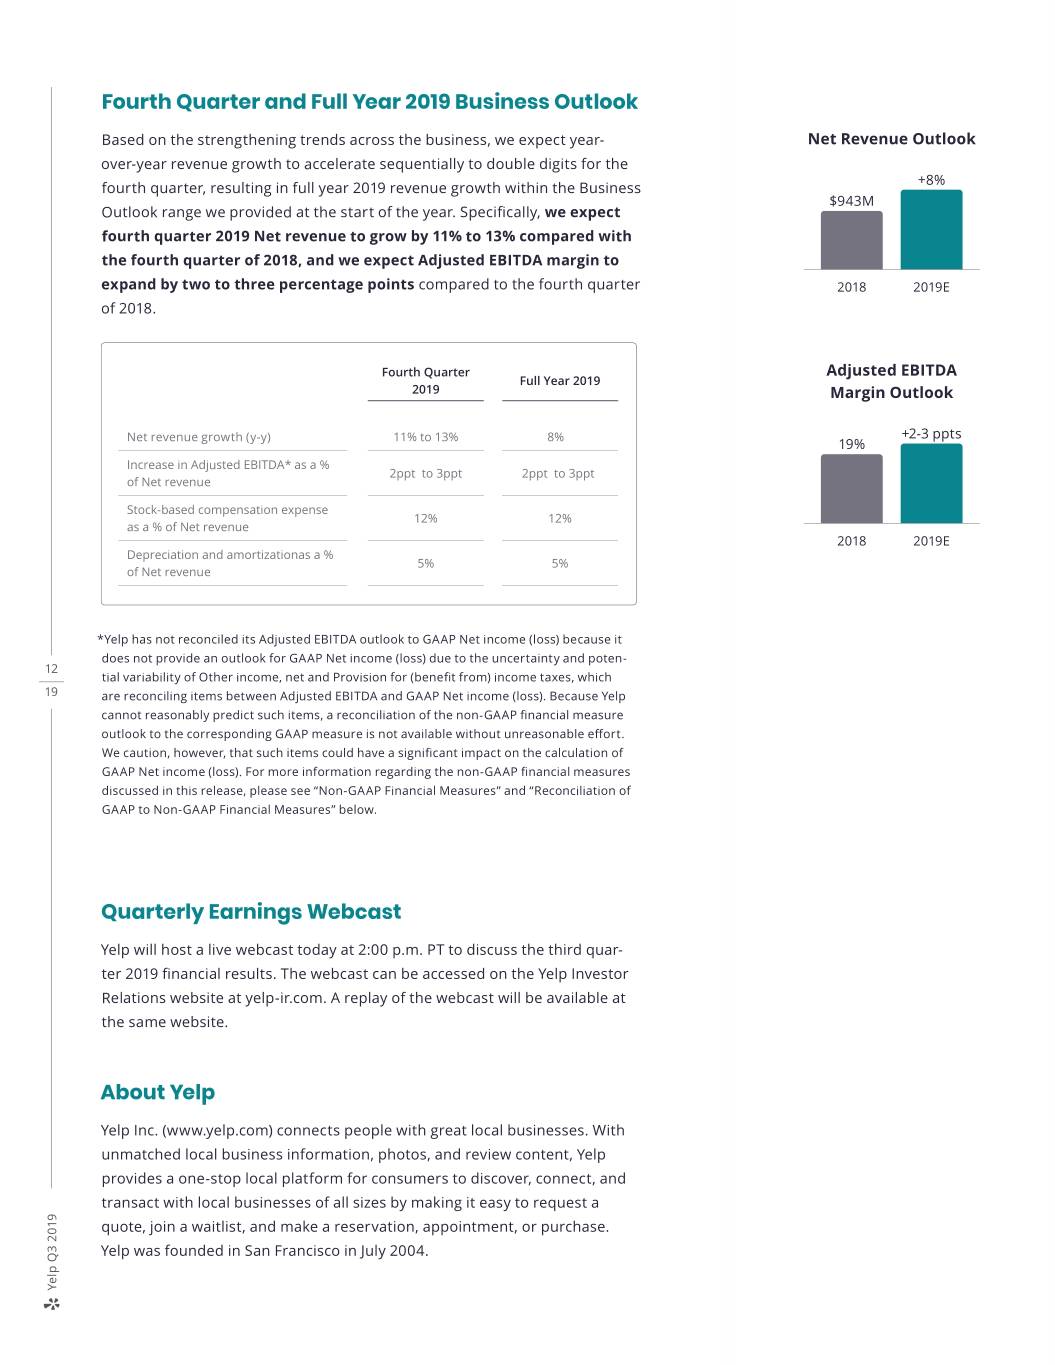
Fourth Quarter and Full Year 2019 Business Outlook Based on the strengthening trends across the business, we expect year- Net Revenue Outlook over-year revenue growth to accelerate sequentially to double digits for the +8% fourth quarter, resulting in full year 2019 revenue growth within the Business $943M Outlook range we provided at the start of the year. Specifically, we expect fourth quarter 2019 Net revenue to grow by 11% to 13% compared with the fourth quarter of 2018, and we expect Adjusted EBITDA margin to expand by two to three percentage points compared to the fourth quarter 2018 2019E of 2018. Fourth Quarter Adjusted EBITDA Full Year 2019 2019 Margin Outlook Net revenue growth (y-y) 11% to 13% 8% +2-3 ppts 19% Increase in Adjusted EBITDA* as a % 2ppt to 3ppt 2ppt to 3ppt of Net revenue Stock-based compensation expense 12% 12% as a % of Net revenue 2018 2019E Depreciation and amortizationas a % 5% 5% of Net revenue *Yelp has not reconciled its Adjusted EBITDA outlook to GAAP Net income (loss) because it does not provide an outlook for GAAP Net income (loss) due to the uncertainty and poten- 12 tial variability of Other income, net and Provision for (benefit from) income taxes, which 19 are reconciling items between Adjusted EBITDA and GAAP Net income (loss). Because Yelp cannot reasonably predict such items, a reconciliation of the non-GAAP financial measure outlook to the corresponding GAAP measure is not available without unreasonable effort. We caution, however, that such items could have a significant impact on the calculation of GAAP Net income (loss). For more information regarding the non-GAAP financial measures discussed in this release, please see “Non-GAAP Financial Measures” and “Reconciliation of GAAP to Non-GAAP Financial Measures” below. Quarterly Earnings Webcast Yelp will host a live webcast today at 2:00 p.m. PT to discuss the third quar- ter 2019 financial results. The webcast can be accessed on the Yelp Investor Relations website at yelp-ir.com. A replay of the webcast will be available at the same website. About Yelp Yelp Inc. (www.yelp.com) connects people with great local businesses. With unmatched local business information, photos, and review content, Yelp provides a one-stop local platform for consumers to discover, connect, and transact with local businesses of all sizes by making it easy to request a quote, join a waitlist, and make a reservation, appointment, or purchase. Yelp was founded in San Francisco in July 2004. Yelp Q3 2019
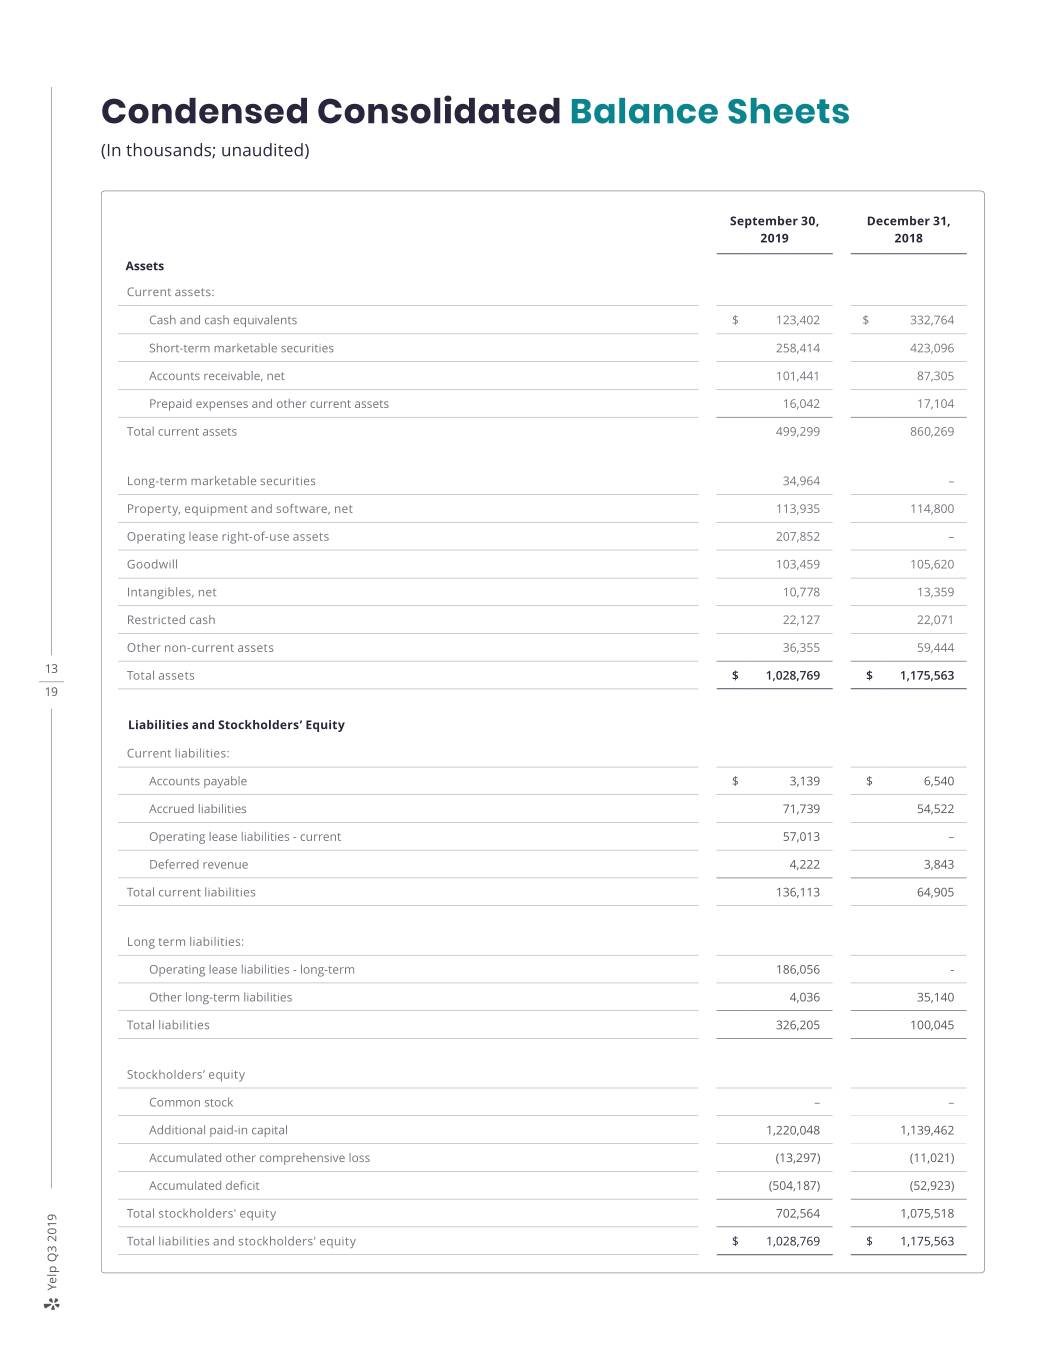
Condensed Consolidated Balance Sheets (In thousands; unaudited) September 30, December 31, 2019 2018 Assets Current assets: Cash and cash equivalents $ 123,402 $ 332,764 Short-term marketable securities 258,414 423,096 Accounts receivable, net 101,441 87,305 Prepaid expenses and other current assets 16,042 17,104 Total current assets 499,299 860,269 Long-term marketable securities 34,964 – Property, equipment and software, net 113,935 114,800 Operating lease right-of-use assets 207,852 – Goodwill 103,459 105,620 Intangibles, net 10,778 13,359 Restricted cash 22,127 22,071 Other non-current assets 36,355 59,444 13 Total assets $ 1,028,769 $ 1,175,563 19 Liabilities and Stockholders’ Equity Current liabilities: Accounts payable $ 3,139 $ 6,540 Accrued liabilities 71,739 54,522 Operating lease liabilities - current 57,013 – Deferred revenue 4,222 3,843 Total current liabilities 136,113 64,905 Long term liabilities: Operating lease liabilities - long-term 186,056 - Other long-term liabilities 4,036 35,140 Total liabilities 326,205 100,045 Stockholders’ equity Common stock – – Additional paid-in capital 1,220,048 1,139,462 Accumulated other comprehensive loss (13,297) (11,021) Accumulated deficit (504,187) (52,923) Total stockholders' equity 702,564 1,075,518 Total liabilities and stockholders' equity $ 1,028,769 $ 1,175,563 Yelp Q3 2019
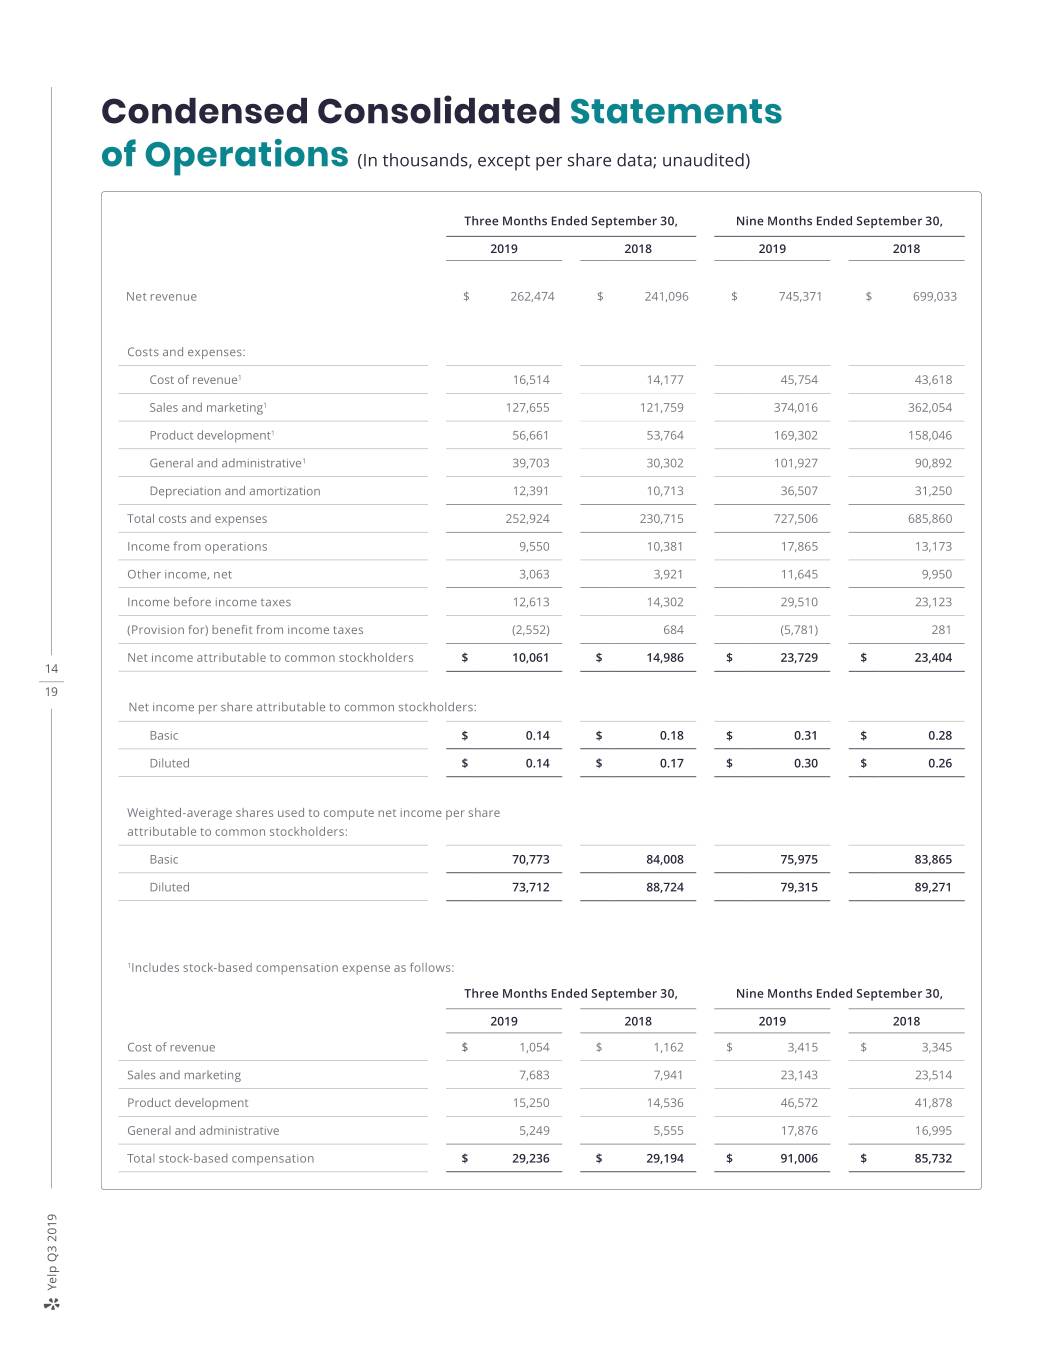
Condensed Consolidated Statements of Operations (In thousands, except per share data; unaudited) Three Months Ended September 30, Nine Months Ended September 30, 2019 2018 2019 2018 Net revenue $ 262,474 $ 241,096 $ 745,371 $ 699,033 Costs and expenses: Cost of revenue1 16,514 14,177 45,754 43,618 Sales and marketing1 127,655 121,759 374,016 362,054 Product development1 56,661 53,764 169,302 158,046 General and administrative1 39,703 30,302 101,927 90,892 Depreciation and amortization 12,391 10,713 36,507 31,250 Total costs and expenses 252,924 230,715 727,506 685,860 Income from operations 9,550 10,381 17,865 13,173 Other income, net 3,063 3,921 11,645 9,950 Income before income taxes 12,613 14,302 29,510 23,123 (Provision for) benefit from income taxes (2,552) 684 (5,781) 281 Net income attributable to common stockholders $ 10,061 $ 14,986 $ 23,729 $ 23,404 14 19 Net income per share attributable to common stockholders: Basic $ 0.14 $ 0.18 $ 0.31 $ 0.28 Diluted $ 0.14 $ 0.17 $ 0.30 $ 0.26 Weighted-average shares used to compute net income per share attributable to common stockholders: Basic 70,773 84,008 75,975 83,865 Diluted 73,712 88,724 79,315 89,271 1Includes stock-based compensation expense as follows: Three Months Ended September 30, Nine Months Ended September 30, 2019 2018 2019 2018 Cost of revenue $ 1,054 $ 1,162 $ 3,415 $ 3,345 Sales and marketing 7,683 7,941 23,143 23,514 Product development 15,250 14,536 46,572 41,878 General and administrative 5,249 5,555 17,876 16,995 Total stock-based compensation $ 29,236 $ 29,194 $ 91,006 $ 85,732 Yelp Q3 2019

Condensed Consolidated Statements of Cash Flows (In thousands; unaudited) Nine Months Ended September 30, 2019 2018 Operating activities Net income attributable to common stockholders $ 23,729 $ 23,404 Adjustments to reconcile net income to net cash provided by operating activities: Depreciation and amortization 36,507 31,250 Provision for doubtful accounts 15,259 19,285 Stock-based compensation 91,006 85,732 Noncash lease cost 31,379 – Deferred income taxes (673) – Other adjustments (2,559) (2,793) Changes in operating assets and liabilities: Accounts receivable (29,395) (24,956) Prepaid expenses and other assets (2,312) (2,085) Operating lease liabilities (31,002) – Accounts payable, accrued liabilities and other liabilities 17,329 (13,722) Net cash provided by operating activities 149,268 116,115 15 19 Investing activities Purchases of marketable securities (396,648) (572,788) Maturities of marketable securities 530,597 460,800 Release of escrow deposit 28,750 – Purchases of property, equipment and software (29,950) (33,937) Other investing activities 383 64 Net cash provided by (used in) investing activities 133,132 (145,861) Financing activities Proceeds from issuance of common stock for employee stock-based plans 15,813 21,835 Repurchases of common stock (474,993) (71,993) Taxes paid related to net share settlement of equity awards (32,784) (41,081) Net cash used in financing activities (491,964) (91,239) Effect of exchange rate changes on cash, cash equivalents and restricted cash 258 197 Change in cash, cash equivalents and restricted cash (209,306) (120,788) Cash, cash equivalents and restricted cash - Beginning of period 354,835 566,404 Cash, cash equivalents and restricted cash - End of period $ 145,529 $ 445,616 Yelp Q3 2019
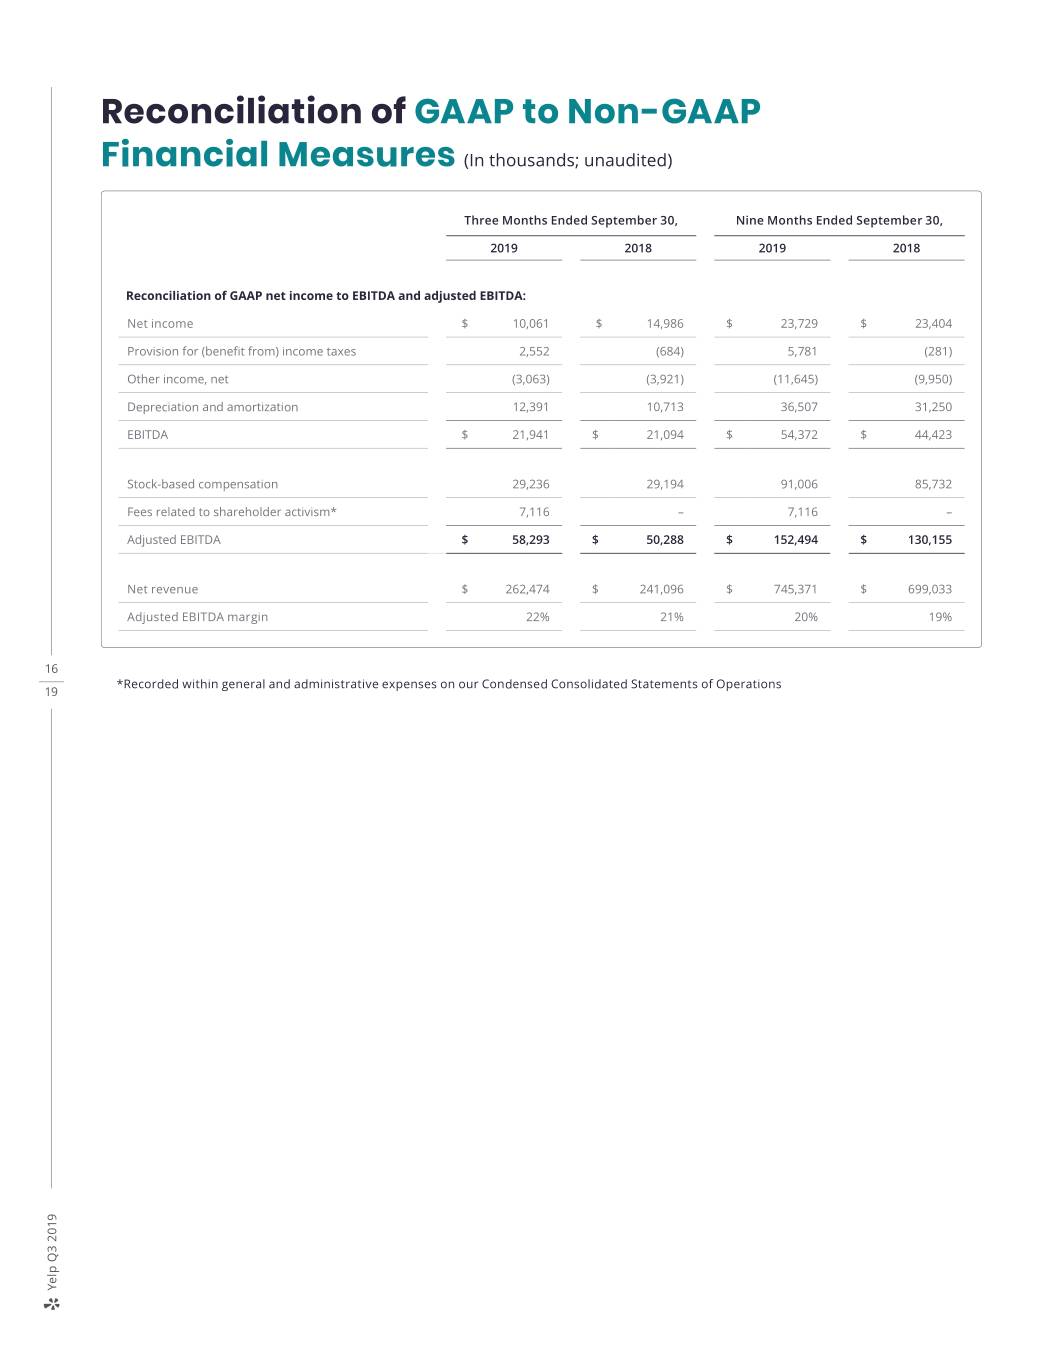
Reconciliation of GAAP to Non-GAAP Financial Measures (In thousands; unaudited) Three Months Ended September 30, Nine Months Ended September 30, 2019 2018 2019 2018 Reconciliation of GAAP net income to EBITDA and adjusted EBITDA: Net income $ 10,061 $ 14,986 $ 23,729 $ 23,404 Provision for (benefit from) income taxes 2,552 (684) 5,781 (281) Other income, net (3,063) (3,921) (11,645) (9,950) Depreciation and amortization 12,391 10,713 36,507 31,250 EBITDA $ 21,941 $ 21,094 $ 54,372 $ 44,423 Stock-based compensation 29,236 29,194 91,006 85,732 Fees related to shareholder activism* 7,116 – 7,116 – Adjusted EBITDA $ 58,293 $ 50,288 $ 152,494 $ 130,155 Net revenue $ 262,474 $ 241,096 $ 745,371 $ 699,033 Adjusted EBITDA margin 22% 21% 20% 19% 16 *Recorded within general and administrative expenses on our Condensed Consolidated Statements of Operations 19 Yelp Q3 2019
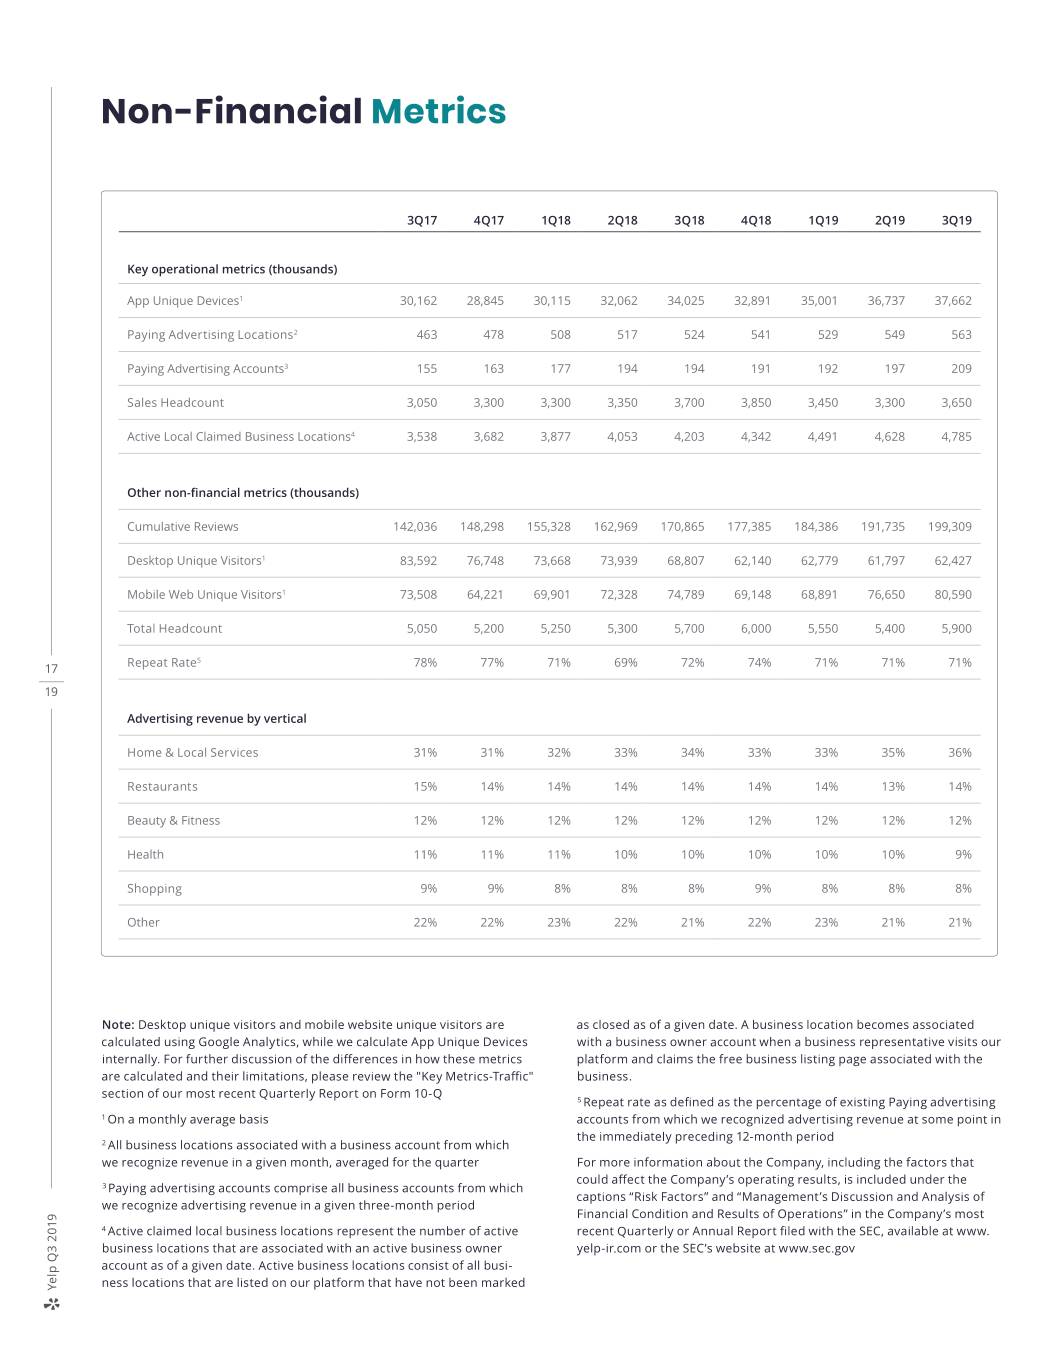
Non-Financial Metrics 3Q17 4Q17 1Q18 2Q18 3Q18 4Q18 1Q19 2Q19 3Q19 Key operational metrics (thousands) App Unique Devices1 30,162 28,845 30,115 32,062 34,025 32,891 35,001 36,737 37,662 Paying Advertising Locations2 463 478 508 517 524 541 529 549 563 Paying Advertising Accounts3 155 163 177 194 194 191 192 197 209 Sales Headcount 3,050 3,300 3,300 3,350 3,700 3,850 3,450 3,300 3,650 Active Local Claimed Business Locations4 3,538 3,682 3,877 4,053 4,203 4,342 4,491 4,628 4,785 Other non-financial metrics (thousands) Cumulative Reviews 142,036 148,298 155,328 162,969 170,865 177,385 184,386 191,735 199,309 Desktop Unique Visitors1 83,592 76,748 73,668 73,939 68,807 62,140 62,779 61,797 62,427 Mobile Web Unique Visitors1 73,508 64,221 69,901 72,328 74,789 69,148 68,891 76,650 80,590 Total Headcount 5,050 5,200 5,250 5,300 5,700 6,000 5,550 5,400 5,900 Repeat Rate5 78% 77% 71% 69% 72% 74% 71% 71% 71% 17 19 Advertising revenue by vertical Home & Local Services 31% 31% 32% 33% 34% 33% 33% 35% 36% Restaurants 15% 14% 14% 14% 14% 14% 14% 13% 14% Beauty & Fitness 12% 12% 12% 12% 12% 12% 12% 12% 12% Health 11% 11% 11% 10% 10% 10% 10% 10% 9% Shopping 9% 9% 8% 8% 8% 9% 8% 8% 8% Other 22% 22% 23% 22% 21% 22% 23% 21% 21% Note: Desktop unique visitors and mobile website unique visitors are as closed as of a given date. A business location becomes associated calculated using Google Analytics, while we calculate App Unique Devices with a business owner account when a business representative visits our internally. For further discussion of the differences in how these metrics platform and claims the free business listing page associated with the are calculated and their limitations, please review the "Key Metrics-Traffic" business. section of our most recent Quarterly Report on Form 10-Q 5 Repeat rate as defined as the percentage of existing Paying advertising 1 On a monthly average basis accounts from which we recognized advertising revenue at some point in the immediately preceding 12-month period 2 All business locations associated with a business account from which we recognize revenue in a given month, averaged for the quarter For more information about the Company, including the factors that could affect the Company’s operating results, is included under the 3 Paying advertising accounts comprise all business accounts from which captions “Risk Factors” and “Management’s Discussion and Analysis of we recognize advertising revenue in a given three-month period Financial Condition and Results of Operations” in the Company’s most 4 Active claimed local business locations represent the number of active recent Quarterly or Annual Report filed with the SEC, available at www. business locations that are associated with an active business owner yelp-ir.com or the SEC’s website at www.sec.gov account as of a given date. Active business locations consist of all busi- ness locations that are listed on our platform that have not been marked Yelp Q3 2019
Non-GAAP Financial Measures This letter and statements made during the above refer- > Adjusted EBITDA does not take into account any costs that enced webcast may include information relating to EBITDA, management determines are not indicative of ongoing Adjusted EBITDA and Adjusted EBITDA margin, each of which operating performance, such as restructuring and integra- the Securities and Exchange Commission has defined as a tion costs in 2017 and fees related to shareholder activism "non-GAAP financial measure." in 2019; and other companies, including those in Yelp’s industry, may We define EBITDA as net income, adjusted to exclude: provi- > calculate EBITDA and Adjusted EBITDA differently, which sion for (benefit from) income taxes; other income, net; and reduces their usefulness as comparative measures. depreciation and amortization. Because of these limitations, you should consider EBITDA, We define Adjusted EBITDA as net income, adjusted to Adjusted EBITDA and Adjusted EBITDA margin alongside exclude: provision for (benefit from) income taxes; other other financial performance measures, Net income (loss) and income, net; depreciation and amortization; stock-based Yelp’s other GAAP results. compensation expense; and, in certain periods, certain other income and expense items. For the third quarter of 2019, Forward-Looking Statements these other income and expense items consisted of fees This letter contains, and statements made during the related to shareholder activism. We define Adjusted EBITDA above-referenced webcast will contain, forward-looking margin as Adjusted EBITDA divided by net revenue. statements relating to, among other things, the future per- EBITDA, Adjusted EBITDA and Adjusted EBITDA margin are formance of Yelp and its consolidated subsidiaries that are key measures used by Yelp management and the board of based on Yelp’s current expectations, forecasts and assump- directors to understand and evaluate core operating perfor- tions and involve risks and uncertainties. These statements mance and trends, to prepare and approve Yelp’s annual bud- include, but are not limited to, statements regarding: get and to develop short- and long-term operational plans. > Yelp’s expected financial results for the fourth quarter and The presentation of this financial information, which is not 18 full year 2019, including its expectation of revenue growth prepared under any comprehensive set of accounting rules 19 accelerating sequentially to double digits for the fourth or principles, is not intended to be considered in isolation or quarter while generating two to three percentage points as a substitute for the financial information prepared and of Adjusted EBITDA margin improvement compared to the presented in accordance with generally accepted accounting fourth quarter of 2018; principles in the United States (“GAAP”). > Yelp’s confidence in achieving the long-term financial tar- EBITDA and Adjusted EBITDA have limitations as analytical gets it shared at the start of the year; tools, and you should not consider them in isolation or as > Yelp’s ability to build on this year’s retention gains by gen- substitutes for analysis of Yelp’s financial results as reported erating even more leads to advertisers at lower cost and under GAAP. Some of these limitations are: further enhance the quality and targeting of its ads; Yelp’s ability to improve advertiser retention by offering > although depreciation and amortization are non-cash > charges, the assets being depreciated and amortized may more ways to customize campaigns and enhancing ads have to be replaced in the future, and EBITDA and Adjusted reporting; EBITDA do not reflect cash capital expenditure require- > Yelp’s opportunity to package certain features into solu- ments for such replacements or for new capital expendi- tions to address the specific needs of its most important ture requirements; customer segments; EBITDA and Adjusted EBITDA do not reflect changes in, or > > Yelp’s plan to deliver additional attribution insights and cash requirements for, Yelp's working capital needs; new ad formats, increase National client coverage, and expand into more verticals to continue to drive strong > Adjusted EBITDA does not consider the potentially dilutive impact of equity-based compensation; growth in the multi-location business; Yelp’s belief that new products and features will not only > EBITDA and Adjusted EBITDA do not reflect tax payments > that may represent a reduction in cash available to Yelp; delight consumers, but also drive valuable repeat business to local business subscribers; Yelp Q3 2019
> Yelp’s work to drive more paid leads to its service profes- Factors that could cause or contribute to such differences sional clientele and provide them with greater control over also include, but are not limited to, those factors that could the types of leads they receive; affect Yelp’s business, operating results and stock price included under the captions “Risk Factors” and “Manage- > Yelp remaining on track to achieve the $25 million in annu- alized cost savings outlined at the start of the year; ment’s Discussion and Analysis of Financial Condition and Results of Operations” in Yelp’s most recent Annual Report on > Yelp’s belief that the continued execution of its long-term Form 10-K or Quarterly Report on Form 10-Q at http://www. strategic plan will yield sustainable expense leverage over yelp-ir.com or the SEC’s website at www.sec.gov. the next several years; and Undue reliance should not be placed on the forward-looking > Yelp’s plans and ability to reduce dilution and return capital to shareholders, including through its share repurchase statements in this letter or the above-referenced webcast, program and plans to continue to buy back shares in the which are based on information available to Yelp on the date fourth quarter of 2019. hereof. Such forward-looking statements do not include the potential impact of any acquisitions or divestitures that may Yelp’s actual results could differ materially from those pre- be announced and/or completed after the date hereof. Yelp dicted or implied by such forward-looking statements and assumes no obligation to update such statements. reported results should not be considered as an indication of future performance. Factors that could cause or contribute to such differences include, but are not limited to: > Yelp’s limited operating history in an evolving industry; > Yelp’s ability to generate sufficient revenue to maintain profitability, particularly in light of its significant ongoing sales and marketing expenses, its ongoing investments in Yelp Reservations, Yelp Waitlist and Yelp WiFi Marketing, 19 and the sale of Eat24; 19 > Yelp’s ability to successfully manage the acquisition and integration of new businesses, solutions or technologies, as well as to monetize the acquired products, solutions or technologies; > Yelp’s reliance on traffic to its website from search engines like Google and Bing and the quality and reliability of such traffic; > Yelp’s ability to generate and maintain sufficient high qual- ity content from its users; > maintaining a strong brand and managing negative public- ity that may arise; > maintaining and expanding Yelp’s base of advertisers, par- ticularly as an increasing portion of advertisers have the ability to cancel their ad campaigns at any time; > Yelp’s ability to timely upgrade and develop its systems, infrastructure and customer service capabilities; and > Yelp’s ability to purchase shares under the stock repur- chase purchase program, or the modification, suspension or termination of that program. Yelp Q3 2019


