
Q2 2020 Letter to Shareholders August 6, 2020 | yelp-ir.com
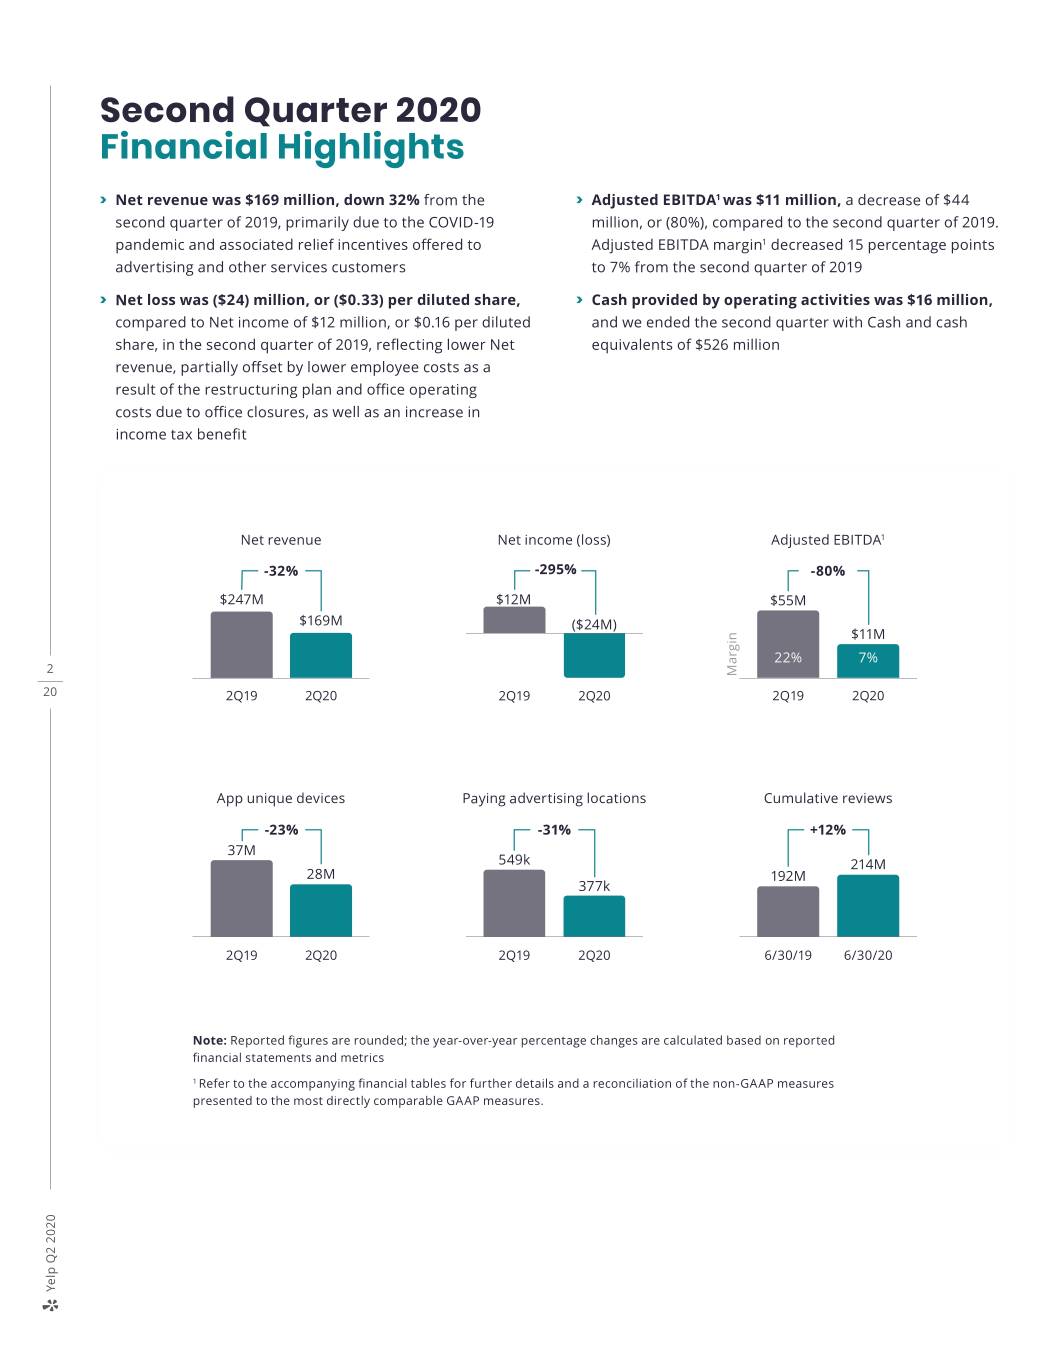
Second Quarter 2020 Financial Highlights 1 > Net revenue was $169 million, down 32% from the > Adjusted EBITDA was $11 million, a decrease of $44 second quarter of 2019, primarily due to the COVID-19 million, or (80%), compared to the second quarter of 2019. pandemic and associated relief incentives offered to Adjusted EBITDA margin1 decreased 15 percentage points advertising and other services customers to 7% from the second quarter of 2019 > Net loss was ($24) million, or ($0.33) per diluted share, > Cash provided by operating activities was $16 million, compared to Net income of $12 million, or $0.16 per diluted and we ended the second quarter with Cash and cash share, in the second quarter of 2019, reflecting lower Net equivalents of $526 million revenue, partially offset by lower employee costs as a result of the restructuring plan and office operating costs due to office closures, as well as an increase in income tax benefit Net revenue Net income (loss) Adjusted EBITDA1 -32% -295% -80% $247M $12M $55M $169M ($24M) $11M 22% 7% 2 Margin 20 2Q19 2Q20 2Q19 2Q20 2Q19 2Q20 App unique devices Paying advertising locations Cumulative reviews -23% -31% +12% 37M 549k 214M 28M 192M 377k 2Q19 2Q20 2Q19 2Q20 6/30/19 6/30/20 Note: Reported figures are rounded; the year-over-year percentage changes are calculated based on reported financial statements and metrics 1 Refer to the accompanying financial tables for further details and a reconciliation of the non-GAAP measures presented to the most directly comparable GAAP measures. Yelp 2020 Q2
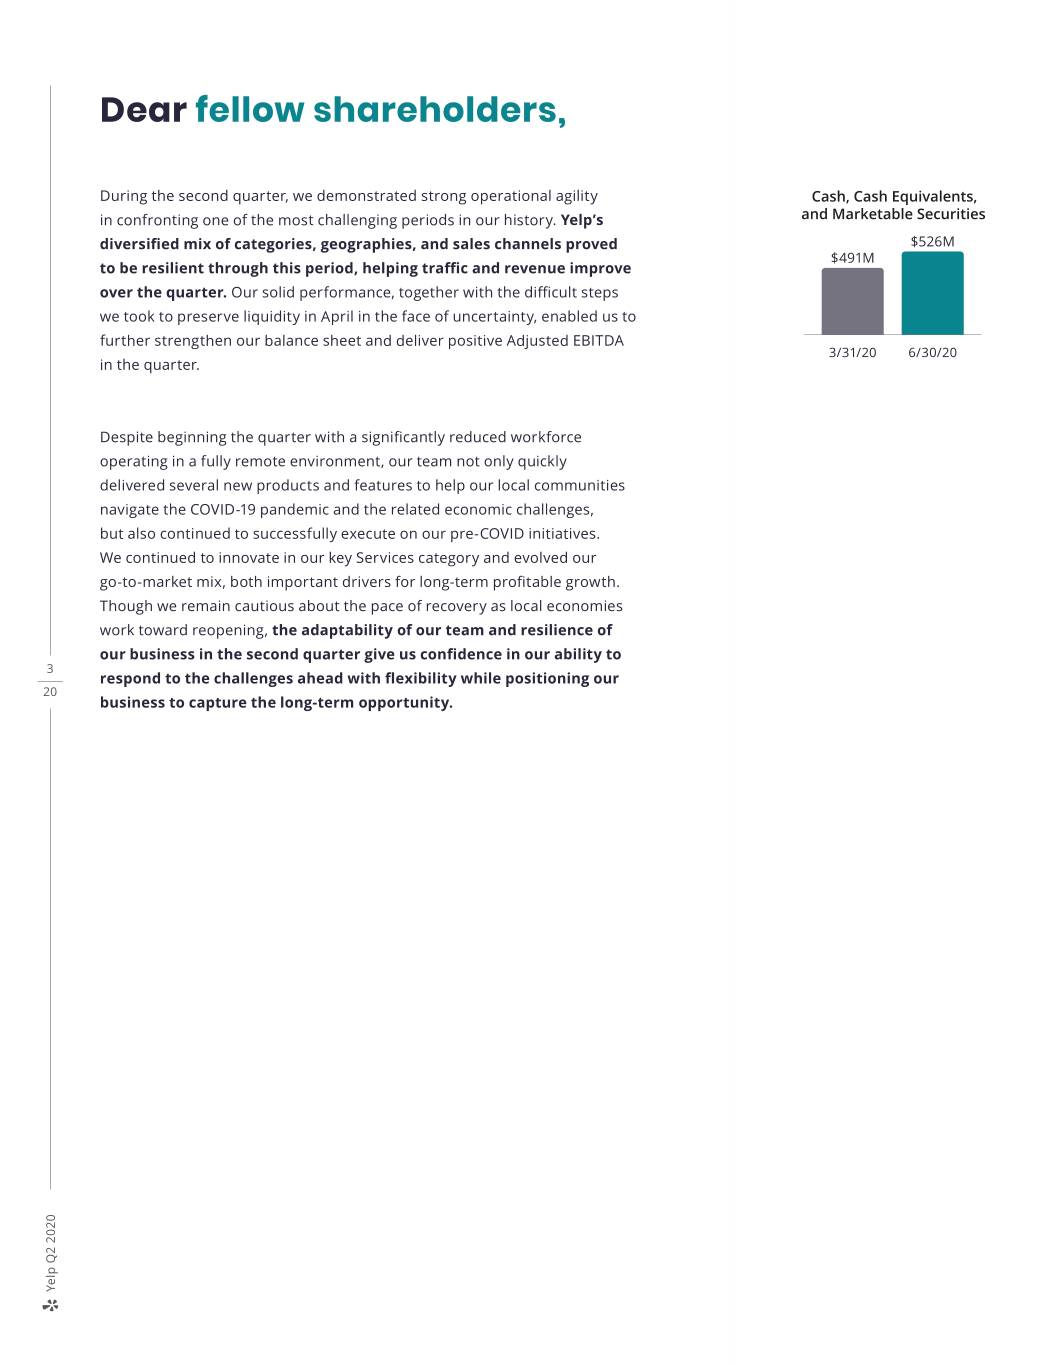
Dear fellow shareholders, During the second quarter, we demonstrated strong operational agility Cash, Cash Equivalents, in confronting one of the most challenging periods in our history. Yelp’s and Marketable Securities diversified mix of categories, geographies, and sales channels proved $526M $491M to be resilient through this period, helping traffic and revenue improve 207M over the quarter. Our solid performance, together with the difficult steps we took to preserve liquidity in April in the face of uncertainty, enabled us to further strengthen our balance sheet and deliver positive Adjusted EBITDA 3/31/20 6/30/20 in the quarter. Despite beginning the quarter with a significantly reduced workforce operating in a fully remote environment, our team not only quickly delivered several new products and features to help our local communities navigate the COVID-19 pandemic and the related economic challenges, but also continued to successfully execute on our pre-COVID initiatives. We continued to innovate in our key Services category and evolved our go-to-market mix, both important drivers for long-term profitable growth. Though we remain cautious about the pace of recovery as local economies work toward reopening, the adaptability of our team and resilience of our business in the second quarter give us confidence in our ability to 3 respond to the challenges ahead with flexibility while positioning our 20 business to capture the long-term opportunity. Yelp 2020 Q2
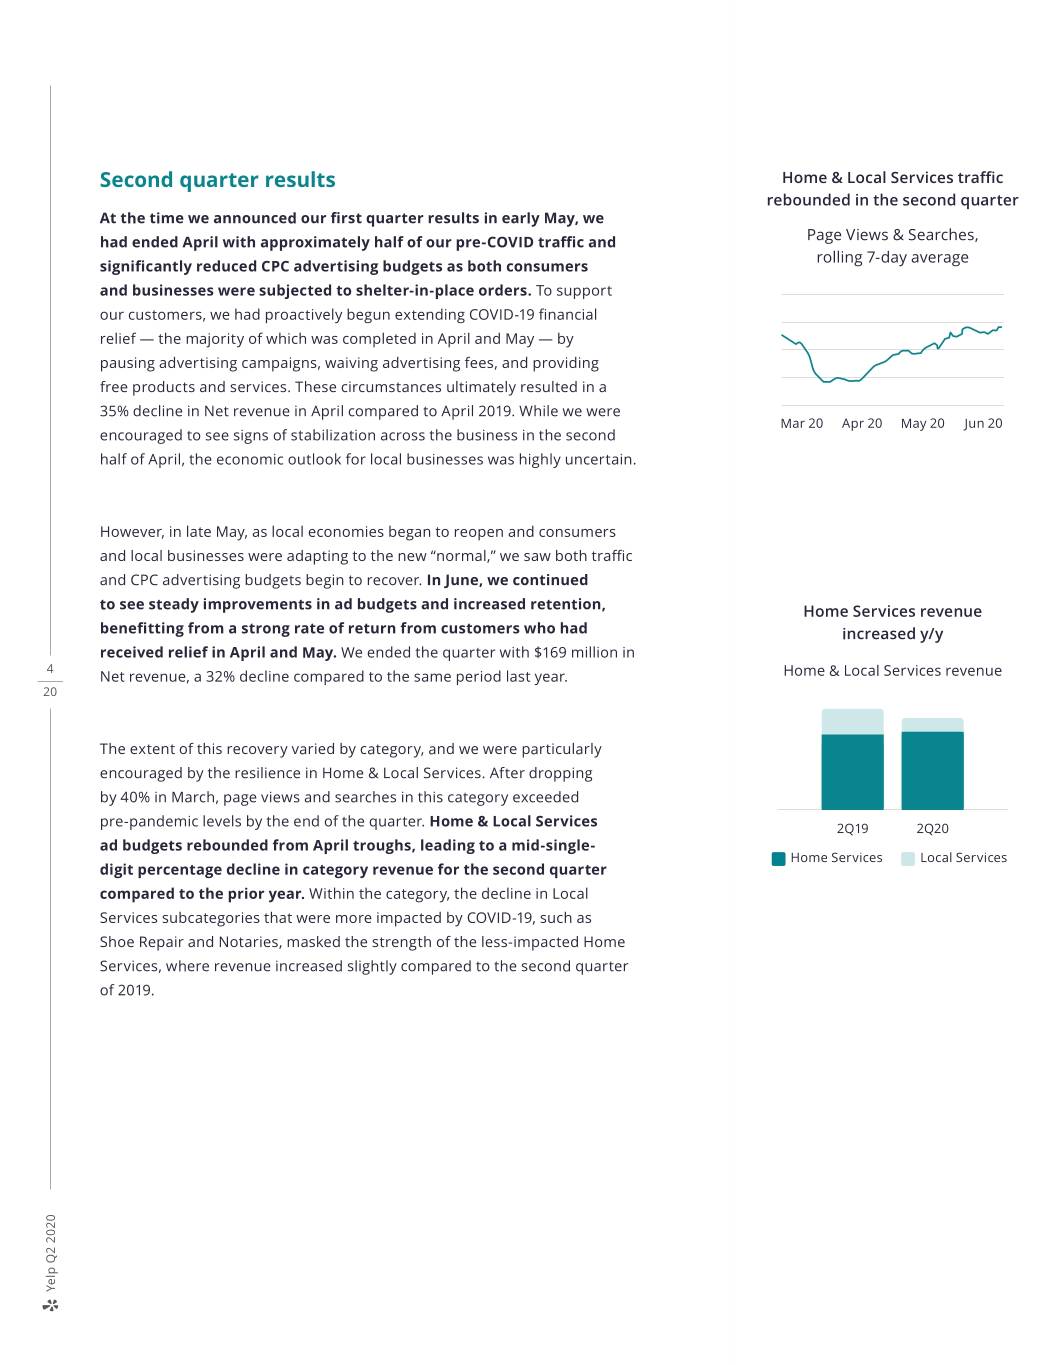
Second quarter results Home & Local Services traffic rebounded in the second quarter At the time we announced our first quarter results in early May, we had ended April with approximately half of our pre-COVID traffic and Page Views & Searches, rolling 7-day average significantly reduced CPC advertising budgets as both consumers and businesses were subjected to shelter-in-place orders. To support our customers, we had proactively begun extending COVID-19 financial relief — the majority of which was completed in April and May — by pausing advertising campaigns, waiving advertising fees, and providing free products and services. These circumstances ultimately resulted in a 35% decline in Net revenue in April compared to April 2019. While we were Mar 20 Apr 20 May 20 Jun 20 encouraged to see signs of stabilization across the business in the second half of April, the economic outlook for local businesses was highly uncertain. However, in late May, as local economies began to reopen and consumers and local businesses were adapting to the new “normal,” we saw both traffic and CPC advertising budgets begin to recover. In June, we continued to see steady improvements in ad budgets and increased retention, Home Services revenue benefitting from a strong rate of return from customers who had increased y/y received relief in April and May. We ended the quarter with $169 million in 4 Net revenue, a 32% decline compared to the same period last year. Home & Local Services revenue 20 The extent of this recovery varied by category, and we were particularly encouraged by the resilience in Home & Local Services. After dropping by 40% in March, page views and searches in this category exceeded pre-pandemic levels by the end of the quarter. Home & Local Services 2Q19 2Q20 ad budgets rebounded from April troughs, leading to a mid-single- Home Services Local Services digit percentage decline in category revenue for the second quarter compared to the prior year. Within the category, the decline in Local Services subcategories that were more impacted by COVID-19, such as Shoe Repair and Notaries, masked the strength of the less-impacted Home Services, where revenue increased slightly compared to the second quarter of 2019. Yelp 2020 Q2
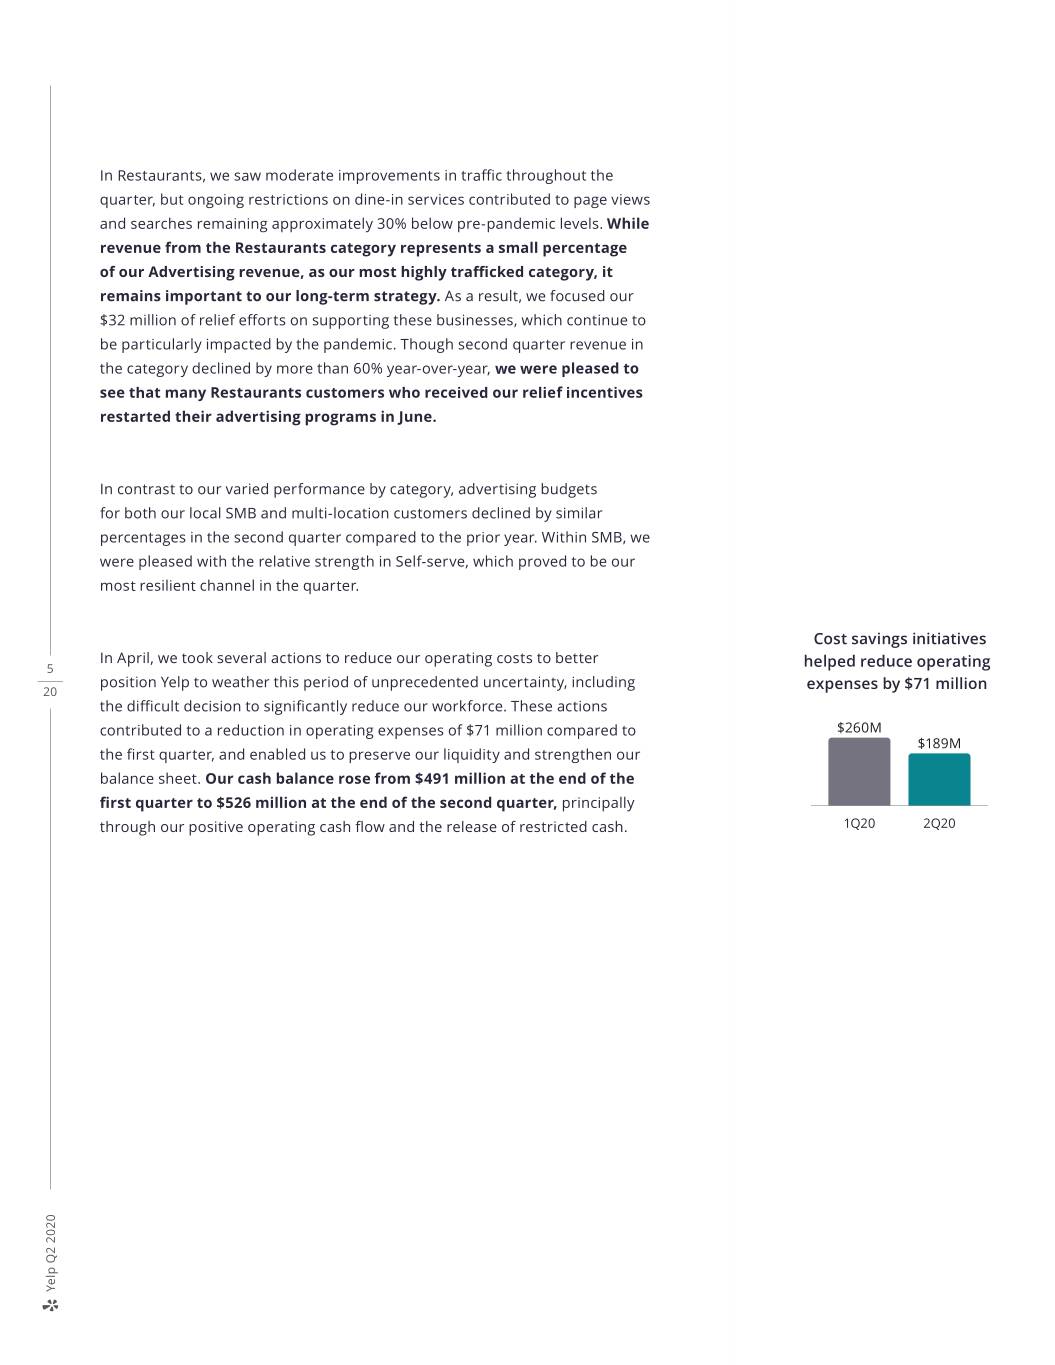
In Restaurants, we saw moderate improvements in traffic throughout the quarter, but ongoing restrictions on dine-in services contributed to page views and searches remaining approximately 30% below pre-pandemic levels. While revenue from the Restaurants category represents a small percentage of our Advertising revenue, as our most highly trafficked category, it remains important to our long-term strategy. As a result, we focused our $32 million of relief efforts on supporting these businesses, which continue to be particularly impacted by the pandemic. Though second quarter revenue in the category declined by more than 60% year-over-year, we were pleased to see that many Restaurants customers who received our relief incentives restarted their advertising programs in June. In contrast to our varied performance by category, advertising budgets for both our local SMB and multi-location customers declined by similar percentages in the second quarter compared to the prior year. Within SMB, we were pleased with the relative strength in Self-serve, which proved to be our most resilient channel in the quarter. Cost savings initiatives In April, we took several actions to reduce our operating costs to better 5 helped reduce operating position Yelp to weather this period of unprecedented uncertainty, including 20 expenses by $71 million the difficult decision to significantly reduce our workforce. These actions contributed to a reduction in operating expenses of $71 million compared to $260M $189M the first quarter, and enabled us to preserve our liquidity and strengthen our balance sheet. Our cash balance rose from $491 million at the end of the 207M first quarter to $526 million at the end of the second quarter, principally through our positive operating cash flow and the release of restricted cash. 1Q20 2Q20 Yelp 2020 Q2

Continuing to connect consumers with COVID-19 section now includes important health and great local businesses safety measures The local business landscape has changed dramatically since we began the year. In response, we quickly adapted our product efforts and operations to support our communities and to provide new tools for local businesses to connect with consumers in a socially distant world. Supporting consumers and local businesses during COVID-19 Providing consumers with the most up to date information on local businesses’ operations is critical to the success of both Yelp and the businesses we serve. Building on the initial success of the COVID-19 Banner Alert, we added a COVID-19 section to business pages, which allows business owners to post custom messages, update their service offerings to include virtual options, as well as list health and safety measures, including “Masks required for customers” and “Social distancing enforced.” We’ve seen rapid adoption, with more than 650,000 customized COVID-19 sections at the end of July. We also added an “Updated hours” feature to each business page, providing business owners with the ability 6 to communicate recent changes to their hours of operation with their 20 customers. As part of our COVID-19 relief initiative, we offered eligible businesses free Yelp Connect paying locations use of our Connect product. Connect enables local businesses to post social accelerated to nearly 10k in the quarter media-like updates, such as special menu items, to communicate with new and existing customers. At a time when communicating digitally is more prevalent than ever, we’ve been encouraged by the accelerated adoption of the product by both business owners and consumers. In fact, we saw a 275% increase in the number of business locations using Connect from March to May, which helped us reach nearly 10,000 paying locations at 1/20 2/20 3/20 4/20 5/20 6/20 the end of June. Yelp 2020 Q2
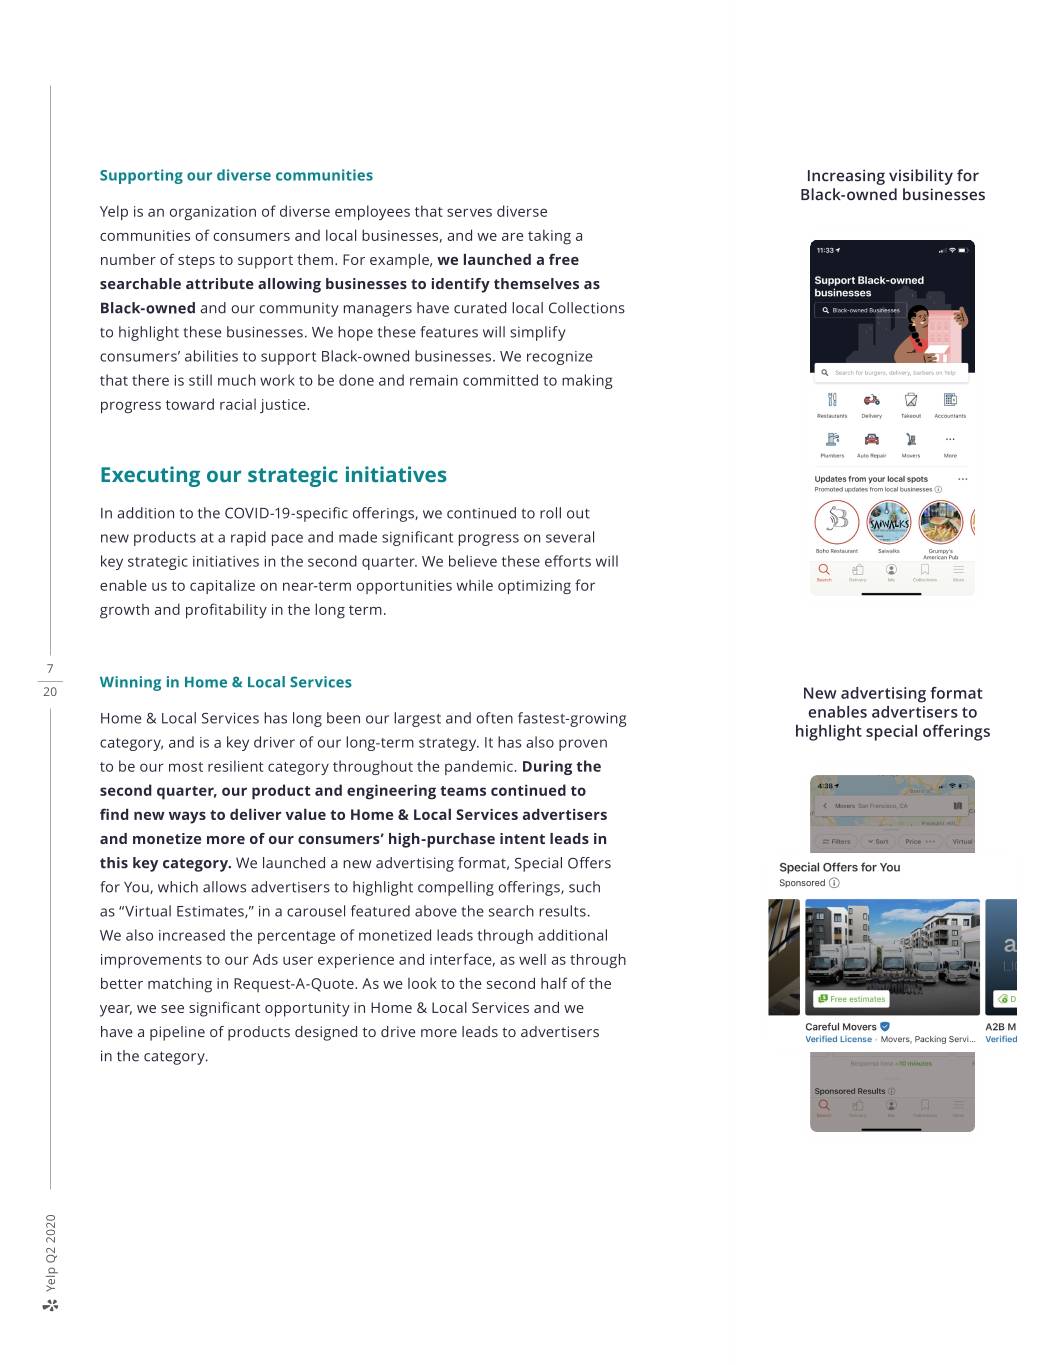
Supporting our diverse communities Increasing visibility for Black-owned businesses Yelp is an organization of diverse employees that serves diverse communities of consumers and local businesses, and we are taking a number of steps to support them. For example, we launched a free searchable attribute allowing businesses to identify themselves as Black-owned and our community managers have curated local Collections to highlight these businesses. We hope these features will simplify consumers’ abilities to support Black-owned businesses. We recognize that there is still much work to be done and remain committed to making progress toward racial justice. Executing our strategic initiatives In addition to the COVID-19-specific offerings, we continued to roll out new products at a rapid pace and made significant progress on several key strategic initiatives in the second quarter. We believe these efforts will enable us to capitalize on near-term opportunities while optimizing for growth and profitability in the long term. 7 Winning in Home & Local Services 20 New advertising format Home & Local Services has long been our largest and often fastest-growing enables advertisers to highlight special offerings category, and is a key driver of our long-term strategy. It has also proven to be our most resilient category throughout the pandemic. During the second quarter, our product and engineering teams continued to find new ways to deliver value to Home & Local Services advertisers and monetize more of our consumers’ high-purchase intent leads in this key category. We launched a new advertising format, Special Offers for You, which allows advertisers to highlight compelling offerings, such as “Virtual Estimates,” in a carousel featured above the search results. We also increased the percentage of monetized leads through additional improvements to our Ads user experience and interface, as well as through better matching in Request-A-Quote. As we look to the second half of the year, we see significant opportunity in Home & Local Services and we have a pipeline of products designed to drive more leads to advertisers in the category. Yelp 2020 Q2
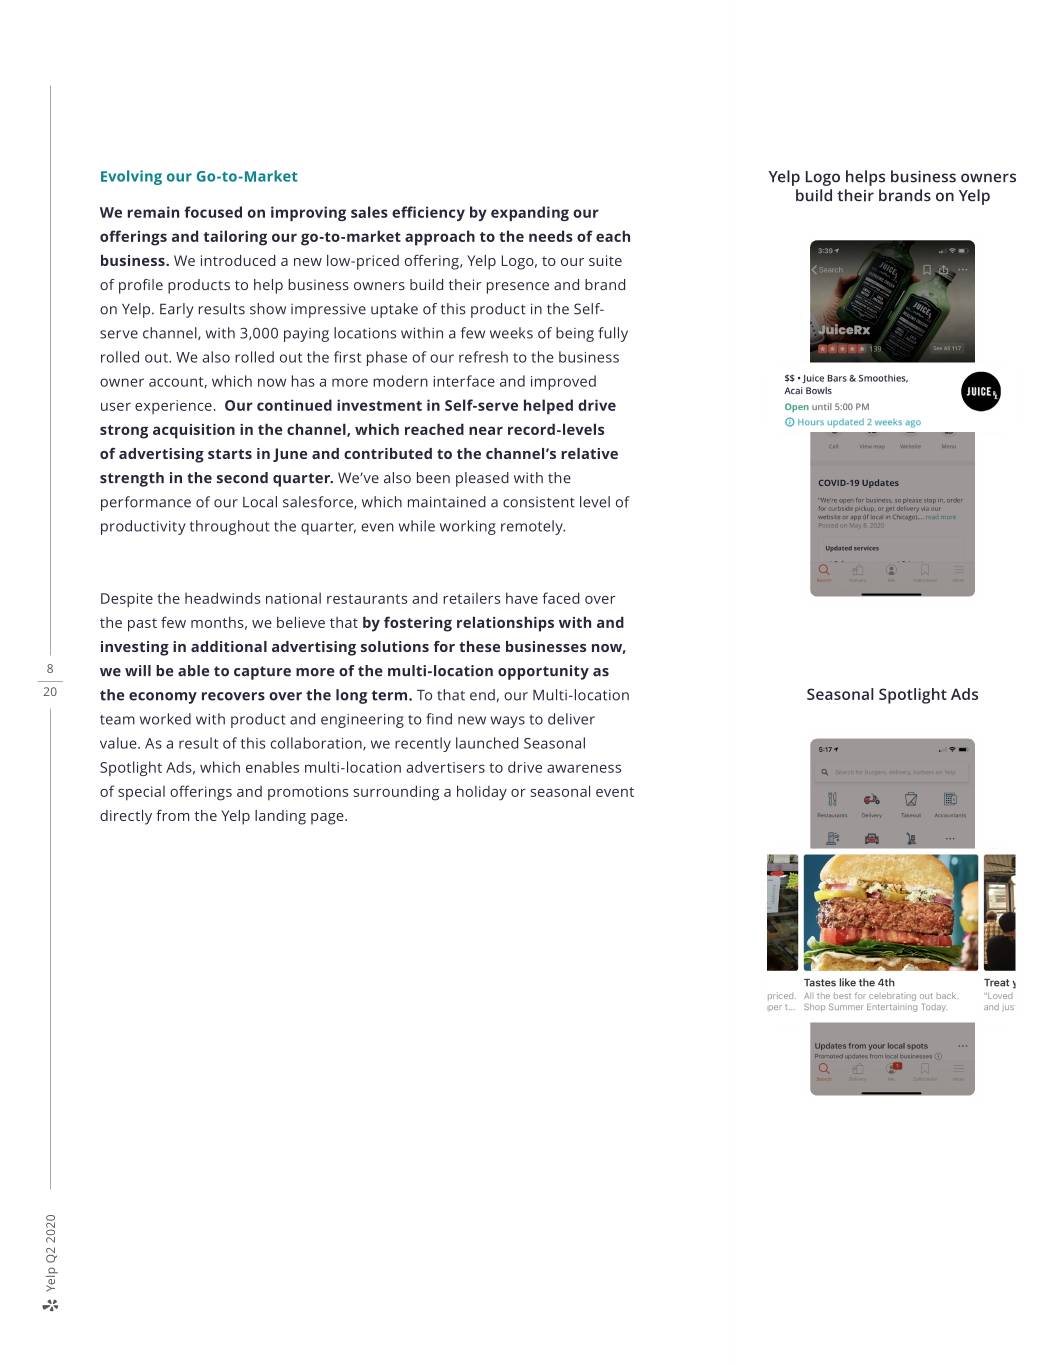
Evolving our Go-to-Market Yelp Logo helps business owners build their brands on Yelp We remain focused on improving sales efficiency by expanding our offerings and tailoring our go-to-market approach to the needs of each business. We introduced a new low-priced offering, Yelp Logo, to our suite of profile products to help business owners build their presence and brand on Yelp. Early results show impressive uptake of this product in the Self- serve channel, with 3,000 paying locations within a few weeks of being fully rolled out. We also rolled out the first phase of our refresh to the business owner account, which now has a more modern interface and improved user experience. Our continued investment in Self-serve helped drive strong acquisition in the channel, which reached near record-levels of advertising starts in June and contributed to the channel’s relative strength in the second quarter. We’ve also been pleased with the performance of our Local salesforce, which maintained a consistent level of productivity throughout the quarter, even while working remotely. Despite the headwinds national restaurants and retailers have faced over the past few months, we believe that by fostering relationships with and investing in additional advertising solutions for these businesses now, 8 we will be able to capture more of the multi-location opportunity as 20 the economy recovers over the long term. To that end, our Multi-location Seasonal Spotlight Ads team worked with product and engineering to find new ways to deliver value. As a result of this collaboration, we recently launched Seasonal Spotlight Ads, which enables multi-location advertisers to drive awareness of special offerings and promotions surrounding a holiday or seasonal event directly from the Yelp landing page. Yelp 2020 Q2
Investing for growth As we look ahead, the disciplined measures that we took in April to preserve our liquidity and reduce costs in the face of enormous uncertainty has positioned us well to capture growth opportunities as we move forward. After careful planning and thought, we are excited to complete the return of many of our remaining furloughed employees and restore reduced salaries in the second half of the year. At the same time, we expect to maintain a smaller and more productive Local sales team while retaining our product and engineering capacity. We believe this prudent reinvestment in our employees prepares us to reestablish our growth momentum and more efficiently capture demand as it returns, while giving our teams time to rekindle relationships with local business owners. Additionally, we plan to explore longer-term opportunities to optimize our location footprint as we expect more of our employees to work remotely more often. In summary, 9 20 While our business continues to face risk from fluctuating COVID-19 cases and the unpredictability of local governments’ reopening measures, we believe we will overcome these challenges by continuing to adapt and maintaining a rapid pace of product development to capture the opportunities that lie ahead. Our core mission—to connect consumers with great local businesses— is more important than ever and we remain confident in our ability to deliver shareholder value in the long term. Sincerely, Jeremy Stoppelman David Schwarzbach Yelp 2020 Q2

Second Quarter 2020 Financial Review Revenue Net revenue -32% Net revenue decreased to $169 million in the second quarter of 2020, a 32% decrease compared to the second quarter of 2019. $247M $169M Advertising revenue was $162 million in the second quarter of 2020, a 32% decrease from the second quarter of 2019, driven by the COVID-19 pandemic 2Q19 2Q20 and resulting shelter-in-place orders, which forced many of our customers to reduce their advertising budgets, particularly those in the restaurants and nightlife categories. We provided approximately $9 million in relief to customers in the second quarter, primarily in the form of waived advertising fees, which reduced net revenue. In addition, we paused certain advertising campaigns and offered certain free advertising products, collectively worth $15 million. 10 20 Transactions revenue was $4 million in the second quarter of 2020, up 26% from the second quarter of 2019, due to increases in food take-out and delivery orders as a result of the COVID-19 pandemic, which forced many restaurants to close for dine-in services and provide take-out and delivery services only. Other services revenue was $3 million in the second quarter of 2020, down 53% from the second quarter of 2019, primarily as a result of approximately $5 million in relief that we provided to customers in the second quarter of 2020, mainly in the form of waived fees. Three Months Ended June 30, Six Months Ended June 30, 2020 2019 2020 2019 Net revenue by product Advertising $ 162,233 $ 237,842 $ 402,326 $ 464,875 Transactions 3,968 3,147 6,607 6,454 Other services 2,829 5,966 9,998 11,568 Total net revenue $ 169,030 $ 246,955 $ 418,931 $ 482,897 Yelp 2020 Q2

Operating expenses, Net loss & Adjusted EBITDA Cost of revenue (exclusive of depreciation and amortization) was $12 COR % of Revenue million in the second quarter of 2020, down $3 million, or 21%, compared to the second quarter of 2019, driven by lower website infrastructure expense 6% 7% resulting from lower traffic, and lower merchant credit card fees due to the reduction in Net revenue. 2Q19 2Q20 Sales and marketing expenses totaled $96 million in the second quarter of S&M % of Revenue 2020, down 21% from the second quarter of 2019. The decrease in expenses was driven by a decrease in employee costs, primarily due to lower sales 57% 49% headcount as a result of the restructuring plan, as well as a decrease in workplace operating costs due to office closures that began in March. 2Q19 2Q20 Product development expenses were $54 million in the second quarter of 2020, relatively consistent with the second quarter of 2019, as the impact of increased headcount was offset by the impact of reduced-hour work weeks as PD % of Revenue part of the restructuring plan. However, product development expenses were down 20% compared to the first quarter of 2020 as a result of the reduced- 32% 22% 11 hour work weeks. 20 2Q19 2Q20 General and administrative expenses were $26 million in the second quarter of 2020, down 15% compared to the second quarter of 2019, primarily due to a decrease in employee and consulting costs following the restructuring G&A % of Revenue plan, as well as a decrease in workplace operating costs from office closures at the beginning of the second quarter. These were partially offset by an increase 16% in provision for doubtful accounts resulting from an anticipated increase in the 13% rate of customer delinquencies associated with the COVID-19 pandemic. 2Q19 2Q20 Restructuring costs were $3 million in the second quarter of 2020 as a result of the restructuring plan announced on April 9, 2020. These costs include severance, payroll taxes and related benefit costs for the workforce reduction affecting approximately 1,000 employees. Costs associated with employees placed on furlough and employees on reduced-hour work weeks were included as part of normal operating expenses. Yelp 2020 Q2

Total costs and expenses were $204 million in the second quarter of 2020, down 13% from $235 million in the second quarter of 2019. Income tax benefit was $11 million in the second quarter of 2020, compared to a $4 million expense in the second quarter of 2019. The increase in the Net income (loss) benefit from income taxes was primarily due to year-to-date pre-tax losses -295% and benefits from net operating loss carryback provisions adopted under the $12M Coronavirus Aid, Relief and Economic Security Act (the “CARES Act”). ($24M) Net loss was ($24) million in the second quarter of 2020 compared to Net 2Q19 2Q20 income of $12 million in the second quarter of 2019. Adjusted EBITDA was $11 million in the second quarter of 2020, an 80% Adjusted EBITDA decrease from $55 million in the second quarter of 2019. Adjusted EBITDA -80% margin declined to 7% in the second quarter of 2020 compared with 22% in the $55M year-ago quarter, driven by a greater decrease in revenue as compared to total costs and expenses recorded in the prior year. $11M 12 22% 7% Margin 20 2Q19 2Q20 Balance sheet and cash flow At the end of June 2020, we held $526 million in Cash and cash equivalents on our condensed consolidated balance sheet, with no debt. Yelp 2020 Q2
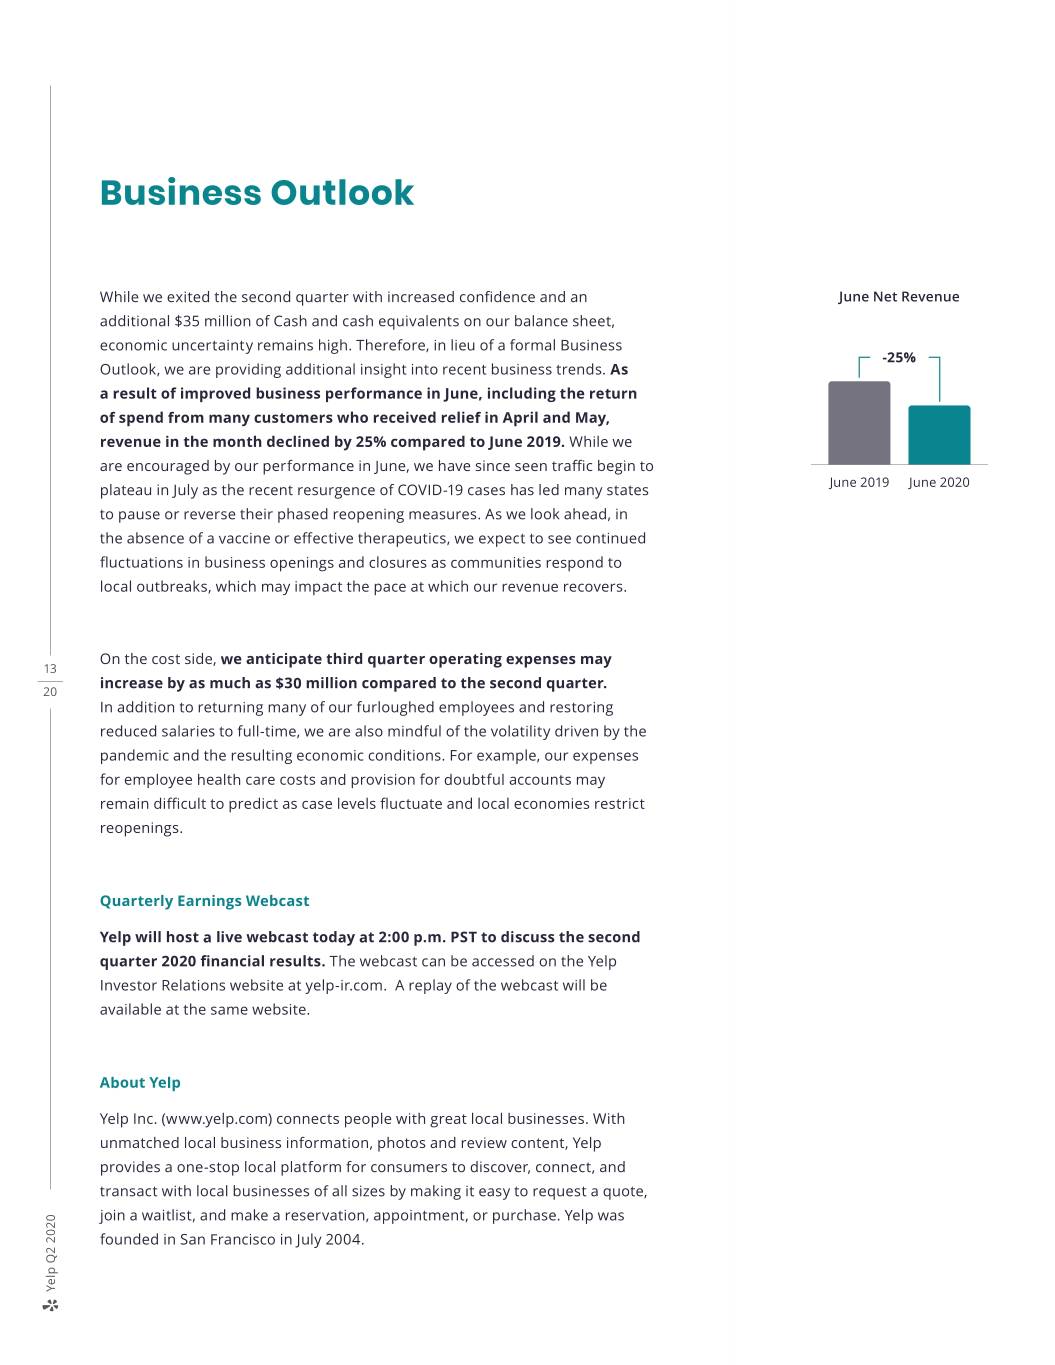
Business Outlook While we exited the second quarter with increased confidence and an June Net Revenue additional $35 million of Cash and cash equivalents on our balance sheet, economic uncertainty remains high. Therefore, in lieu of a formal Business -25% Outlook, we are providing additional insight into recent business trends. As a result of improved business performance in June, including the return of spend from many customers who received relief in April and May, 60m revenue in the month declined by 25% compared to June 2019. While we are encouraged by our performance in June, we have since seen traffic begin to June 2019 June 2020 plateau in July as the recent resurgence of COVID-19 cases has led many states to pause or reverse their phased reopening measures. As we look ahead, in the absence of a vaccine or effective therapeutics, we expect to see continued fluctuations in business openings and closures as communities respond to local outbreaks, which may impact the pace at which our revenue recovers. On the cost side, we anticipate third quarter operating expenses may 13 increase by as much as $30 million compared to the second quarter. 20 In addition to returning many of our furloughed employees and restoring reduced salaries to full-time, we are also mindful of the volatility driven by the pandemic and the resulting economic conditions. For example, our expenses for employee health care costs and provision for doubtful accounts may remain difficult to predict as case levels fluctuate and local economies restrict reopenings. Quarterly Earnings Webcast Yelp will host a live webcast today at 2:00 p.m. PST to discuss the second quarter 2020 financial results.The webcast can be accessed on the Yelp Investor Relations website at yelp-ir.com. A replay of the webcast will be available at the same website. About Yelp Yelp Inc. (www.yelp.com) connects people with great local businesses. With unmatched local business information, photos and review content, Yelp provides a one-stop local platform for consumers to discover, connect, and transact with local businesses of all sizes by making it easy to request a quote, join a waitlist, and make a reservation, appointment, or purchase. Yelp was founded in San Francisco in July 2004. Yelp 2020 Q2

Condensed Consolidated Balance Sheets (In thousands; unaudited) June 30, December 31, 2020 2019 Assets Current assets: Cash and cash equivalents $ 525,693 $ 170,281 Short-term marketable securities - 242,000 Accounts receivable, net 72,025 106,832 Prepaid expenses and other current assets 19,675 14,196 Total current assets 617,393 533,309 Long-term marketable securities - 53,499 Property, equipment and software, net 106,732 110,949 Operating lease right-of-use assets 188,266 197,866 Goodwill 104,796 104,589 Intangibles, net 8,733 10,082 Restricted cash 910 22,037 Other non-current assets 46,655 38,369 14 Total assets $ 1,073,485 $ 1,070,700 20 Liabilities and Stockholders’ Equity Current liabilities: Accounts payable and accrued liabilities $ 60,206 $ 72,333 Operating lease liabilities - current 56,406 57,507 Deferred revenue 3,918 4,315 Total current liabilities 120,530 134,155 Operating lease liabilities - long-term 164,537 174,756 Other long-term liabilities 7,098 6,798 Total liabilities 292,165 315,709 Stockholders’ equity Common stock – – Additional paid-in capital 1,325,745 1,259,803 Accumulated other comprehensive loss (11,845) (11,759) Accumulated deficit (532,580) (493,053) Total stockholders' equity 781,320 754,991 Total liabilities and stockholders' equity $ 1,073,485 $ 1,070,700 Yelp 2020 Q2

Condensed Consolidated Statements of Operations (In thousands, except per share data; unaudited) Three Months Ended June 30, Six Months Ended June 30, 2020 2019 2020 2019 Net revenue $ 169,030 $ 246,955 $ 418,931 $ 482,897 Costs and expenses: Cost of revenue1 11,825 14,975 28,672 29,240 Sales and marketing1 96,289 122,045 233,586 246,361 Product development1 53,969 54,566 121,082 112,641 General and administrative1 26,402 30,932 69,938 62,224 Depreciation and amortization 12,582 12,240 24,940 24,116 Restructuring 3,312 - 3,312 - Total costs and expenses 204,379 234,758 481,530 474,582 (Loss) income from operations (35,349) 12,197 (62,599) 8,315 Other income, net 495 3,891 2,878 8,582 (Loss) income before income taxes (34,854) 16,088 (59,721) 16,897 (Benefit from) provision for income taxes (10,864) 3,785 (20,228) 3,229 15 Net (loss) income attributable to $ (23,990) $ 12,303 $ (39,493) $ 13,668 20 common stockholders Net (loss) income per share attributable to common stockholders: Basic $ (0.33) $ 0.16 $ (0.55) $ 0.17 Diluted $ (0.33) $ 0.16 $ (0.55) $ 0.17 Weighted-average shares used to compute net (loss) income per share attributable to common stockholders: Basic 72,413 75,601 71,980 78,620 Diluted 72,413 78,530 71,980 81,742 1Includes stock-based compensation expense as follows: Three Months Ended June 30, Six Months Ended June 30, 2020 2019 2020 2019 Cost of revenue $ 943 $ 1,118 $ 1,986 $ 2,361 Sales and marketing 7,302 7,774 14,998 15,461 Product development 16,827 15,247 34,582 31,322 General and administrative 5,513 6,313 10,769 12,626 Total stock-based compensation $ 30,585 $ 30,452 $ 62,335 $ 61,770 Yelp 2020 Q2

Condensed Consolidated Statements of Cash Flows (In thousands; unaudited) Six Months Ended June 30, 2020 2019 Operating activities Net (loss) income attributable to common stockholders $ (39,493) 13,668 Adjustments to reconcile net (loss) income to net cash provided by operating activities: Depreciation and amortization 24,940 24,116 Provision for doubtful accounts 21,897 8,716 Stock-based compensation 62,335 61,770 Non-cash lease cost 20,984 21,433 Deferred income taxes (14,263) (1,912) Other adjustments, net 876 (1,632) Changes in operating assets and liabilities: Accounts receivable 12,910 (17,143) Prepaid expenses and other assets 604 (5,335) Operating lease liabilities (22,520) (20,299) Accounts payable, accrued liabilities and other liabilities (11,021) 14,464 16 Net cash provided by operating activities 57,249 97,846 20 Investing activities Sales and maturities of marketable securities - available-for-sale 290,395 - Purchases of marketable securities - held-to-maturity (87,438) (289,100) Maturities of marketable securities - held-to-maturity 93,200 397,197 Release of escrow deposit - 28,750 Purchases of property, equipment and software (17,004) (19,214) Other investing activities 328 276 Net cash provided by investing activities 279,481 117,909 Financing activities Proceeds from issuance of common stock for employee stock-based plans 10,808 11,198 Repurchases of common stock - (397,613) Taxes paid related to net share settlement of equity awards (12,557) (22,605) Other financing activities (356) - Net cash used in financing activities (2,105) (409,020) Effect of exchange rate changes on cash, cash equivalents and restricted cash (340) (24) Change in cash, cash equivalents and restricted cash 334,285 (193,289) Cash, cash equivalents and restricted cash - Beginning of period 192,318 354,835 Cash, cash equivalents and restricted cash - End of period $ 526,603 $ 161,546 Yelp 2020 Q2
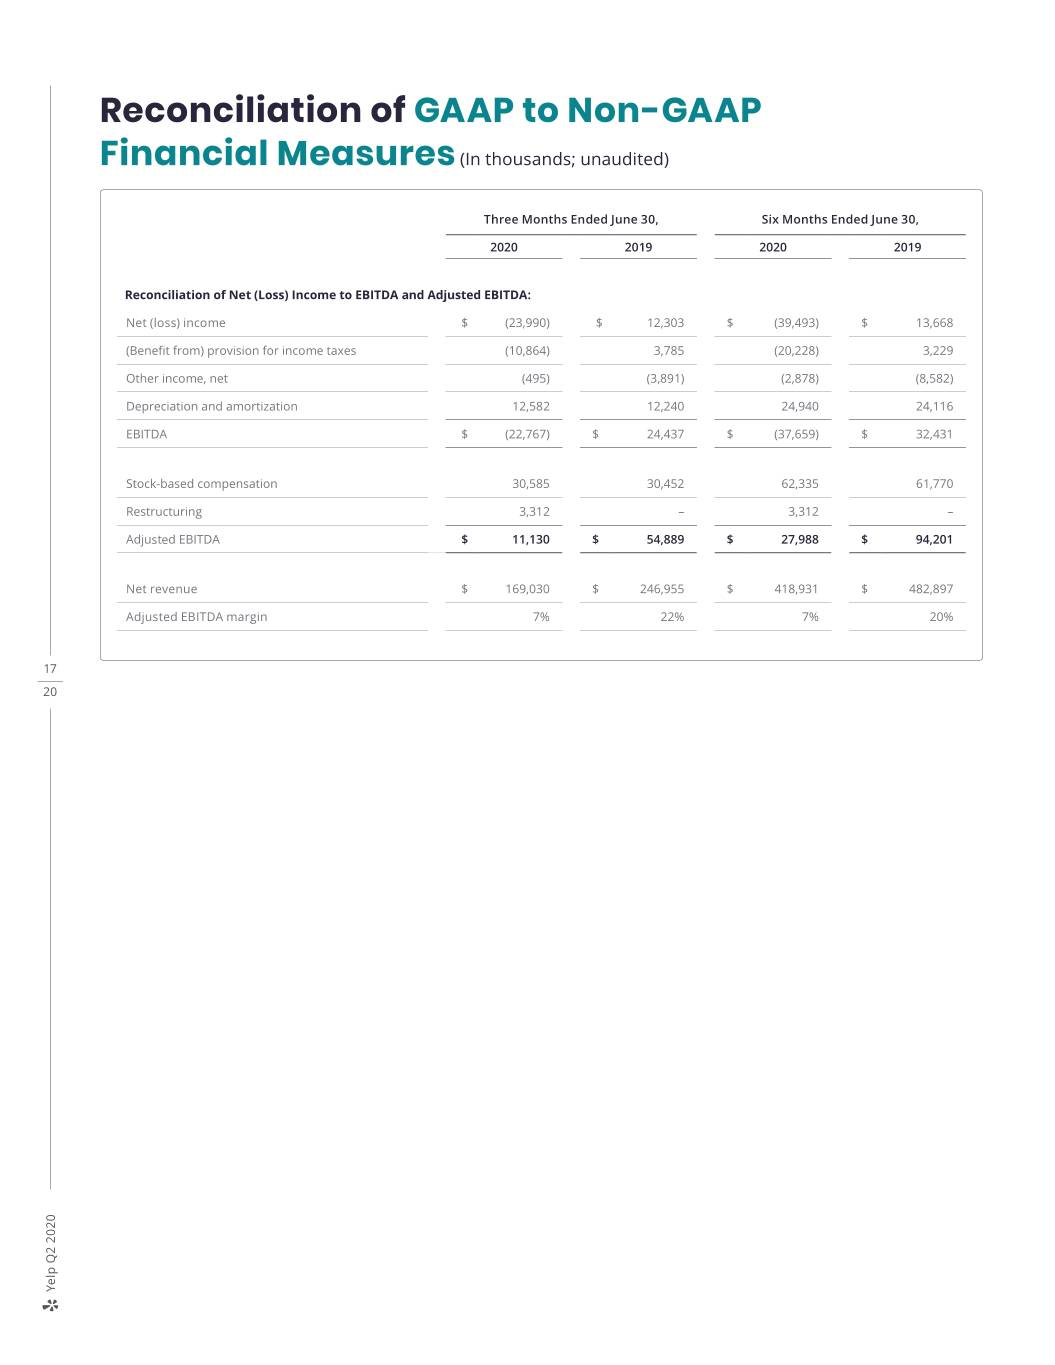
Reconciliation of GAAP to Non-GAAP Financial Measures (In thousands; unaudited) Three Months Ended June 30, Six Months Ended June 30, 2020 2019 2020 2019 Reconciliation of Net (Loss) Income to EBITDA and Adjusted EBITDA: Net (loss) income $ (23,990) $ 12,303 $ (39,493) $ 13,668 (Benefit from) provision for income taxes (10,864) 3,785 (20,228) 3,229 Other income, net (495) (3,891) (2,878) (8,582) Depreciation and amortization 12,582 12,240 24,940 24,116 EBITDA $ (22,767) $ 24,437 $ (37,659) $ 32,431 Stock-based compensation 30,585 30,452 62,335 61,770 Restructuring 3,312 – 3,312 – Adjusted EBITDA $ 11,130 $ 54,889 $ 27,988 $ 94,201 Net revenue $ 169,030 $ 246,955 $ 418,931 $ 482,897 Adjusted EBITDA margin 7% 22% 7% 20% 17 20 Yelp 2020 Q2
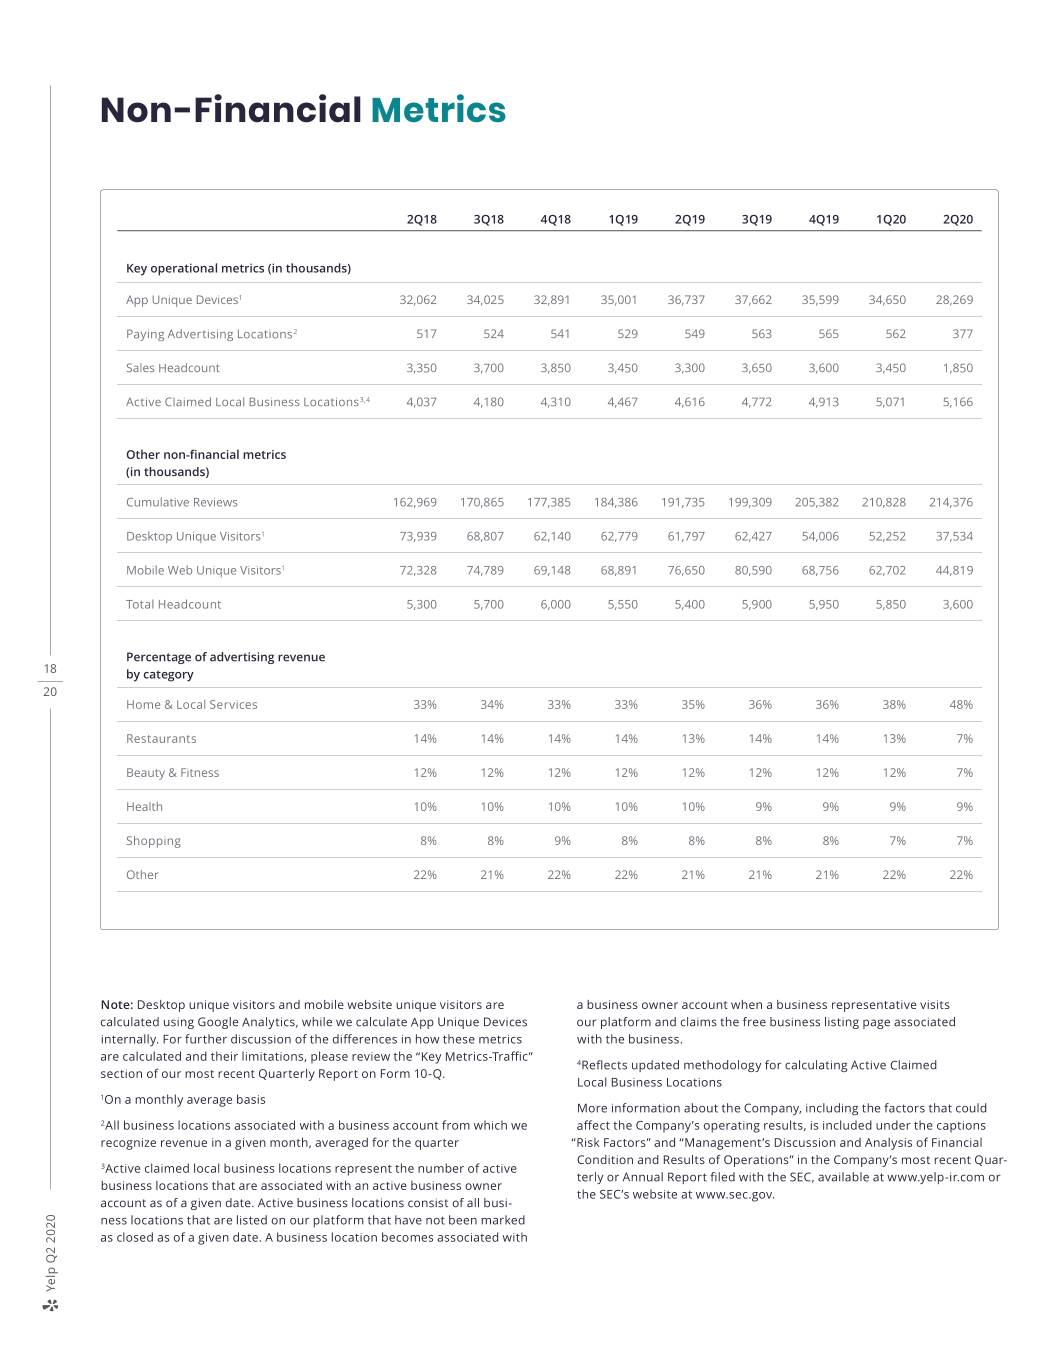
Non-Financial Metrics 2Q18 3Q18 4Q18 1Q19 2Q19 3Q19 4Q19 1Q20 2Q20 Key operational metrics (in thousands) App Unique Devices1 32,062 34,025 32,891 35,001 36,737 37,662 35,599 34,650 28,269 Paying Advertising Locations2 517 524 541 529 549 563 565 562 377 Sales Headcount 3,350 3,700 3,850 3,450 3,300 3,650 3,600 3,450 1,850 Active Claimed Local Business Locations3,4 4,037 4,180 4,310 4,467 4,616 4,772 4,913 5,071 5,166 Other non-financial metrics (in thousands) Cumulative Reviews 162,969 170,865 177,385 184,386 191,735 199,309 205,382 210,828 214,376 Desktop Unique Visitors1 73,939 68,807 62,140 62,779 61,797 62,427 54,006 52,252 37,534 Mobile Web Unique Visitors1 72,328 74,789 69,148 68,891 76,650 80,590 68,756 62,702 44,819 Total Headcount 5,300 5,700 6,000 5,550 5,400 5,900 5,950 5,850 3,600 Percentage of advertising revenue 18 by category 20 Home & Local Services 33% 34% 33% 33% 35% 36% 36% 38% 48% Restaurants 14% 14% 14% 14% 13% 14% 14% 13% 7% Beauty & Fitness 12% 12% 12% 12% 12% 12% 12% 12% 7% Health 10% 10% 10% 10% 10% 9% 9% 9% 9% Shopping 8% 8% 9% 8% 8% 8% 8% 7% 7% Other 22% 21% 22% 22% 21% 21% 21% 22% 22% Note: Desktop unique visitors and mobile website unique visitors are a business owner account when a business representative visits calculated using Google Analytics, while we calculate App Unique Devices our platform and claims the free business listing page associated internally. For further discussion of the differences in how these metrics with the business. are calculated and their limitations, please review the “Key Metrics-Traffic” 4Reflects updated methodology for calculating Active Claimed section of our most recent Quarterly Report on Form 10-Q. Local Business Locations 1On a monthly average basis More information about the Company, including the factors that could 2All business locations associated with a business account from which we affect the Company’s operating results, is included under the captions recognize revenue in a given month, averaged for the quarter “Risk Factors” and “Management’s Discussion and Analysis of Financial Condition and Results of Operations” in the Company’s most recent Quar- 3Active claimed local business locations represent the number of active terly or Annual Report filed with the SEC, available at www.yelp-ir.com or business locations that are associated with an active business owner the SEC’s website at www.sec.gov. account as of a given date. Active business locations consist of all busi- ness locations that are listed on our platform that have not been marked as closed as of a given date. A business location becomes associated with Yelp 2020 Q2
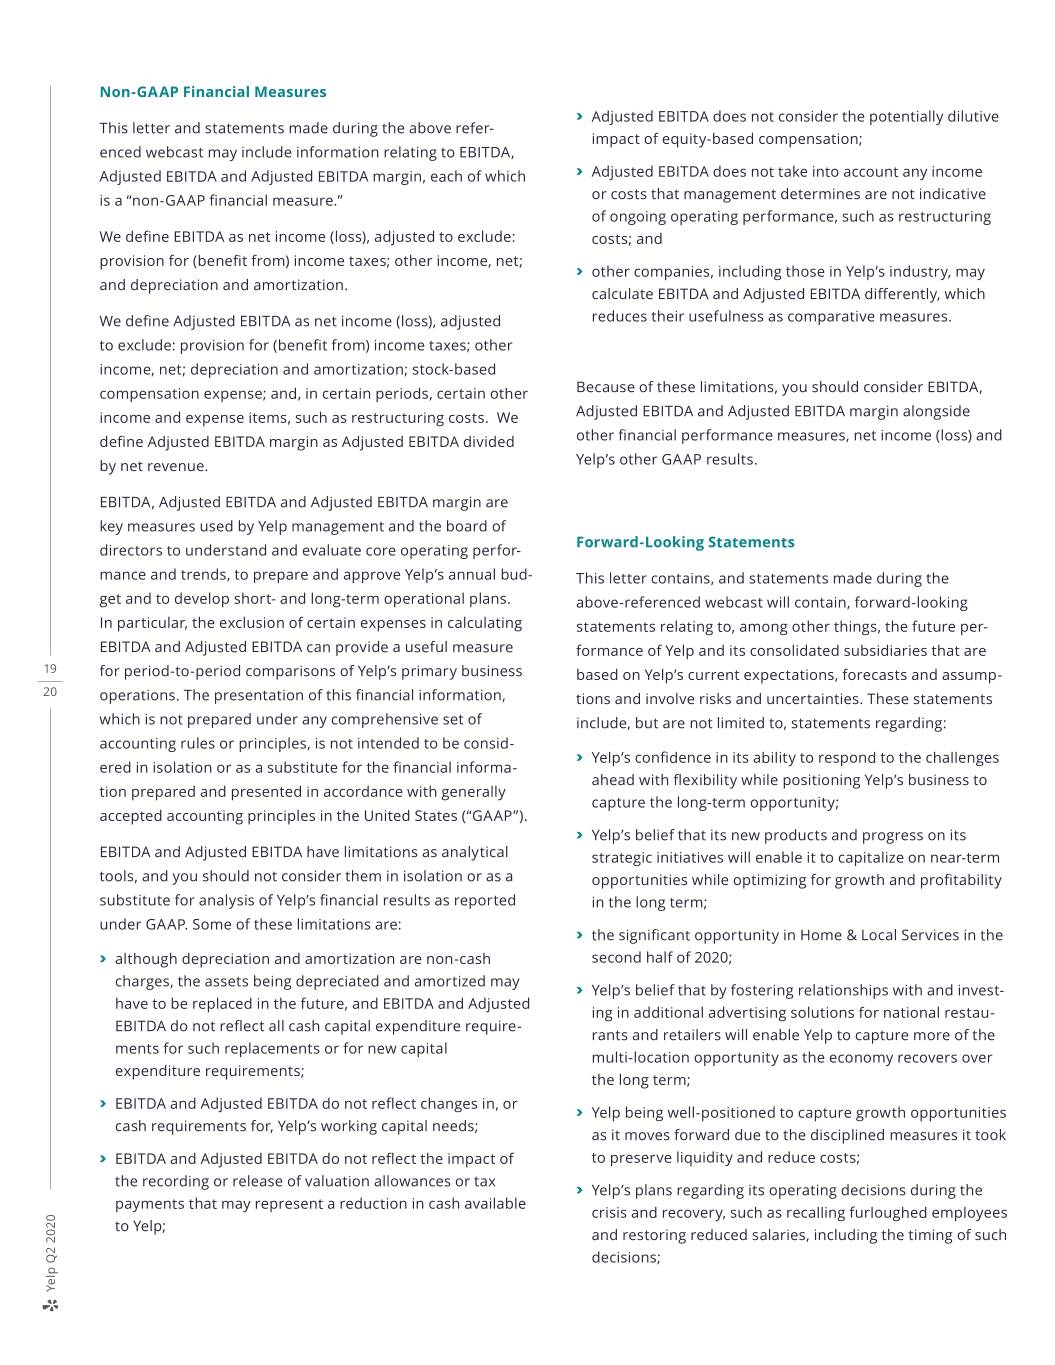
Non-GAAP Financial Measures Adjusted EBITDA does not consider the potentially dilutive This letter and statements made during the above refer- > impact of equity-based compensation; enced webcast may include information relating to EBITDA, Adjusted EBITDA and Adjusted EBITDA margin, each of which > Adjusted EBITDA does not take into account any income is a “non-GAAP financial measure.” or costs that management determines are not indicative of ongoing operating performance, such as restructuring We define EBITDA as net income (loss), adjusted to exclude: costs; and provision for (benefit from) income taxes; other income, net; > other companies, including those in Yelp’s industry, may and depreciation and amortization. calculate EBITDA and Adjusted EBITDA differently, which We define Adjusted EBITDA as net income (loss), adjusted reduces their usefulness as comparative measures. to exclude: provision for (benefit from) income taxes; other income, net; depreciation and amortization; stock-based compensation expense; and, in certain periods, certain other Because of these limitations, you should consider EBITDA, income and expense items, such as restructuring costs. We Adjusted EBITDA and Adjusted EBITDA margin alongside define Adjusted EBITDA margin as Adjusted EBITDA divided other financial performance measures, net income (loss) and by net revenue. Yelp’s other GAAP results. EBITDA, Adjusted EBITDA and Adjusted EBITDA margin are key measures used by Yelp management and the board of Forward-Looking Statements directors to understand and evaluate core operating perfor- mance and trends, to prepare and approve Yelp’s annual bud- This letter contains, and statements made during the get and to develop short- and long-term operational plans. above-referenced webcast will contain, forward-looking In particular, the exclusion of certain expenses in calculating statements relating to, among other things, the future per- EBITDA and Adjusted EBITDA can provide a useful measure formance of Yelp and its consolidated subsidiaries that are 19 for period-to-period comparisons of Yelp’s primary business based on Yelp’s current expectations, forecasts and assump- 20 operations. The presentation of this financial information, tions and involve risks and uncertainties. These statements which is not prepared under any comprehensive set of include, but are not limited to, statements regarding: accounting rules or principles, is not intended to be consid- Yelp’s confidence in its ability to respond to the challenges ered in isolation or as a substitute for the financial informa- > ahead with flexibility while positioning Yelp’s business to tion prepared and presented in accordance with generally capture the long-term opportunity; accepted accounting principles in the United States (“GAAP”). > Yelp’s belief that its new products and progress on its EBITDA and Adjusted EBITDA have limitations as analytical strategic initiatives will enable it to capitalize on near-term tools, and you should not consider them in isolation or as a opportunities while optimizing for growth and profitability substitute for analysis of Yelp’s financial results as reported in the long term; under GAAP. Some of these limitations are: > the significant opportunity in Home & Local Services in the > although depreciation and amortization are non-cash second half of 2020; charges, the assets being depreciated and amortized may > Yelp’s belief that by fostering relationships with and invest- have to be replaced in the future, and EBITDA and Adjusted ing in additional advertising solutions for national restau- EBITDA do not reflect all cash capital expenditure require- rants and retailers will enable Yelp to capture more of the ments for such replacements or for new capital multi-location opportunity as the economy recovers over expenditure requirements; the long term; > EBITDA and Adjusted EBITDA do not reflect changes in, or > Yelp being well-positioned to capture growth opportunities cash requirements for, Yelp’s working capital needs; as it moves forward due to the disciplined measures it took > EBITDA and Adjusted EBITDA do not reflect the impact of to preserve liquidity and reduce costs; the recording or release of valuation allowances or tax > Yelp’s plans regarding its operating decisions during the payments that may represent a reduction in cash available crisis and recovery, such as recalling furloughed employees to Yelp; and restoring reduced salaries, including the timing of such decisions; Yelp 2020 Q2

> Yelp’s plans to maintain a smaller Local sales team while > potential strategic opportunities and Yelp’s ability to maintaining its product and engineering capacity; successfully manage the acquisition and integration of new businesses, solutions or technologies, as well as to Yelp’s plans to explore longer-term opportunities to opti- > monetize the acquired products, solutions or technologies; mize its location footprint and the expectation that more of its employees will work remotely more often; > Yelp’s reliance on traffic to its website from search engines like Google and Bing and the quality and reliability of such Yelp’s belief that it will overcome the challenges associ- > traffic; ated with the COVID-19 pandemic by continuing to adapt and maintaining a rapid pace of innovation to capture the > maintaining a strong brand and managing negative opportunities that lie ahead; publicity that may arise; and > Yelp’s belief that prudent reinvestment in its employees > Yelp’s ability to timely upgrade and develop its systems, prepares it to reestablish its growth momentum and more infrastructure and customer service capabilities. efficiently capture demand; Factors that could cause or contribute to such differences > Yelp’s confidence that it can deliver shareholder value in also include, but are not limited to, those factors that could the long term; affect Yelp’s business, operating results and stock price > Yelp’s expectations regarding third quarter operating included under the captions “Risk Factors” and “Manage- expenses; ment’s Discussion and Analysis of Financial Condition and Results of Operations” in Yelp’s most recent Annual Report on > Yelp’s expectation, in the absence of a vaccine or therapeutics, of continued fluctuations in business Form 10-K or Quarterly Report on Form 10-Q at http://www. openings and closures, which may impact the pace at yelp-ir.com or the SEC’s website at www.sec.gov. which revenue recovers; and > Yelp’s expectation that bringing back trained sales reps will Undue reliance should not be placed on the forward-looking allow it to capture growth opportunities. statements in this letter or the above-referenced webcast, 20 which are based on information available to Yelp on the date 20 Yelp’s actual results could differ materially from those pre- hereof. Such forward-looking statements do not include the dicted or implied by such forward-looking statements and potential impact of any acquisitions or divestitures that may reported results should not be considered as an indication of be announced and/or completed after the date hereof. Yelp future performance. Factors that could cause or contribute to assumes no obligation to update such statements. such differences include, but are not limited to: > The impact of fears or actual outbreaks of disease, includ- ing COVID-19, and any resulting changes in consumer behavior, economic conditions or governmental actions; > maintaining and expanding Yelp’s base of advertisers, particularly as many businesses reduce spending on adver- tising as a result of closures or operating restrictions in connection with the COVID-19 pandemic; > Yelp’s limited operating history in an evolving industry; > Yelp’s ability to generate sufficient revenue to regain profit- ability, particularly in light of the ongoing impact of COVID- 19 and Yelp’s relief initiatives; > Yelp’s ability to generate and maintain sufficient high quality content from its users; Yelp 2020 Q2


