Q1 2021 Letter to Shareholders May 6, 2021 | yelp-ir.com
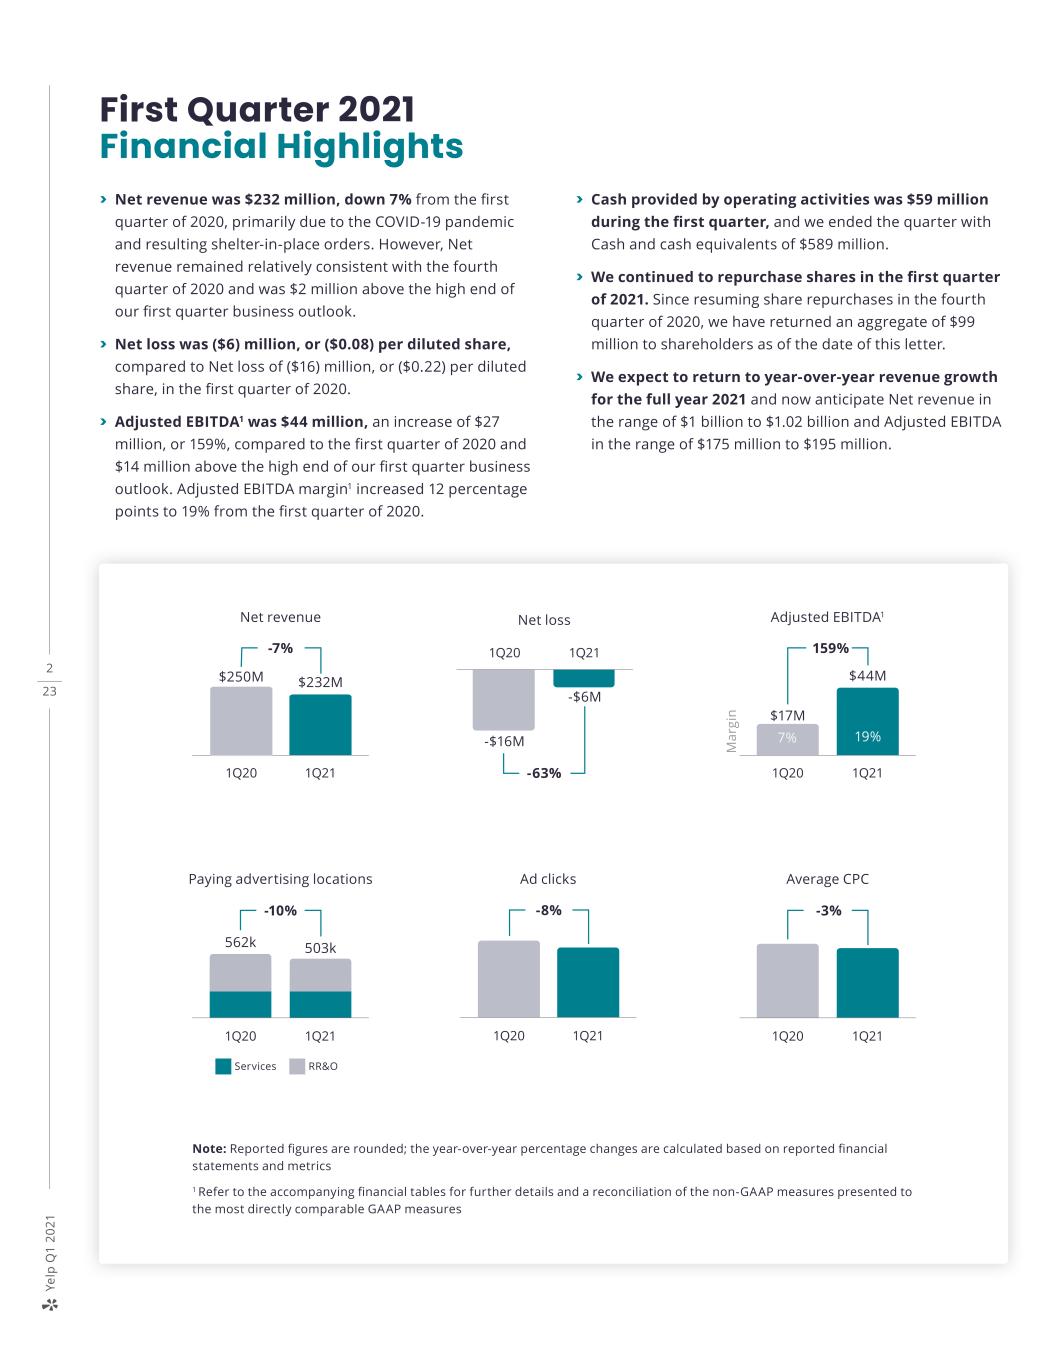
2 23 Ye lp Q 1 2 0 21 First Quarter 2021 Financial Highlights > Net revenue was $232 million, down 7% from the first quarter of 2020, primarily due to the COVID-19 pandemic and resulting shelter-in-place orders. However, Net revenue remained relatively consistent with the fourth quarter of 2020 and was $2 million above the high end of our first quarter business outlook. > Net loss was ($6) million, or ($0.08) per diluted share, compared to Net loss of ($16) million, or ($0.22) per diluted share, in the first quarter of 2020. > Adjusted EBITDA1 was $44 million, an increase of $27 million, or 159%, compared to the first quarter of 2020 and $14 million above the high end of our first quarter business outlook. Adjusted EBITDA margin1 increased 12 percentage points to 19% from the first quarter of 2020. Note: Reported figures are rounded; the year-over-year percentage changes are calculated based on reported financial statements and metrics 1 Refer to the accompanying financial tables for further details and a reconciliation of the non-GAAP measures presented to the most directly comparable GAAP measures > Cash provided by operating activities was $59 million during the first quarter, and we ended the quarter with Cash and cash equivalents of $589 million. > We continued to repurchase shares in the first quarter of 2021. Since resuming share repurchases in the fourth quarter of 2020, we have returned an aggregate of $99 million to shareholders as of the date of this letter. > We expect to return to year-over-year revenue growth for the full year 2021 and now anticipate Net revenue in the range of $1 billion to $1.02 billion and Adjusted EBITDA in the range of $175 million to $195 million. 1Q20 1Q21 Ad clicks -8% 1Q20 1Q21 Average CPC -3% Net revenue 1Q20 $250M -7% $232M 1Q21 M ar gi n 1Q20 1Q21 Adjusted EBITDA1 159% $44M $17M 19%7% Net loss 1Q211Q20 -63% -$16M -$6M 1Q20 1Q21 Paying advertising locations 562k -10% 503k RR&OServices

3 23 Ye lp Q 1 2 0 21 Our results for the quarter ended March 31, 2021 — a date approximately one year after the COVID-19 outbreak was declared a global pandemic — demonstrate a strong start to our plan for the year, underscored by the consistent execution of our teams and the resilience of our business. They also reflect the success of our go-to-market mix shift and increased focus on product innovation, which are the foundation for our next stage of growth. Building from that foundation, our strategic initiatives gained momentum in the first quarter: we again achieved sequential and year-over-year increases in revenue from both our Services categories and Self-serve channel as well as in our retention rate of non-term advertisers’ budgets (our “NTC retention rate”). At the same time, recovery in local economies and the increased vaccination rate benefited businesses in our more impacted Restaurants, Retail & Other categories. As a result, we saw demand from these businesses increase over the course of the first quarter. These trends, together with the structural changes we’ve made to our business over the past year, position us well to benefit from economic recovery and return to sustainable growth. Dear fellow shareholders, Our first quarter results demonstrate a strong start to the year 1Q20 3Q20 4Q202Q20 1Q21 -7% Net Revenue

4 23 Ye lp Q 1 2 0 21 Q1 results We saw improving trends across the business over the course of the first quarter. Product innovation drove continued strength in our Self- serve channel and Services categories. As COVID-19 cases declined and restrictions eased, consumer traffic increased and our Restaurants, Retail & Other categories showed signs of recovery as the quarter progressed. Advertiser demand increased steadily over the first quarter as a result of these trends, which together with a record NTC retention rate enabled us to deliver $232 million of Net revenue. On the consumer side of our business, similar to last summer, App Unique Devices rebounded as pandemic-related restrictions eased over the course of the quarter, reaching 32 million in the month of March compared to 29 million in the month of January. Diners seated via Yelp increased by nearly 20% from the fourth quarter, while the year- over-year decline improved from (43%) in the fourth quarter to (24%) in the first quarter. These diner trends were even stronger in states where restrictions on dine-in services had been significantly relaxed, such as Texas and Arizona. We also continued to see robust interest in pick up and delivery orders on Yelp. To help our restaurant partners meet this increased demand, we rolled out a new takeout management tool for Yelp Waitlist. On the business side, our product investments continued to drive positive results in the first quarter, particularly in our areas of strategic focus. Building on the strong year-over-year retention improvements in the second half of 2020 resulting from ad platform enhancements, we achieved a record NTC retention rate in the first quarter, which increased by more than 20% year over year in January and February. While the NTC retention rate remained just as strong in March, the year-over-year comparison is less meaningful due to the impact of the COVID-19 pandemic in March 2020. We rolled out a new takeout management tool to Yelp Waitlist Jan 21 App Unique Devices reached 32M in March Feb 21 Mar 21 *Monthly average for 1Q21 Diners seated via Yelp increased by 20% from the fourth quarter +20% 1Q20 3Q20 4Q202Q20 1Q21 32M30M29M 31M*
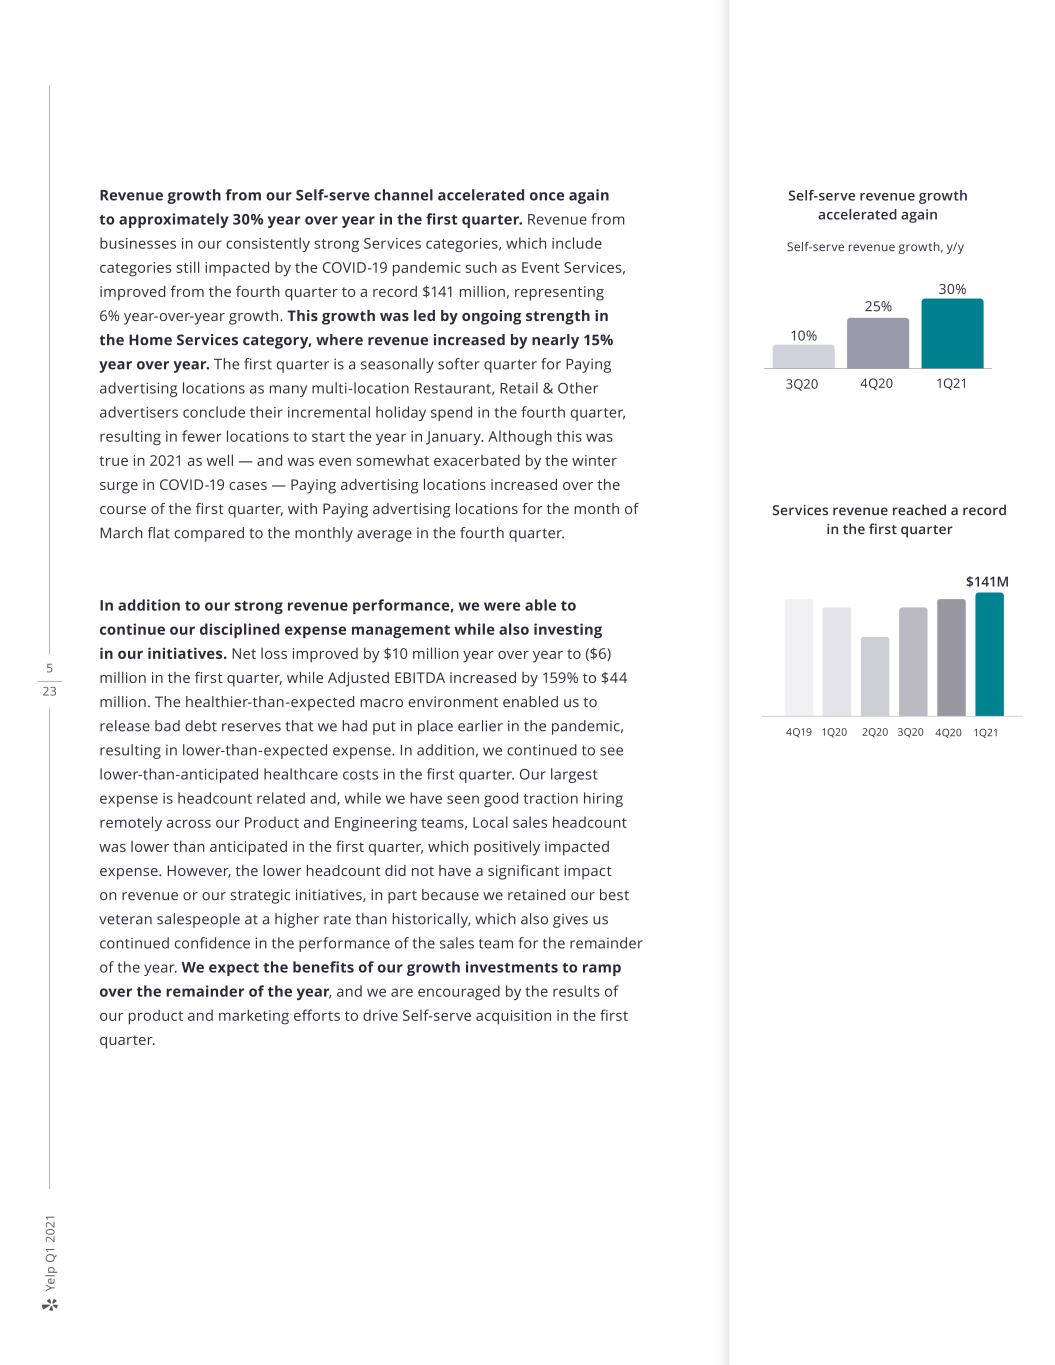
5 23 Ye lp Q 1 2 0 21 Revenue growth from our Self-serve channel accelerated once again to approximately 30% year over year in the first quarter. Revenue from businesses in our consistently strong Services categories, which include categories still impacted by the COVID-19 pandemic such as Event Services, improved from the fourth quarter to a record $141 million, representing 6% year-over-year growth. This growth was led by ongoing strength in the Home Services category, where revenue increased by nearly 15% year over year. The first quarter is a seasonally softer quarter for Paying advertising locations as many multi-location Restaurant, Retail & Other advertisers conclude their incremental holiday spend in the fourth quarter, resulting in fewer locations to start the year in January. Although this was true in 2021 as well — and was even somewhat exacerbated by the winter surge in COVID-19 cases — Paying advertising locations increased over the course of the first quarter, with Paying advertising locations for the month of March flat compared to the monthly average in the fourth quarter. In addition to our strong revenue performance, we were able to continue our disciplined expense management while also investing in our initiatives. Net loss improved by $10 million year over year to ($6) million in the first quarter, while Adjusted EBITDA increased by 159% to $44 million. The healthier-than-expected macro environment enabled us to release bad debt reserves that we had put in place earlier in the pandemic, resulting in lower-than-expected expense. In addition, we continued to see lower-than-anticipated healthcare costs in the first quarter. Our largest expense is headcount related and, while we have seen good traction hiring remotely across our Product and Engineering teams, Local sales headcount was lower than anticipated in the first quarter, which positively impacted expense. However, the lower headcount did not have a significant impact on revenue or our strategic initiatives, in part because we retained our best veteran salespeople at a higher rate than historically, which also gives us continued confidence in the performance of the sales team for the remainder of the year. We expect the benefits of our growth investments to ramp over the remainder of the year, and we are encouraged by the results of our product and marketing efforts to drive Self-serve acquisition in the first quarter. 3Q20 30% Self-serve revenue growth accelerated again 25% 10% 4Q20 1Q21 Self-serve revenue growth, y/y Services revenue reached a record in the first quarter $141M 1Q20 3Q20 4Q202Q20 1Q214Q19

6 23 Ye lp Q 1 2 0 21 Initiatives to drive sustainable growth As a result of our investments in product, marketing, and our Multi-location sales team in the first quarter, we made further progress on our initiatives to drive long-term sustainable growth. Grow Services revenue through improved monetization While the first quarter is typically a seasonally softer quarter for Services businesses, revenue from businesses in these categories grew 6% year over year, 5 percentage points higher than fourth quarter growth, driven by nearly 15% year-over-year growth in Home Services. In addition, our Self-serve channel was an important contributor to Services growth in the first quarter, with Services revenue from this channel up nearly 45% year over year. We continued to differentiate the product experience for consumers and businesses in our Services categories in the first quarter. Building on Yelp Connect’s success among Restaurant, Retail & Other businesses, we developed a new audience model for Services businesses, enabling them to better target potential customers through Yelp Connect while increasing content relevancy for consumers. Since launching the pilot, Services businesses have seen engagement with Connect posts increase to 3 times their previous levels on average. Finding the right service provider can be a difficult task for consumers, so we added new targeted filters to our search results, which have been well received. We also further improved the Request-A-Quote flow and continued to see robust consumer demand for the product: consumer request growth accelerated once again to nearly 30% year over year. As a result of these efforts, we further increased the percentage of monetized leads in our Services categories in the first quarter. In addition, Paying advertising locations in Services categories remained consistent with fourth quarter levels, while average revenue per location reached a record level in the first quarter. To further improve the Services experience and capture more demand, we have a number of projects underway to help consumers find and connect with the right service providers while generating more targeted high-quality leads for our customers. Home Services revenue grew nearly 15% y/y 1Q20 1Q21 Local, Professional, Auto, Real Estate, Financial, Pet, Event Services Home Services +6% +15% Request-A-Quote request growth accelerated to nearly 30% year over year 30% 3Q20 4Q202Q20 1Q21 25% 15% -15% We launched a new Yelp Connect audience model for Services businesses Services Revenue
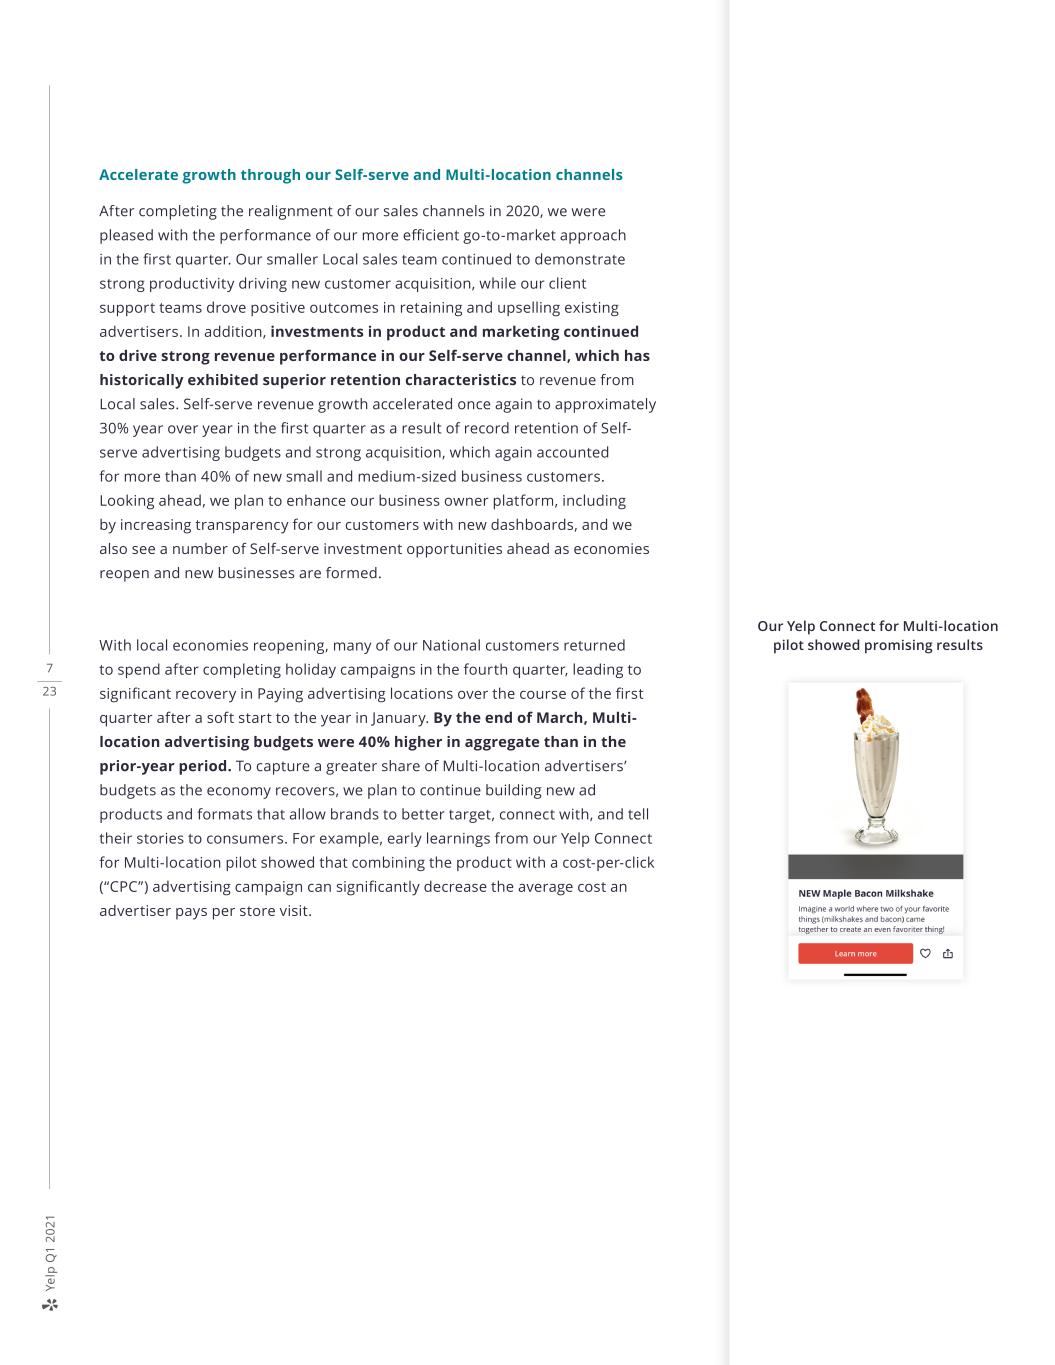
7 23 Ye lp Q 1 2 0 21 Accelerate growth through our Self-serve and Multi-location channels After completing the realignment of our sales channels in 2020, we were pleased with the performance of our more efficient go-to-market approach in the first quarter. Our smaller Local sales team continued to demonstrate strong productivity driving new customer acquisition, while our client support teams drove positive outcomes in retaining and upselling existing advertisers. In addition, investments in product and marketing continued to drive strong revenue performance in our Self-serve channel, which has historically exhibited superior retention characteristics to revenue from Local sales. Self-serve revenue growth accelerated once again to approximately 30% year over year in the first quarter as a result of record retention of Self- serve advertising budgets and strong acquisition, which again accounted for more than 40% of new small and medium-sized business customers. Looking ahead, we plan to enhance our business owner platform, including by increasing transparency for our customers with new dashboards, and we also see a number of Self-serve investment opportunities ahead as economies reopen and new businesses are formed. With local economies reopening, many of our National customers returned to spend after completing holiday campaigns in the fourth quarter, leading to significant recovery in Paying advertising locations over the course of the first quarter after a soft start to the year in January. By the end of March, Multi- location advertising budgets were 40% higher in aggregate than in the prior-year period. To capture a greater share of Multi-location advertisers’ budgets as the economy recovers, we plan to continue building new ad products and formats that allow brands to better target, connect with, and tell their stories to consumers. For example, early learnings from our Yelp Connect for Multi-location pilot showed that combining the product with a cost-per-click (“CPC”) advertising campaign can significantly decrease the average cost an advertiser pays per store visit. Our Yelp Connect for Multi-location pilot showed promising results
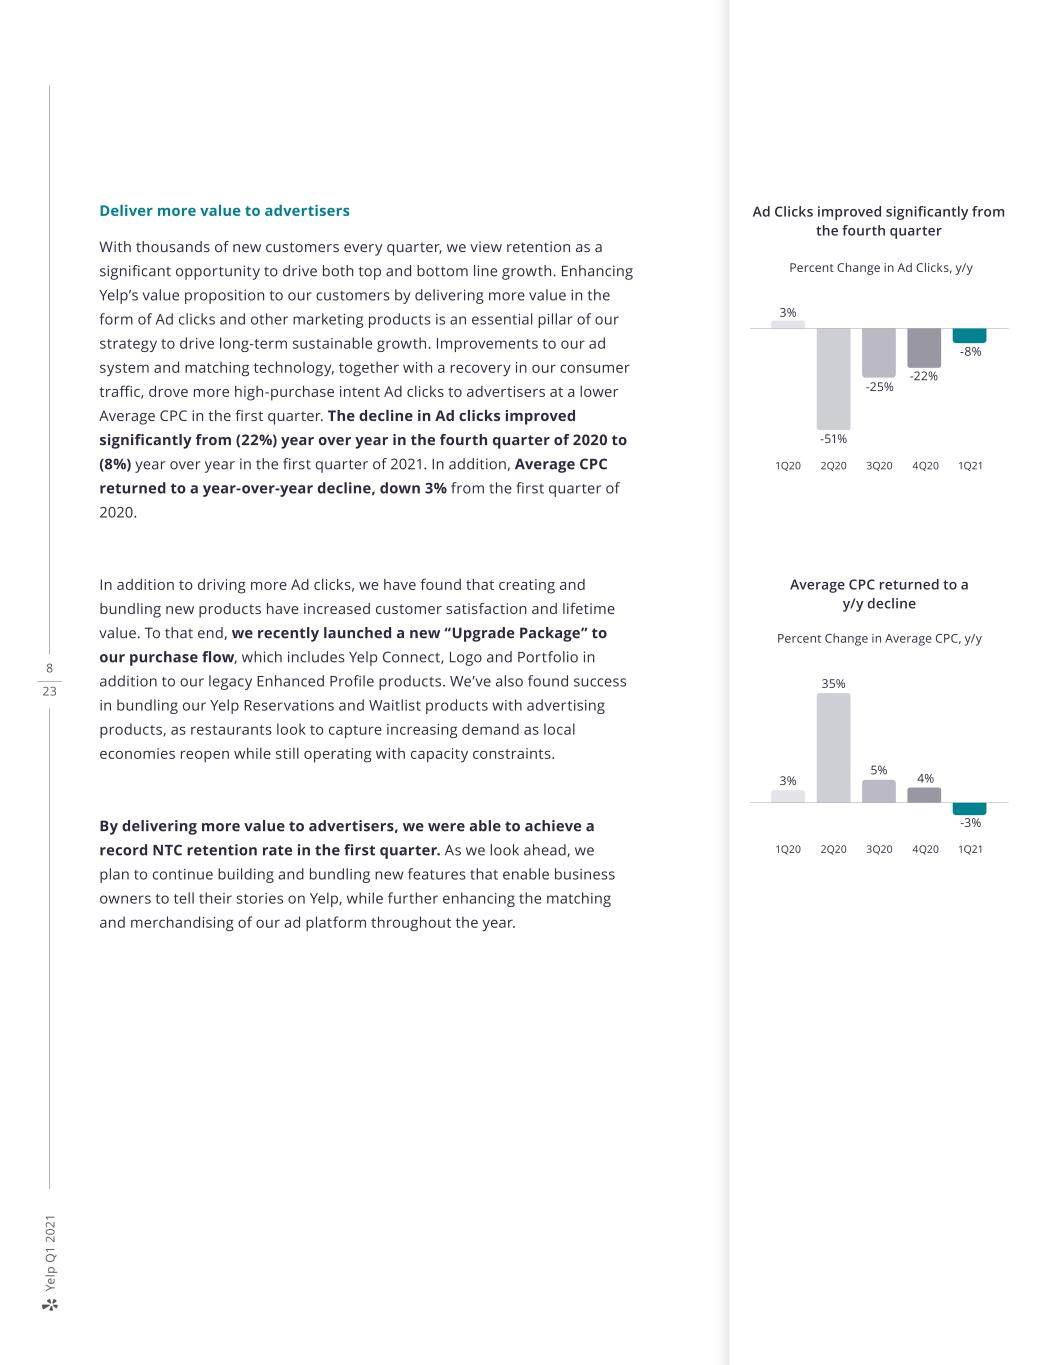
8 23 Ye lp Q 1 2 0 21 Deliver more value to advertisers With thousands of new customers every quarter, we view retention as a significant opportunity to drive both top and bottom line growth. Enhancing Yelp’s value proposition to our customers by delivering more value in the form of Ad clicks and other marketing products is an essential pillar of our strategy to drive long-term sustainable growth. Improvements to our ad system and matching technology, together with a recovery in our consumer traffic, drove more high-purchase intent Ad clicks to advertisers at a lower Average CPC in the first quarter. The decline in Ad clicks improved significantly from (22%) year over year in the fourth quarter of 2020 to (8%) year over year in the first quarter of 2021. In addition, Average CPC returned to a year-over-year decline, down 3% from the first quarter of 2020. In addition to driving more Ad clicks, we have found that creating and bundling new products have increased customer satisfaction and lifetime value. To that end, we recently launched a new “Upgrade Package” to our purchase flow, which includes Yelp Connect, Logo and Portfolio in addition to our legacy Enhanced Profile products. We’ve also found success in bundling our Yelp Reservations and Waitlist products with advertising products, as restaurants look to capture increasing demand as local economies reopen while still operating with capacity constraints. By delivering more value to advertisers, we were able to achieve a record NTC retention rate in the first quarter. As we look ahead, we plan to continue building and bundling new features that enable business owners to tell their stories on Yelp, while further enhancing the matching and merchandising of our ad platform throughout the year. Ad Clicks improved significantly from the fourth quarter 1Q20 3Q20 4Q202Q20 1Q21 Percent Change in Ad Clicks, y/y 3% -25% -22% -51% -8% Average CPC returned to a y/y decline 1Q20 3Q20 4Q202Q20 1Q21 Percent Change in Average CPC, y/y 3% 5% 4% 35% -3%
9 23 Ye lp Q 1 2 0 21 Investing for growth We continue to see opportunities to drive sustainable growth and leverage over the long term, both through strategic investments in our products and technology as well as by optimizing our expense base. Our growth strategy is designed to drive long term profitability Building on the strong momentum of our first quarter performance, we are investing in product development, marketing and our Multi-location sales team to support our strategic initiatives and deliver more value to advertisers. We believe this will enable us to scale our business in a more profitable way over the long term through increased revenue retention and our more efficient go-to-market approach. In the first quarter, lower CPCs contributed to a record NTC retention rate, and revenue growth from our Self-serve channel accelerated. We were able to achieve these results with Local sales headcount at approximately 50% of pre-pandemic levels, which also enabled us to deliver a 19% Adjusted EBITDA margin while heavily investing in our growth initiatives. We are pleased with this start to the year and expect our investments to continue benefiting both revenue and Adjusted EBITDA over the long term. Reduce costs by operating on a distributed basis Yelp’s ability to operate successfully in a fully remote environment over the past year has demonstrated the feasibility of a distributed workforce. While many of our employees look forward to returning to our offices, most will remain primarily remote, allowing us to reduce our real estate footprint. We are currently in the process of negotiating subleases for properties we lease in certain markets and, given the current market for real estate in the United States, we expect to incur a related lease impairment charge as early as the second quarter. As we progress in negotiations, we will provide an estimate of our related savings as well as any impairment charges. In addition to reducing our real estate related expenses, we believe operating with a distributed workforce will enable us to expand our presence in lower-cost markets and reduce our reliance on the Bay Area for talent.
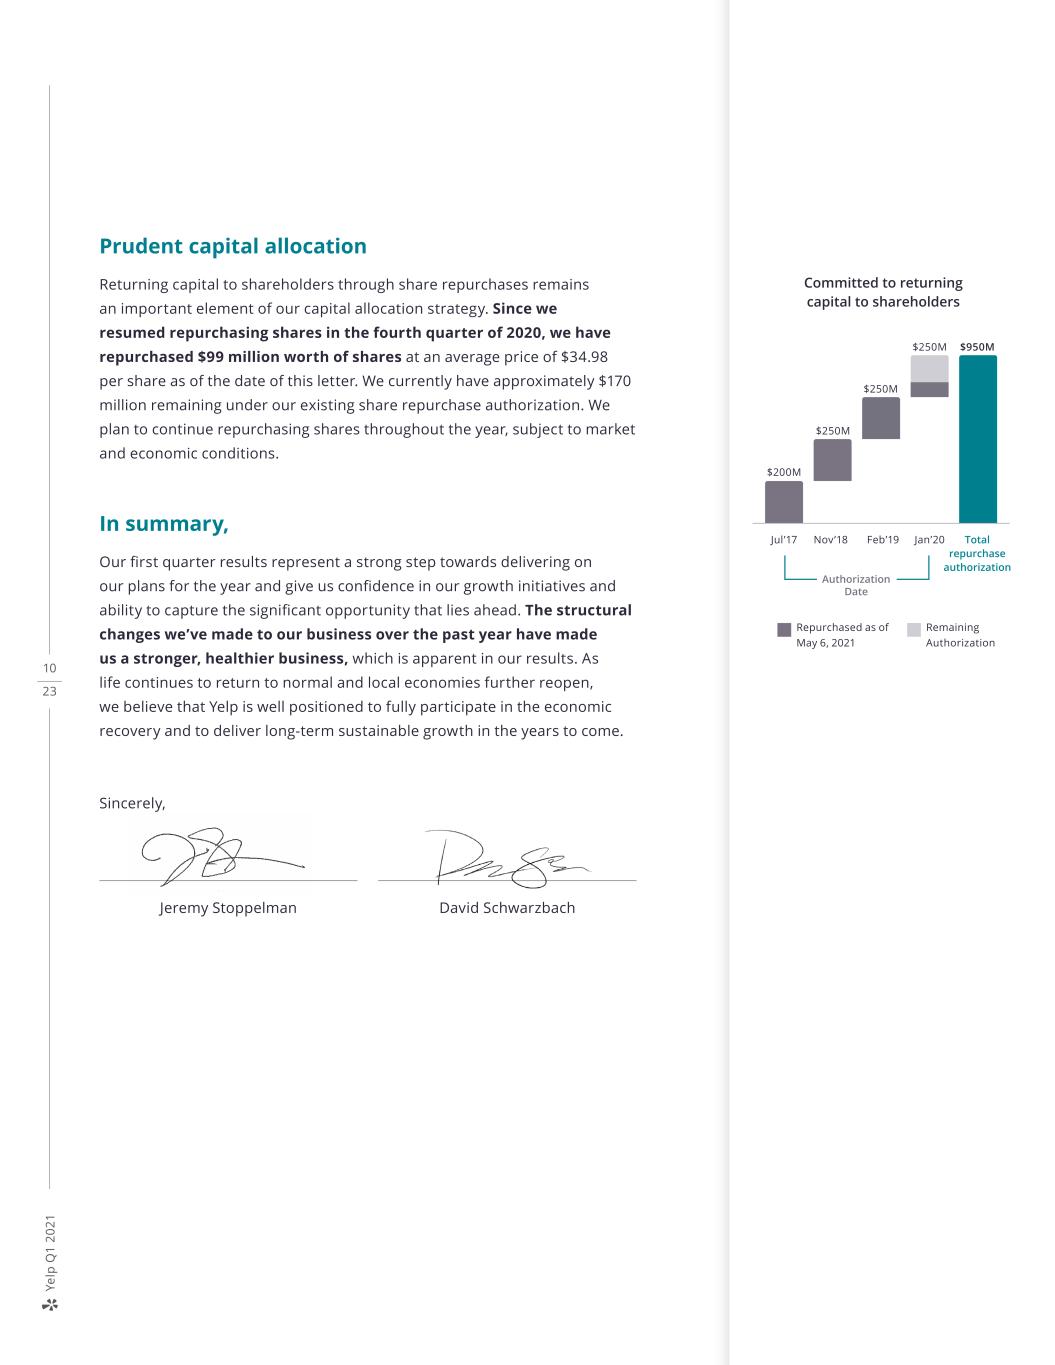
10 23 Ye lp Q 1 2 0 21 Prudent capital allocation Returning capital to shareholders through share repurchases remains an important element of our capital allocation strategy. Since we resumed repurchasing shares in the fourth quarter of 2020, we have repurchased $99 million worth of shares at an average price of $34.98 per share as of the date of this letter. We currently have approximately $170 million remaining under our existing share repurchase authorization. We plan to continue repurchasing shares throughout the year, subject to market and economic conditions. In summary, Our first quarter results represent a strong step towards delivering on our plans for the year and give us confidence in our growth initiatives and ability to capture the significant opportunity that lies ahead. The structural changes we’ve made to our business over the past year have made us a stronger, healthier business, which is apparent in our results. As life continues to return to normal and local economies further reopen, we believe that Yelp is well positioned to fully participate in the economic recovery and to deliver long-term sustainable growth in the years to come. Sincerely, Committed to returning capital to shareholders Jul’17 $200M Nov’18 $250M Feb’19 $250M Jan’20 $250M $950M Total repurchase authorization Authorization Date Repurchased as of May 6, 2021 Remaining Authorization Jeremy Stoppelman David Schwarzbach
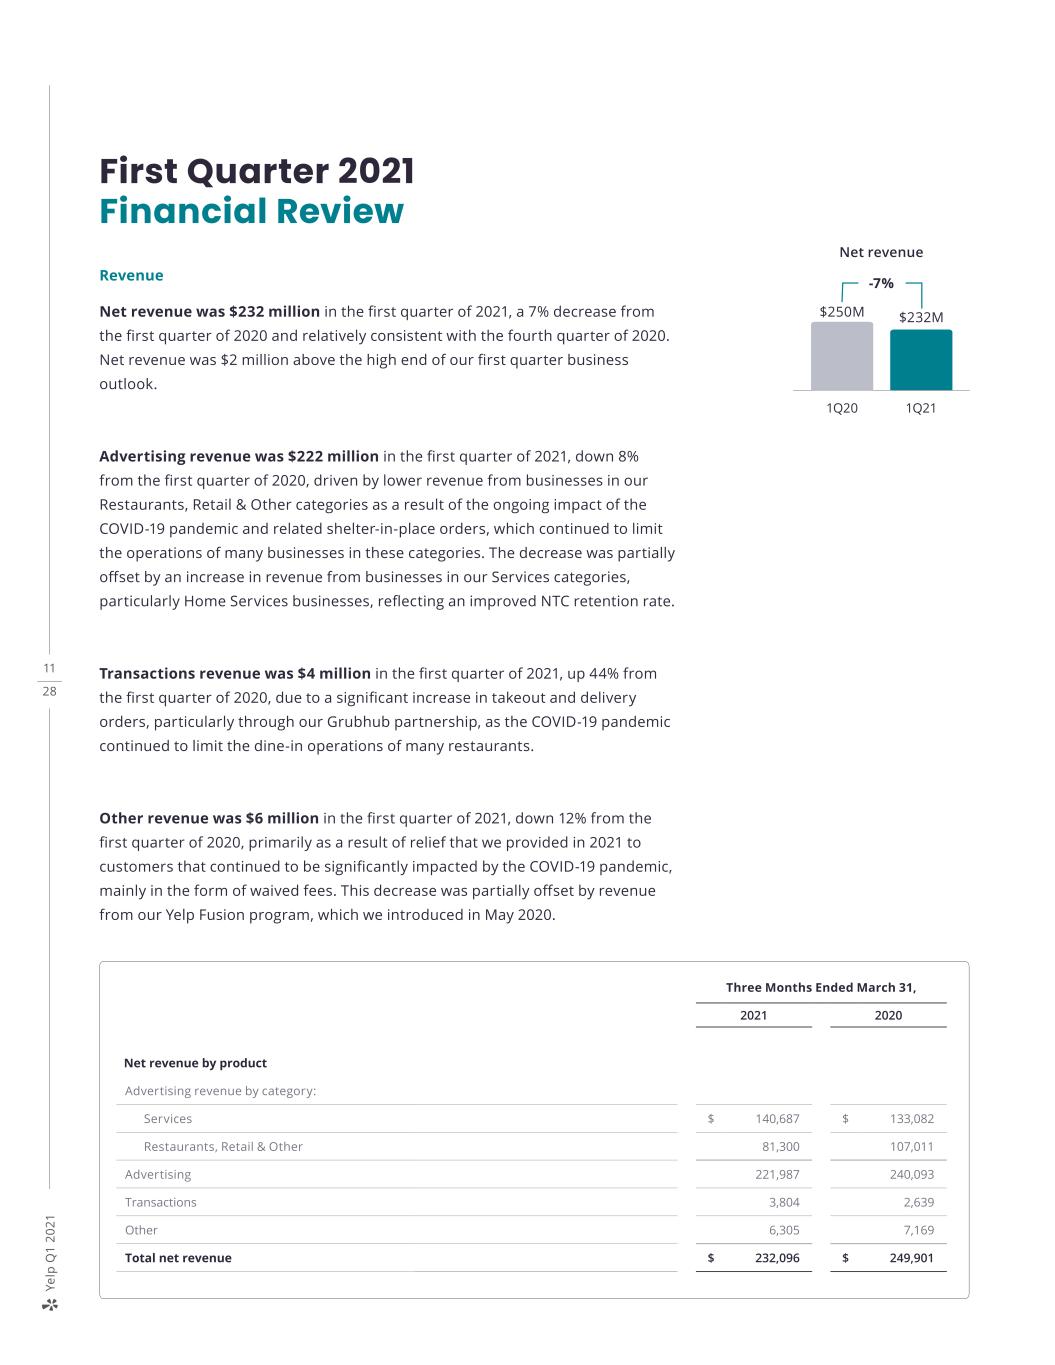
11 28 Ye lp Q 1 2 0 21 First Quarter 2021 Financial Review Revenue Net revenue was $232 million in the first quarter of 2021, a 7% decrease from the first quarter of 2020 and relatively consistent with the fourth quarter of 2020. Net revenue was $2 million above the high end of our first quarter business outlook. Advertising revenue was $222 million in the first quarter of 2021, down 8% from the first quarter of 2020, driven by lower revenue from businesses in our Restaurants, Retail & Other categories as a result of the ongoing impact of the COVID-19 pandemic and related shelter-in-place orders, which continued to limit the operations of many businesses in these categories. The decrease was partially offset by an increase in revenue from businesses in our Services categories, particularly Home Services businesses, reflecting an improved NTC retention rate. Transactions revenue was $4 million in the first quarter of 2021, up 44% from the first quarter of 2020, due to a significant increase in takeout and delivery orders, particularly through our Grubhub partnership, as the COVID-19 pandemic continued to limit the dine-in operations of many restaurants. Other revenue was $6 million in the first quarter of 2021, down 12% from the first quarter of 2020, primarily as a result of relief that we provided in 2021 to customers that continued to be significantly impacted by the COVID-19 pandemic, mainly in the form of waived fees. This decrease was partially offset by revenue from our Yelp Fusion program, which we introduced in May 2020. Three Months Ended March 31, 2021 2020 Net revenue by product Advertising revenue by category: Services $ 140,687 $ 133,082 Restaurants, Retail & Other 81,300 107,011 Advertising 221,987 240,093 Transactions 3,804 2,639 Other 6,305 7,169 Total net revenue $ 232,096 $ 249,901 Net revenue 1Q20 $250M -7% $232M 1Q21
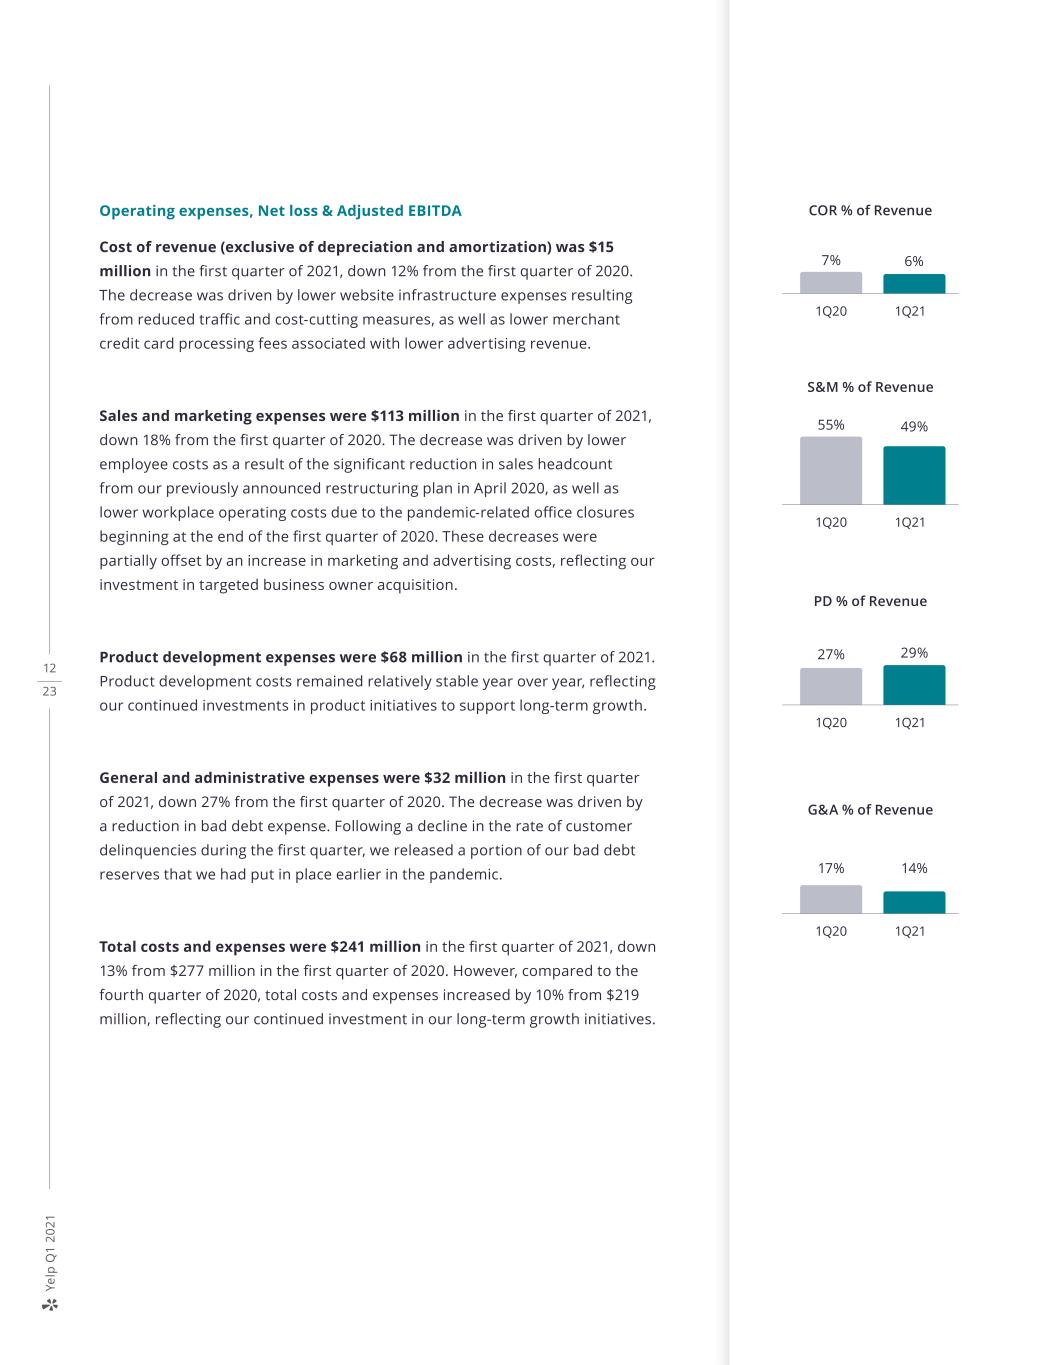
12 23 Ye lp Q 1 2 0 21 Operating expenses, Net loss & Adjusted EBITDA Cost of revenue (exclusive of depreciation and amortization) was $15 million in the first quarter of 2021, down 12% from the first quarter of 2020. The decrease was driven by lower website infrastructure expenses resulting from reduced traffic and cost-cutting measures, as well as lower merchant credit card processing fees associated with lower advertising revenue. Sales and marketing expenses were $113 million in the first quarter of 2021, down 18% from the first quarter of 2020. The decrease was driven by lower employee costs as a result of the significant reduction in sales headcount from our previously announced restructuring plan in April 2020, as well as lower workplace operating costs due to the pandemic-related office closures beginning at the end of the first quarter of 2020. These decreases were partially offset by an increase in marketing and advertising costs, reflecting our investment in targeted business owner acquisition. Product development expenses were $68 million in the first quarter of 2021. Product development costs remained relatively stable year over year, reflecting our continued investments in product initiatives to support long-term growth. General and administrative expenses were $32 million in the first quarter of 2021, down 27% from the first quarter of 2020. The decrease was driven by a reduction in bad debt expense. Following a decline in the rate of customer delinquencies during the first quarter, we released a portion of our bad debt reserves that we had put in place earlier in the pandemic. Total costs and expenses were $241 million in the first quarter of 2021, down 13% from $277 million in the first quarter of 2020. However, compared to the fourth quarter of 2020, total costs and expenses increased by 10% from $219 million, reflecting our continued investment in our long-term growth initiatives. S&M % of Revenue 1Q20 55% 49% 1Q21 COR % of Revenue 1Q20 7% 6% 1Q21 PD % of Revenue 1Q20 27% 29% 1Q21 G&A % of Revenue 1Q20 17% 14% 1Q21
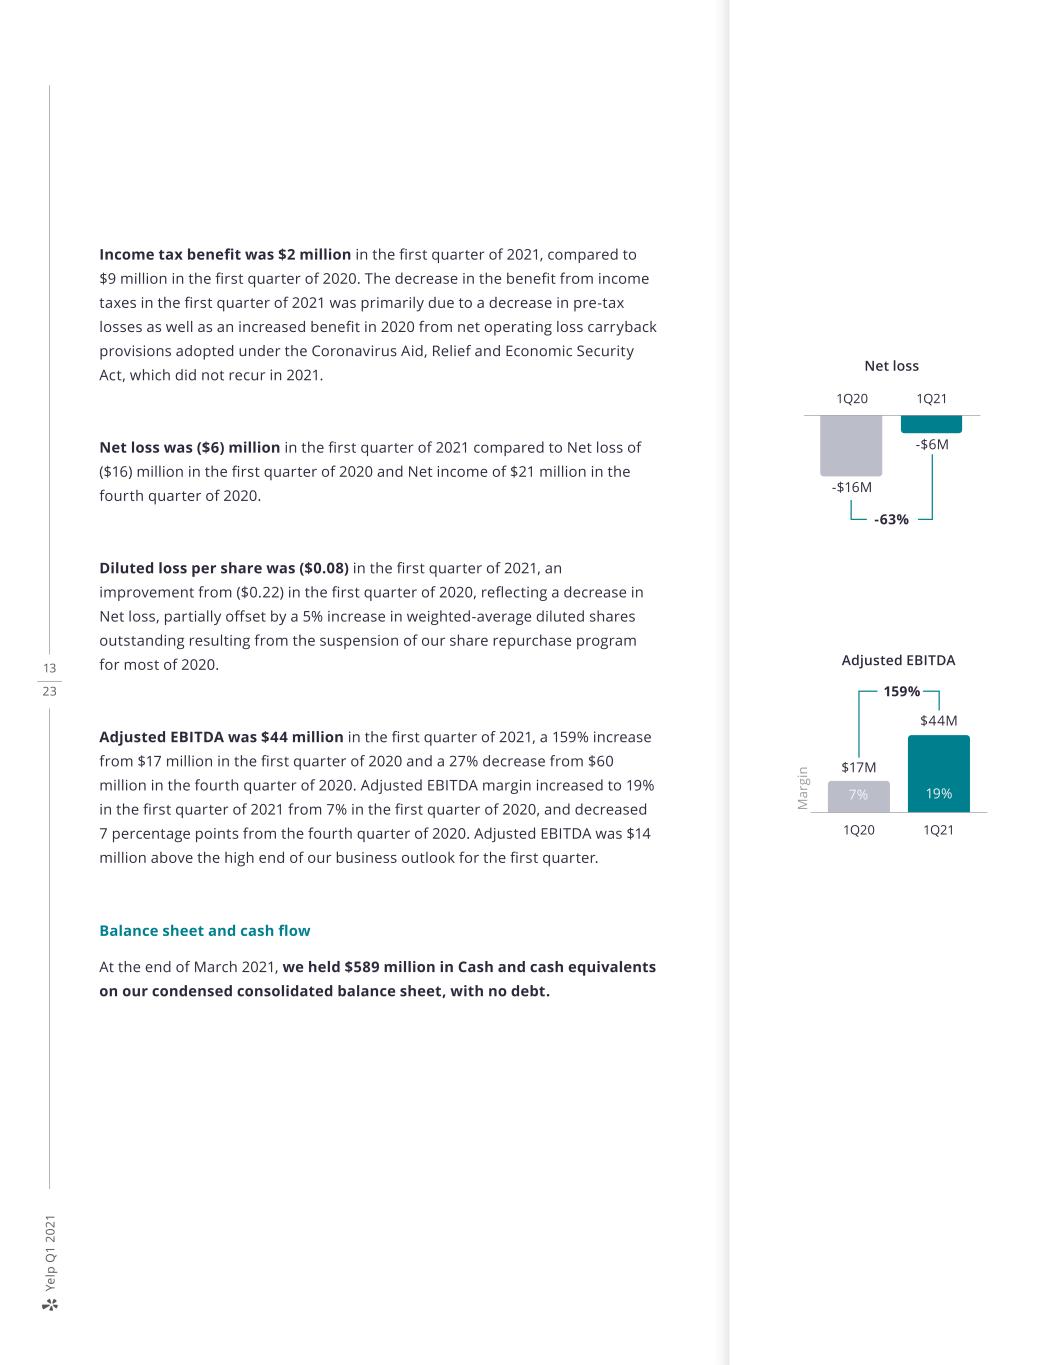
13 23 Ye lp Q 1 2 0 21 Income tax benefit was $2 million in the first quarter of 2021, compared to $9 million in the first quarter of 2020. The decrease in the benefit from income taxes in the first quarter of 2021 was primarily due to a decrease in pre-tax losses as well as an increased benefit in 2020 from net operating loss carryback provisions adopted under the Coronavirus Aid, Relief and Economic Security Act, which did not recur in 2021. Net loss was ($6) million in the first quarter of 2021 compared to Net loss of ($16) million in the first quarter of 2020 and Net income of $21 million in the fourth quarter of 2020. Diluted loss per share was ($0.08) in the first quarter of 2021, an improvement from ($0.22) in the first quarter of 2020, reflecting a decrease in Net loss, partially offset by a 5% increase in weighted-average diluted shares outstanding resulting from the suspension of our share repurchase program for most of 2020. Adjusted EBITDA was $44 million in the first quarter of 2021, a 159% increase from $17 million in the first quarter of 2020 and a 27% decrease from $60 million in the fourth quarter of 2020. Adjusted EBITDA margin increased to 19% in the first quarter of 2021 from 7% in the first quarter of 2020, and decreased 7 percentage points from the fourth quarter of 2020. Adjusted EBITDA was $14 million above the high end of our business outlook for the first quarter. Balance sheet and cash flow At the end of March 2021, we held $589 million in Cash and cash equivalents on our condensed consolidated balance sheet, with no debt. Net loss 1Q211Q20 -63% -$16M -$6M M ar gi n 1Q20 1Q21 Adjusted EBITDA 159% $44M $17M 19%7%
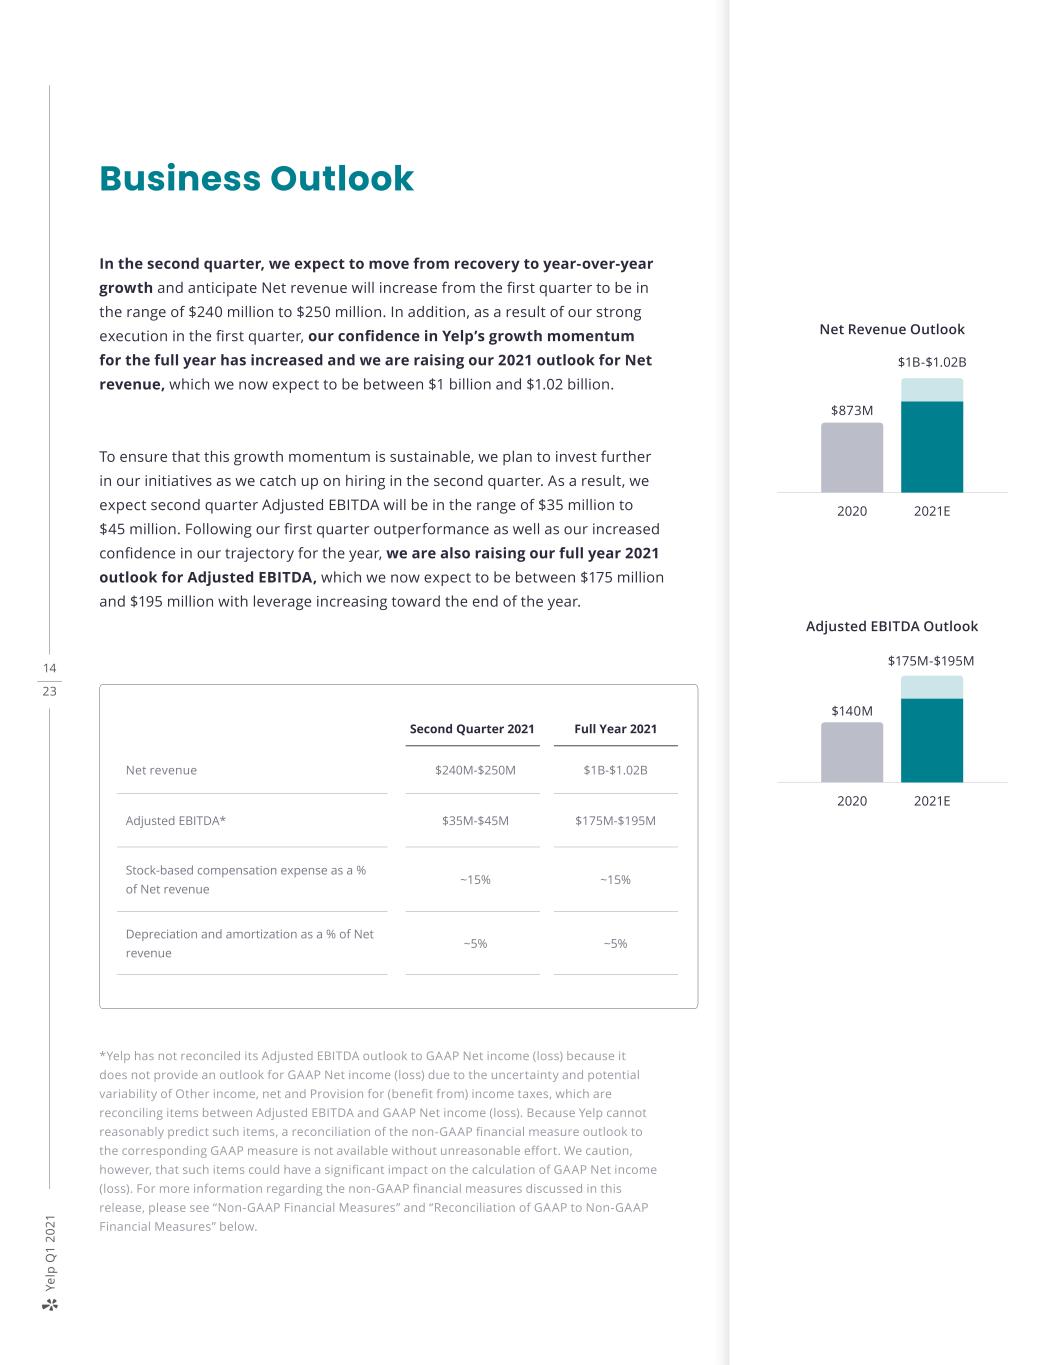
14 23 Ye lp Q 1 2 0 21 Business Outlook In the second quarter, we expect to move from recovery to year-over-year growth and anticipate Net revenue will increase from the first quarter to be in the range of $240 million to $250 million. In addition, as a result of our strong execution in the first quarter, our confidence in Yelp’s growth momentum for the full year has increased and we are raising our 2021 outlook for Net revenue, which we now expect to be between $1 billion and $1.02 billion. To ensure that this growth momentum is sustainable, we plan to invest further in our initiatives as we catch up on hiring in the second quarter. As a result, we expect second quarter Adjusted EBITDA will be in the range of $35 million to $45 million. Following our first quarter outperformance as well as our increased confidence in our trajectory for the year, we are also raising our full year 2021 outlook for Adjusted EBITDA, which we now expect to be between $175 million and $195 million with leverage increasing toward the end of the year. *Yelp has not reconciled its Adjusted EBITDA outlook to GAAP Net income (loss) because it does not provide an outlook for GAAP Net income (loss) due to the uncertainty and potential variability of Other income, net and Provision for (benefit from) income taxes, which are reconciling items between Adjusted EBITDA and GAAP Net income (loss). Because Yelp cannot reasonably predict such items, a reconciliation of the non-GAAP financial measure outlook to the corresponding GAAP measure is not available without unreasonable effort. We caution, however, that such items could have a significant impact on the calculation of GAAP Net income (loss). For more information regarding the non-GAAP financial measures discussed in this release, please see “Non-GAAP Financial Measures” and “Reconciliation of GAAP to Non-GAAP Financial Measures” below. Net Revenue Outlook 2020 $873M $1B-$1.02B 2021E Adjusted EBITDA Outlook 2020 $140M $175M-$195M 2021E Net revenue $240M-$250M $1B-$1.02B Adjusted EBITDA* $35M-$45M $175M-$195M Stock-based compensation expense as a % of Net revenue ~15% ~15% Depreciation and amortization as a % of Net revenue ~5% ~5% Second Quarter 2021 Full Year 2021
15 23 Ye lp Q 1 2 0 21 Quarterly Earnings Webcast Yelp will host a live webcast today at 2:00 p.m. PDT to discuss the first quarter 2021 financial results and outlook for the second quarter and full year of 2021. The webcast can be accessed on the Yelp Investor Relations website at yelp-ir.com. A replay of the webcast will be available at the same website. About Yelp Yelp Inc. (www.yelp.com) connects people with great local businesses. With unmatched local business information, photos and review content, Yelp provides a one-stop local platform for consumers to discover, connect, and transact with local businesses of all sizes by making it easy to request a quote, join a waitlist, and make a reservation, appointment, or purchase. Yelp was founded in San Francisco in July 2004.
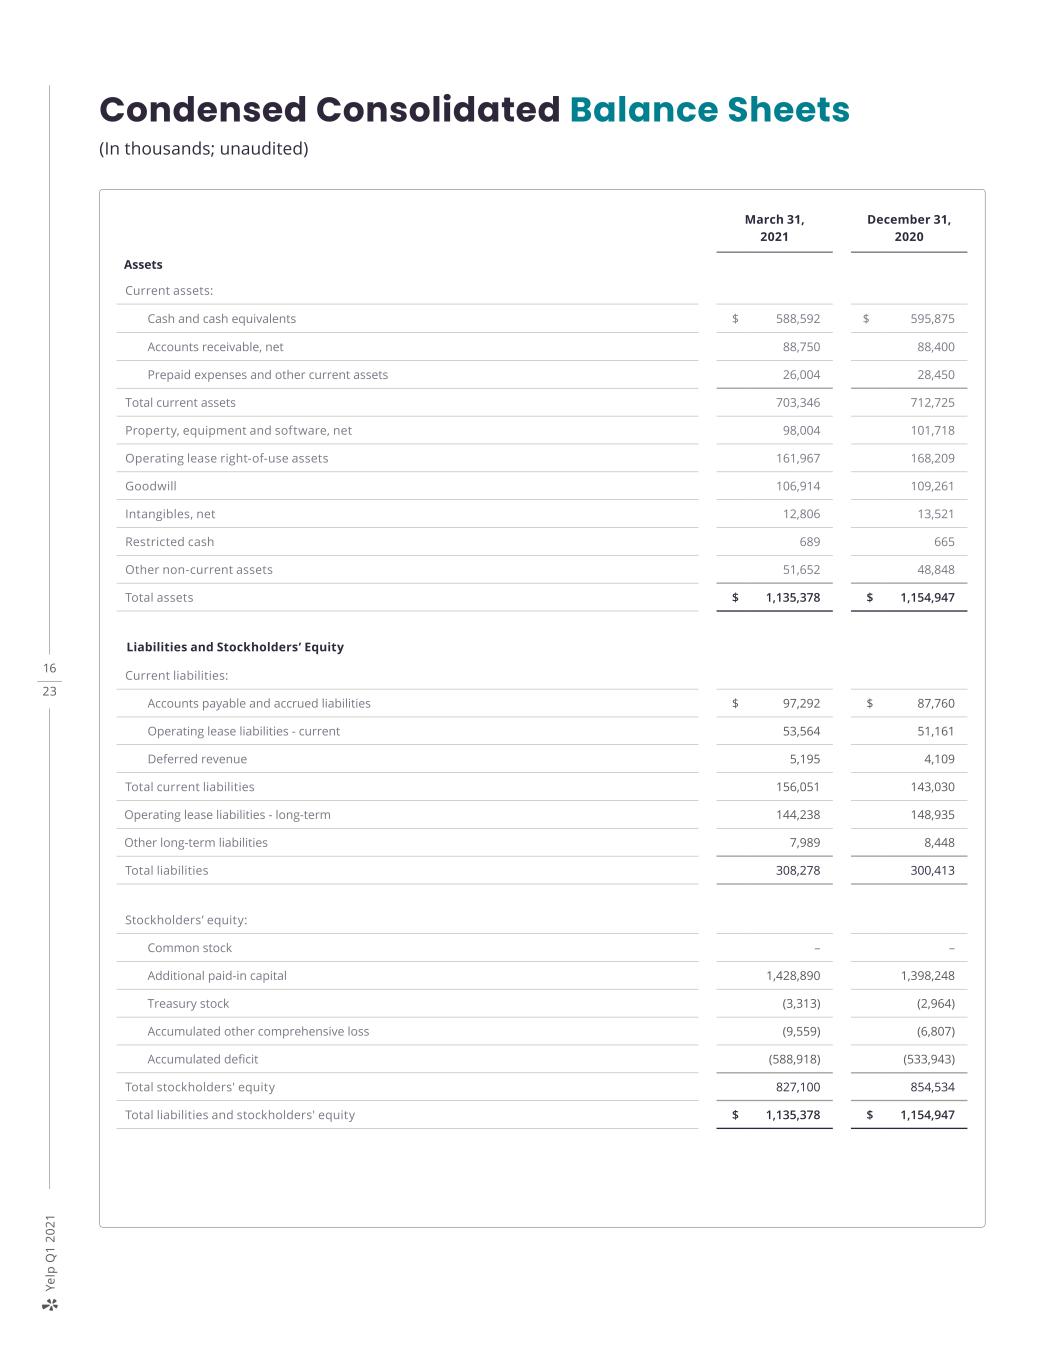
16 23 Ye lp Q 1 2 0 21 March 31, 2021 December 31, 2020 Assets Current assets: Cash and cash equivalents $ 588,592 $ 595,875 Accounts receivable, net 88,750 88,400 Prepaid expenses and other current assets 26,004 28,450 Total current assets 703,346 712,725 Property, equipment and software, net 98,004 101,718 Operating lease right-of-use assets 161,967 168,209 Goodwill 106,914 109,261 Intangibles, net 12,806 13,521 Restricted cash 689 665 Other non-current assets 51,652 48,848 Total assets $ 1,135,378 $ 1,154,947 Liabilities and Stockholders’ Equity Current liabilities: Accounts payable and accrued liabilities $ 97,292 $ 87,760 Operating lease liabilities - current 53,564 51,161 Deferred revenue 5,195 4,109 Total current liabilities 156,051 143,030 Operating lease liabilities - long-term 144,238 148,935 Other long-term liabilities 7,989 8,448 Total liabilities 308,278 300,413 Stockholders’ equity: Common stock – – Additional paid-in capital 1,428,890 1,398,248 Treasury stock (3,313) (2,964) Accumulated other comprehensive loss (9,559) (6,807) Accumulated deficit (588,918) (533,943) Total stockholders' equity 827,100 854,534 Total liabilities and stockholders' equity $ 1,135,378 $ 1,154,947 Condensed Consolidated Balance Sheets (In thousands; unaudited)
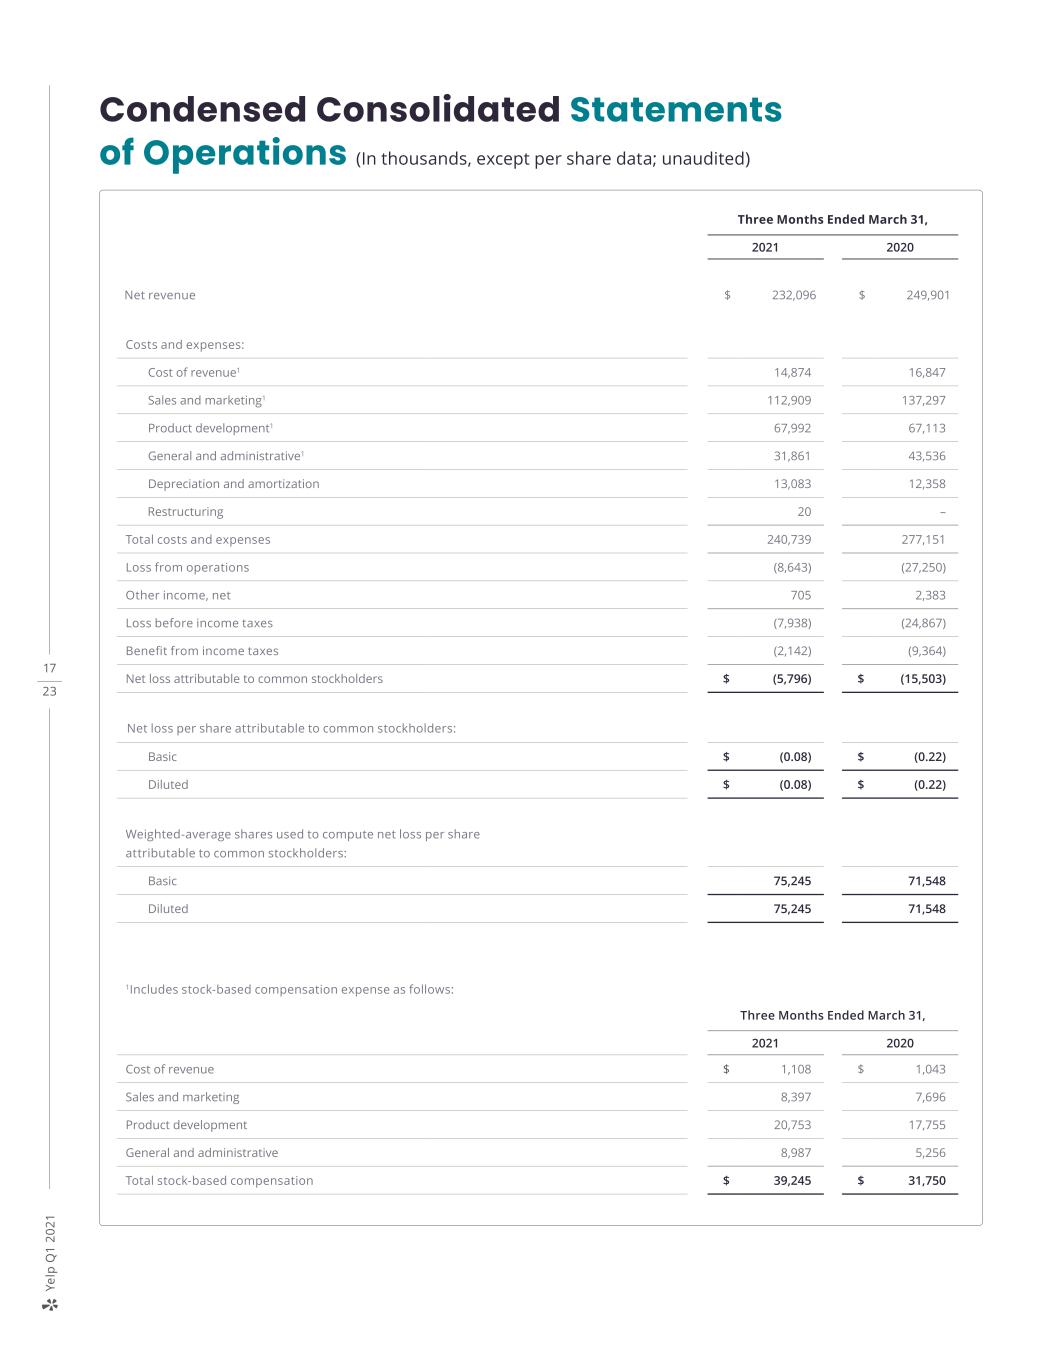
17 23 Ye lp Q 1 2 0 21 Condensed Consolidated Statements of Operations (In thousands, except per share data; unaudited) Three Months Ended March 31, 2021 2020 Net revenue $ 232,096 $ 249,901 Costs and expenses: Cost of revenue1 14,874 16,847 Sales and marketing1 112,909 137,297 Product development1 67,992 67,113 General and administrative1 31,861 43,536 Depreciation and amortization 13,083 12,358 Restructuring 20 – Total costs and expenses 240,739 277,151 Loss from operations (8,643) (27,250) Other income, net 705 2,383 Loss before income taxes (7,938) (24,867) Benefit from income taxes (2,142) (9,364) Net loss attributable to common stockholders $ (5,796) $ (15,503) Net loss per share attributable to common stockholders: Basic $ (0.08) $ (0.22) Diluted $ (0.08) $ (0.22) Weighted-average shares used to compute net loss per share attributable to common stockholders: Basic 75,245 71,548 Diluted 75,245 71,548 1Includes stock-based compensation expense as follows: Three Months Ended March 31, 2021 2020 Cost of revenue $ 1,108 $ 1,043 Sales and marketing 8,397 7,696 Product development 20,753 17,755 General and administrative 8,987 5,256 Total stock-based compensation $ 39,245 $ 31,750
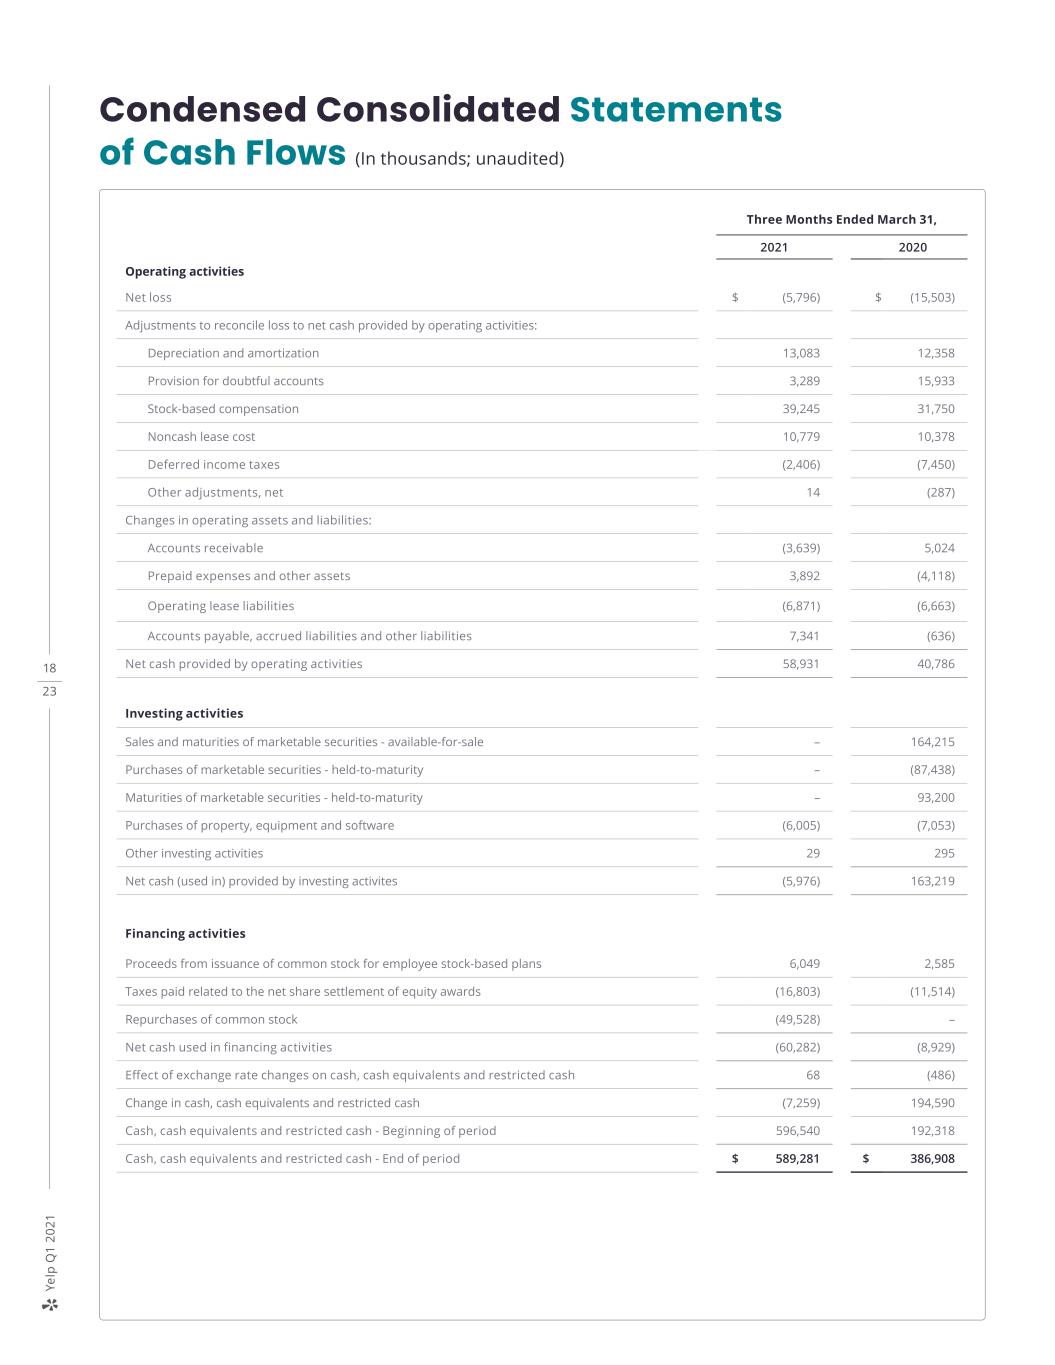
18 23 Ye lp Q 1 2 0 21 Three Months Ended March 31, 2021 2020 Operating activities Net loss $ (5,796) $ (15,503) Adjustments to reconcile loss to net cash provided by operating activities: Depreciation and amortization 13,083 12,358 Provision for doubtful accounts 3,289 15,933 Stock-based compensation 39,245 31,750 Noncash lease cost 10,779 10,378 Deferred income taxes (2,406) (7,450) Other adjustments, net 14 (287) Changes in operating assets and liabilities: Accounts receivable (3,639) 5,024 Prepaid expenses and other assets 3,892 (4,118) Operating lease liabilities (6,871) (6,663) Accounts payable, accrued liabilities and other liabilities 7,341 (636) Net cash provided by operating activities 58,931 40,786 Investing activities Sales and maturities of marketable securities - available-for-sale – 164,215 Purchases of marketable securities - held-to-maturity – (87,438) Maturities of marketable securities - held-to-maturity – 93,200 Purchases of property, equipment and software (6,005) (7,053) Other investing activities 29 295 Net cash (used in) provided by investing activites (5,976) 163,219 Financing activities Proceeds from issuance of common stock for employee stock-based plans 6,049 2,585 Taxes paid related to the net share settlement of equity awards (16,803) (11,514) Repurchases of common stock (49,528) – Net cash used in financing activities (60,282) (8,929) Effect of exchange rate changes on cash, cash equivalents and restricted cash 68 (486) Change in cash, cash equivalents and restricted cash (7,259) 194,590 Cash, cash equivalents and restricted cash - Beginning of period 596,540 192,318 Cash, cash equivalents and restricted cash - End of period $ 589,281 $ 386,908 Condensed Consolidated Statements of Cash Flows (In thousands; unaudited)
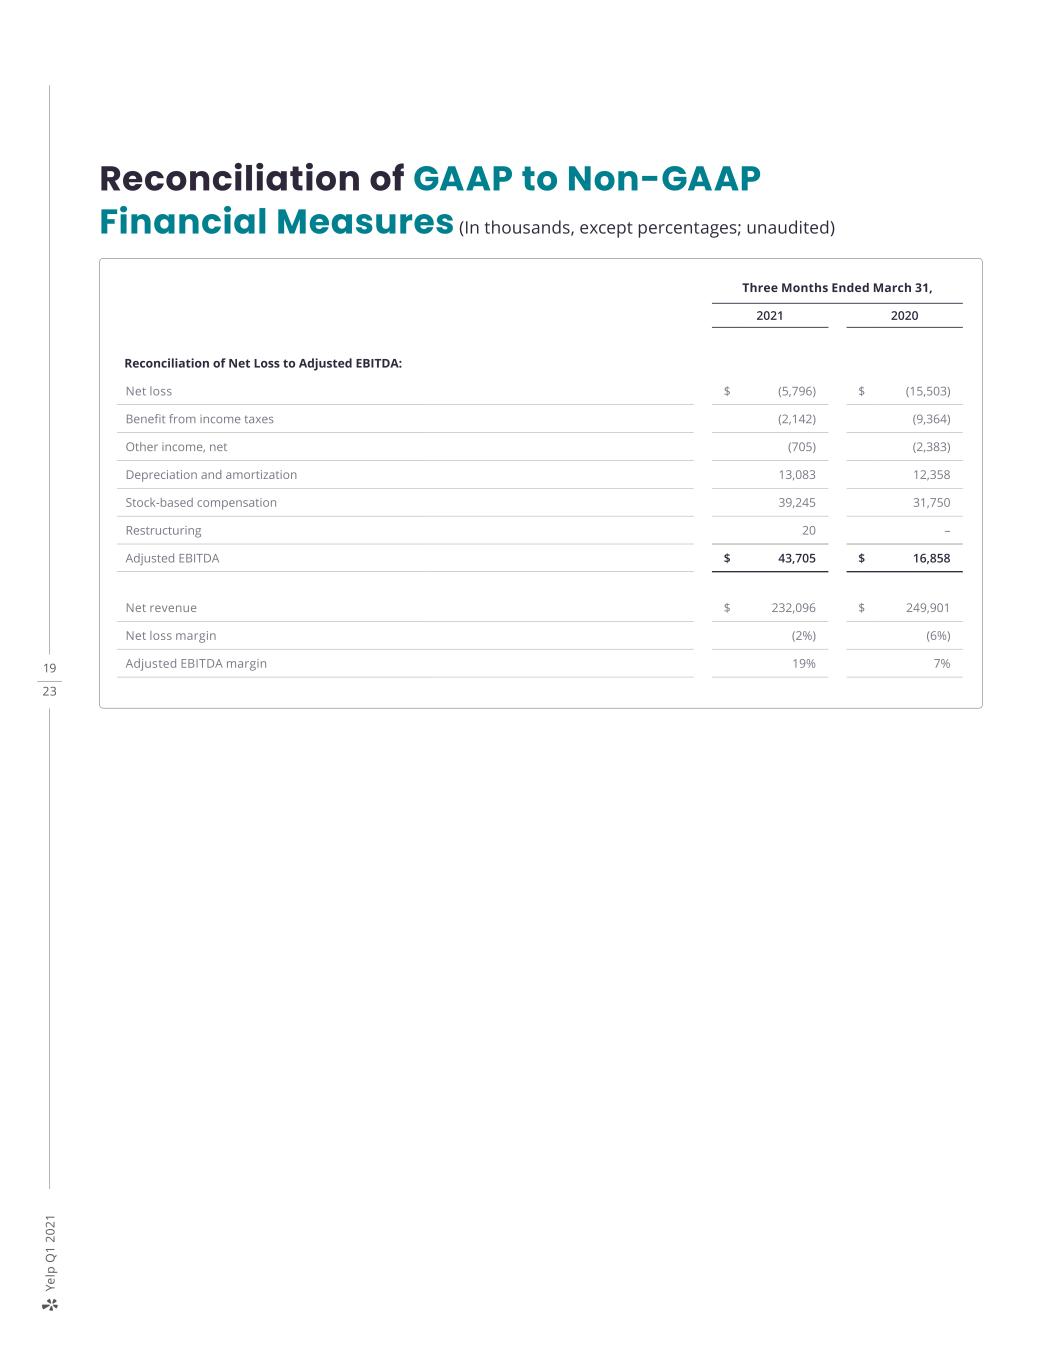
19 23 Ye lp Q 1 2 0 21 Reconciliation of GAAP to Non-GAAP Financial Measures (In thousands, except percentages; unaudited) Three Months Ended March 31, 2021 2020 Reconciliation of Net Loss to Adjusted EBITDA: Net loss $ (5,796) $ (15,503) Benefit from income taxes (2,142) (9,364) Other income, net (705) (2,383) Depreciation and amortization 13,083 12,358 Stock-based compensation 39,245 31,750 Restructuring 20 – Adjusted EBITDA $ 43,705 $ 16,858 Net revenue $ 232,096 $ 249,901 Net loss margin (2%) (6%) Adjusted EBITDA margin 19% 7%
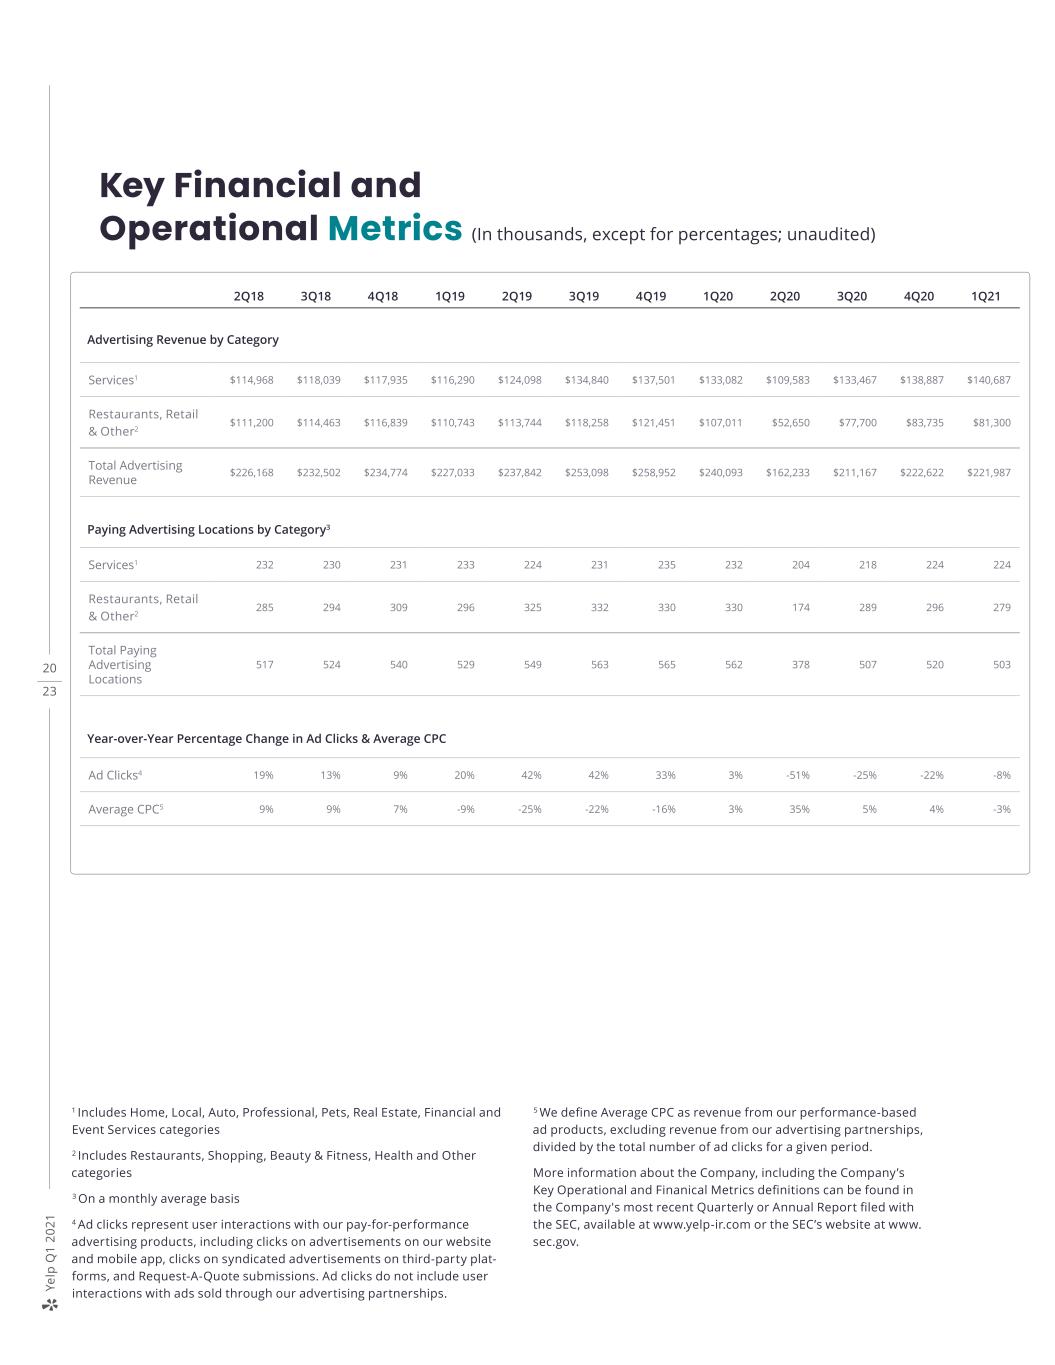
20 23 Ye lp Q 1 2 0 21 2Q18 3Q18 4Q18 1Q19 2Q19 3Q19 4Q19 1Q20 2Q20 3Q20 4Q20 1Q21 Services1 $114,968 $118,039 $117,935 $116,290 $124,098 $134,840 $137,501 $133,082 $109,583 $133,467 $138,887 $140,687 Restaurants, Retail & Other2 $111,200 $114,463 $116,839 $110,743 $113,744 $118,258 $121,451 $107,011 $52,650 $77,700 $83,735 $81,300 Total Advertising Revenue $226,168 $232,502 $234,774 $227,033 $237,842 $253,098 $258,952 $240,093 $162,233 $211,167 $222,622 $221,987 Services1 232 230 231 233 224 231 235 232 204 218 224 224 Restaurants, Retail & Other2 285 294 309 296 325 332 330 330 174 289 296 279 Total Paying Advertising Locations 517 524 540 529 549 563 565 562 378 507 520 503 Ad Clicks4 19% 13% 9% 20% 42% 42% 33% 3% -51% -25% -22% -8% Average CPC5 9% 9% 7% -9% -25% -22% -16% 3% 35% 5% 4% -3% Key Financial and Operational Metrics (In thousands, except for percentages; unaudited) Advertising Revenue by Category Paying Advertising Locations by Category3 Year-over-Year Percentage Change in Ad Clicks & Average CPC 1 Includes Home, Local, Auto, Professional, Pets, Real Estate, Financial and Event Services categories 2 Includes Restaurants, Shopping, Beauty & Fitness, Health and Other categories 3 On a monthly average basis 4 Ad clicks represent user interactions with our pay-for-performance advertising products, including clicks on advertisements on our website and mobile app, clicks on syndicated advertisements on third-party plat- forms, and Request-A-Quote submissions. Ad clicks do not include user interactions with ads sold through our advertising partnerships. 5 We define Average CPC as revenue from our performance-based ad products, excluding revenue from our advertising partnerships, divided by the total number of ad clicks for a given period. More information about the Company, including the Company’s Key Operational and Finanical Metrics definitions can be found in the Company's most recent Quarterly or Annual Report filed with the SEC, available at www.yelp-ir.com or the SEC’s website at www. sec.gov.
21 23 Ye lp Q 1 2 0 21 Non-GAAP Financial Measures This letter and statements made during the above referenced webcast may include information relating to Adjusted EBITDA and Adjusted EBITDA margin, each of which is a "non-GAAP financial measure." We define Adjusted EBITDA as net income (loss), adjusted to exclude: provision for (benefit from) income taxes; other income, net; depreciation and amortization; stock-based compensation expense; and, in certain periods, certain other income and expense items, such as restructuring costs. We define Adjusted EBITDA margin as Adjusted EBITDA divided by net revenue. Adjusted EBITDA, which is not prepared under any comprehensive set of accounting rules or principles, has limitations as an analytical tool and you should not consider it in isolation or as a substitute for analysis of Yelp’s financial results as reported in accordance with generally accepted accounting principles in the United States (“GAAP”). In particular, Adjusted EBITDA should not be viewed as a substitute for, or superior to, net income (loss) prepared in accordance with GAAP as a measure of profitability or liquidity. Some of these limitations are: > although depreciation and amortization are non-cash charges, the assets being depreciated and amortized may have to be replaced in the future, and Adjusted EBITDA does not reflect all cash capital expenditure requirements for such replacements or for new capital expenditure requirements; > Adjusted EBITDA does not reflect changes in, or cash requirements for, Yelp's working capital needs; > Adjusted EBITDA does not reflect the impact of the record- ing or release of valuation allowances or tax payments that may represent a reduction in cash available to Yelp; > Adjusted EBITDA does not consider the potentially dilutive impact of equity-based compensation; > Adjusted EBITDA does not take into account any income or costs that management determines are not indicative of ongoing operating performance, such as restructuring costs; and > other companies, including those in Yelp’s industry, may calculate Adjusted EBITDA differently, which reduces its usefulness as a comparative measure. Because of these limitations, you should consider Adjusted EBITDA and Adjusted EBITDA margin alongside other financial performance measures, net income (loss) and Yelp’s other GAAP results. Forward-Looking Statements This letter contains, and statements made during the above-referenced webcast will contain, forward-looking statements relating to, among other things, the future per- formance of Yelp and its consolidated subsidiaries that are based on Yelp’s current expectations, forecasts and assump- tions and involve risks and uncertainties. These statements include, but are not limited to, statements regarding: > Yelp’s expected financial results for the second quarter and full year 2021; > Yelp being well positioned to fully participate in and benefit from economic recovery and to deliver long-term sustain- able growth in the years to come; > Yelp’s confidence in the performance of its sales team for the remainder of the year; > Yelp’s expectation that the benefits of its growth initiatives will ramp and drive revenue momentum over the remain- der of the year; > Yelp’s confidence that its consumer traffic will return organ- ically as more people are inoculated against COVID-19 and restrictions on businesses ease; > Yelp’s investment plans and priorities for the remainder of 2021, including improving the Services product experience and capturing more demand by prioritizing projects that help consumers find and connect with the right service providers while generating more targeted high-quality leads for its customers; > Yelp’s plan to continue to improve its business owner plat- form, including by increasing transparency for customers with new dashboards; > Yelp’s assessment of potential Self-serve investment opportunities that may become available as economies reopen and new businesses are formed;
22 23 Ye lp Q 1 2 0 21 > Yelp’s plan to capture a greater share of Multi-location advertisers’ budgets as the economy recovers by continuing to build and bundle new ad products and formats that allow brands to better target, connect with, and tell their stories to consumers, while further enhancing the matching and merchandising of its ad platform throughout the year; > Yelp’s plans to invest in product development, marketing and its Multi-location sales team to support its strategic initiatives and deliver more value to advertisers to drive its next phase of sustainable growth, as well as its belief that these investments will enable it to scale its business in a more profitable way over the long term through increased revenue retention and its more efficient go-to-market approach; > Yelp’s plans to reduce its real estate footprint and operate with most of its team primarily working remotely, including its plans to sublease certain office space; > Yelp’s expectations that it will incur an impairment charge in connection with its sublease of certain office space as early as the second quarter of 2021, that such sublease will reduce its real estate related expenses, and that operating with a distributed workforce will enable it to expand its presence in lower-cost markets and reduce its reliance on the Bay Area for talent; > Yelp’s expectation that its investments will continue ben- efiting both revenue and Adjusted EBITDA over the long term; > Yelp’s plans to continue repurchases under its stock repur- chase program; > Yelp’s confidence in its growth initiatives and its ability to capture the significant opportunity that lies ahead; and > Yelp’s plan to further invest in its initiatives to drive sustainable growth momentum and catch up on hiring in the second quarter, and its expectation that leverage will increase toward the end of 2021. Yelp’s actual results could differ materially from those pre- dicted or implied by such forward-looking statements and reported results should not be considered as an indication of future performance. Factors that could cause or contribute to such differences include, but are not limited to: > fluctuations in the number of COVID-19 cases, the pace at which vaccinations are administered in the United States, the timeframe for the lifting of COVID-19-related shelter- in-place orders, and the pace of the economic recovery in local economies and the United States generally; > the impact of fears or actual outbreaks of disease, including COVID-19, and any resulting changes in consumer behavior, economic conditions or governmental actions; > maintaining and expanding Yelp’s base of advertisers, particularly as many businesses reduce spending on advertising as a result of closures or operating restrictions in connection with the COVID-19 pandemic; > Yelp’s ability to continue to effectively operate with a primarily remote work force and attract and retain key talent; > Yelp’s limited operating history in an evolving industry; > Yelp’s ability to generate sufficient revenue to regain profitability, particularly in light of the ongoing impact of COVID-19 and Yelp’s relief initiatives; > Yelp’s ability to generate and maintain sufficient high- quality content from its users; > Potential strategic opportunities and Yelp’s ability to successfully manage the acquisition and integration of new businesses, solutions or technologies, as well as to monetize the acquired products, solutions or technologies; > Yelp’s reliance on traffic to its website from search engines like Google and Bing and the quality and reliability of such traffic; > maintaining a strong brand and managing negative publicity that may arise; and > Yelp’s ability to timely upgrade and develop its systems, infrastructure and customer service capabilities.

23 23 Ye lp Q 1 2 0 21 Factors that could cause or contribute to such differences also include, but are not limited to, those factors that could affect Yelp’s business, operating results and stock price included under the captions “Risk Factors” and “Manage- ment’s Discussion and Analysis of Financial Condition and Results of Operations” in Yelp’s most recent Annual Report on Form 10-K or Quarterly Report on Form 10-Q at http:// www.yelp-ir.com or the SEC’s website at www.sec.gov. Undue reliance should not be placed on the forward-looking statements in this letter or the above-referenced webcast, which are based on information available to Yelp on the date hereof. Such forward-looking statements do not include the potential impact of any acquisitions or divestitures that may be announced and/or completed after the date hereof. Yelp assumes no obligation to update such statements.


