Q4 and Full Year 2024 Letter to Shareholders February 13, 2025 yelp-ir.com Q4 and Full Year 2024 Letter to Shareholder s EXHIBIT 99.2
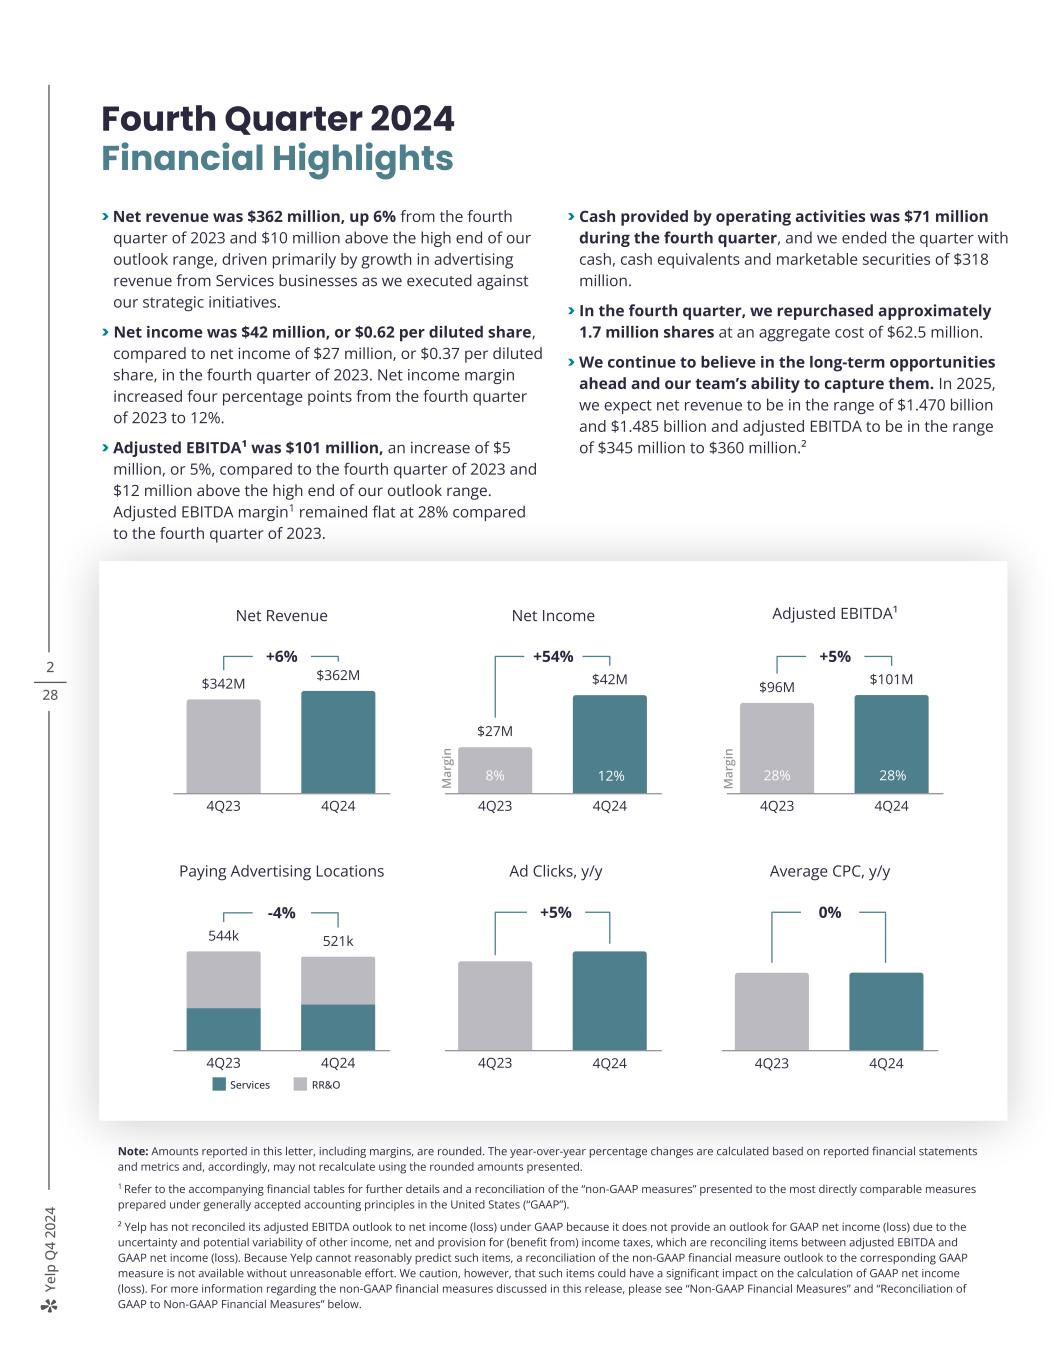
Ye lp Q 4 20 24 2 28 Note: Amounts reported in this letter, including margins, are rounded. The year-over-year percentage changes are calculated based on reported financial statements and metrics and, accordingly, may not recalculate using the rounded amounts presented. 1 Refer to the accompanying financial tables for further details and a reconciliation of the “non-GAAP measures” presented to the most directly comparable measures prepared under generally accepted accounting principles in the United States (“GAAP”). ² Yelp has not reconciled its adjusted EBITDA outlook to net income (loss) under GAAP because it does not provide an outlook for GAAP net income (loss) due to the uncertainty and potential variability of other income, net and provision for (benefit from) income taxes, which are reconciling items between adjusted EBITDA and GAAP net income (loss). Because Yelp cannot reasonably predict such items, a reconciliation of the non-GAAP financial measure outlook to the corresponding GAAP measure is not available without unreasonable effort. We caution, however, that such items could have a significant impact on the calculation of GAAP net income (loss). For more information regarding the non-GAAP financial measures discussed in this release, please see “Non-GAAP Financial Measures” and “Reconciliation of GAAP to Non-GAAP Financial Measures” below. Fourth Quarter 2024 Financial Highlights > Net revenue was $362 million, up 6% from the fourth quarter of 2023 and $10 million above the high end of our outlook range, driven primarily by growth in advertising revenue from Services businesses as we executed against our strategic initiatives. > Net income was $42 million, or $0.62 per diluted share, compared to net income of $27 million, or $0.37 per diluted share, in the fourth quarter of 2023. Net income margin increased four percentage points from the fourth quarter of 2023 to 12%. > Adjusted EBITDA¹ was $101 million, an increase of $5 million, or 5%, compared to the fourth quarter of 2023 and $12 million above the high end of our outlook range. Adjusted EBITDA margin1 remained flat at 28% compared to the fourth quarter of 2023. > Cash provided by operating activities was $71 million during the fourth quarter, and we ended the quarter with cash, cash equivalents and marketable securities of $318 million. > In the fourth quarter, we repurchased approximately 1.7 million shares at an aggregate cost of $62.5 million. > We continue to believe in the long-term opportunities ahead and our team’s ability to capture them. In 2025, we expect net revenue to be in the range of $1.470 billion and $1.485 billion and adjusted EBITDA to be in the range of $345 million to $360 million.² 19% 17% Net Revenue +6% $342M $362M 4Q23 4Q24 Ad Clicks, y/y +5% 4Q23 4Q24 Average CPC, y/y 0% 4Q23 4Q24 Paying Advertising Locations -4% 544k 521k 4Q23 4Q24 Services RR&O Adjusted EBITDA¹ +5% $96M $101M 4Q23 4Q24 M ar gi n 28% 28%8% 7% M ar gi n Net Income +54% $27M $42M 4Q23 4Q24 12%
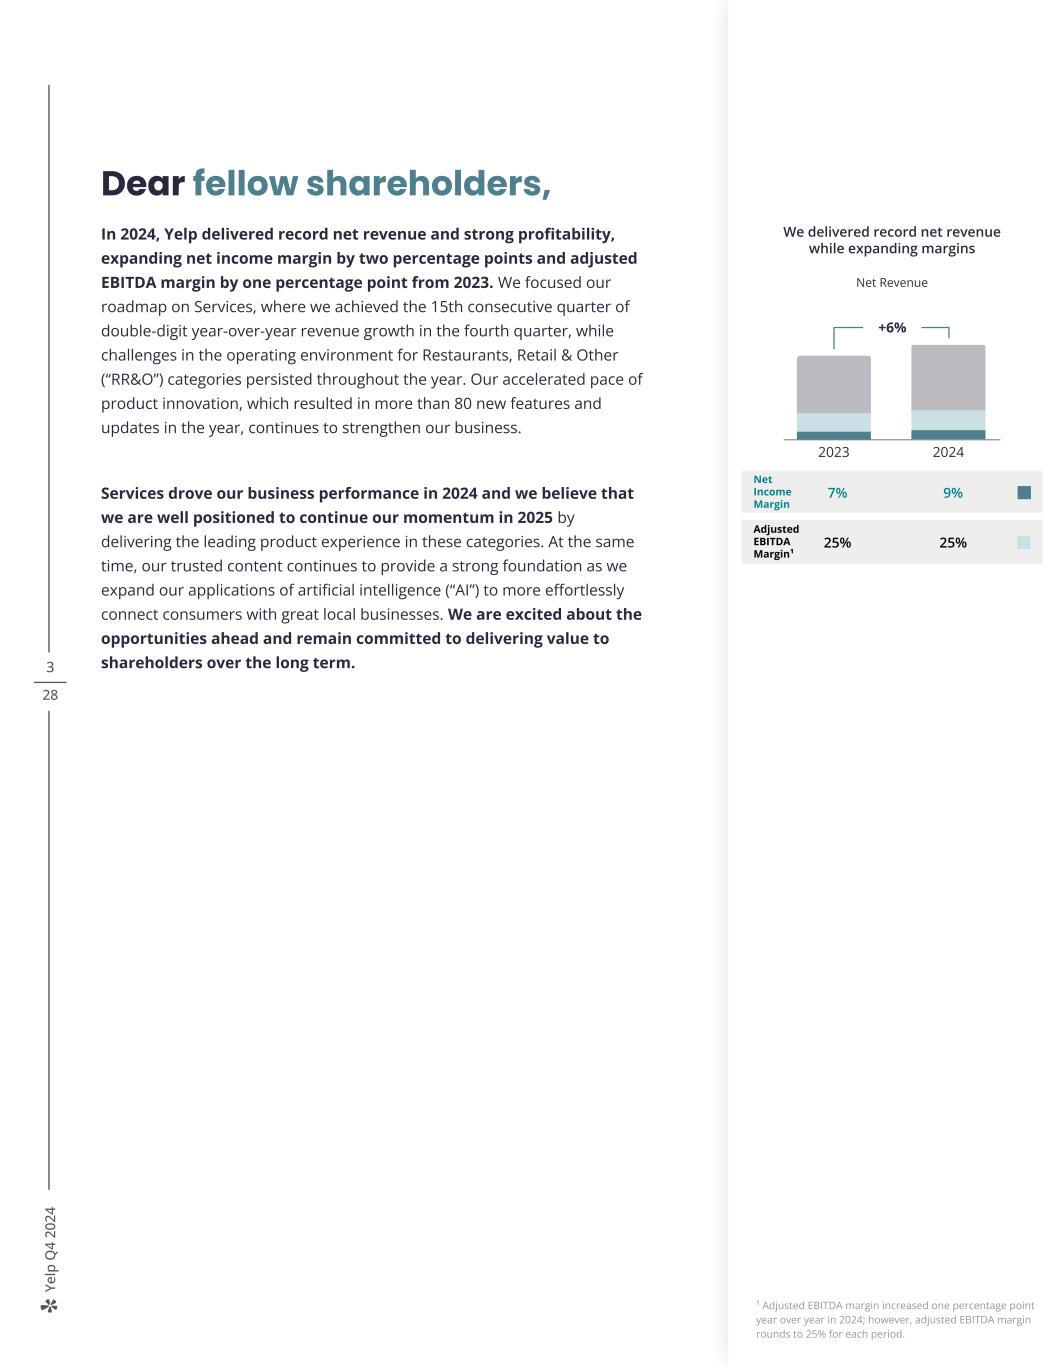
Ye lp Q 4 20 24 3 28 Dear fellow shareholders, In 2024, Yelp delivered record net revenue and strong profitability, expanding net income margin by two percentage points and adjusted EBITDA margin by one percentage point from 2023. We focused our roadmap on Services, where we achieved the 15th consecutive quarter of double-digit year-over-year revenue growth in the fourth quarter, while challenges in the operating environment for Restaurants, Retail & Other (“RR&O”) categories persisted throughout the year. Our accelerated pace of product innovation, which resulted in more than 80 new features and updates in the year, continues to strengthen our business. Services drove our business performance in 2024 and we believe that we are well positioned to continue our momentum in 2025 by delivering the leading product experience in these categories. At the same time, our trusted content continues to provide a strong foundation as we expand our applications of artificial intelligence (“AI”) to more effortlessly connect consumers with great local businesses. We are excited about the opportunities ahead and remain committed to delivering value to shareholders over the long term. +2 ppt 3% 4% 2Q22 2Q23 Net Income Margin 2023 2024 Net Income Margin 9%7% Adjusted EBITDA Margin¹ 25%25% +6% We delivered record net revenue while expanding margins Net Revenue ¹ Adjusted EBITDA margin increased one percentage point year over year in 2024; however, adjusted EBITDA margin rounds to 25% for each period.
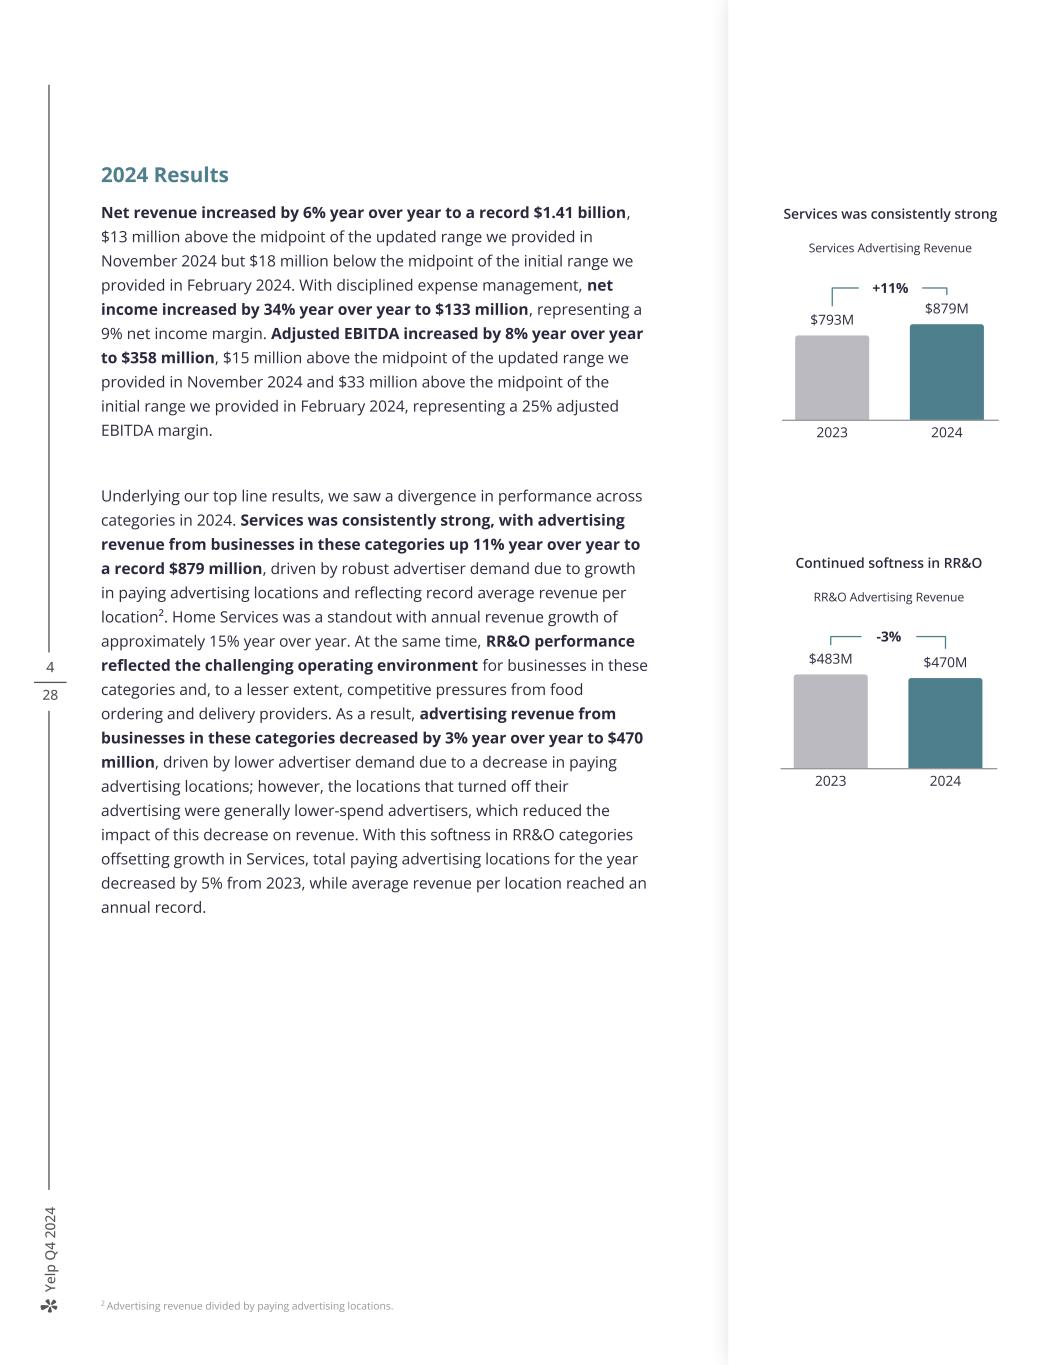
Ye lp Q 4 20 24 4 28 2024 Results Net revenue increased by 6% year over year to a record $1.41 billion, $13 million above the midpoint of the updated range we provided in November 2024 but $18 million below the midpoint of the initial range we provided in February 2024. With disciplined expense management, net income increased by 34% year over year to $133 million, representing a 9% net income margin. Adjusted EBITDA increased by 8% year over year to $358 million, $15 million above the midpoint of the updated range we provided in November 2024 and $33 million above the midpoint of the initial range we provided in February 2024, representing a 25% adjusted EBITDA margin. Underlying our top line results, we saw a divergence in performance across categories in 2024. Services was consistently strong, with advertising revenue from businesses in these categories up 11% year over year to a record $879 million, driven by robust advertiser demand due to growth in paying advertising locations and reflecting record average revenue per location². Home Services was a standout with annual revenue growth of approximately 15% year over year. At the same time, RR&O performance reflected the challenging operating environment for businesses in these categories and, to a lesser extent, competitive pressures from food ordering and delivery providers. As a result, advertising revenue from businesses in these categories decreased by 3% year over year to $470 million, driven by lower advertiser demand due to a decrease in paying advertising locations; however, the locations that turned off their advertising were generally lower-spend advertisers, which reduced the impact of this decrease on revenue. With this softness in RR&O categories offsetting growth in Services, total paying advertising locations for the year decreased by 5% from 2023, while average revenue per location reached an annual record. 2 Advertising revenue divided by paying advertising locations. +11% $793M $879M 2023 2024 Services was consistently strong Services Advertising Revenue -3% $483M $470M 2023 2024 Continued softness in RR&O RR&O Advertising Revenue
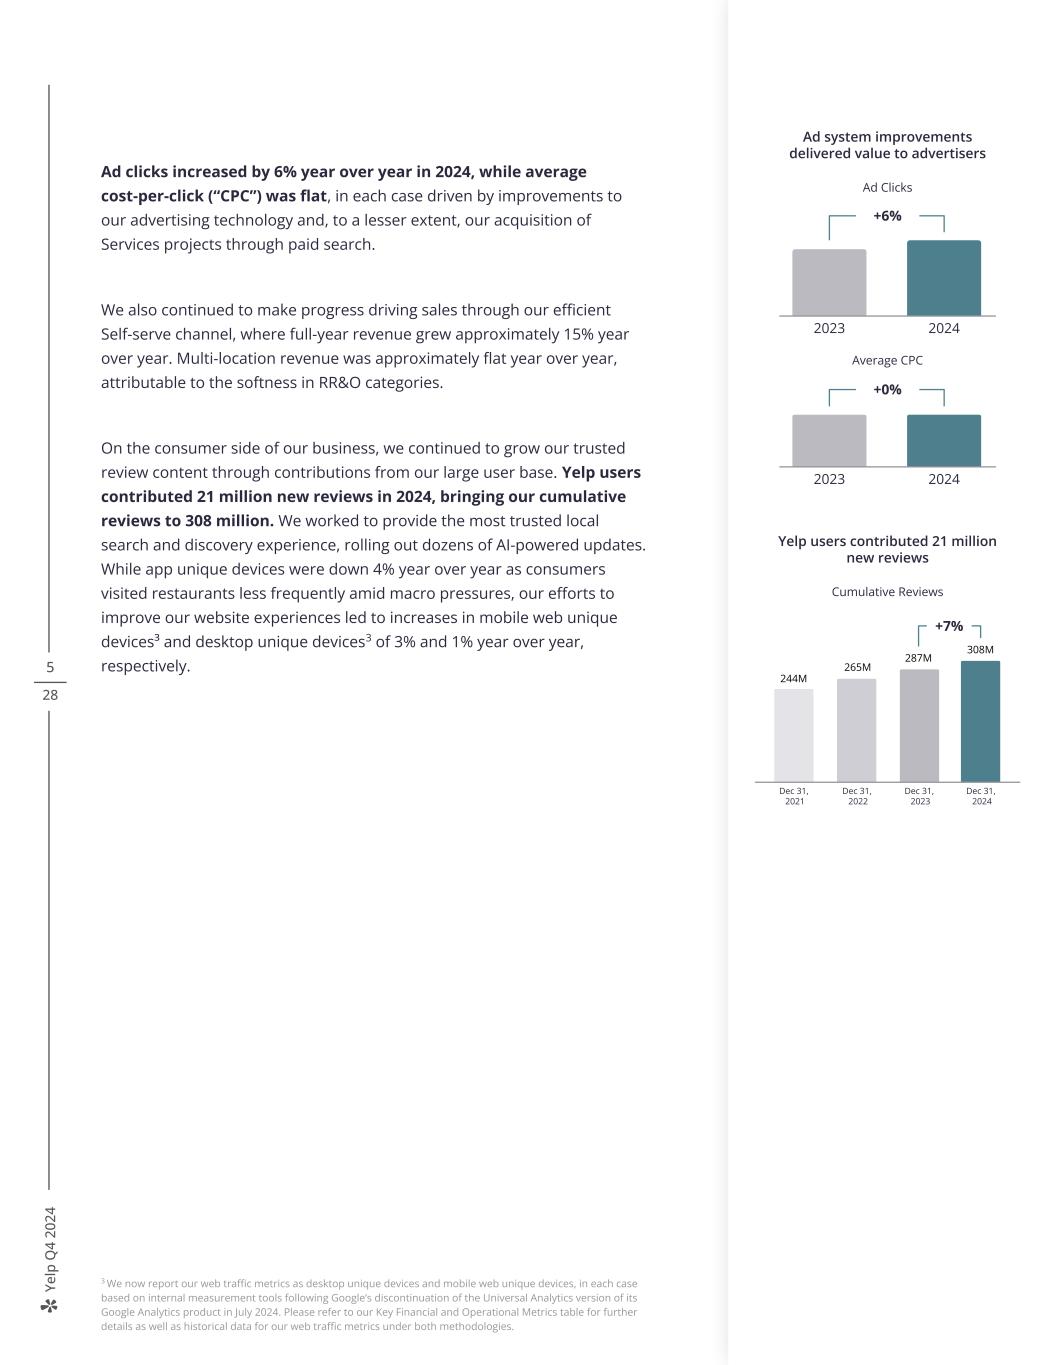
Ye lp Q 4 20 24 5 28 Ad clicks increased by 6% year over year in 2024, while average cost-per-click (“CPC”) was flat, in each case driven by improvements to our advertising technology and, to a lesser extent, our acquisition of Services projects through paid search. We also continued to make progress driving sales through our efficient Self-serve channel, where full-year revenue grew approximately 15% year over year. Multi-location revenue was approximately flat year over year, attributable to the softness in RR&O categories. On the consumer side of our business, we continued to grow our trusted review content through contributions from our large user base. Yelp users contributed 21 million new reviews in 2024, bringing our cumulative reviews to 308 million. We worked to provide the most trusted local search and discovery experience, rolling out dozens of AI-powered updates. While app unique devices were down 4% year over year as consumers visited restaurants less frequently amid macro pressures, our efforts to improve our website experiences led to increases in mobile web unique devices³ and desktop unique devices3 of 3% and 1% year over year, respectively. 3 We now report our web traffic metrics as desktop unique devices and mobile web unique devices, in each case based on internal measurement tools following Google’s discontinuation of the Universal Analytics version of its Google Analytics product in July 2024. Please refer to our Key Financial and Operational Metrics table for further details as well as historical data for our web traffic metrics under both methodologies. $94 $112 308M Yelp users contributed 21 million new reviews Cumulative Reviews Dec 31, 2021 Dec 31, 2022 Dec 31, 2023 Dec 31, 2024 265M 287M 244M +7% +6% 2023 2024 Ad system improvements delivered value to advertisers Ad Clicks +0% 2023 2024 Average CPC

Ye lp Q 4 20 24 6 28 Initiatives to drive long-term, profitable growth Investments in our product-led strategy, including more than 80 new product and feature updates in 2024, have helped maintain Yelp’s position as a leading platform for consumers to discover and connect with great local businesses across a broad range of categories. We plan to build on this position in 2025 by investing in three strategic initiatives to drive profitable growth: > Lead in Services > Drive advertiser value > Transform the consumer experience Underlying each investment area, we plan to accelerate our strategy with AI, which we believe we are well-positioned to leverage based on our high-quality, trusted content. Our updated review submission flow enables users to post high-resolution videos AI-powered review topics suggest helpful items for contributors to cover when writing a review Depictions of Yelp's features are provided for illustrative purposes only, and may differ from the actual product.

Ye lp Q 4 20 24 7 28 Lead in Services The Home Services category was the major focus of our strategy in 2024 and has been the largest driver of growth in Services for many years, reflected in an approximately 20% compound annual growth rate over the last decade. As a result, Services revenue achieved double-digit year-over-year growth in each of the last 15 consecutive quarters and reached 65% of total advertising revenue in 2024. Looking ahead, we are deepening our focus in this area; we plan to continue investing to support our momentum in Home Services while broadening our roadmap to create best-in-class experiences for additional Services categories. In 2024, we launched a number of new products and features to facilitate even better connections between consumers and service pros. Our AI chatbot, Yelp Assistant, has particularly resonated with consumers, with project submissions through this feature increasing by more than 50% from the third to fourth quarter. To help service pros more easily evaluate leads4, we enhanced the business owner inbox by providing AI-powered summaries of crucial job information. We also experimented with paid search to acquire Services projects off Yelp. While we saw strong top-of-funnel results, we ultimately reduced our spend on this initiative as it did not provide our desired return, though we are continuing to iterate on it at a lower level of investment. Request-a-Quote projects increased by approximately 25% year over year in 2024, primarily as a result of improvements to the request flow. This includes approximately 30% year-over-year growth in the fourth quarter, despite our minimal spending on paid search in the quarter. 4 Leads include phone calls, requests and website clicks. AI-powered summaries in the business owner inbox 2023 28% 62% 2024 RR&O Services 65% Services revenue reached 65% of total advertising revenue in 2024 Ad Revenue by Category, % of Total Home Services has been the largest driver of Services growth for nearly a decade Home Services Revenue 2015 ~25% CAGR 2016 2017 2018 2019 2020 2021 2022 2023 2024 Depictions of Yelp's features are provided for illustrative purposes only, and may differ from the actual product.
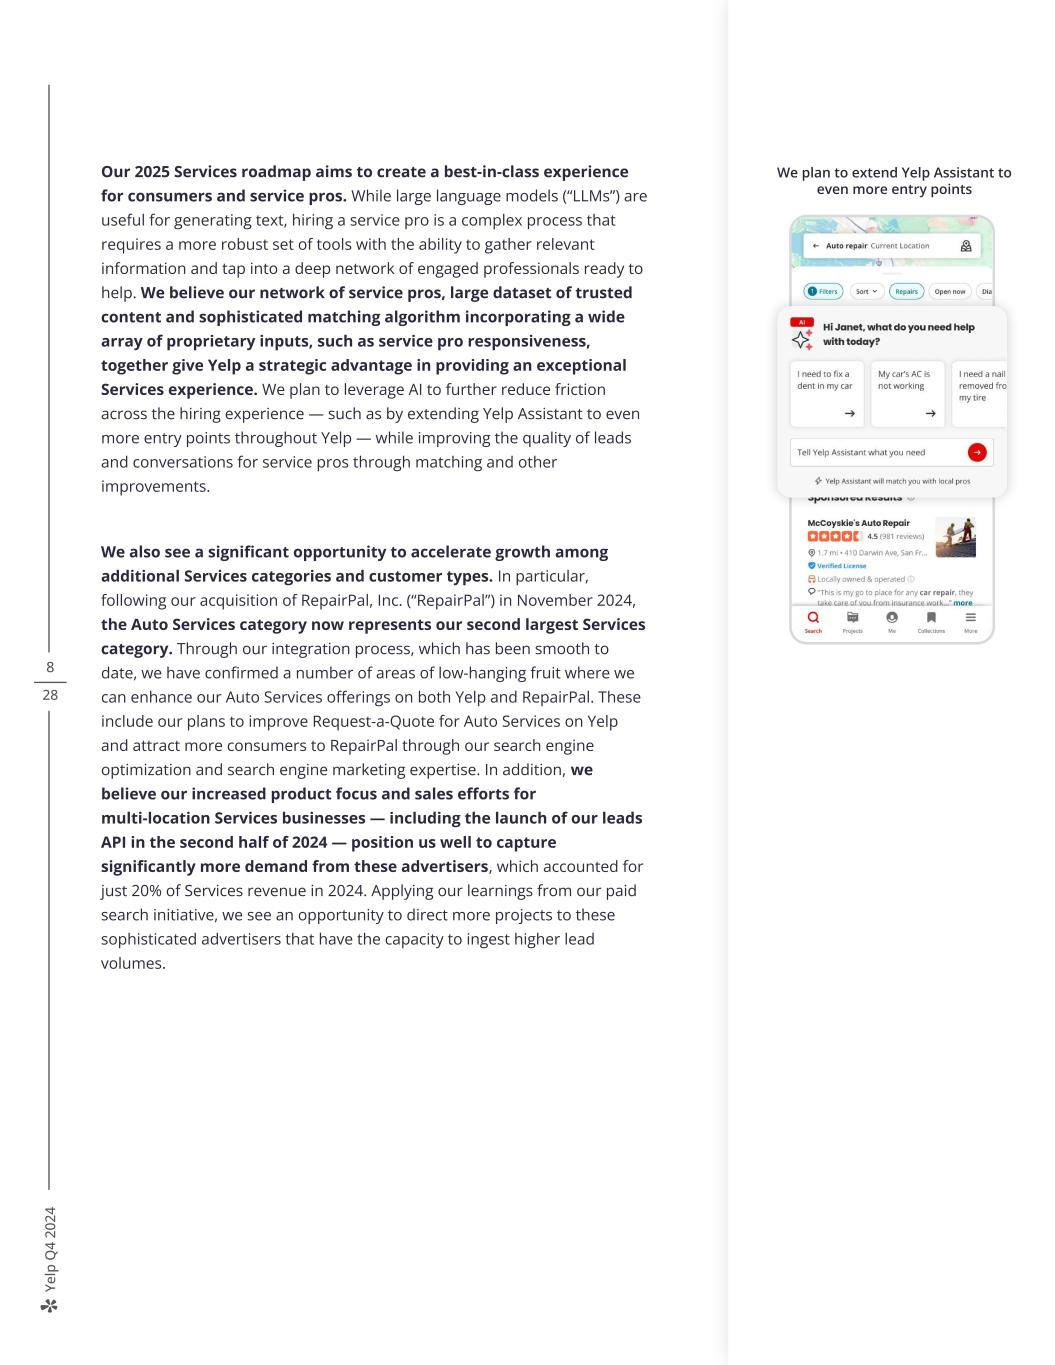
Ye lp Q 4 20 24 8 28 Our 2025 Services roadmap aims to create a best-in-class experience for consumers and service pros. While large language models (“LLMs”) are useful for generating text, hiring a service pro is a complex process that requires a more robust set of tools with the ability to gather relevant information and tap into a deep network of engaged professionals ready to help. We believe our network of service pros, large dataset of trusted content and sophisticated matching algorithm incorporating a wide array of proprietary inputs, such as service pro responsiveness, together give Yelp a strategic advantage in providing an exceptional Services experience. We plan to leverage AI to further reduce friction across the hiring experience — such as by extending Yelp Assistant to even more entry points throughout Yelp — while improving the quality of leads and conversations for service pros through matching and other improvements. We also see a significant opportunity to accelerate growth among additional Services categories and customer types. In particular, following our acquisition of RepairPal, Inc. (“RepairPal”) in November 2024, the Auto Services category now represents our second largest Services category. Through our integration process, which has been smooth to date, we have confirmed a number of areas of low-hanging fruit where we can enhance our Auto Services offerings on both Yelp and RepairPal. These include our plans to improve Request-a-Quote for Auto Services on Yelp and attract more consumers to RepairPal through our search engine optimization and search engine marketing expertise. In addition, we believe our increased product focus and sales efforts for multi-location Services businesses — including the launch of our leads API in the second half of 2024 — position us well to capture significantly more demand from these advertisers, which accounted for just 20% of Services revenue in 2024. Applying our learnings from our paid search initiative, we see an opportunity to direct more projects to these sophisticated advertisers that have the capacity to ingest higher lead volumes. We plan to extend Yelp Assistant to even more entry points
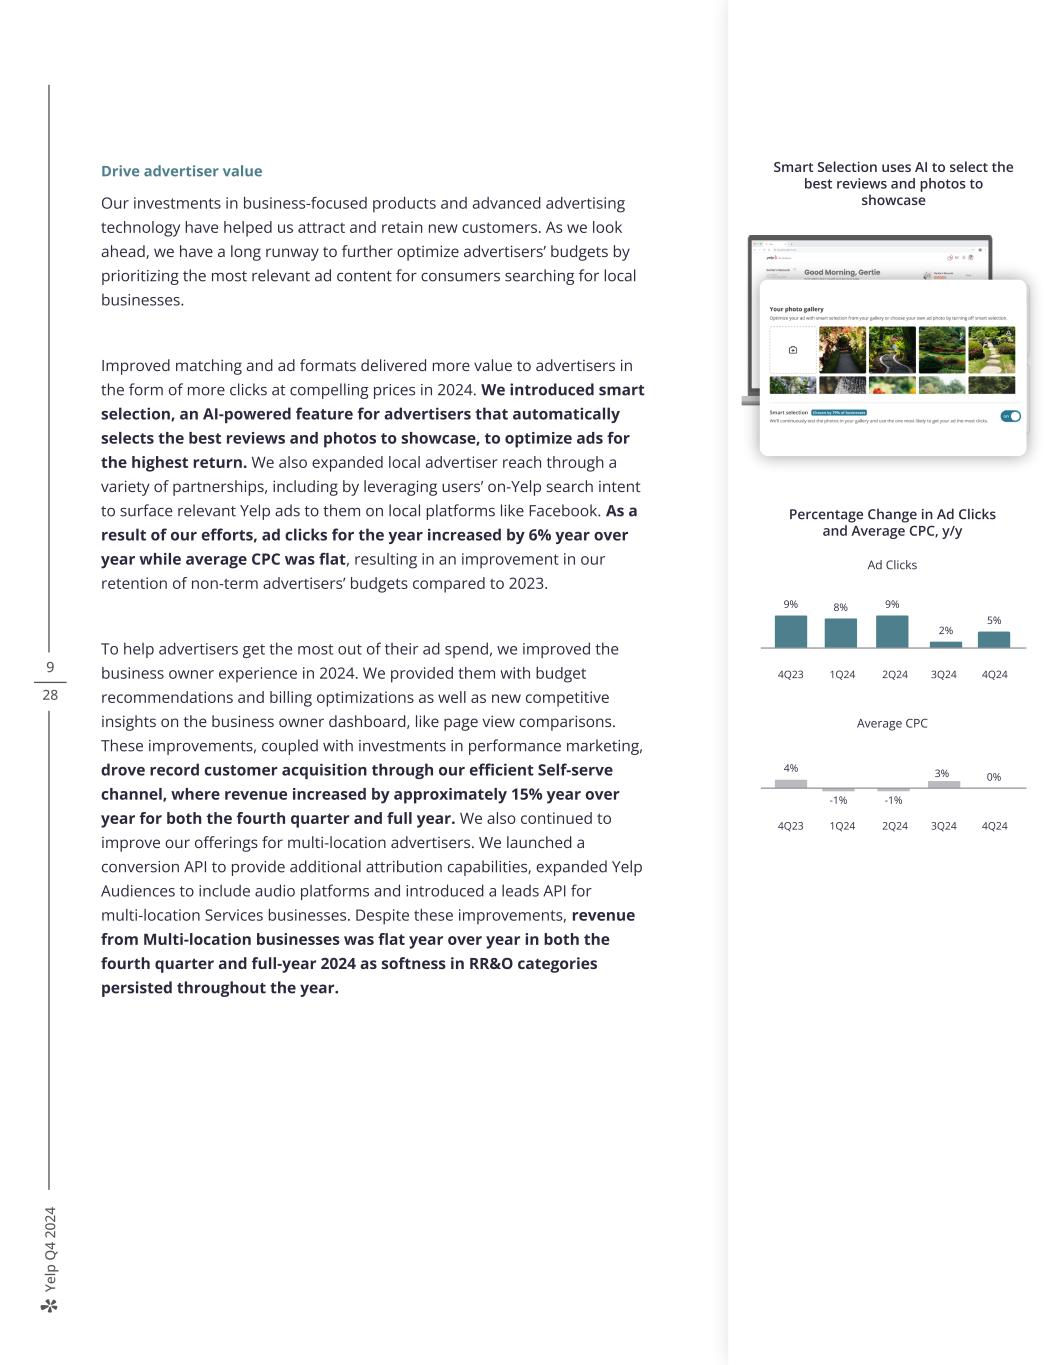
Ye lp Q 4 20 24 9 28 Drive advertiser value Our investments in business-focused products and advanced advertising technology have helped us attract and retain new customers. As we look ahead, we have a long runway to further optimize advertisers’ budgets by prioritizing the most relevant ad content for consumers searching for local businesses. Improved matching and ad formats delivered more value to advertisers in the form of more clicks at compelling prices in 2024. We introduced smart selection, an AI-powered feature for advertisers that automatically selects the best reviews and photos to showcase, to optimize ads for the highest return. We also expanded local advertiser reach through a variety of partnerships, including by leveraging users’ on-Yelp search intent to surface relevant Yelp ads to them on local platforms like Facebook. As a result of our efforts, ad clicks for the year increased by 6% year over year while average CPC was flat, resulting in an improvement in our retention of non-term advertisers’ budgets compared to 2023. To help advertisers get the most out of their ad spend, we improved the business owner experience in 2024. We provided them with budget recommendations and billing optimizations as well as new competitive insights on the business owner dashboard, like page view comparisons. These improvements, coupled with investments in performance marketing, drove record customer acquisition through our efficient Self-serve channel, where revenue increased by approximately 15% year over year for both the fourth quarter and full year. We also continued to improve our offerings for multi-location advertisers. We launched a conversion API to provide additional attribution capabilities, expanded Yelp Audiences to include audio platforms and introduced a leads API for multi-location Services businesses. Despite these improvements, revenue from Multi-location businesses was flat year over year in both the fourth quarter and full-year 2024 as softness in RR&O categories persisted throughout the year. AI-powered business summaries surface unique insights about a business New Recognitions celebrate the helpful contributions of users Smart Selection uses AI to select the best reviews and photos to showcase Percentage Change in Ad Clicks and Average CPC, y/y Ad Clicks 9% 4Q23 1Q24 3Q24 4Q24 5% 8% 9% 2% -1% Average CPC 4% 4Q23 1Q24 2Q24 3Q24 4Q24 -1% 0% 2Q24 3%
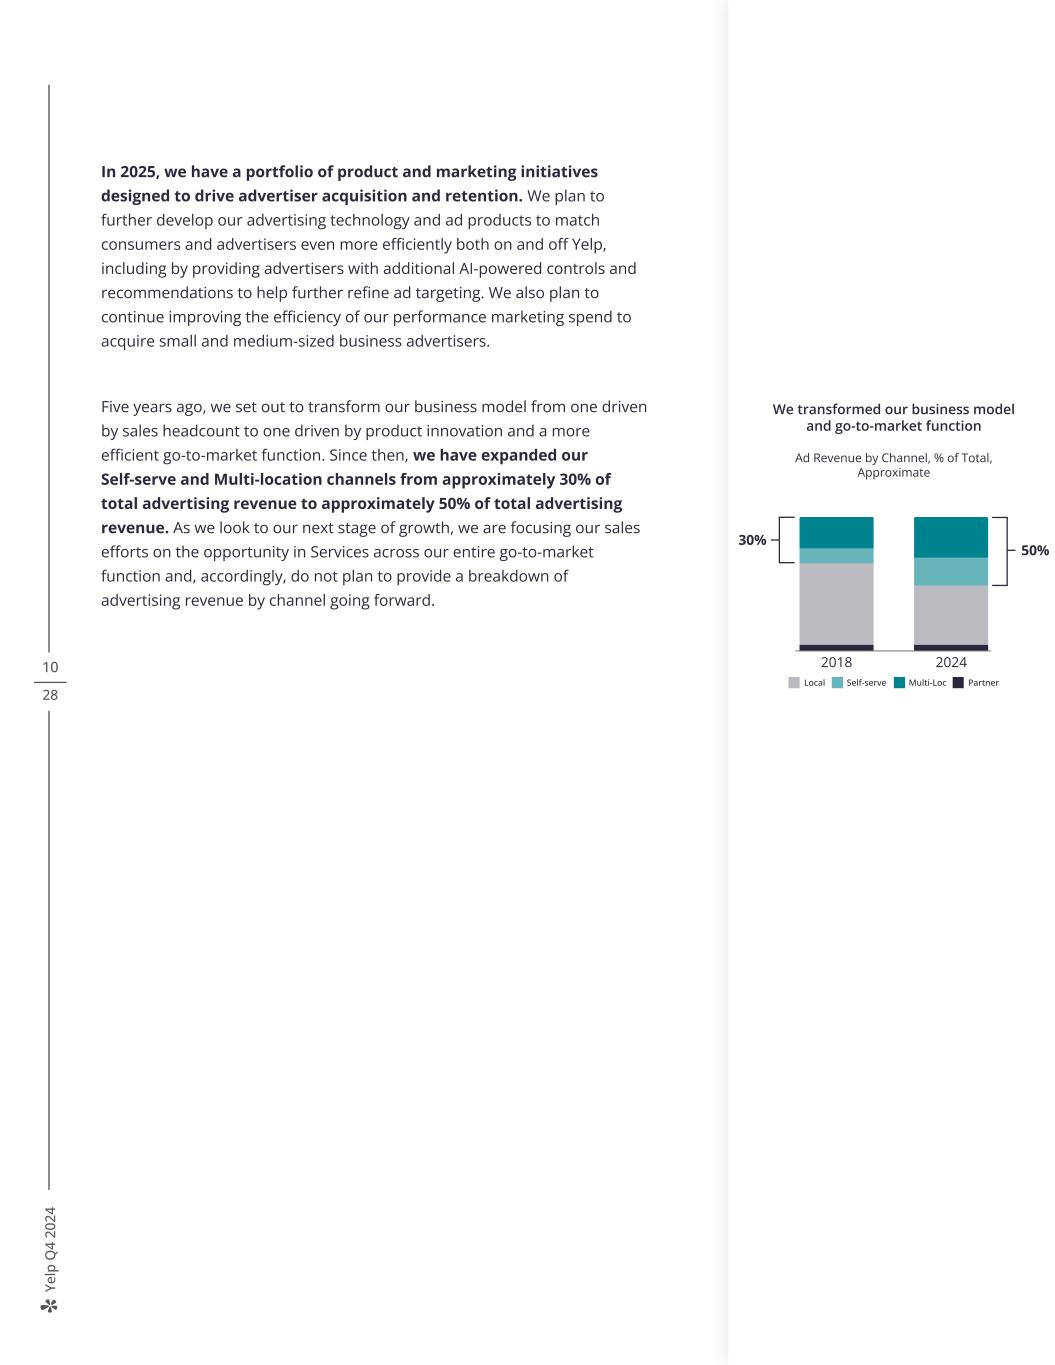
Ye lp Q 4 20 24 10 28 In 2025, we have a portfolio of product and marketing initiatives designed to drive advertiser acquisition and retention. We plan to further develop our advertising technology and ad products to match consumers and advertisers even more efficiently both on and off Yelp, including by providing advertisers with additional AI-powered controls and recommendations to help further refine ad targeting. We also plan to continue improving the efficiency of our performance marketing spend to acquire small and medium-sized business advertisers. Five years ago, we set out to transform our business model from one driven by sales headcount to one driven by product innovation and a more efficient go-to-market function. Since then, we have expanded our Self-serve and Multi-location channels from approximately 30% of total advertising revenue to approximately 50% of total advertising revenue. As we look to our next stage of growth, we are focusing our sales efforts on the opportunity in Services across our entire go-to-market function and, accordingly, do not plan to provide a breakdown of advertising revenue by channel going forward. AI-powered business summaries surface unique insights about a business New Recognitions celebrate the helpful contributions of users 2018 2024 Self-serveLocal Multi-Loc Partner 28%30% 50% We transformed our business model and go-to-market function Ad Revenue by Channel, % of Total, Approximate

Ye lp Q 4 20 24 11 28 Transform the consumer experience Yelp’s high-quality, trusted content has made it a leading resource for consumers to search for and discover great local businesses. In 2024, we rolled out a number of new features and updates to enhance the Yelp experience and drive user engagement. We updated the Yelp app’s home feed to surface additional types of content, like Collections, while also making it a more visual experience by showcasing user-generated videos; following our rollout of these updates, we saw a significant increase in home feed engagement compared to before their launch. We also enhanced the search experience by introducing trending searches and businesses to inspire exploration and highlight popular new spots nearby. Additionally, we redesigned Yelp business pages to make it even easier for users to find what they’re looking for, including by adding a new “People also search for” section that uses AI to recommend relevant searches. Overall, these improvements to the search experience benefited consumer searches following their implementation. For consumers engaging with our trusted reviews, we launched Review Insights, which leverages LLMs to gauge reviewer sentiment about common aspects of a business, such as the quality of its food, service, ambiance, wait time and drinks. Lastly, we made a number of user experience and backend improvements to our mobile and desktop websites that led to a combined year-over-year increase in page views on these platforms in 2024. In 2025, we plan to continue leveraging AI to transform the consumer experience. We plan to experiment with extending Yelp Assistant to other categories and making it accessible through additional entry points. We also expect to make the home feed even more personalized and dynamic by using AI to help consumers discover new and relevant businesses. In addition, we have plans to create an even more seamless and actionable search experience to help consumers find and connect with the right businesses for their needs. LLM-powered Review Insights Enhanced user-generated videos in the home feed
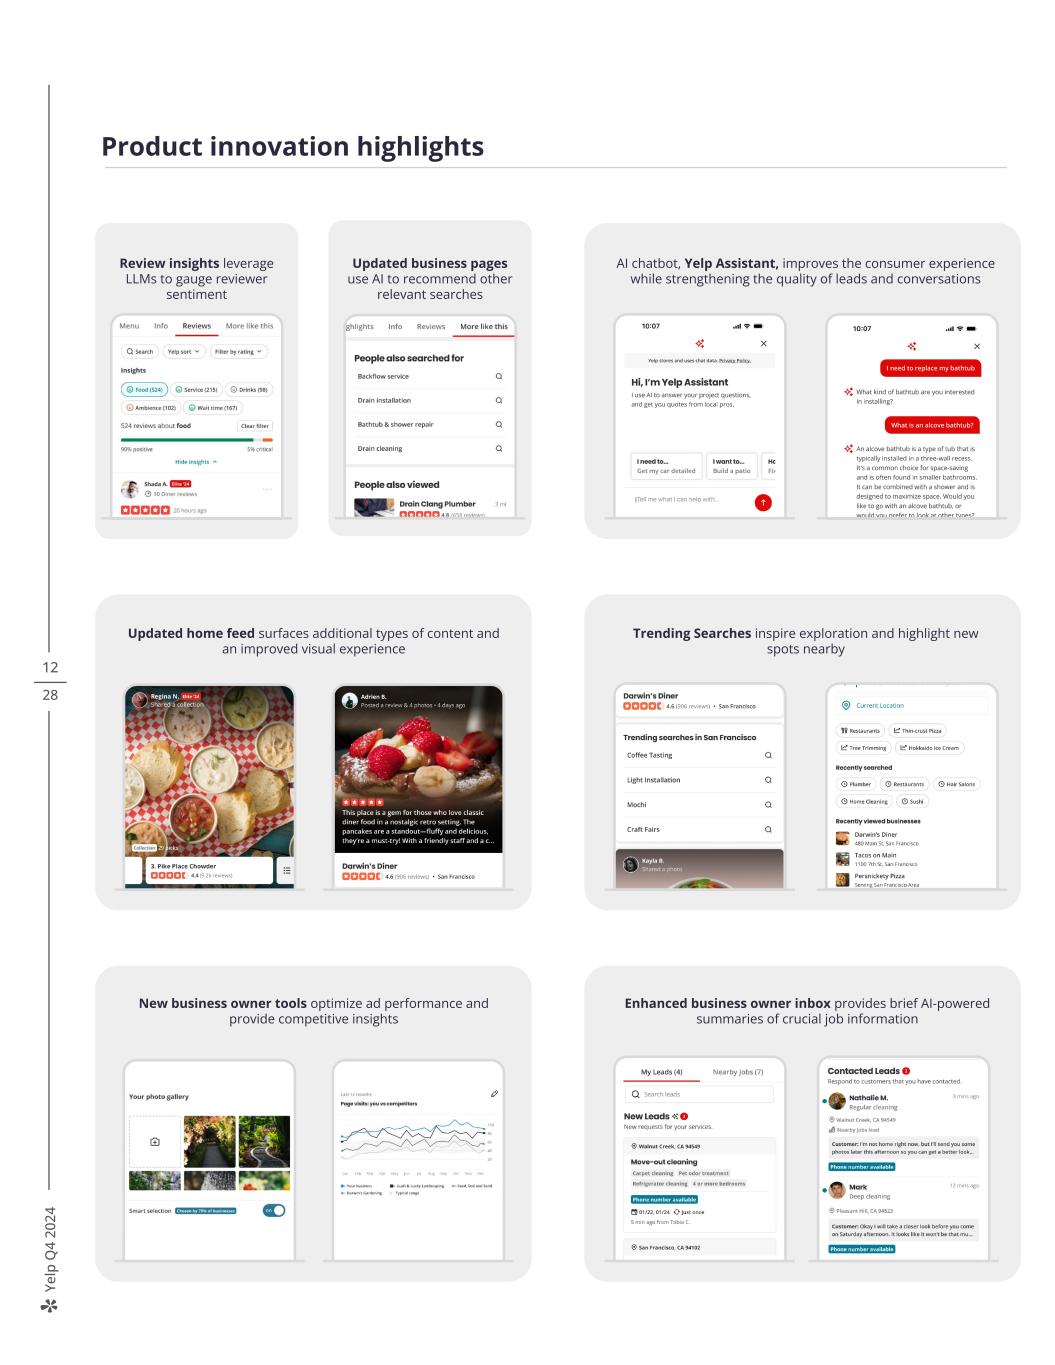
Ye lp Q 4 20 24 Updated business pages use AI to recommend other relevant searches Review insights leverage LLMs to gauge reviewer sentiment Enhanced business owner inbox provides brief AI-powered summaries of crucial job information 28 12 Product innovation highlights AI chatbot, Yelp Assistant, improves the consumer experience while strengthening the quality of leads and conversations Updated home feed surfaces additional types of content and an improved visual experience Trending Searches inspire exploration and highlight new spots nearby New business owner tools optimize ad performance and provide competitive insights
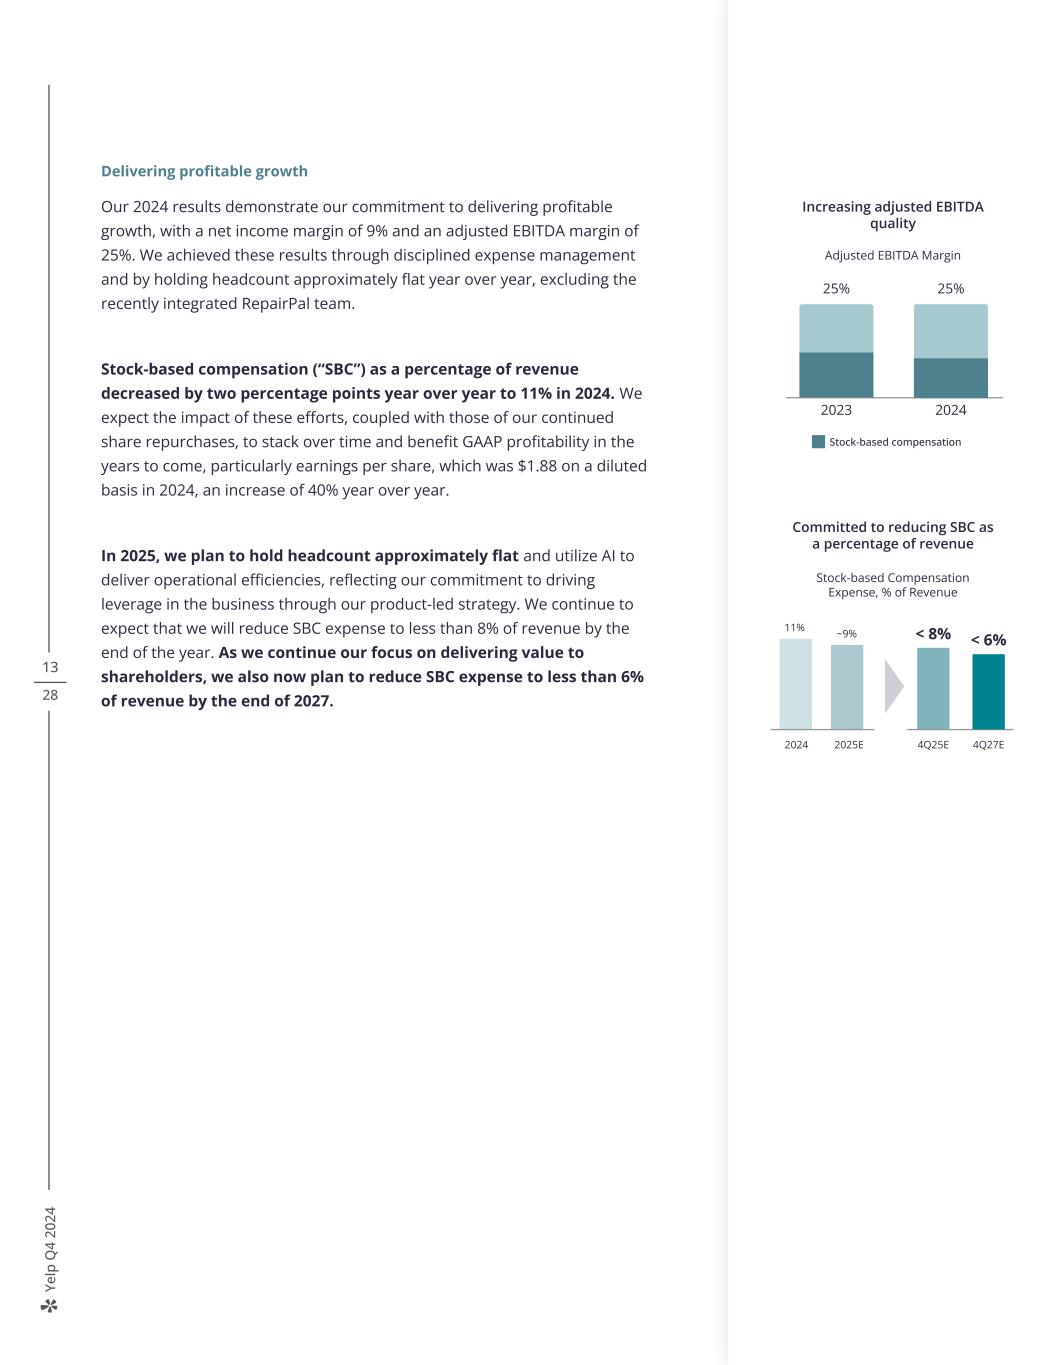
Ye lp Q 4 20 24 13 28 Delivering profitable growth Our 2024 results demonstrate our commitment to delivering profitable growth, with a net income margin of 9% and an adjusted EBITDA margin of 25%. We achieved these results through disciplined expense management and by holding headcount approximately flat year over year, excluding the recently integrated RepairPal team. Stock-based compensation (“SBC”) as a percentage of revenue decreased by two percentage points year over year to 11% in 2024. We expect the impact of these efforts, coupled with those of our continued share repurchases, to stack over time and benefit GAAP profitability in the years to come, particularly earnings per share, which was $1.88 on a diluted basis in 2024, an increase of 40% year over year. In 2025, we plan to hold headcount approximately flat and utilize AI to deliver operational efficiencies, reflecting our commitment to driving leverage in the business through our product-led strategy. We continue to expect that we will reduce SBC expense to less than 8% of revenue by the end of the year. As we continue our focus on delivering value to shareholders, we also now plan to reduce SBC expense to less than 6% of revenue by the end of 2027. Total Repurchase Authorization Authorization Date Prudent Capital Allocation $2.0B Completed as of Dec. 31, 2024 Remaining Authorization $200M $250M $250M $250M $250M $250M Nov ‘22Jul ‘17 Nov ‘18 Feb ‘19 Jan ‘20 Aug ‘21 Feb ‘24 $500M2023 2024 Stock-based compensation 25% 25% Increasing adjusted EBITDA quality Adjusted EBITDA Margin 4Q25E 4Q27E Committed to reducing SBC as a percentage of revenue Stock-based Compensation Expense, % of Revenue 11% ~9% < 8% 2024 2025E < 6%
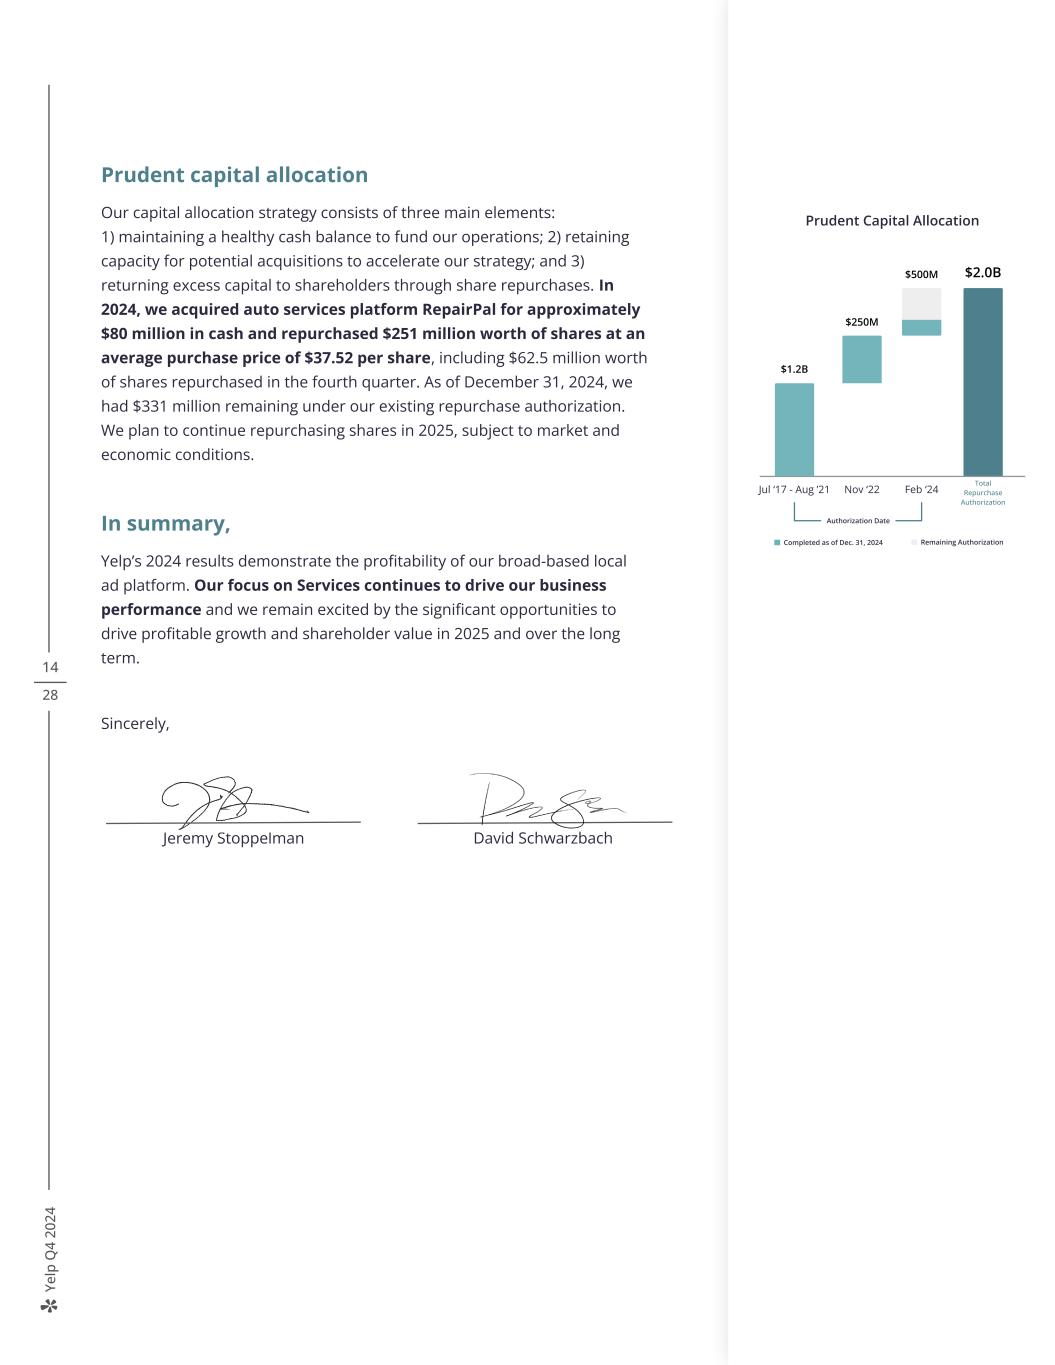
Ye lp Q 4 20 24 14 28 Prudent capital allocation Our capital allocation strategy consists of three main elements: 1) maintaining a healthy cash balance to fund our operations; 2) retaining capacity for potential acquisitions to accelerate our strategy; and 3) returning excess capital to shareholders through share repurchases. In 2024, we acquired auto services platform RepairPal for approximately $80 million in cash and repurchased $251 million worth of shares at an average purchase price of $37.52 per share, including $62.5 million worth of shares repurchased in the fourth quarter. As of December 31, 2024, we had $331 million remaining under our existing repurchase authorization. We plan to continue repurchasing shares in 2025, subject to market and economic conditions. In summary, Yelp’s 2024 results demonstrate the profitability of our broad-based local ad platform. Our focus on Services continues to drive our business performance and we remain excited by the significant opportunities to drive profitable growth and shareholder value in 2025 and over the long term. Sincerely, Total Repurchase Authorization Authorization Date Prudent Capital Allocation $2.0B Completed as of June 30, 2024 Remaining Authorization $200M $250M $250M $250M $250M $250M Nov ‘22Jul ‘17 Nov ‘18 Feb ‘19 Jan ‘20 Aug ‘21 Feb ‘24 $500M Jeremy Stoppelman David Schwarzbach Total Repurchase Authorization Jul ‘17 - Aug ’21 Nov ‘22 Feb ‘24 $2.0B$500M $250M $1.2B Prudent Capital Allocation Authorization Date Completed as of Dec. 31, 2024 Remaining Authorization

Ye lp Q 4 20 24 15 28 Revenue Net revenue was $362 million in the fourth quarter of 2024, a 6% increase from the fourth quarter of 2023. Net revenue was $1.41 billion in the full year 2024, a 6% increase from the full year 2023. Net revenue was above the high end of both our fourth quarter outlook range and the updated full year outlook range we provided in November 2024. Advertising revenue was $346 million in the fourth quarter of 2024, up 6% from the fourth quarter of 2023, and $1.35 billion in the full year 2024, up 6% from the full year 2023, primarily due to year-over-year increases in ad clicks in both periods. Other revenue was $16 million in the fourth quarter of 2024, up 9% from the fourth quarter of 2023, and $63 million in the full year 2024, up 4% from the full year 2023. The increases in both periods were primarily driven by higher revenue from the continued growth of our Yelp Fusion, Yelp Guest Manager and Yelp Fusion Insights (formerly Yelp Knowledge) programs. These increases were partially offset by a lower volume of food takeout and delivery orders compared to the prior-year periods. Net Revenue by Product (In thousands; unaudited) Fourth Quarter and Full Year 2024 Financial Review Three Months Ended December 31, Year Ended December 31, 2024 2023 2024 2023 Net revenue by product: Advertising revenue by category: Services $ 224,840 $ 203,140 $ 879,092 $ 793,112 Restaurants, Retail & Other 120,798 124,231 469,928 483,406 Advertising 345,638 327,371 1,349,020 1,276,518 Other¹ 16,314 15,005 63,044 60,544 Total net revenue $ 361,952 $ 342,376 $ 1,412,064 $ 1,337,062 ¹ For the three and twelve months ended December 31, 2024, other revenue includes revenue generated from transactions with consumers, which the Company reported separately as transactions revenue in prior periods. Prior-period amounts in the table above have been reclassified to conform to the current-period presentation. Net Revenue +6% $342M $362M 4Q23 4Q24
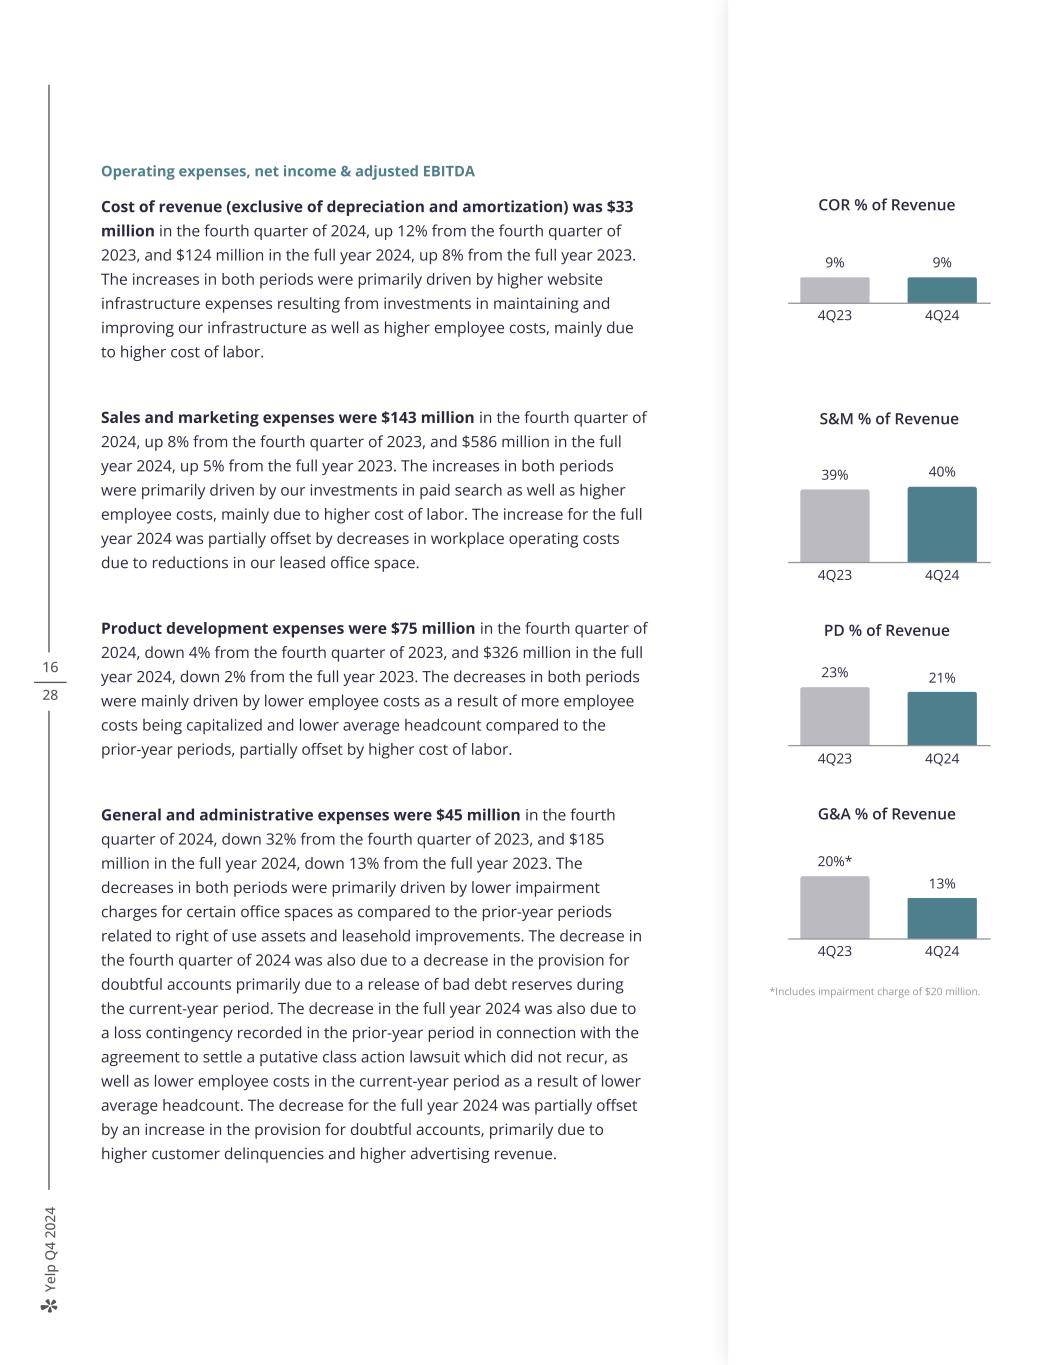
Ye lp Q 4 20 24 16 28 Operating expenses, net income & adjusted EBITDA Cost of revenue (exclusive of depreciation and amortization) was $33 million in the fourth quarter of 2024, up 12% from the fourth quarter of 2023, and $124 million in the full year 2024, up 8% from the full year 2023. The increases in both periods were primarily driven by higher website infrastructure expenses resulting from investments in maintaining and improving our infrastructure as well as higher employee costs, mainly due to higher cost of labor. Sales and marketing expenses were $143 million in the fourth quarter of 2024, up 8% from the fourth quarter of 2023, and $586 million in the full year 2024, up 5% from the full year 2023. The increases in both periods were primarily driven by our investments in paid search as well as higher employee costs, mainly due to higher cost of labor. The increase for the full year 2024 was partially offset by decreases in workplace operating costs due to reductions in our leased office space. Product development expenses were $75 million in the fourth quarter of 2024, down 4% from the fourth quarter of 2023, and $326 million in the full year 2024, down 2% from the full year 2023. The decreases in both periods were mainly driven by lower employee costs as a result of more employee costs being capitalized and lower average headcount compared to the prior-year periods, partially offset by higher cost of labor. General and administrative expenses were $45 million in the fourth quarter of 2024, down 32% from the fourth quarter of 2023, and $185 million in the full year 2024, down 13% from the full year 2023. The decreases in both periods were primarily driven by lower impairment charges for certain office spaces as compared to the prior-year periods related to right of use assets and leasehold improvements. The decrease in the fourth quarter of 2024 was also due to a decrease in the provision for doubtful accounts primarily due to a release of bad debt reserves during the current-year period. The decrease in the full year 2024 was also due to a loss contingency recorded in the prior-year period in connection with the agreement to settle a putative class action lawsuit which did not recur, as well as lower employee costs in the current-year period as a result of lower average headcount. The decrease for the full year 2024 was partially offset by an increase in the provision for doubtful accounts, primarily due to higher customer delinquencies and higher advertising revenue. COR % of Revenue 9% 9% 4Q23 4Q24 S&M % of Revenue 39% 40% 4Q23 4Q24 PD % of Revenue 23% 21% 4Q23 4Q24 G&A % of Revenue 20%* 13% 4Q23 4Q24 *Includes impairment charge of $20 million.

Ye lp Q 4 20 24 17 28 Total costs and expenses were $309 million in the fourth quarter of 2024, down 3% from $317 million in the fourth quarter of 2023, and $1.26 billion in the full year 2024, approximately flat compared to the full year 2023. Other income, net was $7 million in the fourth quarter of 2024, down 24% from the fourth quarter of 2023, and $32 million in the full year 2024, up 23% from the full year 2023. The decrease in the fourth quarter was primarily driven by lower interest income earned on our cash, cash equivalents and marketable securities as well as unfavorable foreign exchange rates. The increase in the full year 2024 was primarily driven by the release of a reserve related to a one-time payroll tax credit as well as higher tax incentives related to research and development activity in the United Kingdom. Provision for income taxes was $18 million in the fourth quarter of 2024 and $50 million in the full year 2024, compared to $6 million in the fourth quarter of 2023 and $6 million in the full year 2023. The increases in both periods were primarily due to increases in profit before tax as well as decreases in the discrete tax benefits related to the federal and state tax provision to return adjustments. Net income was $42 million in the fourth quarter of 2024 compared to $27 million in the fourth quarter of 2023. Net income was $133 million in the full year 2024 compared to $99 million in the full year 2023. Net income margin increased four percentage points from the fourth quarter of 2023 to 12% in the fourth quarter of 2024, and increased two percentage points from the full year 2023 to 9% in the full year 2024. 19% 17% 19% 17% 8% 7% M ar gi n Net Income +54% $27M $42M 4Q23 4Q24 12%

Ye lp Q 4 20 24 18 28 Diluted net income per share was $0.62 in the fourth quarter of 2024, up from $0.37 in the fourth quarter of 2023, and $1.88 in the full year 2024, up from $1.35 in the full year 2023, reflecting the increases in net income for both periods. Adjusted EBITDA was $101 million in the fourth quarter of 2024, a 5% increase from $96 million in the fourth quarter of 2023. Adjusted EBITDA margin remained flat at 28% compared to the fourth quarter of 2023. Adjusted EBITDA was $358 million in the full year 2024, an 8% increase from $330 million in the full year 2023. Adjusted EBITDA margin was 25% in the full year 2024, an increase of one percentage point from the full year 2023, though both periods round to 25%. Balance sheet and cash flow At the end of December 2024, we held $318 million in cash, cash equivalents and marketable securities on our condensed consolidated balance sheet, with no debt. 19% 17% 19% 17% Adjusted EBITDA +5% $96M $101M 4Q23 4Q24 M ar gi n 28% 28%
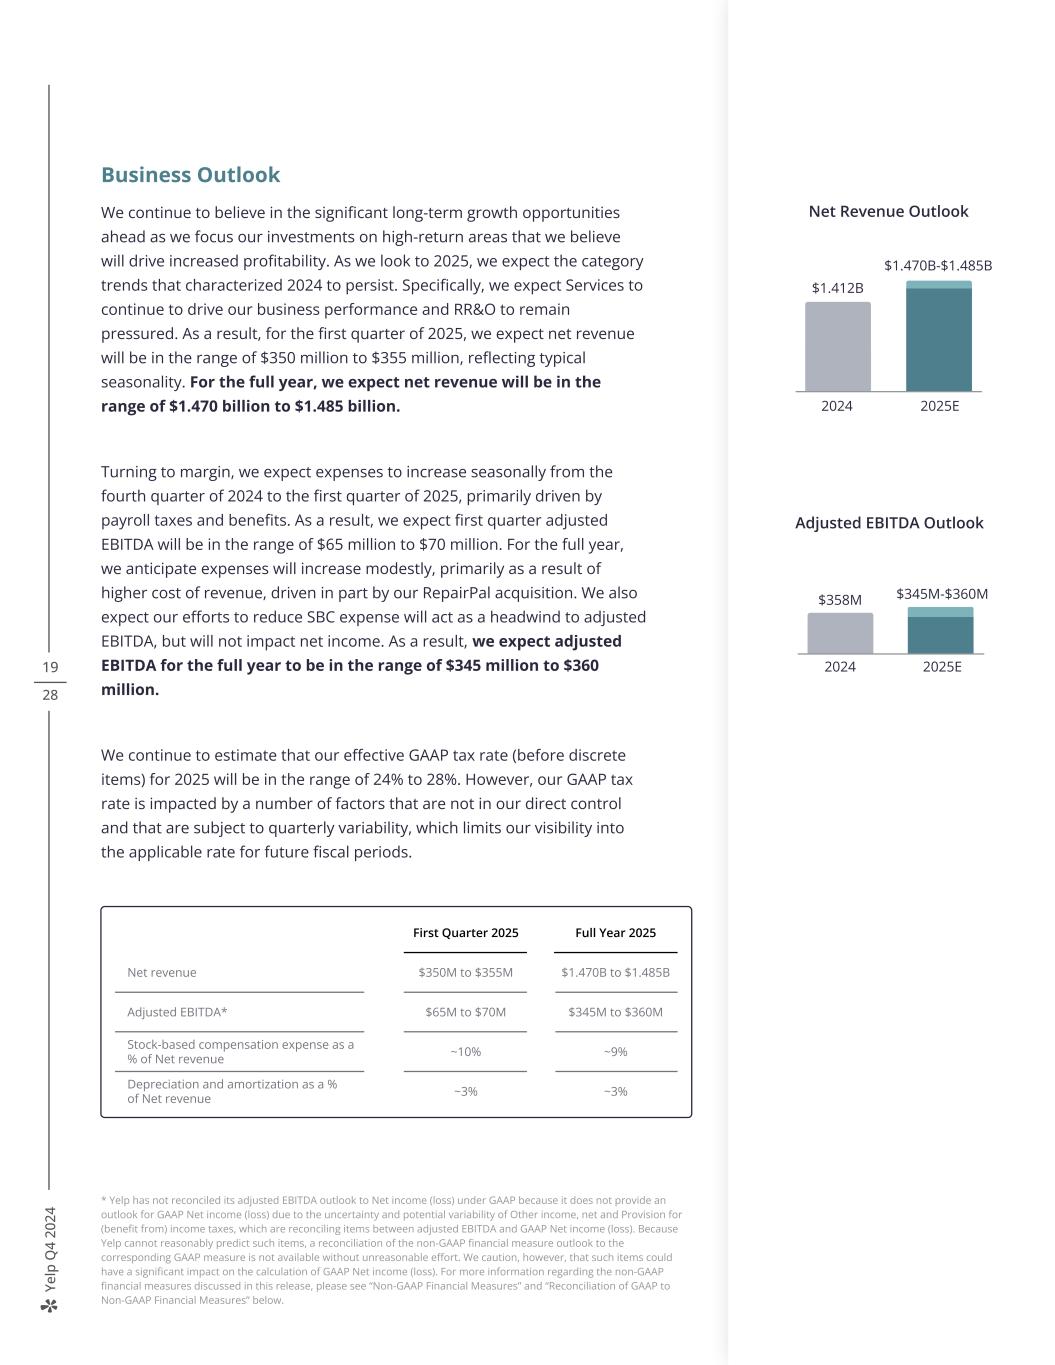
Ye lp Q 4 20 24 19 28 Business Outlook We continue to believe in the significant long-term growth opportunities ahead as we focus our investments on high-return areas that we believe will drive increased profitability. As we look to 2025, we expect the category trends that characterized 2024 to persist. Specifically, we expect Services to continue to drive our business performance and RR&O to remain pressured. As a result, for the first quarter of 2025, we expect net revenue will be in the range of $350 million to $355 million, reflecting typical seasonality. For the full year, we expect net revenue will be in the range of $1.470 billion to $1.485 billion. Turning to margin, we expect expenses to increase seasonally from the fourth quarter of 2024 to the first quarter of 2025, primarily driven by payroll taxes and benefits. As a result, we expect first quarter adjusted EBITDA will be in the range of $65 million to $70 million. For the full year, we anticipate expenses will increase modestly, primarily as a result of higher cost of revenue, driven in part by our RepairPal acquisition. We also expect our efforts to reduce SBC expense will act as a headwind to adjusted EBITDA, but will not impact net income. As a result, we expect adjusted EBITDA for the full year to be in the range of $345 million to $360 million. We continue to estimate that our effective GAAP tax rate (before discrete items) for 2025 will be in the range of 24% to 28%. However, our GAAP tax rate is impacted by a number of factors that are not in our direct control and that are subject to quarterly variability, which limits our visibility into the applicable rate for future fiscal periods. $358M Adjusted EBITDA Outlook 2024 2025E $345M-$360M * Yelp has not reconciled its adjusted EBITDA outlook to Net income (loss) under GAAP because it does not provide an outlook for GAAP Net income (loss) due to the uncertainty and potential variability of Other income, net and Provision for (benefit from) income taxes, which are reconciling items between adjusted EBITDA and GAAP Net income (loss). Because Yelp cannot reasonably predict such items, a reconciliation of the non-GAAP financial measure outlook to the corresponding GAAP measure is not available without unreasonable effort. We caution, however, that such items could have a significant impact on the calculation of GAAP Net income (loss). For more information regarding the non-GAAP financial measures discussed in this release, please see “Non-GAAP Financial Measures” and “Reconciliation of GAAP to Non-GAAP Financial Measures” below. 2024 2025E $1.412B $1.470B-$1.485B Net Revenue Outlook First Quarter 2025 Full Year 2025 Net revenue $350M to $355M $1.470B to $1.485B Adjusted EBITDA* $65M to $70M $345M to $360M Stock-based compensation expense as a % of Net revenue ~10% ~9% Depreciation and amortization as a % of Net revenue ~3% ~3%
Ye lp Q 4 20 24 20 28 Quarterly Earnings Webcast Yelp will host a live webcast today at 2:00 p.m. PST to discuss the fourth quarter and full year 2024 financial results and outlook for the first quarter and full year 2025. The webcast can be accessed on the Yelp Investor Relations website at yelp-ir.com. A replay of the webcast will be available at the same website. About Yelp Yelp Inc. (yelp.com) is a community-driven platform that connects people with great local businesses. Millions of people rely on Yelp for useful and trusted local business information, reviews and photos to help inform their spending decisions. As a one-stop local platform, Yelp helps consumers easily discover, connect and transact with businesses across a broad range of categories by making it easy to request a quote for a service, book a table at a restaurant, and more. Yelp was founded in San Francisco in 2004.
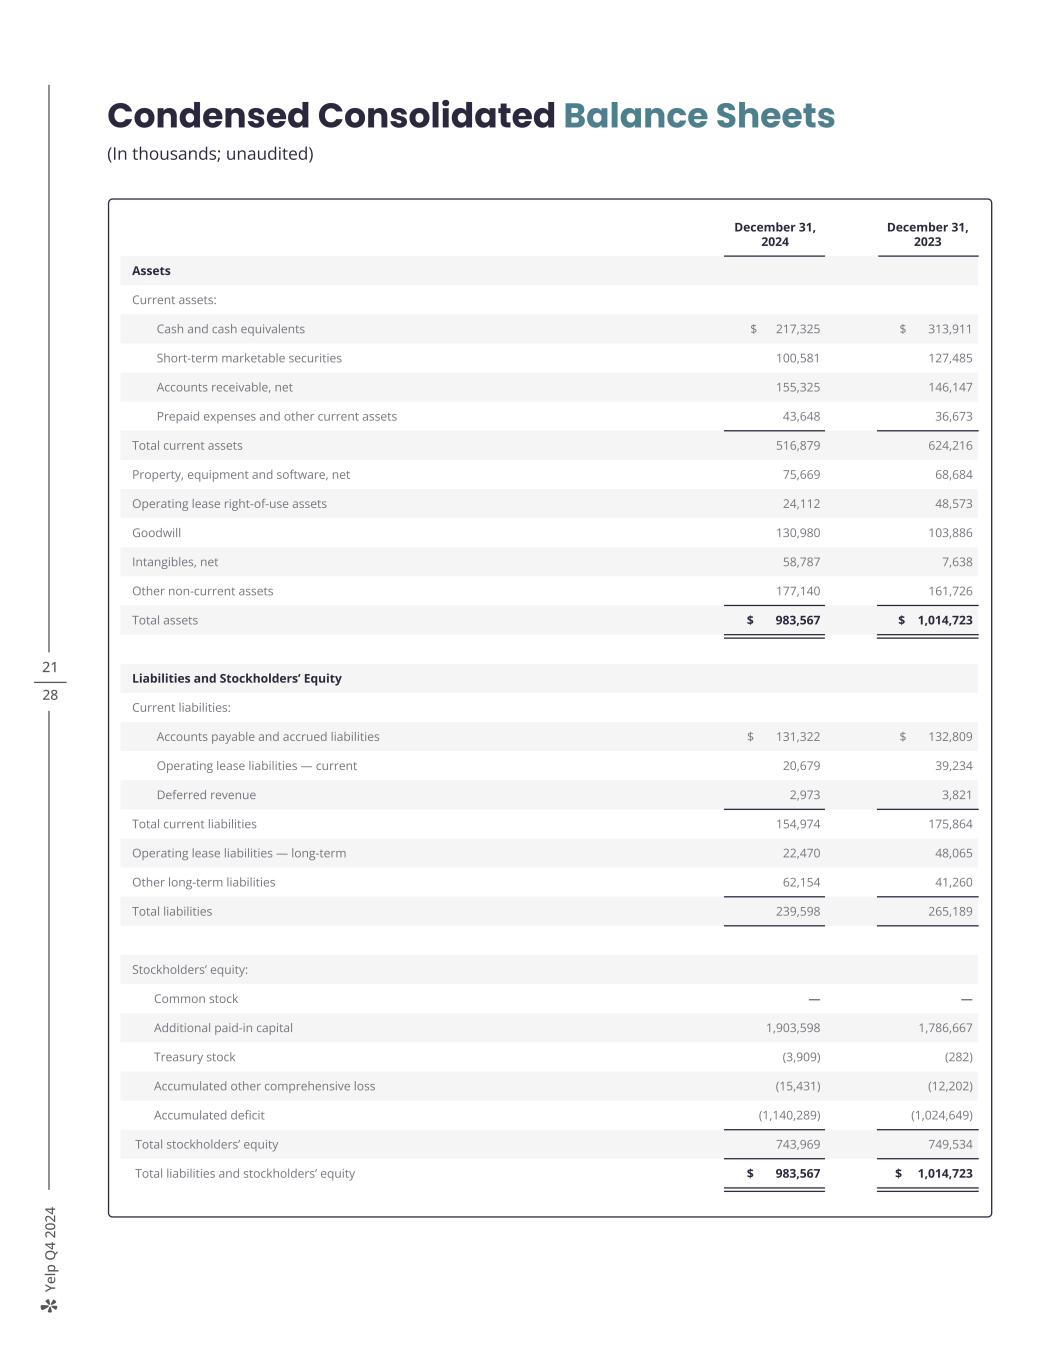
Ye lp Q 4 20 24 21 28 Condensed Consolidated Balance Sheets (In thousands; unaudited) December 31, 2024 December 31, 2023 Assets Current assets: Cash and cash equivalents $ 217,325 $ 313,911 Short-term marketable securities 100,581 127,485 Accounts receivable, net 155,325 146,147 Prepaid expenses and other current assets 43,648 36,673 Total current assets 516,879 624,216 Property, equipment and software, net 75,669 68,684 Operating lease right-of-use assets 24,112 48,573 Goodwill 130,980 103,886 Intangibles, net 58,787 7,638 Other non-current assets 177,140 161,726 Total assets $ 983,567 $ 1,014,723 Liabilities and Stockholders’ Equity Current liabilities: Accounts payable and accrued liabilities $ 131,322 $ 132,809 Operating lease liabilities — current 20,679 39,234 Deferred revenue 2,973 3,821 Total current liabilities 154,974 175,864 Operating lease liabilities — long-term 22,470 48,065 Other long-term liabilities 62,154 41,260 Total liabilities 239,598 265,189 Stockholders’ equity: Common stock — — Additional paid-in capital 1,903,598 1,786,667 Treasury stock (3,909) (282) Accumulated other comprehensive loss (15,431) (12,202) Accumulated deficit (1,140,289) (1,024,649) Total stockholders’ equity 743,969 749,534 Total liabilities and stockholders’ equity $ 983,567 $ 1,014,723
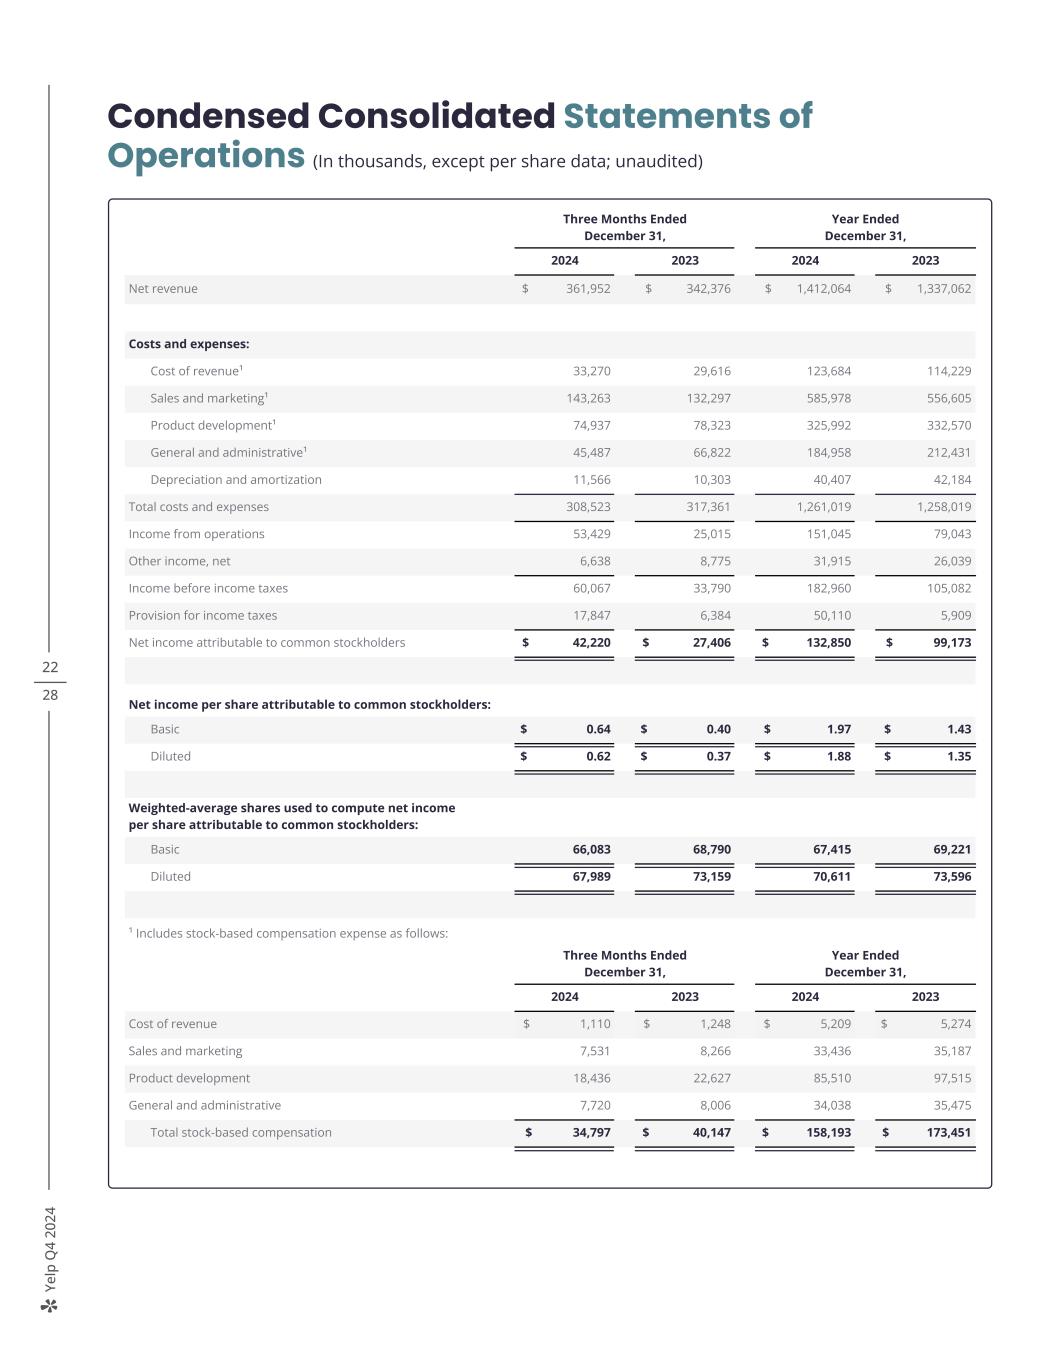
Ye lp Q 4 20 24 22 28 Condensed Consolidated Statements of Operations (In thousands, except per share data; unaudited) Three Months Ended December 31, Year Ended December 31, 2024 2023 2024 2023 Net revenue $ 361,952 $ 342,376 $ 1,412,064 $ 1,337,062 Costs and expenses: Cost of revenue¹ 33,270 29,616 123,684 114,229 Sales and marketing¹ 143,263 132,297 585,978 556,605 Product development¹ 74,937 78,323 325,992 332,570 General and administrative¹ 45,487 66,822 184,958 212,431 Depreciation and amortization 11,566 10,303 40,407 42,184 Total costs and expenses 308,523 317,361 1,261,019 1,258,019 Income from operations 53,429 25,015 151,045 79,043 Other income, net 6,638 8,775 31,915 26,039 Income before income taxes 60,067 33,790 182,960 105,082 Provision for income taxes 17,847 6,384 50,110 5,909 Net income attributable to common stockholders $ 42,220 $ 27,406 $ 132,850 $ 99,173 Net income per share attributable to common stockholders: Basic $ 0.64 $ 0.40 $ 1.97 $ 1.43 Diluted $ 0.62 $ 0.37 $ 1.88 $ 1.35 Weighted-average shares used to compute net income per share attributable to common stockholders: Basic 66,083 68,790 67,415 69,221 Diluted 67,989 73,159 70,611 73,596 ¹ Includes stock-based compensation expense as follows: Three Months Ended December 31, Year Ended December 31, 2024 2023 2024 2023 Cost of revenue $ 1,110 $ 1,248 $ 5,209 $ 5,274 Sales and marketing 7,531 8,266 33,436 35,187 Product development 18,436 22,627 85,510 97,515 General and administrative 7,720 8,006 34,038 35,475 Total stock-based compensation $ 34,797 $ 40,147 $ 158,193 $ 173,451

Ye lp Q 4 20 24 23 28 Condensed Consolidated Statements of Cash Flows (In thousands; unaudited) Year Ended December 31, 2024 2023 Operating Activities Net income $ 132,850 $ 99,173 Adjustments to reconcile net income to net cash provided by operating activities: Depreciation and amortization 40,407 42,184 Provision for doubtful accounts 45,614 40,702 Stock-based compensation 158,193 173,451 Amortization of right-of-use assets 15,094 28,084 Deferred income taxes (24,920) (22,150) Amortization of deferred contract cost 24,854 24,035 Asset impairment 5,914 23,563 Other adjustments, net (2,412) (410) Changes in operating assets and liabilities: Accounts receivable (51,033) (54,947) Prepaid expenses and other assets (24,314) (5,123) Operating lease liabilities (39,230) (39,734) Accounts payable, accrued liabilities and other liabilities 4,798 (2,548) Net cash provided by operating activities 285,815 306,280 Investing Activities Purchases of marketable securities — available-for-sale (94,304) (148,448) Sales and maturities of marketable securities — available-for-sale 123,094 117,916 Purchases of other investments (2,500) — Maturities of other investments — 2,500 Acquisition, net of cash received (66,199) — Purchases of property, equipment and software (37,347) (26,847) Other investing activities (10) 195 Net cash used in investing activities (77,266) (54,684) Financing Activities Proceeds from issuance of common stock for employee stock-based plans 20,790 39,510 Taxes paid related to the net share settlement of equity awards (73,411) (85,180) Repurchases of common stock, including excise tax (251,181) (199,999) Payment of issuance costs for credit facility — (1,109) Net cash used in financing activities (303,802) (246,778) Effect of exchange rate changes on cash, cash equivalents and restricted cash (1,067) 2,046 Change in cash, cash equivalents and restricted cash (96,320) 6,864 Cash, cash equivalents and restricted cash — Beginning of period 314,002 307,138 Cash, cash equivalents and restricted cash — End of period $ 217,682 $ 314,002
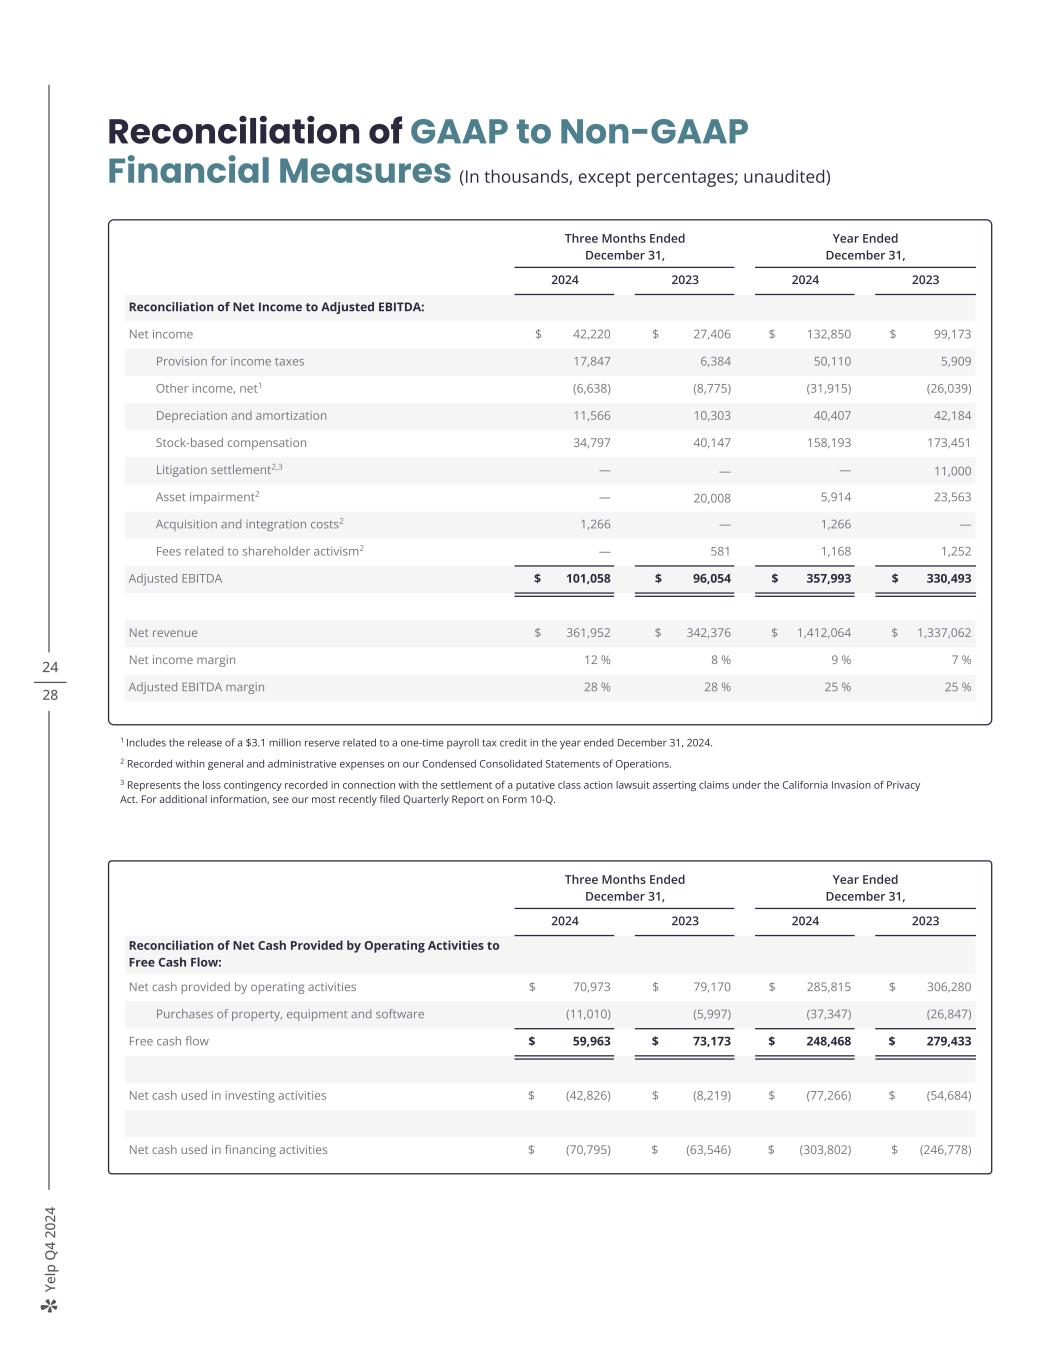
Ye lp Q 4 20 24 24 28 Reconciliation of GAAP to Non-GAAP Financial Measures (In thousands, except percentages; unaudited) 1 Includes the release of a $3.1 million reserve related to a one-time payroll tax credit in the year ended December 31, 2024. 2 Recorded within general and administrative expenses on our Condensed Consolidated Statements of Operations. 3 Represents the loss contingency recorded in connection with the settlement of a putative class action lawsuit asserting claims under the California Invasion of Privacy Act. For additional information, see our most recently filed Quarterly Report on Form 10-Q. Three Months Ended December 31, Year Ended December 31, 2024 2023 2024 2023 Reconciliation of Net Income to Adjusted EBITDA: Net income $ 42,220 $ 27,406 $ 132,850 $ 99,173 Provision for income taxes 17,847 6,384 50,110 5,909 Other income, net1 (6,638) (8,775) (31,915) (26,039) Depreciation and amortization 11,566 10,303 40,407 42,184 Stock-based compensation 34,797 40,147 158,193 173,451 Litigation settlement2,3 — — — 11,000 Asset impairment2 — 20,008 5,914 23,563 Acquisition and integration costs2 1,266 — 1,266 — Fees related to shareholder activism2 — 581 1,168 1,252 Adjusted EBITDA $ 101,058 $ 96,054 $ 357,993 $ 330,493 Net revenue $ 361,952 $ 342,376 $ 1,412,064 $ 1,337,062 Net income margin 12 % 8 % 9 % 7 % Adjusted EBITDA margin 28 % 28 % 25 % 25 % Three Months Ended December 31, Year Ended December 31, 2024 2023 2024 2023 Reconciliation of Net Cash Provided by Operating Activities to Free Cash Flow: Net cash provided by operating activities $ 70,973 $ 79,170 $ 285,815 $ 306,280 Purchases of property, equipment and software (11,010) (5,997) (37,347) (26,847) Free cash flow $ 59,963 $ 73,173 $ 248,468 $ 279,433 Net cash used in investing activities $ (42,826) $ (8,219) $ (77,266) $ (54,684) Net cash used in financing activities $ (70,795) $ (63,546) $ (303,802) $ (246,778)
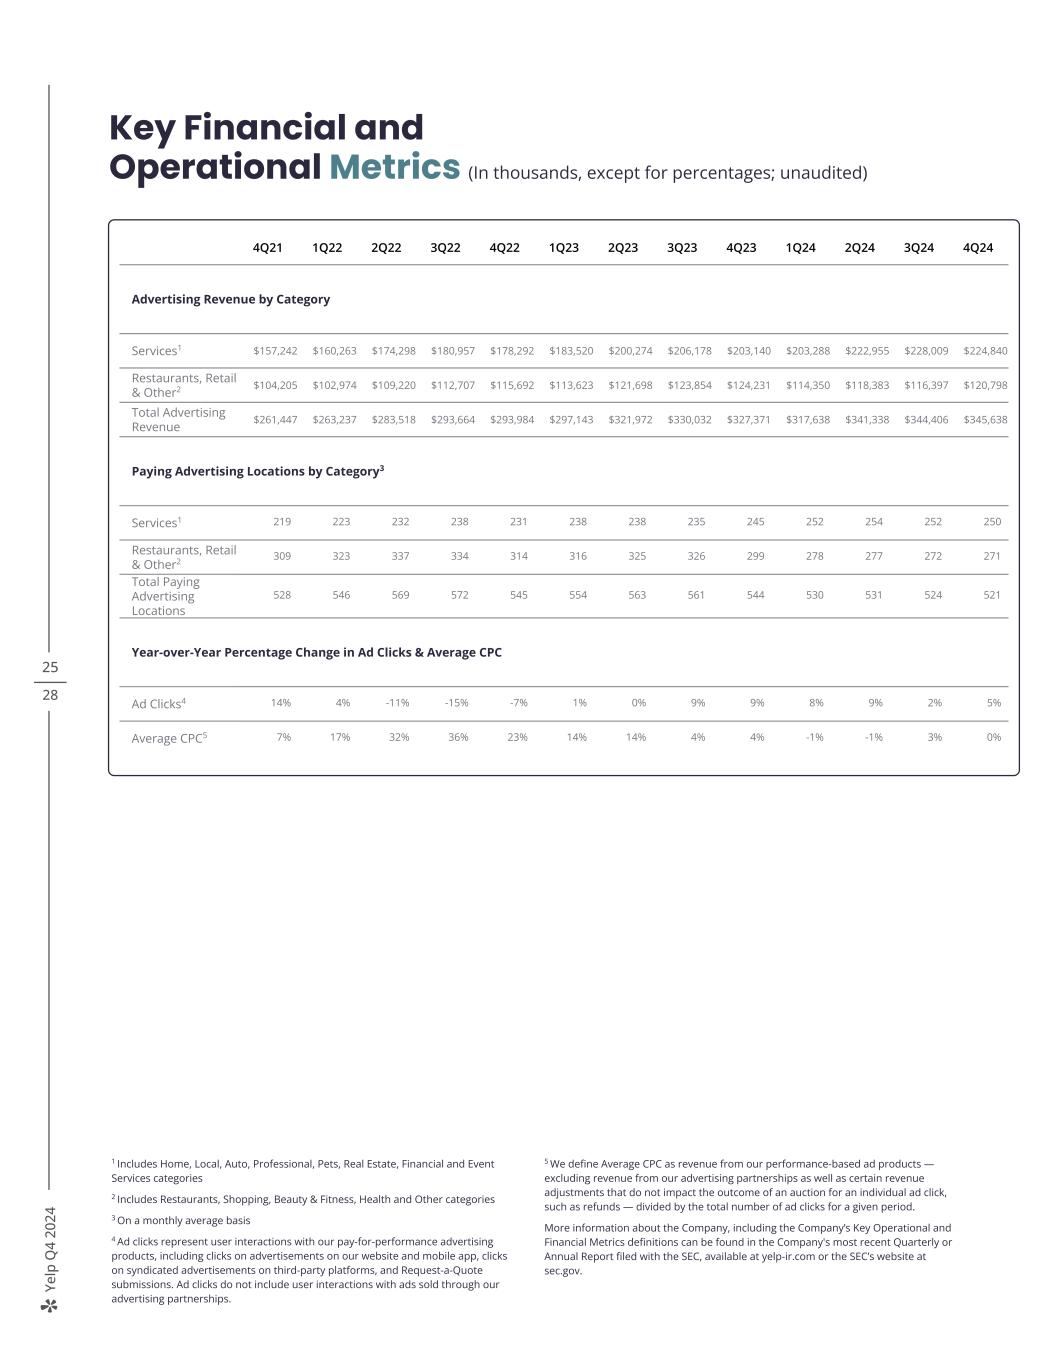
Ye lp Q 4 20 24 25 28 Key Financial and Operational Metrics (In thousands, except for percentages; unaudited) 4Q21 1Q22 2Q22 3Q22 4Q22 1Q23 2Q23 3Q23 4Q23 1Q24 2Q24 3Q24 4Q24 Advertising Revenue by Category Services1 $157,242 $160,263 $174,298 $180,957 $178,292 $183,520 $200,274 $206,178 $203,140 $203,288 $222,955 $228,009 $224,840 Restaurants, Retail & Other2 $104,205 $102,974 $109,220 $112,707 $115,692 $113,623 $121,698 $123,854 $124,231 $114,350 $118,383 $116,397 $120,798 Total Advertising Revenue $261,447 $263,237 $283,518 $293,664 $293,984 $297,143 $321,972 $330,032 $327,371 $317,638 $341,338 $344,406 $345,638 Paying Advertising Locations by Category3 Services1 219 223 232 238 231 238 238 235 245 252 254 252 250 Restaurants, Retail & Other2 309 323 337 334 314 316 325 326 299 278 277 272 271 Total Paying Advertising Locations 528 546 569 572 545 554 563 561 544 530 531 524 521 Year-over-Year Percentage Change in Ad Clicks & Average CPC Ad Clicks4 14% 4% -11% -15% -7% 1% 0% 9% 9% 8% 9% 2% 5% Average CPC5 7% 17% 32% 36% 23% 14% 14% 4% 4% -1% -1% 3% 0% 1 Includes Home, Local, Auto, Professional, Pets, Real Estate, Financial and Event Services categories 2 Includes Restaurants, Shopping, Beauty & Fitness, Health and Other categories 3 On a monthly average basis 4 Ad clicks represent user interactions with our pay-for-performance advertising products, including clicks on advertisements on our website and mobile app, clicks on syndicated advertisements on third-party platforms, and Request-a-Quote submissions. Ad clicks do not include user interactions with ads sold through our advertising partnerships. 5 We define Average CPC as revenue from our performance-based ad products — excluding revenue from our advertising partnerships as well as certain revenue adjustments that do not impact the outcome of an auction for an individual ad click, such as refunds — divided by the total number of ad clicks for a given period. More information about the Company, including the Company’s Key Operational and Financial Metrics definitions can be found in the Company's most recent Quarterly or Annual Report filed with the SEC, available at yelp-ir.com or the SEC’s website at sec.gov.

Ye lp Q 4 20 24 26 28 Key Financial and Operational Metrics (Continued) (In thousands; unaudited) Annual Metrics 2022 2023 2024 Cumulative Reviews 265,288 287,364 308,100 Active Claimed Local Business Locations 6,321 7,056 7,736 App Unique Devices1 Previous Methodology 33,026 31,909 30,660 Updated Methodology 30,296 29,842 28,595 Desktop Unique Devices2 Internal Measurement 37,576 39,959 40,341 Google Analytics 38,046 36,301 — Mobile Web Unique Devices2 Internal Measurement 57,059 62,013 63,987 Google Analytics 59,172 60,282 — 1 We are continually seeking to improve our ability to measure our key metrics and regularly review our processes to assess potential improvement to their accuracy. As a result of such a review, we updated our methodology for measuring app unique devices to exclude devices that access our mobile app but do not meet a minimum level of engagement with it by, for example, viewing a business, performing a search, viewing or submitting content, or other similar interactions (“minimum required level of engagement”). 2 Previously referred to as desktop unique visitors and mobile web unique visitors, as applicable. Prior to 2024, we calculated desktop unique visitors and mobile web unique visitors based on the number of “users,” as measured by Google Analytics — a digital marketing intelligence product from Google LLC (“Google”) — who had visited our desktop website and mobile website, respectively, at least once in a given month, averaged over a given twelve-month period. However, as of July 1, 2024, Google no longer offers the Universal Analytics version of Google Analytics that we previously used. We now calculate desktop web traffic and mobile web traffic as (1) the number of devices identified by our internal measurement tools that have visited our desktop website and mobile website, respectively, at least once in a given month, (2) adjusted to exclude devices that do not meet our minimum required level of engagement, (3) averaged over a given twelve-month period. We refer to our web traffic metrics calculated under this methodology as unique devices rather than unique visitors to conform to the name of our app unique devices metric as well as to better reflect that these metrics measure devices that visit our website rather than individuals who visit our website, as discussed below. Our internal measurement tools and Google Analytics measure devices and “users,” respectively, based on unique identifiers. As a result, an individual who accesses our website from multiple devices with different identifiers may be counted as multiple unique devices or unique visitors, as applicable, and multiple individuals who access our website from a shared device with a single identifier may be counted as a single unique device or unique visitor. Accordingly, the calculations of our unique visitors and unique devices may not accurately reflect the number of individuals who actually visit our website.
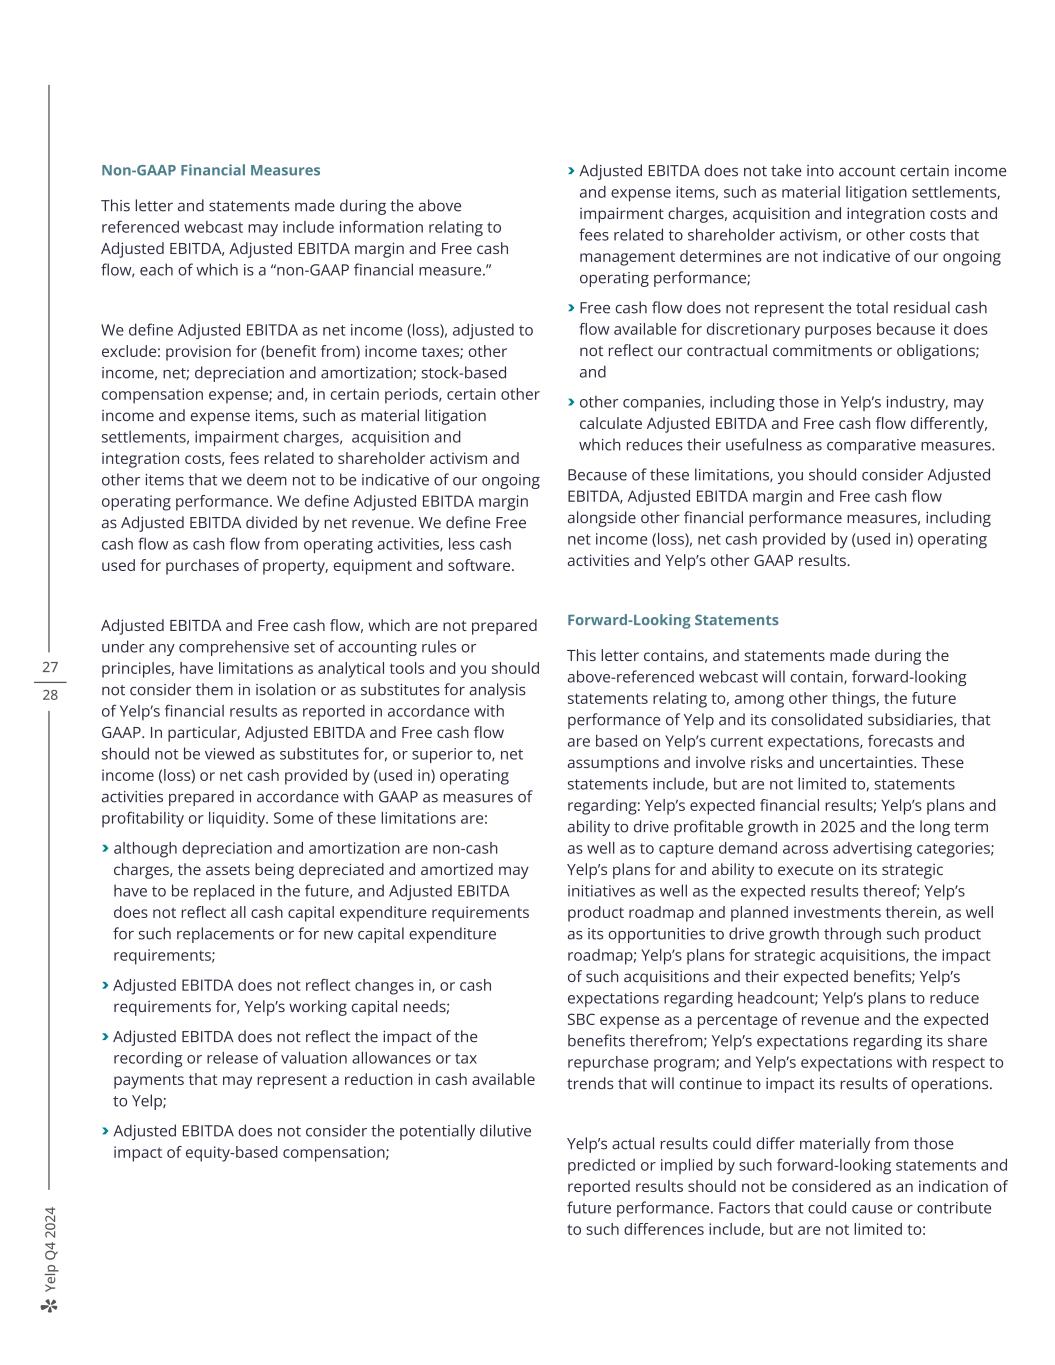
Ye lp Q 4 20 24 Non-GAAP Financial Measures This letter and statements made during the above referenced webcast may include information relating to Adjusted EBITDA, Adjusted EBITDA margin and Free cash flow, each of which is a “non-GAAP financial measure.” We define Adjusted EBITDA as net income (loss), adjusted to exclude: provision for (benefit from) income taxes; other income, net; depreciation and amortization; stock-based compensation expense; and, in certain periods, certain other income and expense items, such as material litigation settlements, impairment charges, acquisition and integration costs, fees related to shareholder activism and other items that we deem not to be indicative of our ongoing operating performance. We define Adjusted EBITDA margin as Adjusted EBITDA divided by net revenue. We define Free cash flow as cash flow from operating activities, less cash used for purchases of property, equipment and software. Adjusted EBITDA and Free cash flow, which are not prepared under any comprehensive set of accounting rules or principles, have limitations as analytical tools and you should not consider them in isolation or as substitutes for analysis of Yelp’s financial results as reported in accordance with GAAP. In particular, Adjusted EBITDA and Free cash flow should not be viewed as substitutes for, or superior to, net income (loss) or net cash provided by (used in) operating activities prepared in accordance with GAAP as measures of profitability or liquidity. Some of these limitations are: > although depreciation and amortization are non-cash charges, the assets being depreciated and amortized may have to be replaced in the future, and Adjusted EBITDA does not reflect all cash capital expenditure requirements for such replacements or for new capital expenditure requirements; > Adjusted EBITDA does not reflect changes in, or cash requirements for, Yelp’s working capital needs; > Adjusted EBITDA does not reflect the impact of the recording or release of valuation allowances or tax payments that may represent a reduction in cash available to Yelp; > Adjusted EBITDA does not consider the potentially dilutive impact of equity-based compensation; > Adjusted EBITDA does not take into account certain income and expense items, such as material litigation settlements, impairment charges, acquisition and integration costs and fees related to shareholder activism, or other costs that management determines are not indicative of our ongoing operating performance; > Free cash flow does not represent the total residual cash flow available for discretionary purposes because it does not reflect our contractual commitments or obligations; and > other companies, including those in Yelp’s industry, may calculate Adjusted EBITDA and Free cash flow differently, which reduces their usefulness as comparative measures. Because of these limitations, you should consider Adjusted EBITDA, Adjusted EBITDA margin and Free cash flow alongside other financial performance measures, including net income (loss), net cash provided by (used in) operating activities and Yelp’s other GAAP results. Forward-Looking Statements This letter contains, and statements made during the above-referenced webcast will contain, forward-looking statements relating to, among other things, the future performance of Yelp and its consolidated subsidiaries, that are based on Yelp’s current expectations, forecasts and assumptions and involve risks and uncertainties. These statements include, but are not limited to, statements regarding: Yelp’s expected financial results; Yelp’s plans and ability to drive profitable growth in 2025 and the long term as well as to capture demand across advertising categories; Yelp’s plans for and ability to execute on its strategic initiatives as well as the expected results thereof; Yelp’s product roadmap and planned investments therein, as well as its opportunities to drive growth through such product roadmap; Yelp’s plans for strategic acquisitions, the impact of such acquisitions and their expected benefits; Yelp’s expectations regarding headcount; Yelp’s plans to reduce SBC expense as a percentage of revenue and the expected benefits therefrom; Yelp’s expectations regarding its share repurchase program; and Yelp’s expectations with respect to trends that will continue to impact its results of operations. Yelp’s actual results could differ materially from those predicted or implied by such forward-looking statements and reported results should not be considered as an indication of future performance. Factors that could cause or contribute to such differences include, but are not limited to: 27 28
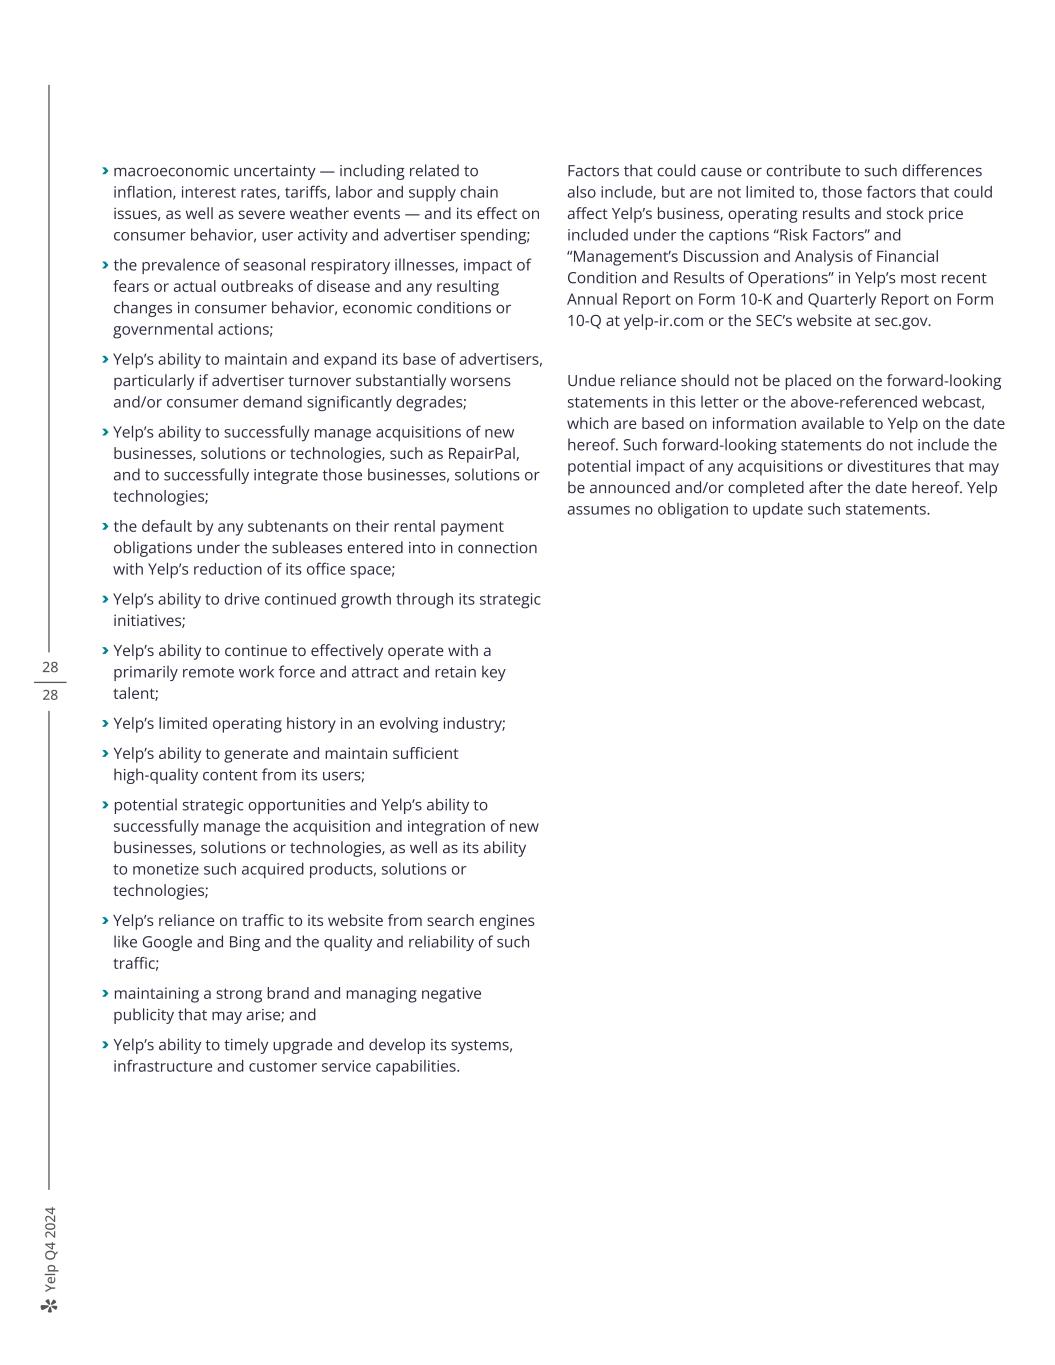
Ye lp Q 4 20 24 > macroeconomic uncertainty — including related to inflation, interest rates, tariffs, labor and supply chain issues, as well as severe weather events — and its effect on consumer behavior, user activity and advertiser spending; > the prevalence of seasonal respiratory illnesses, impact of fears or actual outbreaks of disease and any resulting changes in consumer behavior, economic conditions or governmental actions; > Yelp’s ability to maintain and expand its base of advertisers, particularly if advertiser turnover substantially worsens and/or consumer demand significantly degrades; > Yelp’s ability to successfully manage acquisitions of new businesses, solutions or technologies, such as RepairPal, and to successfully integrate those businesses, solutions or technologies; > the default by any subtenants on their rental payment obligations under the subleases entered into in connection with Yelp’s reduction of its office space; > Yelp’s ability to drive continued growth through its strategic initiatives; > Yelp’s ability to continue to effectively operate with a primarily remote work force and attract and retain key talent; > Yelp’s limited operating history in an evolving industry; > Yelp’s ability to generate and maintain sufficient high-quality content from its users; > potential strategic opportunities and Yelp’s ability to successfully manage the acquisition and integration of new businesses, solutions or technologies, as well as its ability to monetize such acquired products, solutions or technologies; > Yelp’s reliance on traffic to its website from search engines like Google and Bing and the quality and reliability of such traffic; > maintaining a strong brand and managing negative publicity that may arise; and > Yelp’s ability to timely upgrade and develop its systems, infrastructure and customer service capabilities. Factors that could cause or contribute to such differences also include, but are not limited to, those factors that could affect Yelp’s business, operating results and stock price included under the captions “Risk Factors” and “Management’s Discussion and Analysis of Financial Condition and Results of Operations” in Yelp’s most recent Annual Report on Form 10-K and Quarterly Report on Form 10-Q at yelp-ir.com or the SEC’s website at sec.gov. Undue reliance should not be placed on the forward-looking statements in this letter or the above-referenced webcast, which are based on information available to Yelp on the date hereof. Such forward-looking statements do not include the potential impact of any acquisitions or divestitures that may be announced and/or completed after the date hereof. Yelp assumes no obligation to update such statements. 28 28


