Exhibit 99.1
Tim Hortons
Conference Call
2013 First Quarter
May 8th, 2013
S p e a k e r s ( i n s e q u e n c e )
Scott Bonikowsky
& Vice Government President, Affairs Corporate, Public
Paul House
Executive Chairman, and
President & Chief Executive Officer
Cynthia Devine
Chief Financial Officer
2
SAFE HARBOR STATEMENT
Certain information in this presentation, particularly information regarding future economic performance, finances, and plans, expectations and objectives of management, and other information, constitutes forward-looking information within the meaning of Canadian securities laws and forward-looking statements within the meaning of the Private Securities Litigation Reform Act of 1995. We refer to all of these as forward-looking statements. Various factors including competition in the quick service segment of the food service industry, general economic conditions and others described as “risk factors” in the Company’s 2012 Annual Report on Form 10-K filed February 21st, 2013, and our Quarterly Report on Form 10-Q filed on May 8th, 2013 with the U.S. Securities and Exchange Commission and Canadian Securities Administrators, could affect the Company’s actual results and cause such results to differ materially from those expressed in forward-looking statements. As such, readers are cautioned not to place undue reliance on forward-looking statements contained in this presentation, which speak only as to management’s expectations as of the date hereof.
Forward-looking statements are based on a number of assumptions which may prove to be incorrect, including, but not limited to, assumptions about: the absence of an adverse event or condition that damages our strong brand position and reputation; the absence of a material increase in competition or in volume or type of competitive activity within the quick service restaurant segment of the food service industry; general worldwide economic conditions; cost and availability of commodities; the ability to retain our senior management team or the inability to attract and retain new qualified personnel; continuing positive working relationships with the majority of the Company’s restaurant owners; the absence of any material adverse effects arising as a result of litigation; and there being no significant change in the Company’s ability to comply with current or future regulatory requirements.
We are presenting this information for the purpose of informing you of management’s current expectations regarding these matters, and this information may not be appropriate for any other purpose. We assume no obligation to update or alter any forward-looking statements after they are made, whether as a result of new information, future events, or otherwise, except as required by applicable law. Please review the Company’s Safe Harbor Statement at www.timhortons.com/en/about/safeharbor.html.
Results only include up to March 31st, 2013 unless otherwise noted and have not been updated. Historical results are no guarantee of future performance.
Please note that this presentation includes “adjusted” financial information, metrics, and/or analysis that are non-GAAP measures. We are required under applicable securities law to provide a
reconciliation of non-GAAP measures to the nearest GAAP measure. All of these reconciliations and/or related information are included in the attached Appendix.
3
Paul House
Executive Chairman, President & CEO
4

BOARD SELECTS NEW PRESIDENT & CEO
Marc Caira appointed President and CEO, will join July 2nd, 2013
Background
Global CEO, Nestle Professional
10,000 employees and operations in ~100 countries
President & CEO, Parmalat North America Canadian, 3+ decades of global foodservice and beverage experience
5

ENTERING SAUDI ARABIA MARKET
Reached an area development agreement with Apparel FZCO
Up to 100 multi-format restaurants over 5 years
Development in Saudi
Arabia will be managed by Apparel
Focus on major urban markets
All trademarks of Apparel listed above are reserved by them
6

SINGLE-SERVE COFFEE EXTENSION
Reached an agreement to have Tim Hortons coffee on the Mother Parkers Tea
& Coffee RealCupTM platform
Anticipated launch this summer
Compatible for use in
Keurig K-Cup®, but is not affiliated with K-Cup® or
Keurig®
All trademarks of the companies listed above are reserved by their respective owners
7
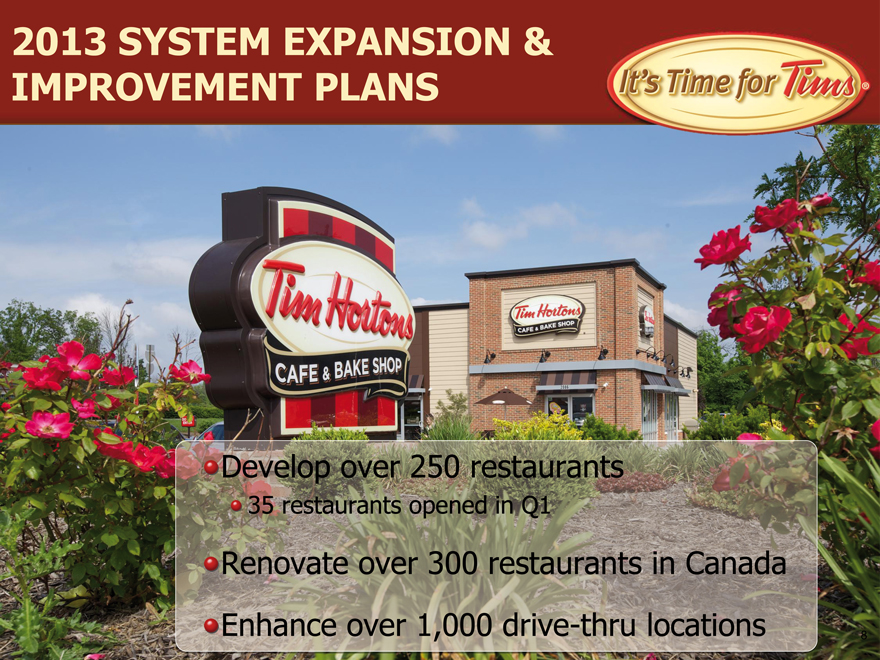
2013 SYSTEM EXPANSION & IMPROVEMENT PLANS
Develop over 250 restaurants
35 restaurants opened in Q1
Renovate over 300 restaurants in Canada Enhance over 1,000 drive-thru locations
8

Q1 2013 MENU &
PROMOTIONAL INNOVATION
Flatbread Breakfast Panini sandwiches (in Canada) Vanilla bean lattes (in Canada) Thick-cut bacon Roll Up the Rim to Win® Promotion of the grilled cheese Panini with sundried tomato soup
9
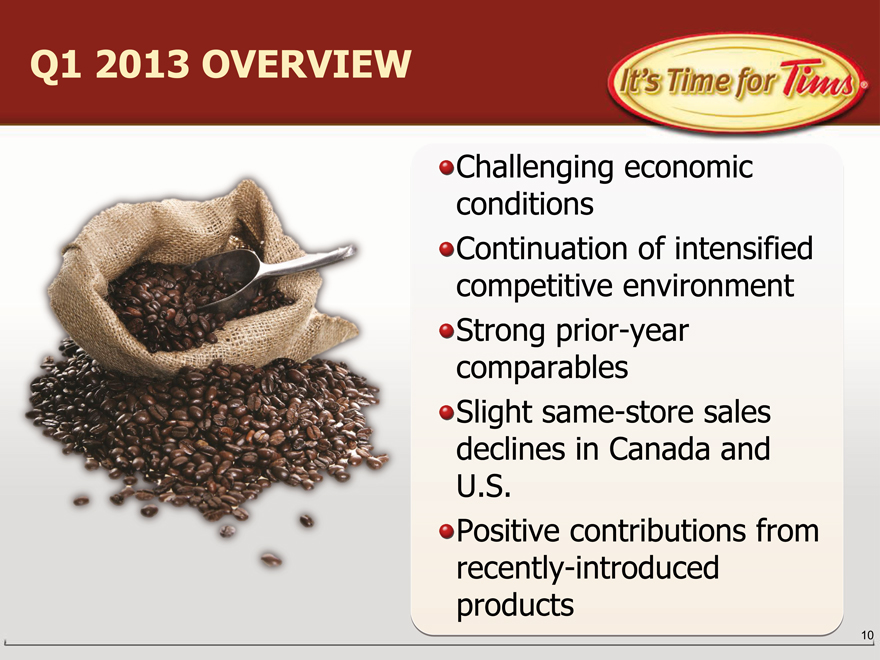
Q1 2013 OVERVIEW
Challenging economic conditions
Continuation of intensified competitive environment strong prior-year mparables slight same-store sales declines in Canada and
U.S.
Positive contributions from recently-introduced products
10
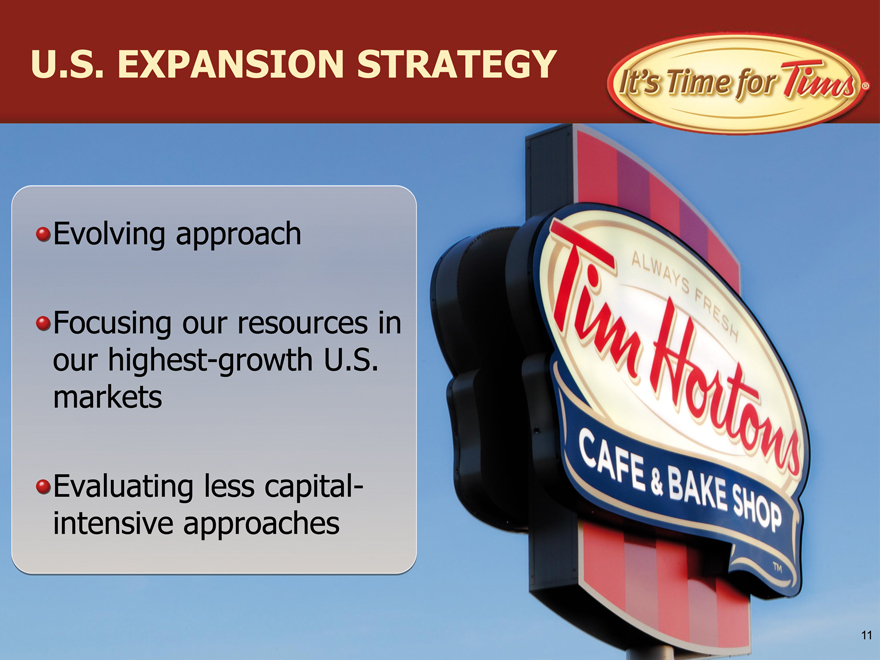
U.S. EXPANSION STRATEGY
Evolving approach
Focusing our resources in our highest-growth U.S. markets
Evaluating less capital-intensive approaches
11

CYNTHIA DEVINE
Chief Financial Officer
12
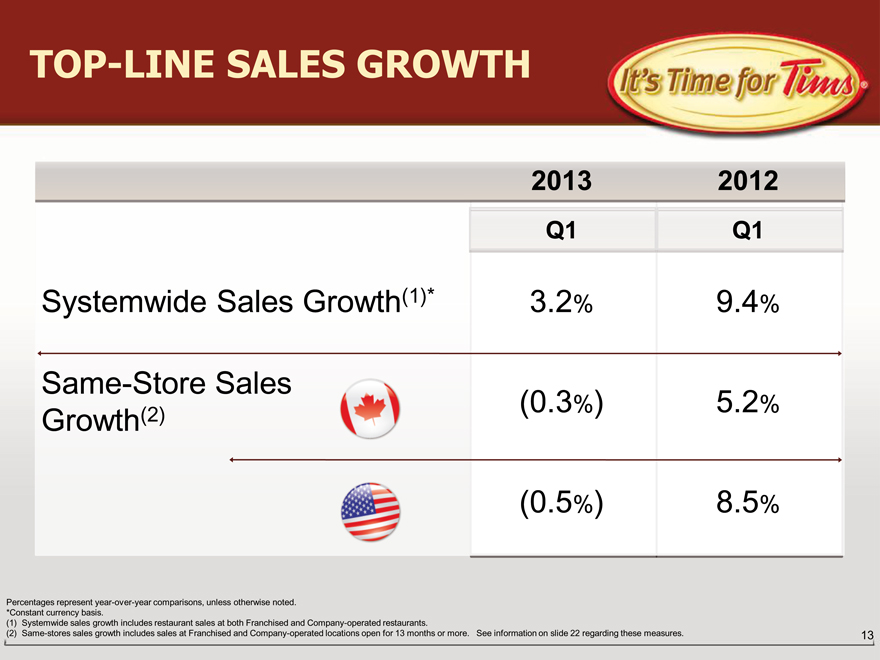
TOP-LINE SALES GROWTH
2013 2012
Q1 Q1
Systemwide Sales Growth(1)* 3.2% 9.4%
Same-Store Sales
Growth(2) (0.3%) 5.2%
(0.5%) 8.5%
Percentages represent year-over-year comparisons, unless otherwise noted. *Constant currency basis.
(1) Systemwide sales growth includes restaurant sales at both Franchised and Company-operated restaurants.
(2) Same-stores sales growth includes sales at Franchised and Company-operated locations open for 13 months or more. See information on slide 22 regarding these measures.
13
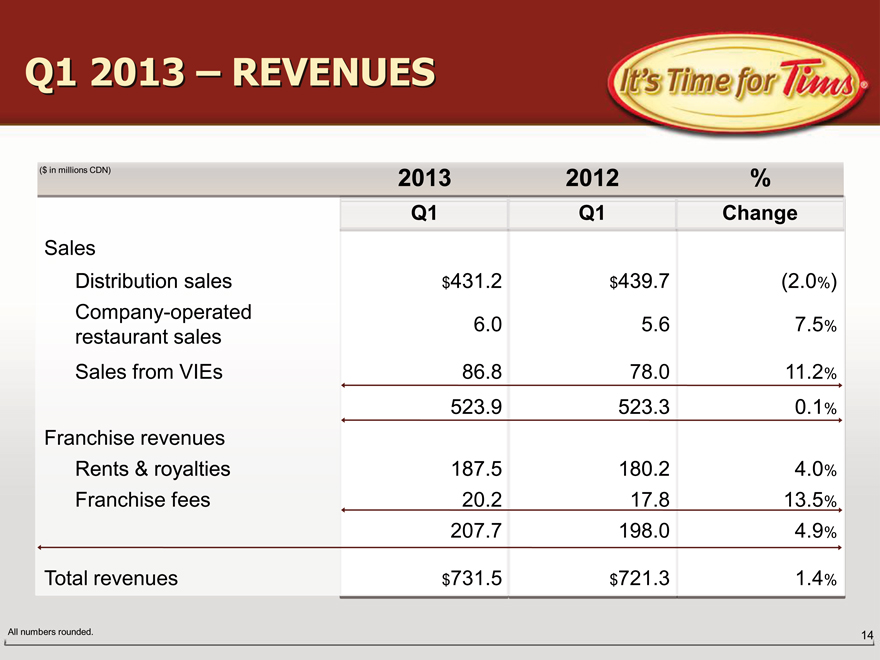
Q1 2013 – REVENUES
($ in millions CDN) 2013 2012 %
Q1 Q1 Change
Sales
Distribution sales $ 431.2 $ 439.7 (2.0%)
Company-operated
restaurant sales 6.0 5.6 7.5%
Sales from VIEs 86.8 78.0 11.2%
523.9 523.3 0.1%
Franchise revenues
Rents & royalties 187.5 180.2 4.0%
Franchise fees 20.2 17.8 13.5%
207.7 198.0 4.9%
Total revenues $ 731.5 $ 721.3 1.4%
All numbers rounded.
14
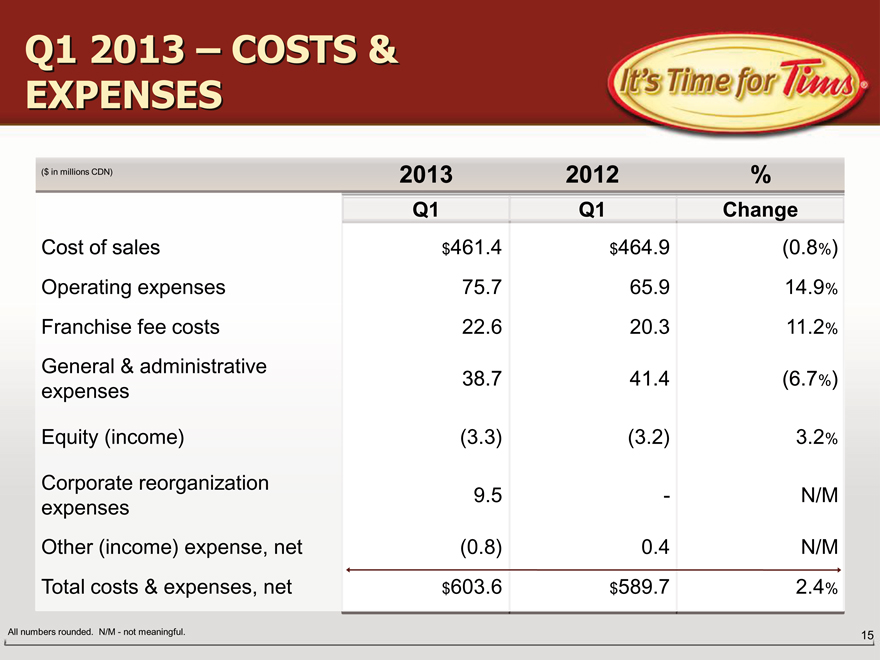
Q1 2013 – COSTS & EXPENSES
($ in millions CDN) 2013 2012 %
Q1 Q1 Change
Cost of sales $ 461.4 $ 464.9 (0.8%)
Operating expenses 75.7 65.9 14.9%
Franchise fee costs 22.6 20.3 11.2%
General & administrative
expenses 38.7 41.4 (6.7%)
Equity (income) (3.3) (3.2) 3.2%
Corporate reorganization 9.5 — N/M
expenses
Other (income) expense, net (0.8) 0.4 N/M
Total costs & expenses, net $ 603.6 $ 589.7 2.4%
All numbers rounded. N/M—not meaningful.
15
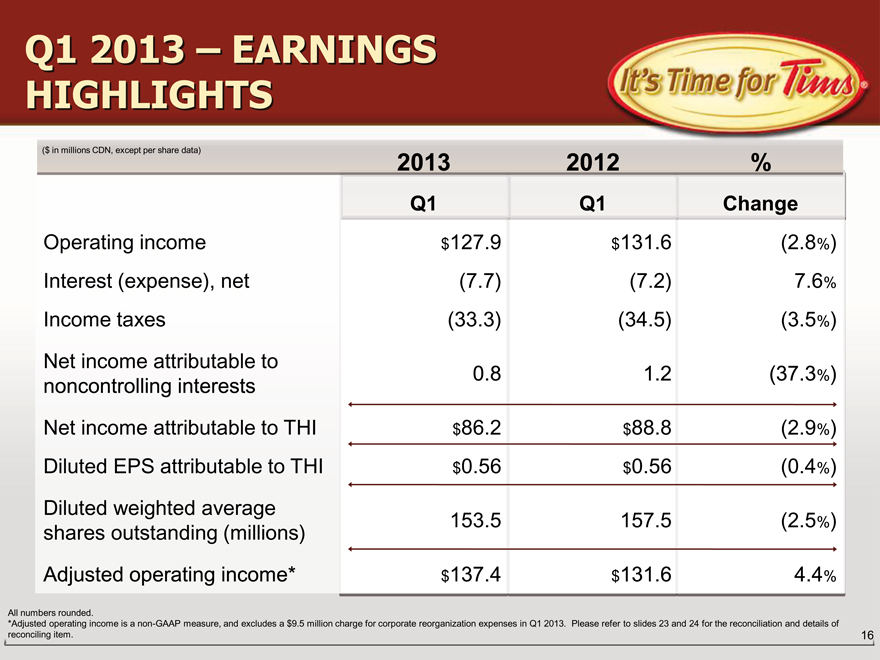
Q1 2013 – EARNINGS HIGHLIGHTS
($ in millions CDN, except per share data)
2013 2012 %
Q1 Q1 Change
Operating income $127.9 $131.6 (2.8%)
Interest (expense), net (7.7) (7.2) 7.6%
Income taxes (33.3) (34.5) (3.5%)
Net income attributable to
noncontrolling interests 0.8 1.2 (37.3%)
Net income attributable to THI $86.2 $88.8 (2.9%)
Diluted EPS attributable to THI $0.56 $0.56 (0.4%)
Diluted weighted average
shares outstanding (millions) 153.5 157.5 (2.5%)
Adjusted operating income* $137.4 $131.6 4.4%
All numbers rounded.
*Adjusted operating income is a non-GAAP measure, and excludes a $9.5 million charge for corporate reorganization expenses in Q1 2013. Please refer to slides 23 and 24 for the reconciliation and details of reconciling item.
16
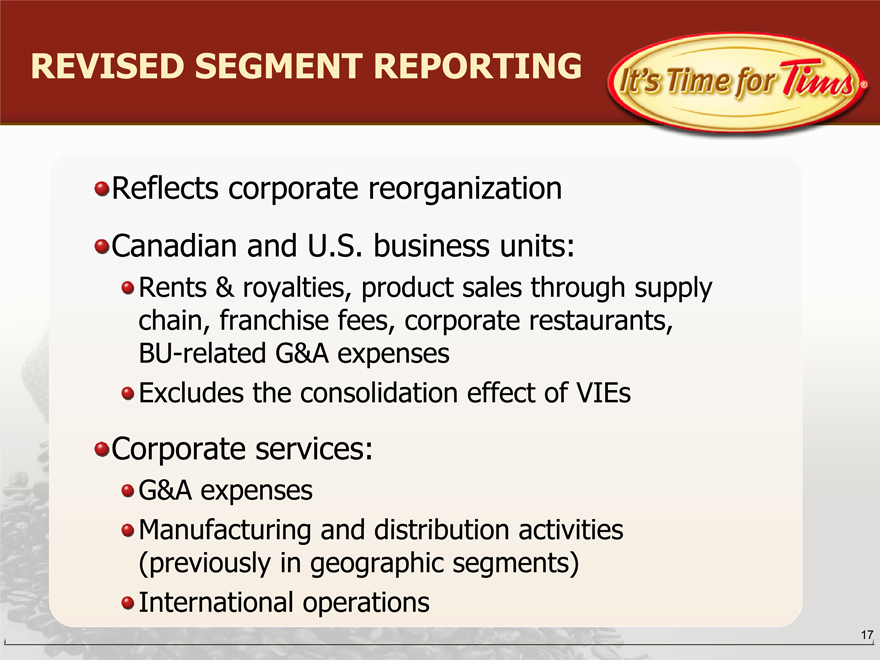
REVISED SEGMENT REPORTING
Reflects corporate reorganization
Canadian and U.S. business units:
Rents & royalties, product sales through supply chain, franchise fees, corporate restaurants, BU-related G&A expenses Exclude the consolidation effect of VIEs
Corporate services:
G&A expenses
Manufacturing and distribution activities (previously in geographic segments) International operations
17
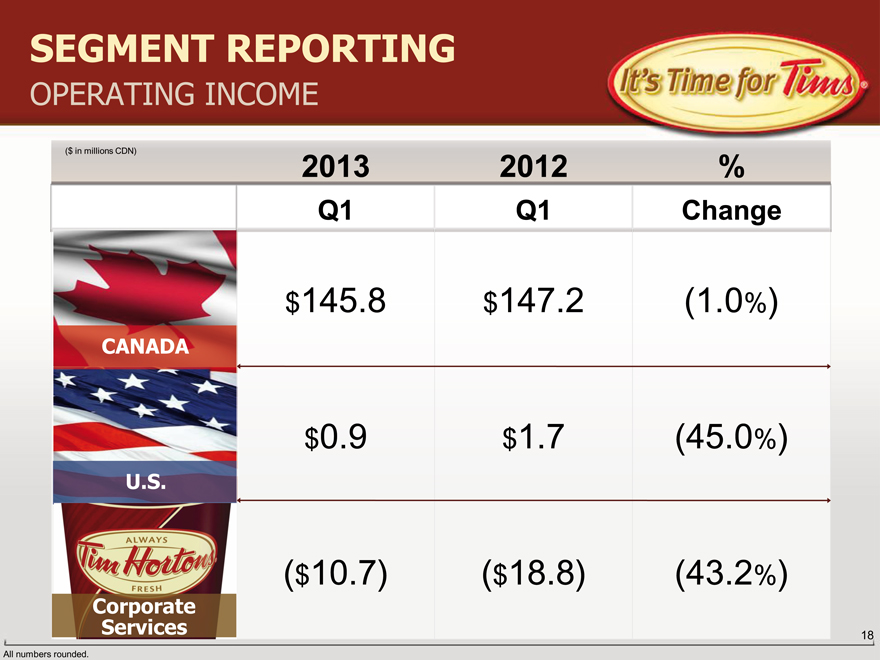
SEGMENT REPORTING
OPERATING INCOME
($ in millions CDN)
2013 2012 %
Q1 Q1 Change
$145.8 $147.2 (1.0%)
CANADA
$0.9 $1.7 (45.0%)
U.S.
($10.7) ($18.8) (43.2%)
Corporate
Services
All numbers rounded.
18
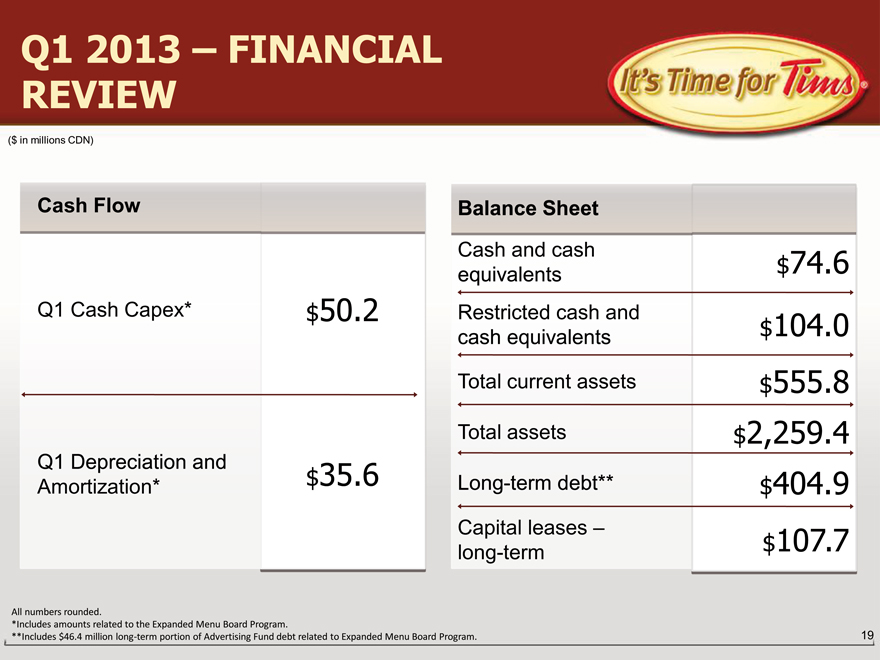
Q1 2013 – FINANCIAL REVIEW
($ in millions CDN)
Cash Flow Balance Sheet
Cash and cash $74.6
equivalents
Q1 Cash Capex* $ 50.2 Restricted cash and $104.0
cash equivalents
Total current assets $555.8
Total assets $2,259.4
Q1 Depreciation and $ 35.6
Amortization* Long-term debt** $404.9
Capital leases – $107.7
long-term
All numbers rounded.
*Includes amounts related to the Expanded Menu Board Program.
**Includes $46.4 million long-term portion of Advertising Fund debt related to Expanded Menu Board Program.
19
CAPITAL ALLOCATION STRATEGY
Complexities need to be taken into account in light of historically low interest rate environment Evaluating optimal capital structure
20
Appendix
SYSTEMWIDE SALES GROWTH
& SAME-STORE SALES
Total systemwide sales growth includes restaurant-level sales at both Company and Franchised restaurants. Approximately 99.6% of our system is franchised as at March 31st, 2013. Systemwide sales growth is determined using a constant exchange rate where noted, to exclude the effects of foreign currency translation. U.S. dollar sales are converted to Canadian dollar amounts using the average exchange rate of the base year for the period covered. For the first quarter of 2013, systemwide sales on a constant currency basis increased 3.2% compared to the first quarter of 2012. Systemwide sales are important to understanding our business performance as they impact our franchise royalties and rental income, as well as our distribution income. Changes in systemwide sales are driven by changes in average same-store sales and changes in the number of systemwide restaurants, and are ultimately driven by consumer demand.
We believe systemwide sales and same-store sales growth provide meaningful information to investors regarding the size of our system, the overall health and financial performance of the system, and the strength of our brand and restaurant owner base, which ultimately impacts our consolidated and segmented financial performance. Franchised restaurant sales are not generally included in our Condensed Consolidated Financial Statements (except for certain non-owned restaurants consolidated in accordance with applicable accounting rules). The amount of systemwide sales impacts our rental and royalties revenues, as well as distribution revenues.
22
INFORMATION ON NON-GAAP MEASURE: ADJUSTED OPERATING INCOME
Adjusted operating income is a non-GAAP measure. See reconciliation on the next slide for adjusting items to calculate adjusted operating income. Management uses adjusted operating income to assist in the evaluation of year-over-year performance, and believes that it will be helpful to investors as a measure of underlying operational growth rates. This non-GAAP measure is not intended to replace the presentation of our financial results in accordance with GAAP. The Company’s use of the term adjusted operating income may differ from similar measures reported by other companies. The reconciliation of operating income, a GAAP measure, to adjusted operating income, a non-GAAP measure, is set forth in the next slide.
23
RECONCILIATION OF
ADJUSTED OPERATING INCOME
($ in millions CDN)
2013 2012
Q1 Q1
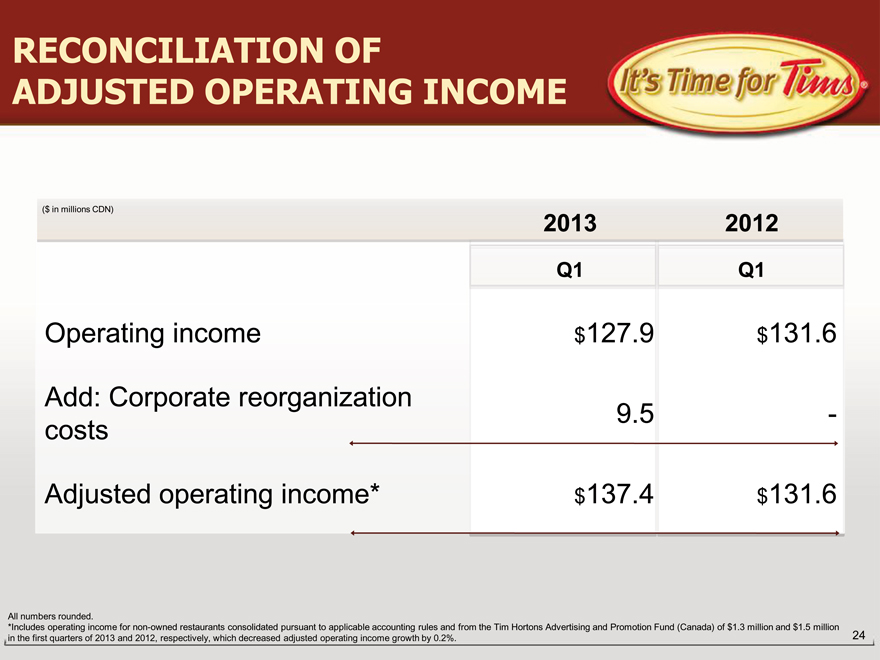
Operating income $ 127.9 $ 131.6
Add: Corporate reorganization
costs 9.5 -
Adjusted operating income* $ 137.4 $ 131.6
All numbers rounded.
*Includes operating income for non-owned restaurants consolidated pursuant to applicable accounting rules and from the Tim Hortons Advertising and Promotion Fund (Canada) of $1.3 million and $1.5 million in the first quarters of 2013 and 2012, respectively, which decreased adjusted operating income growth by 0.2%.
24
INFORMATION ON NON-GAAP MEASURE: ADJUSTED DEBT TO EBITDAR
Our current goal is to manage debt levels to continue our investment grade credit rating, which is important in order to maintain access to a variety of short and long-term sources of funding. When evaluating our leverage position, we look at metrics that consider the impact of long-term operating and capital leases as well as other long-term debt obligations which are all important considerations in credit rating assessments given that our business model involves owning or controlling a significant amount of our restaurant properties and, as a result, we have a significant number of both capital and operating leases.
When evaluating our debt capacity, we believe that Adjusted Debt to EBITDAR (Earnings before Interest, Income Tax, Depreciation, Amortization and Rent) is the most relevant and frequently used financial ratio for assessing leverage as this measure broadly encompasses the Company’s borrowing and leasing activities. Adjusted Debt to EBITDAR is a non-
GAAP measure and there are limitations associated with using this non-GAAP measure as compared to the most directly comparable GAAP measure. Management believes Adjusted Debt to EBITDAR is useful for purposes of evaluating the amount of financial leverage, which encompasses operating lease commitments which are not recorded on our balance sheet, and to evaluate the balance sheet on a consistent basis with our Canadian rating agency. As such, the Company believes that the ratio of Adjusted Debt to EBITDAR is a useful supplemental measure as it provides an indication of the results generated by the Company and its level of indebtedness in relation to its capital structure, including operating lease activity. In our calculation of Adjusted Debt to EBITDAR, we have added back our Corporate reorganization expenses because we believe this non-GAAP adjustment is consistent with our Canadian rating agency calculations. Non-GAAP financial measures should be considered in addition to, not as a substitute for, total debt, net income, earnings per share or other measures of financial performance prepared in accordance with GAAP. Other companies in our industry and other rating agencies may calculate Adjusted Debt to EBITDAR differently than the Canadian rating agency does.
Our Adjusted Debt to EBITDAR for fiscal 2012 was 1.7x. This measure has been calculated by the Company to align with our Canadian rating agency calculations and reconciled to Operating income, the most directly comparable GAAP measure, as follows on the next slide.
25
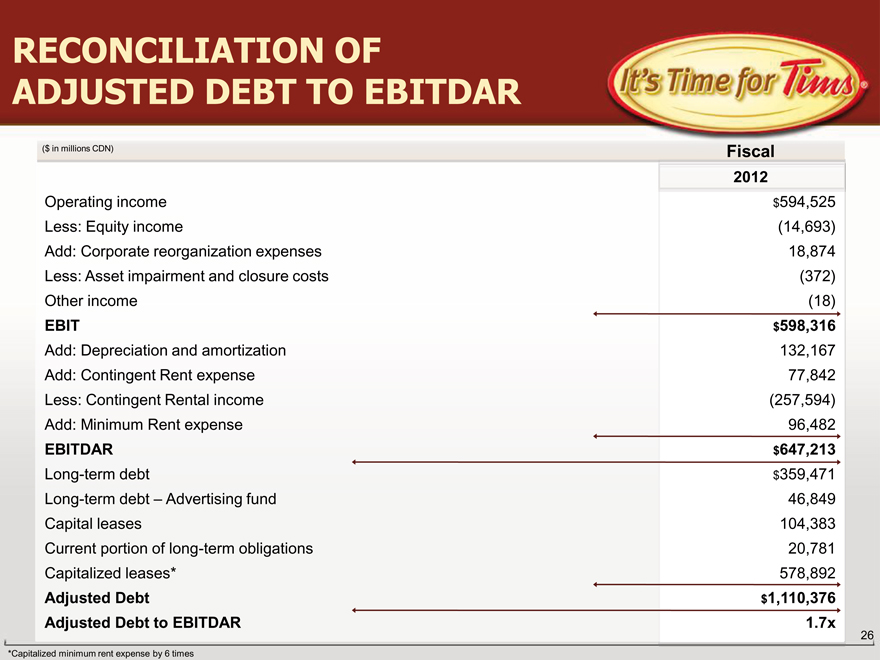
RECONCILIATION OF
ADJUSTED DEBT TO EBITDAR
($ in millions CDN) Fiscal
2012
Operating income $594,525
Less: Equity income (14,693)
Add: Corporate reorganization expenses 18,874
Less: Asset impairment and closure costs (372)
Other income (18)
EBIT $598,316
Add: Depreciation and amortization 132,167
Add: Contingent Rent expense 77,842
Less: Contingent Rental income (257,594)
Add: Minimum Rent expense 96,482
EBITDAR $647,213
Long-term debt $359,471
Long-term debt – Advertising fund 46,849
Capital leases 104,383
Current portion of long-term obligations 20,781
Capitalized leases* 578,892
Adjusted Debt $1,110,376
Adjusted Debt to EBITDAR 1.7x
*Capitalized minimum rent expense by 6 times
26