Exhibit 99.1
Tim Hortons
Q2 2013
Investor Update
SAFE HARBOR STATEMENT
Certain information in this presentation, particularly information regarding future economic performance, finances, and plans, expectations and objectives of management, and other information, constitutes forward-looking information within the meaning of Canadian securities laws and forward-looking statements within the meaning of the Private Securities Litigation Reform Act of 1995. We refer to all of these as forward-looking statements. Various factors including competition in the quick service segment of the food service industry, general economic conditions and others described as “risk factors” in the Company’s 2012 Annual Report on Form 10-K filed February 21st, 2013, and our Quarterly Report on Form 10-Q filed on August 8th, 2013 with the U.S. Securities and Exchange Commission and Canadian Securities Administrators, could affect the Company’s actual results and cause such results to differ materially from those expressed in forward-looking statements. As such, readers are cautioned not to place undue reliance on forward-looking statements contained in this presentation, which speak only as to management’s expectations as of the date hereof.
Forward-looking statements are based on a number of assumptions which may prove to be incorrect, including, but not limited to, assumptions about: the absence of an adverse event or condition that damages our strong brand position and reputation; the absence of a material increase in competition or in volume or type of competitive activity within the quick service restaurant segment of the food service industry; ability to obtain financing on favourable terms; ability to maintain investment grade credit ratings; prospects and execution risks concerning the U.S. market strategy; general worldwide economic conditions; cost and availability of commodities; the ability to retain our senior management team or the inability to attract and retain new qualified personnel; continuing positive working relationships with the majority of the Company’s restaurant owners; the absence of any material adverse effects arising as a result of litigation; and there being no significant change in the Company’s ability to comply with current or future regulatory requirements.
We are presenting this information for the purpose of informing you of management’s current expectations regarding these matters, and this information may not be appropriate for any other purpose. We assume no obligation to update or alter any forward-looking statements after they are made, whether as a result of new information, future events, or otherwise, except as required by applicable law. Please review the Company’s Safe Harbor Statement at www.timhortons.com/en/about/safeharbor.html.
2
Strong Business with Focused Strategy to Drive Shareholder Returns
Canadian market leadership position and unique business model supports strong, reliable cash flows
Significant opportunities in 3 distinct markets: Canada, U.S. and International
Strong track record of returning capital to shareholders with clear plans to continue
Taking actions to drive shareholder value and position Tim Hortons for sustainable long-term earnings growth
3
Q2 2013: Key Themes
New reality facing food services industry: low-growth, competitive environment
Building on our strengths and leadership position to drive top-line sales
A great business; focused on key opportunities and challenges
4
Recent Announcements Designed to Drive Shareholder Value
Board approved $900 million increase in debt
Plan to direct proceeds to repurchase $1 billion of shares within the next year
Accelerating initiative to partner with well-capitalized franchisees in the U.S. market
Two new directors add financial and strategic expertise to Board
Sherri Brillon, EVP & CFO, Encana Corp
Thomas Milroy, CEO, BMO Capital Markets
5
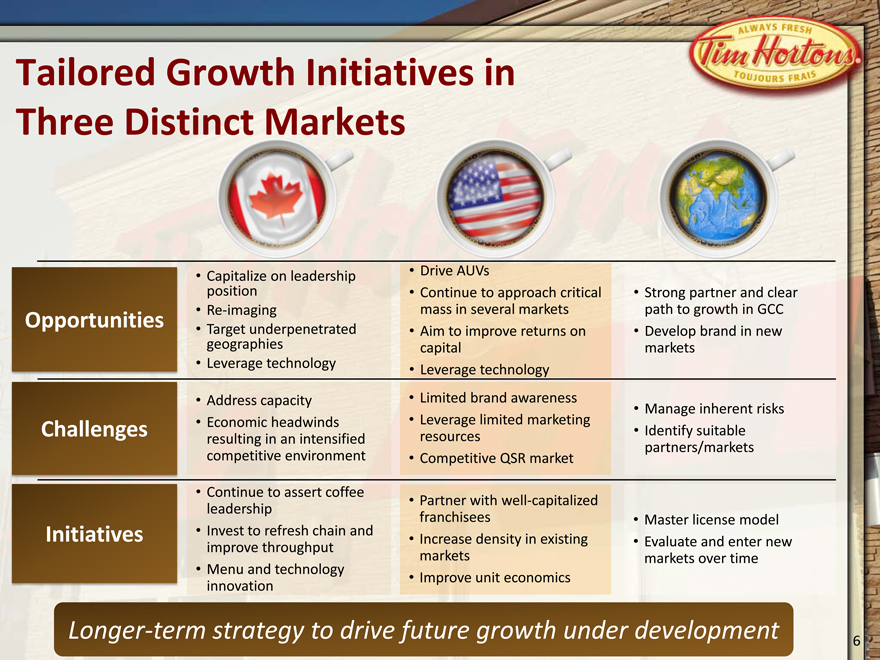
Tailored Growth Initiatives in Three Distinct Markets
Opportunities
Capitalize on leadership position
Re-imaging
Target underpenetrated geographies
Drive AUVs
Continue to approach critical mass in several markets
Aim to improve returns on capital
Strong partner and clear path to growth in GCC
Develop brand in new markets
Challenges
Address capacity
Economic headwinds resulting in an intensified competitive environment
Limited brand awareness
Leverage limited marketing resources
Competitive QSR market
Manage inherent risks
Identify suitable partners/markets
Initiatives
Continue to assert coffee leadership
Invest to refresh chain and improve throughput
Menu and technology innovation
Partner with well-capitalized franchisees
Increase density in existing markets
Improve unit economics
Master license model
Evaluate and enter new markets over time
Longer-term strategy to drive future growth under development
6
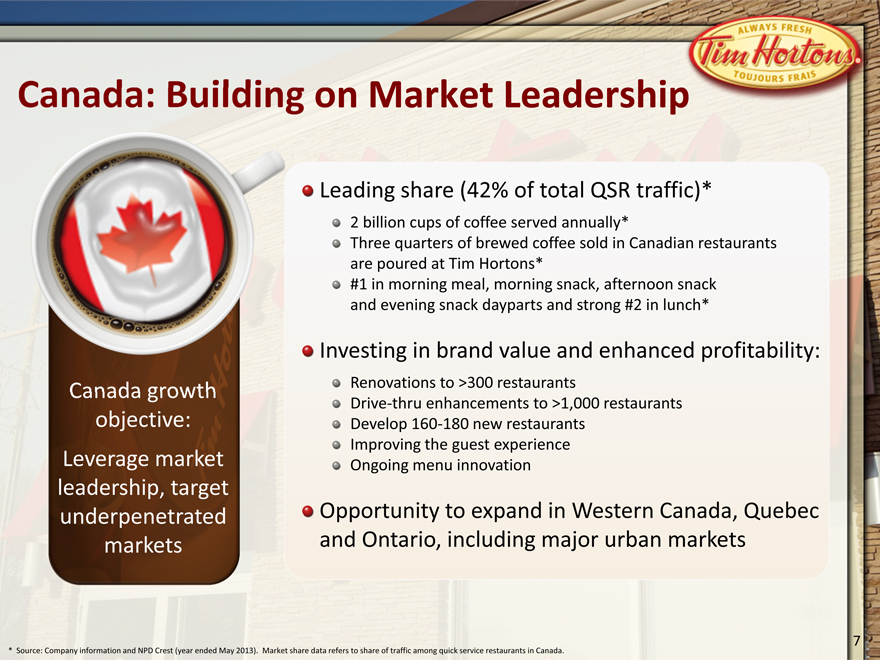
Canada: Building on Market Leadership
Leading share (42% of total QSR traffic)*
2 billion cups of coffee served annually*
Three quarters of brewed coffee sold in Canadian restaurants are poured at Tim Hortons*
#1 in morning meal, morning snack, afternoon snack and evening snack dayparts and strong #2 in lunch*
Investing in brand value and enhanced profitability:
Renovations to >300 restaurants
Drive-thru enhancements to >1,000 restaurants
Develop 160-180 new restaurants
Improving the guest experience Ongoing menu innovation
Opportunity to expand in Western Canada, Quebec and Ontario, including major urban markets
Canada growth objective: Leverage market leadership, target underpenetrated markets
* Source: Company information and NPD Crest (year ended May 2013). Market share data refers to share of traffic among quick service restaurants in Canada.
7
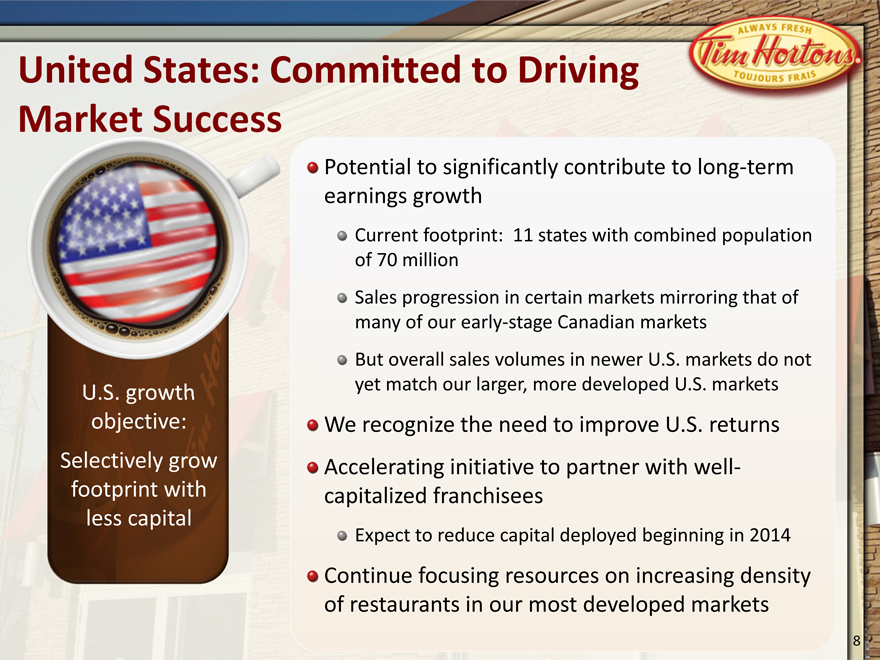
United States: Committed to Driving Market Success
Potential to significantly contribute to long-term earnings growth
Current footprint: 11 states with combined population of 70 million
Sales progression in certain markets mirroring that of many of our early-stage Canadian markets
But overall sales volumes in newer U.S. markets do not yet match our larger, more developed U.S. markets
We recognize the need to improve U.S. returns
Accelerating initiative to partner with well-capitalized franchisees
Expect to reduce capital deployed beginning in 2014
Continue focusing resources on increasing density of restaurants in our most developed markets
U.S. growth objective: Selectively grow footprint with less capital
8
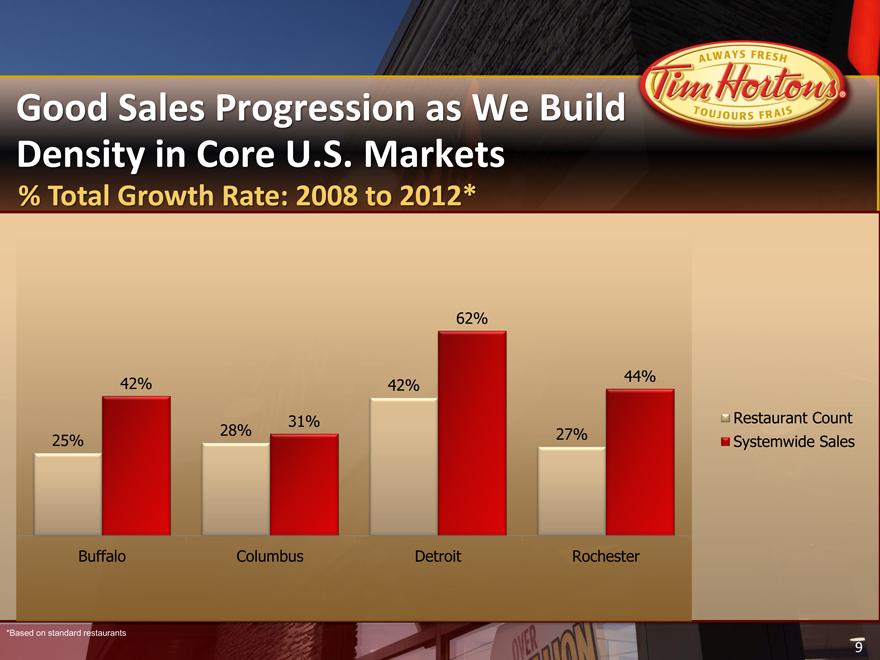
Good Sales Progression as We Build Density in Core U.S. Markets
% Total Growth Rate: 2008 to 2012*
25%
42%
28%
31%
42%
62%
27%
44%
Buffalo
Columbus
Detroit
Rochester
Restaurant Count Systemwide Sales
*Based on standard restaurants
9
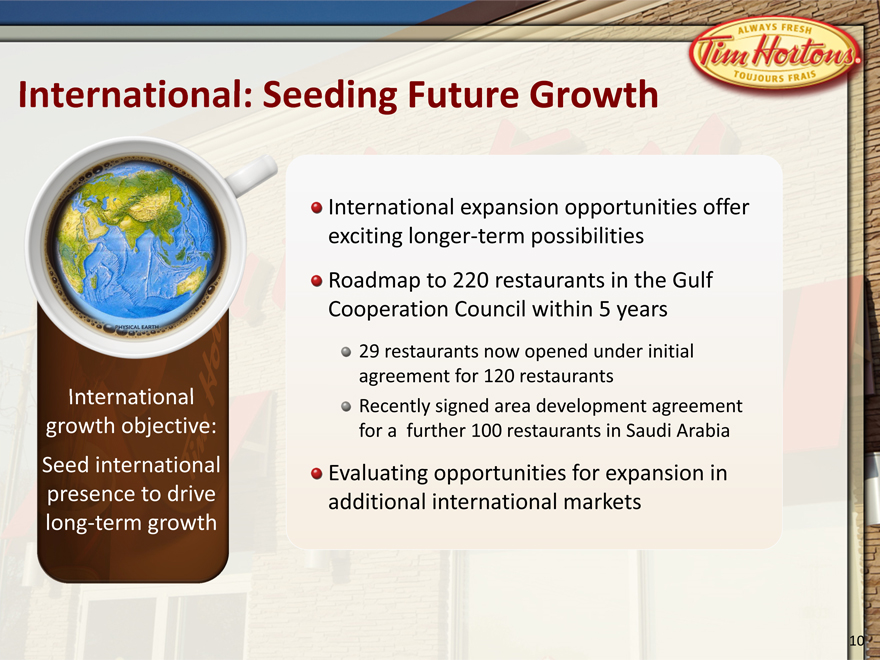
International: Seeding Future Growth
International expansion opportunities offer exciting longer-term possibilities
Roadmap to 220 restaurants in the Gulf Cooperation Council within 5 years
29 restaurants now opened under initial agreement for 120 restaurants Recently signed area development agreement for a further 100 restaurants in Saudi Arabia
Evaluating opportunities for expansion in additional international markets
International growth objective: Seed international presence to drive long-term growth
10
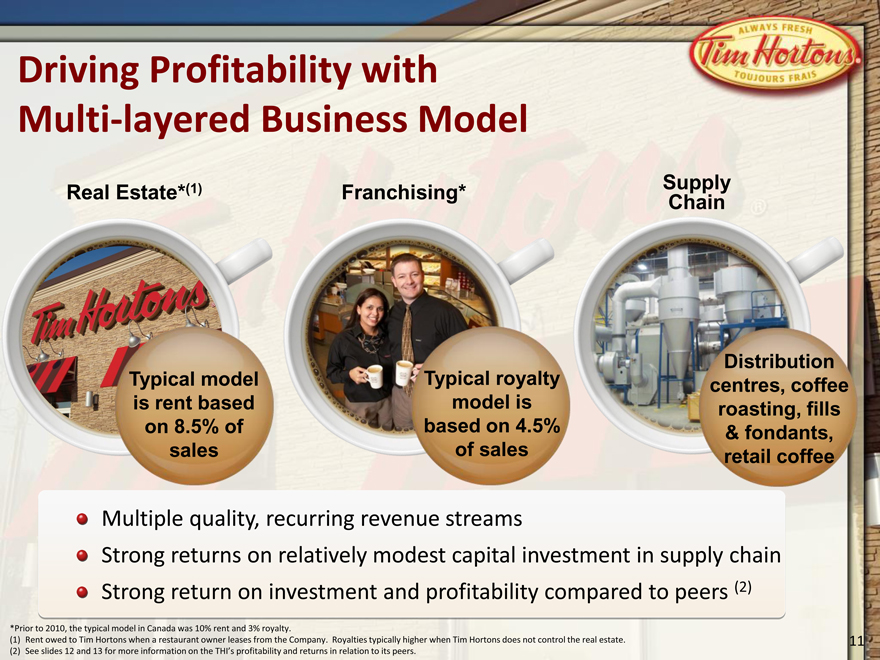
Driving Profitability with
Multi-layered Business Model
*Prior to 2010, the typical model in Canada was 10% rent and 3% royalty.
Rent owed to Tim Hortons when a restaurant owner leases from the Company. Royalties typically higher when Tim Hortons does not control the real estate.
See slides 12 and 13 for more information on the THI’s profitability and returns in relation to its peers.
Supply
Chain
Real Estate*(1)
Franchising*
Typical royalty
model is
based on 4.5%
of sales
Distribution
centres, coffee
roasting, fills
& fondants,
CPG
Multiple quality, recurring revenue streams
Strong returns on relatively modest capital investment in supply chain
Strong return on investment and profitability compared to peers (2)
Typical model
is rent based
on 8.5% of
sales
11
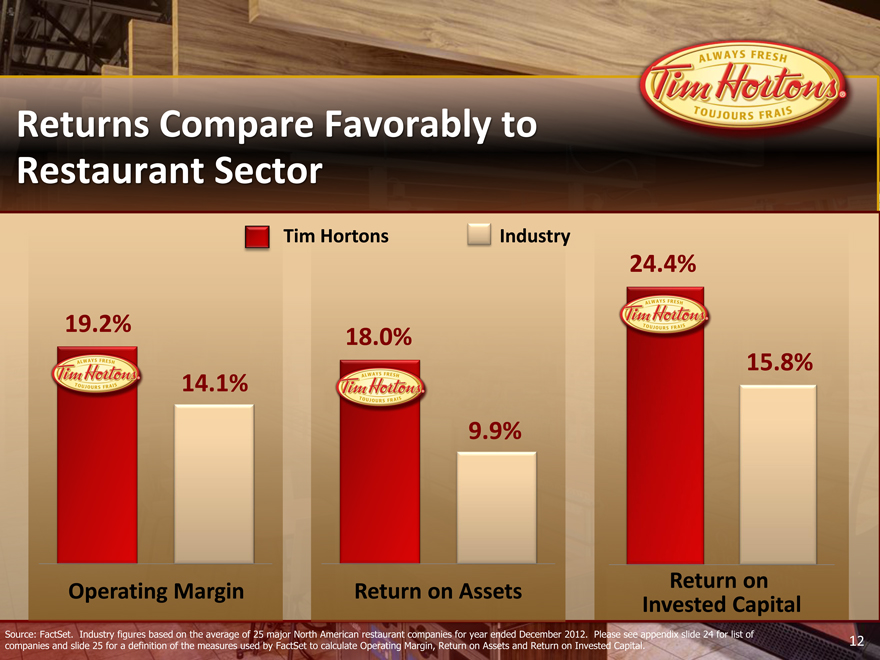
Returns Compare Favorably to
Restaurant Sector
Tim Hortons
(CHART)
(CHART)
Industry
(CHART)
Operating Margin
Return on Assets
Return on
Invested Capital
24.4%
15.8%
18.0%
9.9%
19.2%
14.1%
Source: FactSet. Industry figures based on the average of 25 major North American restaurant companies for year ended December 2012. Please see appendix slide 24 for list of
companies and slide 25 for a definition of the measures used by FactSet to calculate Operating Margin, Return on Assets and Return on Invested Capital.
12
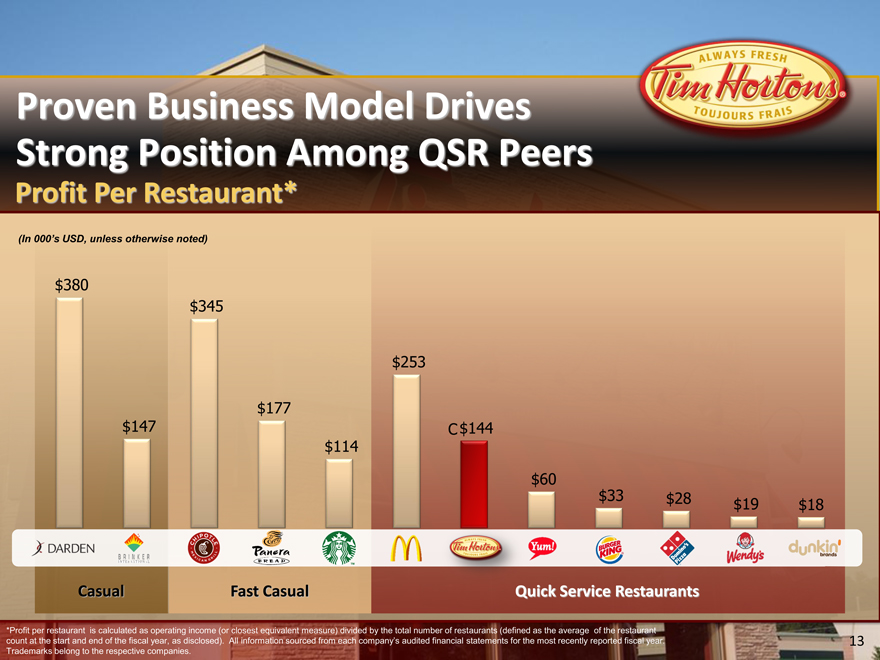
Proven Business Model Drives
Strong Position Among QSR Peers
Profit Per Restaurant*
Casual
Fast Casual
Quick Service Restaurants
(In 000’s USD, unless otherwise noted)
C
*Profit per restaurant is calculated as operating income (adjusted for one-time items) divided by the total number of restaurants (defined as the average of the restaurant count at the start
and end of the fiscal year, as disclosed). All information sourced from each company’s audited financial statements for the most recently reported fiscal year.
13
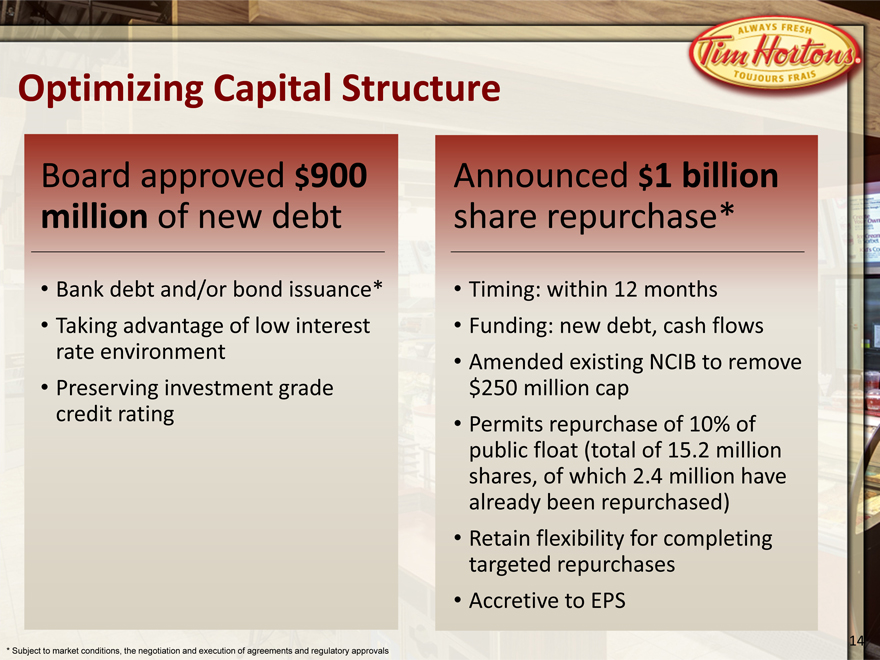
Optimizing Capital Structure
Board approved $900
million of new debt
Bank debt and/or bond issuance*
Taking advantage of low interest
rate environment
Preserving investment grade
credit rating
Announced $1 billion
share repurchase*
Timing: within 12 months
Funding: new debt, cash flows
Amended existing NCIB to remove
$250 million cap
Permits repurchase of 10% of
public float (total of 15.2 million
shares, of which 2.4 million have
already been repurchased)
Retain flexibility for completing
targeted repurchases
Accretive to EPS
* | | Subject to market conditions, the negotiation and execution of agreements and regulatory approvals |
14
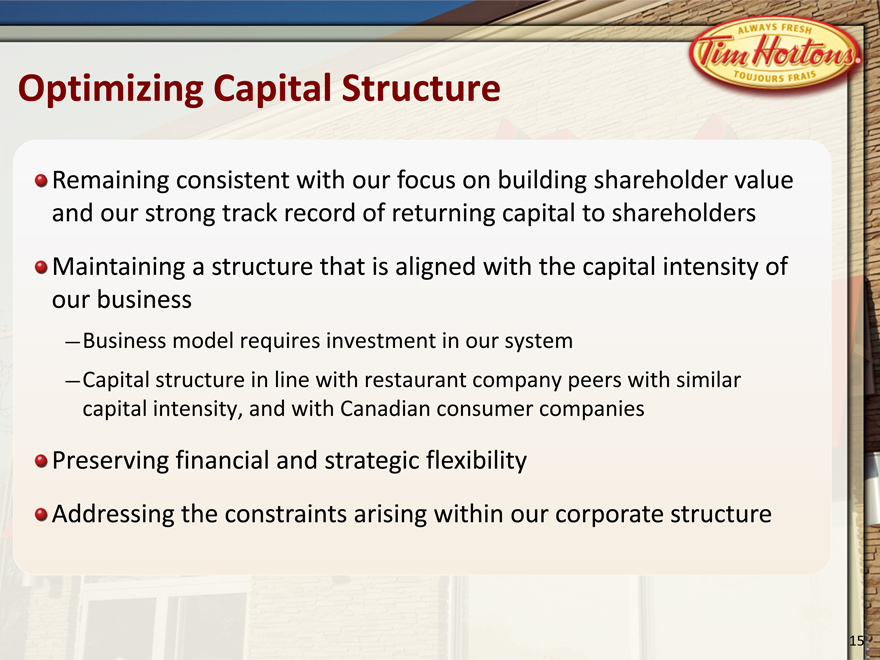
Optimizing Capital Structure
Remaining consistent with our focus on building shareholder value
and our strong track record of returning capital to shareholders
Maintaining a structure that is aligned with the capital intensity of
our business
Business model requires investment in our system
Capital structure in line with restaurant company peers with similar
capital intensity, and with Canadian consumer companies
Preserving financial and strategic flexibility
Addressing the constraints arising within our corporate structure
15
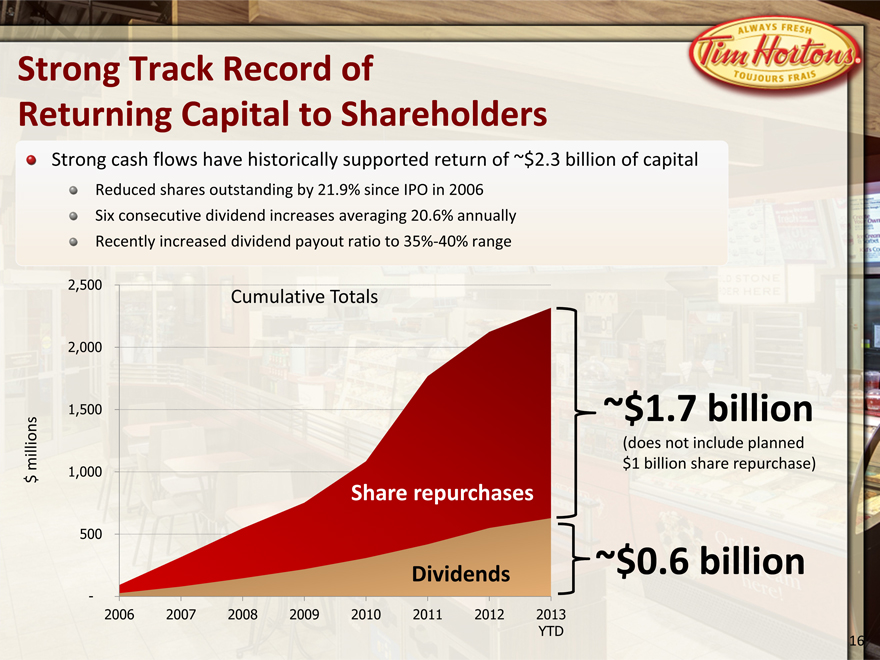
Strong Track Record of
Returning Capital to Shareholders
Share repurchases
Dividends
~$1.7 billion
(does not include planned
$1 billion share repurchase)
~$0.6 billion
Cumulative Totals
Strong cash flows have historically supported return of ~$2.3 billion of capital
Reduced shares outstanding by 21.9% since IPO in 2006
Six consecutive dividend increases averaging 20.6% annually
Recently increased dividend payout ratio to 35%-40% range
$ millions
16
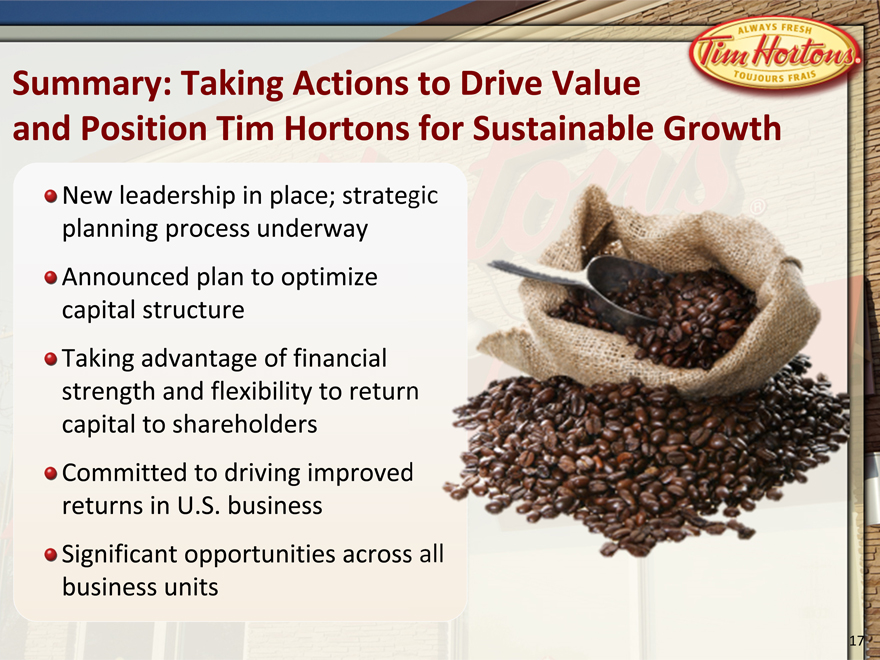
Summary: Taking Actions to Drive Value
and Position Tim Hortons for Sustainable Growth
New leadership in place; strategic
planning process underway
Announced plan to optimize
capital structure
Taking advantage of financial
strength and flexibility to return
capital to shareholders
Committed to driving improved
returns in U.S. business
Significant opportunities across all
business units
17
Appendix
18
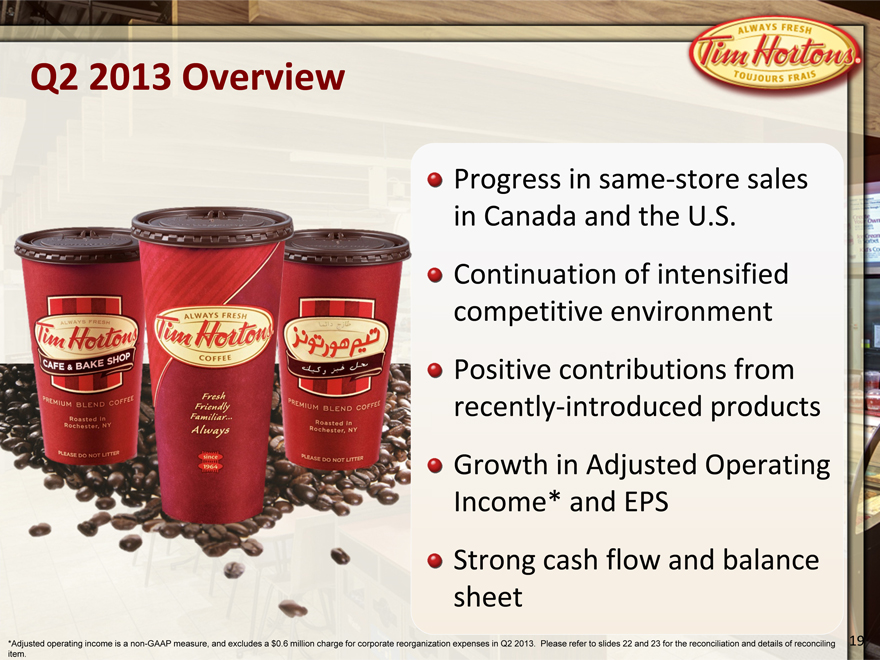
Q2 2013 Overview
Progress in same-store sales
in Canada and the U.S.
Continuation of intensified
competitive environment
Positive contributions from
recently-introduced products
Growth in Adjusted Operating
Income* and EPS
Strong cash flow and balance
sheet
*Adjusted operating income is a non-GAAP measure, and excludes a $0.6 million charge for corporate reorganization expenses in Q2 2013. Please refer to slides 22 and 23 for the reconciliation and details of reconciling
item.
19
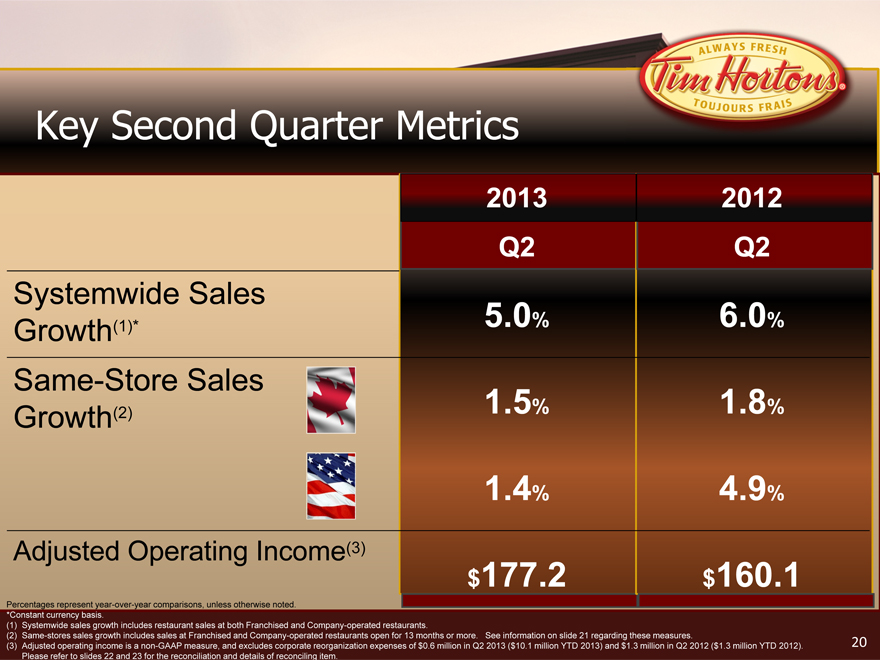
Key Second Quarter Metrics
2013 2012
Q2 Q2
Systemwide Sales Growth(1)* 5.0% 6.0%
Same-Store Sales Growth(2) 1.5% 1.8%
1.4% 4.9%
Adjusted Operating Income(3) $177.2 $160.1
Percentages represent year-over-year comparisons, unless otherwise noted.
*Constant currency basis.
Systemwide sales growth includes restaurant sales at both Franchised and Company-operated restaurants.
Same-stores sales growth includes sales at Franchised and Company-operated restaurants open for 13 months or more. See information on slide 21 regarding these measures.
Adjusted operating income is a non-GAAP measure, and excludes corporate reorganization expenses of $0.6 million in Q2 2013 ($10.1 million YTD 2013) and $1.3 million in Q2 2012 ($1.3 million YTD 2012).
Please refer to slides 22 and 23 for the reconciliation and details of reconciling item.
20
Total systemwide sales growth includes restaurant level sales at both Company and
Franchised restaurants. Approximately 99.5% of our systemwide restaurants were franchised
as at June 30th, 2013. Systemwide sales growth is determined using a constant exchange rate
where noted, to exclude the effects of foreign currency translation. U.S. dollar sales are
converted to Canadian dollar amounts using the average exchange rate of the base year for
the period covered. For the second quarter of 2013, systemwide sales on a constant
currency basis increased 5.0% compared to the second quarter of 2012. Systemwide sales
are important to understanding our business performance as they impact our franchise
royalties and rental income, as well as our distribution income. Changes in systemwide sales
are driven by changes in average same-store sales and changes in the number of systemwide
restaurants, and are ultimately driven by consumer demand.
We believe systemwide sales and same-store sales growth provide meaningful information
to investors regarding the size of our system, the overall health and financial performance of
the system, and the strength of our brand and restaurant owner base, which ultimately
impacts our consolidated and segmented financial performance. Franchised restaurant sales
are not generally included in our Condensed Consolidated Financial Statements (except for
certain non-owned restaurants consolidated in accordance with applicable accounting rules).
Systemwide Sales Growth
& Same-Store Sales
21
Adjusted operating income is a non-GAAP measure. See reconciliations for adjusting items to
calculate adjusted operating income. Management uses adjusted operating income to assist
in the evaluation of year-over-year performance, and believes that it will be helpful to
investors as a measure of underlying operational growth rates. This non-GAAP measure is
not intended to replace the presentation of our financial results in accordance with GAAP.
The Company’s use of the term adjusted operating income may differ from similar measures
reported by other companies. The reconciliation of operating income, a GAAP measure, to
adjusted operating income, a non-GAAP measure, is set forth in the following slide.
Information on Non-GAAP Measure:
Adjusted Operating Income
22
Reconciliation of Adjusting
Operating Income
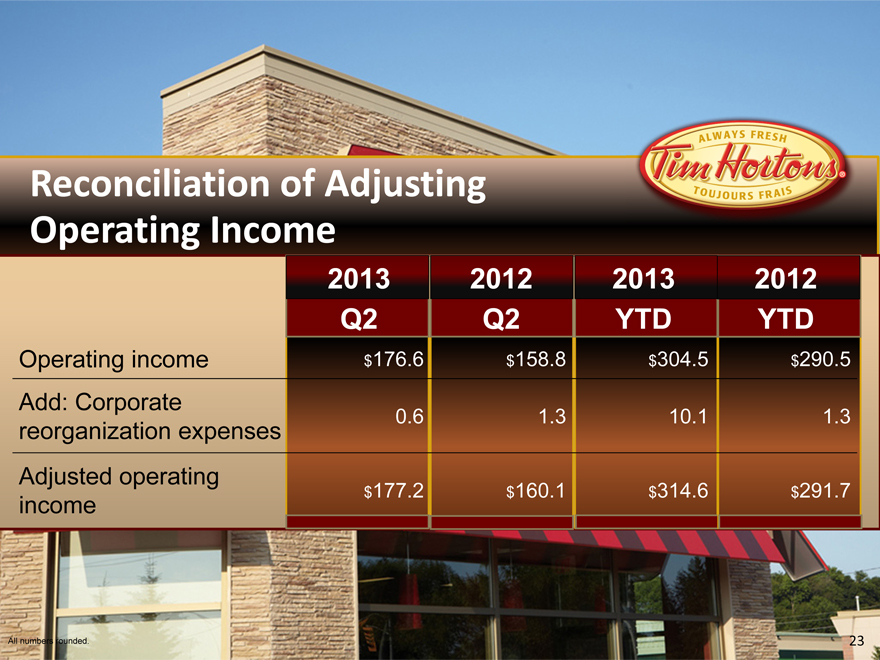
All numbers rounded.
2013 2012 2013 2012
Q2 Q2 YTD YTD
Operating income $176.6 $158.8 $304.5 $290.5
Add: Corporate reorganization expenses 0.6 1.3 10.1 1.3
Adjusted operating income $177.2 $160.1 $314.6 $291.7
23
Restaurant Peer Group
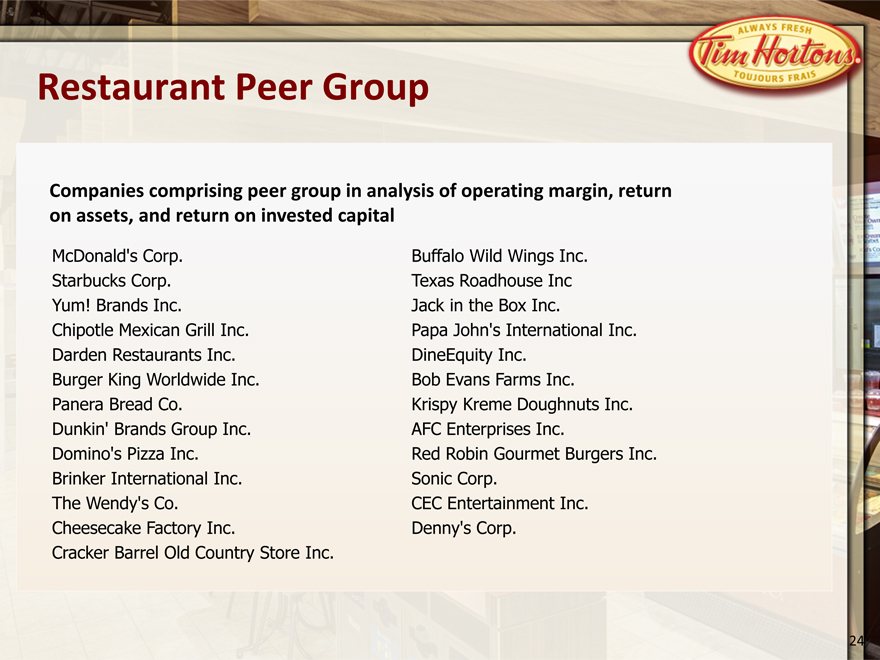
McDonald’s Corp.
Starbucks Corp.
Yum! Brands Inc.
Chipotle Mexican Grill Inc.
Darden Restaurants Inc.
Burger King Worldwide Inc.
Panera Bread Co.
Dunkin’ Brands Group Inc.
Domino’s Pizza Inc.
Brinker International Inc.
The Wendy’s Co.
Cheesecake Factory Inc.
Cracker Barrel Old Country Store Inc.
Buffalo Wild Wings Inc.
Texas Roadhouse Inc
Jack in the Box Inc.
Papa John’s International Inc.
DineEquity Inc.
Bob Evans Farms Inc.
Krispy Kreme Doughnuts Inc.
AFC Enterprises Inc.
Red Robin Gourmet Burgers Inc.
Sonic Corp.
CEC Entertainment Inc.
Denny’s Corp.
Companies comprising peer group in analysis of operating margin, return
on assets, and return on invested capital
24
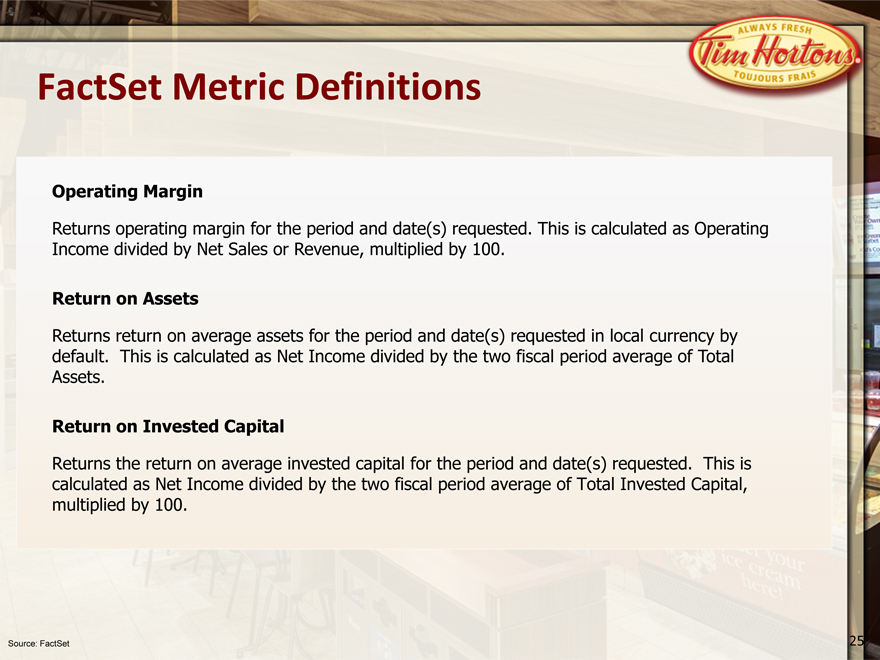
FactSet Metric Definitions
Operating Margin
Returns operating margin for the period and date(s) requested. This is calculated as Operating
Income divided by Net Sales or Revenue, multiplied by 100.
Return on Assets
Returns return on average assets for the period and date(s) requested in local currency by
default. This is calculated as Net Income divided by the two fiscal period average of Total
Assets.
Return on Invested Capital
Returns the return on average invested capital for the period and date(s) requested. This is
calculated as Net Income divided by the two fiscal period average of Total Invested Capital,
multiplied by 100.
Source: FactSet
25
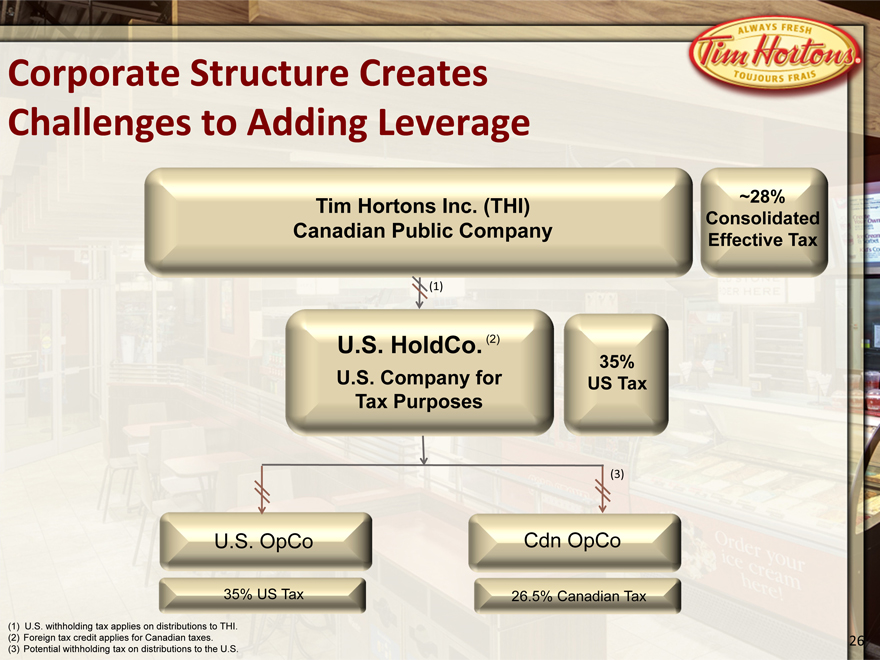
Corporate Structure Creates
Challenges to Adding Leverage
Tim Hortons Inc. (THI)
Canadian Public Company
U.S. OpCo
U.S. HoldCo. (2)
U.S. Company for
Tax Purposes
Cdn OpCo
35%
US Tax
~28%
Consolidated
Effective Tax
26.5% Canadian Tax
35% US Tax
(1) | | U.S. withholding tax applies on distributions to THI. |
Foreign tax credit applies for Canadian taxes.
Potential withholding tax on distributions to the U.S.
Limited Value-Creation Potential in a
REIT Conversion
26
In keeping with our commitment to maximize shareholder value, we recently
explored the possibility of converting THI real estate assets to a REIT structure with
help from our external financial and legal advisors
After a thorough evaluation we concluded that there is currently limited value-
creation potential in a REIT because of reasons unique to THI, including:
Unlike many other retailers that have transitioned into a REIT structure, the majority of our
real estate is leased
Due to the nature of our business relationships with restaurant owners, rental income may
not qualify for a REIT
We believe pursuing a REIT structure would not add significant shareholder value for
THI, given company’s current business model and applicable regulations
27