
Third Quarter 2017 Earnings Call November 9, 2017
Disclaimer The information in this presentation is provided to you by China Rapid Finance Limited (the “Company”) solely for informational purposes and is not an offer to buy or sell, or a solicitation of an offer to buy or sell, any security or instrument of the Company, or to participate in any investment activity or trading strategy, nor may it or any part of it form the basis of or be relied on in connection with any contract or commitment whatsoever, in the United States or anywhere else. The information included herein was obtained from various sources, including certain third parties, and has not been independently verified. This presentation does not constitute legal, regulatory, accounting or tax advice to you. This presentation does not constitute and should not be considered as any form of financial opinion or recommendation by the Company or any other party. No representations, warranties or undertakings, express or implied, are made and no reliance should be placed on the accuracy, fairness or completeness of the information, sources or opinions presented or contained in this presentation. By viewing or accessing the information contained in this presentation, you hereby acknowledge and agree that neither the Company, nor any of its directors, officers, employees, advisers, nor any of its representatives, affiliates, associated persons or agents accepts any responsibility for or makes any representation or warranty, express or implied, with respect to the truth, accuracy, fairness, completeness or reasonableness of the information contained in, and omissions from, these materials and that that neither the Company, nor any of its directors, officers, employees, advisers, nor any of its representatives, affiliates, associated persons or agents accepts any liability whatsoever for any loss howsoever arising from any information presented or contained in these materials. The information presented or contained in this presentation is subject to change without notice and its accuracy is not guaranteed. This presentation contains statements that constitute forward-looking statements within the meaning of Section 27A of the Securities Act and Section 21E of the Securities Exchange Act of 1934, as amended. These statements include descriptions regarding the intent, belief or current expectations of the Company or its officers about the future. Such forward-looking statements are not guarantees of future performance and involve risks and uncertainties, and actual results may differ materially from those in the forward-looking statements as a result of various factors and assumptions, many of which are beyond the Company‘s control. A description of risks relating to the Company appears in section “Risk Factors” of the Company’s prospectus dated April 27, 2017 and filed with the Securities and Exchange Commission on April 28, 2017. Neither the Company, nor any of its directors, officers, employees, advisers, nor any of its representatives, affiliates, associated persons or agents has any obligation to, nor do any of them undertake to, revise or update the forward-looking statements contained in this presentation to reflect future events or circumstances. This presentation contains certain financial projections. These financial projections relate to future performance and reflect the Company‘s views as at the date of this presentation and are subject to known and unknown risks, uncertainties and assumptions that may cause future results, performance or achievements to differ materially from those expected. The Company believes the expectations reflected in these financial projections are reasonable but no assurance can be given that these expectations will prove to be correct and these financial projections should not be relied upon. The Company cannot guarantee future results, level of activities, performance or achievements, including, but not limited to borrowing activities on its platform, including size of loans and repeat borrowing rate, borrower attrition rate, the Company‘s ability to maintain its existing fee rates. Consequently, the Company makes no representation that the actual results achieved will be the same in whole or in part as those set out in the financial projections. 1
Our Mission Use Technology to Fulfill the Lifetime Consumer Credit Needs of China’s Emerging Middle Class 2
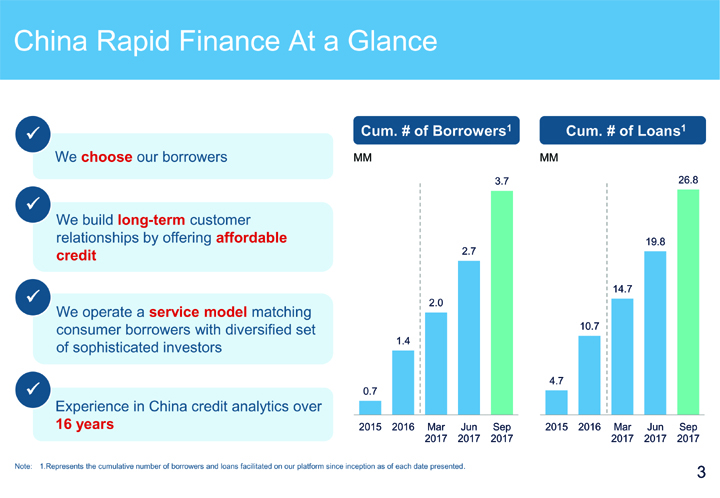
China Rapid Finance At a Glance  Cum. # of Borrowers1 Cum. # of Loans1 We choose our borrowers MM MM 3.7 26.8  We build long-term customer relationships by offering affordable 19.8 credit 2.7 14.7  We operate a service model matching 2.0 consumer borrowers with diversified set 10.7 of sophisticated investors 1.4 4.7  0.7 Experience in China credit analytics over 16 years 2015 2016 Mar Jun Sep 2015 2016 Mar Jun Sep 2017 2017 2017 2017 2017 2017 Note: 1.Represents the cumulative number of borrowers and loans facilitated on our platform since inception as of each date presented. 3
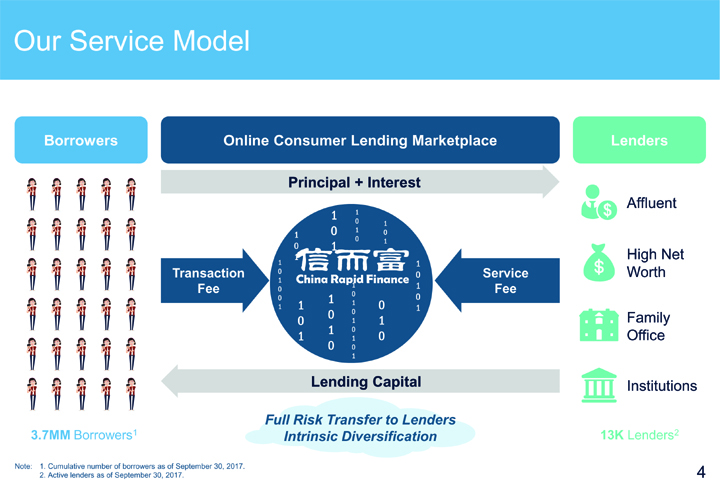
Our Service Model Borrowers Online Consumer Lending Marketplace Lenders Principal + Interest 1 1 Affluent 0 1 0 1 0 1 0 1 0 1 1 High Net 1 1 Transaction 0 0 Service Worth 1 1 1 Fee 0 Fee 0 0 0 1 1 1 1 0 1 0 0 Family 0 1 1 1 0 0 Office 1 1 0 0 1 Lending Capital Institutions Full Risk Transfer to Lenders 3.7MM Borrowers1 Intrinsic Diversification 13K Lenders2 Note: 1. Cumulative number of borrowers as of September 30, 2017. 2. Active lenders as of September 30, 2017. 4
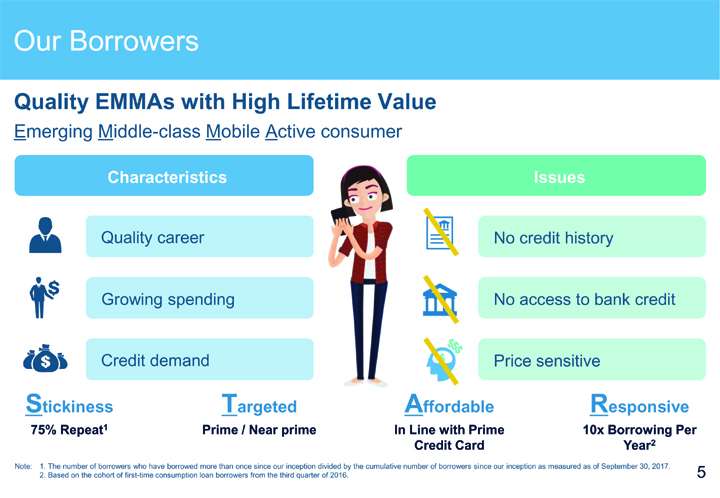
Our Borrowers Quality EMMAs with High Lifetime Value Emerging Middle-class Mobile Active consumer Characteristics Issues Quality career No credit history Growing spending No access to bank credit Credit demand $ Price sensitive Stickiness Targeted Affordable Responsive 75% Repeat1 Prime / Near prime In Line with Prime 10x Borrowing Per Credit Card Year2 Note: 1. The number of borrowers who have borrowed more than once since our inception divided by the cumulative number of borrowers since our inception as measured as of September 30, 2017. 2. Based on the cohort of first-time consumption loan borrowers from the third quarter of 2016. 5
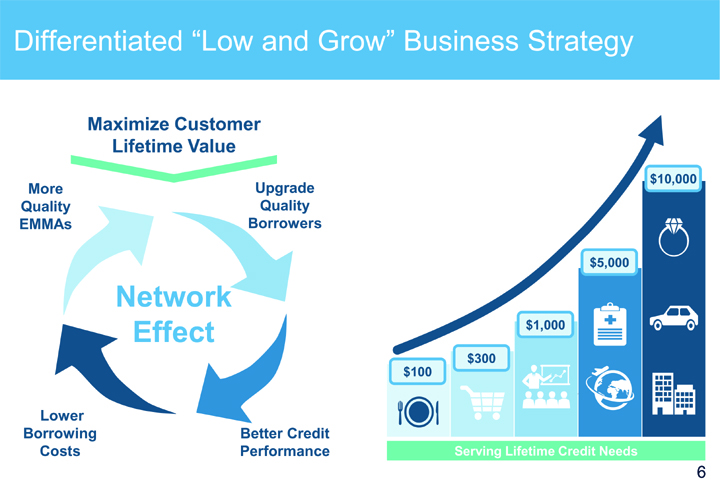
Differentiated “Low and Grow” Business Strategy Maximize Customer Lifetime Value $10,000 More Upgrade Quality Quality EMMAs Borrowers $5,000 Network Effect $1,000 $300 $100 Lower Borrowing Better Credit Costs Performance Serving Lifetime Credit Needs 6
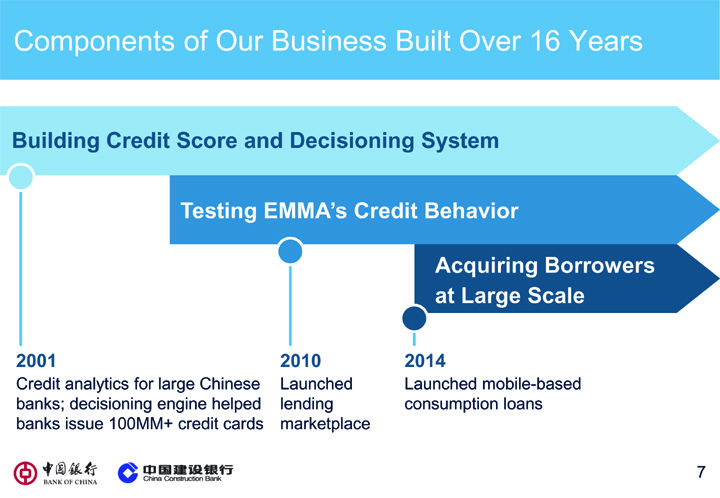
Components of Our Business Built Over 16 Years Building Credit Score and Decisioning System Testing EMMA’s Credit Behavior Acquiring Borrowers at Large Scale 2001 2010 2014 Credit analytics for large Chinese Launched Launched mobile-based banks; decisioning engine helped lending consumption loans banks issue 100MM+ credit cards marketplace 7
Third Quarter 2017 Operating Results 8
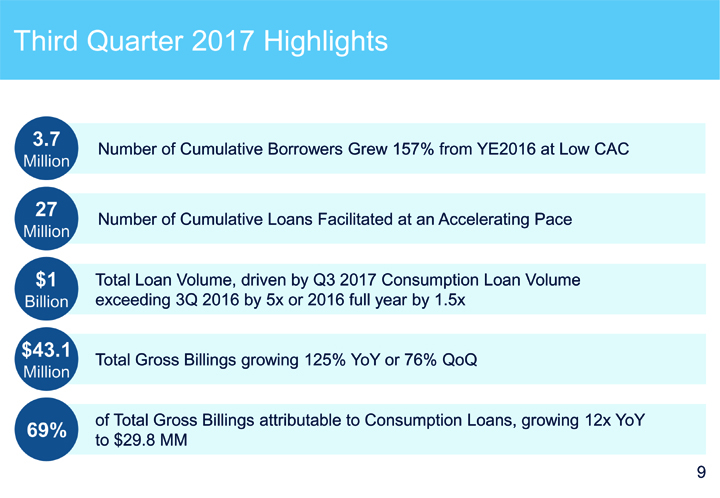
Third Quarter 2017 Highlights 3.7 Number of Cumulative Borrowers Grew 157% from YE2016 at Low CAC Million 27 Number of Cumulative Loans Facilitated at an Accelerating Pace Million $1 Total Loan Volume, driven by Q3 2017 Consumption Loan Volume Billion exceeding 3Q 2016 by 5x or 2016 full year by 1.5x $43.1 Total Gross Billings growing 125% YoY or 76% QoQ Million of Total Gross Billings attributable to Consumption Loans, growing 12x YoY 69% to $29.8 MM 9
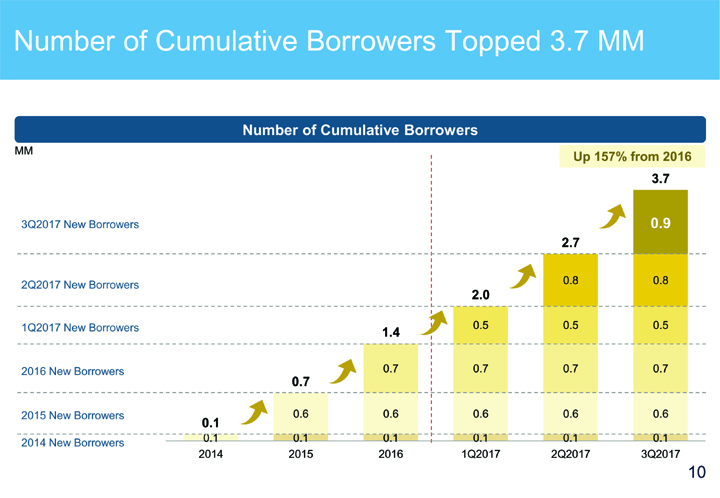
Number of Cumulative Borrowers Topped 3.7 MM Number of Cumulative Borrowers MM Up 157% from 2016 3.7 3Q2017 New Borrowers 0.9 2.7 2Q2017 New Borrowers 0.8 0.8 2.0 1Q2017 New Borrowers 0.5 0.5 0.5 1.4 2016 New Borrowers 0.7 0.7 0.7 0.7 0.7 2015 New Borrowers 0.6 0.6 0.6 0.6 0.6 0.1 0.1 0.1 0.1 0.1 0.1 0.1 2014 New Borrowers 2014 2015 2016 1Q2017 2Q2017 3Q2017 10
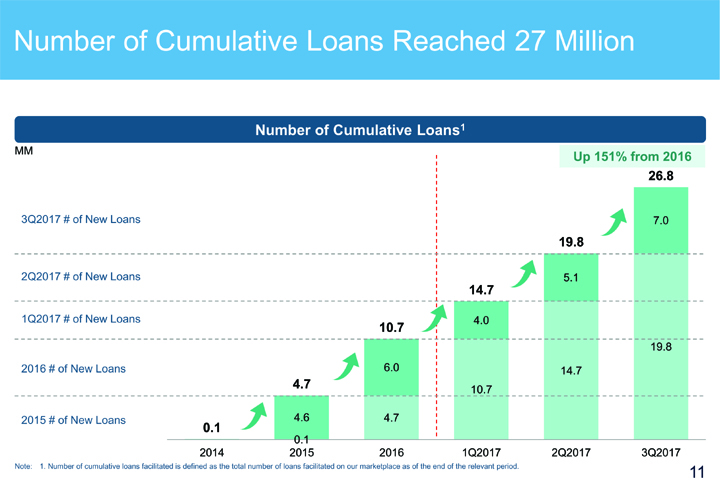
Number of Cumulative Loans Reached 27 Million Number of Cumulative Loans1 MM Up 151% from 2016 26.8 3Q2017 # of New Loans 7.0 19.8 2Q2017 # of New Loans 5.1 14.7 1Q2017 # of New Loans 4.0 10.7 19.8 2016 # of New Loans 6.0 14.7 4.7 10.7 2015 # of New Loans 0.1 4.6 4.7 0.1 2014 2015 2016 1Q2017 2Q2017 3Q2017 Note: 1. Number of cumulative loans facilitated is defined as the total number of loans facilitated on our marketplace as of the end of the relevant period. 11

Third Quarter 2017 Financial Results 12
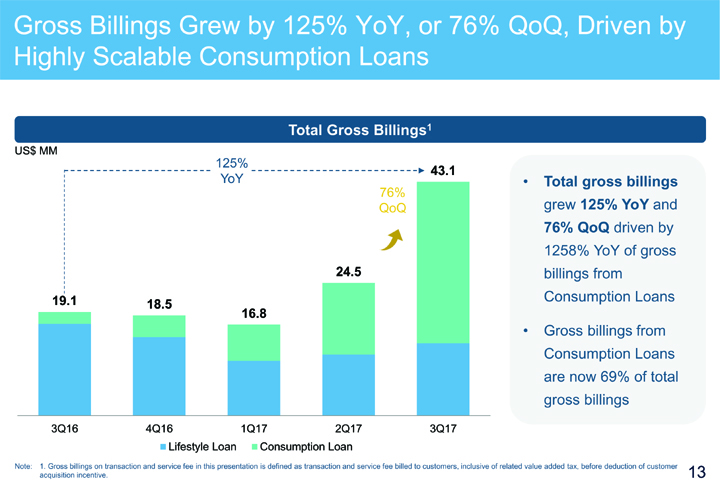
Gross Billings Grew by 125% YoY, or 76% QoQ, Driven by Highly Scalable Consumption Loans Total Gross Billings1 US$ MM 125% 43.1 YoY • Total gross billings 76% grew 125% YoY and QoQ 76% QoQ driven by 1258% YoY of gross 24.5 billings from 19.1 Consumption Loans 18.5 16.8 • Gross billings from Consumption Loans are now 69% of total gross billings 3Q16 4Q16 1Q17 2Q17 3Q17 Lifestyle Loan Consumption Loan Note: 1. Gross billings on transaction and service fee in this presentation is defined as transaction and service fee billed to customers, inclusive of related value added tax, before deduction of customer acquisition incentive. 13
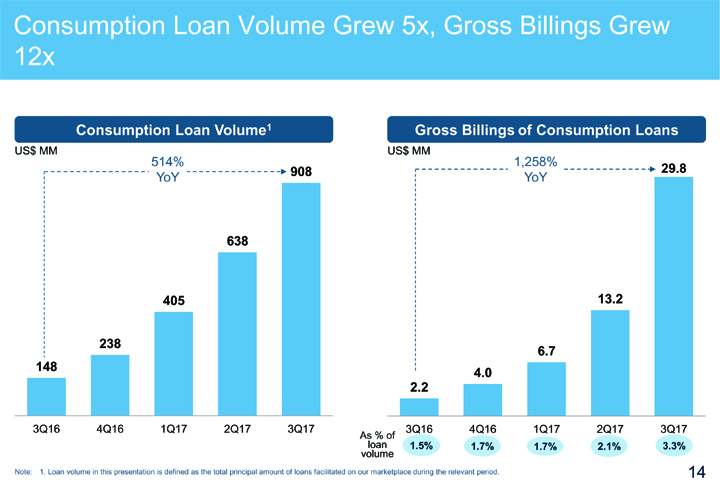
Consumption Loan Volume Grew 5x, Gross Billings Grew 12x Consumption Loan Volume1 Gross Billings of Consumption Loans US$ MM 514% US$ MM 1,258% 908 29.8 YoY YoY 638 405 13.2 238 6.7 148 4.0 2.2 3Q16 4Q16 1Q17 2Q17 3Q17 3Q16 4Q16 1Q17 2Q17 3Q17 As % of loan 1.5% 1.7% 1.7% 2.1% 3.3% volume Note: 1. Loan volume in this presentation is defined as the total principal amount of loans facilitated on our marketplace during the relevant period. 14
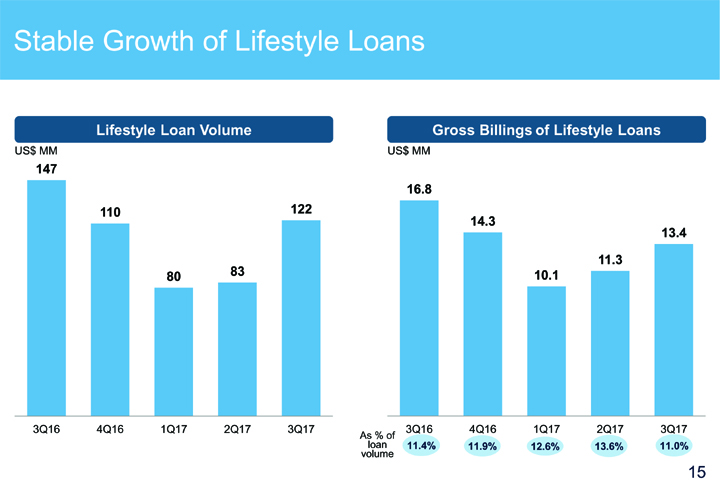
Stable Growth of Lifestyle Loans Lifestyle Loan Volume Gross Billings of Lifestyle Loans US$ MM US$ MM 147 16.8 110 122 14.3 13.4 83 11.3 80 10.1 3Q16 4Q16 1Q17 2Q17 3Q17 3Q16 4Q16 1Q17 2Q17 3Q17 As % of loan 11.4% 11.9% 12.6% 13.6% 11.0% volume 15
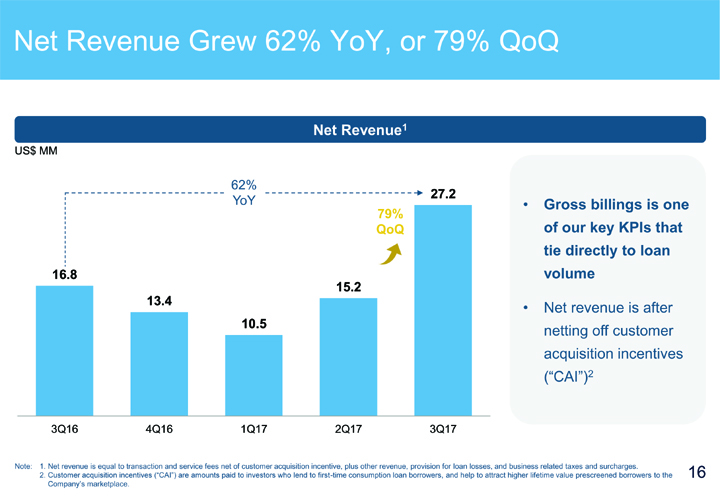
Net Revenue Grew 62% YoY, or 79% QoQ Net Revenue1 US$ MM 62% 27.2 YoY • Gross billings is one 79% QoQ of our key KPIs that tie directly to loan 16.8 volume 15.2 13.4 • Net revenue is after 10.5 netting off customer acquisition incentives (“CAI”)2 3Q16 4Q16 1Q17 2Q17 3Q17 Note: 1. Net revenue is equal to transaction and service fees net of customer acquisition incentive, plus other revenue, provision for loan losses, and business related taxes and surcharges. 2. Customer acquisition incentives (“CAI”) are amounts paid to investors who lend to first-time consumption loan borrowers, and help to attract higher lifetime value prescreened borrowers to the 16 Company‘s marketplace.
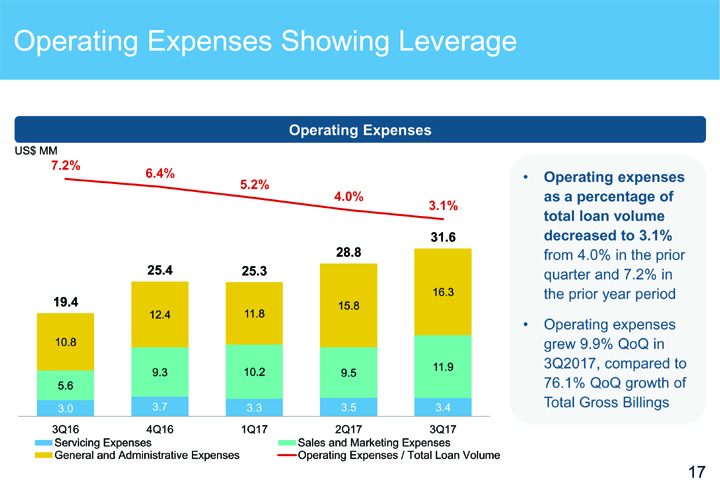
Operating Expenses Showing Leverage Operating Expenses US$ MM 7.2% 6.4% 5.2% • Operating expenses 4.0% as a percentage of 3.1% total loan volume 31.6 decreased to 3.1% 28.8 from 4.0% in the prior 25.4 25.3 quarter and 7.2% in 16.3 the prior year period 19.4 15.8 12.4 11.8 • Operating expenses 10.8 grew 9.9% QoQ in 11.9 3Q2017, compared to 9.3 10.2 9.5 5.6 76.1% QoQ growth of 3.7 3.3 3.5 3.4 Total Gross Billings 3.0 3Q16 4Q16 1Q17 2Q17 3Q17 Servicing Expenses Sales and Marketing Expenses General and Administrative Expenses Operating Expenses / Total Loan Volume 17
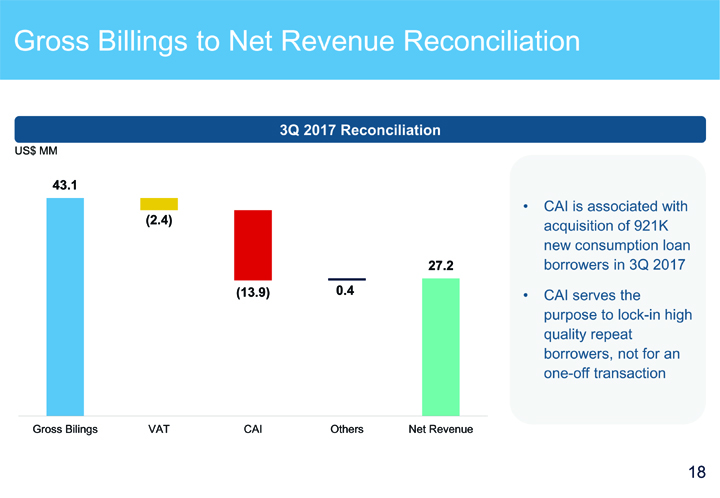
Gross Billings to Net Revenue Reconciliation 3Q 2017 Reconciliation US$ MM 43.1 • CAI is associated with (2.4) acquisition of 921K new consumption loan 27.2 borrowers in 3Q 2017 (13.9) 0.4 • CAI serves the purpose tolock-in high quality repeat borrowers, not for anone-off transaction Gross Bilings VAT CAI Others Net Revenue 18
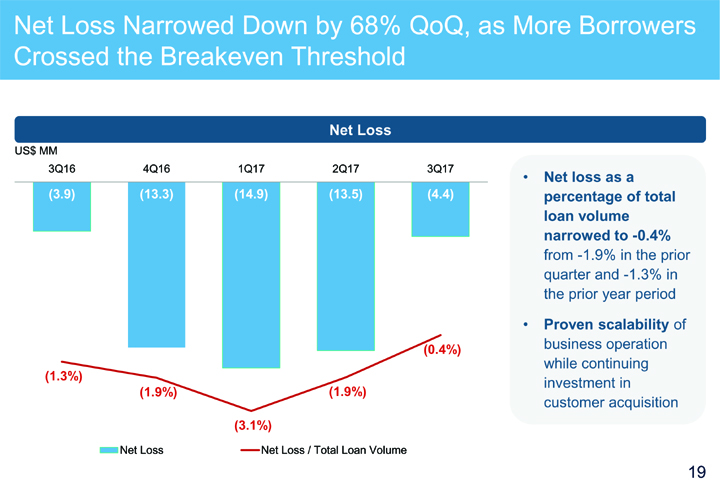
Net Loss Narrowed Down by 68% QoQ, as More Borrowers Crossed the Breakeven Threshold Net Loss US$ MM 3Q16 4Q16 1Q17 2Q17 3Q17 • Net loss as a (3.9) (13.3) (14.9) (13.5) (4.4) percentage of total loan volume narrowed to-0.4% from-1.9% in the prior quarter and-1.3% in the prior year period • Proven scalability of (0.4%) business operation while continuing (1.3%) investment in (1.9%) (1.9%) customer acquisition (3.1%) Net Loss Net Loss / Total Loan Volume 19
Unique Low & Grow Strategy and Business Model 20
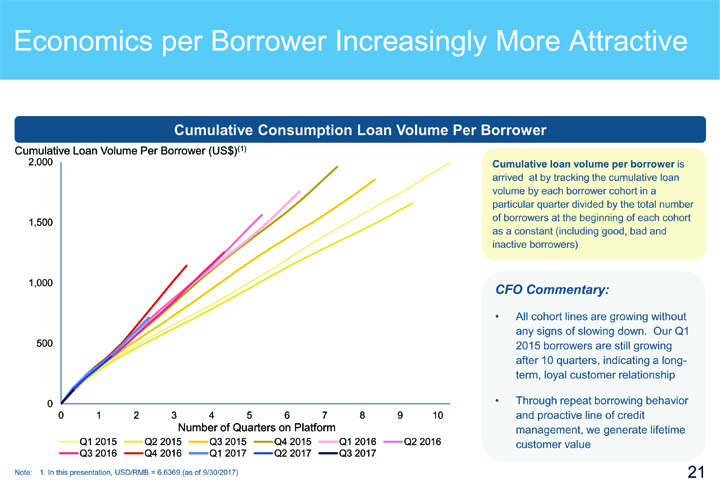
Economics per Borrower Increasingly More Attractive Cumulative Consumption Loan Volume Per Borrower Cumulative Loan Volume Per Borrower (US$)(1) 2,000 Cumulative loan volume per borrower is arrived at by tracking the cumulative loan volume by each borrower cohort in a particular quarter divided by the total number of borrowers at the beginning of each cohort 1,500 as a constant (including good, bad and inactive borrowers) 1,000 CFO Commentary: • All cohort lines are growing without any signs of slowing down. Our Q1 500 2015 borrowers are still growing after 10 quarters, indicating a long-term, loyal customer relationship 0 • Through repeat borrowing behavior 0 1 2 3 4 5 6 7 8 9 10 and proactive line of credit Number of Quarters on Platform management, we generate lifetime Q1 2015 Q2 2015 Q3 2015 Q4 2015 Q1 2016 Q2 2016 customer value Q3 2016 Q4 2016 Q1 2017 Q2 2017 Q3 2017 Note: 1. In this presentation, USD/RMB = 6.6369 (as of 9/30/2017) 21
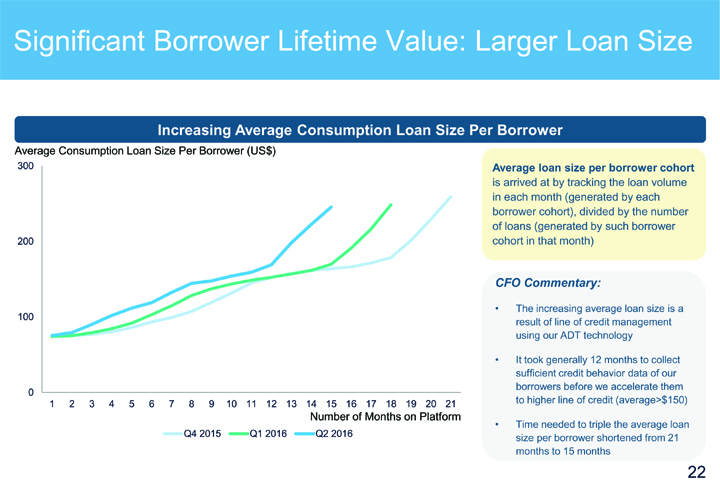
Significant Borrower Lifetime Value: Larger Loan Size Increasing Average Consumption Loan Size Per Borrower Average Consumption Loan Size Per Borrower (US$) 300 Average loan size per borrower cohort is arrived at by tracking the loan volume in each month (generated by each borrower cohort), divided by the number of loans (generated by such borrower 200 cohort in that month) CFO Commentary: 100 • The increasing average loan size is a result of line of credit management using our ADT technology • It took generally 12 months to collect sufficient credit behavior data of our borrowers before we accelerate them 0 1 2 3 4 5 6 7 8 9 10 11 12 13 14 15 16 17 18 19 20 21 to higher line of credit (average>$150) Number of Months on Platform • Time needed to triple the average loan Q4 2015 Q1 2016 Q2 2016 size per borrower shortened from 21 months to 15 months 22
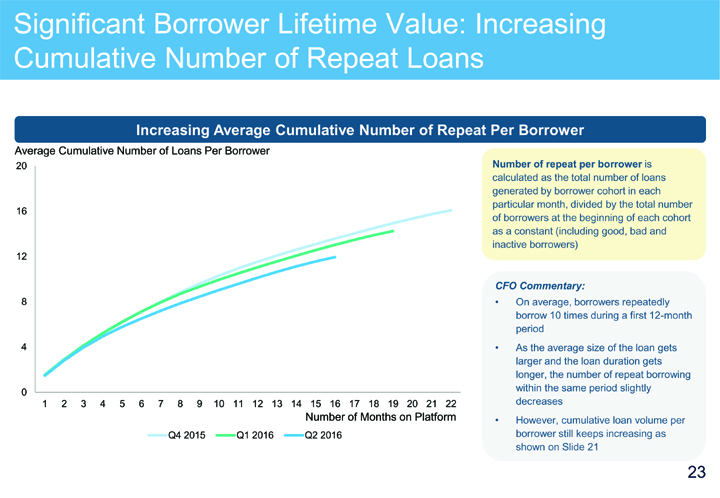
Significant Borrower Lifetime Value: Increasing Cumulative Number of Repeat Loans Increasing Average Cumulative Number of Repeat Per Borrower Average Cumulative Number of Loans Per Borrower 20 Number of repeat per borrower is calculated as the total number of loans generated by borrower cohort in each particular month, divided by the total number 16 of borrowers at the beginning of each cohort as a constant (including good, bad and inactive borrowers) 12 CFO Commentary: 8 • On average, borrowers repeatedly borrow 10 times during a first12-month period 4 • As the average size of the loan gets larger and the loan duration gets longer, the number of repeat borrowing 0 within the same period slightly 1 2 3 4 5 6 7 8 9 10 11 12 13 14 15 16 17 18 19 20 21 22 decreases Number of Months on Platform • However, cumulative loan volume per Q4 2015 Q1 2016 Q2 2016 borrower still keeps increasing as shown on Slide 21 23
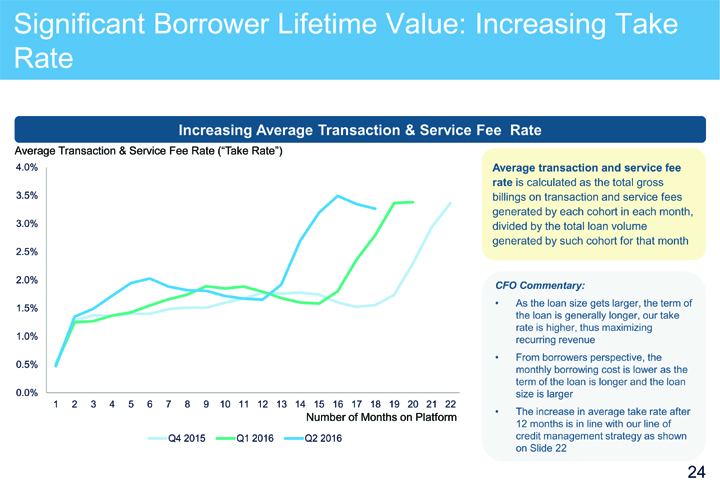
Significant Borrower Lifetime Value: Increasing Take Rate Increasing Average Transaction & Service Fee Rate Average Transaction & Service Fee Rate (“Take Rate”) 4.0% Average transaction and service fee rate is calculated as the total gross 3.5% billings on transaction and service fees generated by each cohort in each month, 3.0% divided by the total loan volume generated by such cohort for that month 2.5% 2.0% CFO Commentary: • As the loan size gets larger, the term of 1.5% the loan is generally longer, our take 1.0% rate is higher, thus maximizing recurring revenue • From borrowers perspective, the 0.5% monthly borrowing cost is lower as the term of the loan is longer and the loan 0.0% size is larger 1 2 3 4 5 6 7 8 9 10 11 12 13 14 15 16 17 18 19 20 21 22 • The increase in average take rate after Number of Months on Platform 12 months is in line with our line of Q4 2015 Q1 2016 Q2 2016 credit management strategy as shown on Slide 22 24
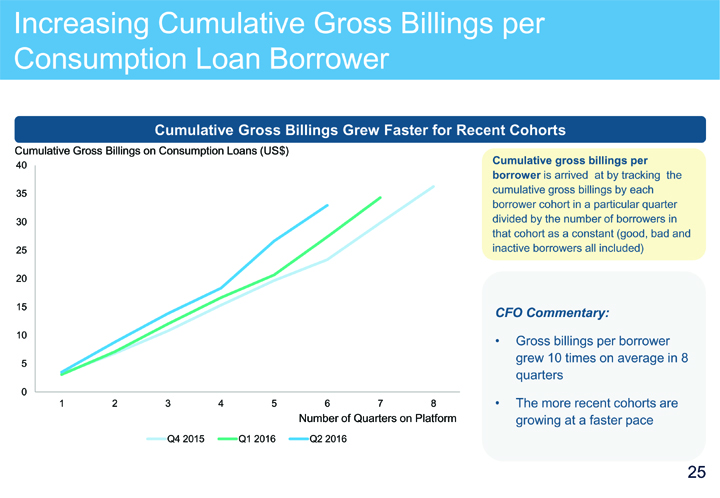
Increasing Cumulative Gross Billings per Consumption Loan Borrower Cumulative Gross Billings Grew Faster for Recent Cohorts Cumulative Gross Billings on Consumption Loans (US$) Cumulative gross billings per 40 borrower is arrived at by tracking the 35 cumulative gross billings by each borrower cohort in a particular quarter 30 divided by the number of borrowers in that cohort as a constant (good, bad and 25 inactive borrowers all included) 20 15 CFO Commentary: 10 • Gross billings per borrower grew 10 times on average in 8 5 quarters 0 1 2 3 4 5 6 7 8 • The more recent cohorts are Number of Quarters on Platform growing at a faster pace Q4 2015 Q1 2016 Q2 2016 25
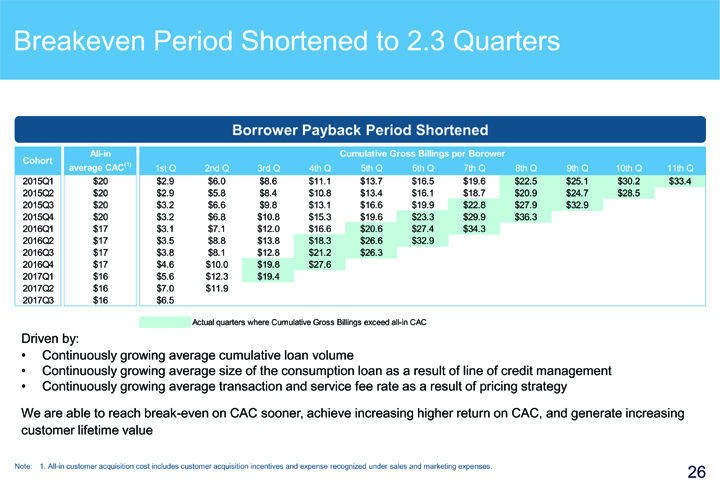
Breakeven Period Shortened to 2.3 Quarters Borrower Payback Period ShortenedAll-in Cumulative Gross Billings per Borower Cohort average CAC(1) 1st Q 2nd Q 3rd Q 4th Q 5th Q 6th Q 7th Q 8th Q 9th Q 10th Q 11th Q 2015Q1 $20 $2.9 $6.0 $8.6 $11.1 $13.7 $16.5 $19.6 $22.5 $25.1 $30.2 $33.4 2015Q2 $20 $2.9 $5.8 $8.4 $10.8 $13.4 $16.1 $18.7 $20.9 $24.7 $28.5 2015Q3 $20 $3.2 $6.6 $9.8 $13.1 $16.6 $19.9 $22.8 $27.9 $32.9 2015Q4 $20 $3.2 $6.8 $10.8 $15.3 $19.6 $23.3 $29.9 $36.3 2016Q1 $17 $3.1 $7.1 $12.0 $16.6 $20.6 $27.4 $34.3 2016Q2 $17 $3.5 $8.8 $13.8 $18.3 $26.6 $32.9 2016Q3 $17 $3.8 $8.1 $12.8 $21.2 $26.3 2016Q4 $17 $4.6 $10.0 $19.8 $27.6 2017Q1 $16 $5.6 $12.3 $19.4 2017Q2 $16 $7.0 $11.9 2017Q3 $16 $6.5 Actual quarters where Cumulative Gross Billings exceedall-in CAC Driven by: • Continuously growing average cumulative loan volume • Continuously growing average size of the consumption loan as a result of line of credit management • Continuously growing average transaction and service fee rate as a result of pricing strategy We are able to reach break-even on CAC sooner, achieve increasing higher return on CAC, and generate increasing customer lifetime value Note: 1.All-in customer acquisition cost includes customer acquisition incentives and expense recognized under sales and marketing expenses. 26
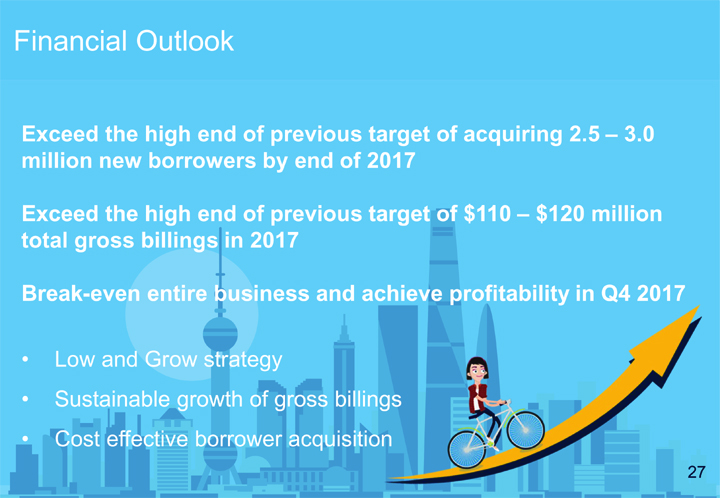
Financial Outlook Exceed the high end of previous target of acquiring 2.5 – 3.0 million new borrowers by end of 2017 Exceed the high end of previous target of $110 – $120 million total gross billings in 2017 Break-even entire business and achieve profitability in Q4 2017 • Low and Grow strategy • Sustainable growth of gross billings • Cost effective borrower acquisition 27
Appendix 28
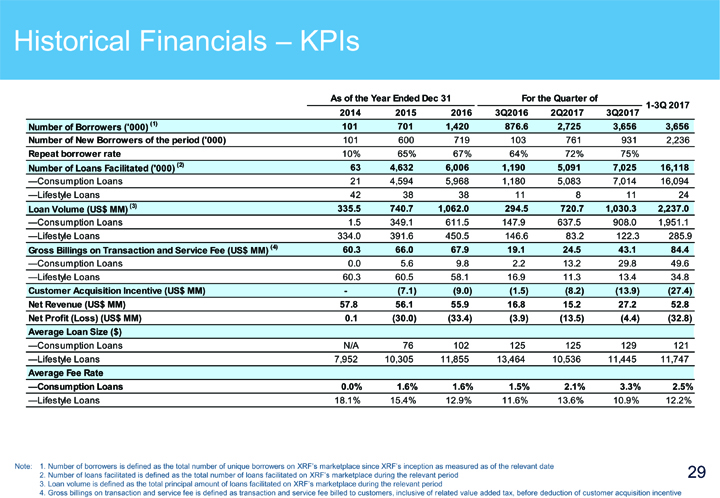
Historical Financials – KPIs As of the Year Ended Dec 31 For the Quarter of 2014 2015 2016 3Q2016 2Q2017 3Q20171-3Q 2017 Number of Borrowers (‘000) (1) 101 701 1,420 876.6 2,725 3,656 3,656 Number of New Borrowers of the period (‘000) 101 600 719 103 761 931 2,236 Repeat borrower rate 10% 65% 67% 64% 72% 75% Number of Loans Facilitated (‘000) (2) 63 4,632 6,006 1,190 5,091 7,025 16,118 —Consumption Loans 21 4,594 5,968 1,180 5,083 7,014 16,094 —Lifestyle Loans 42 38 38 11 8 11 24 Loan Volume (US$ MM) (3) 335.5 740.7 1,062.0 294.5 720.7 1,030.3 2,237.0 —Consumption Loans 1.5 349.1 611.5 147.9 637.5 908.0 1,951.1 —Lifestyle Loans 334.0 391.6 450.5 146.6 83.2 122.3 285.9 Gross Billings on Transaction and Service Fee (US$ MM) (4) 60.3 66.0 67.9 19.1 24.5 43.1 84.4 —Consumption Loans 0.0 5.6 9.8 2.2 13.2 29.8 49.6 —Lifestyle Loans 60.3 60.5 58.1 16.9 11.3 13.4 34.8 Customer Acquisition Incentive (US$ MM)—(7.1) (9.0) (1.5) (8.2) (13.9) (27.4) Net Revenue (US$ MM) 57.8 56.1 55.9 16.8 15.2 27.2 52.8 Net Profit (Loss) (US$ MM) 0.1 (30.0) (33.4) (3.9) (13.5) (4.4) (32.8) Average Loan Size ($) —Consumption Loans N/A 76 102 125 125 129 121 —Lifestyle Loans 7,952 10,305 11,855 13,464 10,536 11,445 11,747 Average Fee Rate —Consumption Loans 0.0% 1.6% 1.6% 1.5% 2.1% 3.3% 2.5% —Lifestyle Loans 18.1% 15.4% 12.9% 11.6% 13.6% 10.9% 12.2% Note: 1. Number of borrowers is defined as the total number of unique borrowers on XRF‘s marketplace since XRF‘s inception as measured as of the relevant date 2. Number of loans facilitated is defined as the total number of loans facilitated on XRF‘s marketplace during the relevant period 29 3. Loan volume is defined as the total principal amount of loans facilitated on XRF‘s marketplace during the relevant period 4. Gross billings on transaction and service fee is defined as transaction and service fee billed to customers, inclusive of related value added tax, before deduction of customer acquisition incentive

Historical Financials – Income Statement For the Three Months Ended For the Nine Months Ended September 30, June 30, September 30, September 30, September 30, (US$000) 2016 2017 2017 2016 2017 Revenue: 16,795 15,153 27,218 44,616 52,826 Transaction and service fees (net of customer acquisition incentive) 16,441 14,691 26,818 43,605 51,925 Other revenue 354 462 400 1,011 901 Provision for loan losses (1) 10 (2) (12) 9 Business related taxes and surcharges 2 (1) (32) (765) (38) Net Revenue 16,796 15,162 27,184 43,839 52,797 Total operating expenses (21,094) (28,801) (31,638) (63,794) (85,720) Servicing expenses (3,142) (3,476) (3,437) (10,178) (10,227) Sales and marketing expenses (6,673) (9,522) (11,863) (20,668) (31,601) General and administrative expenses (11,279) (15,803) (16,338) (32,948) (43,892) Other income (expense), net 360 149 135 (146) 261 Loss before income tax expense (3,938) (13,490) (4,319) (20,101) (32,662) Income tax expense—(28) (41)—(69) Net loss (3,938) (13,518) (4,360) (20,101) (32,731) Accretion on Series A convertible redeemable preferred shares to redemption value (72) (24)—(216) (96) Accretion on Series B convertible redeemable preferred shares to redemption value (406) (135)—(1,216) (540) Accretion on Series C convertible redeemable preferred shares to redemption value (1,201) (653)—(3,024) (2,232) Deemed dividend to series C shareholder from its modification (635) (82,034) (635) (82,034) Net loss attributable to ordinary shareholders (6,252) (96,364) (4,360) (25,192) (117,633) Weighted average number of ordinary shares used in computing net loss per share Basic 16,415,391 50,013,189 64,696,840 16,415,391 44,008,941 Diluted 16,415,391 50,013,189 64,696,840 16,415,391 44,008,941 Loss per share attributable to ordinary shareholders Basic (0.38) (1.93) (0.07) (1.53) (2.67) Diluted (0.38) (1.93) (0.07) (1.53) (2.67) 30
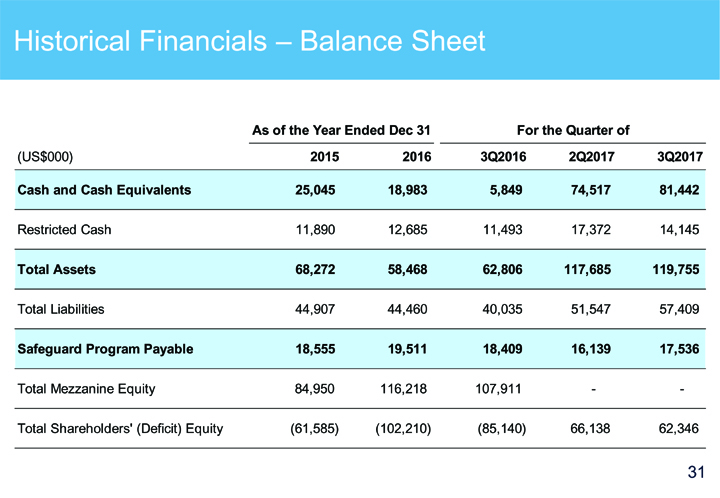
Historical Financials – Balance Sheet As of the Year Ended Dec 31 For the Quarter of (US$000) 2015 2016 3Q2016 2Q2017 3Q2017 Cash and Cash Equivalents 25,045 18,983 5,849 74,517 81,442 Restricted Cash 11,890 12,685 11,493 17,372 14,145 Total Assets 68,272 58,468 62,806 117,685 119,755 Total Liabilities 44,907 44,460 40,035 51,547 57,409 Safeguard Program Payable 18,555 19,511 18,409 16,139 17,536 Total Mezzanine Equity 84,950 116,218 107,911 — Total Shareholders’ (Deficit) Equity (61,585) (102,210) (85,140) 66,138 62,346 31

China Rapid Finance