Exhibit 99.1
Exhibit 99.1
$350mm Senior Notes Offering April 2012
1
|
|
This presentation contains “forward-looking statements” within the meaning of Section 27A of the Securities Act of 1933, as amended, and Section 21E of the Securities Exchange Act of 1934, as amended. These forward-looking statements are subject to certain risks, trends and uncertainties that could cause actual results to differ materially from those projected. Among those risks, trends and uncertainties are our ability to find oil and natural gas reserves that are economically recoverable, the volatility of oil and natural gas prices and significantly depressed natural gas prices since the middle of 2008, the uncertain economic conditions in the United States and globally, the decline in the values of our properties that have resulted in and may in the future result in additional ceiling test write-downs, our ability to replace reserves and sustain production, our estimate of the sufficiency of our existing capital sources, our ability to raise additional capital to fund cash requirements for future operations, the uncertainties involved in prospect development and property acquisitions or dispositions and in projecting future rates of production or future reserves, the timing of development expenditures and drilling of wells, hurricanes and other natural disasters, including the impact of the oil spill in the Gulf of Mexico on our present and future operations, the impact of government regulation, and the operating hazards attendant to the oil and natural gas business. In particular, careful consideration should be given to cautionary statements made in the various reports we have filed with the Securities and Exchange Commission. We undertake no duty to update or revise these forward-looking statements.
2
Presenters
Mark Fischer Chief Executive Officer
& President
Joe Evans Chief Financial Officer
& Executive Vice President
3
Investment Highlights
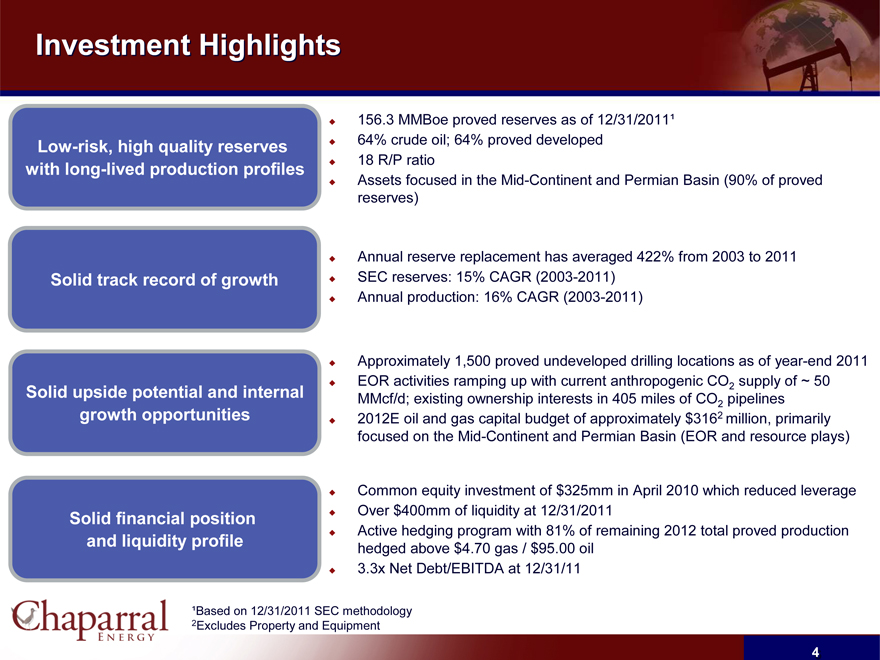
Low-risk, high quality reserves with long-lived production profiles
156.3 MMBoe proved reserves as of 12/31/2011¹ 64% crude oil; 64% proved developed
18 R/P ratio
Assets focused in the Mid-Continent and Permian Basin (90% of proved reserves)
Solid track record of growth
Annual reserve replacement has averaged 422% from 2003 to 2011 SEC reserves: 15% CAGR (2003-2011) Annual production: 16% CAGR (2003-2011)
Solid upside potential and internal growth opportunities
Approximately 1,500 proved undeveloped drilling locations as of year-end 2011 EOR activities ramping up with current anthropogenic CO2 supply of ~ 50
MMcf/d; existing ownership interests in 405 miles of CO2 pipelines
2012E oil and gas capital budget of approximately $3162 million, primarily focused on the Mid-Continent and Permian Basin (EOR and resource plays)
Solid financial position and liquidity profile
Common equity investment of $325mm in April 2010 which reduced leverage Over $400mm of liquidity at 12/31/2011 Active hedging program with 81% of remaining 2012 total proved production hedged above $4.70 gas / $95.00 oil 3.3x Net Debt/EBITDA at 12/31/11
¹Based on 12/31/2011 SEC methodology 2Excludes Property and Equipment
4
Chaparral Overview
Founded in 1988, Based in Oklahoma City
Core areas — Mid-Continent (Oklahoma) and Permian Basin (West Texas)
Oil-weighted producer (64% oil; 36% gas); R/P ratio 18 years
Third largest oil producer in Oklahoma
Stable 1P base with large 2P and 3P upside
Near-term growth potential through drilling in conventional & emerging plays
Long-term growth through CO EOR
2
Company Statistics
2011 Production (Boe/d) ~23,700
YE 2011 Proved Reserves (MMBoe)1 156.3
YE 2011 Proved Reserves PV-10 ($ in mm)1 $2,309
2011 EBITDA ($ in mm) $313
¹Based on 12/31/2011 SEC methodology
5
Operating Areas
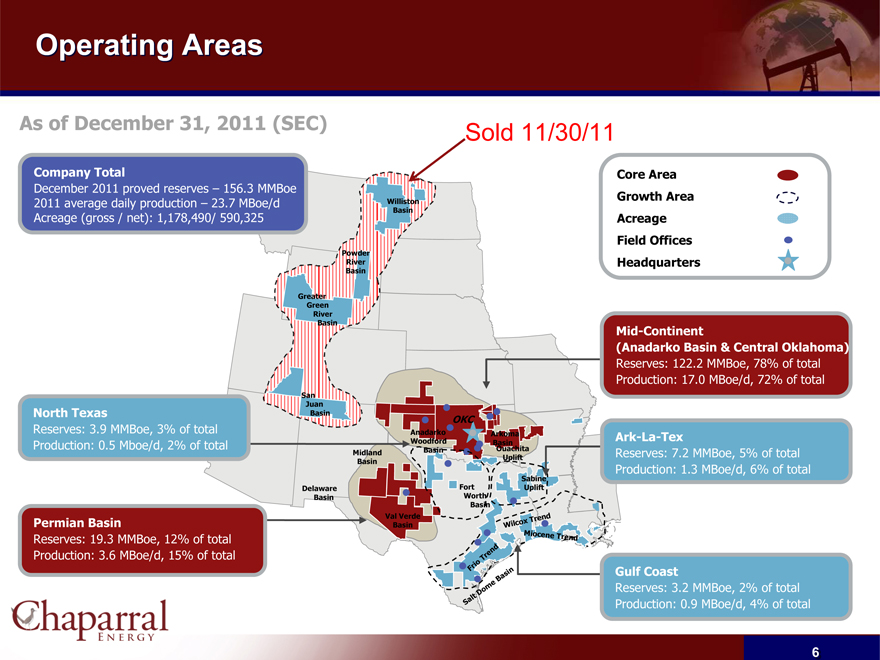
As of December 31, 2011 (SEC)
Company Total
December 2011 proved reserves – 156.3 MMBoe 2011 average daily production – 23.7 MBoe/d Acreage (gross / net): 1,178,490/590,325
North Texas
Reserves: 3.9 MMBoe, 3% of total Production: 0.5 Mboe/d, 2% of total
Permian Basin
Reserves 19.3 MMBoe, 12% of total Production: 3.6 MBoe/d, 15% of total
Sold 11/30/11
Williston Basin
Powder River Basin
Greater Green River Basin
San Juan Basin
Midland Basin
Anadarko Woodford Basin OKC
Delaware Basin
Fort Worth Basin
Sabine, Uplift
Frio Trend
Miocene Trend
Arkoma Basin
Ouachita Uplift
Val Verde Basin
Salt Dome Basin
Wilcox Trend
Core Area
Growth Area
Acreage
Field Offices
Headquarters Mid-Continent
(Anadarko Basin & Central Oklahoma)
Reserves: 122.2 MMBoe, 78% of total Production: 17.0 MBoe/d, 72% of total
Ark-La-Tex
Reserves: 7.2 MMBoe, 5% of total Production: 1.3 MBoe/d, 6% of total
Gulf Coast
Reserves: 3.2 MMBoe, 2% of total Production: 0.9 MBoe/d, 4% of total
6
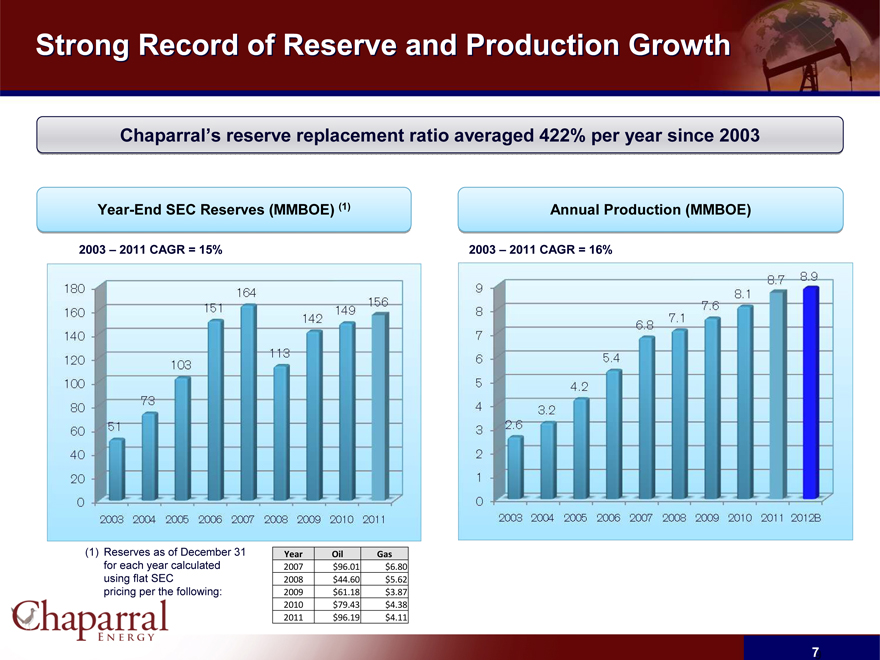
Strong Record of Reserve and Production Growth
Chaparral’s reserve replacement ratio averaged 422% per year since 2003
Year-End SEC Reserves (MMBOE) (1)
2003 – 2011 CAGR = 15%
180 160 140 120 100 80 60 40 20 0
51 73 103 151 164 113 142 149 156
2003 2004 2005 2006 2007 2008 2009 2010 2011
Annual Production (MMBOE)
2003 – 2011 CAGR = 16%
9 8 7 6 5 4 3 2 1 0
2.6 3.2 4.2 5.4 6.8 7.1 7.6 8.1 8.7 8.9
2003 2004 2005 2006 2007 2008 2010 2011 2012B
(1) Reserves as of December 31 for each year calculated using flat SEC pricing per the following:
Year Oil Gas
2007 $96.01 $6.80
2008 $44.60 $5.62
2009 $61.18 $3.87
2010 $79.43 $4.38
2011 $96.19 $4.11
7
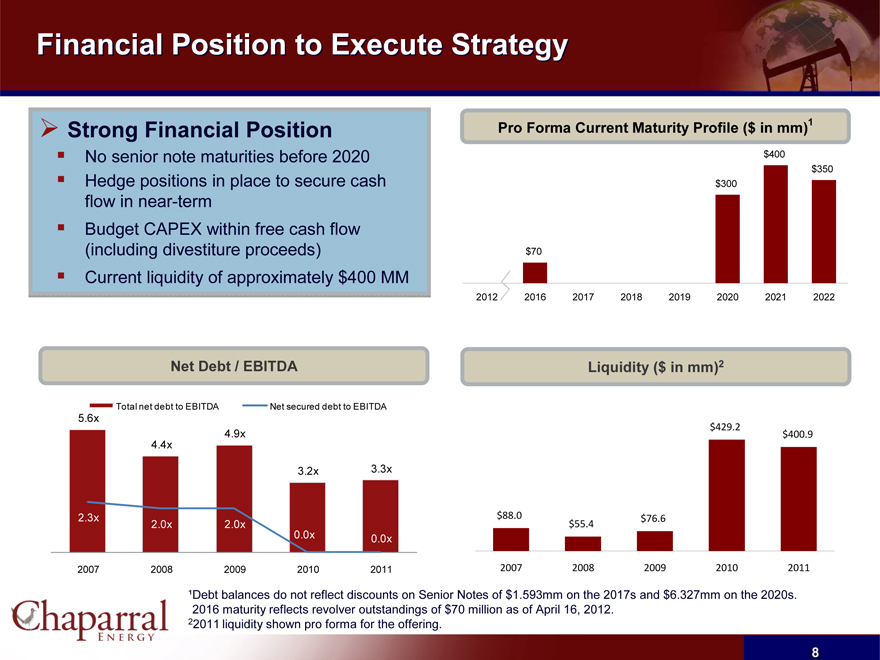
Financial Position to Execute Strategy
Strong Financial Position
No senior note maturities before 2020 Hedge positions in place to secure cash flow in near-term Budget CAPEX within free cash flow (including divestiture proceeds) Current liquidity of approximately $400 MM
Net Debt / EBITDA
Total net debt to EBITDA
Net secured debt to EBITDA
5.6x
2.3x
2007
4.4x
2.0x
2008
4.9x
2.0x
2009
3.2x
0.0x 2010
3.3x
0.0x 2011
1
Pro Forma Current Maturity Profile ($ in mm)
2012 2016 2017 2018 2019 2020 2021 2022
$70
$300
$400
$350
Liquidity ($ in mm)2
2007 2008 2009 2010 2011
$88.0 $55.4 $76.6 $429.2 $400.9
¹Debt balances do not reflect discounts on Senior Notes of $1.593mm on the 2017s and $6.327mm on the 2020s. 2016 maturity reflects revolver outstandings of $70 million as of April 16, 2012.
22011 liquidity shown pro forma for the offering.
8
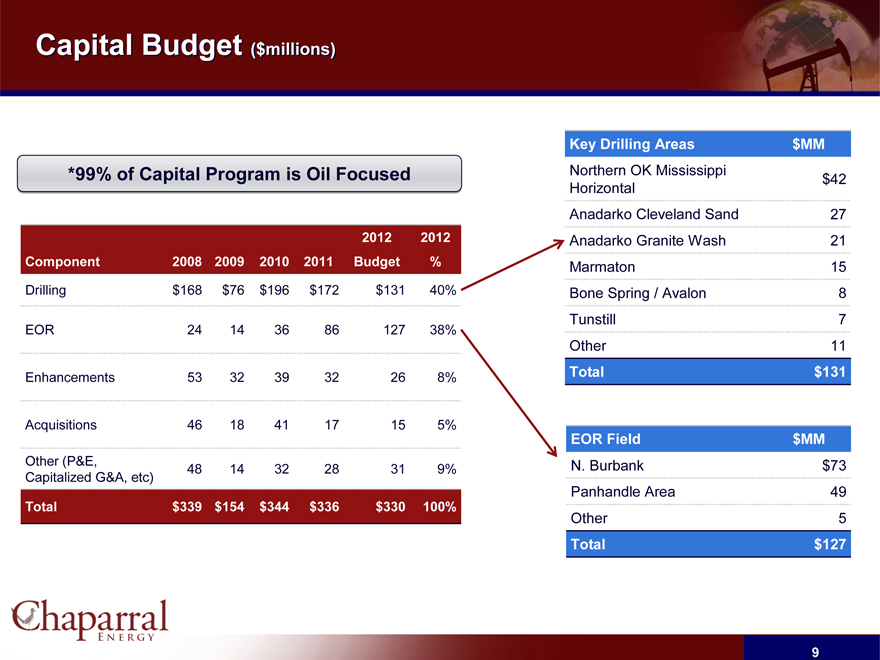
Capital Budget ($millions)
*99% of Capital Program is Oil Focused
2012 2012
Component 2008 2009 2010 2011 Budget%
Drilling $168 $76 $196 $172 $131 40%
EOR 24 14 36 86 127 38%
Enhancements 53 32 39 32 26 8%
Acquisitions 46 18 41 17 15 5%
Other (P&E,
48 14 32 28 31 9%
Capitalized G&A, etc)
Total $339 $154 $344 $336 $330 100%
Key Drilling Areas $MM
Northern OK Mississippi
$42
Horizontal
Anadarko Cleveland Sand 27
Anadarko Granite Wash 21
Marmaton 15
Bone Spring / Avalon 8
Tunstill 7
Other 11
Total $131
EOR Field $MM
N. Burbank $73
Panhandle Area 49
Other 5
Total $127
9
Resource Potential
10
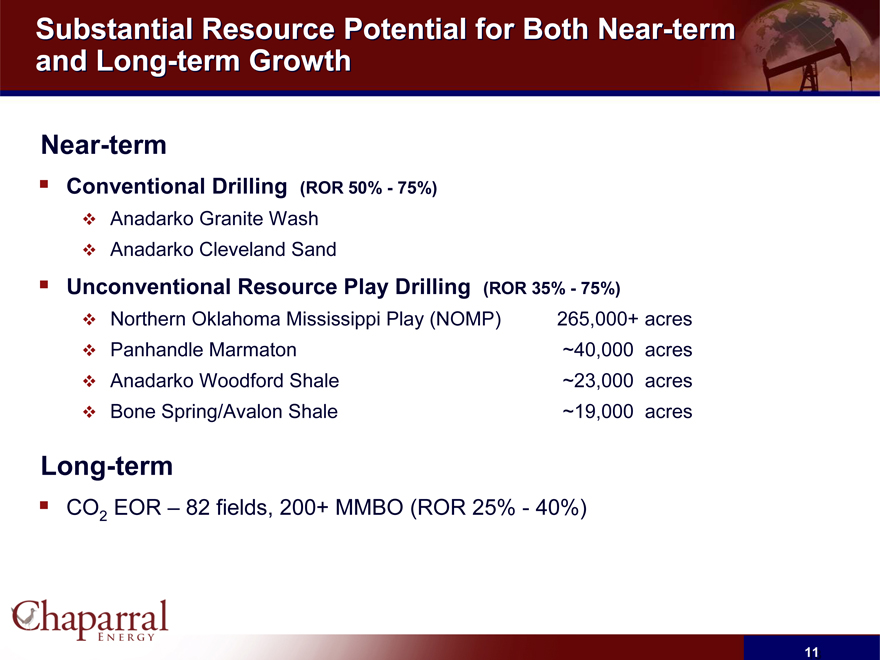
Substantial Resource Potential for Both Near-term and Long-term Growth
Near-term
Conventional Drilling (ROR 50%—75%)
Anadarko Granite Wash Anadarko Cleveland Sand
Unconventional Resource Play Drilling (ROR 35%—75%)
Northern Oklahoma Mississippi Play (NOMP) 265,000+ acres
Panhandle Marmaton ~40,000 acres
Anadarko Woodford Shale ~23,000 acres
Bone Spring/Avalon Shale ~19,000 acres
Long-term
CO2 EOR – 82 fields, 200+ MMBO (ROR 25%—40%)
11
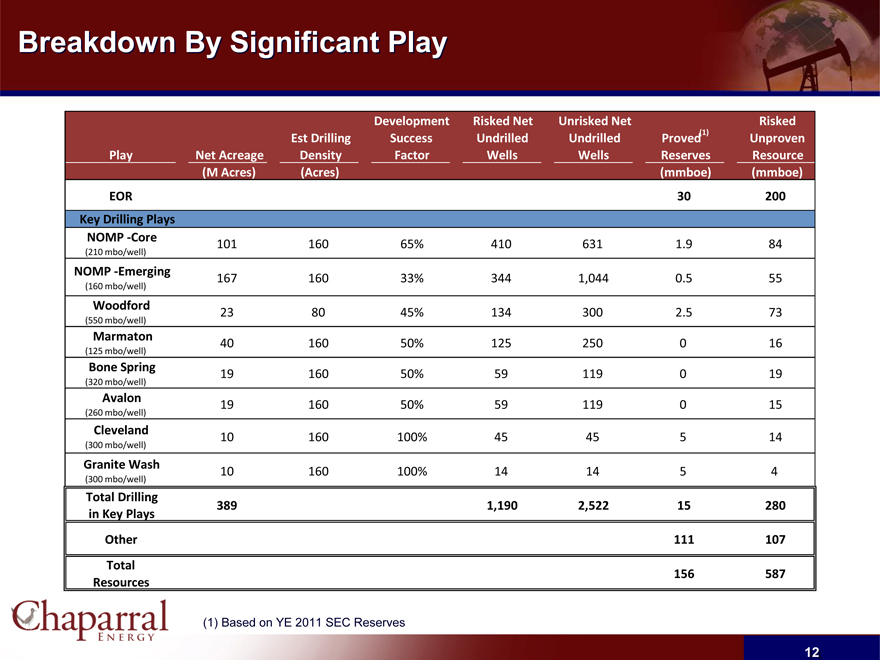
Breakdown By Significant Play
Play Net Acreage Est Drilling Density Development
Success factor
Risked Net Undrilled Wells Unrisked Net Undrilled Wells Proved(1) Reserves Risked Unproven Resource
(M Acres)(Acres)(mmboe)(mmboe)
EOR 30 200
Key Drilling Plays
NOMP -Core
(210 mbo/well) 101 160 65% 410 631 1.9 84
NOMP -Emerging
(160 mbo/well) 167 160 33% 344 1,044 0.5 55
Woodford
(550 mbo/well) 23 80 45% 134 300 2.5 73
Marmaton
(125 mbo/well) 40 160 50% 125 250 0 16
Bone Spring
(320 mbo/well) 19 160 50% 59 119 0 19
Avalon
(260 mbo/well) 19 160 50% 59 119 0 15
Cleveland
(300 mbo/well) 10 160 100% 45 45 5 14
Granite Wash
(300 mbo/well) 10 160 100% 14 14 5 4
Total Drilling in Key Plays 389 1,190 2,522 15 280
Other 111 107
Total Resources 156 587
(1) Based on YE 2011 SEC Reserves
12
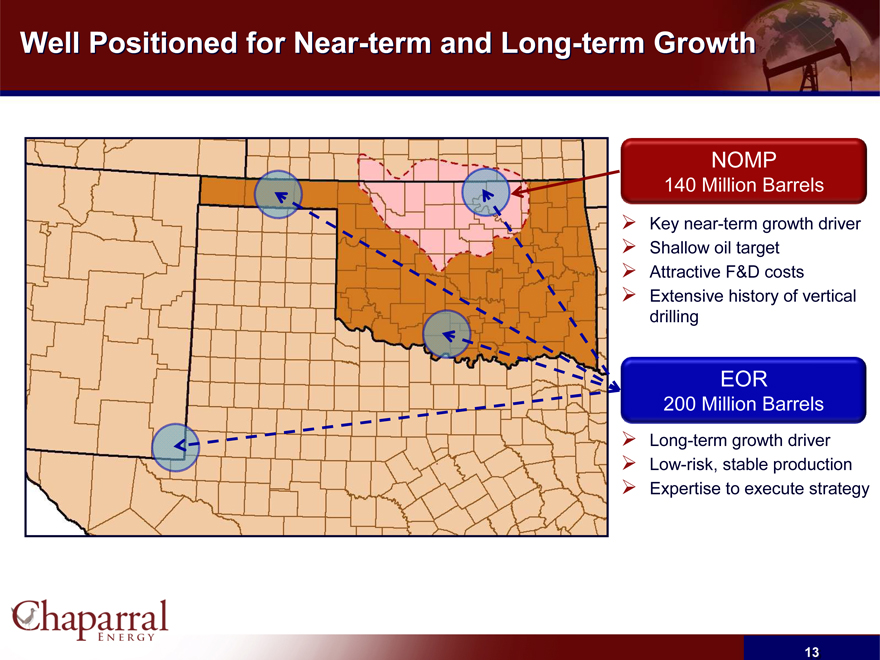
Well Positioned for Near-term and Long-term Growth
NOMP
140 Million Barrels
Key near-term growth driver Shallow oil target Attractive F&D costs Extensive history of vertical drilling
EOR
200 Million Barrels
Long-term growth driver Low-risk, stable production Expertise to execute strategy
13
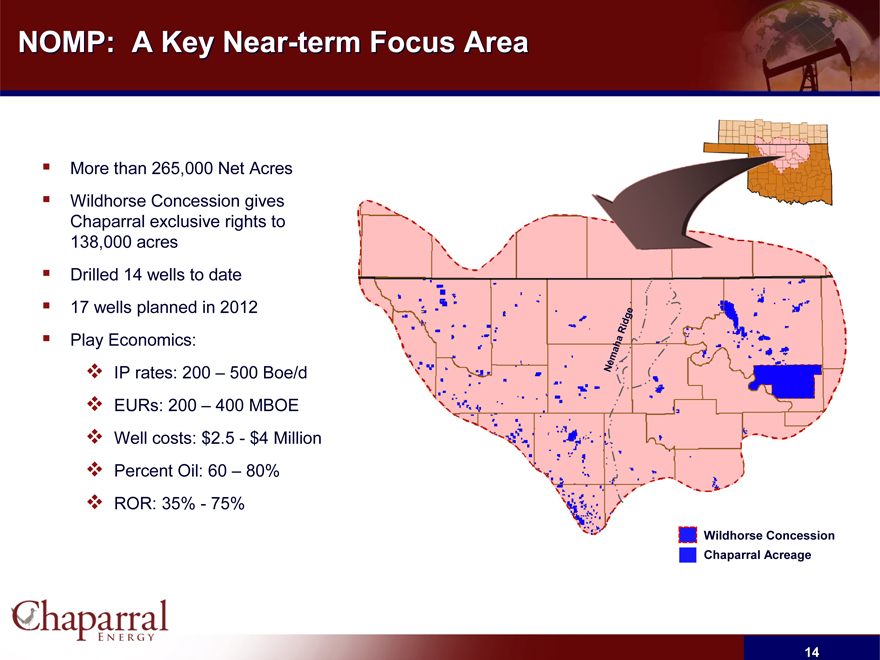
NOMP: A Key Near-term Focus Area
More than 265,000 Net Acres
Wildhorse Concession gives Chaparral exclusive rights to 138,000 acres
Drilled 14 wells to date 17 wells planned in 2012 Play Economics:
IP rates: 200 – 500 Boe/d EURs: 200 – 400 MBOE Well costs: $2.5—$4 Million Percent Oil: 60 – 80% ROR: 35%—75%
Nemaha Ridge
Wildhorse Concession Chaparral Acreage
14
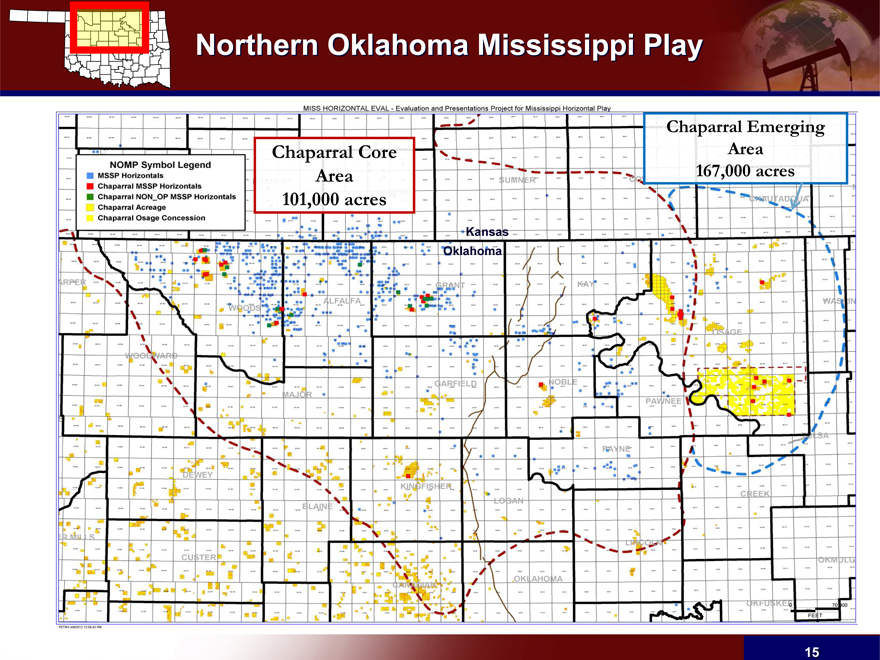
Northern Oklahoma Mississippi Play
MISS HORIZONTAL EVAL - Evaluation and Presentation Project for Mississippi Horizontal Play
NOMP Symbol Legend
MSSP Horizontals
Chaparral MSSP Horizontals
Chaparral NON_OP MSSP Horizontals
Chaparral Acreage
Chaparral Osage Concession
Chaparral Core Area 101,000 acres
Chaparral Emerging Area 167,000 acres
Kansas Oklahoma
15
Other Developing Drilling Plays
16
Bone Spring / Avalon
Chaparral Energy, LLC
Avalon Shale Position
19,000 Net Acres in West and Central Loving County, TX Upper and Lower Avalon Production Surrounding Acreage Block Over 80 Potential Avalon Drill Sites
Oil & NGL Rich Play High Initial Production Prime Acreage Position Large Development Opportunity Average Well Depth : 12,000 –12,250 Ft. (MD)
IP: 508 boe/d
Cum: 126,250 boe in 11 Mo’s
Avg. 377 boe/d past 11 Mo’s
Chaparral Energy, LLC TXL 17 #1H (Avalon Horiz) IP 450 Boe/d
Chaparral Energy, LLC TXL 29 #6H
Flowing back after frac
IP: 830 boe/d
No Avail. Prod. Data
IP: 425 boe/d
Cum: 96,440 BOE in 9 Mo’s
Avg. 411 boe/d past 9 Mo’s
IP: 572 boe/d
Cum: 67,872 boe in 7 Mo’s
Avg. 324 boe/d past 7 Mo’s
IP: 195 boe/d
Cum: 151,511 BOE in 15 Mo’s
Avg. 348 boe/d past 15 Mo’s
Well Legend
Brushy Canyon Horizontal
Avalon Shale Horizontal
Bone Spring Sand Horizontal
17
Marmaton Shelf Play
Johnston 1H-24 Completing
Leatherman 1H-14 2012 Location
Lamaster 1H-23 2012 Location
Chaparral Acreage
Marmaton Production
Net Acreage 40,000
EUR/well (MBoe) 150
Cost per Well ($MM) $3.6
Jay 1H-1098 2012 Location
Wright 1H-1099 2012 Location
18
Chaparral: A Growing Mid-Continent CO EOR Company
2
19
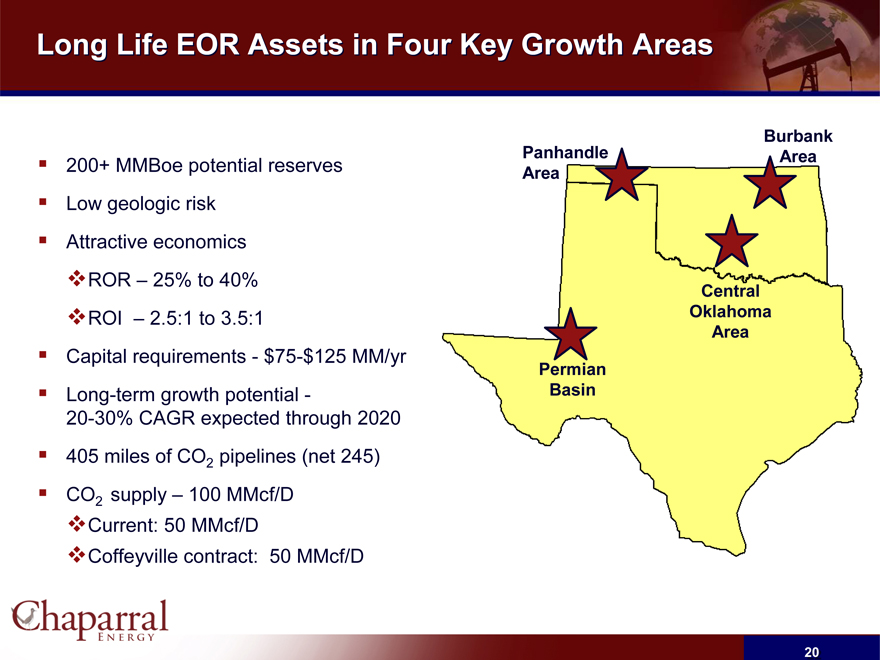
Long Life EOR Assets in Four Key Growth Areas
200+ MMBoe potential reserves Low geologic risk Attractive economics
ROR – 25% to 40%
ROI – 2.5:1 to 3.5:1
Capital requirements—$75-$125 MM/yr
Long-term growth potential -
20-30% CAGR expected through 2020
405 miles of CO2 pipelines (net 245) CO2 supply – 100 MMcf/D
Current: 50 MMcf/D
Coffeyville contract: 50 MMcf/D
Panhandle Area
Burbank Area
Central Oklahoma Area
Permian Basin
20
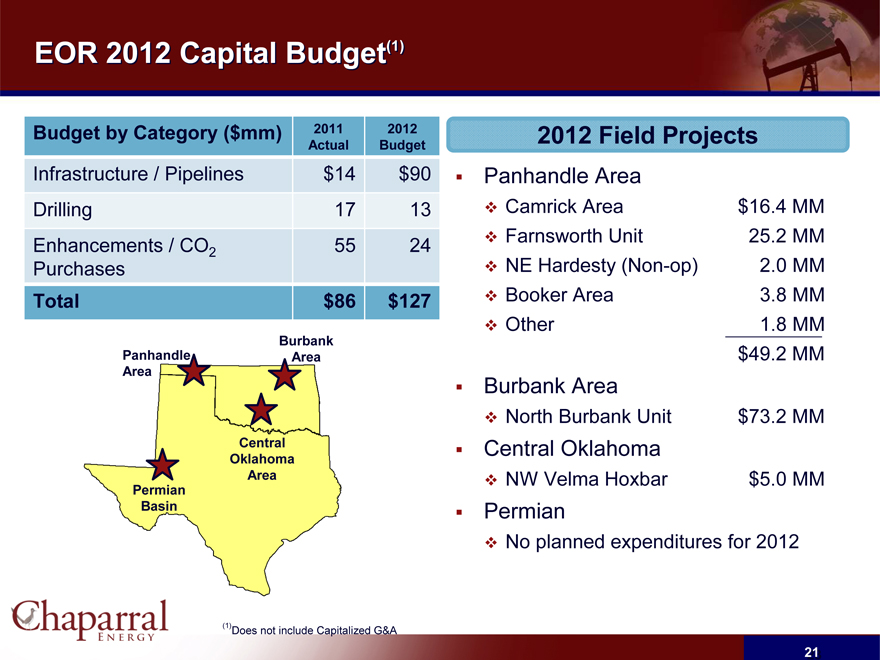
EOR 2012 Capital Budget(1)
Budget by Category ($mm) 2011 2012
Actual Budget
Infrastructure / Pipelines $14 $90
Drilling 17 13
Enhancements / CO2 55 24
Purchases
Total $86 $127
Panhandle Area
Burbank Area
Central Oklahoma Area
Permian Basin
2012 Field Projects
Panhandle Area
Camrick Area $16.4 MM
Farnsworth Unit 25.2 MM
NE Hardesty (Non-op) 2.0 MM
Booker Area 3.8 MM
Other 1.8 MM
$49.2 MM
Burbank Area
North Burbank Unit $73.2 MM
Central Oklahoma
NW Velma Hoxbar $5.0 MM
Permian
No planned expenditures for 2012
(1)
Does not include Capitalized G&A
21
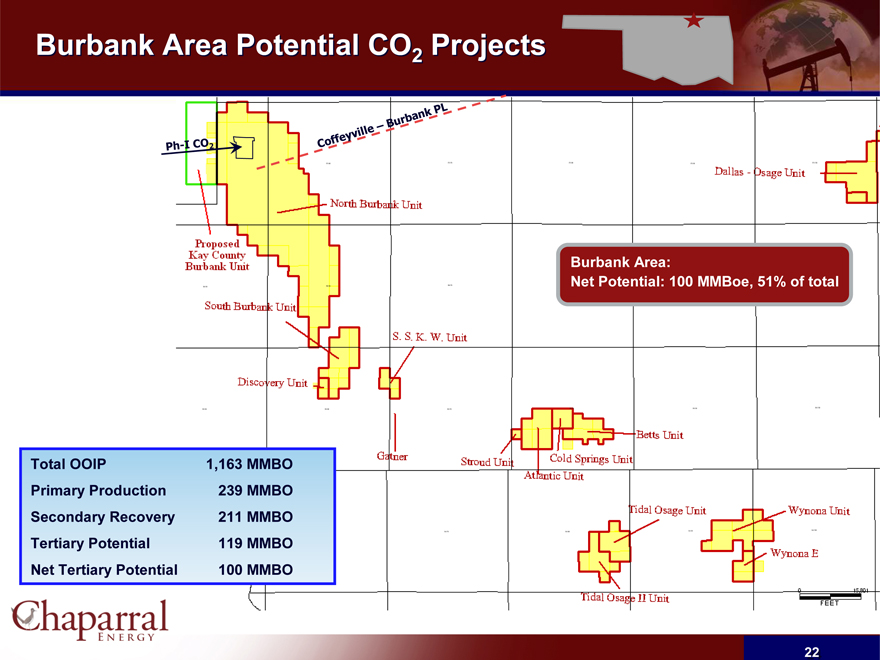
Burbank Area Potential CO Projects
2
Burbank Area:
Net Potential: 100 MMBoe, 51% of total
Total OOIP 1,163 MMBO Primary Production 239 MMBO Secondary Recovery 211 MMBO Tertiary Potential 119 MMBO Net Tertiary Potential 100 MMBO
22
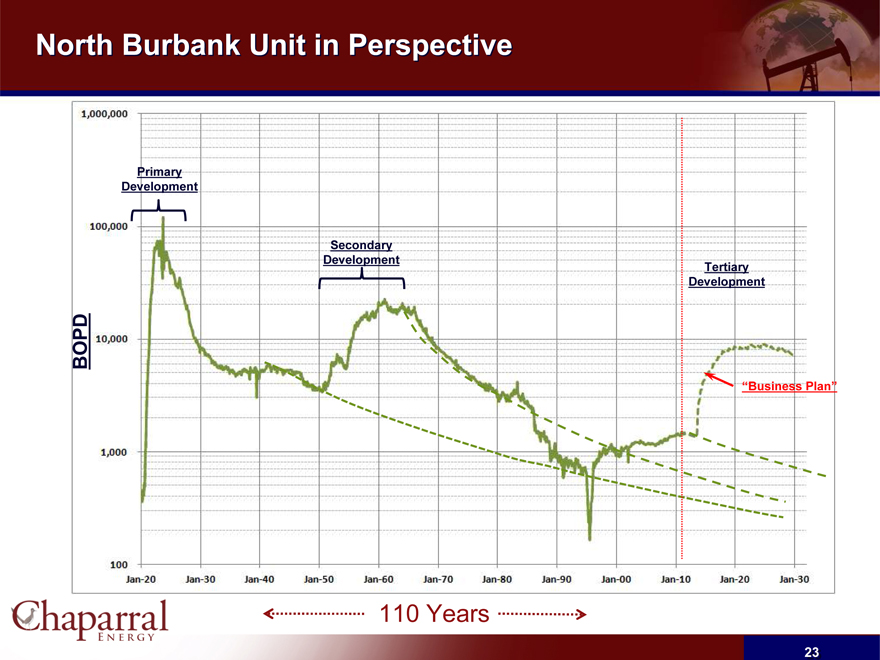
North Burbank Unit in Perspective
Primary Development
Secondary
Development
Tertiary Development
BOPD
1,000,000 100,000 10,000 1,000 100
Jan-20 Jan-30 Jan-40 Jan-50 Jan-60 Jan-70 Jan-80 Jan-90 Jan-00 Jan-10 Jan-20 Jan-30
110 Years
“Business Plan”
23
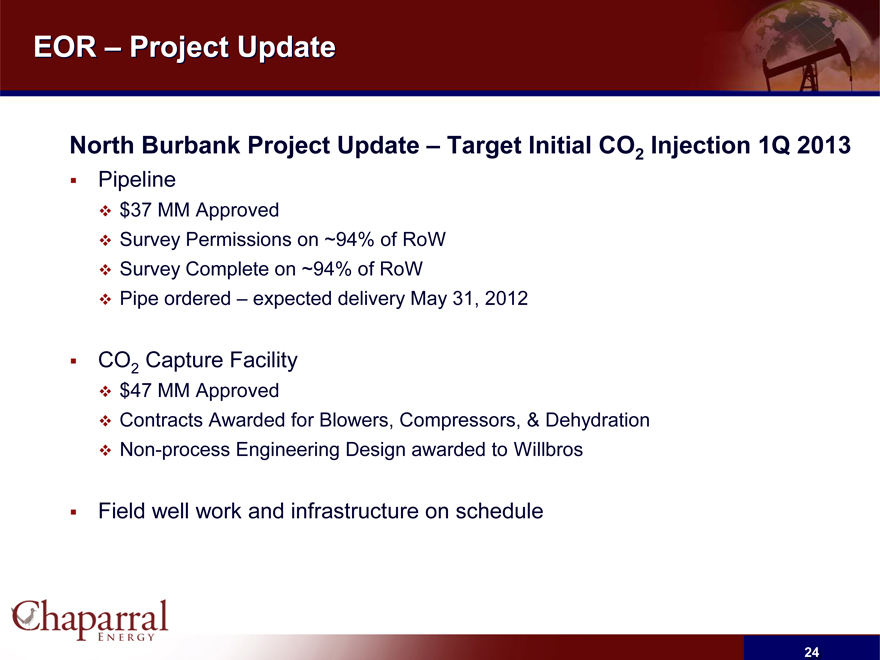
EOR – Project Update
North Burbank Project Update – Target Initial CO Injection 1Q 2013
2
Pipeline
$37 MM Approved
Survey Permissions on ~94% of RoW Survey Complete on ~94% of RoW
Pipe ordered – expected delivery May 31, 2012
CO Capture Facility
2
$47 MM Approved
Contracts Awarded for Blowers, Compressors, & Dehydration Non-process Engineering Design awarded to Willbros
Field well work and infrastructure on schedule
24
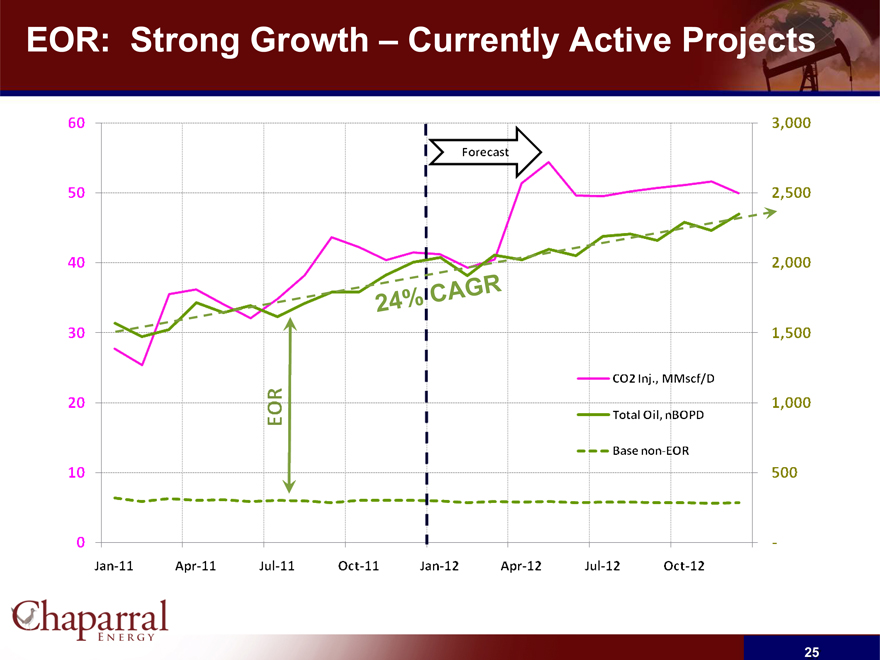
EOR: Strong Growth – Currently Active Projects
60 50 40 30 20 10 0
Jan-11 Apr-11 Jul-11 Oct-11
Jan-12 Apr-12 Jul-12 Oct-12
Forecast
24%CAGR
EOR
Co2 Inj., MMscf/D
Total Oil, nBOPD
Base non-EOR
3,000 2,500 2,000 1,500 1,000 500 –
25
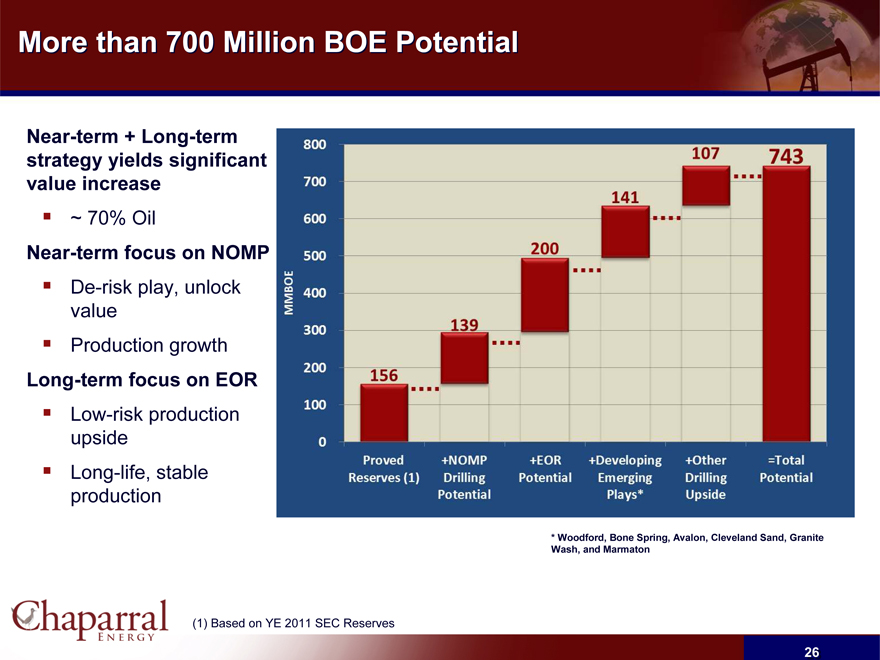
More than 700 Million BOE Potential
Near-term + Long-term strategy yields significant value increase
~ 70% Oil
Near-term focus on NOMP
De-risk play, unlock value
Production growth
Long-term focus on EOR
Low-risk production upside
Long-life, stable production
MMBOE
800 700 600 500 400 300 200 100 0
156 139 200 141 107 743
Proved Reserves (1)
+NOMP Drilling Potential
+EOR Potential
+Developing Emerging Plays *
+Other Drilling Upside
=Total Potential
* Woodford, Bone Spring, Avalon, Cleveland Sand, Granite Wash, and Marmaton
(1) Based on YE 2011 SEC Reserves
26
Financial Performance and Credit Statistics
27
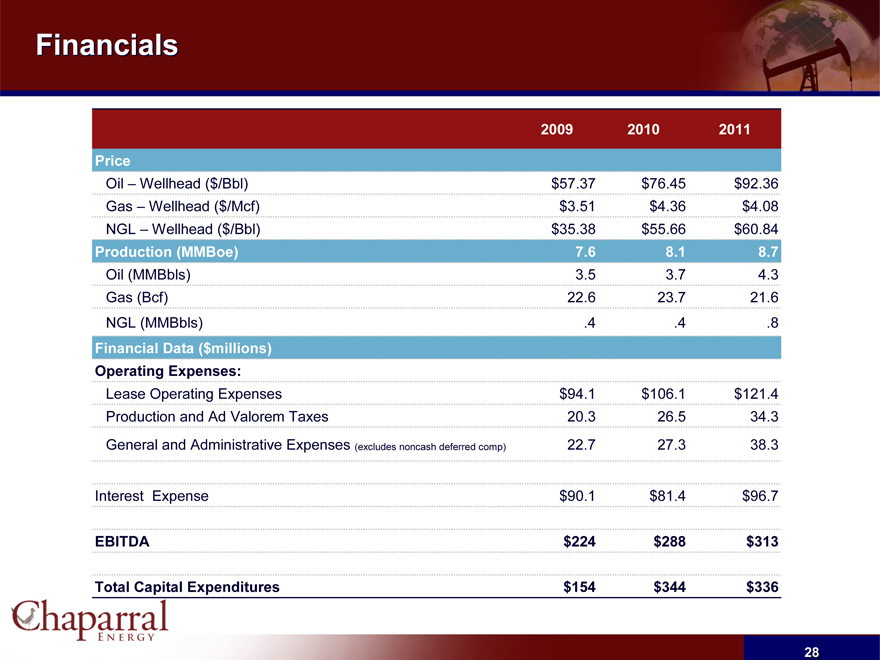
Financials
2009 2010 2011
Price
Oil – Wellhead ($/Bbl) $57.37 $76.45 $92.36
Gas – Wellhead ($/Mcf) $3.51 $4.36 $4.08
NGL – Wellhead ($/Bbl) $35.38 $55.66 $60.84
Production (MMBoe) 7.6 8.1 8.7
Oil (MMBbls) 3.5 3.7 4.3
Gas (Bcf) 22.6 23.7 21.6
NGL (MMBbls) .4 .4 .8
Financial Data ($millions)
Operating Expenses:
Lease Operating Expenses $94.1 $106.1 $121.4
Production and Ad Valorem Taxes 20.3 26.5 34.3
General and Administrative Expenses (excludes noncash deferred comp) 22.7 27.3 38.3
Interest Expense $90.1 $81.4 $96.7
EBITDA $224 $288 $313
Total Capital Expenditures $154 $344 $336
28
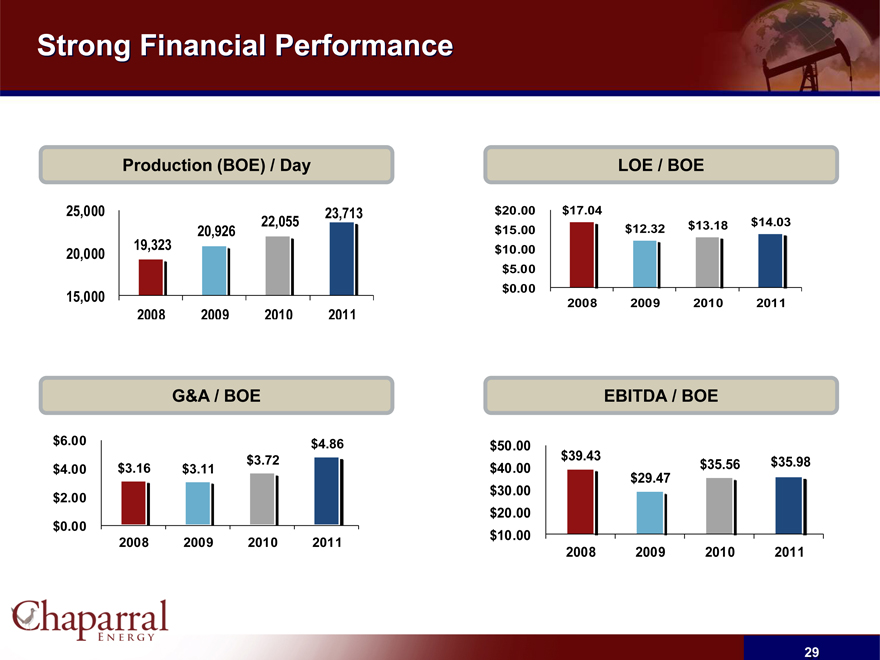
Strong Financial Performance
Production (BOE) / Day
25,000 20,000 15,000
19,323
20,926
22,055
23,713
2008 2009 2010 2011
LOE / BOE
$20.00 $15.00 $10.00 $5.00 $0.00
2008 2009 2010 2011
$17.04
$12.32
$13.18
$14.03
G&A / BOE
$6.00 $4.00 $2.00 $0.00
2008 2009 2010 2011
$3.16
$3.11
$3.72
$4.86
EBITDA / BOE
$50.00
$40.00
$30.00 $20.00
$10.00
2008 2009 2010 2011
$39.43
$29.47
$35.56
$35.98
29
2011 Results and 2012 Guidance
Operating Statistics
2011 Results 2012 Guidance
Capital Expenditures $336 million $330 million
Production 8.7 MMBoe 8.8 - 9.0 MMBoe
General and Administrative $4.86/Boe $5.00 - $5.50/Boe
Lease Operating Expense $14.03/Boe $14.25 - $14.75/Boe
30
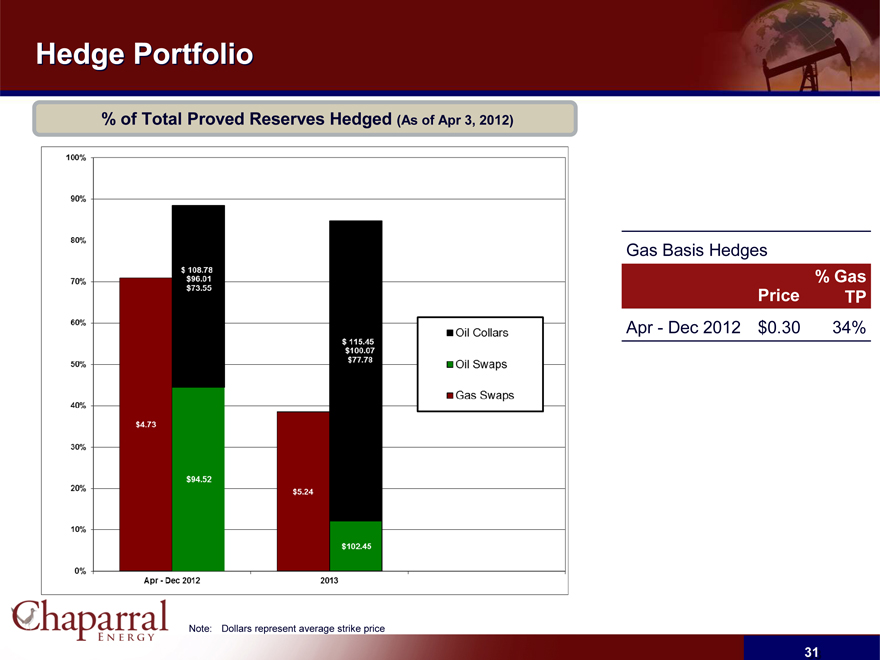
Hedge Portfolio
% of Total Proved Reserves Hedged (As of Apr 3, 2012)
100% 90% 80% 70% 60% 50% 40% 30% 20% 10% 0%
$4.73
$108.78
$96.01
$73.55
$94.52
$5.24
$115.45
$100.07
$77.78
$102.45
Apr - Dec 2012 2013
Oil Collars
Oil Swaps
Gas Swaps
Gas Basis Hedges
% Gas
Price TP
Apr - Dec 2012 $0.30 34%
Note: Dollars represent average strike price
31
Question & Answer
32