J.P. Morgan High Yield Conference
Miami, Florida
February 2012

This presentation contains "forward-looking statements" within the meaning of Section 27A of the Securities Act of 1933, as amended, and Section 21E of the Securities Exchange Act of 1934, as amended. These forward-looking statements are subject to certain risks, trends and uncertainties that could cause actual results to differ materially from those projected. Among those risks, trends and uncertainties are our ability to find oil and natural gas reserves that are economically recoverable, the volatility of oil and natural gas prices and significantly depressed natural gas prices since the middle of 2008, the uncertain economic conditions in the United States and globally, the decline in the values of our properties that have resulted in and may in the future result in additional ceiling test write-downs, our ability to replace reserves and sustain production, our estimate of the sufficiency of our existing capital sources, our ability to raise additional capital to fund cash requirements for future operations, the uncertainties involved in prospect development and property acquisitions or dispositions and in projecting future rates of production or future reserves, the timing of development expenditures and drilling of wells, hurricanes and other natural disasters, including the impact of the oil spill in the Gulf of Mexico on our present and future operations, the impact of government regulation, and the operating hazards attendant to the oil and natural gas business. In particular, careful consideration should be given to cautionary statements made in the various reports we have filed with the Securities and Exchange Commission. We undertake no duty to update or revise these forward-looking statements.

Company Representatives
Mark Fischer
Chief Executive Officer
& President
Joe Evans
Chief Financial Officer
& Executive Vice President
Earl Reynolds
Chief Operating Officer
& Executive Vice President
Diane Montgomery
Vice President
Finance/Investor Relations
Chaparral Overview
Founded in 1988, Based in Oklahoma City
Core areas — Mid-Continent (Oklahoma) and Permian Basin (W. Texas)
Oil-weighted producer (60% oil; 40% gas); R/P ratio 18 years
Third largest oil producer in Oklahoma
Stable 1P base with large 2P and 3P Upside
Near-term growth potential through drilling in conventional & emerging plays
Long-term growth through CO2 EOR
2011 Production (Boe/d) ~23,700
YE 2011 Proved Reserves (MMBoe)1 156.3
YE 2011 Proved Reserves PV-10 ($ in mm)1 $2,309
2011 Estimated EBITDA ($ mm) $310 - 315
¹Based on 12/31/2011 SEC methodology
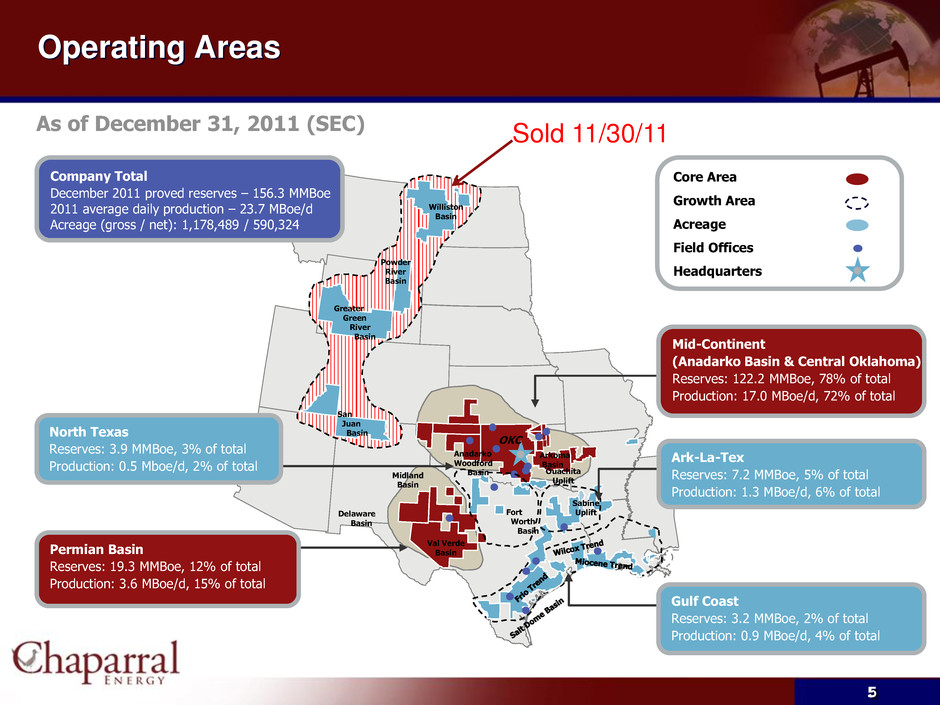
Operating Areas
As of December 31, 2011 (SEC)
Sold 11/30/11
Core Area
Growth Area
Acreage
Field Offices
Headquarters
Company Total
December 2011 proved reserves – 156.3 MMBoe
2011 average daily production – 23.7 MBoe/d
Acreage (gross / net): 1,178,489 / 590,324
Mid-Continent
(Anadarko Basin & Central Oklahoma)
Reserves: 122.2 MMBoe, 78% of total
Production: 17.0 MBoe/d, 72% of total
Permian Basin
Reserves: 19.3 MMBoe, 12% of total
Production: 3.6 MBoe/d, 15% of total
Ark-La-Tex
Reserves: 7.2 MMBoe, 5% of total
Production: 1.3 MBoe/d, 6% of total
North Texas
Reserves: 3.9 MMBoe, 3% of total
Production: 0.5 Mboe/d, 2% of total
Gulf Coast
Reserves: 3.2 MMBoe, 2% of total
Production: 0.9 MBoe/d, 4% of total
Strong Record of Reserve and Production Growth
Chaparral’s reserve replacement ratio averaged 422% per year since 2002
2003 – 2011 CAGR = 15%
2003 – 2011 CAGR = 16%
Financial Position to Execute Strategy
Strong Financial Position
No debt maturities before 2017
Hedge positions in place to secure cash flow in near term
Budget CAPEX within free cash flow (including divestiture proceeds)
Current Liquidity of approximately $400 MM
1) Note: Debt balances do not reflect discounts on Senior Notes of $1.658mm
on the 2017s and $6.441mm on the 2020s
Capital Budget ($millions)
*99% of Capital Program is Oil Focused
Resource Potential
Substantial Resource Potential for both Near Term and Long Term Growth
Near Term
Conventional Drilling (ROR 50% - 75%)
Anadarko Granite Wash
Anadarko Cleveland Sand
Unconventional Resource Play Drilling (ROR 35% - 75%)
| |
| Northern Oklahoma Mississippi Play (NOMP) | 250,000+ acres |
| |
| Panhandle Marmaton | ~28,000 acres |
| |
| Anadarko Woodford Shale | ~23,000 acres |
| |
| Bone Spring/Avalon Shale | ~19,000 acres |
Long Term
CO2 EOR – 82 fields, 200+ MMBO (ROR 25% - 40%)
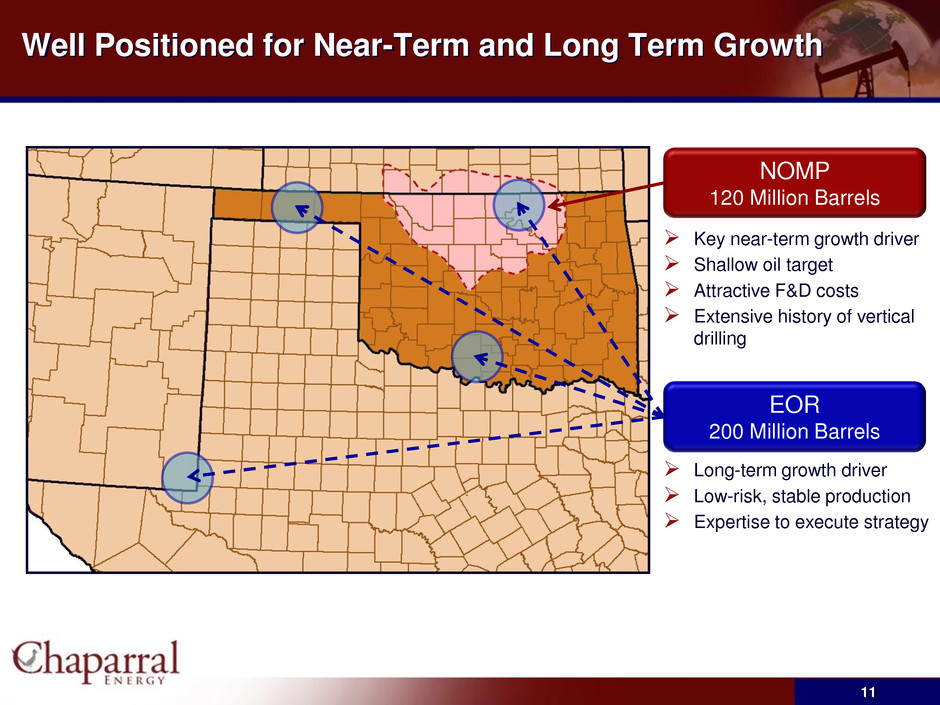
Well Positioned for Near-Term and Long Term Growth
NOMP
120 Million Barrels
Key near-term growth driver
Shallow oil target
Attractive F&D costs
Extensive history of vertical drilling
EOR
200 Million Barrels
Long-term growth driver
Low-risk, stable production
Expertise to execute strategy
NOMP: A Key Near-Term Focus Area
More than 250,000 Net Acres
Wildhorse Concession gives Chaparral exclusive rights to 138,000 acres
Drilled 14 wells to date
17 wells planned in 2012
Play Economics:
EURs: 200 – 400 MBOE
Well costs: $2.5 - $4 Million
Percent Oil: 60 – 80%
NOMP: Recent Results
NOMP West
Approximately 40,000 Net Acres
Significant industry activity in the play
Drilled 9 wells to date (2 Waiting on Completion)
Average IP 590 Boepd
46% Oil
NOMP East
218,000 Net Acres
In de-risking phase – industry activity increasing
Drilled 5 wells to date (2 Waiting on Completion)
Average IP 170 Boepd
70% Oil
Chaparral:A Growing Mid-Continent CO2 EOR Company
Long Life EOR Assets in Four Key Growth Areas
200+ MMBOe Potential Reserves
Low Geologic Risk
Attractive Economics
ROR – 25% to 40%
ROI – 2.5:1 to 3.5:1
Capital Requirements - $75-$125 MM/yr
Long-term growth potential - 20-30% CAGR expected through 2020
405 miles of CO2 Pipelines (net 245)
CO2 Supply – 100 MMcf/D
Current: 50 MMcf/D
Coffeyville Contract: 50 MMcf/D
Currently Owned CO2 Development Potential and Infrastructure
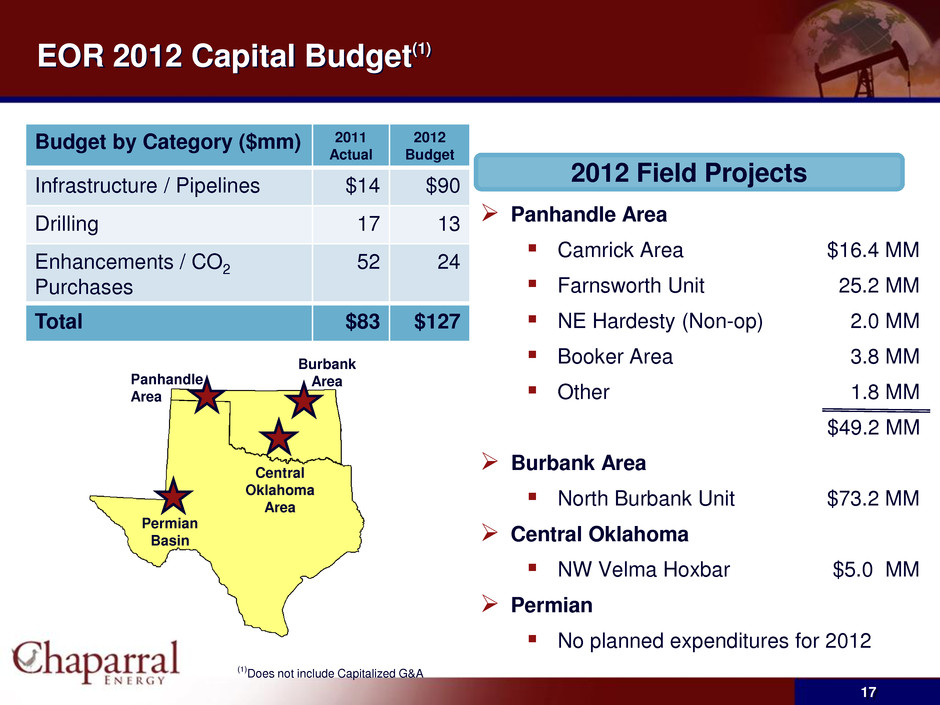
EOR 2012 Capital Budget(1)
2012 Field Projects
Panhandle Area
| |
| NE Hardesty (Non-op) | 2.0 MM |
$49.2 MM
Burbank Area
| |
| North Burbank Unit | $73.2 MM |
Central Oklahoma
No planned expenditures for 2012
(1)Does not include Capitalized G&A
PROCESSING RATE: The Key to Improved Rate of Return
CO2 Injection initiated Sep’07
Processing Rates Average 25% hcpv Inj./Yr
North Burbank CO2 Development
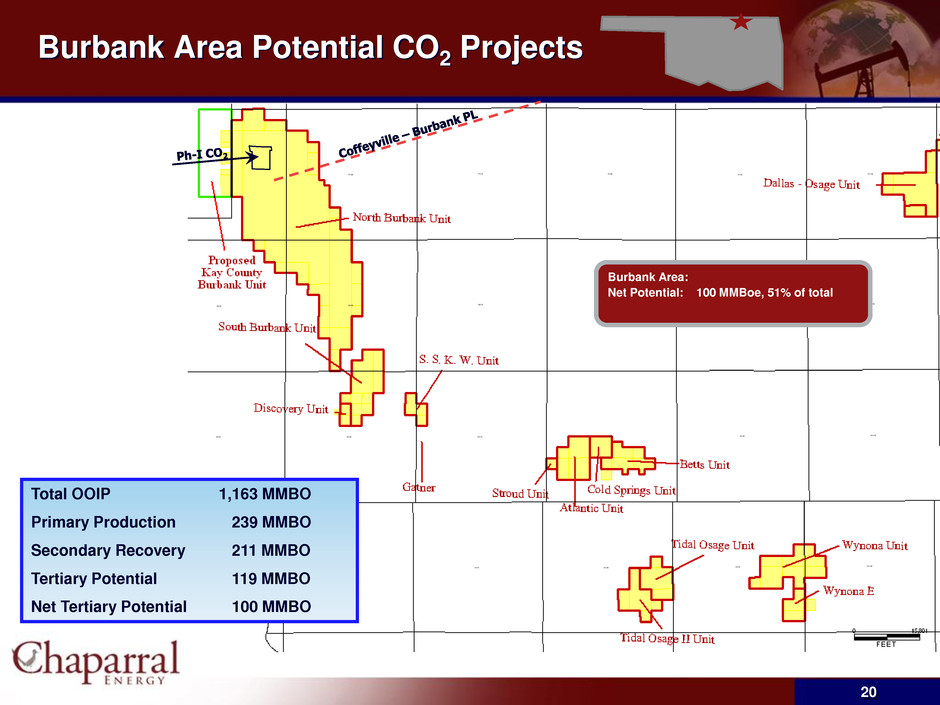
Burbank Area Potential CO2 Projects
“BURBANK” in Perspective
Other Recently Installed CO2 Injection Projects
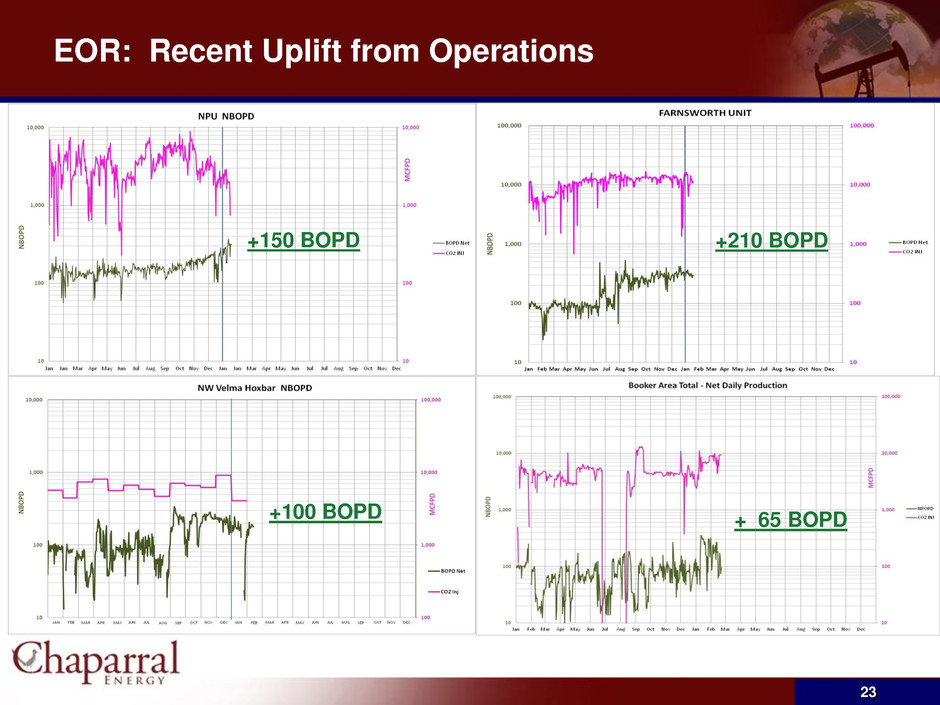
EOR: Recent Uplift from Operations
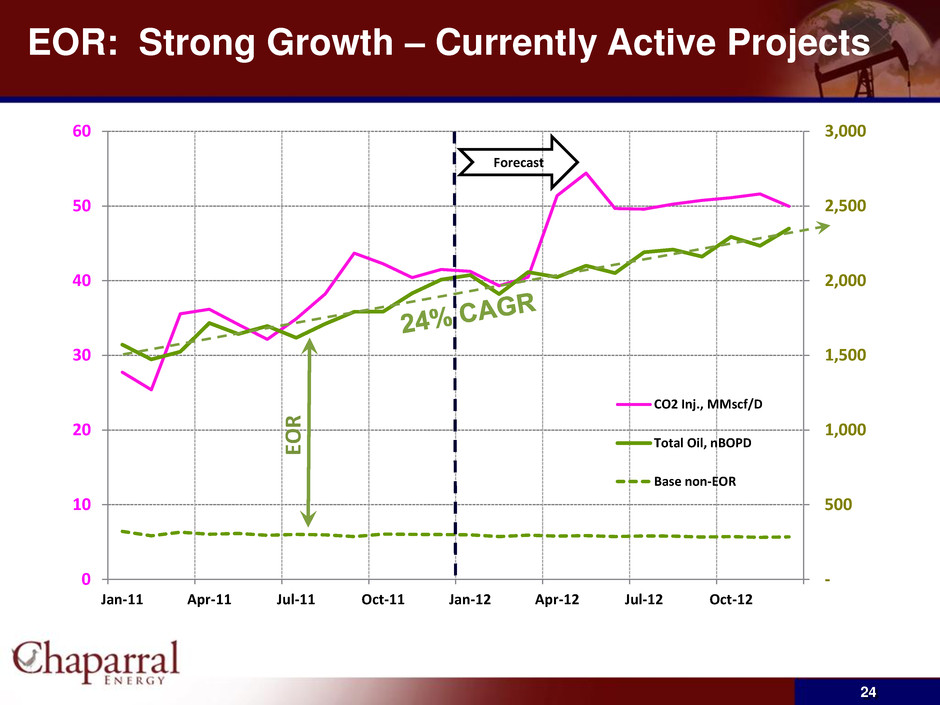
EOR: Strong Growth – Currently Active Projects
Other Developing Drilling Plays
Bone Spring / Avalon
Chaparral Energy, LLC
Avalon Shale Position
19,000 Net Acres in West and Central Loving County, TX
Upper and Lower Avalon Production Surrounding Acreage Block
Over 80 Potential Avalon Drill Sites
Oil & NGL Rich Play
High Initial Production
Prime Acreage Position
Large Development Opportunity
Average Well Depth : 12,000 – 12,250 Ft. (MD)
Panhandle Marmaton
Unit’s average 30 day IP + 238 BOE/D
Unit’s average reserves 130 MBOE (76% oil, 14% NGL, 10% gas)
Unit’s average CWC: $2.8 MM
Total 2012 Budgeted CAPEX: $5 MM to drill three wells
Average Depth to Marmaton 6600’
Chaparral continues to lease in the play and currently has ~28,000 confirmed net acres in the Emerging Marmaton Play
More than 700 Million BOE Potential
Near-term + Long-term strategy yields significant value increase
~ 70% Oil
Near-term focus on NOMP
De-risk play, unlock value
Production growth
Long-term focus on EOR
Low-risk production upside
Long-life, stable production
* Woodford, Bone Spring, Avalon, Cleveland Sand, Granite Wash, and Marmaton
Financial Performance, Projections and Credit Statistics
Financial Summary
Financial Metrics per BOE
2011 Estimates and 2012 Preliminary Guidance
Hedge Portfolio
Question & Answer