
Investor Presentation May 2019 NYSE: CHAP 0
Forward-Looking Statements and Risk Factors This presentation contains forward-looking statements within the meaning of Section 27A of the Securities Act of 1933 and Section 21E of the Securities Exchange Act of 1934. Statements made in this presentation and by representatives of Chaparral Energy (the company) during the course of this presentation that are not historical facts are forward-looking statements. These statements are based on certain assumptions and expectations made by the company, which reflect management’s experience, estimates and perception of historical trends, current conditions and anticipated future developments. Although the company believes these assumptions and expectations are reasonable, they are subject to a number of assumptions, risks and uncertainties, many of which are difficult to predict and are beyond the control of the company and which may cause actual results to differ materially from those implied or anticipated in the forward-looking statements. These include risks relating to financial performance and results, ability to improve our financial results and profitability following emergence from bankruptcy, availability of sufficient cash flow to execute our business plan, continued low or further declining commodity prices and demand for oil, natural gas and natural gas liquids, ability to hedge future production, ability to replace reserves and efficiently develop current reserves and the regulatory environment and other important factors that could cause actual results to differ materially from those anticipated or implied in the forward-looking statements. Initial production (IP) rates are discrete data points in each well’s productive history. These rates are sometimes actual rates and sometimes extrapolated or normalized rates. As such, the rates for a particular well may decline over time and change as additional data becomes available. Peak production rates are not necessarily indicative or predictive of future production rates or economic rates-of-return from such wells and should not be relied upon for such purpose. The ability of the company or the relevant operator to maintain expected levels of production from a well is subject to numerous risks and uncertainties, including those referenced and discussed above. In addition, methodology the company and other industry participants utilize to calculate peak IP rates may not be consistent and, as a result, the values reported may not be directly and meaningfully comparable. These and other important factors could cause actual results to differ materially from those anticipated or implied in the forward-looking statements. Please read risk factors in the company’s annual reports on form 10-K as amended, quarterly reports on form 10-Q and other public filings. We undertake no obligation to publicly update any forward-looking statements, whether as a result of new information or future events. This presentation includes financial measures that are not in accordance with generally accepted accounting principals (GAAP). For reconciliation of such measures to the most directly comparable GAAP measures, please refer to the appendix. NYSE: CHAP 1

Company Overview NYSE: CHAP 2
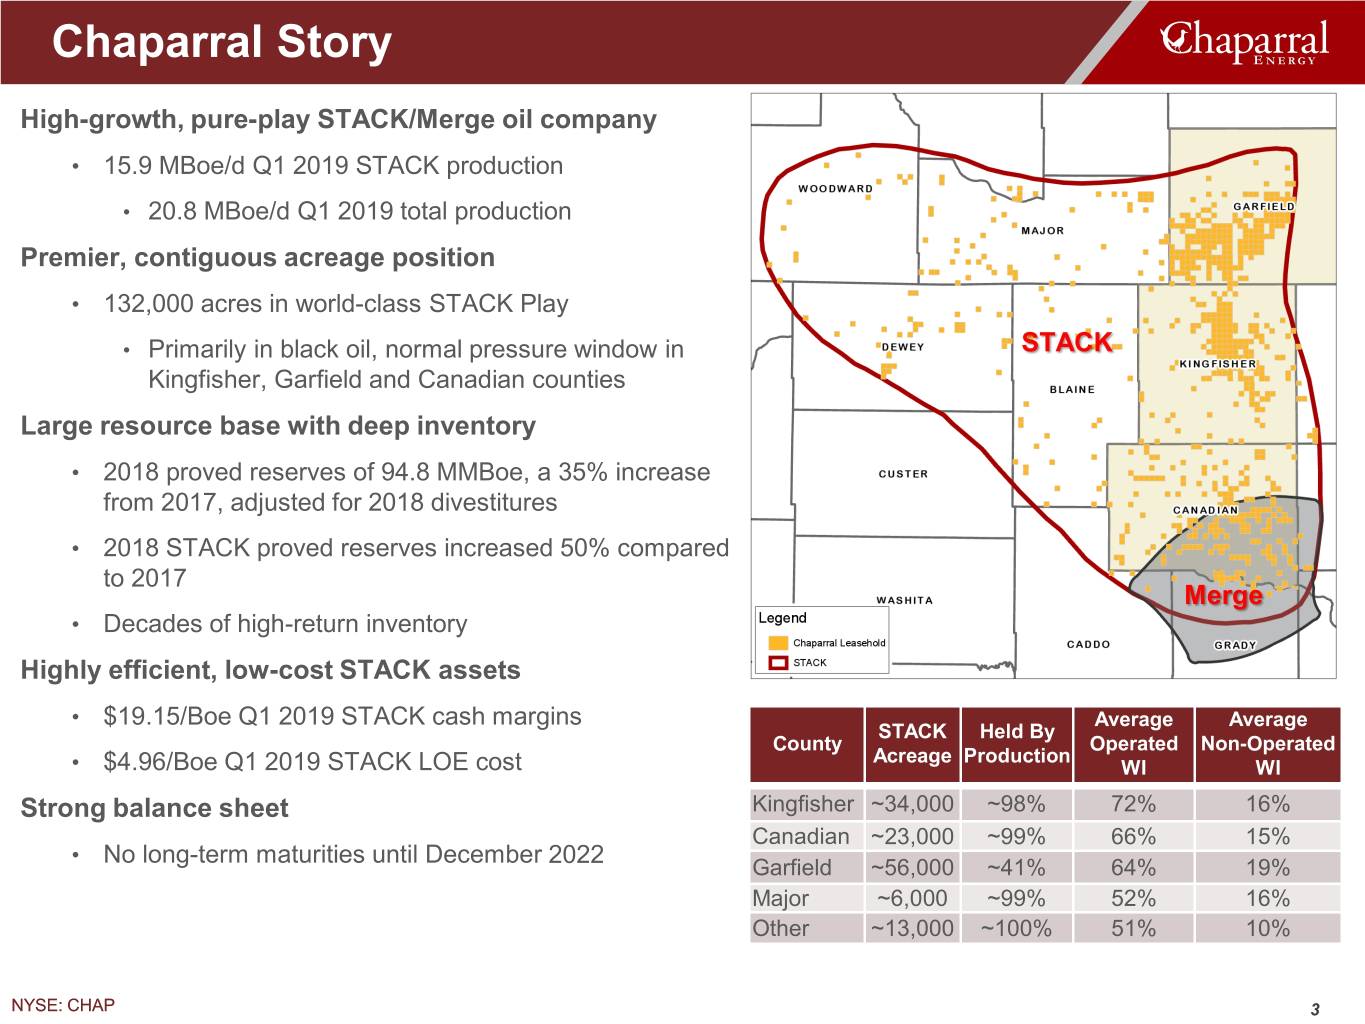
Chaparral Story High-growth, pure-play STACK/Merge oil company • 15.9 MBoe/d Q1 2019 STACK production • 20.8 MBoe/d Q1 2019 total production Premier, contiguous acreage position • 132,000 acres in world-class STACK Play • Primarily in black oil, normal pressure window in STACK Kingfisher, Garfield and Canadian counties Large resource base with deep inventory • 2018 proved reserves of 94.8 MMBoe, a 35% increase from 2017, adjusted for 2018 divestitures • 2018 STACK proved reserves increased 50% compared to 2017 Merge • Decades of high-return inventory Highly efficient, low-cost STACK assets • $19.15/Boe Q1 2019 STACK cash margins Average Average STACK Held By County Operated Non-Operated Acreage Production • $4.96/Boe Q1 2019 STACK LOE cost WI WI Strong balance sheet Kingfisher ~34,000 ~98% 72% 16% Canadian ~23,000 ~99% 66% 15% • No long-term maturities until December 2022 Garfield ~56,000 ~41% 64% 19% Major ~6,000 ~99% 52% 16% Other ~13,000 ~100% 51% 10% NYSE: CHAP 3
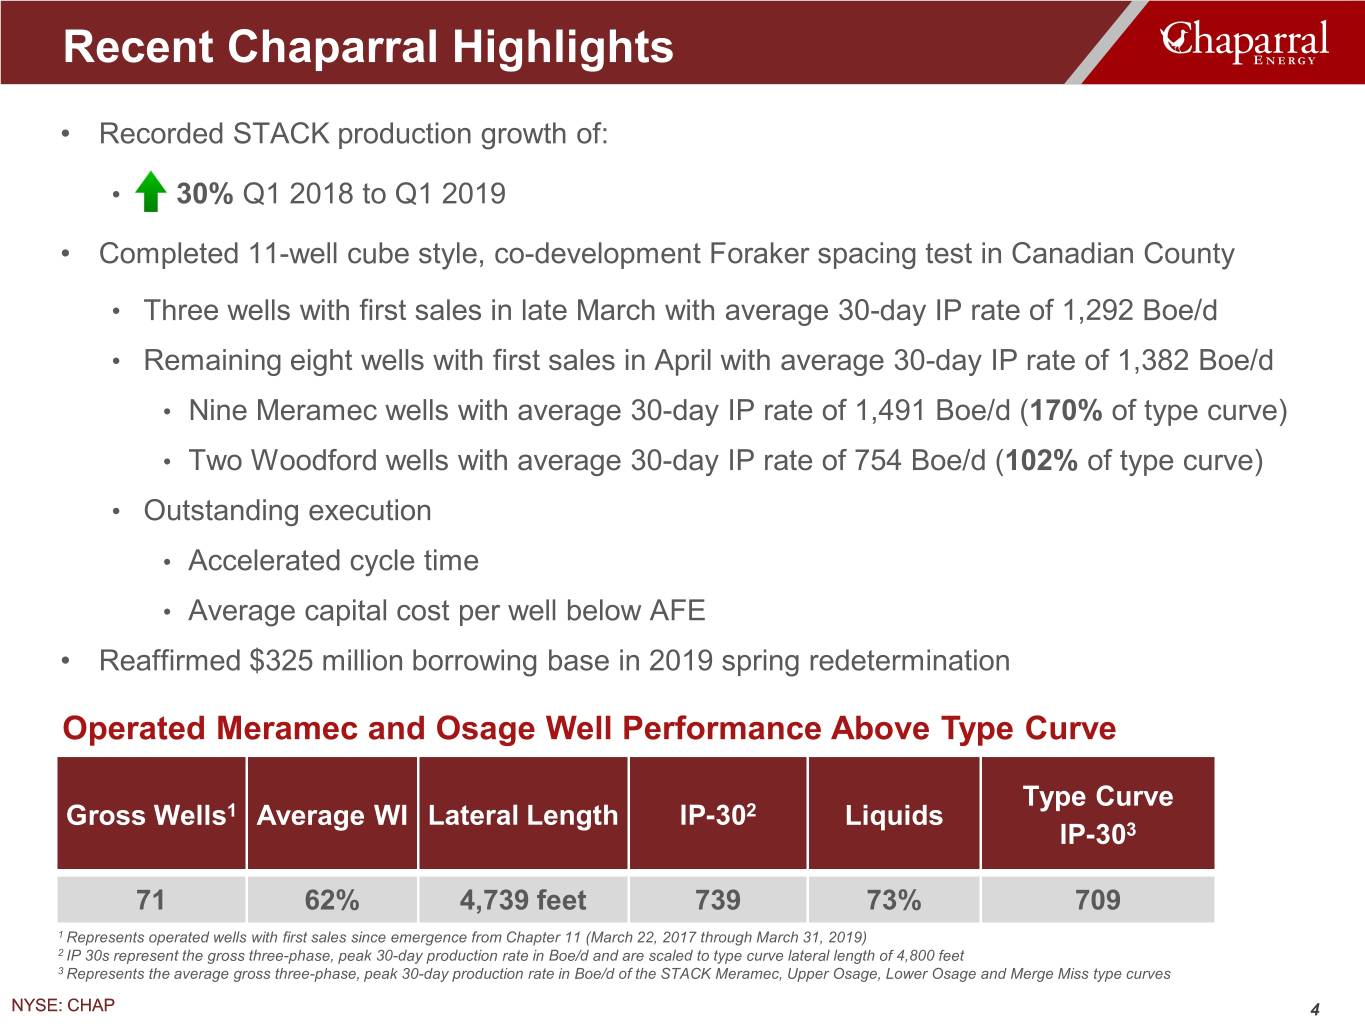
Recent Chaparral Highlights • Recorded STACK production growth of: • 30% Q1 2018 to Q1 2019 • Completed 11-well cube style, co-development Foraker spacing test in Canadian County • Three wells with first sales in late March with average 30-day IP rate of 1,292 Boe/d • Remaining eight wells with first sales in April with average 30-day IP rate of 1,382 Boe/d • Nine Meramec wells with average 30-day IP rate of 1,491 Boe/d (170% of type curve) • Two Woodford wells with average 30-day IP rate of 754 Boe/d (102% of type curve) • Outstanding execution • Accelerated cycle time • Average capital cost per well below AFE • Reaffirmed $325 million borrowing base in 2019 spring redetermination Operated Meramec and Osage Well Performance Above Type Curve Type Curve Gross Wells1 Average WI Lateral Length IP-302 Liquids IP-303 71 62% 4,739 feet 739 73% 709 1 Represents operated wells with first sales since emergence from Chapter 11 (March 22, 2017 through March 31, 2019) 2 IP 30s represent the gross three-phase, peak 30-day production rate in Boe/d and are scaled to type curve lateral length of 4,800 feet 3 Represents the average gross three-phase, peak 30-day production rate in Boe/d of the STACK Meramec, Upper Osage, Lower Osage and Merge Miss type curves NYSE: CHAP 4
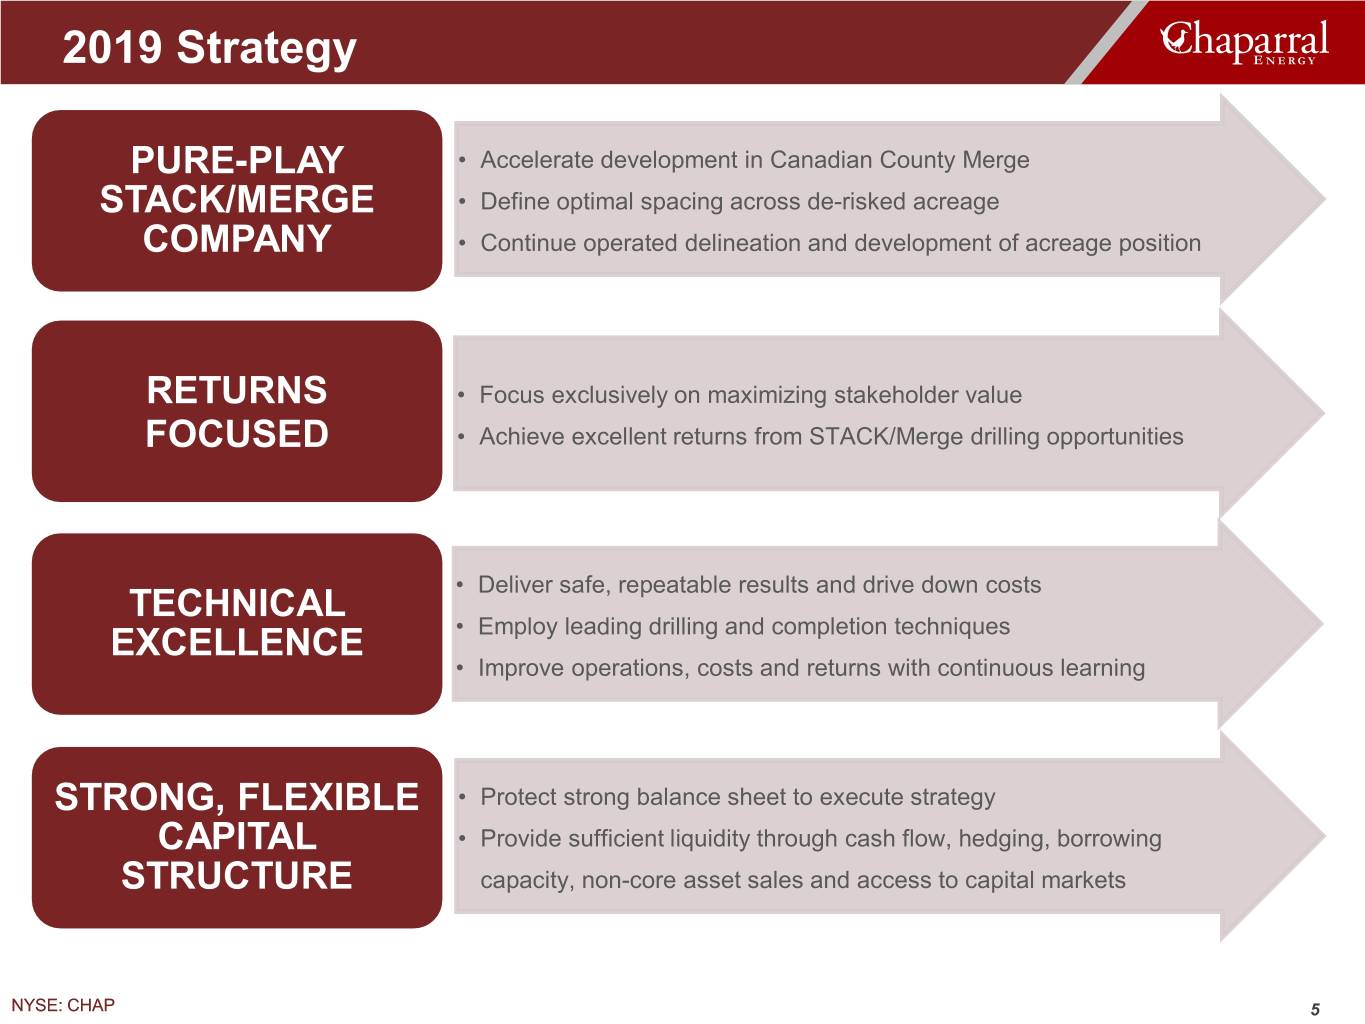
2019 Strategy PURE-PLAY • Accelerate development in Canadian County Merge STACK/MERGE • Define optimal spacing across de-risked acreage COMPANY • Continue operated delineation and development of acreage position RETURNS • Focus exclusively on maximizing stakeholder value FOCUSED • Achieve excellent returns from STACK/Merge drilling opportunities • Deliver safe, repeatable results and drive down costs TECHNICAL • Employ leading drilling and completion techniques EXCELLENCE • Improve operations, costs and returns with continuous learning STRONG, FLEXIBLE • Protect strong balance sheet to execute strategy CAPITAL • Provide sufficient liquidity through cash flow, hedging, borrowing STRUCTURE capacity, non-core asset sales and access to capital markets NYSE: CHAP 5
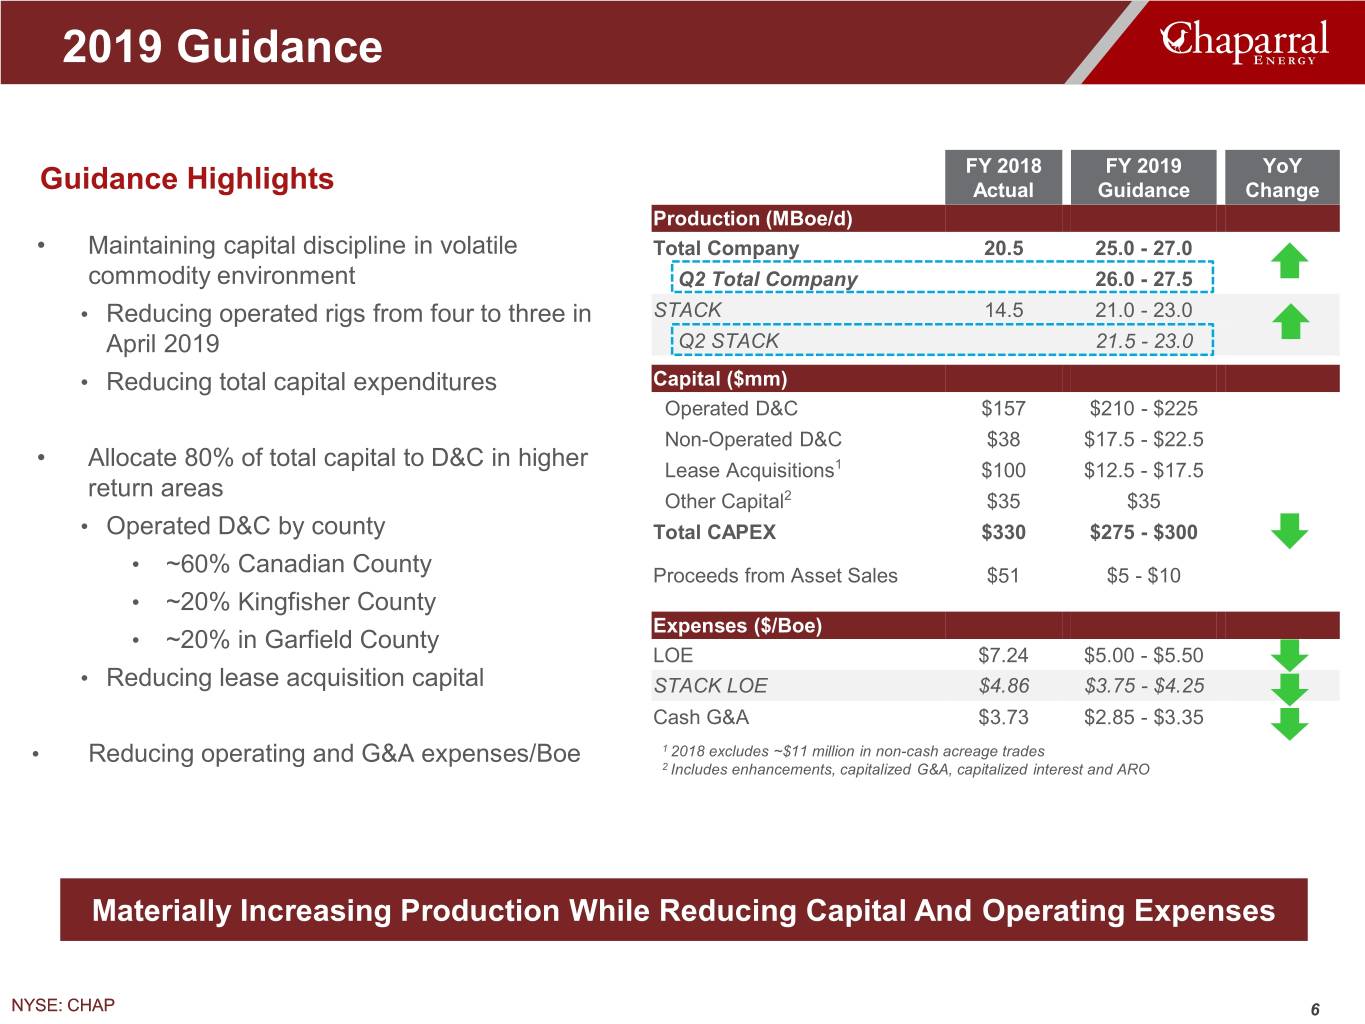
2019 Guidance FY 2018 FY 2019 YoY Guidance Highlights Actual Guidance Change Production (MBoe/d) • Maintaining capital discipline in volatile Total Company 20.5 25.0 - 27.0 commodity environment Q2 Total Company 26.0 - 27.5 • Reducing operated rigs from four to three in STACK 14.5 21.0 - 23.0 April 2019 Q2 STACK 21.5 - 23.0 • Reducing total capital expenditures Capital ($mm) Operated D&C $157 $210 - $225 Non-Operated D&C $38 $17.5 - $22.5 • Allocate 80% of total capital to D&C in higher Lease Acquisitions1 $100 $12.5 - $17.5 return areas 2 Other Capital $35 $35 • Operated D&C by county Total CAPEX $330 $275 - $300 • ~60% Canadian County Proceeds from Asset Sales $51 $5 - $10 • ~20% Kingfisher County Expenses ($/Boe) • ~20% in Garfield County LOE $7.24 $5.00 - $5.50 • Reducing lease acquisition capital STACK LOE $4.86 $3.75 - $4.25 Cash G&A $3.73 $2.85 - $3.35 • Reducing operating and G&A expenses/Boe 1 2018 excludes ~$11 million in non-cash acreage trades 2 Includes enhancements, capitalized G&A, capitalized interest and ARO Materially Increasing Production While Reducing Capital And Operating Expenses NYSE: CHAP 6
Operational Overview NYSE: CHAP 7
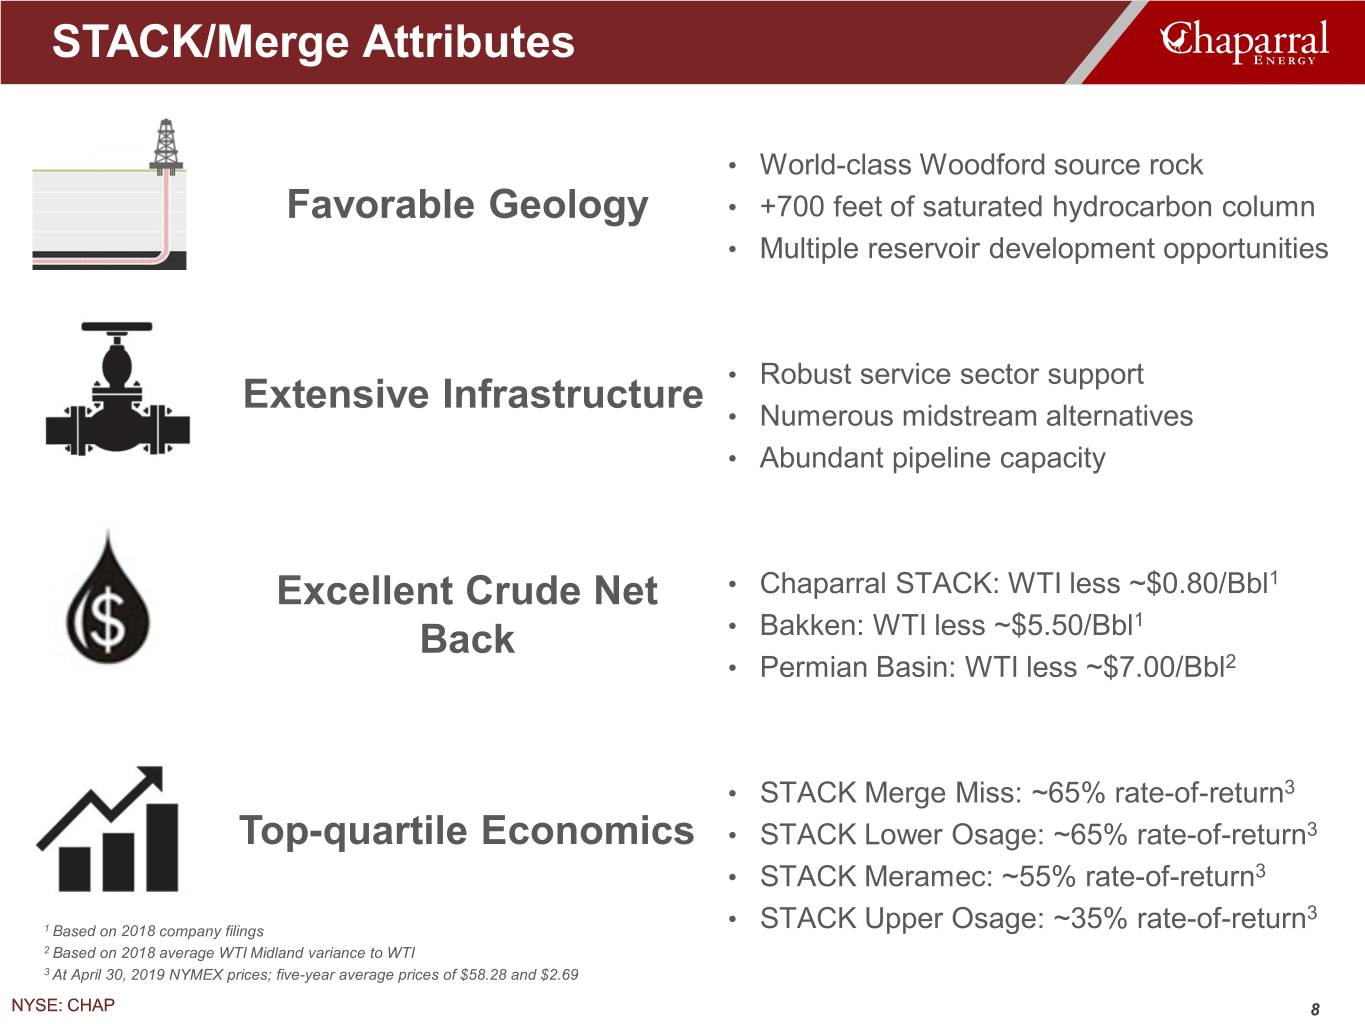
STACK/Merge Attributes • World-class Woodford source rock Favorable Geology • +700 feet of saturated hydrocarbon column • Multiple reservoir development opportunities • Robust service sector support Extensive Infrastructure • Numerous midstream alternatives • Abundant pipeline capacity Excellent Crude Net • Chaparral STACK: WTI less ~$0.80/Bbl1 1 Back • Bakken: WTI less ~$5.50/Bbl • Permian Basin: WTI less ~$7.00/Bbl2 • STACK Merge Miss: ~65% rate-of-return3 Top-quartile Economics • STACK Lower Osage: ~65% rate-of-return3 • STACK Meramec: ~55% rate-of-return3 3 1 Based on 2018 company filings • STACK Upper Osage: ~35% rate-of-return 2 Based on 2018 average WTI Midland variance to WTI 3 At April 30, 2019 NYMEX prices; five-year average prices of $58.28 and $2.69 NYSE: CHAP 8
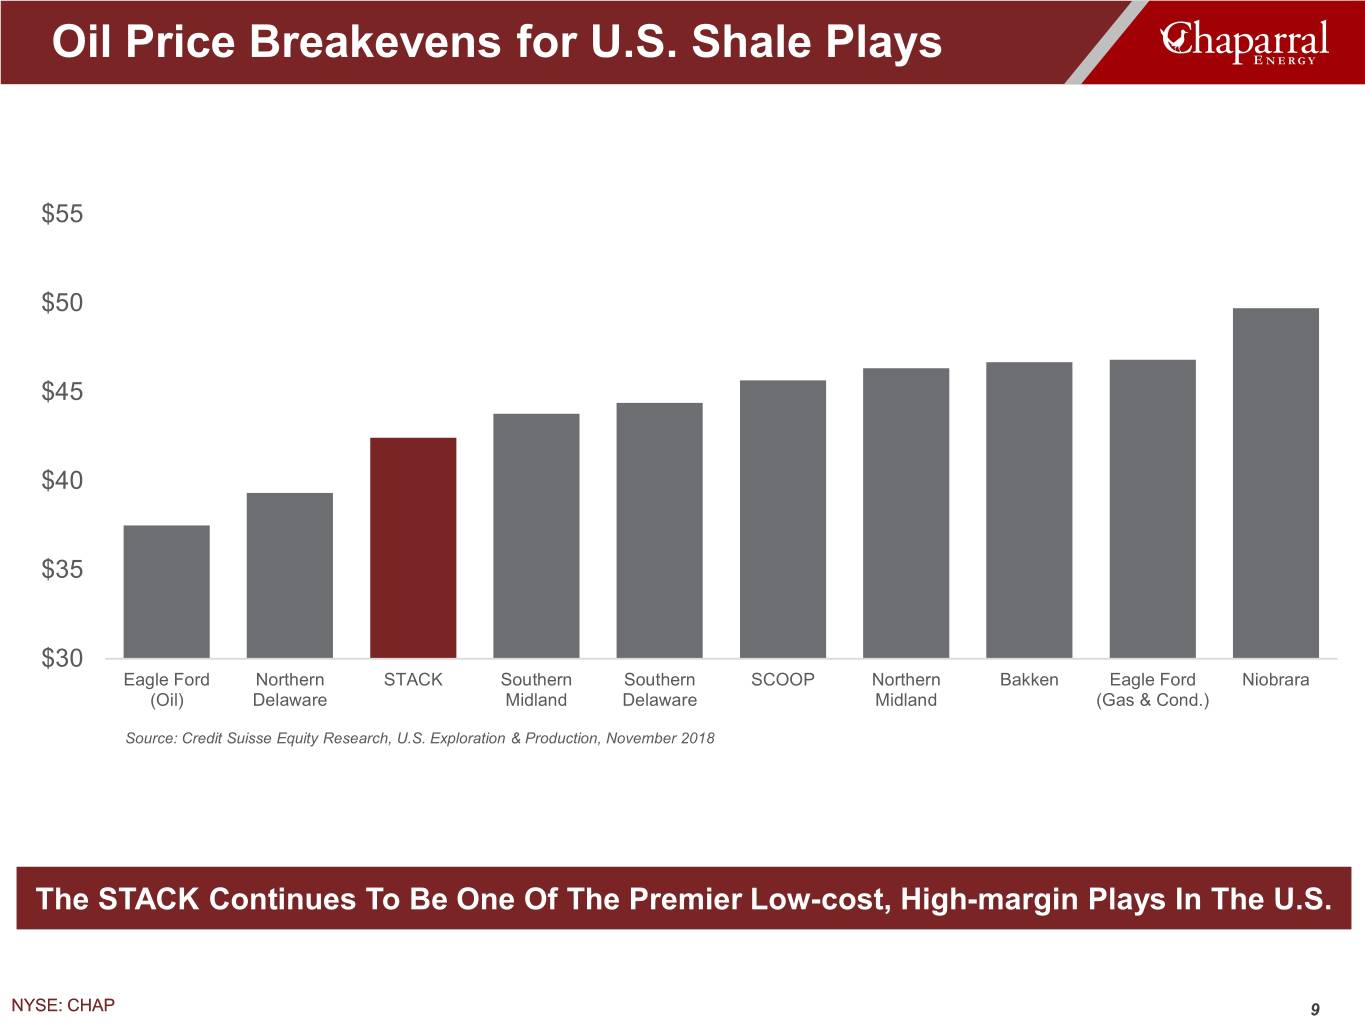
Oil Price Breakevens for U.S. Shale Plays $55 $50 $45 $40 $35 $30 Eagle Ford Northern STACK Southern Southern SCOOP Northern Bakken Eagle Ford Niobrara (Oil) Delaware Midland Delaware Midland (Gas & Cond.) Source: Credit Suisse Equity Research, U.S. Exploration & Production, November 2018 The STACK Continues To Be One Of The Premier Low-cost, High-margin Plays In The U.S. NYSE: CHAP 9
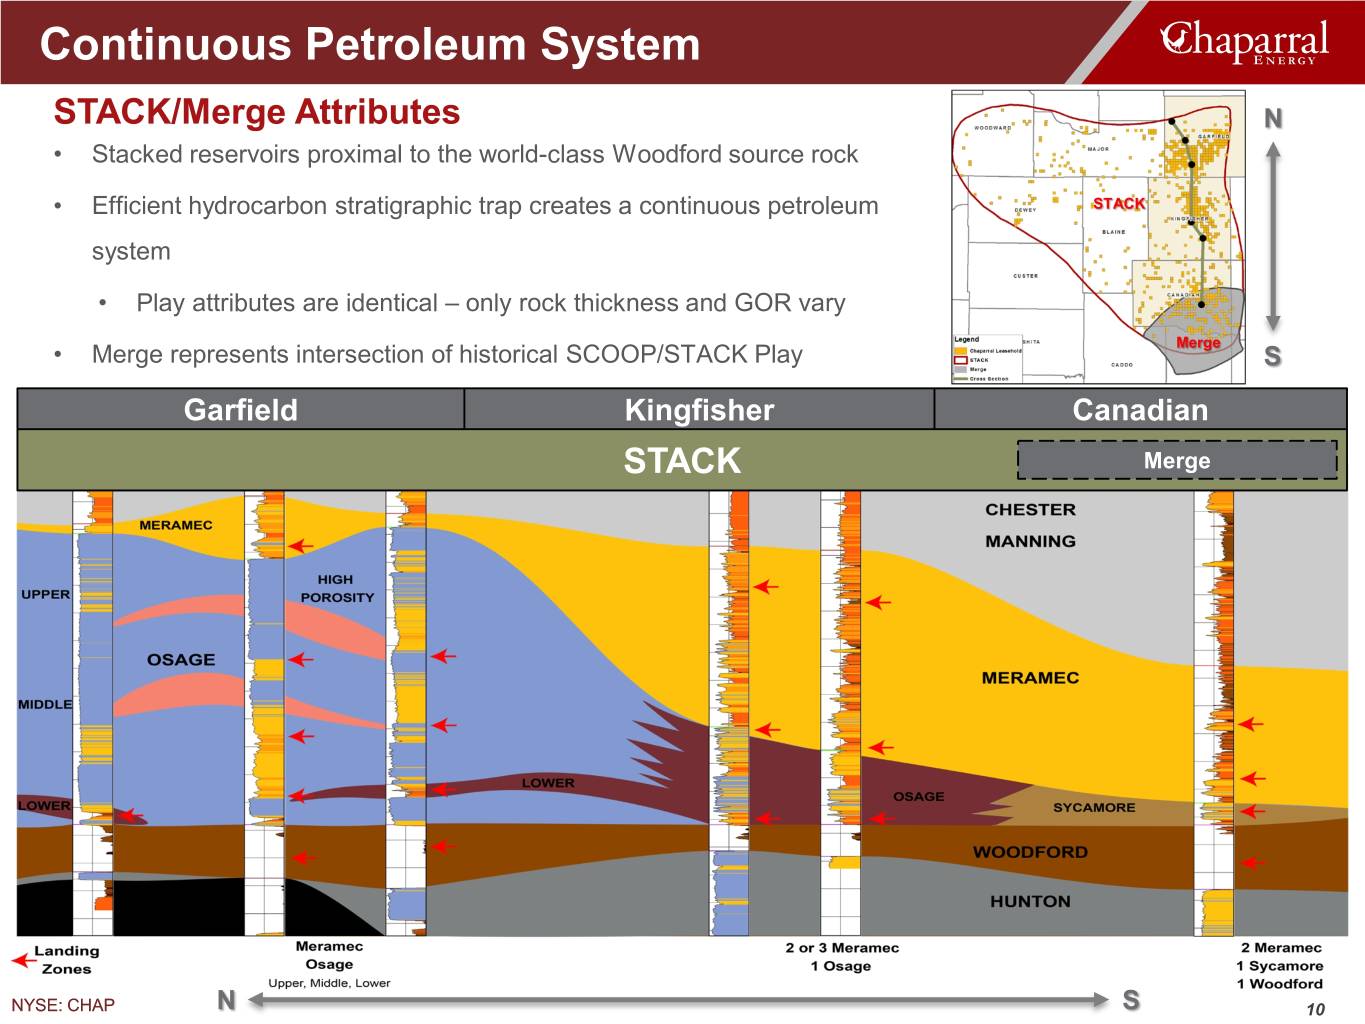
Continuous Petroleum System STACK/Merge Attributes N • Stacked reservoirs proximal to the world-class Woodford source rock • Efficient hydrocarbon stratigraphic trap creates a continuous petroleum STACK system • Play attributes are identical – only rock thickness and GOR vary Merge • Merge represents intersection of historical SCOOP/STACK Play S outlines Garfield Kingfisher Canadian STACK Merge NYSE: CHAP N S 10
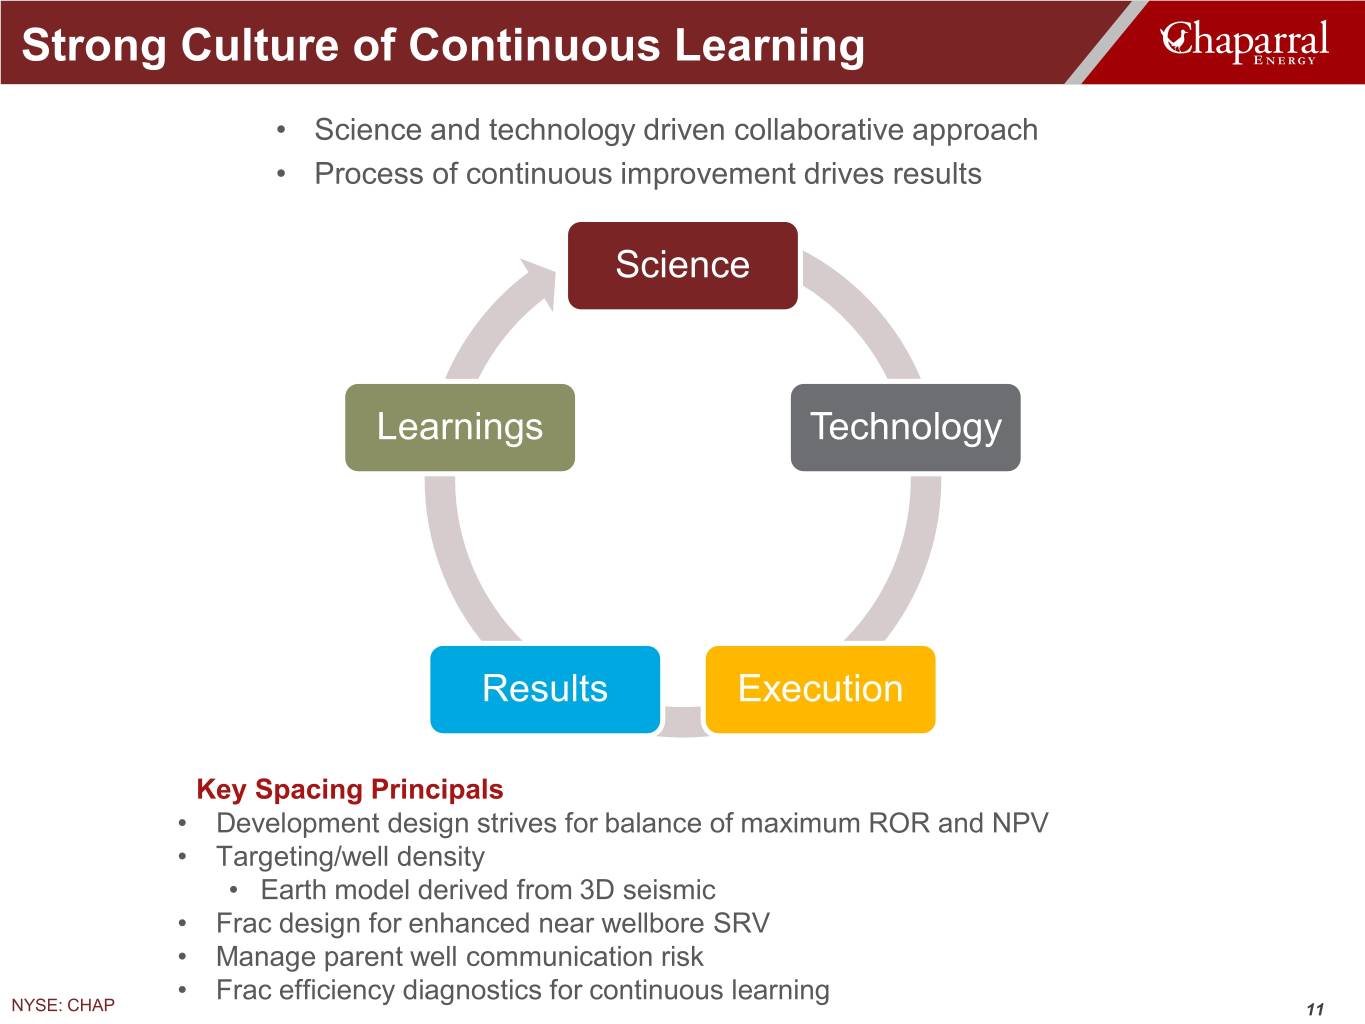
Strong Culture of Continuous Learning • Science and technology driven collaborative approach • Process of continuous improvement drives results Science Learnings Technology Results Execution Key Spacing Principals • Development design strives for balance of maximum ROR and NPV • Targeting/well density • Earth model derived from 3D seismic • Frac design for enhanced near wellbore SRV • Manage parent well communication risk • Frac efficiency diagnostics for continuous learning NYSE: CHAP 11
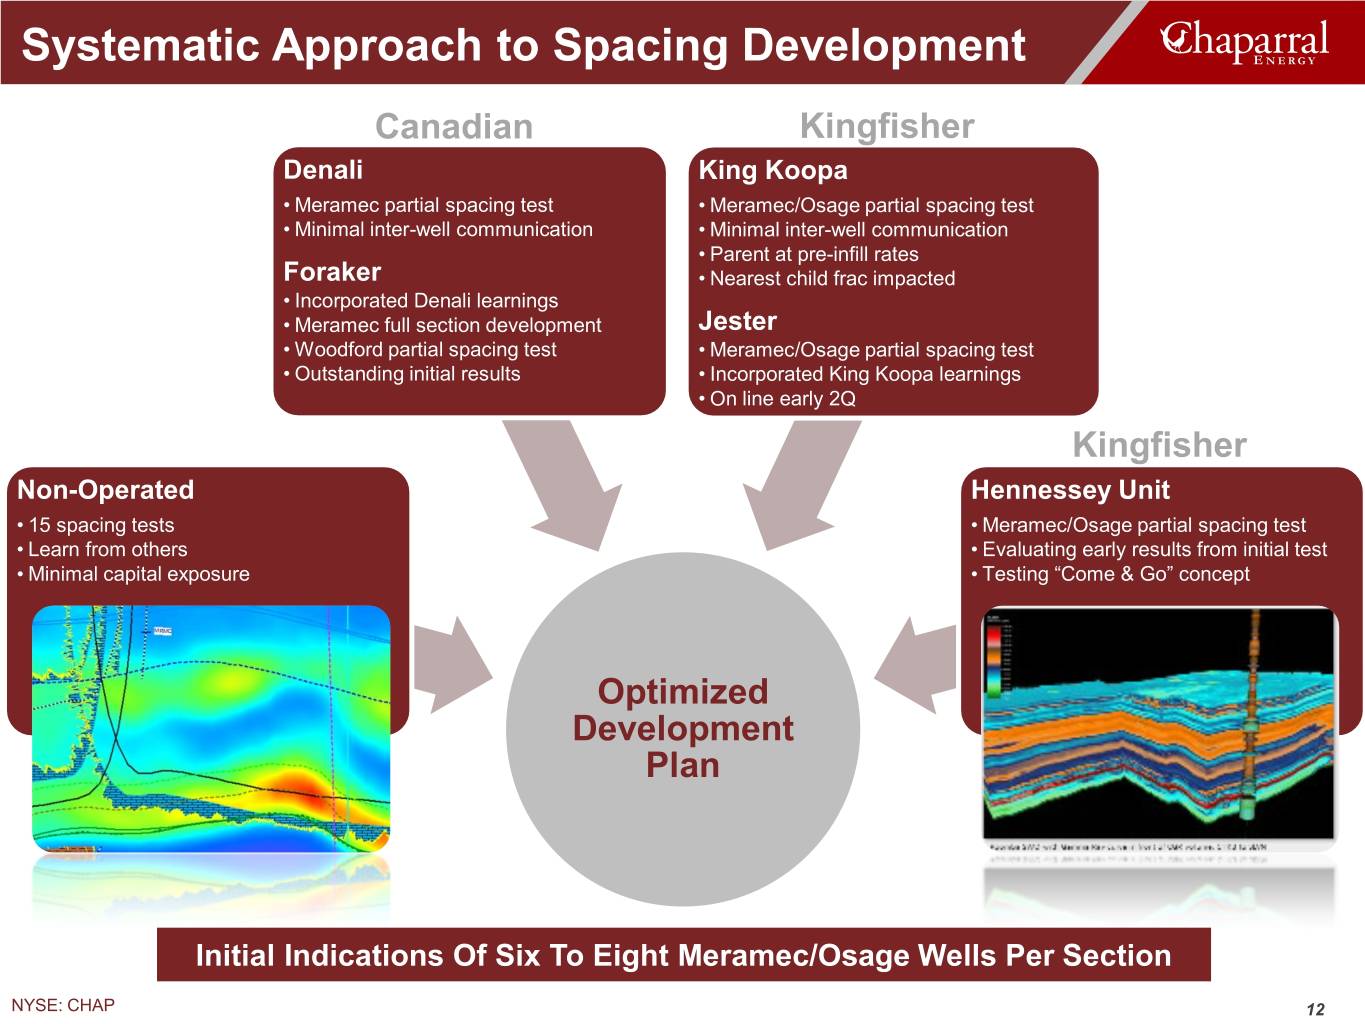
Systematic Approach to Spacing Development Canadian Kingfisher Denali King Koopa • Meramec partial spacing test • Meramec/Osage partial spacing test • Minimal inter-well communication • Minimal inter-well communication • Parent at pre-infill rates Foraker • Nearest child frac impacted • Incorporated Denali learnings • Meramec full section development Jester • Woodford partial spacing test • Meramec/Osage partial spacing test • Outstanding initial results • Incorporated King Koopa learnings • On line early 2Q Kingfisher Non-Operated Hennessey Unit • 15 spacing tests • Meramec/Osage partial spacing test • Learn from others • Evaluating early results from initial test • Minimal capital exposure • Testing “Come & Go” concept Optimized Development Plan Initial Indications Of Six To Eight Meramec/Osage Wells Per Section NYSE: CHAP 12
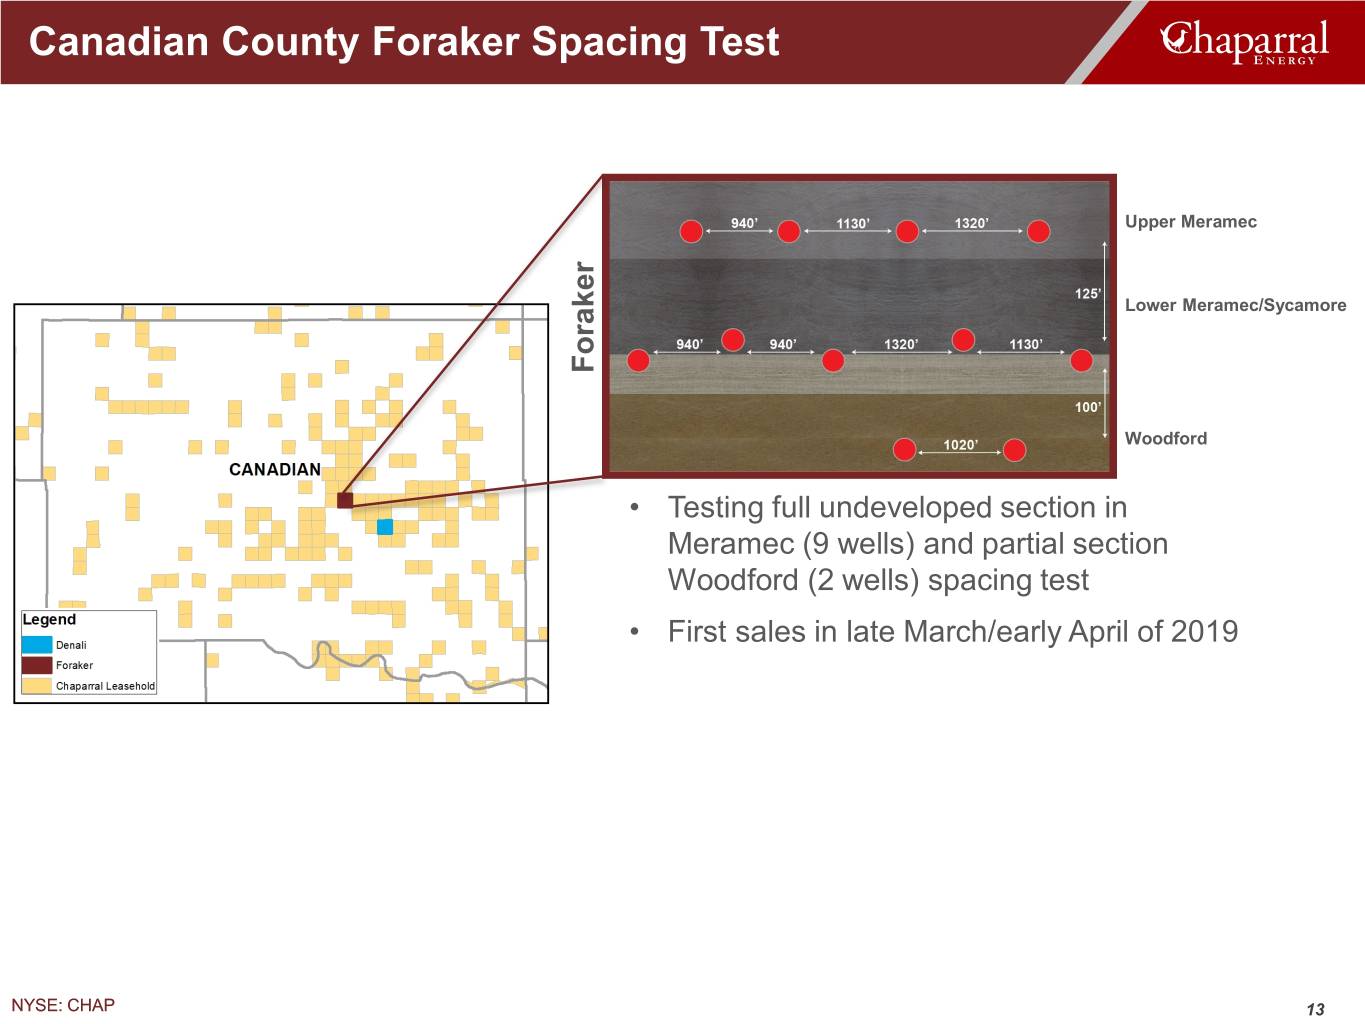
Canadian County Foraker Spacing Test Upper Meramec Lower Meramec/Sycamore Foraker Woodford • Testing full undeveloped section in Meramec (9 wells) and partial section Woodford (2 wells) spacing test • First sales in late March/early April of 2019 NYSE: CHAP 13
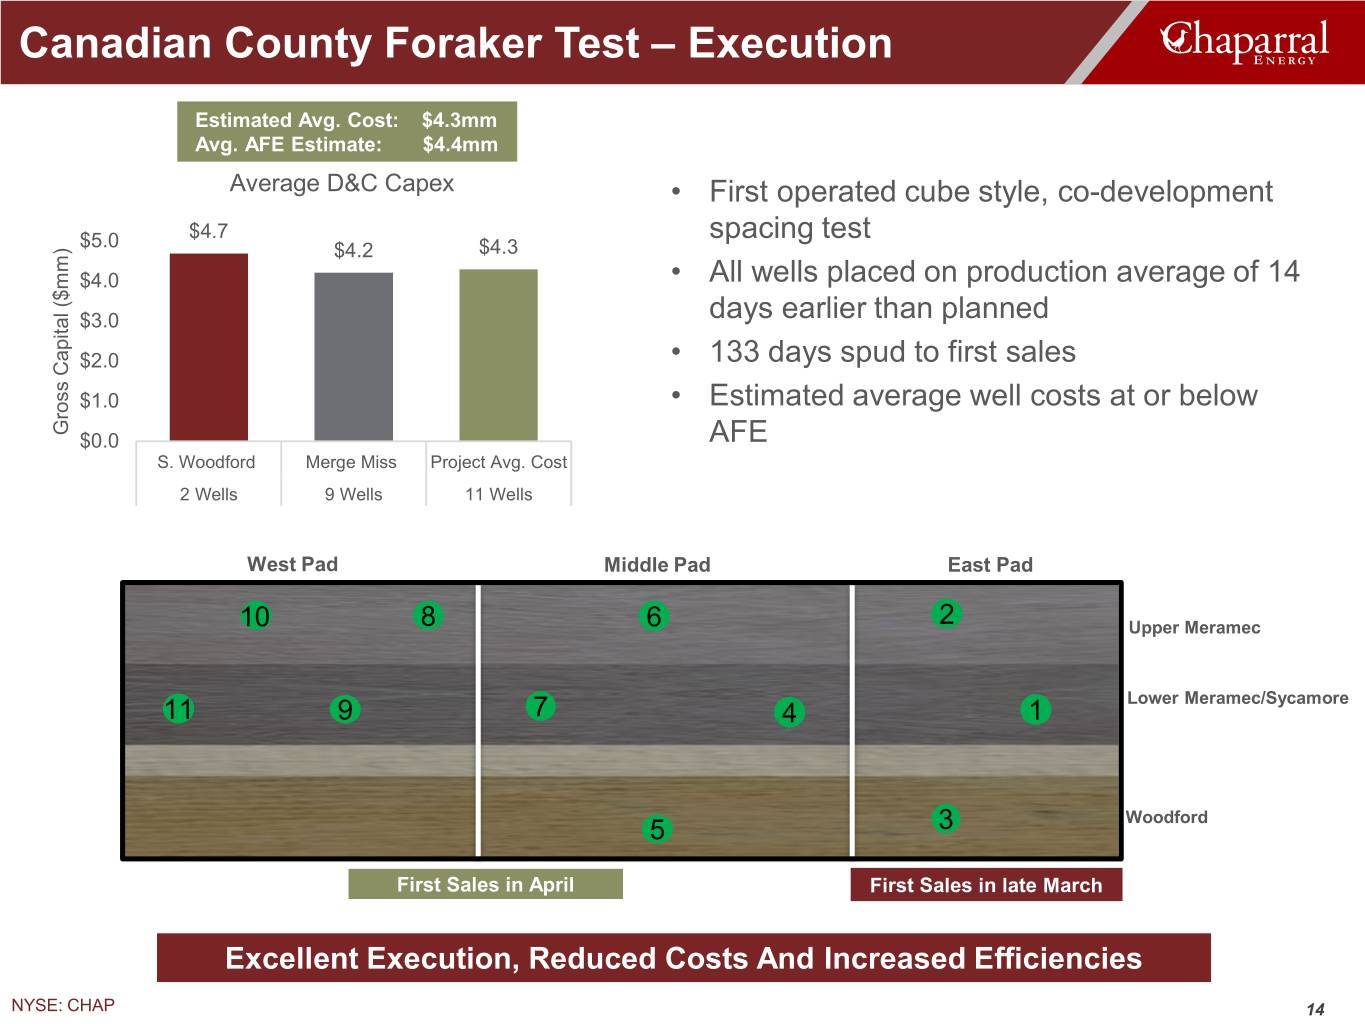
Canadian County Foraker Test – Execution Estimated Avg. Cost: $4.3mm Avg. AFE Estimate: $4.4mm Average D&C Capex • First operated cube style, co-development $4.7 spacing test $5.0 $4.2 $4.3 $4.0 • All wells placed on production average of 14 $3.0 days earlier than planned $2.0 • 133 days spud to first sales $1.0 • Estimated average well costs at or below Gross Capital ($mm) $0.0 AFE S. Woodford Merge Miss Project Avg. Cost 2 Wells 9 Wells 11 Wells West Pad Middle Pad East Pad 10 8 6 2 Upper Meramec Lower Meramec/Sycamore 11 9 7 4 1 5 3 Woodford First Sales in April First Sales in late March Excellent Execution, Reduced Costs And Increased Efficiencies NYSE: CHAP 14
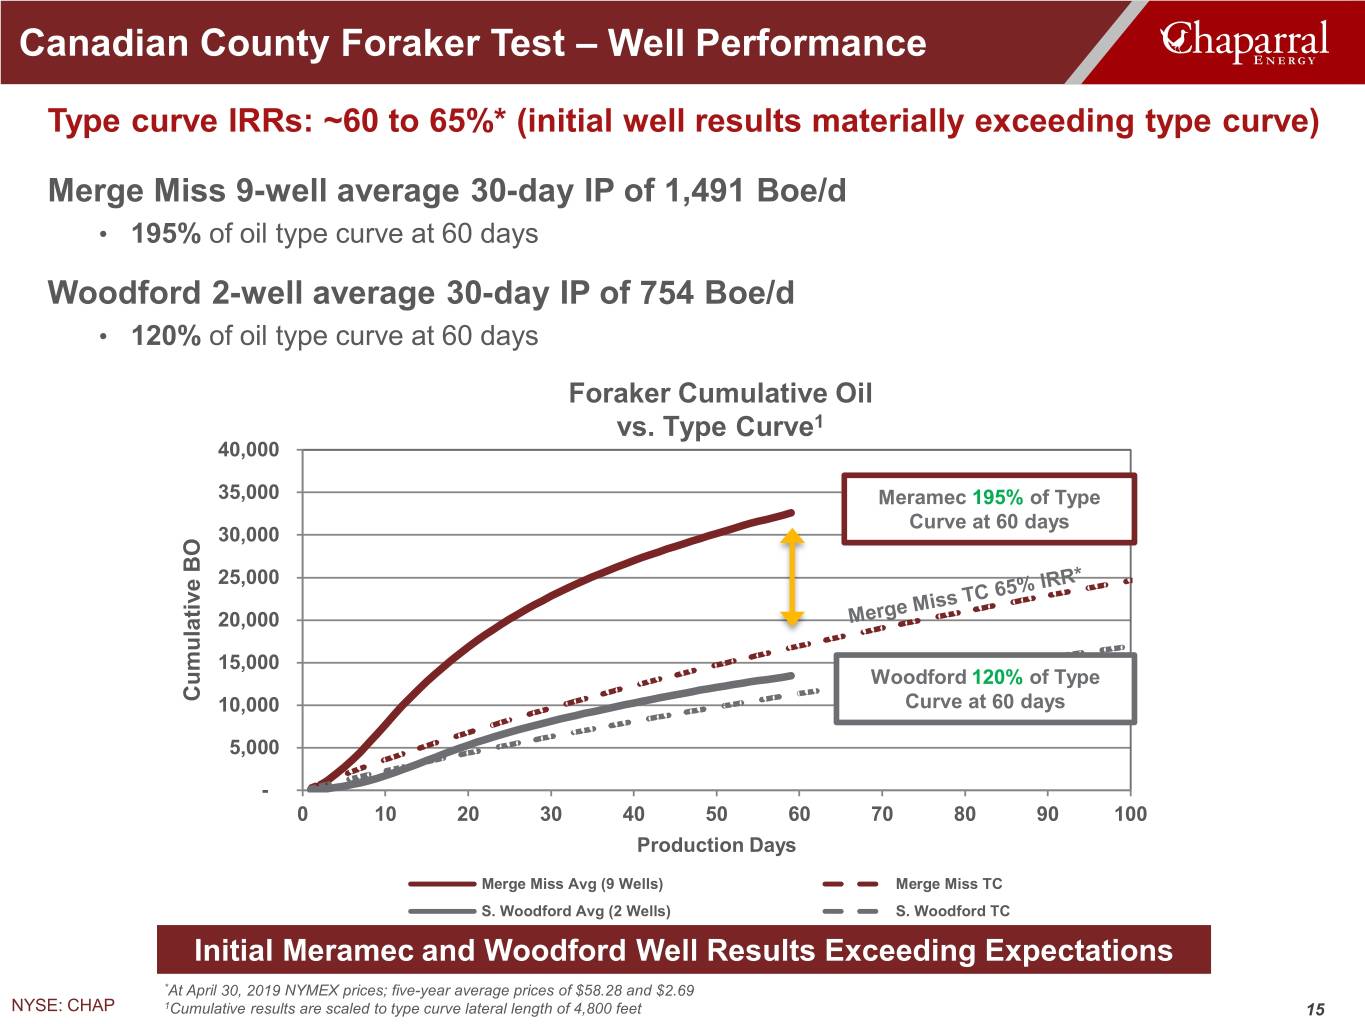
Canadian County Foraker Test – Well Performance Type curve IRRs: ~60 to 65%* (initial well results materially exceeding type curve) Merge Miss 9-well average 30-day IP of 1,491 Boe/d • 195% of oil type curve at 60 days Woodford 2-well average 30-day IP of 754 Boe/d • 120% of oil type curve at 60 days Foraker Cumulative Oil vs. Type Curve1 40,000 35,000 Meramec 195% of Type Curve at 60 days 30,000 25,000 20,000 15,000 Woodford 120% of Type Cumulative BO Cumulative 10,000 Curve at 60 days 5,000 - 0 10 20 30 40 50 60 70 80 90 100 Production Days Merge Miss Avg (9 Wells) Merge Miss TC S. Woodford Avg (2 Wells) S. Woodford TC Initial Meramec and Woodford Well Results Exceeding Expectations *At April 30, 2019 NYMEX prices; five-year average prices of $58.28 and $2.69 NYSE: CHAP 1Cumulative results are scaled to type curve lateral length of 4,800 feet 15
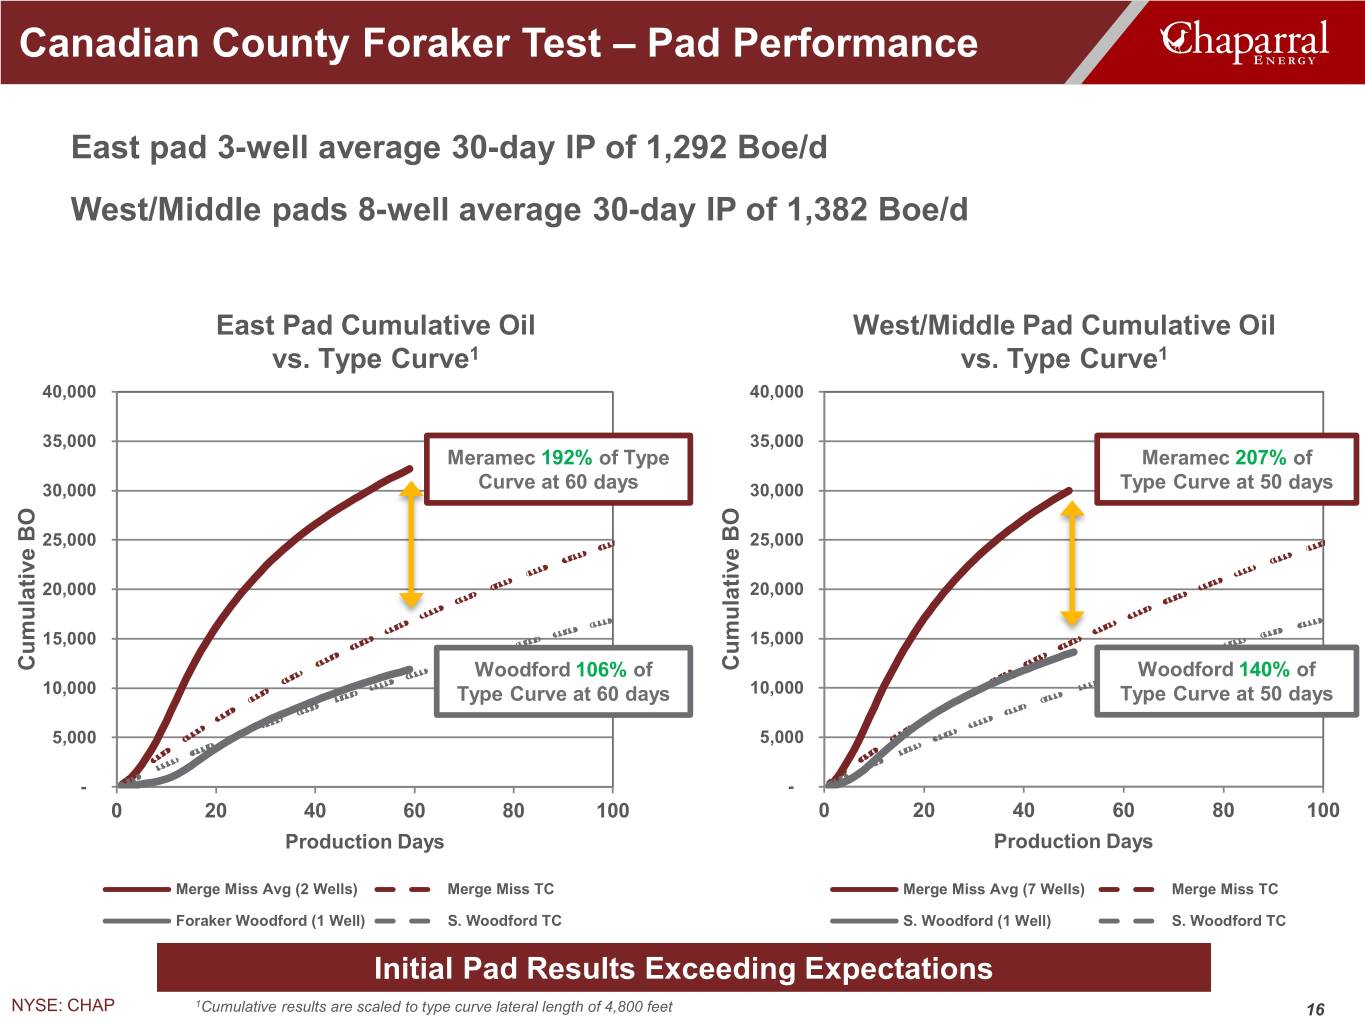
Canadian County Foraker Test – Pad Performance East pad 3-well average 30-day IP of 1,292 Boe/d West/Middle pads 8-well average 30-day IP of 1,382 Boe/d East Pad Cumulative Oil West/Middle Pad Cumulative Oil vs. Type Curve1 vs. Type Curve1 40,000 40,000 35,000 35,000 Meramec 192% of Type Meramec 207% of 30,000 Curve at 60 days 30,000 Type Curve at 50 days 25,000 25,000 20,000 20,000 15,000 15,000 Cumulative BO Cumulative Cumulative BO Cumulative Woodford 106% of Woodford 140% of 10,000 Type Curve at 60 days 10,000 Type Curve at 50 days 5,000 5,000 - - 0 20 40 60 80 100 0 20 40 60 80 100 Production Days Production Days Merge Miss Avg (2 Wells) Merge Miss TC Merge Miss Avg (7 Wells) Merge Miss TC Foraker Woodford (1 Well) S. Woodford TC S. Woodford (1 Well) S. Woodford TC Initial Pad Results Exceeding Expectations NYSE: CHAP 1Cumulative results are scaled to type curve lateral length of 4,800 feet 16

Canadian County Denali Spacing Test Upper Meramec Lower Meramec/Sycamore Denali Denali Woodford • Meramec 3-well partial spacing test in undeveloped section (first sales in Q3 2018) • Drilled in two targets of the Meramec and implies approximately 4 wells per drillable target or 8-9 wells per section spacing for the Meramec NYSE: CHAP 17
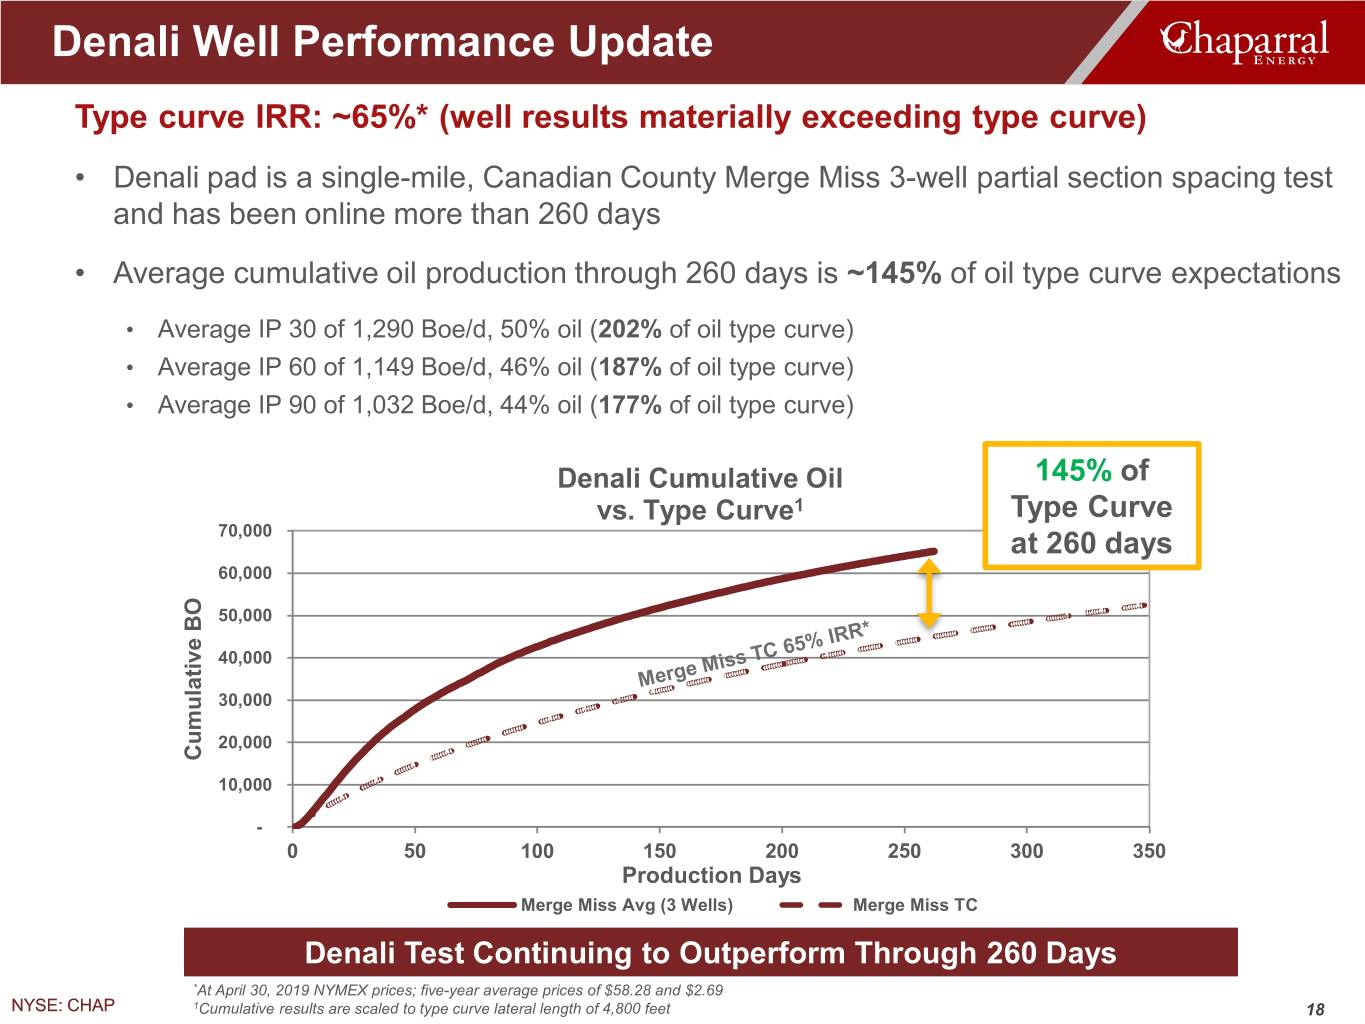
Denali Well Performance Update Type curve IRR: ~65%* (well results materially exceeding type curve) • Denali pad is a single-mile, Canadian County Merge Miss 3-well partial section spacing test and has been online more than 260 days • Average cumulative oil production through 260 days is ~145% of oil type curve expectations • Average IP 30 of 1,290 Boe/d, 50% oil (202% of oil type curve) • Average IP 60 of 1,149 Boe/d, 46% oil (187% of oil type curve) • Average IP 90 of 1,032 Boe/d, 44% oil (177% of oil type curve) Denali Cumulative Oil 145% of vs. Type Curve1 Type Curve 70,000 at 260 days 60,000 50,000 40,000 30,000 20,000 Cumulative BO Cumulative 10,000 - 0 50 100 150 200 250 300 350 Production Days Merge Miss Avg (3 Wells) Merge Miss TC Denali Test Continuing to Outperform Through 260 Days *At April 30, 2019 NYMEX prices; five-year average prices of $58.28 and $2.69 NYSE: CHAP 1Cumulative results are scaled to type curve lateral length of 4,800 feet 18

STACK/Merge Overview STACK/Merge Production 25 23.0 23.0 21.5 20 21.0 15 14.5 MBoe/d 10 9.5 5 7.3 0 2016 2017 2018 FY 2019E STACK Production Guidance Range Q2 2019 Guidance (Low) Q2 2019 Guidance (High) Chaparral STACK/Merge Position • 132,000 net acres • 143 operated horizontal wells as of Q1 2019 • Excellent Merge acreage ~100% held-by-production Positive Well Performance Driving Production Growth 1 Based on midpoint of 2019 production guidance NYSE: CHAP 19
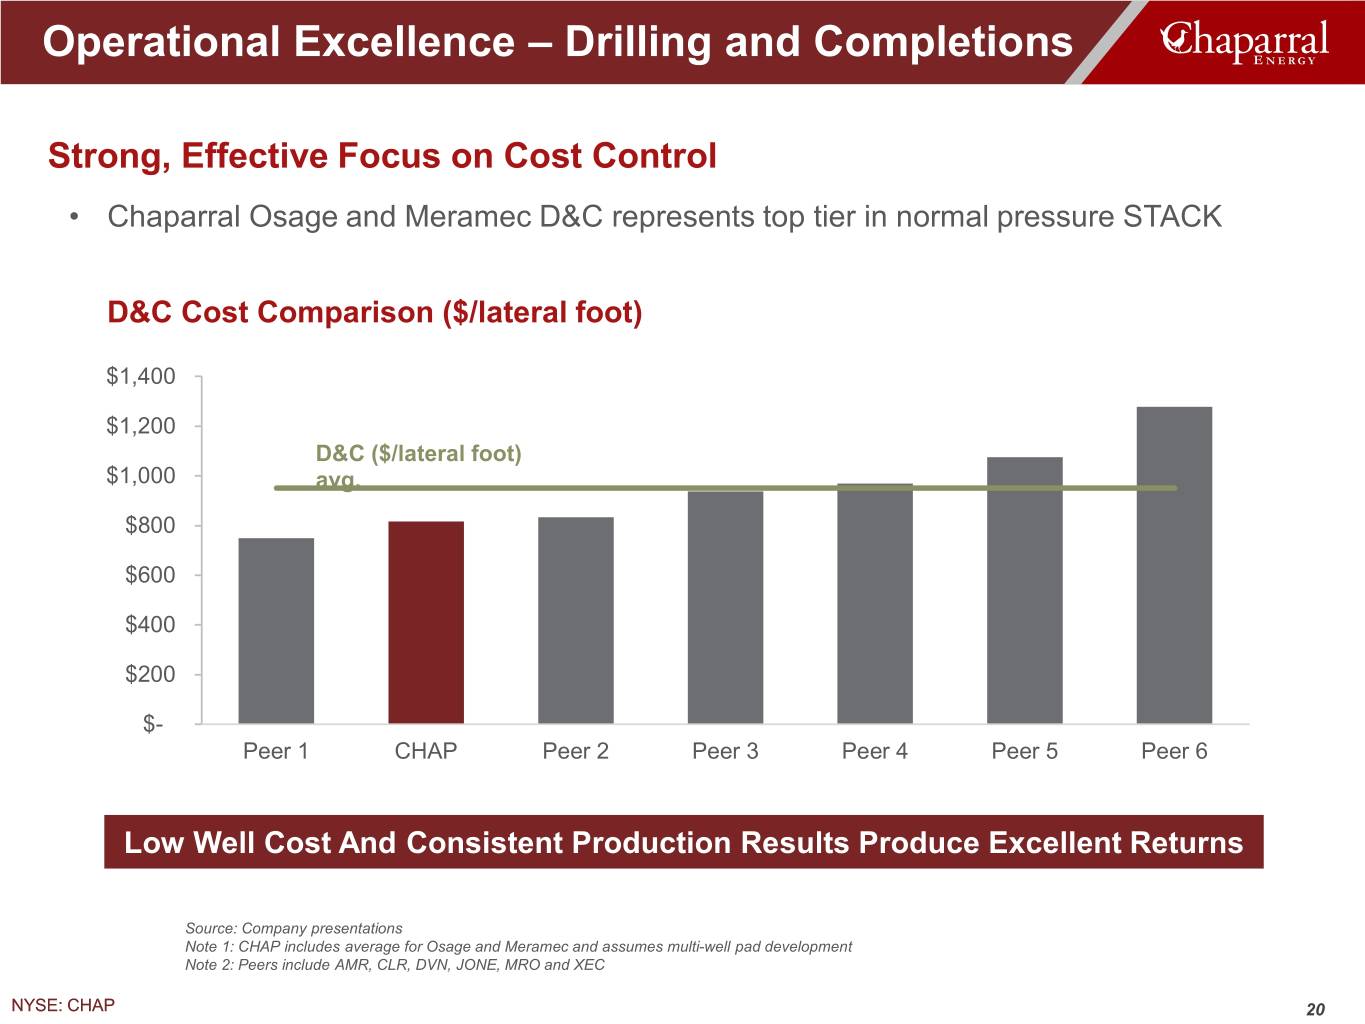
Operational Excellence – Drilling and Completions Strong, Effective Focus on Cost Control • Chaparral Osage and Meramec D&C represents top tier in normal pressure STACK D&C Cost Comparison ($/lateral foot) $1,400 $1,200 D&C ($/lateral foot) $1,000 avg. $800 $600 $400 $200 $- Peer 1 CHAP Peer 2 Peer 3 Peer 4 Peer 5 Peer 6 Low Well Cost And Consistent Production Results Produce Excellent Returns Source: Company presentations Note 1: CHAP includes average for Osage and Meramec and assumes multi-well pad development Note 2: Peers include AMR, CLR, DVN, JONE, MRO and XEC NYSE: CHAP 20
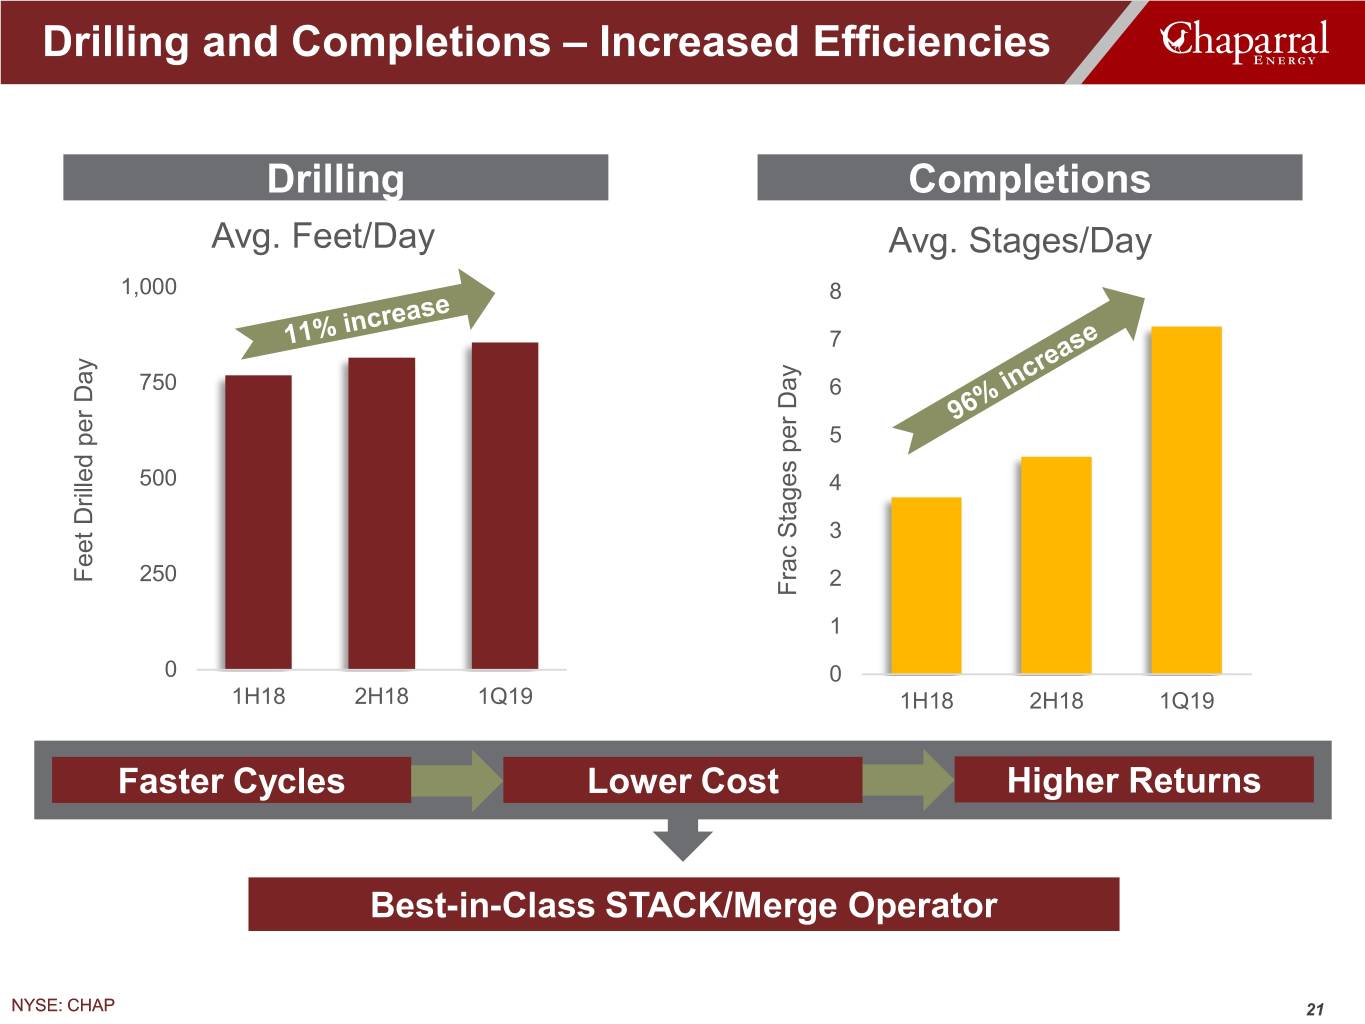
Drilling and Completions – Increased Efficiencies Drilling Completions Avg. Feet/Day Avg. Stages/Day 1,000 8 7 750 6 5 500 4 3 Feet Drilled per Day 250 2 FracStages per Day 1 0 0 1H18 2H18 1Q19 1H18 2H18 1Q19 Faster Cycles Lower Cost Higher Returns Best-in-Class STACK/Merge Operator NYSE: CHAP 21
Financial Overview NYSE: CHAP 22
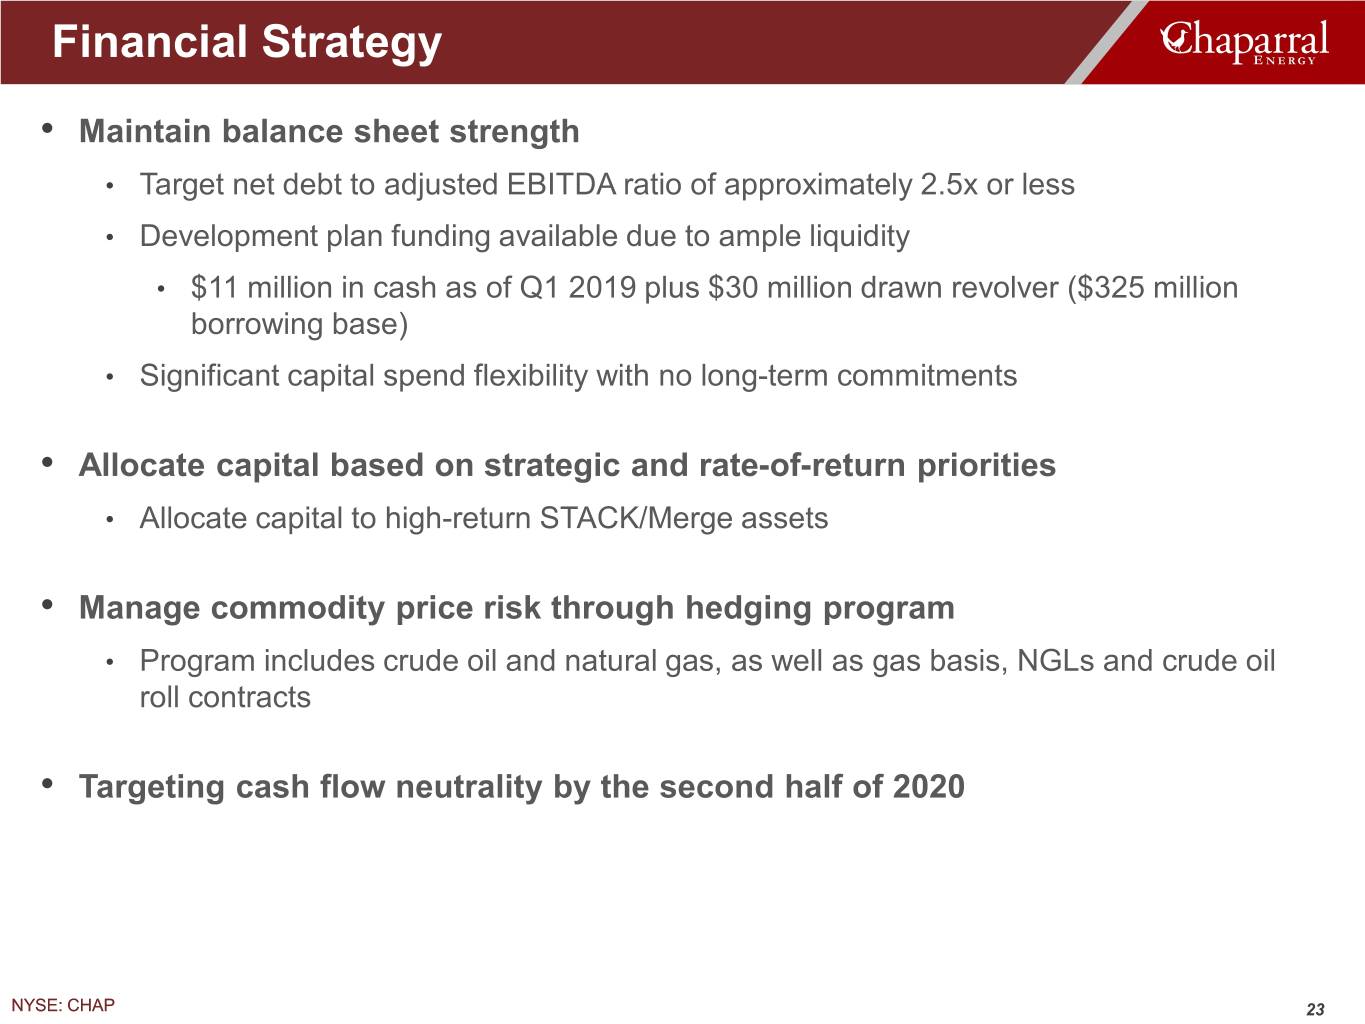
Financial Strategy • Maintain balance sheet strength • Target net debt to adjusted EBITDA ratio of approximately 2.5x or less • Development plan funding available due to ample liquidity • $11 million in cash as of Q1 2019 plus $30 million drawn revolver ($325 million borrowing base) • Significant capital spend flexibility with no long-term commitments • Allocate capital based on strategic and rate-of-return priorities • Allocate capital to high-return STACK/Merge assets • Manage commodity price risk through hedging program • Program includes crude oil and natural gas, as well as gas basis, NGLs and crude oil roll contracts • Targeting cash flow neutrality by the second half of 2020 NYSE: CHAP 23

Financial Position and Liquidity Highlights Chaparral Liquidity • $325 million borrowing base ($ in Millions) reaffirmed in spring 2019 Actual Q1 2019 redetermination Cash and Cash Equivalents $11 • Closed on $300 million senior Revolving Credit Facility due Dec. 2022 $30 unsecured notes offering in June Other $20 2018 Senior Notes $300 • Develop long runway to unlock Total Debt $350 value of deep STACK/Merge drilling inventory Net Debt $339 Borrowing Base Amount $325 • No maturities until 2022 Chaparral Debt Maturity Schedule $500 $400 $325 $300 $300 No maturities until 2022 $200 Debt ($mm) Debt $100 $- 2019 2020 2021 2022 2023 2024 2025 2025+ Senior Notes Drawn Revolver1 Undrawn Revolver NYSE: CHAP 1As of May 7, 2019 cash & cash equivalents was $42 million and revolving credit facility balance was $85 million 24
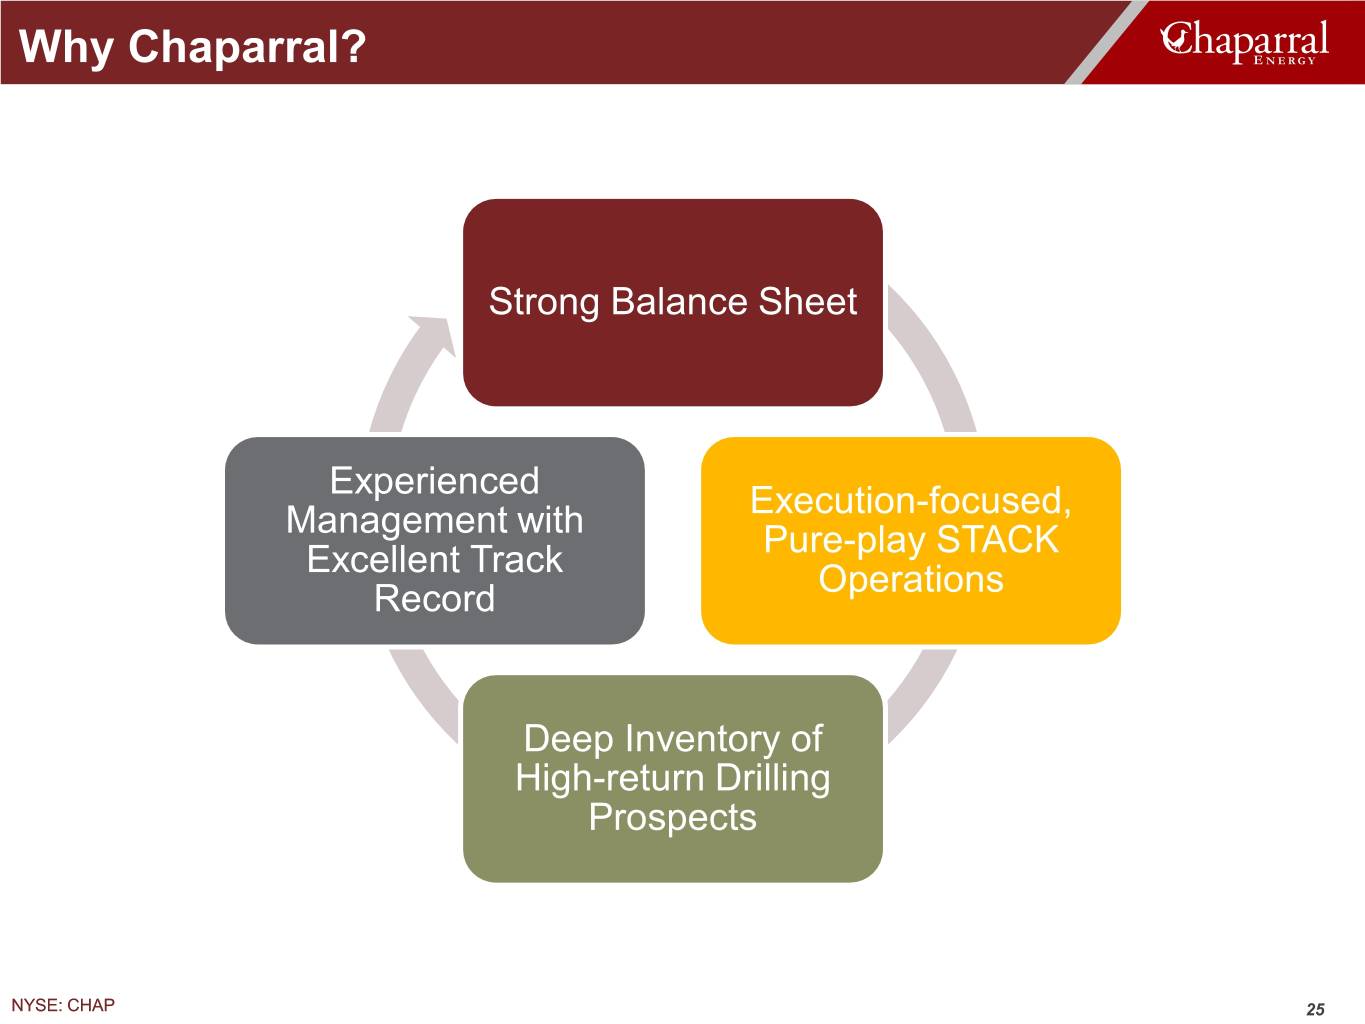
Why Chaparral? Strong Balance Sheet Experienced Execution-focused, Management with Pure-play STACK Excellent Track Operations Record Deep Inventory of High-return Drilling Prospects NYSE: CHAP 25

Appendix NYSE: CHAP 26
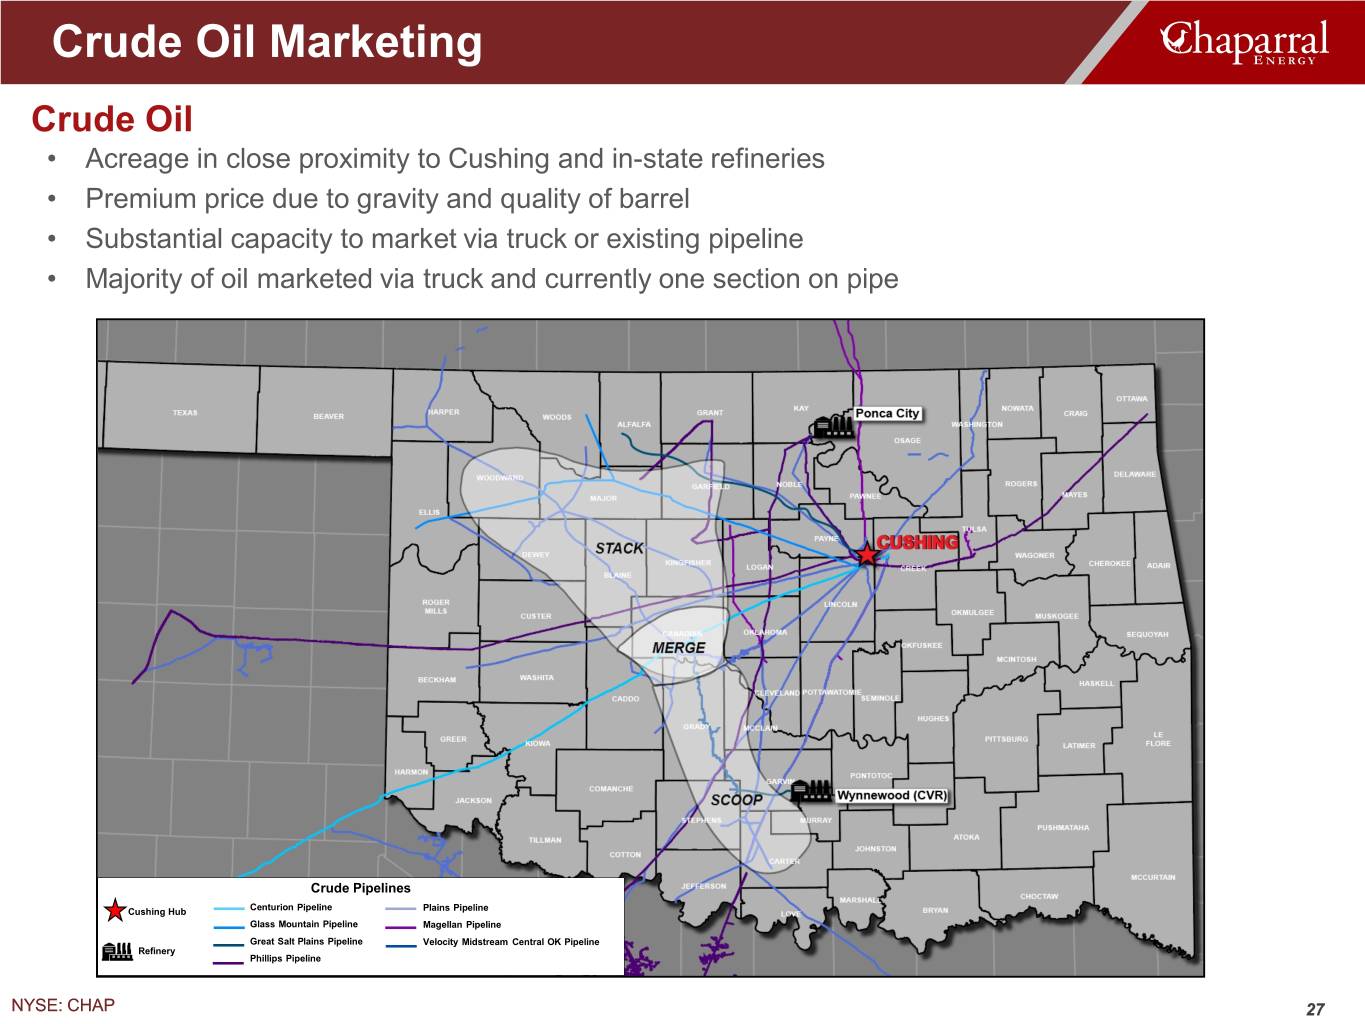
Crude Oil Marketing Crude Oil • Acreage in close proximity to Cushing and in-state refineries • Premium price due to gravity and quality of barrel • Substantial capacity to market via truck or existing pipeline • Majority of oil marketed via truck and currently one section on pipe Crude Pipelines Cushing Hub Centurion Pipeline Plains Pipeline Glass Mountain Pipeline Magellan Pipeline Great Salt Plains Pipeline Velocity Midstream Central OK Pipeline Refinery Phillips Pipeline NYSE: CHAP 27

Natural Gas & NGL Marketing Natural Gas and NGL • Midstream super system, with multiple plants and residue outlets • Residue and NGL agreements with midstream operators who have firm transportation • Approximately 50/50 NGL markets and pricing split between Conway and Mt. Belvieu • Incremental capacity of 1.4 Bcf/d to Gulf Coast markets expected in Q4 2019 (Midship) NYSE: CHAP 28
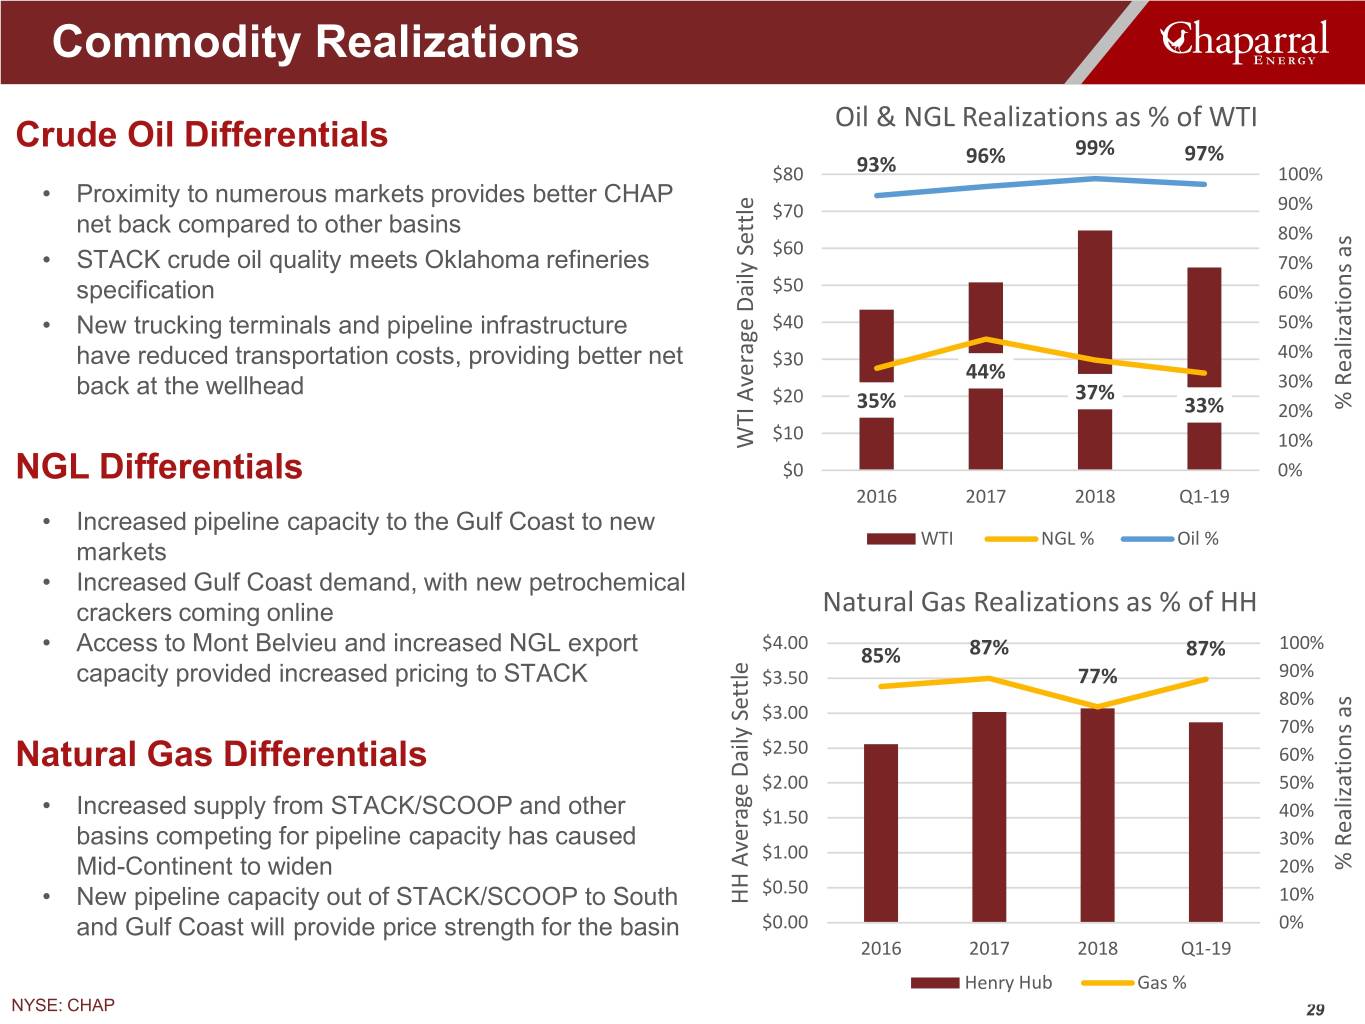
Commodity Realizations Oil & NGL Realizations as % of WTI Crude Oil Differentials 96% 99% 97% $80 93% 100% • Proximity to numerous markets provides better CHAP $70 90% net back compared to other basins 80% $60 • STACK crude oil quality meets Oklahoma refineries 70% specification $50 60% • New trucking terminals and pipeline infrastructure $40 50% have reduced transportation costs, providing better net $30 40% 44% 30% back at the wellhead $20 37% 35% 33% 20% as Realizations % $10 WTI Average Daily Settle DailyWTI Average 10% NGL Differentials $0 0% 2016 2017 2018 Q1-19 • Increased pipeline capacity to the Gulf Coast to new WTI NGL % Oil % markets • Increased Gulf Coast demand, with new petrochemical crackers coming online Natural Gas Realizations as % of HH • Access to Mont Belvieu and increased NGL export $4.00 87% 100% 85% 87% capacity provided increased pricing to STACK $3.50 77% 90% 80% $3.00 70% Natural Gas Differentials $2.50 60% $2.00 50% • Increased supply from STACK/SCOOP and other $1.50 40% basins competing for pipeline capacity has caused 30% $1.00 Mid-Continent to widen 20% as Realizations % $0.50 • New pipeline capacity out of STACK/SCOOP to South HH Average Daily Settle 10% and Gulf Coast will provide price strength for the basin $0.00 0% 2016 2017 2018 Q1-19 Henry Hub Gas % NYSE: CHAP 29
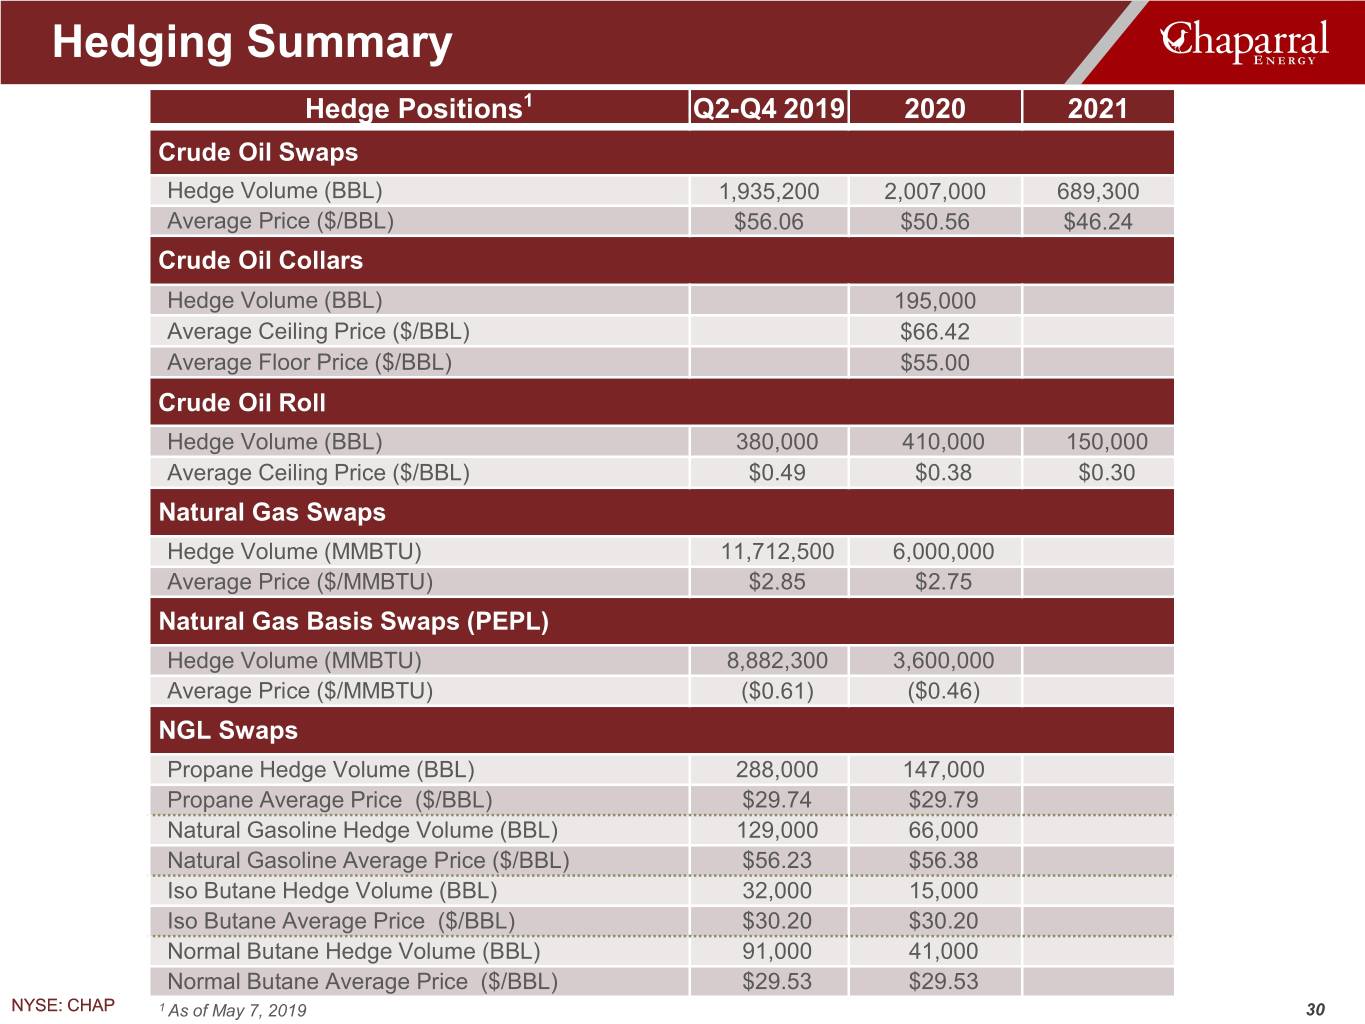
Hedging Summary Hedge Positions1 Q2-Q4 2019 2020 2021 Crude Oil Swaps Hedge Volume (BBL) 1,935,200 2,007,000 689,300 Average Price ($/BBL) $56.06 $50.56 $46.24 Crude Oil Collars Hedge Volume (BBL) 195,000 Average Ceiling Price ($/BBL) $66.42 Average Floor Price ($/BBL) $55.00 Crude Oil Roll Hedge Volume (BBL) 380,000 410,000 150,000 Average Ceiling Price ($/BBL) $0.49 $0.38 $0.30 Natural Gas Swaps Hedge Volume (MMBTU) 11,712,500 6,000,000 Average Price ($/MMBTU) $2.85 $2.75 Natural Gas Basis Swaps (PEPL) Hedge Volume (MMBTU) 8,882,300 3,600,000 Average Price ($/MMBTU) ($0.61) ($0.46) NGL Swaps Propane Hedge Volume (BBL) 288,000 147,000 Propane Average Price ($/BBL) $29.74 $29.79 Natural Gasoline Hedge Volume (BBL) 129,000 66,000 Natural Gasoline Average Price ($/BBL) $56.23 $56.38 Iso Butane Hedge Volume (BBL) 32,000 15,000 Iso Butane Average Price ($/BBL) $30.20 $30.20 Normal Butane Hedge Volume (BBL) 91,000 41,000 Normal Butane Average Price ($/BBL) $29.53 $29.53 NYSE: CHAP 1 As of May 7, 2019 30
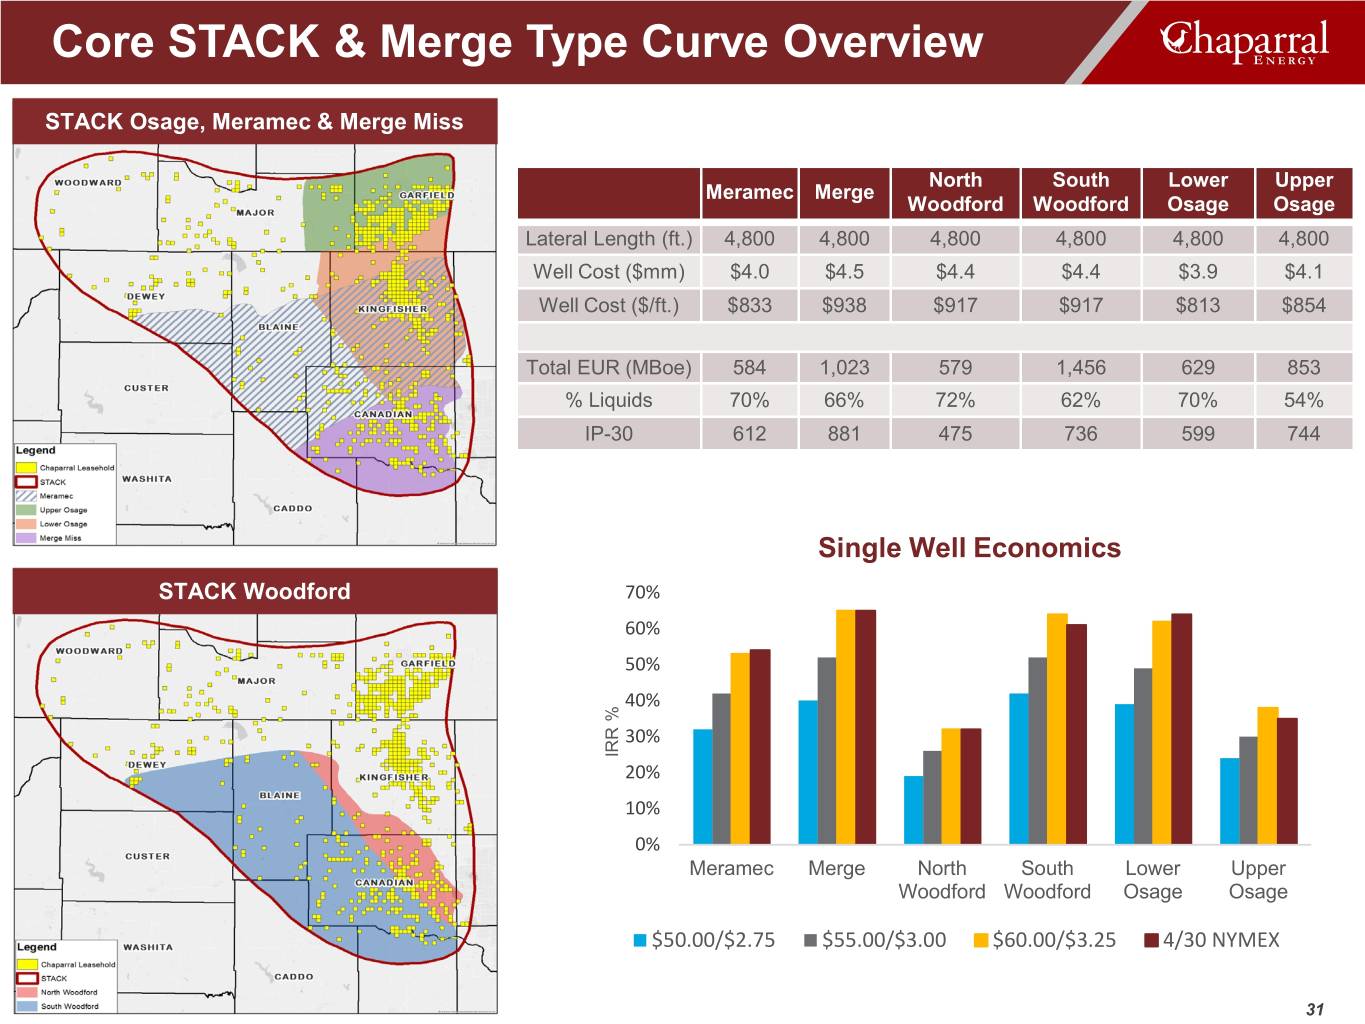
Core STACK & Merge Type Curve Overview STACK Osage, Meramec & Merge Miss North South Lower Upper Meramec Merge Woodford Woodford Osage Osage Lateral Length (ft.) 4,800 4,800 4,800 4,800 4,800 4,800 Well Cost ($mm) $4.0 $4.5 $4.4 $4.4 $3.9 $4.1 Well Cost ($/ft.) $833 $938 $917 $917 $813 $854 Total EUR (MBoe) 584 1,023 579 1,456 629 853 % Liquids 70% 66% 72% 62% 70% 54% IP-30 612 881 475 736 599 744 Single Well Economics STACK Woodford 70% 60% 50% 40% 30% IRR % IRR 20% 10% 0% Meramec Merge North South Lower Upper Woodford Woodford Osage Osage $50.00/$2.75 $55.00/$3.00 $60.00/$3.25 4/30 NYMEX NYSE: CHAP 31
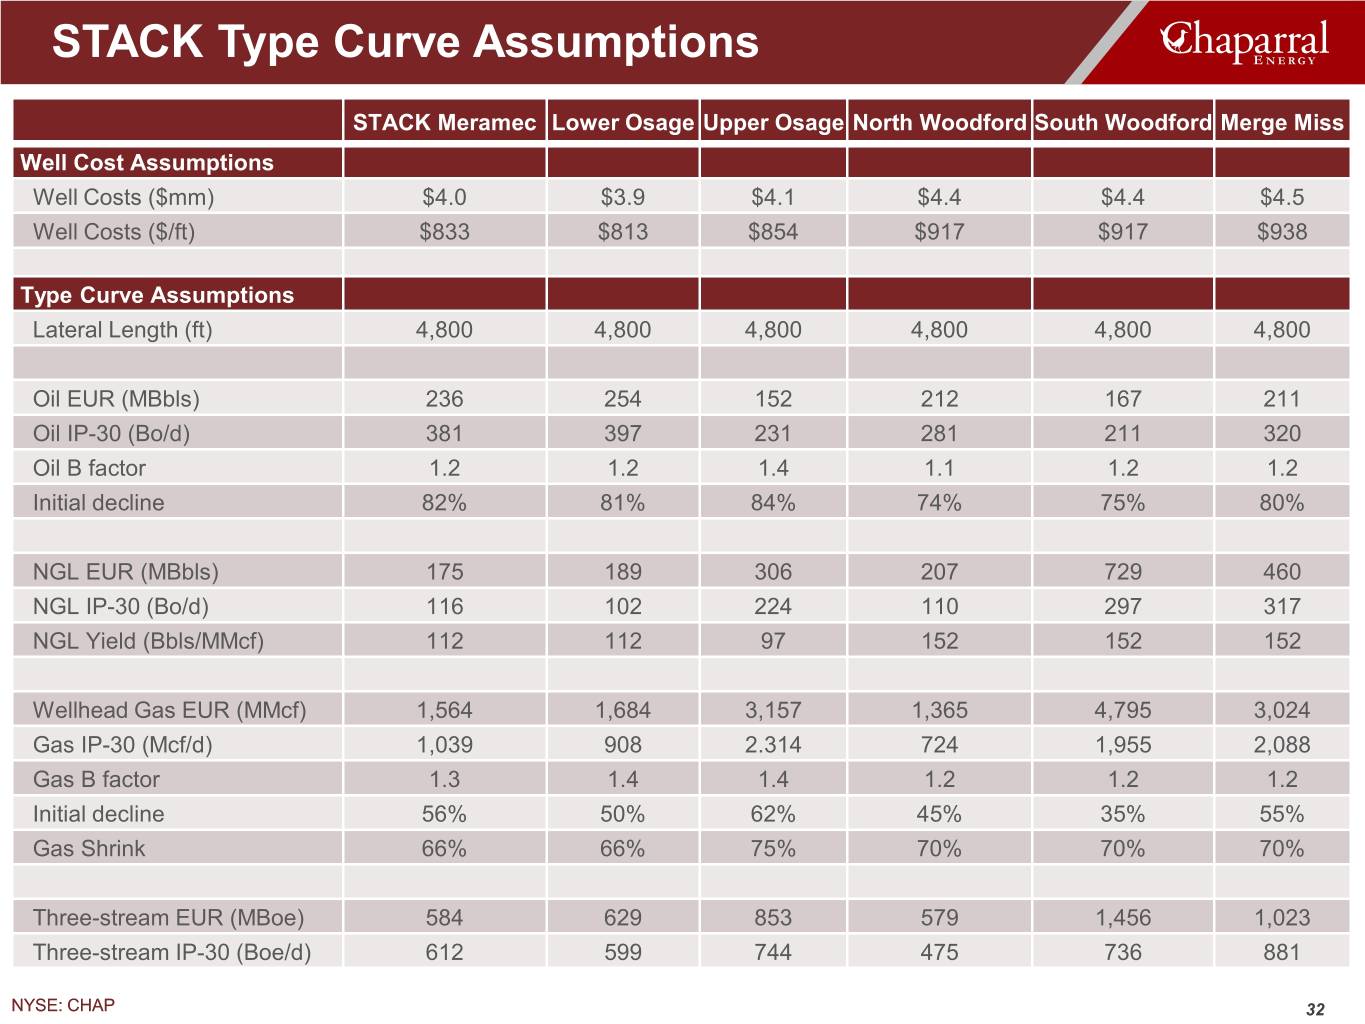
STACK Type Curve Assumptions STACK Meramec Lower Osage Upper Osage North Woodford South Woodford Merge Miss Well Cost Assumptions Well Costs ($mm) $4.0 $3.9 $4.1 $4.4 $4.4 $4.5 Well Costs ($/ft) $833 $813 $854 $917 $917 $938 Type Curve Assumptions Lateral Length (ft) 4,800 4,800 4,800 4,800 4,800 4,800 Oil EUR (MBbls) 236 254 152 212 167 211 Oil IP-30 (Bo/d) 381 397 231 281 211 320 Oil B factor 1.2 1.2 1.4 1.1 1.2 1.2 Initial decline 82% 81% 84% 74% 75% 80% NGL EUR (MBbls) 175 189 306 207 729 460 NGL IP-30 (Bo/d) 116 102 224 110 297 317 NGL Yield (Bbls/MMcf) 112 112 97 152 152 152 Wellhead Gas EUR (MMcf) 1,564 1,684 3,157 1,365 4,795 3,024 Gas IP-30 (Mcf/d) 1,039 908 2.314 724 1,955 2,088 Gas B factor 1.3 1.4 1.4 1.2 1.2 1.2 Initial decline 56% 50% 62% 45% 35% 55% Gas Shrink 66% 66% 75% 70% 70% 70% Three-stream EUR (MBoe) 584 629 853 579 1,456 1,023 Three-stream IP-30 (Boe/d) 612 599 744 475 736 881 NYSE: CHAP 32
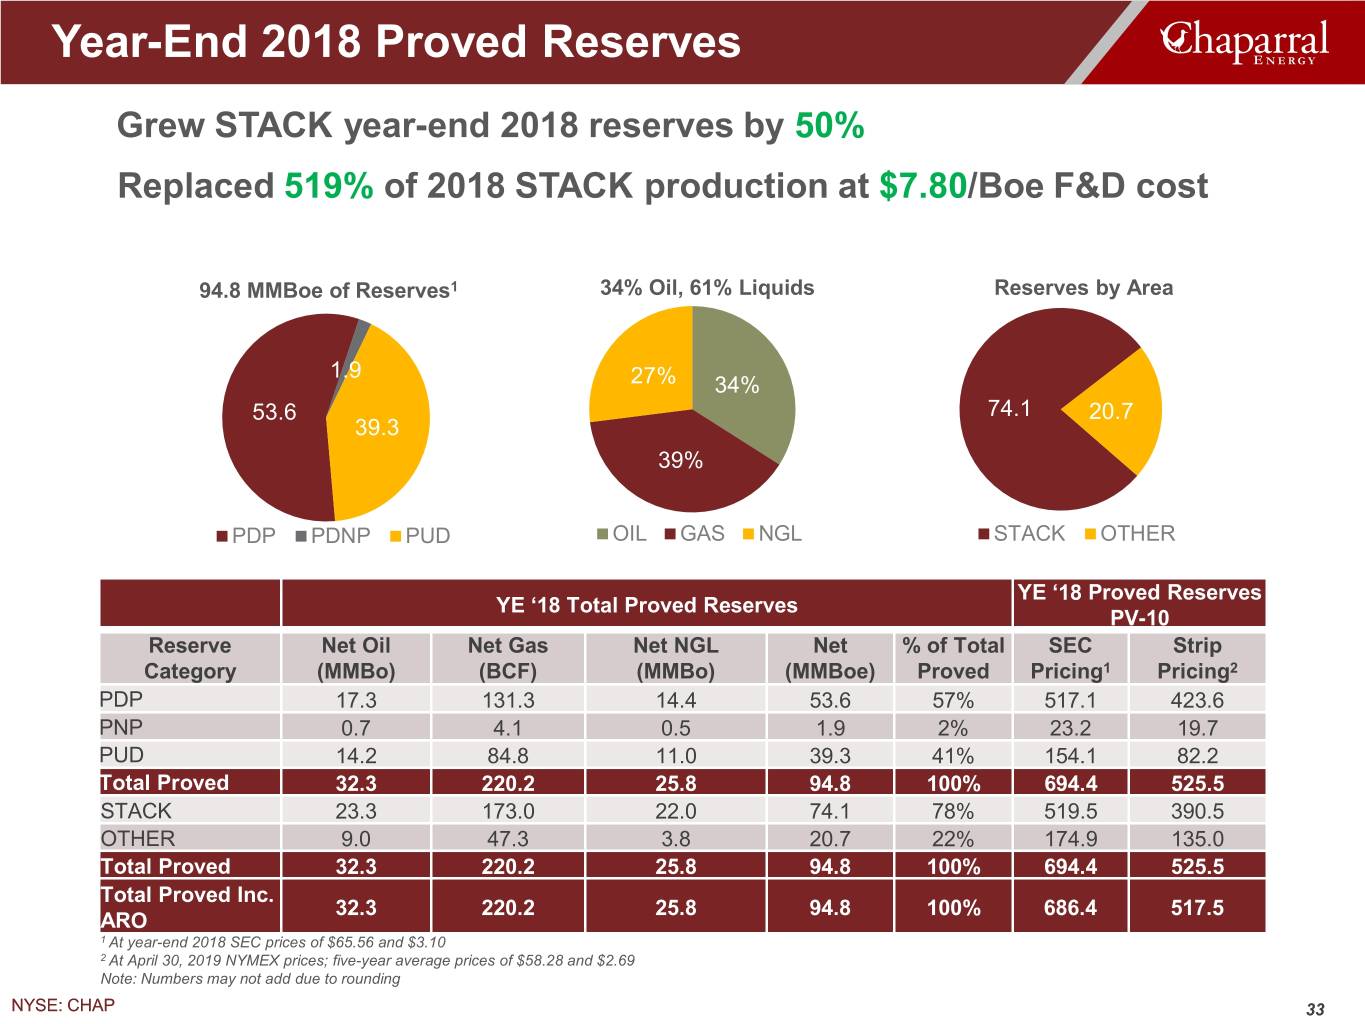
Year-End 2018 Proved Reserves Grew STACK year-end 2018 reserves by 50% Replaced 519% of 2018 STACK production at $7.80/Boe F&D cost 94.8 MMBoe of Reserves1 34% Oil, 61% Liquids Reserves by Area 1.9 27% 34% 53.6 74.1 20.7 39.3 39% PDP PDNP PUD OIL GAS NGL STACK OTHER YE ‘18 Proved Reserves YE ‘18 Total Proved Reserves PV-10 Reserve Net Oil Net Gas Net NGL Net % of Total SEC Strip Category (MMBo) (BCF) (MMBo) (MMBoe) Proved Pricing1 Pricing2 PDP 17.3 131.3 14.4 53.6 57% 517.1 423.6 PNP 0.7 4.1 0.5 1.9 2% 23.2 19.7 PUD 14.2 84.8 11.0 39.3 41% 154.1 82.2 Total Proved 32.3 220.2 25.8 94.8 100% 694.4 525.5 STACK 23.3 173.0 22.0 74.1 78% 519.5 390.5 OTHER 9.0 47.3 3.8 20.7 22% 174.9 135.0 Total Proved 32.3 220.2 25.8 94.8 100% 694.4 525.5 Total Proved Inc. 32.3 220.2 25.8 94.8 100% 686.4 517.5 ARO 1 At year-end 2018 SEC prices of $65.56 and $3.10 2 At April 30, 2019 NYMEX prices; five-year average prices of $58.28 and $2.69 Note: Numbers may not add due to rounding NYSE: CHAP 33
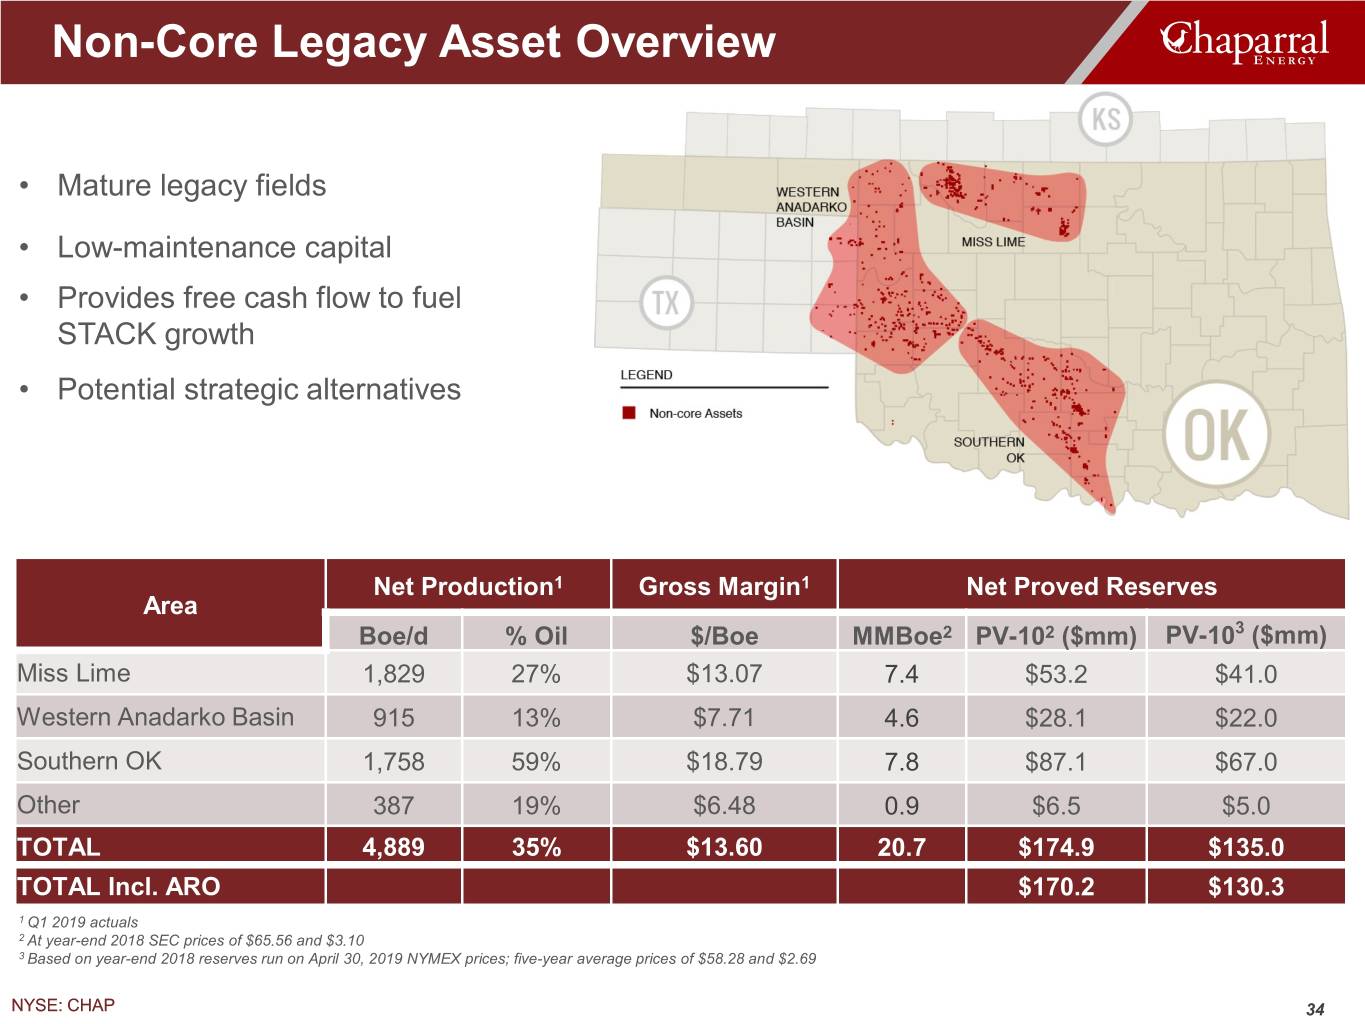
Non-Core Legacy Asset Overview • Mature legacy fields • Low-maintenance capital • Provides free cash flow to fuel STACK growth • Potential strategic alternatives Net Production1 Gross Margin1 Net Proved Reserves Area Boe/d % Oil $/Boe MMBoe2 PV-102 ($mm) PV-103 ($mm) Miss Lime 1,829 27% $13.07 7.4 $53.2 $41.0 Western Anadarko Basin 915 13% $7.71 4.6 $28.1 $22.0 Southern OK 1,758 59% $18.79 7.8 $87.1 $67.0 Other 387 19% $6.48 0.9 $6.5 $5.0 TOTAL 4,889 35% $13.60 20.7 $174.9 $135.0 TOTAL Incl. ARO $170.2 $130.3 1 Q1 2019 actuals 2 At year-end 2018 SEC prices of $65.56 and $3.10 3 Based on year-end 2018 reserves run on April 30, 2019 NYMEX prices; five-year average prices of $58.28 and $2.69 NYSE: CHAP 34
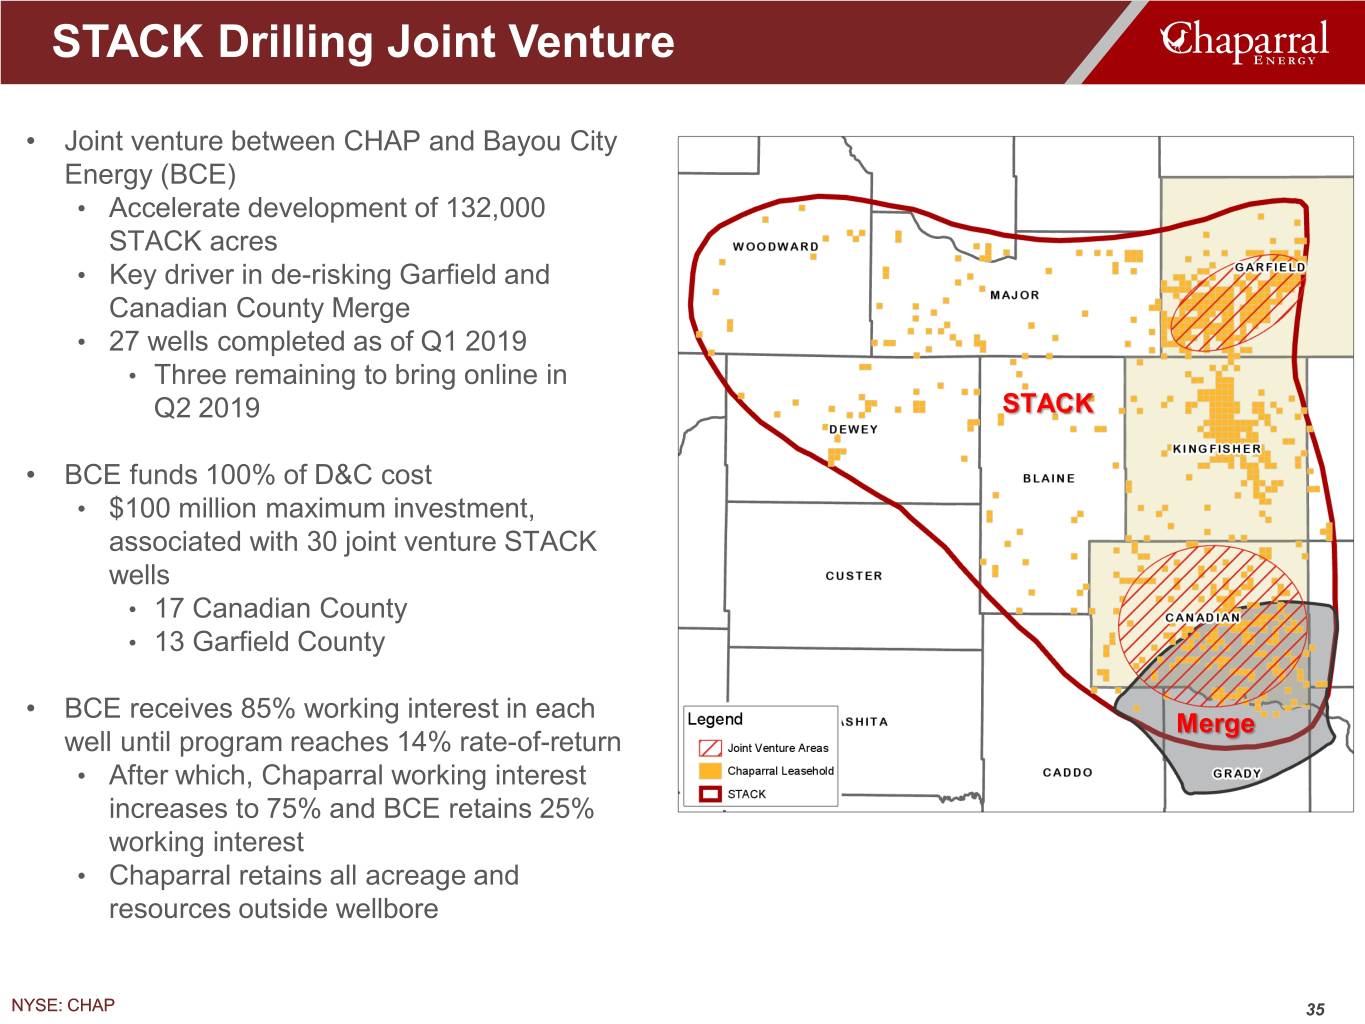
STACK Drilling Joint Venture • Joint venture between CHAP and Bayou City Energy (BCE) • Accelerate development of 132,000 STACK acres • Key driver in de-risking Garfield and Canadian County Merge • 27 wells completed as of Q1 2019 • Three remaining to bring online in Q2 2019 STACK • BCE funds 100% of D&C cost • $100 million maximum investment, associated with 30 joint venture STACK wells • 17 Canadian County • 13 Garfield County • BCE receives 85% working interest in each Merge well until program reaches 14% rate-of-return • After which, Chaparral working interest increases to 75% and BCE retains 25% working interest • Chaparral retains all acreage and resources outside wellbore NYSE: CHAP 35
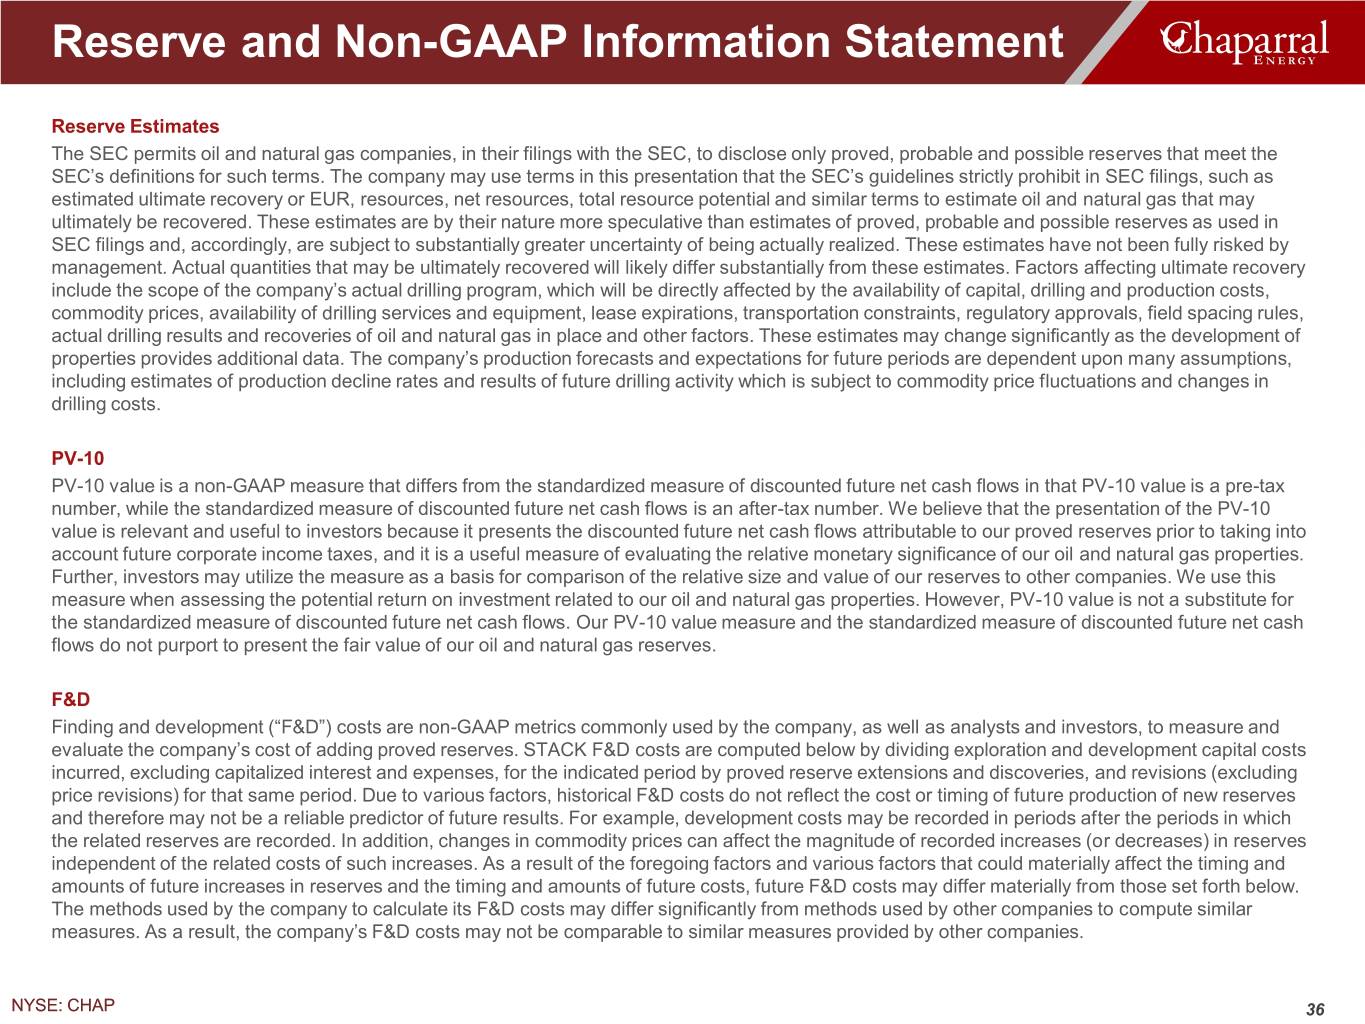
Reserve and Non-GAAP Information Statement Reserve Estimates The SEC permits oil and natural gas companies, in their filings with the SEC, to disclose only proved, probable and possible reserves that meet the SEC’s definitions for such terms. The company may use terms in this presentation that the SEC’s guidelines strictly prohibit in SEC filings, such as estimated ultimate recovery or EUR, resources, net resources, total resource potential and similar terms to estimate oil and natural gas that may ultimately be recovered. These estimates are by their nature more speculative than estimates of proved, probable and possible reserves as used in SEC filings and, accordingly, are subject to substantially greater uncertainty of being actually realized. These estimates have not been fully risked by management. Actual quantities that may be ultimately recovered will likely differ substantially from these estimates. Factors affecting ultimate recovery include the scope of the company’s actual drilling program, which will be directly affected by the availability of capital, drilling and production costs, commodity prices, availability of drilling services and equipment, lease expirations, transportation constraints, regulatory approvals, field spacing rules, actual drilling results and recoveries of oil and natural gas in place and other factors. These estimates may change significantly as the development of properties provides additional data. The company’s production forecasts and expectations for future periods are dependent upon many assumptions, including estimates of production decline rates and results of future drilling activity which is subject to commodity price fluctuations and changes in drilling costs. PV-10 PV-10 value is a non-GAAP measure that differs from the standardized measure of discounted future net cash flows in that PV-10 value is a pre-tax number, while the standardized measure of discounted future net cash flows is an after-tax number. We believe that the presentation of the PV-10 value is relevant and useful to investors because it presents the discounted future net cash flows attributable to our proved reserves prior to taking into account future corporate income taxes, and it is a useful measure of evaluating the relative monetary significance of our oil and natural gas properties. Further, investors may utilize the measure as a basis for comparison of the relative size and value of our reserves to other companies. We use this measure when assessing the potential return on investment related to our oil and natural gas properties. However, PV-10 value is not a substitute for the standardized measure of discounted future net cash flows. Our PV-10 value measure and the standardized measure of discounted future net cash flows do not purport to present the fair value of our oil and natural gas reserves. F&D Finding and development (“F&D”) costs are non-GAAP metrics commonly used by the company, as well as analysts and investors, to measure and evaluate the company’s cost of adding proved reserves. STACK F&D costs are computed below by dividing exploration and development capital costs incurred, excluding capitalized interest and expenses, for the indicated period by proved reserve extensions and discoveries, and revisions (excluding price revisions) for that same period. Due to various factors, historical F&D costs do not reflect the cost or timing of future production of new reserves and therefore may not be a reliable predictor of future results. For example, development costs may be recorded in periods after the periods in which the related reserves are recorded. In addition, changes in commodity prices can affect the magnitude of recorded increases (or decreases) in reserves independent of the related costs of such increases. As a result of the foregoing factors and various factors that could materially affect the timing and amounts of future increases in reserves and the timing and amounts of future costs, future F&D costs may differ materially from those set forth below. The methods used by the company to calculate its F&D costs may differ significantly from methods used by other companies to compute similar measures. As a result, the company’s F&D costs may not be comparable to similar measures provided by other companies. NYSE: CHAP 36
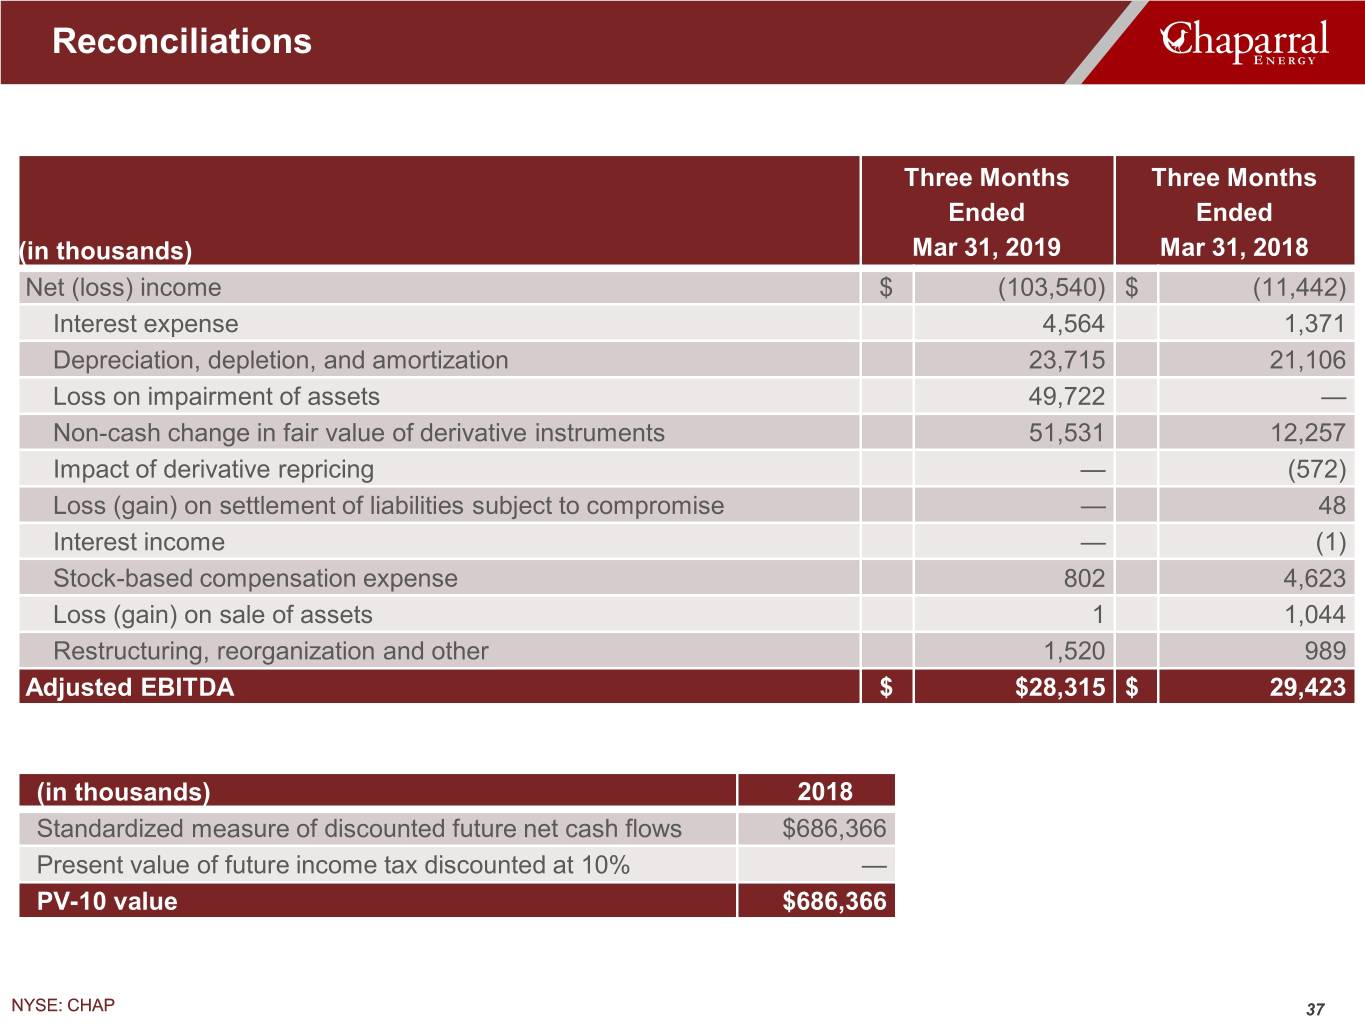
Reconciliations Three Months Three Months Ended Ended (in thousands) Mar 31, 2019 Mar 31, 2018 Net (loss) income $ (103,540) $ (11,442) Interest expense 4,564 1,371 Depreciation, depletion, and amortization 23,715 21,106 Loss on impairment of assets 49,722 — Non-cash change in fair value of derivative instruments 51,531 12,257 Impact of derivative repricing — (572) Loss (gain) on settlement of liabilities subject to compromise — 48 Interest income — (1) Stock-based compensation expense 802 4,623 Loss (gain) on sale of assets 1 1,044 Restructuring, reorganization and other 1,520 989 Adjusted EBITDA $ $28,315 $ 29,423 (in thousands) 2018 Standardized measure of discounted future net cash flows $686,366 Present value of future income tax discounted at 10% — PV-10 value $686,366 NYSE: CHAP 37
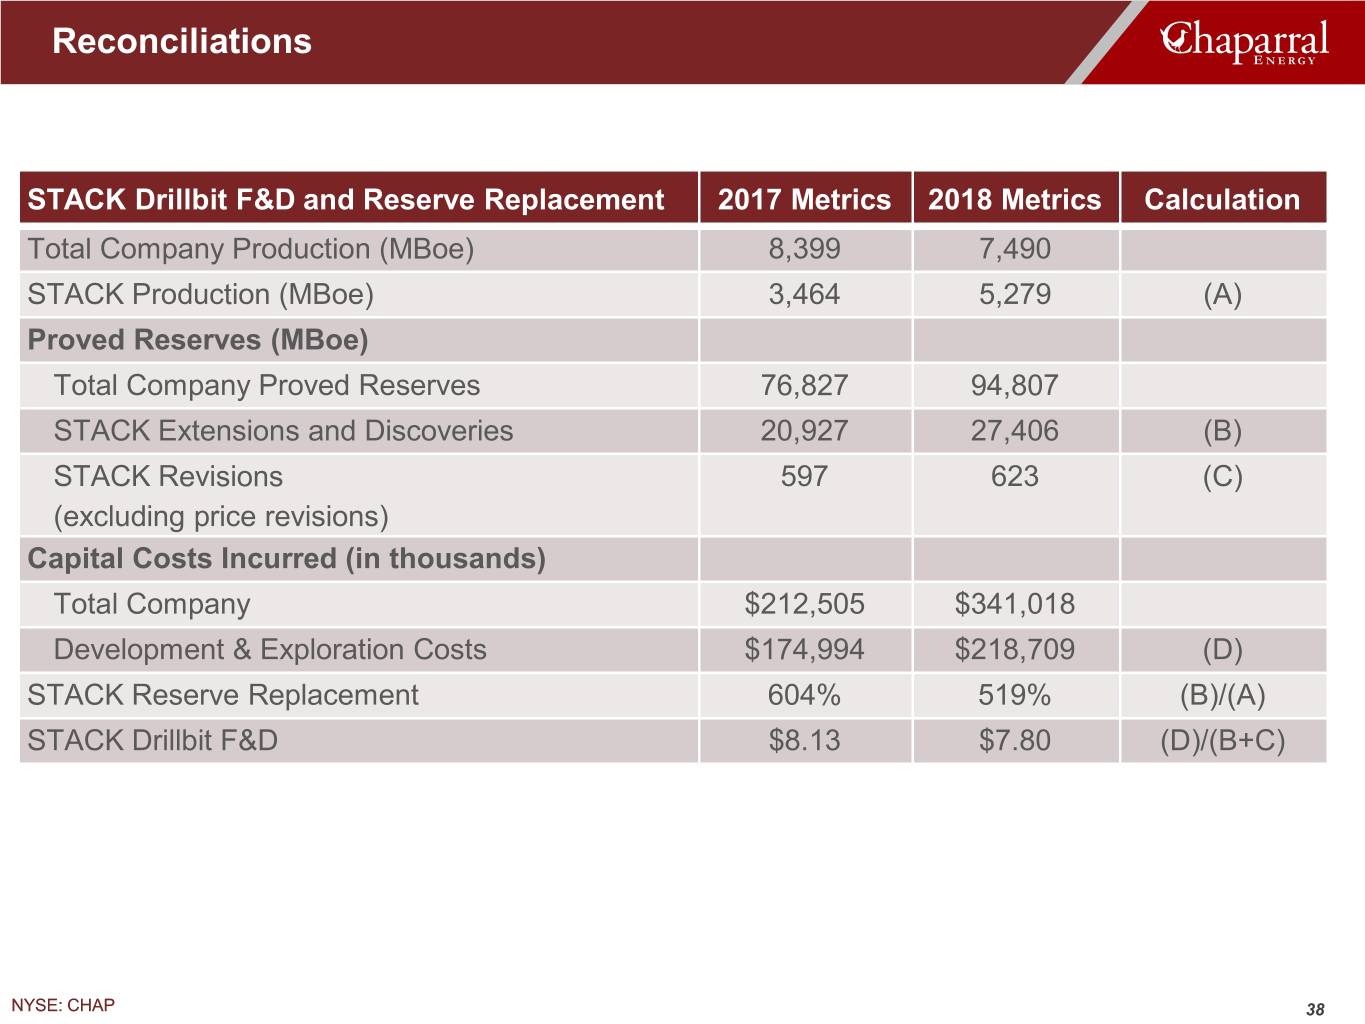
Reconciliations STACK Drillbit F&D and Reserve Replacement 2017 Metrics 2018 Metrics Calculation Total Company Production (MBoe) 8,399 7,490 STACK Production (MBoe) 3,464 5,279 (A) Proved Reserves (MBoe) Total Company Proved Reserves 76,827 94,807 STACK Extensions and Discoveries 20,927 27,406 (B) STACK Revisions 597 623 (C) (excluding price revisions) Capital Costs Incurred (in thousands) Total Company $212,505 $341,018 Development & Exploration Costs $174,994 $218,709 (D) STACK Reserve Replacement 604% 519% (B)/(A) STACK Drillbit F&D $8.13 $7.80 (D)/(B+C) NYSE: CHAP 38

Contact Information Chaparral Energy, Inc. 701 Cedar Lake Boulevard Oklahoma City, OK 73114 Investors Media Scott Pittman Brandi Wessel Chief Financial Officer Manager – Communications investor.relations@chaparralenergy.com brandi.wessel@chaparralenergy.com 405-426-6700 405-426-6657 NYSE: CHAP 39

ENERGIZING America’s Heartland NYSE: CHAP chaparralenergy.com NYSE: CHAP 40


