SECURITIES AND EXCHANGE COMMISSION
Washington, D.C. 20549
FORM 6-K
REPORT OF FOREIGN PRIVATE ISSUER
PURSUANT TO RULE 13a-16 OR 15d-16 UNDER THE
SECURITIES EXCHANGE ACT OF 1934
November 23, 2022
Commission File Number: 001-32827
MACRO BANK INC.
(Translation of registrant’s name into English)
Avenida Eduardo Madero 1182
Ciudad Autónoma de Buenos Aires C1106 ACY
Tel: 54 11 5222 6500
(Address of registrant’s principal executive offices)
Indicate by check mark whether the registrant files or will file annual reports under cover of Form 20-F or Form 40-F.
| Form 20-F | x | Form 40-F | ¨ |
Indicate by check mark if the registrant is submitting the Form 6-K in paper as permitted by Regulation S-T Rule 101(b)(1):
| Yes | ¨ | No | x |
Indicate by check mark if the registrant is submitting the Form 6-K in paper as permitted by Regulation S-T Rule 101(b)(7):
| Yes | o | No | x |

 | 3Q22 Earnings Release |
Banco Macro Announces Results for the Third Quarter of 2022
Buenos Aires, Argentina, November 23, 2022 – Banco Macro S.A. (NYSE: BMA; BYMA: BMA) (“Banco Macro” or “BMA” or the “Bank”) announced today its results for the third quarter ended September 30, 2022 (“3Q22”). All figures are in Argentine pesos (Ps.) and have been restated in terms of the measuring unit current at the end of the reporting period. As of 1Q20, the Bank began reporting results applying Hyperinflation Accounting, in accordance with IFRS IAS 29 as established by the Central Bank. For ease of comparison, figures of previous quarters of 2022 have been restated applying IAS 29 to reflect the accumulated effect of the inflation adjustment for each period through September 30, 2022.
Summary
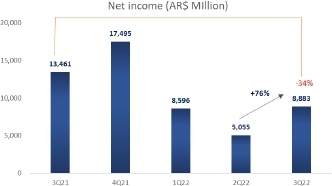
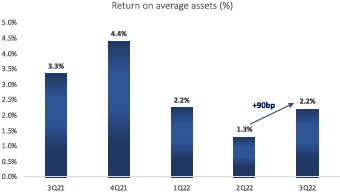
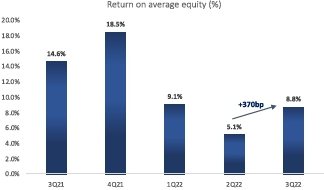
• The Bank’s net income totaled Ps.8.9 billion in 3Q22. This result was 76% higher than the Ps.5.5 billion posted in 2Q22 and 34% lower than the result registered in 3Q21. As of 3Q22, the accumulated annualized return on average equity (“ROAE”) and the accumulated annualized return on average assets (“ROAA”) were 7.7% and 1.9%, respectively.
• In 3Q22 Net Operating Income (before G&A and personnel expenses) totaled Ps.121.6 billion, 22% or Ps.22.2 billion higher than in 2Q22 and 54% or Ps.42.6 billion higher than the same period of last year.
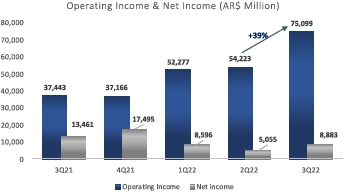
• In 3Q22 Operating Income (after G&A and personnel expenses) totaled Ps.75.1 billion, 39% or Ps.20.1 billion higher than in 2Q22 and 101% or Ps.37.7 billion higher than the same period of last year.
• In 3Q22, Banco Macro’s financing to the private sector decreased 7% or Ps.37.2 billion quarter over quarter (“QoQ”) totaling Ps.506.8 billion and decreased 9% or Ps.53.1 billion year over year (“YoY”).
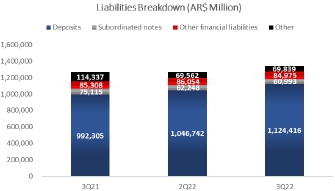
• In 3Q22, Banco Macro’s total deposits increased 7% or Ps.77.7 billion QoQ, totaling Ps.1.1 trillion and representing 84% of the Bank’s total liabilities. Private sector deposits increased 5% or Ps.45.3 billion QoQ.
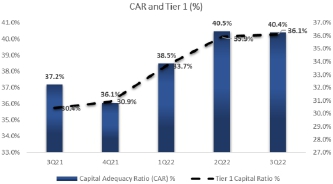
• Banco Macro continued showing a strong solvency ratio, with an excess capital of Ps.351.9 billion, 40.4% regulatory capital ratio – Basel III and 36.1% Tier 1 Ratio. In addition, the Bank’s liquid assets remained at an adequate level, reaching 90% of its total deposits in 3Q22.
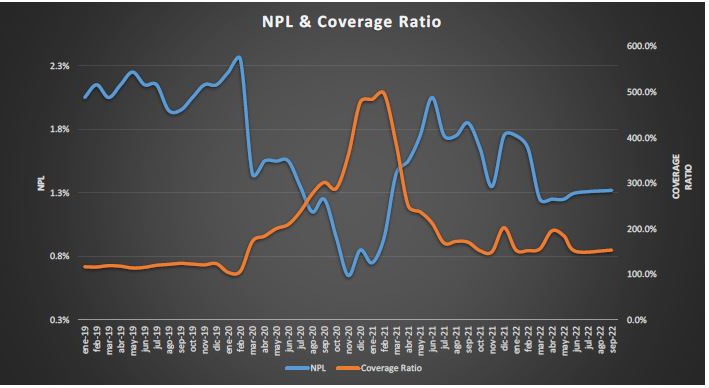
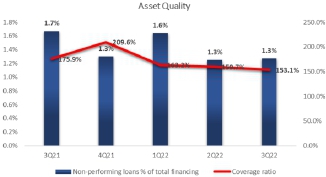
• In 3Q22, the Bank’s non-performing to total financing ratio was 1.27% and the coverage ratio reached 153.13%.
| 3Q22 Earnings Release Conference Call | IR Contacts in Buenos Aires: | |
| Monday, November 28, 2022 | Jorge Scarinci | |
| Time: 11:00 a.m. Eastern Time | 12:00 p.m. Buenos Aires Time | Chief Financial Officer | |
| To participate, please dial: | ||
| Argentina Toll Free: | Nicolás A. Torres | |
| (011) 3984 5677 | Investor Relations | |
| Participants Dial In (Toll Free): | ||
| +1 (844) 450 3847 | Webcast Replay: click here | Phone: (54 11) 5222 6682 |
| Participants International Dial In: | E-mail: investorelations@macro.com.ar | |
| +1 (412) 317 6370 | Available from 11/28/2022 through 12/12/2022 | |
| Conference ID: Banco Macro | Visit our website at: | |
| Webcast: click here | www.macro.com.ar/relaciones-inversores | |
2
| 3Q22 Earnings Release |
Disclaimer
This press release includes forward-looking statements. We have based these forward-looking statements largely on our current beliefs, expectations and projections about future events and financial trends affecting our business. Many important factors could cause our actual results to differ substantially from those anticipated in our forward-looking statements, including, among other things: inflation; changes in interest rates and the cost of deposits; government regulation; adverse legal or regulatory disputes or proceedings; credit and other risks of lending, such as increases in defaults by borrowers; fluctuations and declines in the value of Argentine public debt; competition in banking and financial services; deterioration in regional and national business and economic conditions in Argentina; and fluctuations in the exchange rate of the peso.
The words “believe,” “may,” “will,” “aim,” “estimate,” “continue,” “anticipate,” “intend,” “expect” and similar words are intended to identify forward-looking statements. Forward-looking statements include information concerning our possible or assumed future results of operations, business strategies, financing plans, competitive position, industry environment, potential growth opportunities, the effects of future regulation and the effects of competition. Forward-looking statements speak only as of the date they were made, and we undertake no obligation to update publicly or to revise any forward-looking statements after we distribute this press release because of new information, future events or other factors. In light of the risks and uncertainties described above, the forward-looking events and circumstances discussed in this press release might not occur and are not guarantees of future performance.
This report is a summary analysis of Banco Macro's financial condition and results of operations as of and for the period indicated. For a correct interpretation, this report must be read in conjunction with all other material periodically filed with the Comisión Nacional de Valores (www.cnv.gob.ar), the Securities and Exchange Commission (www.sec.gov), Bolsas y mercados Argentinos (www.byma.com.ar) and the New York Stock Exchange (www.nyse.com). In addition, the Central Bank (www.bcra.gov.ar) may publish information related to Banco Macro as of a date subsequent to the last date for which the Bank has published information.
Readers of this report must note that this is a translation made from an original version written and expressed in Spanish. Consequently, any matters of interpretation should be referred to the original version in Spanish.
3
| 3Q22 Earnings Release |
This Earnings Release has been prepared in accordance with the accounting framework established by the Central Bank of Argentina (“BCRA”), based on International Financial Reporting Standards (“I.F.R.S.”) and the resolutions adopted by the International Accouting Standards Board (“I.A.S.B”) and by the Federación Argentina de Consejos Profesionales de Ciencias Económicas (“F.A.C.P.E.”). As of January 2020 the Bank started reporting with the application of (i) Expected losses of IFRS 9 “Financial Instruments” and (ii) IAS 29 “Financial Reporting in Hyperinflationary Economies”. Data and figures shown in this Earnings Release may differ from the ones shown in the 20-F annual report. As of fiscal year 2021, the monetary result accrued by items of a monetary nature measured at fair value with changes in Other Comprehensive Income (OCI), is recorded in the Result form the Net Monetary Position integrating the Net Result of the period in accordance with Communication “A” 7211 of the Central Bank of Argentina. Previous quarters of 2021/2 have been restated in accordance with said Communication in order to make a comparison possible.
Results
Earnings per outstanding share were Ps.13.9 in 3Q22, 76% higher than in 2Q22 and 34% lower than the result posted a year ago.
| EARNINGS PER SHARE | MACRO Consolidated | Change | ||||||||||||||||||||||||||
| In MILLION $ (Measuring Unit Current at EOP) | 3Q21 | 4Q21 | 1Q22 | 2Q22 | 3Q22 | QoQ | YoY | |||||||||||||||||||||
| Net income -Parent Company- (M $) | 13,461 | 17,495 | 8,596 | 5,055 | 8,883 | 76 | % | -34 | % | |||||||||||||||||||
| Average # of shares outstanding (M) | 639 | 639 | 639 | 639 | 639 | 0 | % | 0 | % | |||||||||||||||||||
| Average #of treasury stocks (shares repurchased) (M) | 0 | 0 | 0 | - | - | - | -100 | % | ||||||||||||||||||||
| Book value per avg. Outstanding share ($) | 592 | 620 | 632 | 648 | 665 | 3 | % | 12 | % | |||||||||||||||||||
| Shares Outstanding (M) | 639 | 639 | 639 | 639 | 639 | 0 | % | 0 | % | |||||||||||||||||||
| Earnings per avg. outstanding share ($) | 21.07 | 27.38 | 13.45 | 7.91 | 13.90 | 76 | % | -34 | % | |||||||||||||||||||
| EOP FX (Pesos per USD) | 98.7350 | 102.7500 | 110.9783 | 125.2150 | 147.3150 | 18 | % | 49 | % | |||||||||||||||||||
| Book value per avg. issued ADS (USD) | 59.96 | 60.34 | 56.95 | 51.75 | 45.14 | -13 | % | -25 | % | |||||||||||||||||||
| Earnings per avg. outstanding ADS (USD) | 2.13 | 2.66 | 1.21 | 0.63 | 0.94 | 49 | % | -56 | % | |||||||||||||||||||
Banco Macro’s 3Q22 net income of Ps.8.9 billion was 76% or Ps.3.8 billion higher than the previous quarter and 34% or Ps.4.6 billion lower YoY. This result represented an accumulated annualized ROAE and ROAA of 7.7% and 1.9% respectively.
Net operating income (before G&A and personnel expenses) was Ps.121.6 billion in 3Q22, 22% or Ps.22.2 billion higher compared to 2Q22 due to higher income from financial instruments at fair value through P&L and higher fx gains. On a yearly basis Net operating income increased 54% or Ps.42.6 billion.
In 3Q22 Provision for loan losses totaled Ps.1.4 billion, increasing 51% or Ps.483 million compared to the previous quarter. On a yearly basis, Provision for loan losses increased 268% or Ps.1 billion.
Operating income (after G&A and personnel expenses) was Ps.75.1 billion in 3Q22, 39% or Ps.20.9 billion higher than in 2Q22 and 101% or Ps.37.7 billion higher than a year ago.
It is important to emphasize that this result was obtained with a leverage of only 4.4x assets to equity ratio.
4
| 3Q22 Earnings Release |
| INCOME STATEMENT | MACRO Consolidated | Change | ||||||||||||||
| In MILLION $ (Measuring Unit Current at EOP) | 3Q21 | 4Q21 | 1Q22 | 2Q22 | 3Q22 | QoQ | YoY | |||||||||
| Net Interest Income | 54,446 | 59,321 | 59,992 | 65,553 | 63,488 | -3 | % | 17 | % | |||||||
| Net fee income | 14,322 | 14,548 | 14,617 | 14,557 | 14,242 | -2 | % | -1 | % | |||||||
| Net Interest Income + Net Fee Income | 68,768 | 73,869 | 74,609 | 80,110 | 77,730 | -3 | % | 13 | % | |||||||
| Net Income from financial instruments at fair value through P&L | 6,327 | 5,875 | 9,125 | 9,006 | 25,531 | 183 | % | 304 | % | |||||||
| Income from assets at amortized cost | 0 | 151 | 0 | 0 | 0 | 0 | % | 0 | % | |||||||
| Differences in quoted prices of gold and foreign currency | 1,083 | 2,657 | 4,414 | 6,562 | 16,030 | 144 | % | 1380 | % | |||||||
| Other operating income | 3,228 | 3,303 | 4,744 | 4,656 | 3,745 | -20 | % | 16 | % | |||||||
| Provision for loan losses | 387 | 3,260 | 1,066 | 942 | 1,425 | 51 | % | 268 | % | |||||||
| Net Operating Income | 79,019 | 82,595 | 91,826 | 99,392 | 121,611 | 22 | % | 54 | % | |||||||
| Employee benefits | 16,516 | 16,153 | 14,039 | 18,478 | 17,655 | -4 | % | 7 | % | |||||||
| Administrative expenses | 8,223 | 9,793 | 7,890 | 8,326 | 8,295 | 0 | % | 1 | % | |||||||
| Depreciation and impairment of assets | 3,033 | 3,074 | 3,136 | 3,223 | 3,287 | 2 | % | 8 | % | |||||||
| Other operating expenses | 13,804 | 16,409 | 14,484 | 15,142 | 17,275 | 14 | % | 25 | % | |||||||
| Operating Income | 37,443 | 37,166 | 52,277 | 54,223 | 75,099 | 39 | % | 101 | % | |||||||
| Result from associates & joint ventures | -2 | 58 | -51 | -49 | -97 | - | - | |||||||||
| Result from net monetary postion | -23,458 | -25,206 | -41,375 | -46,592 | -58,335 | 25 | % | 149 | % | |||||||
| Result before taxes from continuing operations | 13,983 | 12,018 | 10,851 | 7,582 | 16,667 | 120 | % | 19 | % | |||||||
| Income tax | 522 | -5,477 | 2,255 | 2,527 | 7,784 | 208 | % | 1391 | % | |||||||
| Net income from continuing operations | 13,461 | 17,495 | 8,596 | 5,055 | 8,883 | 76 | % | -34 | % | |||||||
| - | - | |||||||||||||||
| Net Income of the period | 13,461 | 17,495 | 8,596 | 5,055 | 8,883 | 76 | % | -34 | % | |||||||
| Net income of the period attributable to parent company | 13,461 | 17,496 | 8,613 | 5,059 | 8,865 | 75 | % | -34 | % | |||||||
| Net income of the period attributable to minority interest | - | -1 | -17 | -4 | 18 | - | - | |||||||||
| Other Comprehensive Income | 105 | 115 | -855 | -3,834 | 2,079 | - | - | |||||||||
| Foreign currency translation differences in financial statements conversion | -337 | -320 | -369 | -189 | -178 | - | - | |||||||||
| Profits or losses from financial assets measured at fair value through other comprehensive income (FVOCI) (IFRS 9(4.1.2)(a) | 442 | 435 | -486 | -3,645 | 2,257 | -162 | % | 411 | % | |||||||
| TOTAL COMPREHENSIVE INCOME FOR THE PERIOD | 13,566 | 17,610 | 7,741 | 1,221 | 10,962 | 798 | % | -19 | % | |||||||
| Total Comprehensive Income attributable to parent Company | 13,566 | 17,611 | 7,758 | 1,225 | 10,944 | 793 | % | -19 | % | |||||||
| Total Comprehensive Income attributable to non-controlling interests | - | -1 | -17 | -4 | 18 | - | - | |||||||||
The Bank’s 3Q22 net interest income totaled Ps.63.5 billion, 3% or Ps.2.1 billion lower than in 2Q22 but 17% or Ps.9 billion higher YoY.
In 3Q22 interest income totaled Ps.137.2 billion, 17% or Ps.20 billion higher than in 2Q22 and 50% or Ps. 45.8 billion higher than in 3Q21.
Income from interest on loans and other financing totaled Ps.55.5 billion, 9% or Ps.4.6 billion higher compared to the previous quarter, due to a 324 b.p increase in the average lending rates. On a yearly basis, Income from interest on loans increased 22% or Ps.9.8 billion.
In 3Q22 income from government and private securities increased 19% or Ps.12.2 billion QoQ and increased 86% or Ps.36 billion compared with the same period of last year. This result is explained 14% by income from government and private securities through other comprehensive income (Leliqs and Other government securities) and the remaining 86% is explained by income from sovereign bonds at amortized cost.
5
 | 3Q22 Earnings Release |
In 3Q22, income from Repos totaled Ps.3.9 billion, 358% or Ps.3 billion higher than the previous quarter and 3% or Ps.107 million lower than a year ago.
In 3Q22 FX income totaled Ps.16 billion, 144% or Ps.9.5 billion higher than the previous quarter and Ps.15 billion higher than a year ago, due to the Bank’s long dollar position, and a 18% depreciation in the quarter of the Argentine peso against the US dollar.
| FX INCOME | MACRO Consolidated | Variation | |||||||||||
| In MILLION $ (Measuring Unit Current at EOP) | 3Q21 | 2Q22 | 3Q22 | QoQ | YoY | ||||||||
| (1) Differences in quoted prices of gold and foreign currency | 1,083 | 6,562 | 16,030 | 144 | % | 1381 | % | ||||||
| Translation of FX assets and liabilities to Pesos | 840 | 6,381 | 15,699 | 146 | % | 1769 | % | ||||||
| Income from foreign currency exchange | 243 | 181 | 332 | 83 | % | 37 | % | ||||||
| (2) Net Income from financial assets and liabilities at fair value through P&L | - | 9 | 105 | - | - | ||||||||
| Income from investment in derivative financing instruments | - | 9 | 105 | - | - | ||||||||
| (1) +(2) Total Result from Differences in quoted prices of gold and foreign currency | 1,083 | 6,562 | 16,030 | 144 | % | 1381 | % | ||||||
| INTEREST INCOME | MACRO Consolidated | Change | ||||||||||||||
| In MILLION $ (Measuring Unit Current at EOP) | 3Q21 | 4Q21 | 1Q22 | 2Q22 | 3Q22 | QoQ | YoY | |||||||||
| Interest on Cash and due from Banks | 5 | 5 | 4 | 19 | 97 | 411 | % | 1840 | % | |||||||
| Interest from government securities | 41,604 | 42,483 | 49,439 | 65,438 | 77,676 | 19 | % | 87 | % | |||||||
| Interest from private securities | 80 | 64 | 36 | 27 | 33 | 22 | % | -59 | % | |||||||
| Interest on loans and other financing | ||||||||||||||||
| To the financial sector | 254 | 231 | 132 | 96 | 83 | -14 | % | -67 | % | |||||||
| To the public non financial sector | 659 | 516 | 395 | 313 | 298 | -5 | % | -55 | % | |||||||
| Interest on overdrafts | 3,319 | 3,411 | 3,626 | 4,695 | 6,542 | 39 | % | 97 | % | |||||||
| Interest on documents | 4,238 | 4,978 | 4,365 | 4,528 | 6,171 | 36 | % | 46 | % | |||||||
| Interest on mortgages loans | 5,489 | 6,323 | 6,688 | 8,571 | 8,503 | -1 | % | 55 | % | |||||||
| Interest on pledged loans | 468 | 761 | 742 | 669 | 604 | -10 | % | 29 | % | |||||||
| Interest on personal loans | 19,422 | 20,207 | 19,750 | 19,326 | 18,579 | -4 | % | -4 | % | |||||||
| Interest on credit cards loans | 5,882 | 6,795 | 7,270 | 7,802 | 8,661 | 11 | % | 47 | % | |||||||
| Interest on financial leases | -2 | 63 | 65 | 56 | 75 | 34 | % | -3850 | % | |||||||
| Interest on other loans | 5,889 | 5,833 | 5,377 | 4,761 | 5,933 | 25 | % | 1 | % | |||||||
| Interest on Repos | ||||||||||||||||
| From the BCRA | 4,001 | 2,790 | 569 | 703 | 3,832 | 445 | % | -4 | % | |||||||
| Other financial institutions | 10 | 14 | 50 | 150 | 72 | -52 | % | 620 | % | |||||||
| Total Interest income | 91,318 | 94,474 | 98,508 | 117,154 | 137,159 | 17 | % | 50 | % | |||||||
| Income from Interest on loans | 45,618 | 49,118 | 48,410 | 50,817 | 55,449 | 9 | % | 22 | % | |||||||
The Bank’s 3Q22 interest expense totaled Ps.73.7billion, increasing 43% or Ps.22.1 billion compared to the previous quarter and 100% or Ps.36.8 billion higher compared to 3Q21.
In 3Q22, interest on deposits represented 98% of the Bank’s total interest expense, increasing 45% or Ps.22.4 billion QoQ, due to a 950 b.p. increase in the average rate paid on deposits while the average volume of deposits from the private sector increased 8%. On a yearly basis, interest on deposits increased 106% or Ps.37.2 billion.
6
| 3Q22 Earnings Release |
| INTEREST EXPENSE | MACRO Consolidated | Change | ||||||||||||||
| In MILLION $ (Measuring Unit Current at EOP) | 3Q21 | 4Q21 | 1Q22 | 2Q22 | 3Q22 | QoQ | YoY | |||||||||
| Deposits | ||||||||||||||||
| Interest on checking accounts | 179 | 236 | 616 | 1,614 | 3,359 | 108 | % | 1777 | % | |||||||
| Interest on saving accounts | 476 | 506 | 562 | 819 | 906 | 11 | % | 90 | % | |||||||
| Interest on time deposits | 34,484 | 32,911 | 35,700 | 47,472 | 68,034 | 43 | % | 97 | % | |||||||
| Interest on other financing from BCRA and financial inst. | 42 | 34 | 64 | 88 | 119 | 35 | % | 183 | % | |||||||
| Repos | ||||||||||||||||
| Other financial institutions | 135 | 100 | 311 | 390 | 87 | -78 | % | -36 | % | |||||||
| Interest on corporate bonds | 201 | 184 | 160 | 69 | 11 | -84 | % | -95 | % | |||||||
| Interest on subordinated bonds | 1,342 | 1,175 | 1,039 | 984 | 959 | -3 | % | -29 | % | |||||||
| Interest on other financial liabilities | 13 | 7 | 64 | 165 | 196 | �� | 19 | % | 1408 | % | ||||||
| Total financial expense | 36,872 | 35,153 | 38,516 | 51,601 | 73,671 | 43 | % | 100 | % | |||||||
| Expenses from interest on deposits | 35,139 | 33,653 | 36,878 | 49,905 | 72,299 | 45 | % | 106 | % | |||||||
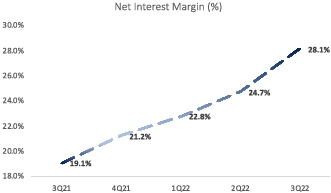
In 3Q22, the Bank’s net interest margin (including FX) was 28.1%, higher than the 24.7% posted in 2Q22 and the 19.1% posted in 3Q21.
In 3Q22, Net Interest Margin (excluding FX) was 22.5%, unchanged from the one posted in 2Q22 and higher than the 18.7% posted in 3Q21.
In 3Q22 Net Interest Margin (Pesos) was 24.5%, lower than the 25.1% posted in 2Q22 but higher than the 20.8% posted in 3Q21; meanwhile Net Interest Margin (USD) was 5%, higher than the 3.5% posted in 2Q22 and higher than the 3.9% registered in 3Q21.
| ASSETS & LIABILITIES PERFORMANCE (AR$) | MACRO Consolidated | ||||||||||||||||||||||||||||||||||||||||
| In MILLION $ | 3Q21 | 4Q21 | 1Q22 | 2Q22 | 3Q22 | ||||||||||||||||||||||||||||||||||||
| (Measuring Unit Current at EOP) | AVERAGE | REAL INT | NOMINAL | AVERAGE | REAL INT | NOMINAL | AVERAGE | REAL INT | NOMINAL | AVERAGE | REAL INT | NOMINAL | AVERAGE | REAL INT | NOMINAL | ||||||||||||||||||||||||||
| Yields & rates in annualized nominal % | BALANCE | RATE | INT RATE | BALANCE | RATE | INT RATE | BALANCE | RATE | INT RATE | BALANCE | RATE | INT RATE | BALANCE | RATE | INT RATE | ||||||||||||||||||||||||||
| Interest-earning assets | |||||||||||||||||||||||||||||||||||||||||
| Loans & Other Financing | |||||||||||||||||||||||||||||||||||||||||
| Public Sector | 5,715 | 6.5 | % | 45.7 | % | 4,835 | 1.3 | % | 42.3 | % | 3,563 | -12.2 | % | 45.0 | % | 2,809 | -14.6 | % | 44.7 | % | 2,741 | -23.6 | % | 43.1 | % | ||||||||||||||||
| Financial Sector | 2,827 | -0.9 | % | 35.6 | % | 2,793 | -5.5 | % | 32.8 | % | 1,591 | -19.1 | % | 33.6 | % | 1,098 | -20.5 | % | 34.7 | % | 963 | -28.3 | % | 34.2 | % | ||||||||||||||||
| Private Sector | 493,029 | -2.2 | % | 33.8 | % | 527,126 | -4.4 | % | 34.3 | % | 509,672 | -17.5 | % | 36.2 | % | 488,001 | -17.5 | % | 39.7 | % | 484,753 | -23.5 | % | 43.2 | % | ||||||||||||||||
| Other debt securities | |||||||||||||||||||||||||||||||||||||||||
| Central Bank Securities (Leliqs) | 236,186 | 0.5 | % | 37.5 | % | 225,772 | -2.1 | % | 37.6 | % | 273,554 | -15.1 | % | 40.3 | % | 319,133 | -10.7 | % | 51.2 | % | 382,907 | -9.8 | % | 68.8 | % | ||||||||||||||||
| Government & Private Securities | 228,159 | -2.4 | % | 33.6 | % | 204,198 | 0.3 | % | 40.9 | % | 207,670 | -13.2 | % | 43.3 | % | 208,826 | -13.0 | % | 47.4 | % | 105,199 | -24.0 | % | 42.2 | % | ||||||||||||||||
| Repos | 43,798 | -0.4 | % | 36.3 | % | 30,753 | -3.1 | % | 36.2 | % | 7,270 | -18.6 | % | 34.5 | % | 9,053 | -18.7 | % | 37.8 | % | 25,879 | -14.6 | % | 59.9 | % | ||||||||||||||||
| Total interest-earning assets | 1,009,714 | -1.5 | % | 34.8 | % | 995,477 | -2.9 | % | 36.5 | % | 1,003,320 | -16.0 | % | 38.8 | % | 1,028,920 | -14.5 | % | 44.8 | % | 1,002,442 | -18.1 | % | 53.3 | % | ||||||||||||||||
| Fin. Assets through P&L and equity inv. | 66,657 | 0.6 | % | 37.7 | % | 51,552 | 3.3 | % | 45.2 | % | 53,795 | 2.2 | % | 68.8 | % | 65,691 | -8.5 | % | 55.0 | % | 130,662 | -5.2 | % | 77.5 | % | ||||||||||||||||
| Other Non interest-earning assets | 120,366 | 119,158 | 121,924 | 114,799 | 53,533 | ||||||||||||||||||||||||||||||||||||
| Total Non interest-earning assets | 187,023 | 170,710 | 175,719 | 180,490 | 184,195 | ||||||||||||||||||||||||||||||||||||
| Total Average Assets | 1,196,737 | 1,166,187 | 1,179,039 | 1,209,410 | 1,186,637 | ||||||||||||||||||||||||||||||||||||
| Interest-bearing liabilities | |||||||||||||||||||||||||||||||||||||||||
| Deposits | |||||||||||||||||||||||||||||||||||||||||
| Public Sector | 39,414 | -6.4 | % | 28.1 | % | 33,029 | -9.1 | % | 27.7 | % | 35,674 | -21.4 | % | 29.8 | % | 53,037 | -20.9 | % | 34.0 | % | 62,253 | -21.6 | % | 46.8 | % | ||||||||||||||||
| Private Sector | 534,783 | -9.4 | % | 24.0 | % | 525,700 | -12.0 | % | 23.6 | % | 538,907 | -23.8 | % | 25.8 | % | 564,428 | -21.9 | % | 32.3 | % | 611,925 | -24.1 | % | 42.1 | % | ||||||||||||||||
| BCRA and other financial institutions | 695 | -8.1 | % | 25.7 | % | 515 | -10.8 | % | 25.4 | % | 805 | -20.0 | % | 32.2 | % | 927 | -16.2 | % | 42.0 | % | 640 | -3.5 | % | 80.6 | % | ||||||||||||||||
| Corporate bonds | 4,402 | -13.7 | % | 18.1 | % | 5,207 | -18.9 | % | 14.0 | % | 4,596 | -30.9 | % | 14.1 | % | 1,730 | -33.7 | % | 12.3 | % | 0 | 0.0 | % | 0.0 | % | ||||||||||||||||
| Repos | 2,172 | -8.9 | % | 24.7 | % | 1,371 | -8.3 | % | 28.9 | % | 4,008 | -20.4 | % | 31.5 | % | 4,473 | -20.3 | % | 35.0 | % | 758 | -22.3 | % | 45.5 | % | ||||||||||||||||
| Other financial liabilities | 1215 | -0.262 | 0.01 | 3646 | -0.288 | 0.001 | 3624 | -0.353 | 0.068 | 4250 | -0.322 | 0.149 | 3141 | -0.351 | 0.215 | ||||||||||||||||||||||||||
| Total int.-bearing liabilities | 582,681 | -9.2 | % | 24.2 | % | 569,468 | -12.0 | % | 23.7 | % | 587,614 | -23.8 | % | 25.9 | % | 628,845 | -21.9 | % | 32.3 | % | 678,717 | -23.9 | % | 42.5 | % | ||||||||||||||||
| Total non int.-bearing liabilities | 371,090 | 383,892 | 363,561 | 343,821 | 317,967 | ||||||||||||||||||||||||||||||||||||
| Total Average Liabilities | 953,771 | 953,360 | 951,175 | 972,666 | 996,684 | ||||||||||||||||||||||||||||||||||||
| Assets Performance | 88,508 | 91,562 | 95,988 | 114,920 | 134,660 | ||||||||||||||||||||||||||||||||||||
| Liabilities Performance | 35,490 | 33,952 | 37,461 | 50,592 | 72,665 | ||||||||||||||||||||||||||||||||||||
| Net Interest Income | 53,018 | 57,610 | 58,527 | 64,328 | 61,995 | ||||||||||||||||||||||||||||||||||||
| Total interest-earning assets | 1,009,714 | 995,477 | 1,003,320 | 1,028,920 | 1,002,442 | ||||||||||||||||||||||||||||||||||||
| Net Interest Margin (NIM) | 20.8 | % | 23.0 | % | 23.7 | % | 25.1 | % | 24.5 | % | |||||||||||||||||||||||||||||||
7
| 3Q22 Earnings Release |
| ASSETS & LIABILITIES PERFORMANCE USD | MACRO Consolidated | |||||||||||||||||||||||||||||||||||||||||||||||||||||||||||
| In MILLION $ | 3Q21 | 4Q21 | 1Q22 | 2Q22 | 3Q22 | |||||||||||||||||||||||||||||||||||||||||||||||||||||||
| (Measuring Unit Current at EOP) | AVERAGE | REAL INT | NOMINAL | AVERAGE | REAL INT | NOMINAL | AVERAGE | REAL INT | NOMINAL | AVERAGE | REAL INT | NOMINAL | AVERAGE | REAL INT | NOMINAL | |||||||||||||||||||||||||||||||||||||||||||||
| Yields & rates in annualized nominal % | BALANCE | RATE | INT RATE | BALANCE | RATE | INT RATE | BALANCE | RATE | INT RATE | BALANCE | RATE | INT RATE | BALANCE | RATE | INT RATE | |||||||||||||||||||||||||||||||||||||||||||||
| Interest-earning assets | ||||||||||||||||||||||||||||||||||||||||||||||||||||||||||||
| Cash and Deposits in Banks | 92,258 | -17.8 | % | 0.0 | % | 82,788 | -17.3 | % | 0.0 | % | 69,569 | -19.8 | % | 0.0 | % | 67,609 | -10.5 | % | 0.1 | % | 65,428 | -8.6 | % | 0.6 | % | |||||||||||||||||||||||||||||||||||
| Loans & Other Financing | ||||||||||||||||||||||||||||||||||||||||||||||||||||||||||||
| Financial Sector | 0 | 0.0 | % | 0.0 | % | 0 | 0.0 | % | 0.0 | % | 0 | 0.0 | % | 0.0 | % | 41 | -1.8 | % | 9.8 | % | 0 | 0.0 | % | 0.0 | % | |||||||||||||||||||||||||||||||||||
| Private Sector | 38,092 | 5.7 | % | 28.6 | % | 31,844 | 11.3 | % | 34.6 | % | 24,536 | 12.1 | % | 39.8 | % | 24,177 | 21.1 | % | 35.5 | % | 26,698 | 21.7 | % | 34.0 | % | |||||||||||||||||||||||||||||||||||
| Other debt securities | ||||||||||||||||||||||||||||||||||||||||||||||||||||||||||||
| Central Bank | 0 | 0.0 | % | 0.0 | % | 0 | 0.0 | % | 0.0 | % | 0 | 0.0 | % | 0.0 | % | 0 | 0.0 | % | 0.0 | % | 3,826 | 0.0 | % | 0.0 | % | |||||||||||||||||||||||||||||||||||
| Government & Private Securities | 14,363 | -16.4 | % | 1.7 | % | 49,165 | -16.5 | % | 1.0 | % | 49,679 | -19.1 | % | 0.9 | % | 48,822 | -10.1 | % | 0.6 | % | 22,360 | -7.4 | % | 2.0 | % | |||||||||||||||||||||||||||||||||||
| Total interest-earning assets | 144,713 | -11.5 | % | 7.7 | % | 163,797 | -11.5 | % | 7.1 | % | 143,784 | -14.1 | % | 7.1 | % | 140,649 | -4.9 | % | 6.4 | % | 118,312 | -1.3 | % | 8.7 | % | |||||||||||||||||||||||||||||||||||
| Non interest-earning assets | 257,929 | 251,286 | 244,737 | 239,624 | 303,247 | |||||||||||||||||||||||||||||||||||||||||||||||||||||||
| Total Average Assets | 402,642 | 415,083 | 388,521 | 380,273 | 417,733 | |||||||||||||||||||||||||||||||||||||||||||||||||||||||
| Interest-bearing liabilities | ||||||||||||||||||||||||||||||||||||||||||||||||||||||||||||
| Deposits | ||||||||||||||||||||||||||||||||||||||||||||||||||||||||||||
| Public Sector | 4,896 | -17.7 | % | 0.1 | % | 7,183 | -17.3 | % | 0.1 | % | 8,057 | -19.7 | % | 0.1 | % | 4,967 | -10.5 | % | 0.1 | % | 3,867 | -9.1 | % | 0.1 | % | |||||||||||||||||||||||||||||||||||
| Private Sector | 113,028 | -17.7 | % | 0.1 | % | 100,879 | -17.3 | % | 0.1 | % | 91,431 | -19.8 | % | 0.0 | % | 86,523 | -10.6 | % | 0.0 | % | 75,727 | -9.2 | % | 0.0 | % | |||||||||||||||||||||||||||||||||||
| BCRA and other financial institutions | 926 | -15.3 | % | 3.0 | % | 678 | -14.0 | % | 4.1 | % | 418 | -17.5 | % | 2.9 | % | 664 | -7.4 | % | 3.6 | % | 2,199 | -4.9 | % | 4.7 | % | |||||||||||||||||||||||||||||||||||
| Issued corporate bonds | 0 | 0.0 | % | 0.0 | % | 0 | 0.0 | % | 0.0 | % | 0 | 0.0 | % | 0.0 | % | 1,591 | -8.8 | % | 2.0 | % | 2,227 | -7.4 | % | 2.0 | % | |||||||||||||||||||||||||||||||||||
| Subordinated bonds | 75,467 | -12.0 | % | 7.1 | % | 70,678 | -11.9 | % | 6.6 | % | 66,389 | -14.7 | % | 6.3 | % | 61,773 | -4.9 | % | 6.4 | % | 59,088 | -3.4 | % | 6.4 | % | |||||||||||||||||||||||||||||||||||
| Total int.-bearing liabilities | 194,317 | -15.5 | % | 2.8 | % | 179,418 | -15.1 | % | 2.7 | % | 166,295 | -17.7 | % | 2.6 | % | 155,518 | -8.3 | % | 2.6 | % | 143,108 | -6.6 | % | 2.8 | % | |||||||||||||||||||||||||||||||||||
| Total non int.-bearing liabilities | 86,441 | 73,473 | 65,512 | 65,754 | 68,439 | |||||||||||||||||||||||||||||||||||||||||||||||||||||||
| Total Average liabilities | 280,758 | 252,891 | 231,807 | 221,272 | 211,547 | |||||||||||||||||||||||||||||||||||||||||||||||||||||||
| Assets Performance | 2,810 | 2,912 | 2,520 | 2,234 | 2,499 | |||||||||||||||||||||||||||||||||||||||||||||||||||||||
| Liabilities Performance | 1,382 | 1,201 | 1,055 | 1,009 | 1,006 | |||||||||||||||||||||||||||||||||||||||||||||||||||||||
| Net Interest Income | 1,428 | 1,711 | 1,465 | 1,225 | 1,493 | |||||||||||||||||||||||||||||||||||||||||||||||||||||||
| Total interest-earning assets | 144,713 | 163,797 | 143,784 | 140,649 | 118,312 | |||||||||||||||||||||||||||||||||||||||||||||||||||||||
| Net Interest Margin (NIM) | 3.9 | % | 4.1 | % | 4.1 | % | 3.5 | % | 5.0 | % | ||||||||||||||||||||||||||||||||||||||||||||||||||
In 3Q22 Banco Macro’s net fee income totaled Ps.14.2 billion, 2% or Ps.315 million lower than in 2Q22 and 1% or Ps.80 million lower than the same period of last year.
In the quarter, fee income totaled Ps.15.8 billion, 2% or Ps.305 million lower than in 2Q22. Insurance fees, ATM transaction fees and fees charged on deposit accounts stand out with a 12% (Ps.119 million), 6% (Ps.88 million) and 1% (Ps.87 million) decrease respectively, which were partially offset by a 5% increase in corporate services fees and a 2% increase in credit card fees. On a yearly basis, fee income decreased Ps.22 million.
In the quarter, total fee expense increased 1% or Ps.10 million. On a yearly basis, fee expenses increased 4% or Ps.58 million.
| NET FEE INCOME | MACRO Consolidated | Change | ||||||||||||||||||||||||||
| In MILLION $ (Measuring Unit Current at EOP) | 3Q21 | 4Q21 | 1Q22 | 2Q22 | 3Q22 | QoQ | YoY | |||||||||||||||||||||
| Fees charged on deposit accounts | 70 | 71 | 52 | 53 | 49 | -8 | % | -30 | % | |||||||||||||||||||
| Credit card fees | 6,190 | 5,996 | 6,168 | 6,006 | 5,919 | -1 | % | -4 | % | |||||||||||||||||||
| Corporate services fees | 356 | 358 | 307 | 251 | 205 | -18 | % | -42 | % | |||||||||||||||||||
| ATM transactions fees | 1,461 | 1,485 | 1,395 | 1,424 | 1,336 | -6 | % | -9 | % | |||||||||||||||||||
| Insurance fees | 20 | 22 | 19 | 20 | 15 | -25 | % | -25 | % | |||||||||||||||||||
| Debit card fees | 917 | 984 | 935 | 961 | 842 | -12 | % | -8 | % | |||||||||||||||||||
| Financial agent fees (Provinces) | 1,813 | 1,933 | 2,039 | 2,158 | 2,272 | 5 | % | 25 | % | |||||||||||||||||||
| Credit related fees | 871 | 902 | 832 | 926 | 872 | -6 | % | 0 | % | |||||||||||||||||||
| Mutual funds & securities fees | 1,017 | 1,096 | 1,076 | 1,044 | 1,028 | -2 | % | 1 | % | |||||||||||||||||||
| AFIP & Collection services | 2,813 | 2,926 | 2,967 | 2,898 | 2,950 | 2 | % | 5 | % | |||||||||||||||||||
| ANSES fees | 336 | 411 | 339 | 405 | 353 | -13 | % | 5 | % | |||||||||||||||||||
| Total fee income | 15,864 | 16,184 | 16,129 | 16,146 | 15,841 | -2 | % | 0 | % | |||||||||||||||||||
| Total fee expense | 1,541 | 1,636 | 1,512 | 1,589 | 1,599 | 1 | % | 4 | % | |||||||||||||||||||
| Net fee income | 14,323 | 14,548 | 14,617 | 14,557 | 14,242 | -2 | % | -1 | % | |||||||||||||||||||
In 3Q22 Net Income from financial assets and liabilities at fair value through profit or loss totaled a Ps.25.5 billion gain, 183% or Ps.16.5 billion higher than the previous quarter. This increase is mostly related to higher income from government securities (mainly TV23) which increased 416% or Ps.14.7 billion. On a yearly basis Net income from financial assets and liabilities at fair value through profit or loss increased 304% or Ps.19.2 billion.
8
| 3Q22 Earnings Release |
| NET INCOME FROM FINANCIAL ASSETS AND LIABILITIES AT FAIR VALUE THROUGH PROFIT OR LOSS | MACRO Consolidated | Change | ||||||||||||||||||||||||||
| In MILLION $ (Measuring Unit Current at EOP) | 3Q21 | 4Q21 | 1Q22 | 2Q22 | 3Q22 | QoQ | YoY | |||||||||||||||||||||
| Profit or loss from government securities | 4,901 | 4,560 | 2,007 | 3,531 | 18,223 | 416 | % | 272 | % | |||||||||||||||||||
| Profit or loss from private securities | 892 | -75 | 216 | 4,970 | 7,049 | 42 | % | 690 | % | |||||||||||||||||||
| Profit or loss from investment in derivative financing instruments | 0 | 0 | 0 | 9 | 105 | - | - | |||||||||||||||||||||
| Profit or loss from other financial assets | -2 | -11 | -4 | -5 | -35 | 600 | % | - | ||||||||||||||||||||
| Profit or loss from investment in equity instruments | -92 | 973 | 5,467 | 323 | -81 | -125 | % | - | ||||||||||||||||||||
| Profit or loss from the sale of financial assets at fair value | 759 | 442 | 1,439 | 178 | 270 | 52 | % | -64 | % | |||||||||||||||||||
| Income from financial assets at fair value through profit or loss | 6,458 | 5,889 | 9,125 | 9,006 | 25,531 | 183 | % | 295 | % | |||||||||||||||||||
| Profit or loss from derivative financing instruments | -131 | -14 | 0 | 0 | 0 | - | - | |||||||||||||||||||||
| Income from financial liabilities at fair value through profit or loss | -131 | -14 | 0 | 0 | 0 | - | - | |||||||||||||||||||||
| NET INCOME FROM FINANCIAL ASSETS AT FAIR VALUE THROUGH PROFIT OR LOSS | 6,327 | 5,875 | 9,125 | 9,006 | 25,531 | 183 | % | 304 | % | |||||||||||||||||||
In the quarter Other Operating Income totaled Ps.3.7 billion, 20% or Ps.911 million lower than in 2Q22. On a yearly basis, Other Operating Income increased 16% or Ps.517 million.
| OTHER OPERATING INCOME | MACRO Consolidated | Change | ||||||||||||||||||||||||||
| In MILLION $ (Measuring Unit Current at EOP) | 3Q21 | 4Q21 | 1Q22 | 2Q22 | 3Q22 | QoQ | YoY | |||||||||||||||||||||
| Credit and debit cards | 161 | 235 | 260 | 278 | 292 | 5 | % | 81 | % | |||||||||||||||||||
| Lease of safe deposit boxes | 501 | 494 | 492 | 463 | 436 | -6 | % | -13 | % | |||||||||||||||||||
| Other service related fees | 1,417 | 1,202 | 1,170 | 1,100 | 1,120 | 2 | % | -21 | % | |||||||||||||||||||
| Other adjustments and interest from other receivables | 507 | 504 | 614 | 762 | 970 | 27 | % | 91 | % | |||||||||||||||||||
| Initial recognition of loans | 0 | 0 | 610 | -510 | -101 | - | - | |||||||||||||||||||||
| Sale of property, plant and equipment | 0 | 4 | 0 | 0 | 0 | - | - | |||||||||||||||||||||
| Others | 642 | 799 | 1,580 | 2,559 | 1,029 | -60 | % | 60 | % | |||||||||||||||||||
| Other Operating Income | 3,228 | 3,303 | 4,744 | 4,656 | 3,745 | -20 | % | 16 | % | |||||||||||||||||||
In 3Q22 Banco Macro’s administrative expenses plus employee benefits totaled Ps.26 billion, decreasing 3% or Ps.854 million compared to the previous quarter, personnel expenses decreased 4% while administrative expenses remained unchaged. On a yearly basis administrative expenses plus employee benefits increased 5% or Ps.1.2 billion.
Employee benefits decreased 4% or Ps.823 million QoQ with lower remunerations and lower employee services, both of them with 7% decreases. On a yearly basis Employee benefits increased 7% or Ps.1.1 billion.
In 3Q22, administrative expenses decreased Ps.31 million, due to lower advertising fees (36% decrease) which is partially offset by a 3% or Ps.35 million increase in
As of 3Q22, the efficiency ratio reached 29.1%, improving from the 31.2 % posted in 2Q22 and considerably better than the 37.6% posted a year ago. In 3Q22 expenses (employee benefits + G&A expenses + depreciation and impairment of assets) decreased 3%, while income (net interest income + net fee income + differences in quoted prices of gold and foreign currency + other operating income + net income from financial assets at fair value through profit or loss – (Turnover Tax + Insurance on deposits)) increased 23% compared to 2Q22.
9
 | 3Q22 Earnings Release |
| PERSONNEL & ADMINISTRATIVE EXPENSES | MACRO Consolidated | Change | ||||||||||||||||||||||||||
| In MILLION $ (Measuring Unit Current at EOP) | 2Q21 | 3Q21 | 4Q21 | 1Q22 | 2Q22 | QoQ | YoY | |||||||||||||||||||||
| Employee benefits | 13,766 | 13,540 | 13,244 | 11,509 | 15,149 | 32 | % | 10 | % | |||||||||||||||||||
| Remunerations | 9,969 | 9,483 | 9,180 | 7,824 | 10,631 | 36 | % | 7 | % | |||||||||||||||||||
| Social Security Contributions | 2,285 | 2,189 | 2,187 | 1,804 | 2,502 | 39 | % | 9 | % | |||||||||||||||||||
| Compensation and bonuses | 1,210 | 1,489 | 1,364 | 1,437 | 1,496 | 4 | % | 24 | % | |||||||||||||||||||
| Employee services | 302 | 379 | 513 | 444 | 520 | 17 | % | 72 | % | |||||||||||||||||||
| Administrative Expenses | 6,373 | 6,741 | 8,028 | 6,468 | 6,826 | 6 | % | 7 | % | |||||||||||||||||||
| Taxes | 982 | 1,012 | 1,009 | 1,012 | 1,146 | 13 | % | 17 | % | |||||||||||||||||||
| Maintenance, conservation fees | 1,085 | 1,161 | 1,211 | 1,044 | 1,071 | 3 | % | -1 | % | |||||||||||||||||||
| Directors & statutory auditors fees | 167 | 182 | 525 | 324 | 221 | -32 | % | 32 | % | |||||||||||||||||||
| Security services | 683 | 703 | 705 | 671 | 647 | -4 | % | -5 | % | |||||||||||||||||||
| Electricity & Communications | 708 | 678 | 657 | 639 | 599 | -6 | % | -15 | % | |||||||||||||||||||
| Other professional fees | 634 | 549 | 674 | 597 | 612 | 3 | % | -3 | % | |||||||||||||||||||
| Rental agreements | 31 | 31 | 40 | 33 | 33 | 0 | % | 6 | % | |||||||||||||||||||
| Advertising & publicity | 279 | 330 | 475 | 298 | 560 | 88 | % | 101 | % | |||||||||||||||||||
| Personnel allowances | 67 | 74 | 135 | 78 | 105 | 35 | % | 57 | % | |||||||||||||||||||
| Stationary & Office Supplies | 42 | 45 | 49 | 45 | 47 | 4 | % | 12 | % | |||||||||||||||||||
| Insurance | 90 | 111 | 86 | 78 | 69 | -12 | % | -23 | % | |||||||||||||||||||
| Hired administrative services | 39 | 45 | 56 | 45 | 41 | - | 5 | % | ||||||||||||||||||||
| Other | 1,566 | 1,820 | 2,406 | 1,604 | 1,675 | 4 | % | 7 | % | |||||||||||||||||||
| Total Administrative Expenses | 20,139 | 20,281 | 21,272 | 17,977 | 21,975 | 22 | % | 9 | % | |||||||||||||||||||
| Total Employees | 8,318 | 8,167 | 8,005 | 7,982 | 7,925 | |||||||||||||||||||||||
| Branches | 464 | 464 | 466 | 466 | 466 | |||||||||||||||||||||||
| Efficiency ratio | 38.8 | % | 37.4 | % | 29.6 | % | 32.7 | % | 25.8 | % | ||||||||||||||||||
| Accumulated efficiency ratio | 37.6 | % | 37.5 | % | 29.6 | % | 31.2 | % | 29.1 | % | ||||||||||||||||||
In 3Q22, Other Operating Expenses totaled Ps.17.3 billion, increasing 14% or Ps.2.1 million QoQ, due to higher Turnover tax and initial loan recognition expenses (16% and Ps.385 million increases respectively). On a yearly basis Other Operating Expenses increased 25% or Ps.3.5 billion.
| OTHER OPERATING EXPENSES | MACRO Consolidated | Change | ||||||||||||||||||||||||||
| In MILLION $ (Measuring Unit Current at EOP) | 3Q21 | 4Q21 | 1Q22 | 2Q22 | 3Q22 | QoQ | YoY | |||||||||||||||||||||
| Turnover Tax | 7,347 | 7,668 | 7,942 | 8,090 | 9,420 | 16 | % | 28 | % | |||||||||||||||||||
| Other provision charges | 612 | 839 | 612 | 646 | 1,019 | 58 | % | 67 | % | |||||||||||||||||||
| Deposit Guarantee Fund Contributions | 411 | 403 | 393 | 393 | 407 | 4 | % | -1 | % | |||||||||||||||||||
| Donations | 13 | 32 | 179 | 16 | 139 | 769 | % | 969 | % | |||||||||||||||||||
| Insurance claims | 35 | 62 | 77 | 71 | 97 | 37 | % | 177 | % | |||||||||||||||||||
| Initial loan recognition | 214 | 1,330 | 0 | 0 | 385 | 100 | % | 80 | % | |||||||||||||||||||
| Others | 5,172 | 6,075 | 5,281 | 5,926 | 5,808 | -2 | % | 12 | % | |||||||||||||||||||
| Other Operating Expenses | 13,804 | 16,409 | 14,484 | 15,142 | 17,275 | 14 | % | 25 | % | |||||||||||||||||||
In 3Q22 the result from the net monetary position totaled a Ps.58.3 billion loss, 25% or Ps.11.7 billion higher than the loss posted in 2Q22 and 149% or Ps.34.9 billion higher than the loss registered in 3Q21. Higher inflation was observed during the quarter (467 b.p. above 2Q22 level, up from 17.3% to 22%).
| OPERATING RESULT | MACRO consolidated | Change | ||||||||||||||||||||||||||
| In MILLION $ (Measuring Unit Current at EOP) | 3Q21 | 4Q21 | 1Q22 | 2Q22 | 3Q22 | QoQ | YoY | |||||||||||||||||||||
| Operating Result (exc. Loss from net monetary position) | 37,443 | 37,166 | 52,277 | 54,223 | 75,099 | 39 | % | 101 | % | |||||||||||||||||||
| Result from net monetary position (i.e. inflation adjustment) | -23,458 | -25,206 | -41,375 | -46,592 | -58,335 | 25 | % | 149 | % | |||||||||||||||||||
| Operating Result (Inc. Loss from net monetary position) | 13,985 | 11,960 | 10,902 | 7,631 | 16,764 | 120 | % | 20 | % | |||||||||||||||||||
In 3Q22 Banco Macro's effective income tax rate was 46.7%. For more information please see note 22 to our Financial Statements.
10
| 3Q22 Earnings Release |
Financial Assets
Private sector financing
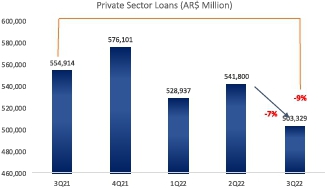
The volume of “core” financing to the private sector (including loans, financial trust and leasing portfolio) totaled Ps.506.8 billion, decreasing 7% or Ps.37.2 billion QoQ and 9% or Ps.53.1 billion YoY.
Within Commercial loans Overdrafts and Documents, stand out with an 18% or Ps.8.7 billion decrease and a 9% or Ps.5.5 billion increase respectively.
Meanwhile within Consumer lending both Personal loans decreased 12% or Ps.16.3 billion while Credit card loans decreased 6% or Ps.9.6 billion.
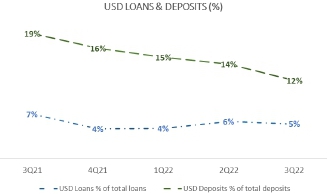
Within private sector financing, peso financing decreased 6% or Ps.33.3 billion, while US dollar financing decreased 26% or USD 63 million.
As of 3Q22, Banco Macro´s market share over private sector loans was 7.3%.
| FINANCING TO THE PRIVATE SECTOR | MACRO Consilidated | Change | ||||||||||||||||||||||||||
| In MILLION $ (Measuring Unit Current at EOP) | 3Q21 | 4Q21 | 1Q22 | 2Q22 | 3Q22 | QoQ | YoY | |||||||||||||||||||||
| Overdrafts | 35,693 | 38,638 | 37,511 | 48,384 | 39,658 | -18 | % | 11 | % | |||||||||||||||||||
| Discounted documents | 68,350 | 65,865 | 52,997 | 58,464 | 63,931 | 9 | % | -6 | % | |||||||||||||||||||
| Mortgage loans | 32,318 | 36,561 | 31,344 | 25,063 | 20,929 | -16 | % | -35 | % | |||||||||||||||||||
| Pledged loans | 11,098 | 12,167 | 10,669 | 9,874 | 7,992 | -19 | % | -28 | % | |||||||||||||||||||
| Personal loans | 155,072 | 155,471 | 150,060 | 141,135 | 124,832 | -12 | % | -20 | % | |||||||||||||||||||
| Credit Card loans | 144,411 | 157,709 | 154,896 | 163,689 | 154,108 | -6 | % | 7 | % | |||||||||||||||||||
| Others | 58,046 | 58,455 | 41,685 | 47,155 | 43,043 | -9 | % | -26 | % | |||||||||||||||||||
| Interest | 49,926 | 51,235 | 49,775 | 48,036 | 48,836 | 2 | % | -2 | % | |||||||||||||||||||
| Total loan portfolio | 554,914 | 576,101 | 528,937 | 541,800 | 503,329 | -7 | % | -9 | % | |||||||||||||||||||
| Total loans in Pesos | 520,137 | 551,576 | 505,941 | 512,585 | 477,984 | -7 | % | -8 | % | |||||||||||||||||||
| Total loans in USD | 34,777 | 24,525 | 22,996 | 29,215 | 25,345 | -13 | % | -27 | % | |||||||||||||||||||
| Financial trusts | 636 | 882 | 955 | 553 | 1,152 | 108 | % | 81 | % | |||||||||||||||||||
| Leasing | 335 | 794 | 770 | 777 | 1,072 | 38 | % | 220 | % | |||||||||||||||||||
| Others | 3,984 | 1,789 | 1,212 | 872 | 1,202 | 38 | % | -70 | % | |||||||||||||||||||
| Total other financing | 4,955 | 3,465 | 2,937 | 2,202 | 3,426 | 56 | % | -31 | % | |||||||||||||||||||
| Total other financing in Pesos | 2,910 | 2,471 | 2,082 | 1,373 | 2,637 | 92 | % | -9 | % | |||||||||||||||||||
| Total other financing in USD | 2,045 | 994 | 855 | 829 | 789 | -5 | % | -61 | % | |||||||||||||||||||
| Total financing to the private sector | 559,869 | 579,566 | 531,874 | 544,002 | 506,755 | -7 | % | -9 | % | |||||||||||||||||||
| EOP FX (Pesos per USD) | 98.7350 | 102.7500 | 110.9783 | 125.2150 | 147.3150 | 18 | % | 49 | % | |||||||||||||||||||
| USD financing / Financing to the private sector | 7 | % | 4 | % | 4 | % | 6 | % | 5 | % | ||||||||||||||||||
11
| 3Q22 Earnings Release |
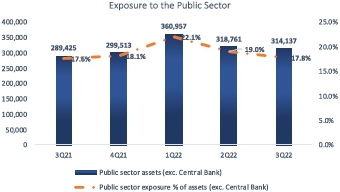
Public Sector Assets
In 3Q22, the Bank’s public sector assets (excluding LELIQs and Central Bank Notes) to total assets ratio was 17.8%, lower than the 19% registered in the previous quarter, and higher than the 17.6% posted in 3Q21.
In 2Q22, a 22% or Ps.74.7 billion increase in Leliqs stands out.
| PUBLIC SECTOR ASSETS | MACRO Consolidated | Change | ||||||||||||||||||||||||||
| In MILLION $ (Measuring Unit Current at EOP) | 3Q21 | 4Q21 | 1Q22 | 2Q22 | 3Q22 | QoQ | YoY | |||||||||||||||||||||
| Central Bank Notes | - | - | - | 26,364.00 | 35,329 | |||||||||||||||||||||||
| Leliqs | 238,640 | 220,829 | 303,200 | 342,999 | 417,716 | 22 | % | 75 | % | |||||||||||||||||||
| Other | 284,572 | 295,670 | 358,353 | 315,235 | 312,706 | -1 | % | 10 | % | |||||||||||||||||||
| Government securities | 523,212 | 516,499 | 661,553 | 684,598 | 765,751 | 12 | % | 46 | % | |||||||||||||||||||
| Provincial loans | 4,533 | 3,544 | 2,604 | 3,526 | 1,431 | -59 | % | -68 | % | |||||||||||||||||||
| Loans | 4,533 | 3,544 | 2,604 | 3,526 | 1,431 | -59 | % | -68 | % | |||||||||||||||||||
| Purchase of government bonds | 320 | 299 | - | 0 | 0 | - | -100 | % | ||||||||||||||||||||
| Other receivables | 320 | 299 | 0 | 0 | 0 | - | -100 | % | ||||||||||||||||||||
| TOTAL PUBLIC SECTOR ASSETS | 528,065 | 520,342 | 664,157 | 688,124 | 767,182 | 11 | % | 45 | % | |||||||||||||||||||
| TOTAL PUBLIC SECTOR ASSETS (net of LEBAC/NOBAC/LELIQ) | 289,425 | 299,513 | 360,957 | 318,761 | 314,137 | -1 | % | 9 | % | |||||||||||||||||||
| TOTAL PUBLIC SECTOR ASSETS (net of LEBAC/NOBAC/LELIQ)/TOTAL ASSETS | 17.6 | % | 18.1 | % | 22.1 | % | 19.0 | % | 17.8 | % | ||||||||||||||||||
Funding
Deposits
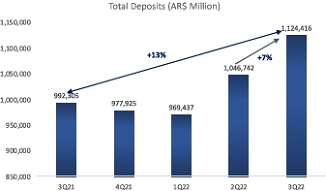
Banco Macro’s deposit base totaled Ps.1.1 trillion in 3Q22, increasing 7% or Ps.77.7 billion QoQ and a 13% or Ps.132.1 billion increase YoY and representing 84% of the Bank’s total liabilities.
On a quarterly basis, private sector deposits increased 5% or Ps.45.3 billion while public sector deposits increased 32% or Ps.32.6 billion.
The increase in private sector deposits was led by time deposits, which increased 7% or Ps.34.5 billion, while demand deposits decreased 5% or Ps.21.4 billion QoQ.
Within private sector deposits, peso deposits increased 10% or Ps.94.3 billion, while US dollar deposits decreased 25% or USD 289 million.
As of 3Q22, Banco Macro´s market share over private sector deposits was 6.5%.
12
| 3Q22 Earnings Release |
| DEPOSITS | MACRO Consolidated | Change | ||||||||||||||||||||||||||
| In MILLION $ (Measuring Unit Current at EOP) | 3Q21 | 4Q21 | 1Q22 | 2Q22 | 3Q22 | QoQ | YoY | |||||||||||||||||||||
| Public sector | 98,708 | 93,670 | 112,825 | 102,190 | 134,773 | 32 | % | 37 | % | |||||||||||||||||||
| Financial sector | 1,519 | 1,596 | 1,479 | 1,492 | 1,273 | -15 | % | -16 | % | |||||||||||||||||||
| Private sector | 892,078 | 882,659 | 855,133 | 943,060 | 988,370 | 5 | % | 11 | % | |||||||||||||||||||
| Checking accounts | 180,273 | 167,516 | 156,283 | 162,322 | 149,090 | -8 | % | -17 | % | |||||||||||||||||||
| Savings accounts | 268,492 | 305,492 | 268,609 | 287,854 | 279,727 | -3 | % | 4 | % | |||||||||||||||||||
| Time deposits | 420,587 | 387,695 | 410,435 | 471,142 | 505,632 | 7 | % | 20 | % | |||||||||||||||||||
| Other | 22,726 | 21,956 | 19,806 | 21,742 | 53,921 | 148 | % | 137 | % | |||||||||||||||||||
| Total | 992,305 | 977,925 | 969,437 | 1,046,742 | 1,124,416 | 7 | % | 13 | % | |||||||||||||||||||
| Pesos | 808,246 | 817,493 | 823,634 | 899,835 | 994,147 | 10 | % | 23 | % | |||||||||||||||||||
| Foreign Currency (Pesos) | 184,059 | 160,432 | 145,803 | 146,907 | 130,269 | -11 | % | -29 | % | |||||||||||||||||||
| EOP FX (Pesos per USD) | 98.7350 | 102.7500 | 110.9783 | 125.2150 | 147.3150 | 18 | % | 49 | % | |||||||||||||||||||
| Foreign Currency (USD) | 1,864 | 1,561 | 1,314 | 1,173 | 884 | -25 | % | -53 | % | |||||||||||||||||||
| USD Deposits / Total Deposits | 19 | % | 16 | % | 15 | % | 14 | % | 12 | % | ||||||||||||||||||
Banco Macro’s transactional deposits represent approximately 43% of its total deposit base as of 3Q22. These accounts are low cost and are not sensitive to interest rate increases.
Other sources of funds
In 3Q22, the total amount of other sources of funds increased 2% or Ps.9.2 billion compared to 2Q22. On a yearly basis other sources of funds increased 7% or Ps.31.1 billion. In 3Q22 Shareholder’s Equity increased 3% or Ps.10.9 billion due to the total comprehensive income registered in the quarter, this increase was partially offset by a Ps.1.3 billion decrease in subordinated corporate bonds.
| OTHER SOURCES OF FUNDS | MACRO Consolidated | Change | ||||||||||||||||||||||||||
| In MILLION $ (Measuring Unit Current at EOP) | 3Q21 | 4Q21 | 1Q22 | 2Q22 | 3Q22 | QoQ | YoY | |||||||||||||||||||||
| Central Bank of Argentina | 40 | 36 | 32 | 40 | 31 | -23 | % | -23 | % | |||||||||||||||||||
| Banks and international institutions | 934 | 456 | 230 | 2,348 | 1,752 | -25 | % | 88 | % | |||||||||||||||||||
| Financing received from Argentine financial institutions | 115 | 235 | 2,612 | 512 | 649 | 27 | % | 464 | % | |||||||||||||||||||
| Subordinated corporate bonds | 75,115 | 69,708 | 65,858 | 62,248 | 60,993 | -2 | % | -19 | % | |||||||||||||||||||
| Corporate bonds | 4,646 | 4,967 | 4,430 | 2,323 | 2,305 | -1 | % | -50 | % | |||||||||||||||||||
| Shareholders' equity | 378,592 | 396,199 | 403,957 | 413,891 | 424,835 | 3 | % | 12 | % | |||||||||||||||||||
| Total other source of funds | 459,442 | 471,601 | 477,119 | 481,362 | 490,565 | 2 | % | 7 | % | |||||||||||||||||||
13
| 3Q22 Earnings Release |
Liquid Assets
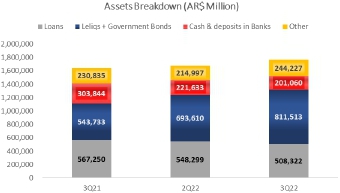
In 3Q22, the Bank’s liquid assets amounted to Ps.1 trillion, showing an 8% or Ps.78 billion increase QoQ, and a 14% or Ps.124.9 billion increase on a yearly basis.
In 3Q22, Leliqs increased 22% or Ps.74.7 billion, Net Repos increased 65% or Ps.24.4 billion and were partially offset by a 9% or Ps.20.6 decrease in Cash.
In 3Q22 Banco Macro’s liquid assets to total deposits ratio reached 90%.
| LIQUID ASSETS | MACRO Consolidated | Change | ||||||||||||||||||||||||||
| In MILLION $ (Measuring Unit Current at EOP) | 3Q21 | 4Q21 | 1Q22 | 2Q22 | 3Q22 | QoQ | YoY | |||||||||||||||||||||
| Cash | 303,844 | 286,199 | 251,151 | 221,633 | 201,060 | -9 | % | -34 | % | |||||||||||||||||||
| Guarantees for compensating chambers | 26,795 | 25,783 | 22,892 | 20,831 | 22,856 | 10 | % | -15 | % | |||||||||||||||||||
| Leliq own portfolio | 238,640 | 220,829 | 287,036 | 342,999 | 417,716 | 22 | % | 75 | % | |||||||||||||||||||
| Net Repos | 37,743 | 52,157 | -16,961 | 37,759 | 62,129 | 65 | % | 65 | % | |||||||||||||||||||
| Other government & private securities | 284,572 | 295,670 | 358,353 | 315,235 | 312,706 | -1 | % | 10 | % | |||||||||||||||||||
| Total | 893,300 | 880,638 | 902,471 | 938,457 | 1,016,467 | 8 | % | 14 | % | |||||||||||||||||||
| Liquid assets to total deposits | 93 | % | 90 | % | 90 | % | 93 | % | 90 | % | ||||||||||||||||||
Solvency
Banco Macro continued showing high solvency levels in 3Q22 with an integrated capital (RPC) of Ps.440.7 billion over a total capital requirement of Ps.88.8 billion. Banco Macro’s excess capital in 3Q22 was 396% or Ps.351.9 billion.
The regulatory capital ratio (as a percentage of risk-weighted assets- RWA) was 40.4% in 2Q22; TIER1 Ratio stood at 36.1%.
The Bank’s aim is to make the best use of this excess capital.
| MINIMUM CAPITAL REQUIREMENT | MACRO Consolidated | Change | ||||||||||||||||||||||||||
| In MILLION $ | 3Q21 | 4Q21 | 1Q22 | 2Q22 | 3Q22 | QoQ | YoY | |||||||||||||||||||||
| Credit risk requirement | 34,030 | 36,726 | 40,488 | 45,204 | 52,233 | 16 | % | 53 | % | |||||||||||||||||||
| Market risk requirement | 1,631 | 3,585 | 3,886 | 4,643 | 9,998 | 115 | % | 513 | % | |||||||||||||||||||
| Operational risk requirement | 15,691 | 17,438 | 19,206 | 21,817 | 26,568 | 22 | % | 69 | % | |||||||||||||||||||
| Total capital requirements | 51,352 | 57,749 | 63,581 | 71,664 | 88,800 | 24 | % | 73 | % | |||||||||||||||||||
| Ordinary Capital Level 1 (COn1) | 203,858 | 233,700 | 279,447 | 336,826 | 418,322 | 24 | % | 105 | % | |||||||||||||||||||
| Deductible concepts Level 1 (COn1) | -12,411 | -14,585 | -16,866 | -21,154 | -24,630 | 16 | % | 98 | % | |||||||||||||||||||
| Capital Level 2 (COn2) | 42,565 | 36,401 | 37,615 | 40,243 | 47,051 | 17 | % | 11 | % | |||||||||||||||||||
| Integrated capital - RPC (i) | 234,012 | 255,516 | 300,196 | 355,914 | 440,743 | 24 | % | 88 | % | |||||||||||||||||||
| Excess capital | 182,660 | 197,767 | 236,615 | 284,250 | 351,943 | 24 | % | 93 | % | |||||||||||||||||||
| Risk-weighted assets - RWA (ii) | 629,505 | 708,490 | 780,016 | 879,341 | 1,090,977 | 24 | % | 73 | % | |||||||||||||||||||
| Regulatory Capital ratio [(i)/(ii)] | 37.2 | % | 36.1 | % | 38.5 | % | 40.5 | % | 40.4 | % | ||||||||||||||||||
| Ratio TIER 1 [Capital Level 1/RWA] | 30.4 | % | 30.9 | % | 33.7 | % | 35.9 | % | 36.1 | % | ||||||||||||||||||
RWA - (ii): Risk Weighted Assets, considering total capital requirements.
14
| 3Q22 Earnings Release |
Asset Quality
In 3Q22, Banco Macro’s non-performing to total financing ratio (under Central Bank rules) reached a level of 1.27%, unchanged from the 1.25% registered in 2Q22, and below the 1.67% posted in 3Q21.
Consumer portfolio non-performing loans were unchanged (down to 1.23% from 1.24%) while Commercial portfolio non-performing loans increased 15b.p. in 3Q22 (up to 1.43% from 1.28%).
The coverage ratio (measured as total allowances under Expected Credit Losses over Non Performing loans under Central Bank rules) reached to 153.13% in 3Q22. Write-offs over total loans totaled 0.14%.
The Bank is committed to continue working in this area to maintain excellent asset quality standards.
| ASSET QUALITY | MACRO Consolidated | Change | ||||||||||||||||||||||||||
| In MILLION $ (Measuring Unit Current at EOP) | 3Q21 | 4Q21 | 1Q22 | 2Q22 | 3Q22 | QoQ | YoY | |||||||||||||||||||||
| Commercial portfolio | 151,305 | 144,734 | 116,074 | 119,233 | 103,707 | -13 | % | -31 | % | |||||||||||||||||||
| Non-performing | 857 | 1,439 | 3,211 | 1,521 | 1,480 | -3 | % | 73 | % | |||||||||||||||||||
| Consumer portfolio | 438,415 | 463,609 | 435,588 | 448,121 | 423,016 | -6 | % | -4 | % | |||||||||||||||||||
| Non-performing | 8,975 | 6,472 | 5,865 | 5,567 | 5,224 | -6 | % | -42 | % | |||||||||||||||||||
| Total portfolio | 589,720 | 608,343 | 551,662 | 567,354 | 526,723 | -7 | % | -11 | % | |||||||||||||||||||
| Non-performing | 9,832 | 7,911 | 9,076 | 7,088 | 6,704 | -5 | % | -32 | % | |||||||||||||||||||
| Commercial non-perfoming ratio | 0.57 | % | 0.99 | % | 2.77 | % | 1.28 | % | 1.43 | % | ||||||||||||||||||
| Consumer non-perfoming ratio | 2.05 | % | 1.40 | % | 1.35 | % | 1.24 | % | 1.23 | % | ||||||||||||||||||
| Total non-performing/ Total portfolio | 1.67 | % | 1.30 | % | 1.65 | % | 1.25 | % | 1.27 | % | ||||||||||||||||||
| Total allowances | 17,296 | 16,581 | 14,806 | 11,319 | 10,266 | -9 | % | -41 | % | |||||||||||||||||||
| Coverage ratio w/allowances | 175.92 | % | 209.59 | % | 163.13 | % | 159.69 | % | 153.13 | % | ||||||||||||||||||
| Write Offs | 2,053 | 952 | 810 | 672 | 728 | 8 | % | -65 | % | |||||||||||||||||||
| Write Offs/ Total portfolio | 0.35 | % | 0.16 | % | 0.15 | % | 0.12 | % | 0.14 | % | ||||||||||||||||||
15
| | 3Q22 Earnings Release |
CER Exposure and Foreign Currency Position
| CER EXPOSURE | MACRO Consolidated | Change | ||||||||||||||||||||||||||
| In MILLION $ (Measuring Unit Current at EOP) | 3Q21 | 4Q21 | 1Q22 | 2Q22 | 3Q22 | QoQ | YoY | |||||||||||||||||||||
| CER adjustable ASSETS | ||||||||||||||||||||||||||||
| Government Securities | 137,071 | 162,652 | 238,758 | 227,848 | 158,403 | -30 | % | 16 | % | |||||||||||||||||||
| Loans (*) | 44,511 | 43,464 | 40,686 | 40,355 | 38,421 | -5 | % | -14 | % | |||||||||||||||||||
| Private sector loans | 12,826 | 11,615 | 9,836 | 8,545 | 7,061 | -17 | % | -45 | % | |||||||||||||||||||
| Mortgage loans (UVA adjusted) | 31,662 | 31,829 | 30,819 | 31,781 | 31,332 | -1 | % | -1 | % | |||||||||||||||||||
| Other loans | 23 | 20 | 31 | 29 | 28 | -3 | % | 22 | % | |||||||||||||||||||
| Total CER adjustable assets | 181,582 | 206,116 | 279,444 | 268,203 | 196,824 | -27 | % | 8 | % | |||||||||||||||||||
| CER adjustable LIABILITIES | ||||||||||||||||||||||||||||
| Deposits (*) | 15,468 | 12,850 | 14,737 | 19,808 | 16,133 | -19 | % | 4 | % | |||||||||||||||||||
| UVA Unemployment fund | 2,591 | 2,662 | 2,748 | 3,149 | 3,456 | 10 | % | 33 | % | |||||||||||||||||||
| Total CER adjustable liabilities | 18,059 | 15,512 | 17,485 | 22,957 | 19,589 | -15 | % | 8 | % | |||||||||||||||||||
| NET CER EXPOSURE | 163,523 | 190,604 | 261,959 | 245,246 | 177,235 | -28 | % | 8 | % | |||||||||||||||||||
(*) Includes Loans &Time Deposits CER adjustable (UVAs)
| FOREIGN CURRENCY POSITION | MACRO Consolidated | Change | ||||||||||||||||||||||||||
| In MILLION $ (Measuring Unit Current at EOP) | 3Q21 | 4Q21 | 1Q22 | 2Q22 | 3Q22 | QoQ | YoY | |||||||||||||||||||||
| Cash and deposits in Banks | 223,869 | 202,659 | 187,113 | 181,545 | 166,983 | -8 | % | -25 | % | |||||||||||||||||||
| Cash | 21,335 | 14,751 | 25,291 | 16,736 | 15,428 | -8 | % | -28 | % | |||||||||||||||||||
| Central Bank of Argentina | 115,765 | 123,036 | 94,664 | 97,895 | 84,229 | -14 | % | -27 | % | |||||||||||||||||||
| Other financial institutions local and abroad | 86,758 | 64,862 | 67,068 | 66,792 | 67,315 | 1 | % | -22 | % | |||||||||||||||||||
| Others | 11 | 10 | 90 | 122 | 11 | -91 | % | 0 | % | |||||||||||||||||||
| Financial instruments at fair value through P&L | 1,696 | 2,049 | 3,081 | 5,951 | 146,601 | 2363 | % | 8544 | % | |||||||||||||||||||
| Other financial assets | 10,523 | 9,947 | 12,311 | 11,997 | 11,732 | -2 | % | 11 | % | |||||||||||||||||||
| Loans and other financing | 36,761 | 25,467 | 23,798 | 29,994 | 26,090 | -13 | % | -29 | % | |||||||||||||||||||
| Non financial private sector& foreign residents | 36,761 | 25,467 | 23,798 | 29,994 | 26,090 | -13 | % | -29 | % | |||||||||||||||||||
| Other debt securities | 21,478 | 56,250 | 48,150 | 47,974 | 40,640 | -15 | % | 89 | % | |||||||||||||||||||
| Guarantees received | 3,817 | 3,814 | 3,567 | 3,221 | 3,404 | 6 | % | -11 | % | |||||||||||||||||||
| Investment in equity instruments | 28 | 117 | 95 | 87 | 124 | 43 | % | 343 | % | |||||||||||||||||||
| Total Assets | 298,172 | 300,303 | 278,115 | 280,769 | 395,574 | 41 | % | 33 | % | |||||||||||||||||||
| Deposits | 184,059 | 160,432 | 145,803 | 146,907 | 130,269 | -11 | % | -29 | % | |||||||||||||||||||
| Non financial public sector | 10,440 | 12,749 | 11,002 | 6,201 | 5,354 | -14 | % | -49 | % | |||||||||||||||||||
| Financial sector | 1,338 | 1,263 | 1,254 | 1,207 | 1,164 | -4 | % | -13 | % | |||||||||||||||||||
| Non financial private sector& foreign residents | 172,281 | 146,420 | 133,547 | 139,499 | 123,751 | -11 | % | -28 | % | |||||||||||||||||||
| Financial liabiities at fair value through P&L | 0 | 210 | 660 | 655 | 667 | 2 | % | - | ||||||||||||||||||||
| Other liabilities from financial intermediation | 15,502 | 10,807 | 10,143 | 11,401 | 12,164 | 7 | % | -22 | % | |||||||||||||||||||
| Financing from the Central Bank and other fin. Inst | 939 | 459 | 230 | 2,355 | 1,767 | -25 | % | 88 | % | |||||||||||||||||||
| Issued corporate bonds | 0 | 0 | 0 | 2,323 | 2,305 | |||||||||||||||||||||||
| Subordinated corporate bonds | 75,115 | 69,708 | 65,858 | 62,248 | 60,993 | -2 | % | -19 | % | |||||||||||||||||||
| Other non financial liabilities | 42 | 67 | 37 | 74 | 64 | -14 | % | 52 | % | |||||||||||||||||||
| Total Liabilities | 275,657 | 241,683 | 222,731 | 225,963 | 208,229 | -8 | % | -24 | % | |||||||||||||||||||
| NET FX POSITION (Pesos) | 22,515 | 58,620 | 55,384 | 54,806 | 187,345 | 242 | % | 732 | % | |||||||||||||||||||
| EOP FX (Pesos per USD) | 98.7350 | 102.7500 | 110.9783 | 125.2150 | 147.3150 | 18 | % | 49 | % | |||||||||||||||||||
| NET FX POSITION (USD) | 228 | 571 | 499 | 438 | 1,272 | 191 | % | 458 | % | |||||||||||||||||||
16
| | 3Q22 Earnings Release |
3Q22 Snapshot
In AR$ Million. Figures of previous quarters have been restated to reflect the accumulated effect of the inflation adjustment for each period through September 30, 2022
 |  |
 |  |
 |  |
 |  |
17
| | 3Q22 Earnings Release |
 |  |
 |  |
 |  |
18
| 3Q22 Earnings Release |
Relevant and Recent Events
| · | On April 29th 2022 TheShareholders’ Meetingresolved to distribute as dividend to the shareholders in cash and/or in kind, in the latter case valued at market price, the amount of AR$ 14,187,872,701.21, which represents AR$ 22.18 per share, subject to prior authorization from the Banco Central de la República Argentina (“BCRA”), and delegated to the Board the powers to determine the date of the effective availability thereof to the shareholders, currency, terms and other payment terms and conditions of such dividend. |
| On May 12th the Superintendencia de Entidades Financieras y Cambiarias of the Central Bank of the Republic of Argentina informed us that it has decided to authorize Banco Macro S.A. to distribute profits in cash and/or in kind (securities) for an aggregate amount of AR $19,751,444,343.74, which distribution shall be carried out in 12 monthly equal and consecutive instalments. |
As of this date the Bank has paid
| · | On June 7, 2022 a cash dividend in the amount of Ps.9,875,722,171.88 (installments 1 through 6) |
| · | On July 6, 2022 a cash dividend in the amount of Ps.1.645.953.695,31 (installment 7) |
| · | On August 2, 2022 a cash dividend in the amount of Ps.1.645.953.695,31 (installment 8) |
| · | On September 6, 2022 a cash dividend in the amount of Ps. 1.645.953.695,31 (installment 9) |
| · | On October 4, 2022 a cash dividend in the amount of Ps. 1.645.953.695,31 (installment 10) |
| · | On November 1, 2022 a cash dividend in the amount of Ps. 1.645.953.695,31 (installment 11) |
| · | Interest Payment Series E Dollar denominated Notes. In November 2022, the Bank paid quarterly interest on Class E dollar denominated notes in the amount of USD 62,131.5. |
| · | Interest Payment Series A Subordinated Notes. In November 2022, the Bank paid semiannual interest on Series A Subordinated notes in the amount of USD 13.286.000. |
Regulatory Changes
| · | Monetary policy rate. On September 15, 2022 through Communication “A” 7605 the Central Bank of Argentina increased the applicable percentages (over Leliq rates) for the determination of minimum time deposit rates: time deposits made by individuals which do not exceed the amount of $10 million: 100% (75% nominal annual), deposits not included in the previous item: 88.67% of the Leliq rate (66.50%), effective as of September 26, 2022. |
In terms of Productive Investment Credit Lines for SMEs, maximum rates were increased: from 59% to 64.50% to investment project financing, and from 69% to 74.50% for working capital and discounted instruments financing. As of September 2022, interest rates for credit card financing (up to $200,000) was increased from 71.50% to 77%. On September 15, 2022 the Central Bank of Argentina also decided to increase the monetary policy rate (28-day Leliq) by 550 basis points from 69.50% to 75%.
19
| 3Q22 Earnings Release |
| · | Productive Investment Credit Lines for SMEs. On September 29, 2022 through communication “A” 7615 the Central Bank of Argentina established that for the definition of amounts included in the 2022/2023 quotas, financial institutions must exclude deposits related to “special accounts for holders with agricultural activity”. Minimum reserve requirement. (Communication “A” 7616, 09/30/2022). The BCRA decided (i) To reduce the reserve requirement rate of time deposits (7 points for deposits with a residual period of 29 days and 8 points for deposits of up to 59 days), (ii) eliminate the reduction of requirements by location of branches, |
(iii) enable institutions not included in Group A to integrate requirements with Bonte 27 (except sight deposits and unutilized balances), (iv) enable to integrate sight deposits with LELIQ (Group A: 4 points, all other: 10 points), (v) eliminate franchises not linked to credits, (vi) eliminate special requirement rates
| · | Minimum reserve requirements. On September 22, 2022, through Communication “A” the Central Bank of Argentina allowed the integration of up to 45% of reserve requirements over peso deposits of payment services providers that offer payment accounts with Government Bonds in pesos maturing on May 23, 2027. On September 27 through Communication “A” 7614 the Central Bank of Argentina increased to 630 consecutive days (from 450) the maximum duration of national public securities in pesos purchased through primary market since September 28, 2022, used to integrate minimum reserve requirements. It also established that as of September 27, 2022, that the minimum reserve requirement that financial institutions can integrate with LELIQ will also be able to be integrated with public securities in “dual currency” (which are now exclude from public sector financing limits). |
20
| 3Q22 Earnings Release |
| QUARTERLY BALANCE SHEET | MACRO Consolidated | Change | ||||||||||||||||||||||||||
| In MILLION $ (Measuring Unit Current at EOP) | 3Q21 | 4Q21 | 1Q22 | 2Q22 | 3Q22 | QoQ | YoY | |||||||||||||||||||||
| ASSETS | ||||||||||||||||||||||||||||
| Cash and deposits in Banks | 303,844 | 286,199 | 251,151 | 221,633 | 201,060 | -9 | % | -34 | % | |||||||||||||||||||
| Cash | 45,681 | 44,216 | 45,937 | 35,398 | 33,589 | -5 | % | -26 | % | |||||||||||||||||||
| Central Bank of Argentina | 171,351 | 177,103 | 138,039 | 119,307 | 99,991 | -16 | % | -42 | % | |||||||||||||||||||
| Other local & foreign entities | 86,801 | 64,869 | 67,085 | 66,805 | 67,470 | 1 | % | -22 | % | |||||||||||||||||||
| Other | 11 | 11 | 90 | 123 | 10 | -92 | % | -9 | % | |||||||||||||||||||
| Debt securities at fair value through profit & loss | 38,880 | 53,819 | 46,134 | 119,998 | 179,169 | 49 | % | 361 | % | |||||||||||||||||||
| Derivatives | 2 | 2 | 0 | 12 | 138 | - | - | |||||||||||||||||||||
| Repo Transactions | 41,056 | 52,157 | 0 | 38,177 | 62,480 | - | 52 | % | ||||||||||||||||||||
| Other financial assets | 39,222 | 58,398 | 35,730 | 34,244 | 32,429 | -5 | % | -17 | % | |||||||||||||||||||
| Loans & other receivables | 567,250 | 585,138 | 534,924 | 548,299 | 508,322 | -7 | % | -10 | % | |||||||||||||||||||
| Non Financial Public Sector | 4,901 | 3,946 | 2,991 | 3,955 | 1,780 | -55 | % | -64 | % | |||||||||||||||||||
| Financial Sector | 3,116 | 2,508 | 1,014 | 895 | 939 | 5 | % | -70 | % | |||||||||||||||||||
| Non Financial private sector and foreign | 559,233 | 578,684 | 530,919 | 543,449 | 505,603 | -7 | % | -10 | % | |||||||||||||||||||
| Other debt securities | 504,853 | 474,937 | 605,100 | 573,612 | 632,344 | 10 | % | 25 | % | |||||||||||||||||||
| Financial assets in guarantee | 34,504 | 29,834 | 45,854 | 24,963 | 27,258 | 9 | % | -21 | % | |||||||||||||||||||
| Income tax assets | 0 | 903 | 282 | 1,551 | 0 | |||||||||||||||||||||||
| Investments in equity instruments | 3,817 | 3,620 | 682 | 714 | 677 | -5 | % | -82 | % | |||||||||||||||||||
| Investments in other companies (subsidiaries and joint ventures) | 720 | 813 | 933 | 840 | 964 | 15 | % | 34 | % | |||||||||||||||||||
| Property, plant and equipment | 88,133 | 87,807 | 87,153 | 87,044 | 86,539 | -1 | % | -2 | % | |||||||||||||||||||
| Intangible assets | 13,806 | 13,957 | 13,904 | 14,738 | 15,017 | 2 | % | 9 | % | |||||||||||||||||||
| Deferred income tax assets | 62 | 79 | 60 | 121 | 90 | -26 | % | 45 | % | |||||||||||||||||||
| Other non financial assets | 4,036 | 3,871 | 4,757 | 7,236 | 13,372 | 85 | % | 231 | % | |||||||||||||||||||
| Non-current assets held for sale | 5,477 | 5,383 | 5,363 | 5,357 | 5,263 | -2 | % | -4 | % | |||||||||||||||||||
| TOTAL ASSETS | 1,645,662 | 1,656,917 | 1,632,027 | 1,678,539 | 1,765,122 | 5 | % | 7 | % | |||||||||||||||||||
| LIABILITIES | ||||||||||||||||||||||||||||
| Deposits | 992,305 | 977,925 | 969,437 | 1,046,742 | 1,124,416 | 7 | % | 13 | % | |||||||||||||||||||
| Non Financial Public Sector | 98,708 | 93,670 | 112,825 | 102,190 | 134,773 | 32 | % | 37 | % | |||||||||||||||||||
| Financial Sector | 1,519 | 1,596 | 1,479 | 1,492 | 1,273 | -15 | % | -16 | % | |||||||||||||||||||
| Non Financial private sector and foreign | 892,078 | 882,659 | 855,133 | 943,060 | 988,370 | 5 | % | 11 | % | |||||||||||||||||||
| Liabilities at fair value through profit & loss | 4,064 | 2,703 | 660 | 659 | 667 | 1 | % | -84 | % | |||||||||||||||||||
| Derivatives | 4 | 4 | 11 | 1 | 2 | - | 0 | % | ||||||||||||||||||||
| Repo Transactions | 3,313 | - | 16,961 | 418 | 351 | - | -86 | % | ||||||||||||||||||||
| Other financial liabilities | 85,308 | 111,923 | 84,761 | 86,054 | 84,975 | -1 | % | 0 | % | |||||||||||||||||||
| Financing received from Central Bank and Other Financial Institutions | 1,089 | 727 | 2,874 | 2,900 | 2,433 | -16 | % | 123 | % | |||||||||||||||||||
| Issued Corporate Bonds | 4,646 | 4,967 | 4,430 | 2,323 | 2,305 | -1 | % | -50 | % | |||||||||||||||||||
| Current income tax liabilities | 4,452 | 583 | 793 | 781 | 6,733 | 762 | % | 51 | % | |||||||||||||||||||
| Subordinated corporate bonds | 75,115 | 69,708 | 65,858 | 62,248 | 60,993 | -2 | % | -19 | % | |||||||||||||||||||
| Provisions | 2,508 | 2,726 | 2,865 | 2,860 | 3,144 | 10 | % | 25 | % | |||||||||||||||||||
| Deferred income tax liabilities | 14,299 | 9,453 | 10,817 | 11,664 | 13,177 | 13 | % | -8 | % | |||||||||||||||||||
| Other non financial liabilities | 79,962 | 79,936 | 68,558 | 47,956 | 41,027 | -14 | % | -49 | % | |||||||||||||||||||
| TOTAL LIABILITIES | 1,267,065 | 1,260,655 | 1,228,025 | 1,264,606 | 1,340,223 | 6 | % | 6 | % | |||||||||||||||||||
| SHAREHOLDERS' EQUITY | ||||||||||||||||||||||||||||
| Capital Stock | 639 | 639 | 639 | 639 | 639 | 0 | % | 0 | % | |||||||||||||||||||
| Issued Shares premium | 12,430 | 12,430 | 12,430 | 12,430 | 12,430 | 0 | % | 0 | % | |||||||||||||||||||
| Adjustment to Shareholders' Equity | 145,814 | 145,814 | 145,814 | 145,814 | 145,814 | 0 | % | 0 | % | |||||||||||||||||||
| Reserves | 202,321 | 202,321 | 202,321 | 241,143 | 241,143 | 0 | % | 19 | % | |||||||||||||||||||
| Retained earnings | -14,814 | -14,814 | 30,229 | 116 | 116 | - | - | |||||||||||||||||||||
| Other accumulated comprehensive income | 4,652 | 4,766 | 3,911 | 77 | 2,156 | 2700 | % | -54 | % | |||||||||||||||||||
| Net income for the period / fiscal year | 27,550 | 45,043 | 8,613 | 13,672 | 22,537 | 65 | % | -18 | % | |||||||||||||||||||
| Shareholders' Equity attributable to parent company | 378,592 | 396,199 | 403,957 | 413,891 | 424,835 | 3 | % | 12 | % | |||||||||||||||||||
| Shareholders' Equity attributable to non controlling interest | 5 | 63 | 46 | 42 | 64 | 52 | % | 1180 | % | |||||||||||||||||||
| TOTAL SHAREHOLDERS' EQUITY | 378,597 | 396,262 | 404,003 | 413,933 | 424,899 | 3 | % | 12 | % | |||||||||||||||||||
21
| 3Q22 Earnings Release |
| INCOME STATEMENT | MACRO Consolidated | Change | ||||||||||||||||||||||||||
| In MILLION $ (Measuring Unit Current at EOP) | 3Q21 | 4Q21 | 1Q22 | 2Q22 | 3Q22 | QoQ | YoY | |||||||||||||||||||||
| Interest Income | 91,318 | 94,474 | 98,508 | 117,154 | 137,159 | 17 | % | 50 | % | |||||||||||||||||||
| Interest Expense | 36,872 | 35,153 | 38,516 | 51,601 | 73,671 | 43 | % | 100 | % | |||||||||||||||||||
| Net Interest Income | 54,446 | 59,321 | 59,992 | 65,553 | 63,488 | -3 | % | 17 | % | |||||||||||||||||||
| Fee income | 15,863 | 16,184 | 16,129 | 16,146 | 15,841 | -2 | % | 0 | % | |||||||||||||||||||
| Fee expense | 1,541 | 1,636 | 1,512 | 1,589 | 1,599 | 1 | % | 4 | % | |||||||||||||||||||
| Net Fee Income | 14,322 | 14,548 | 14,617 | 14,557 | 14,242 | -2 | % | -1 | % | |||||||||||||||||||
| Subtotal (Net Interest Income + Net Fee Income) | 68,768 | 73,869 | 74,609 | 80,110 | 77,730 | -3 | % | 13 | % | |||||||||||||||||||
| Net Income from financial instruments at Fair Value Through Profit & Loss | 6,327 | 5,875 | 9,125 | 9,006 | 25,531 | 183 | % | 304 | % | |||||||||||||||||||
| Result from assets at amortised cost | - | 151 | - | - | - | - | - | |||||||||||||||||||||
| Difference in quoted prices of gold and foreign currency | 1,083 | 2,657 | 4,414 | 6,562 | 16,030 | 144 | % | 1380 | % | |||||||||||||||||||
| Other operating income | 3,228 | 3,303 | 4,744 | 4,656 | 3,745 | -20 | % | 16 | % | |||||||||||||||||||
| Provision for loan losses | 387 | 3,260 | 1,066 | 942 | 1,425 | 51 | % | 268 | % | |||||||||||||||||||
| Net Operating Income | 79,019 | 82,595 | 91,826 | 99,392 | 121,611 | 22 | % | 54 | % | |||||||||||||||||||
| Personnel expenses | 16,516 | 16,153 | 14,039 | 18,478 | 17,655 | -4 | % | 7 | % | |||||||||||||||||||
| Administrative expenses | 8,223 | 9,793 | 7,890 | 8,326 | 8,295 | 0 | % | 1 | % | |||||||||||||||||||
| Depreciation and impairment of assets | 3,033 | 3,074 | 3,136 | 3,223 | 3,287 | 2 | % | 8 | % | |||||||||||||||||||
| Other operating expenses | 13,804 | 16,409 | 14,484 | 15,142 | 17,275 | 14 | % | 25 | % | |||||||||||||||||||
| Operating Income | 37,443 | 37,166 | 52,277 | 54,223 | 75,099 | 39 | % | 101 | % | |||||||||||||||||||
| Income from associates and joint ventures | -2 | 58 | -51 | -49 | -97 | - | - | |||||||||||||||||||||
| Result from net monetary position | -23,458 | -25,206 | -41,375 | -46,592 | -58,335 | - | - | |||||||||||||||||||||
| Net Income before income tax on cont. operations | 13,983 | 12,018 | 10,851 | 7,582 | 16,667 | 120 | % | 19 | % | |||||||||||||||||||
| Income tax on continuing operations | 522 | -5,477 | 2,255 | 2,527 | 7,784 | 208 | % | 1391 | % | |||||||||||||||||||
| Net Income from continuing operations | 13,461 | 17,495 | 8,596 | 5,055 | 8,883 | 76 | % | -34 | % | |||||||||||||||||||
| Net Income for the period | 13,461 | 17,495 | 8,596 | 5,055 | 8,883 | 76 | % | -34 | % | |||||||||||||||||||
| Net Income of the period attributable to parent company | 13,461 | 17,496 | 8,613 | 5,059 | 8,865 | 75 | % | -34 | % | |||||||||||||||||||
| Net income of the period attributable to non-controlling interests | - | -1 | -17 | -4 | 18 | - | - | |||||||||||||||||||||
| Other Comprehensive Income | 105 | 115 | -855 | -3,834 | 2,079 | - | - | |||||||||||||||||||||
| Foreign currency translation differences in financial statements conversion | -337 | -320 | -369 | -189 | -178 | - | - | |||||||||||||||||||||
| Profits or losses from financial assets measured at fair value through other comprehensive income (FVOCI) (IFRS 9(4.1.2)(a) | 442 | 435 | -486 | -3,645 | 2,257 | - | 411 | % | ||||||||||||||||||||
| TOTAL COMPREHENSIVE INCOME FOR THE PERIOD | 13,566 | 17,610 | 7,741 | 1,221 | 10,962 | 798 | % | -19 | % | |||||||||||||||||||
| Total Comprehensive Income attributable to parent Company | 13,566 | 17,611 | 7,758 | 1,225 | 10,944 | 793 | % | -19 | % | |||||||||||||||||||
| Total Comprehensive Income attributable to non-controlling interests | - | -1 | -17 | -4 | 18 | - | - | |||||||||||||||||||||
22
| 3Q22 Earnings Release |
| QUARTERLY ANNUALIZED RATIOS | MACRO Consolidated | |||||||||||||||||||
| 3Q21 | 4Q21 | 1Q22 | 2Q22 | 3Q22 | ||||||||||||||||
| Profitability & performance | ||||||||||||||||||||
| Net interest margin | 19.1 | % | 21.2 | % | 22.8 | % | 24.7 | % | 28.1 | % | ||||||||||
| Net interest margin adjusted (exc. FX) | 18.7 | % | 20.3 | % | 21.2 | % | 22.5 | % | 22.5 | % | ||||||||||
| Net fee income ratio | 13.7 | % | 12.6 | % | 13.0 | % | 11.7 | % | 7.2 | % | ||||||||||
| Efficiency ratio | 38.8 | % | 37.4 | % | 29.6 | % | 32.7 | % | 25.8 | % | ||||||||||
| Net fee income as % of A&G Expenses | 35.3 | % | 33.7 | % | 44.0 | % | 35.7 | % | 27.9 | % | ||||||||||
| Return on average assets | 3.3 | % | 4.4 | % | 2.2 | % | 1.3 | % | 2.2 | % | ||||||||||
| Return on average equity | 14.6 | % | 18.5 | % | 9.1 | % | 5.1 | % | 8.8 | % | ||||||||||
| Liquidity | ||||||||||||||||||||
| Loans as a percentage of total deposits | 57.2 | % | 59.8 | % | 55.2 | % | 52.4 | % | 45.2 | % | ||||||||||
| Liquid assets as a percentage of total deposits | 90.0 | % | 90.0 | % | 93.0 | % | 90.0 | % | 90.0 | % | ||||||||||
| Capital | ||||||||||||||||||||
| Total equity as a percentage of total assets | 23.0 | % | 23.9 | % | 24.8 | % | 24.7 | % | 24.1 | % | ||||||||||
| Regulatory capital as % of APR | 37.2 | % | 36.1 | % | 38.5 | % | 40.5 | % | 40.4 | % | ||||||||||
| Asset Quality | ||||||||||||||||||||
| Allowances over total loans | 3.0 | % | 2.8 | % | 2.8 | % | 2.1 | % | 2.0 | % | ||||||||||
| Non-performing financing as a percentage of total financing | 1.7 | % | 1.3 | % | 1.6 | % | 1.3 | % | 1.3 | % | ||||||||||
| Coverage ratio w/allowances | 175.9 | % | 209.6 | % | 163.2 | % | 159.7 | % | 153.1 | % | ||||||||||
| Cost of Risk | 0.3 | % | 2.3 | % | 0.8 | % | 0.7 | % | 1.1 | % | ||||||||||
| ACCUMULATED ANNUALIZED RATIOS | MACRO Consolidated | |||||||||||||||||||
| 3Q21 | 4Q21 | 1Q22 | 2Q22 | 3Q22 | ||||||||||||||||
| Profitability & performance | ||||||||||||||||||||
| Net interest margin | 18.4 | % | 19.1 | % | 22.8 | % | 23.8 | % | 25.2 | % | ||||||||||
| Net interest margin adjusted (exc. FX) | 17.8 | % | 18.4 | % | 21.2 | % | 21.9 | % | 22.1 | % | ||||||||||
| Net fee income ratio | 12.4 | % | 12.5 | % | 13.0 | % | 12.3 | % | 10.3 | % | ||||||||||
| Efficiency ratio | 37.6 | % | 37.5 | % | 29.6 | % | 31.2 | % | 29.1 | % | ||||||||||
| Net fee income as % of A&G Expenses | 33.1 | % | 33.3 | % | 44.0 | % | 39.5 | % | 35.5 | % | ||||||||||
| Return on average assets | 2.2 | % | 2.8 | % | 2.2 | % | 1.7 | % | 1.9 | % | ||||||||||
| Return on average equity | 10.1 | % | 12.3 | % | 9.1 | % | 7.1 | % | 7.7 | % | ||||||||||
| Liquidity | ||||||||||||||||||||
| Loans as a percentage of total deposits | 57.2 | % | 59.8 | % | 55.2 | % | 52.4 | % | 45.2 | % | ||||||||||
| Liquid assets as a percentage of total deposits | 90.0 | % | 90.0 | % | 93.0 | % | 90.0 | % | 90.0 | % | ||||||||||
| Capital | ||||||||||||||||||||
| Total equity as a percentage of total assets | 23.0 | % | 23.9 | % | 24.8 | % | 24.7 | % | 24.1 | % | ||||||||||
| Regulatory capital as % of APR | 37.2 | % | 36.1 | % | 38.5 | % | 40.5 | % | 40.4 | % | ||||||||||
| Asset Quality | ||||||||||||||||||||
| Allowances over total loans | 3.0 | % | 2.8 | % | 2.8 | % | 2.1 | % | 2.0 | % | ||||||||||
| Non-performing financing as a percentage of total financing | 1.7 | % | 1.3 | % | 1.6 | % | 1.3 | % | 1.3 | % | ||||||||||
| Coverage ratio w/allowances | 175.9 | % | 209.6 | % | 163.2 | % | 159.7 | % | 153.1 | % | ||||||||||
| Cost of Risk | 0.2 | % | 0.7 | % | 0.8 | % | 0.8 | % | 0.9 | % | ||||||||||
23
SIGNATURE
Pursuant to the requirements of the Securities Exchange Act of 1934, the Registrant has duly caused this report to be signed on its behalf by the undersigned, thereto duly authorized.
Date: November 23, 2022
| MACRO BANK INC. | ||
| By: | /s/ Jorge Francisco Scarinci | |
| Name: Jorge Francisco Scarinci | ||
| Title: Chief Financial Officer | ||