Exhibit 99.1
Investor Presentation Fox-Pitt Kelton Cochran Caronia Waller 2009 Bermuda in Boston Conference |
Cautionary Note Regarding Forward-Looking Statements This presentation may include forward-looking statements, both with respect to us and our industry, that reflect our current views with respect to future events and financial performance. Statements that include the ipate,” “will,”words statements of a future or forward-looking nature identify forward-looking statements. All forward-looking statements address matters that involve risks and uncertainties. Accordingly, there are or will be important factors that could cause actual results to differ materially from those indicated in such statements and, additionally, you should not place undue reliance on any such statements. We believe that these factors include, but are not limited to, the following: 1) unpredictability and severity of catastrophic events; d loss limitation methods; 2) rating 4) cyclicality of demand and pricing in the insurance and’reinsurancebility to implement itsa business strategy during “soft” as well as “hard” markets; f capital and financing; 9)7) adequacy retention of key personnel; 10) competition; 11) potential loss of business from one or more major insurance or reinsurance brokers; 12) implement, successfully and on a timely basis, complex infrastructure, distribution capabilities, systems, procedures and internal controls, and to develop accurate actuarial data to support the business and regulatory and reporting requirements; 13) general economic and market conditions (including inflation, volatility in the credit and capital markets, interest rates and foreign currency exchange rates); 14) the integration of Talbot, IPC and other businesses Validus may acquire or new business ventures f changing financial market Validus may conditions including inflation, interest rates, liquidity and other factors; 16) acts of terrorism or outbreak of war; 17) availability of reinsurance and retrocessional coverage; and 18) failure to realize the anticipated benefits of the amalgamation, including as a result of failure or delay in integrating the businesses of Validus and IPC, as well as management’s response to any The foregoing review of important factors should not be construed as exhaustive and should be read in conjunction with the other cautionary statements that are included herein and elsewhere, including the Risk Factors included in our most recent reports on Form 10-K and Form 10-Q and other documents on file with the Securities and Exchange Commission. Any forward-looking statements made in this presentation are qualified by these cautionary statements, and there can be no assurance that the actual results or developments anticipated by us will be realized or, even if substantially realized, that they will have the expected consequences to, or effects on, us or our business or operations. We undertake no obligation to update publicly or revise any forward-looking statement, whether as a result of new information, future developments or otherwise. |
Note on Non-GAAP Financial Measures In presenting the Company’s results herein, management hasdiluted book valueincluded per share that are not calculated under standards or rules that comprise U.S. GAAP. Such measures are referred to as non-GAAP. Non-GAAP measures may be defined or calculated differently by other companies. We believe that theses measures are important to investors and other interested parties. These measures should not be viewed as a substitute for those determined in accordance with U.S. GAAP. The underwriting results of an insurance or reinsurance company are often measured by reference to its underwriting income because underwriting income indicates the performance of the company’s core underwriting e by the addition or subtraction of net investment income (loss), financing expenses, fair value of warrants issued, net realized gains (losses) on investments and foreign exchange gains (losses) (see slides 13-15). Net operating income is calculated based on net income (loss) excluding net realized gains (losses), net unrealized gains (losses) on investments, gains (losses) arising from translation of non-U.S.$ denominated balances and non-recurring items. Net operating income is the most directly comparable GAAP measure as it focuses on the underlying fundamentals of our operations without the influence of realized gains (losses) from the sale of investments, translation of non-U.S.$ currencies and non-recurring items. Realized gains (losses) from the sale of investments are driven by the timing of the disposition of investments, not by our operating performance. Gains (losses) arising from translation of non-U.S.$ denominated balances are unrelated to our underlying business. Diluted book value per share is calculated based on total outstanding options andshareholders’ warrants, divided by the sum of shares, options, warrants and share equivalents outstanding (assuming their exercise). A reconciliation of the non-GAAP measures detailed herein to the most comparable GAAP measure can be found at the end of this presentation. |
Selected Market Information Exchange / Ticker: NYSE / “VR” Share Price (September 9, 2009): $25.20 Primary Shares Outstanding: 130,493,701 Primary Market Capitalization: $3.29bn Annual Dividend/Yield : $0.80 per share (3.2%) Analyst Coverage: Matt Carletti, Fox-Pitt Kelton Cochran Caronia Waller Jay Cohen, Bank of America Merrill Lynch Dean Evans, Keefe, Bruyette & Woods Julia Ferguson, Dowling & Partners Matt Heimermann, JP Morgan Brian Meredith, UBS Chris Neczypor, Goldman Sachs |
Validus Holdings, Ltd.NYSE listed, Bermuda headquartered (re)insurance company operating through two primary segmentsBusiness mix balanced between insurance and reinsuranceFocused on short tail specialty classes of businessLeadership position in property catastrophe reinsuranceFlexible and efficient operating platformResilient financial results during 2008Excellent financial results during the first half of 2009Significantly expanded float |
Validus is Diversified in Short-Tail Specialty Classes Validus Re GPW Pro Forma for IPC Re Talbot Gross Premium Written Bloodstock Contingency 2% 3% Specialty 9% War Property Marine 18% 14% 26% FinancialProperty Cat 5% XOL Other Property 65% 12% Accident & Heath 2% Marine 39% Aviation & Other 5% Last twelve months proforma GPW: $1.24 billion Last twelve months GPW: $773.0 millionLast twelve months pro forma consolidated GPW of $1.96 billion1Balanced by Class: 58% Property, 23% Marine, 19% Specialty Notes (1): Last twelve months is through June 30, 2009; consolidated GPW reflects intersegment eliminations |
Balanced Between Insurance and Reinsurance 0% 10% 20% 30% 40% 50% 60% 70% 80% 90% 100% TRH0.0% 100.0% PRE0.0% 100.0% IPCR0.0% 100.0% PTP0.0% 100.0% FSR 9.8% 90.2%Based on 2008 GPW except ACGL which is NPW.MRH 10.2% 89.8% RE 23.2% 76.8% Insurance (%) RNR 28.1% 71.9% ORH 34.5% 65.5% AHL 44.3% 55.7% Reinsurance (%) VR 45.4% 54.6% MXGL 47.2% 52.8%Source: SEC filings and other public disclosures.AXS 54.3% 45.7% ACGL 59.1% 40.9% ENH 63.4% 36.6% 70.0% 30.0% AWH 84.4% 15.6% LRE 92.1% 7.9% AGII |
Focused on Short-Tail Specialty Classes 0% 10% 20% 30% 40% 50% 60% 70% 80% 90% 100% LRE 100.0% FSR 100.0% IPCR 100.0% VR 94.0% 6.0% RNR 93.1% 6.9%Based on 2008 GPW except ACGL which is NPW.MRH 92.8% 7.2% ENH 67.2% 32.8% Short tail (%) PRE 64.0% 36.0% AXS 62.2% 37.8% Long tail (%) RE 58.7% 41.3% AHL 57.8% 42.2% PTP 50.3% 49.7%Source: SEC filings and other public disclosures.ORH 47.9% 52.1% MXGL 37.2% 62.8% ACGL 36.9% 63.1% 30.2% 69.8% TRH 25.6% 74.4% AGII 23.0% 77.0% AWH |
Property Cat Reinsurance is Important But Not Dominant 0.0% 10.0% 20.0% 30.0% 40.0% 50.0% 60.0% 70.0% 80.0% 90.0% 100.0% IPCR 90.0% 10.0% FSR 58.5% 41.5% RNR 57.1% 36.0% 6.9% MRH 56.1% 36.7% 7.2% VR 24.1% 69.9% 6.0%Based on 2008 GPW except ACGL which is NPW.PTP 23.3% 27.1% 49.7% Property Cat Reins, % of total RE 20.3% 38.4% 41.3% ORH 17.2% 30.7% 52.1% LRE 15.6% 84.4% ENH 14.0% 53.2% 32.8% Other Short Tail, % of total 13.4% 48.8% 37.8% AXS 12.6% 45.2% 42.2% AHLVR/IPCR proforma property cat XOL percentage for the year ended December 31, 2008 is 37.5% Source: SEC filings and other public disclosures.12.0% 18.2% 69.8% Long Tail, % of total TRH 10.0% 54.0% 36.0% 8.2% 28.7% 63.1% PRE 7.9% 29.3% 62.8% ACGL 5.3% 17.7% 77.0% MXGL0.0% 25.6% 74.4% AWH AGII |
Current Market Dynamics Catastrophe Rate on Line Index2Reinsurance industry capital was materially depleted in 2008U.S. Statutory surplus was down 11%, or 290% ~$ 60 billion in 20081Limited access to replacement 270% capital and new capacity at Jan 1 2009 250%June and July renewals were orderly 230%Demand and supply equilibriumCatastrophe business is well priced 210% and one of the few sectors seeing rate increases 190% 170% 150% 2000 2001 2002 2003 2004 2005 2006 2007 2008 20091 Source: A.M. Best Company2 Source: Guy Carpenter; indexed to 1990 value of 100% |
Scalable Operating Platform Validus Holdings Flexible and Efficient Operating Platform TalbotSingapore and Hamburg Validus Re Holdings representative officesMiami office targeting Latin America Validus Talbot Reaseguros UnderwritingOnshore Energy Technical Und. RiskAviation Lines Services MGA (“VURSI”)Dubai joint venture Representative OfficesNote: Certain subsidiaries have been excluded for the purposes of presentation. For a complete organizational chart see the company’s most recent Annual Report on Form 10 -K |
Change in 2008 Diluted BV/Share plus Dividends — P/C IndustrySource: Range: Results:-80.0% -70.0% - -60.0% -50.0% -40.0% -30.0% -20.0% -10.0% 0.0% 10.0% 20.0%Universe:XL -67.0% HIG -50.3% CNA - -42.8% MTG -40.1% ALL -34.8% HMN -27.9% WTM -25.5% CINF -23.5% OB -22.4% UTR -20.7% AFG -17.9% FSR - -17.4% INDM -16.5% MKL -16.2%SNL Financial and company reportsORI -15.9% THG -15.4% PGR -14.2% STFC -14.2% MCY -13.0% SIGI -12.4% MXGL -10.8%From +15.0% (FMR) to -67.0% (XL), Average of -9.6% UFCS -10.6% ACE -9.2% MRH -9.2% AXS -7.8% FNF -7.0% ACGL -6.8% FAC -6.8% BWINB -6.6%55 public listed P&C companies reporting through February 18, 2009L -6.1% MIG -5.4% ITIC -4.2% WRB -3.5% RNR - -3.3% TRH -3.2% PRE -3.2%16 companies (29.1%) reported positive change in 2008 diluted BV/share plus dividendsENH -2.8% RLI -2.8% AGII -2.1% PTP 0.8% IPCC 1.3% CB 2.3% VR 2.4% ZNT 3.1% AFSI 3.2% NATL 3.2% NAVG 4.2% IPCR 4.7% TRV 5.0% DGICA 5.7% AHL 6.0% AWH 10.0% ACAP 12.3% SUR 14.8% FMR 15.0% |
Validus Reported Excellent Second Quarter 2009 ResultsValidus Q2 2009 Highlights111.9% quarter to quarter growth in gross premiums written (6.3% at Validus Re and 19.2% at Talbot)71.9% combined ratio (52.5% at Validus Re and 87.4% at Talbot)Net operating income of $110.4 million and diluted operating EPS of $1.40Net income of $137.6 million and diluted EPS of $1.74Diluted book value per share of $26.0826.4% annualized ROAE and 21.2% annualized operating ROAEPeer Comparison Q2 2009 Annualized Operating ROAE35.0% 31.2% 30.0% 25.0% 21.9% 21.2% 21.2% 21.1% 20.0% 19.4% 20.0% 18.6% 18.0% 17.4% 17.0% 15.9% 15.0% 14.6% 15.0% 10.0% 5.0% 0.0% RNR FSR VR LRE ENH IPCR RE PTP MRH AXS ACGL PRE TRH MXGL1Reconciliations of VR diluted book value per share, operating income and annualized operating ROAE, non-GAAP financial |
Validus Holdings, Ltd. Quarterly Overview Q2 2009 Gross premiums written increased by 11.9% (U.S. Dollars in thousands, except share and per share information) ($ 45.1 million) Three Months Ended June 30, June 30,6.3% increase in Validus Re segment 2009 200819.2% in Talbot segment Gross premiums written $ 425,032 $ 379,919 Net underwriting income increased by 2.9% Net premiums written 362,741 378,520 Net premiums earned 328,200 309,2986.1% growth in net premiums earned Underwriting income 92,179 89,607 Net investment income 26,963 36,435Combined ratio higher by 0.9 percentage points Net operating income $ 110,383 $ 111,665 Net investment income decreased 26.0% Net income $ 137,563 $ 75,921Increase of 0.7% sequentially Selected RatiosImpact of cash balance reinvestment Losses and loss expenses 38.0% 39.5% Net operating income $110.4 million Policy acquisition costs 19.6% 18.2% General and administrative expenses 14.3% 13.3% Expense ratio 33.9% 31.5%Diluted net operating EPS of $1.40 Combined ratio 71.9% 71.0% Net income of $137.6 million Impact of identified loss events (Note 1) 3.4% 3.3% Impact of prior period developmentDiluted EPS of $1.74 (favorable)/unfavorable -4.0% -3.6%Unrealized investment gain of $37.2 millionNote (1): Current quarter events: $11.0mm Air France loss. Prior year = $10.2 million US storm and flood losses |
Validus Re Quarterly Segment Results Q2 2009 (U.S. Dollars in thousands, except share and per share information) Gross premiums written increased by 6.3% ($ 11.7 million) Three Months Three Months Ended June Ended June$12.6 million increase in property 30, 2009 30, 2008 Underwriting Revenues: Gross premiums written $ 199,560 $ 187,820 Net premiums written decreased by 16.1% Reinsurance premiums ceded (43,070) (1,208) ($ 30.1 million) Net premiums written 156,490 186,612 Change in unearned premiums 7,207 (22,500)Advanced renewal of retrocessional coverage, Net premiums earned 163,697 164,112 increasing ceded premiums Underwriting Deductions:Net premiums earned of $163.7 million Losses and loss expenses 41,121 48,677 Policy acquisition costs 29,120 25,309 General and administrative expenses 14,149 9,955 Underwriting income of $77.8 million Share compensation expense 1,548 1,597 Total underwriting deductions 85,938 85,538Stable net premiums earnedCombined ratio of 52.5% vs. 52.1% in prior year Underwriting income $ 77,759 $ 78,574 Selected Ratios Losses and loss expenses 25.1% 29.7% Policy acquisition costs 17.8% 15.4% General and administrative expenses 9.6% 7.0% Expense ratio 27.4% 22.4% Combined ratio 52.5% 52.1% Impact of identified loss events (Note 1) 1.6% 6.2% Impact of prior period development (favorable)/unfavorable -1.8% -0.3% |
Talbot Quarterly Segment Results Q2 2009 (U.S. Dollars in thousands, except share and per share information) Three Months Three Months Gross premiums written increased by 19.2% Ended June 30, Ended June 30, ($ 37.9 million) 2009 200826.5% on a constant currency basis ($52.3 million) Underwriting Revenues: Gross premiums written $ 235,113 $ 197,235$31.2 million from Onshore Energy Reinsurance premiums ceded (28,862) (5,327) Net premiums written 206,251 191,908 Change in unearned premiums (41,748) (46,722) Rate increases in 16 of 20 classes Net premiums earned 164,503 145,186 Underwriting Deductions: Losses and loss expenses 83,630 73,412 Policy acquisition costs 36,114 31,134 Sources of favorable prior period development: General and administrative expenses 21,927 19,787 Share compensation expense 2,098 1,126$7.9 million from Property Total underwriting deductions 143,769 125,459$4.5 million from Marine Underwriting income $ 20,734 $ 19,727 Selected Ratios Underwriting income of $20.7 million: Losses and loss expenses 50.8% 50.6% Policy acquisition costs 22.0% 21.4%Combined ratio of 87.5% vs. 86.4% General and administrative expenses 14.6% 14.4% Expense ratio 36.6% 35.8% Combined ratio 87.4% 86.4% Impact of identified loss events (Note 1) 5.0% 0.0% Impact of prior period development (favorable)/unfavorable -6.2% -7.3%Note (1): Current quarter events: $8.3 million Air France loss |
Investment Portfolio at June 30, 2009 ABS CMBS State and Local Conservative investment strategy 1.9% Govt., Cat Bonds 2.2% 0.7% Emphasize the preservation of Non-U.S. Govt. and Agency invested assets 4.0% Non-U.S. Provide sufficient liquidity for the Corporates prompt payment of claims 4.8% Non-Agency RMBS U.S. Govt. and No exposure to alternative asset 5.1% Agency classes, equities, derivatives 28.1% Comprehensive portfolio disclosure Agency RMBS 15.4% Average portfolio rating of AA+ Short Term, Cash and Equivalents Minimum average credit quality of AA- 20.2% U.S. Corporate Short duration (1.9 years as of June 30, 17.6% 2009) Investment yield: 3.08%(1)Note (1): Annualized effective investment yield for the quarter is calculated by dividing net investment income by the average balance of the assets managed by our portfolio managers and our other investments. |
Loss Reserves at June 30, 2009 Validus Gross Reserve Mix Observations Gross reserves for losses and loss expenses of $1.31 billion IBNR represents 45.3% of reserves Talbot has a history of favorable reserve development: IBNR Reserves Case Reserves $126.5 million since acquisition 45.3% 54.7% $ 54.7 million during 2009 Favorable reserve development in the second quarter 2009 of $13.2 million Talbot reserve release of $10.3 million Validus reserve release of $2.9 million |
Growth in Diluted Book Value Per Share Plus Accumulated Dividends $28.00Growth in diluted book value per share plus accumulated dividends$27.28 $26.00 $24.58 $24.00 $24.00 $22.00 $19.73 $20.00 $16.93 $18.00 $16.00 $14.00 2005 2006 2007 2008 2009 YTD14.6% compounded annual growth through June 30, 2009 |
Transparent Disclosure PolicyFinancial supplementInvestment portfolio detailed disclosure comparable to US Statutory Schedule DInvestment portfolio summary disclosure on RMBS, CMBS, ABSKey risk metrics includingProbable Maximum Loss (“PML”) modeledZonal aggregate limitsRealistic Disaster Scenarios (“RDS”)Validus provides regular visibility into important financial and operational metrics |
Strategic Rationale for the Validus/IPC Transaction Financial OperationalTransaction is accretive to diluted bookStronger relationships with major value per share reinsurance intermediariesFollowing recent acquisitions, top two brokers holdLower marginal costs due to Validus’ 70% market share1scalable infrastructureIncreased opportunities for Validus / IPC as lead / quoting marketValidus can more effectively utilize IPC’sOpportunity for aggregate in property catastrophe linesApplication of scalable technology to optimize theHighly public asset quality issues leading portfolio buyers to rethink counterparty riskDiversification into non-property cat linesValidus / IPC -to” market becomes on dislocationAdditional capital to TalbotOpportunity to expand into longer-tailExpansion of existing lines lines if/when market conditions warrantNew ventures |
Significant Increase in Scale and Market PresenceA Pro Forma Comparison of 6/30/09 Common Shareholders’ Equity$8.0 $7.0 $6.8 $6.0 $6.0 70% Increase $5.5 billions) $5.0 in $4.4 $ ( $4.0 $3.7 $3.7 $3.5 $3.1 $3.0 $2.8 $2.6 $2.3 $2.2 $2.0 $2.0 $2.0 $1.6 $1 $1.0 $0.01XL PRE RE AXS ACGL VR TRH ORH RNR AHL ENH VR IPCR PTP MRH + IPCR Strictly Private and Confidential 21Source: SNL, PartnerRe Form PREM14A Filed 8/6/09, Validus pro forma analysis |
Financial Summary Growth in ($ in millions) $3,663.3 $2,152.0 $1,934.8 $1,938.7 $1,192.5 $999.8 2005 2006 2007 2008 06/09 06/09 As Reported Pro Forma |
Increased Float and Liquidity 140.0 55.0Market value of float =131.5 $2.2bn pro forma (67% of market capitalization) 120.0Continues trend of increased float 100.0 and liquidity for Validus 67% 80.0 76.515.7mm shares issued in July 2007 IPO 60.0 Shares (mm) 44%33.5mm shares in float at August 40.0 20093Validus to issue approximately 20.0 33% 56% 55.0mm shares in IPC 0.0 transaction2Validus Issued Validus / IPC 1 2 Standalone in Amalgamation Pro Forma Public Float1 As of August 7, 20092 Issued for IPC common shares, RSUs, PSUs, restricted shares and in-the-money options3 All common shares excluding shares held by Founding Investors, Directors and Officers |
Investor Presentation — Appendix |
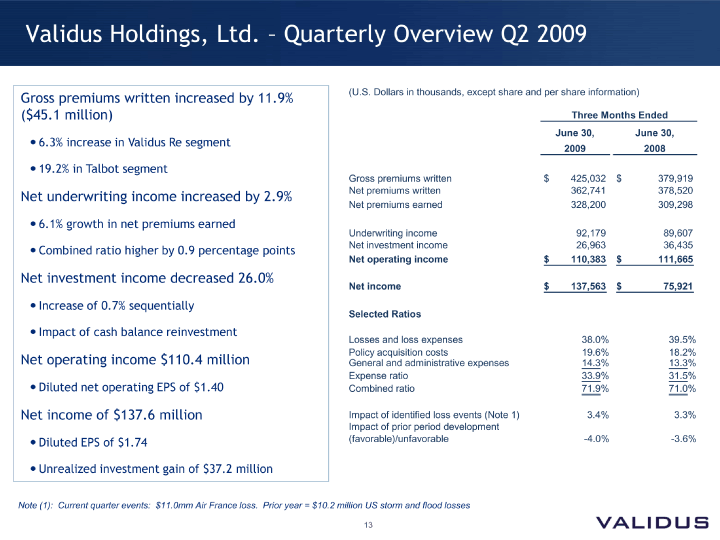
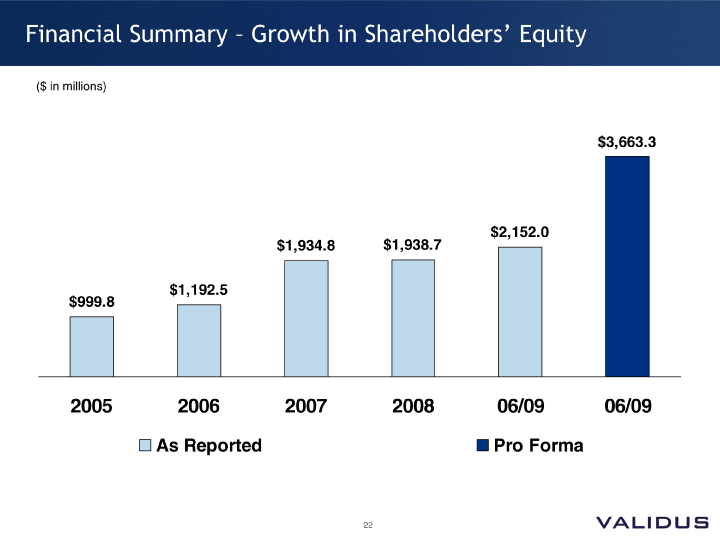
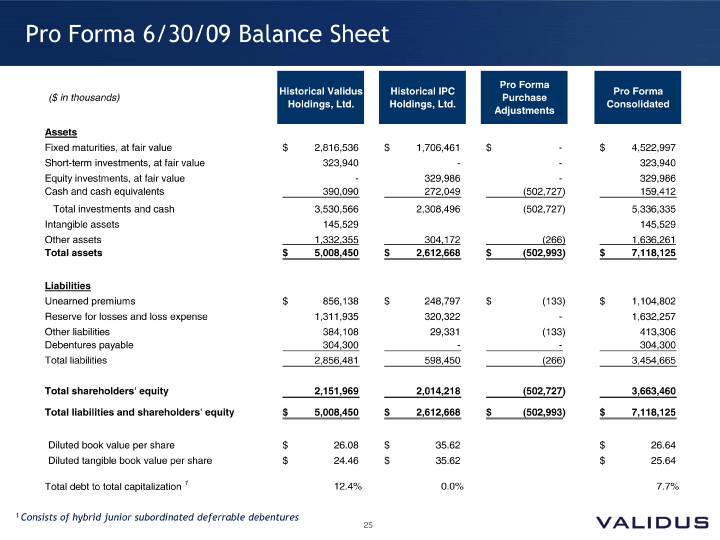
Pro Forma 6/30/09 Balance Sheet Pro Forma Historical Validus Historical IPC Pro Forma($ in thousands)Purchase Holdings, Ltd. Holdings, Ltd. Consolidated Adjustments Assets Fixed maturities, at fair value $ 2,816,536 $ 1,706,461 $ — $ 4,522,997 Short-term investments, at fair value 323,940 — - 323,940 Equity investments, at fair value — 329,986 — 329,986 Cash and cash equivalents 390,090 272,049 (502,727) 159,412 Total investments and cash 3,530,566 2,308,496 (502,727) 5,336,335 Intangible assets 145,529 145,529 Other assets 1,332,355 304,172 (266) 1,636,261 Total assets $ 5,008,450 $ 2,612,668 $ (502,993) $ 7,118,125 Liabilities Unearned premiums $ 856,138 $ 248,797 $ (133) $ 1,104,802 Reserve for losses and loss expense 1,311,935 320,322 — 1,632,257 Other liabilities 384,108 29,331 (133) 413,306 Debentures payable 304,300 — - 304,300 Total liabilities 2,856,481 598,450 (266) 3,454,665 Total shareholders’ equity 2,151,969 2,014,218 (502,727) 3,663,460 Total liabilities and shareholders’ equity $ 5,008,450 $ 2,612,668 $ (502,993) $ 7,118,125 Diluted book value per share $ 26.08 $ 35.62 $ 26.64 Diluted tangible book value per share $ 24.46 $ 35.62 $ 25.64 Total debt to total capitalization1 12.4% 0.0% 7.7% |
Net Operating Income Reconciliation Validus Holdings, Ltd Non-GAAP Financial Measure Reconciliation Net Operating Income, Net Operating Income per share and Annualized Net Operating Return on Average Equity (U.S. Dollars in thousands, except share and per share information) Three Months Ended Six June 30, June 30, June 30, 2009 2008 2009 Net income $ 137,563 $ 75,921 $ 232,470 Adjustment for realized gain on repurchase of debentures — (8,752) -Adjustment for net realized losses (gains) on investments 2,650 2,425 26,071 Adjustment for net unrealized (gains) losses on investments (37,249) 42,982 (59,402) Adjustment for foreign exchange (gains) (8,432) (911) (4,232) Adjustment for transaction expenses 15,851 — 15,851 Net operating income $ 110,383 $ 111,665 $ 210,758 Net income $ 137,563 $ 75,921 $ 232,470 Less: Dividends and distributions declared on outstanding warrants — — -Net income available to common shareholders $ 137,563 $ 75,921 $ 232,470 Net income per share — diluted $ 1.74 $ 0.98 $ 2.94 Adjustment for realized gain on repurchase of debentures $ — $ (0.11) $ -Adjustment for net realized losses (gains) on investments 0.03 0.03 0.33 Adjustment for net unrealized (gains) losses on investments (0.47) 0.56 (0.75) Adjustment for foreign exchange (gains) losses (0.10) (0.01) (0.05) Adjustment for transaction expenses 0.20 — 0.20 Net operating income per share — diluted 1.40 1.45 2.67 Weighted average number of common shares — diluted 78,942,027 77,257,545 79,022,336 Net operating income 110,383 111,665 210,758 Average shareholders’ equity 2,087,478 2,023,720 2,037,896 Annualized operating return on average equity 21.2% 22.1% 20.7% |
Diluted Book Value Per Share Reconciliation Validus Holdings, Ltd. Non-GAAP Financial Measure Reconciliation Diluted Book Value Per Common Share As at June 30, 2009 and December 31, 2008 (expressed in thousands of U.S. dollars, except share amounts) At June 30, 2009 Equity amount Shares Book value per common share Total shareholders’ equity $2,151,969 76,151,473 Diluted book value per common share Total shareholders’ equity $2,151,969 76,151,473 Assumed exercise of outstanding warrants 139,576 7,952,138 Assumed exercise of outstanding stock options 50,904 2,793,402 Unvested restricted shares — 2,928,813 Diluted book value per common share $2,342,449 89,825,826 At December 31, 2008 Equity amount Shares Book value per common share Total shareholders’ equity $1,938,734 75,624,697 Diluted book value per common share Total shareholders’ equity $1,938,734 75,624,697 Assumed exercise of outstanding warrants 152,316 8,680,149 Assumed exercise of outstanding stock options 51,043 2,799,938 Unvested restricted shares — 2,986,619 Diluted book value per common share $2,142,093 90,091,403 |