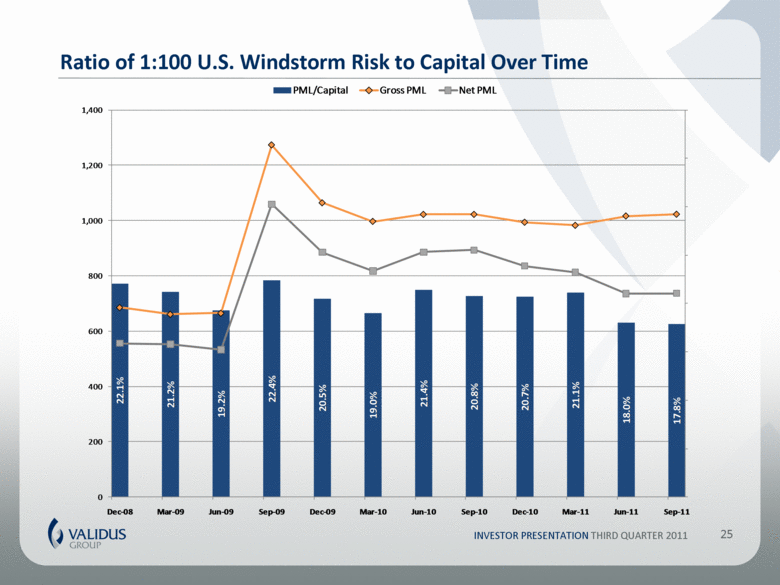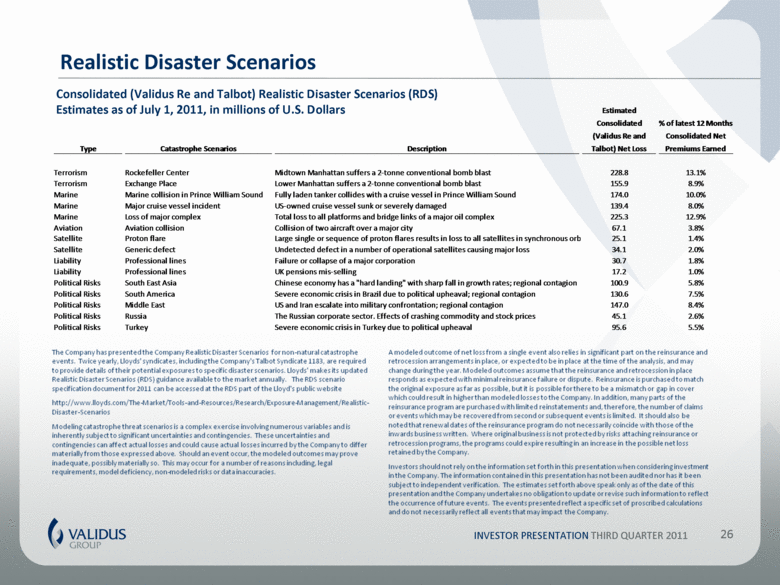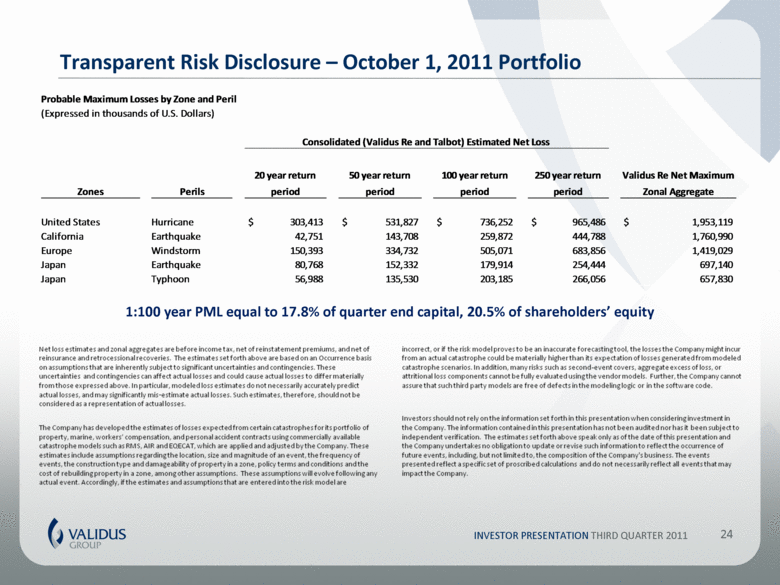
| Transparent Risk Disclosure – October 1, 2011 Portfolio 24 1:100 year PML equal to 17.8% of quarter end capital, 20.5% of shareholders’ equity INVESTOR PRESENTATION THIRD QUARTER 2011 Probable Maximum Losses by Zone and Peril Zones Perils 20 year return period 50 year return period 100 year return period 250 year return period Validus Re Net Maximum Zonal Aggregate United States Hurricane 303,413 $ 531,827 $ 736,252 $ 965,486 $ 1,953,119 $ California Earthquake 42,751 143,708 259,872 444,788 1,760,990 Europe Windstorm 150,393 334,732 505,071 683,856 1,419,029 Japan Earthquake 80,768 152,332 179,914 254,444 697,140 Japan Typhoon 56,988 135,530 203,185 266,056 657,830 (Expressed in thousands of U.S. Dollars) Consolidated (Validus Re and Talbot) Estimated Net Loss Net loss estimates and zonal aggregates are before income tax, net of reinstatement premiums, and net of reinsurance and retrocessional recoveries. The estimates set forth above are based on an Occurrence basis on assumptions that are inherently subject to significant uncertainties and contingencies. These uncertainties and contingencies can affect actual losses and could cause actual losses to differ materially from those expressed above. In particular, modeled loss estimates do not necessarily accurately predict actual losses, and may significantly mis-estimate actual losses. Such estimates, therefore, should not be considered as a representation of actual losses. The Company has developed the estimates of losses expected from certain catastrophes for its portfolio of property, marine, workers’ compensation, and personal accident contracts using commercially available catastrophe models such as RMS, AIR and EQECAT, which are applied and adjusted by the Company. These estimates include assumptions regarding the location, size and magnitude of an event, the frequency of events, the construction type and damageability of property in a zone, policy terms and conditions and the cost of rebuilding property in a zone, among other assumptions. These assumptions will evolve following any actual event. Accordingly, if the estimates and assumptions that are entered into the risk model are incorrect, or if the risk model proves to be an inaccurate forecasting tool, the losses the Company might incur from an actual catastrophe could be materially higher than its expectation of losses generated from modeled catastrophe scenarios. In addition, many risks such as second-event covers, aggregate excess of loss, or attritional loss components cannot be fully evaluated using the vendor models. Further, the Company cannot assure that such third party models are free of defects in the modeling logic or in the software code. Investors should not rely on the information set forth in this presentation when considering investment in the Company. The information contained in this presentation has not been audited nor has it been subject to independent verification. The estimates set forth above speak only as of the date of this presentation and the Company undertakes no obligation to update or revise such information to reflect the occurrence of future events, including, but not limited to, the composition of the Company's business. The events presented reflect a specific set of proscribed calculations and do not necessarily reflect all events that may impact the Company. |


