
Validus Holdings, Ltd. 29 Richmond Road Pembroke HM 08 Bermuda | |
Mailing Address: Suite 1790 48 Par-la-Ville Road Hamilton, HM 11 Bermuda | |
Telephone: (441) 278-9000 Facsimile: (441) 278-9090 Website: www.validusholdings.com | |
April 17, 2017
VIA EDGAR TRANSMISSION
Jim B. Rosenberg
Senior Assistant Chief Accountant
Office of Healthcare and Insurance
Mail Stop 4546
Securities and Exchange Commission
100 F Street, N.E.
Washington, D.C. 20549
| Re: | Validus Holdings Ltd. |
Form 10-K for Fiscal Year Ended December 31, 2016
Filed February 23, 2017
File No. 001-33606
Dear Mr. Rosenberg:
Validus Holdings, Ltd. (the “Company” or “Validus”), hereby submits responses to the comments of the Staff regarding the above-referenced filing (the “Form 10-K”) as set forth in your letter dated April 3, 2017 (the “Comment Letter”).
Set forth below are the Staff’s comments contained in the Comment Letter and immediately following each comment is the Company’s response.
The Company is available at your convenience to discuss any comments or questions. Thank you in advance for your consideration.
Management’s Discussion and Analysis
Full Year 2016, 2015 and 2014 Summarized Results of Operations - Consolidated, page 64
| 1. | Your discussion of financial indicators on pages 49-50 and results of operations on pages 51 and 64 appears to give undue prominence to your non-GAAP measures. Please explain to us your consideration of Question 102.10 of the Compliance and Disclosure Interpretations on Non-GAAP Financial Measures as revised on May 17, 2016 (“Revised C&DIs”) in providing these disclosures. In this regard, specifically discuss your consideration of the following examples from the C&DI that we consider indicators of undue prominence: |
| • | Presenting a full income statement of non-GAAP measures or presenting a full non-GAAP income statement when reconciling non-GAAP measures to the most directly comparable GAAP measures; |
| • | Presenting a non-GAAP measure using a style of presentation (e.g., bold, larger font) that emphasizes the non-GAAP measure over the comparable GAAP measure; |
| • | Providing tabular disclosure of non-GAAP financial measures without preceding it with an equally prominent tabular disclosure of the comparable GAAP measures or including the comparable GAAP measures in the same table; |
| • | Providing discussion and analysis of a non-GAAP measure without a similar discussion and analysis of the comparable GAAP measure in a location with equal or greater prominence. |
Response: The Company acknowledges the Staff’s comment and advises the Staff that it has reviewed the Revised C&DIs, specifically Question 102.10, and as a result, the Company intends to make the following changes to its discussion of financial indicators and results of operations in future filings:
| • | Replace the full non-GAAP income statements as presented in the Results of Operations on pages 51 and 64 with full GAAP income statements. Please refer to Appendix A for the proposed amended disclosures; |
| • | Remove the bold font on non-GAAP measures as shown in the Results of Operations on pages 51 and 64 along with the italicized font as shown in Financial Measures on pages 49-50. Please refer to Appendices A and B for the proposed amended disclosures; |
| • | Replace the tables as currently presented in Financial Measures on pages 49-50 with the revised tables included in Appendix B, which reconcile the Company’s: |
| ◦ | Book value per common share, a GAAP financial measure, to the following non-GAAP financial measures: book value per diluted common share; tangible book value per diluted common share; and book value per diluted common share plus accumulated dividends; and |
| ◦ | Net income available to Validus common shareholders, a GAAP financial measure, to net operating income available to Validus common shareholders, a non-GAAP financial measure; and |
| • | Add the GAAP book value per common share narrative as presented at the bottom of page 1 in Appendix B and remove the quantitative narratives at the end of each paragraph within the other non-GAAP financial indicators section as currently presented in Financial Measures on pages 49-50. |
Non-GAAP Financial Measures, page 90
| 2. | Your non-GAAP measure “Net operating income available to Validus common shareholders” does not appear to reflect the income tax effects of the related non-GAAP adjustments. Please tell us how you determined that this presentation was consistent with Question 102.11 of the revised C&DIs. |
Response: The Company acknowledges the Staff’s comment and advises the Staff that it has reviewed the Revised C&DIs, specifically Question 102.11, and as a result, will make revisions to the Company’s disclosures in future filings to include the income tax effects of the related non-GAAP adjustments within the reconciliation of net income available to Validus common shareholders to net operating income available to Validus common shareholders. Please refer to page 2 of Appendix B for the proposed revised reconciliation which includes the income tax effects of the related non-GAAP adjustments.
2
Notes to Consolidated Financial Statements
Note 21 - Income Taxes, page F-68
| 3. | With respect to the $18.4 million release of the valuation allowance previously held against a deferred tax asset related to tax losses carried forward in Luxembourg, please provide us with your analysis of all available evidence considered, both positive and negative, and how this evidence was weighted in determining that a partial release of this valuation allowance was warranted during the fourth quarter of 2016. |
Response: The Company acknowledges the Staff’s comment.
As background, it is worth noting that the Company’s deferred tax asset (“Luxembourg DTA”), to which the partial release of the valuation allowance pertains, relates to tax losses carried forward by Flagstone Reinsurance (Luxembourg), SARL ("FRL"), a former Luxembourg affiliate of Flagstone Reinsurance Holdings, S.A. (“Flagstone”) which was acquired by the Company in the fourth quarter of 2012. Pre-acquisition by the Company, FRL incurred significant losses resulting from impairments on investments in subsidiaries, which suffered substantial losses from unprecedented global catastrophes in 2010 and 2011, giving rise to FRL’s tax losses carried forward. At December 31, 2016, the gross Luxembourg DTA was $78.3 million and the related valuation allowance was $59.9 million.
In accordance with Accounting Standards Codification ("ASC") Topic 740 “Income Taxes,” the Company considers all positive and negative evidence to determine whether it is more-likely-than-not that the tax benefit of part or all of a deferred tax asset will be realized. As per ASC 740-10-30-18, the Company’s framework for assessing the recoverability of deferred tax assets primarily considers four sources of possible future taxable income as follows: (a) taxable income in prior carryback years when permitted by law; (b) future reversal of existing taxable temporary differences; (c) available tax planning strategies; and (d) the expected occurrence of future taxable income.
The weighting of all positive and negative evidence identified is commensurate with the extent to which they can be objectively verified.
The following analysis was performed by the Company to assess what portion of the Luxembourg DTA was more-likely-than-not to be realized in the future:
(a)Taxable income in prior carryback years when permitted by law
Under Luxembourg tax law, there is no opportunity to carry back tax losses and recover prior period taxes.
(b)Future reversal of existing taxable temporary differences
The Company does not expect profits from the reversal of taxable temporary differences as FRL does not carry any Luxembourg deferred tax liabilities. Therefore, there is no possibility to realize the Luxembourg DTA through future reversal of existing taxable temporary differences.
(c)Available tax planning strategies
ASC 740-10-30-19(b) defines a tax planning strategy as an action that "an entity ordinarily might not take, but would take to prevent an operating loss or tax credit carryforward from expiring unused." ASC 740-10-55-39(b) further clarifies this definition by indicating that strategies that are expected to be employed for business or tax purposes, other than utilization of carryforwards that otherwise expire unused, are not tax-planning strategies as that term is used in ASC Topic 740. Luxembourg tax law provides that tax losses carried forward do not expire, therefore, the Company can not consider tax planning strategies as a possible source of future taxable income.
3
(d)Expected occurrence of future taxable income
To estimate future taxable income, in Luxembourg the Company reviewed both prior year taxable results of FRL and available future projections.
Pre-acquisition by the Company, FRL had a history of incurring significant losses which constitutes objective negative evidence. However, such significant losses were resulting from impairments on investments in subsidiaries which were subsequently sold, transferred or liquidated. Consequently, the Company believes that only limited weight can be given to this objective negative evidence as those losses are not expected to reoccur given FRL no longer holds those investments.
During 2014, FRL refocused its business purpose to more effectively utilize its capital base by partially funding the acquisition of Western World Insurance Group, Inc. (“Western World”) through an intra-group loan (the "Loan") to Validus Specialty, Inc. (“VSI”), the acquirer of Western World. The Loan of $400.0 million generates annual intra-group interest income of approximately $23.2 million for FRL which translates into net taxable income in Luxembourg. FRL currently has no other business activities and incurs very limited expenses. Future interest payments under the remaining term of the Loan would translate into future taxable income for FRL of approximately $179.8 million. Based on the currently enacted Luxembourg corporate income tax rates, the maximum amount of Luxembourg DTA that could be realized under the remaining term of the Loan would be approximately $47.0 million.
The following chart outlines the existing financing structure:
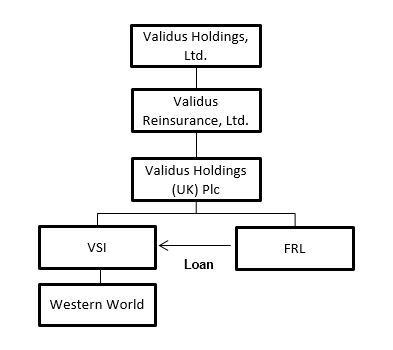
The ability to project future taxable income for FRL therefore relies both on (i) the ability for the Company to maintain the existing intra-group financing structure and (ii) the ability of VSI to pay interest on the Loan.
(i)Ability of the Company to maintain the existing intra-group financing structure
The existing Luxembourg financing structure is efficient from a capital, legal and tax perspective. If the tax treatment of the interest in the U.S. and/or the tax losses in Luxembourg would change, the existing financing structure may no longer be attractive. In such case, the Company would reevaluate the financing structure with the intent to replace the existing Loan with a more efficient structure. Some of the threats to the existing financing structure include the proposed U.S. tax reforms from the newly elected U.S. President and U.S. Congress, tax treaty developments and implementation of the final Organization for Economic Co-operation and Development ("OECD") reports on "Base Erosion and Profit Shifting" ("BEPS"), notably actions 3, 4, 6
4
and 8-10, relating to strengthening Controlled Foreign Company (“CFC”) rules, interest limitations, preventing inappropriate use of tax treaties and transfer pricing, especially with respect to risk and capital remuneration, respectively. The Company believes that the subjective negative evidence of potential political and/or legal changes carries limited weight given these laws have not yet been enacted.
(ii)Ability of VSI to pay interest on the Loan
The future taxable income for FRL is reliant on the ability of VSI to pay interest for the remaining term of the Loan. In turn, VSI’s ability to pay the interest on the Loan is reliant on income derived from its investment in Western World.
Western World was able to return dividends to VSI in the fourth quarter of both 2015 and 2016 which resulted in VSI being able to pay the interest due on the Loan. The Company believes that while the history of dividend distributions from Western World to VSI provides objective positive evidence, future dividends are nevertheless uncertain and, as such, a medium weight was assigned to this positive evidence. This uncertainty includes future capital requirements that exist in relation to growing Western World which is one of the Company’s main objectives as it is seen as a source of future value creation for the Company.
The Company’s financial projections for Western World, supporting its future dividend paying capacity, were also assessed. The Company’s consideration of the extent to which these projections could be considered objectively verifiable included specific consideration of a comparison of forecasted to historical results. The Company assessed that these factors provided positive evidence to which a medium weighting was assigned due to the inherent uncertainty of financial projections.
Based on the weighting of evidence from the foregoing considerations, the Company concluded that there was sufficient overall positive evidence to conclude that it was more-likely-than-not that at least some portion of the deferred tax asset would be realized in the future.
The Company’s determination of the approach to subsequently assess what portion of the deferred tax asset was considered to be more-likely-than-not to be realized in the future through the expected occurrence of future taxable income included specific consideration of the interaction of this assessment with the Company’s annual goodwill impairment assessment of Western World. For reference, the Company carries $176.4 million of goodwill relating to the Western World reporting unit. While the Company believes that sufficient evidence was available to conclude that it is was more-likely-than-not that the Western World goodwill was not impaired from a qualitative perspective, the Company also recognized that this conclusion also spoke to the view of the fair value of Western World. From this perspective, one of the recognized approaches to determining fair value is a discounted cash flow analysis. As such, the Company also used the Western World financial projections in the preparation of a discounted cash flow analysis which resulted in an indicated fair value of the Western World reporting unit in excess of the reporting unit’s carrying value (and, therefore, supporting the Company’s goodwill impairment assessment conclusion).
Based on the consideration of the interaction between the goodwill and deferred tax asset assessments, the Company determined it reasonable and appropriate to conclude that only those cash flows over and above those required to support a fair value equal to the carrying value of the reporting unit would be considered more-likely-than-not to be available for distributions to VSI to fund the future interest payments under the remaining term of the Loan. The assessment of the reasonability and appropriateness of this approach was based upon both of the following: (a) the approach ensures that the cash flows and financial projections are not double counted in the Company’s assessment of two separate assets; and (b) the approach is consistent with the Company’s strategic priority to grow the Western World operations, which takes precedent over the utilization of deferred tax assets. Furthermore, as previously discussed, the Luxembourg tax losses carried forward do not expire.
The application of this approach resulted in available cash flows equal to approximately three years of interest on the Loan over and above those required to support a fair value equal to the carrying value of the reporting unit.
5
Conclusion
The Company believes, after review of all available positive and negative evidence, that it is more-likely-than-not that FRL will have sufficient future taxable income to realize a portion of the Luxembourg DTA in an amount equal to approximately three years of interest on the Loan, the tax benefit of which, based upon currently enacted Luxembourg corporate income tax rates, is approximately $18.4 million. As such, the Company recorded a partial release of the previously held full valuation allowance which resulted in a tax benefit of $18.4 million for the quarter and year ended December 31, 2016.
The timing of the release coincided with the annual impairment assessment for goodwill and other intangible assets as well as the annual financial projection process. The full valuation allowance held previously was deemed necessary due to a higher level of uncertainty, including and in relation to: (a) the impact of strategic changes the Company made to Western World’s business post-acquisition; (b) the impact of rating agency capital requirements, including those to support future growth, and how such requirements could constrain capital available for distribution; and (c) the fact that Western World was still a relatively recent acquisition, resulting in a more limited history available for the Company’s comparison of forecasted to historical results. Given the Company’s progress on its goals for Western World in 2016, which included exiting underperforming classes of business, building out its short-tail underwriting platform, and achieving revenue growth, the Company determined that the level of uncertainty surrounding future cash flows available for distribution had been sufficiently reduced to support the conclusion above.
The Company will continue to monitor all available positive and negative evidence, including its expectations for future taxable income in Luxembourg, in relation to the recoverability of the Luxembourg DTA. If the Company’s positive evidence continues to develop favorably in the foreseeable future, it is possible that further releases of the valuation allowance related to the Luxembourg DTA will occur.
6
* * * * *
Comments or questions regarding these matters may be directed to Jeff Sangster at (441) 278-9052 or Robert Kuzloski at (441) 278-9075.
Very truly yours,
/s/ Jeffrey D. Sangster
Name: Jeffrey D. Sangster
| Title: | Executive Vice President and |
Chief Financial Officer
cc: Robert F. Kuzloski, Esq. (Validus Holdings, Ltd.)
7
Appendix A
Results of Operations - Fourth Quarter 2016 - Consolidated
The following table presents the results of operations for the three months ended December 31, 2016 and 2015:
| Three Months Ended December 31, | ||||||||
| (Dollars in thousands) | 2016 | 2015 | ||||||
| Revenues | ||||||||
| Gross premiums written | $ | 339,454 | $ | 309,605 | ||||
| Reinsurance premiums ceded | (40,635 | ) | (33,128 | ) | ||||
| Net premiums written | 298,819 | 276,477 | ||||||
| Change in unearned premiums | 241,580 | 266,823 | ||||||
| Net premiums earned | 540,399 | 543,300 | ||||||
| Net investment income | 38,153 | 31,612 | ||||||
| Net realized gains (losses) on investments | 9,220 | (2,928 | ) | |||||
| Change in net unrealized losses on investments | (67,460 | ) | (34,862 | ) | ||||
| Income (loss) from investment affiliates | 2,166 | (1,261 | ) | |||||
| Other insurance related income and other income | 568 | 2,545 | ||||||
| Foreign exchange (losses) gains | (901 | ) | 797 | |||||
| Total revenues | 522,145 | 539,203 | ||||||
| Expenses | ||||||||
| Losses and loss expenses | 275,126 | 214,748 | ||||||
| Policy acquisition costs | 120,889 | 102,285 | ||||||
| General and administrative expenses | 77,955 | 98,563 | ||||||
| Share compensation expenses | 10,442 | 10,062 | ||||||
| Finance expenses | 14,630 | 16,581 | ||||||
| Total expenses | 499,042 | 442,239 | ||||||
| Income before taxes, loss from operating affiliate and (income) attributable to AlphaCat investors | 23,103 | 96,964 | ||||||
| Tax benefit | 21,147 | 756 | ||||||
| Loss from operating affiliate | — | (1,708 | ) | |||||
| (Income) attributable to AlphaCat investors | (7,080 | ) | (974 | ) | ||||
| Net income | 37,170 | 95,038 | ||||||
| Net (income) attributable to noncontrolling interests | (27,200 | ) | (25,996 | ) | ||||
| Net income available to Validus | 9,970 | 69,042 | ||||||
| Dividends on preferred shares | (2,203 | ) | — | |||||
| Net income available to Validus common shareholders | $ | 7,767 | $ | 69,042 | ||||
1
| Three Months Ended December 31, | ||||||||
| (Dollars in thousands) | 2016 | 2015 | ||||||
| Supplemental information: | ||||||||
| Losses and loss expenses: | ||||||||
| Current period excluding items below | $ | 269,301 | $ | 272,889 | ||||
| Current period—notable loss events | 52,310 | (86 | ) | |||||
| Current period—non-notable loss events | 302 | 56 | ||||||
| Change in prior accident years | (46,787 | ) | (58,111 | ) | ||||
| Total losses and loss expenses | $ | 275,126 | $ | 214,748 | ||||
| Selected ratios: | ||||||||
| Ratio of net to gross premiums written | 88.0 | % | 89.3 | % | ||||
| Losses and loss expense ratio: | ||||||||
| Current period excluding items below | 49.8 | % | 50.2 | % | ||||
| Current period—notable loss events | 9.7 | % | — | % | ||||
| Current period—non-notable loss events | 0.1 | % | — | % | ||||
| Change in prior accident years | (8.7 | )% | (10.7 | )% | ||||
| Losses and loss expense ratio | 50.9 | % | 39.5 | % | ||||
| Policy acquisition cost ratio | 22.4 | % | 18.8 | % | ||||
General and administrative expense ratio (a) | 16.3 | % | 20.0 | % | ||||
| Expense ratio | 38.7 | % | 38.8 | % | ||||
| Combined ratio | 89.6 | % | 78.3 | % | ||||
| (a) | The general and administrative expense ratio includes share compensation expenses. |
2
Full Year 2016, 2015 and 2014 Summarized Results of Operations - Consolidated
The Company acquired Western World on October 2, 2014, therefore the results of Western World have been included in the Company’s consolidated results from the date of acquisition. The following table presents the results of operations for the years ended December 31, 2016, 2015 and 2014:
| Years Ended December 31, | ||||||||||||
| (Dollars in thousands) | 2016 | 2015 | 2014 | |||||||||
| Revenues | ||||||||||||
| Gross premiums written | $ | 2,648,705 | $ | 2,557,506 | $ | 2,358,865 | ||||||
| Reinsurance premiums ceded | (289,705 | ) | (328,681 | ) | (313,208 | ) | ||||||
| Net premiums written | 2,359,000 | 2,228,825 | 2,045,657 | |||||||||
| Change in unearned premiums | (109,835 | ) | 18,064 | (52,602 | ) | |||||||
| Net premiums earned | 2,249,165 | 2,246,889 | 1,993,055 | |||||||||
| Net investment income | 150,385 | 127,824 | 100,086 | |||||||||
| Net realized gains on investments | 15,757 | 2,298 | 14,917 | |||||||||
| Change in net unrealized gains (losses) on investments | 16,871 | (32,395 | ) | (2,842 | ) | |||||||
| (Loss) income from investment affiliate | (2,083 | ) | 4,281 | 8,411 | ||||||||
| Other insurance related income and other income | 2,195 | 5,111 | 1,229 | |||||||||
| Foreign exchange gains (losses) | 10,864 | (8,731 | ) | (12,181 | ) | |||||||
| Total revenues | 2,443,154 | 2,345,277 | 2,102,675 | |||||||||
| Expenses | ||||||||||||
| Losses and loss expenses | 1,065,097 | 977,833 | 765,015 | |||||||||
| Policy acquisition costs | 449,482 | 410,058 | 339,467 | |||||||||
| General and administrative expenses | 336,294 | 363,709 | 329,362 | |||||||||
| Share compensation expenses | 42,907 | 38,341 | 33,073 | |||||||||
| Finance expenses | 58,520 | 74,742 | 68,324 | |||||||||
Transaction expenses (a) | — | — | 8,096 | |||||||||
| Total expenses | 1,952,300 | 1,864,683 | 1,543,337 | |||||||||
| Income before taxes, loss from operating affiliate and (income) attributable to AlphaCat investors | 490,854 | 480,594 | 559,338 | |||||||||
| Tax benefit (expense) | 19,729 | (6,376 | ) | (155 | ) | |||||||
| Loss from operating affiliate | (23 | ) | (3,949 | ) | (4,340 | ) | ||||||
| (Income) attributable to AlphaCat investors | (23,358 | ) | (2,412 | ) | — | |||||||
| Net income | 487,202 | 467,857 | 554,843 | |||||||||
| Net (income) attributable to noncontrolling interests | (123,363 | ) | (92,964 | ) | (74,880 | ) | ||||||
| Net income available to Validus | 363,839 | 374,893 | 479,963 | |||||||||
| Dividends on preferred shares | (4,455 | ) | — | — | ||||||||
| Net income available to Validus common shareholders | $ | 359,384 | $ | 374,893 | $ | 479,963 | ||||||
| (a) | Transaction expenses incurred during 2014 relate to the acquisition of Western World. Transaction expenses are primarily comprised of legal, financial advisory and audit related services. |
3
| Years Ended December 31, | ||||||||||||
| (Dollars in thousands) | 2016 | 2015 | 2014 | |||||||||
| Supplemental information: | ||||||||||||
| Losses and loss expenses: | ||||||||||||
| Current period excluding items below | $ | 1,120,841 | $ | 1,164,775 | $ | 954,644 | ||||||
| Current period—notable loss events | 90,211 | 96,964 | 34,944 | |||||||||
| Current period—non-notable loss events | 70,237 | 22,231 | 34,668 | |||||||||
| Change in prior accident years | (216,192 | ) | (306,137 | ) | (259,241 | ) | ||||||
| Total losses and loss expenses | $ | 1,065,097 | $ | 977,833 | $ | 765,015 | ||||||
| Selected ratios: | ||||||||||||
| Ratio of net to gross premiums written | 89.1 | % | 87.1 | % | 86.7 | % | ||||||
| Losses and loss expense ratio: | ||||||||||||
| Current period excluding items below | 49.9 | % | 51.8 | % | 47.9 | % | ||||||
| Current period—notable loss events | 4.0 | % | 4.3 | % | 1.8 | % | ||||||
| Current period—non-notable loss events | 3.1 | % | 1.0 | % | 1.7 | % | ||||||
| Change in prior accident years | (9.6 | )% | (13.6 | )% | (13.0 | )% | ||||||
| Losses and loss expense ratio | 47.4 | % | 43.5 | % | 38.4 | % | ||||||
| Policy acquisition cost ratio | 20.0 | % | 18.3 | % | 17.0 | % | ||||||
General and administrative expense ratio (a) | 16.8 | % | 17.9 | % | 18.2 | % | ||||||
| Expense ratio | 36.8 | % | 36.2 | % | 35.2 | % | ||||||
| Combined ratio | 84.2 | % | 79.7 | % | 73.6 | % | ||||||
| (a) | The general and administrative expense ratio includes share compensation expenses. |
4
Appendix B
Non-GAAP Financial Measures
In presenting the Company’s results, management has included and discussed certain non-GAAP financial measures. The Company believes that these non-GAAP measures, which may be defined and calculated differently by other companies, better explain and enhance the understanding of the Company’s results of operations. However, these measures should not be viewed as a substitute for those determined in accordance with U.S. GAAP.
Book value financial indicators
In addition to presenting book value per common share determined in accordance with U.S. GAAP, the Company believes that the key financial indicator for evaluating our performance and measuring the overall growth in value generated for shareholders is book value per diluted common share plus accumulated dividends, a non-GAAP financial measure.
The following table presents reconciliations of book value per common share to book value per diluted common share plus accumulated dividends and other non-GAAP book value financial indicators:
| December 31, 2016 | |||||||||||
Equity Amount (a) | Common Shares | Per Share Amount (b) | |||||||||
| Book value per common share | $ | 3,688,291 | 79,132,252 | $ | 46.61 | ||||||
| Non-GAAP Adjustments: | |||||||||||
Assumed exercise of outstanding stock options (c)(d) | 614 | 26,136 | |||||||||
| Unvested restricted shares | — | 2,868,610 | |||||||||
Book value per diluted common share (e) | 3,688,905 | 82,026,998 | $ | 44.97 | |||||||
| Goodwill | (196,758 | ) | — | ||||||||
| Intangible assets | (115,592 | ) | — | ||||||||
Tangible book value per diluted common share (e) | $ | 3,376,555 | 82,026,998 | $ | 41.16 | ||||||
Book value per diluted common share (e) | $ | 44.97 | |||||||||
| Accumulated dividends | 11.56 | ||||||||||
Book value per diluted common share plus accumulated dividends (e) | $ | 56.53 | |||||||||
| December 31, 2015 | |||||||||||
Equity Amount (a) | Common Shares | Per Share Amount (b) | |||||||||
| Book value per common share | $ | 3,638,975 | 82,900,617 | $ | 43.90 | ||||||
| Non-GAAP Adjustments: | |||||||||||
Assumed exercise of outstanding stock options (c)(d) | 1,319 | 65,401 | |||||||||
| Unvested restricted shares | — | 3,026,376 | |||||||||
Book value per diluted common share (e) | 3,640,294 | 85,992,394 | $ | 42.33 | |||||||
| Goodwill | (196,758 | ) | — | ||||||||
| Intangible assets | (121,258 | ) | — | ||||||||
Tangible book value per diluted common share (e) | $ | 3,322,278 | 85,992,394 | $ | 38.63 | ||||||
Book value per diluted common share (e) | $ | 42.33 | |||||||||
| Accumulated dividends | 10.16 | ||||||||||
Book value per diluted common share plus accumulated dividends (e) | $ | 52.49 | |||||||||
| (a) | Total shareholders’ equity available to Validus common shareholders excludes the liquidation value of the preferred shares of $150,000. |
| (b) | Per share amounts are calculated by dividing the equity amount by the common shares. |
| (c) | At December 31, 2016, the weighted average exercise price for those stock options that had an exercise price lower than book value per share was $23.48 (December 31, 2015: $20.17). |
| (d) | Using the “as-if-converted” method, assuming all proceeds received upon exercise of stock options will be retained by the Company and the resulting common shares from exercise remain outstanding. |
| (e) | Non-GAAP financial measure. |
Book value per common share, a GAAP financial measure, increased by $2.71, or 6.2%, from $43.90 at December 31, 2015 to $46.61 at December 31, 2016.
1
Book value per diluted common share plus accumulated dividends, a non-GAAP financial measure, is considered by management to be the key financial indicator of performance, as the Company believes growth in book value on a diluted basis, plus the dividends that have accumulated, ultimately translates into the return that a shareholder will receive. Book value per diluted common share plus accumulated dividends increased by $4.04, or 7.7%, from $52.49 at December 31, 2015 to $56.53 at December 31, 2016. Cash dividends per common share are an integral part of the value created for shareholders. During the year ended December 31, 2016 the Company paid cash dividends of $1.40 (2015: $1.28) per common share.
Book value per diluted common share, a non-GAAP financial measure, is considered by management to be a measure of returns to common shareholders, as the Company believes growth in book value on a diluted basis ultimately translates into growth in stock price. Book value per diluted common share after dividends paid increased by $2.64, or 6.2%, from $42.33 at December 31, 2015 to $44.97 at December 31, 2016. Growth in book value per diluted common share inclusive of dividends was 9.5% and 10.0% for the year ended December 31, 2016 and 2015, respectively. All outstanding warrants expired on December 12, 2015 and no further warrants are anticipated to be issued.
Tangible book value per diluted common share, a non-GAAP financial measure, is considered by management to be a measure of returns to common shareholders excluding goodwill and other intangible assets, as the Company believes growth in tangible book value on a diluted basis ultimately translates into growth in the tangible value of the Company. Tangible book value per diluted common share increased by $2.53, or 6.5%, from $38.63 at December 31, 2015 to $41.16 at December 31, 2016.
Other financial indicators
In addition to presenting net income available to Validus common shareholders determined in accordance with U.S. GAAP, the Company believes that showing net operating income available to Validus common shareholders, a non-GAAP financial measure, provides investors with a valuable measure of profitability and enables investors, analysts, rating agencies and other users of its financial information to more easily analyze the Company’s results in a manner similar to how management analyzes the Company’s underlying business performance.
Net operating income available to Validus common shareholders is calculated by the addition or subtraction of certain Consolidated Statement of Income and Comprehensive Income line items from net income available to Validus common shareholders, the most directly comparable GAAP financial measure, as illustrated in the table below:
| Three Months Ended December 31, | Years Ended December 31, | |||||||||||||||||||
| (Dollars in thousands) | 2016 | 2015 | 2016 | 2015 | 2014 | |||||||||||||||
| Net income available to Validus common shareholders | $ | 7,767 | $ | 69,042 | $ | 359,384 | $ | 374,893 | $ | 479,963 | ||||||||||
| Non-GAAP Adjustments: | ||||||||||||||||||||
| Net realized (gains) losses on investments | (9,220 | ) | 2,928 | (15,757 | ) | (2,298 | ) | (14,917 | ) | |||||||||||
| Change in net unrealized losses (gains) on investments | 67,460 | 34,862 | (16,871 | ) | 32,395 | 2,842 | ||||||||||||||
| (Income) loss from investment affiliates | (2,166 | ) | 1,261 | 2,083 | (4,281 | ) | (8,411 | ) | ||||||||||||
| Foreign exchange losses (gains) | 901 | (797 | ) | (10,864 | ) | 8,731 | 12,181 | |||||||||||||
| Other (income) loss | (7 | ) | (1,576 | ) | 766 | 1,002 | 2,243 | |||||||||||||
| Transaction expenses | — | — | — | — | 8,096 | |||||||||||||||
| Net (loss) income attributable to noncontrolling interests | (412 | ) | (325 | ) | 457 | (693 | ) | (1,235 | ) | |||||||||||
Tax (benefit) expense (a) | (5,863 | ) | (2,201 | ) | 1,687 | 384 | 483 | |||||||||||||
Net operating income available to Validus common shareholders (b) | $ | 58,460 | $ | 103,194 | $ | 320,885 | $ | 410,133 | $ | 481,245 | ||||||||||
Average shareholders’ equity available to Validus common shareholders (c) | $ | 3,702,956 | $ | 3,641,970 | $ | 3,697,114 | $ | 3,641,920 | $ | 3,683,029 | ||||||||||
| Annualized return on average equity | 0.8 | % | 7.6 | % | 9.7 | % | 10.3 | % | 13.0 | % | ||||||||||
Annualized net operating return on average equity (b) | 6.3 | % | 11.3 | % | 8.7 | % | 11.3 | % | 13.1 | % | ||||||||||
| (a) | Represents the tax expense or benefit associated with the specific country to which the pre-tax adjustment relates to. The tax impact is estimated by applying the statutory rates of applicable jurisdictions, after consideration of other relevant factors including the ability to utilize tax losses carried forward. |
| (b) | Non-GAAP financial measure. |
| (c) | Average shareholders’ equity for the three months ended is the average of the beginning and ending quarter end shareholders’ equity balances, excluding the liquidation value of the preferred shares of $150,000. Average shareholders’ equity for the year ended is the average of the beginning, ending and intervening quarter end shareholders’ equity balances, excluding the liquidation value of the preferred shares of $150,000. |
2
Net operating income available to Validus common shareholders, a non-GAAP financial measure, measures the performance of the Company’s operations without the influence of gains or losses on investments and foreign currencies and other items as noted in the table above. The Company excludes these items from its calculation of net operating income available to Validus common shareholders because the amount of these gains and losses is heavily influenced by, and fluctuates in part, according to availability of investment market opportunities and other factors. The Company believes these amounts are largely independent of its core underwriting activities and including them distorts the analysis of trends in its operations. The Company believes the reporting of net operating income available to Validus common shareholders enhances the understanding of results by highlighting the underlying profitability of the Company’s core (re)insurance operations. This profitability is influenced significantly by earned premium growth, adequacy of the Company’s pricing, as well as loss frequency and severity. Over time it is also influenced by the Company’s underwriting discipline, which seeks to manage exposure to loss through favorable risk selection and diversification, its management of claims, its use of reinsurance and its ability to manage its expense ratio, which it accomplishes through its management of acquisition costs and other underwriting expenses.
Return on average equity, a GAAP financial measure, and net operating return on average equity, a non-GAAP financial measure, represents the returns generated on common shareholders’ equity during the year. The Company’s objective is to generate superior returns on capital that appropriately reward shareholders for the risks assumed.
For further discussion of the components driving the Company’s financial indicators refer to the “Results of Operations” sections.
3