EST. OF FUTURE RESERVES AND REVENUES
U. S. SECURITIES & EXCHANGE COMMISSION REPORT IN MISSISSIPPI & LOUISIANA
TO LEXARIA CORPORATION AS OF OCTOBER 31, 2008
| December 26, 2008 |

| Lexaria Corporation Attn: Mr. Chris Bunka, President 700 West Pender, Suite 604 Vancouver, BC V6C 1G8 |
Re: | Estimate of Future Reserves and Revenues U. S. Securities and Exchange Commission (SEC) Report Wilkinson County, Mississippi West Feliciana Parish, Louisiana As of October 31, 2008 |
Dear Mr. Bunka,
Following your request, we have estimated the future net reserves and revenues for Lexaria Corporation participating in the Phase I and Phase II drilling programs located in Wilkinson County, Mississippi and West Feliciana Parish, Louisiana. The proved developed reserves consist of the producing properties and those wells which are shut-in and a minimal investment is needed to commence production. The proved undeveloped properties consist of locations which directly off-set existing producing wells. Open-hole logs, core analysis, seismic and/or geological maps were used in the calculation of reserves for all proved properties. Attached herein are one-line and detailed economic summaries for Lexaria Corporation’s interest in these programs. Our conclusions, as of October 31, 2008 are found on the following page.
| Lexaria Corporation | ||||||||
| Wilkinson County, MS | ||||||||
| West Feliciana Parish, LA | ||||||||
| As of October 31, 2008 | ||||||||
| CASH | ||||||||
| NET OIL, | NET GAS, | CASH FLOW, | FLOW, | |||||
| Category | BBLS | MCF | UNDISC | DISC @ 10% | ||||
| Proved Developed Reserves | ||||||||
| Phase I | 35,740 | 68,220 | $2,034,174 | $1,672,641 | ||||
| Phase II | 0 | 111,200 | $184,455 | $153,149 | ||||
| 35,740 | 179,420 | $2,218,629 | $1,825,790 | |||||
| Proved Un-developed Reserves | ||||||||
| Phase I | 40,920 | 0 | $1,675,738 | $1,208,960 | ||||
| Total Proved Reserves | 76,660 | 179,420 | $3,894,367 | $3,034,750 | ||||
The working interests and net revenue interests used to calculate these net reserves and revenues were supplied by Lexaria Corporation and are as follows:
| Lexaria Corporation Summary of Interests |
| Working | Working Interest | Net Revenue | ||||
| Drilling Program | Interest | Reversion Upon Completion | Interest | |||
| Phase I | 30% | 25.5% | 19.125% | |||
| Phase II | 45% | 36% | 27% |
CLASSIFICATIONS AND DEFINITIONS
The classifications and definitions for proved reserves are consistent with those of the Securities and Exchange Commission (SEC). A copy of the Reserve Classification is included in this report.
RESERVE ESTIMATES
3-D and/or geological maps, logs, core analysis and test data taken from all wells included in this report were provided by the operator, Griffin & Griffin, LLC. This data was analyzed and used in calculating porosity, water saturation, thickness, temperature and pressure for the different reservoirs.
The Legatski correlation1was used in determining reserves by the volumetric method. This correlation predicts the recovery of gas reserves from water-drive reservoirs. However, the range of sweep efficiency can be altered from a depletion drive reservoir to a strong water-drive reservoir. For the producing properties, the historical production was incorporated in the calculation of remaining reserves. The proved undeveloped locations are direct off-sets from producing wells and the drainage area is
1SPE 899: Displacement of Gas from Porous Media by Water, Max W. Legatski
| approximately twenty acres per well. PRODUCT PRICES |
The initial oil price of $64.00/Bbl used in this report is taken from the posted price published by Plains Marketing, LP on October 31, 2008 for central Louisiana. The initial gas price used of $6.17/Mcf is the spot price for Natural Gas Henry Hub on October 31, 2008. Prices are held constant throughout the life of the forecast.
EXPENSES
Drilling, work-over, re-completion and operating expenses were supplied by Griffin & Griffin, LLC and are based on historical costs. Expenses were held constant throughout the life of the forecast. Attached herein is a table showing the lease operating expenses for each well.
PLUGGING AND ABANDONMENT / RECLAMATION COSTS
Abandonment and reclamation costs were estimated to be $2.00 per foot (measured depth) and were applied at the end of the life for each property separately. This estimate is consistent with the Louisiana Office of Conservation bonding rules for wells with depths from 3,001 ft. to 10,000 ft. Included in the table showing lease operating expenses is also a column showing the estimated plugging and restoration costs for each wellbore.
PROJECTIONS
The attached reserve and revenue projections are on a calendar year basis.
REPORT QUALIFICATIONS
The estimated revenues, both discounted and undiscounted, are not represented as constituting the fair market value of the properties.
Veazey & Associates, LLC has made no independent examination of titles to the appraised properties, nor has the actual degree or type of interest owned been independently confirmed. The data used in our evaluation were supplied by partners Lexaria Corporation, Griffin & Griffin, LLC or obtained from public records of the Louisiana Office of Conservation and Mississippi State Oil and Gas Board and/or published industry sources and were considered accurate. A field inspection of the properties was not made nor considered necessary for the purpose of this report.
Environmental studies were not conducted and are beyond the scope of this investigation. Ownership, product prices and other factual data have been accepted as represented by Lexaria Corporation and Griffin & Griffin, LLC. We have generally tested the validity of these data and believe the information is correct.
The quality of available information and the application of engineering interpretation and judgment affect the reliability of any reserve estimate. In our opinion, the reserve estimates presented herein are reasonable. These reserves should be accepted with the understanding that drilling activity or additional information subsequent to the date of this report might require their revision.
In performing this study, we have not considered matters in which legal or accounting, rather than engineering interpretation may be controlling. Finally, it must be realized that forecasting, by its nature, is subject to uncertainty, and the conclusions expressed herein are based on interpretation of engineering data and such conclusions necessarily represent only informed professional judgments.
Neither Veazey & Associates, LLC nor any of its employees has any interest in the subject properties and neither the employment to make this study nor the compensation is contingent on our estimates of reserves and future income for the subject properties.
Included herein is our firm’s curriculum vita. The appraiser graduated from Louisiana State University in Petroleum Engineering and has been a registered professional engineer since 2001. He has thirteen years of petroleum engineering experience and is a member of the Society of Petroleum Engineers.
If you have any questions or comments, please contact me. Thank you for the opportunity to review this matter. As always, I remain

| Jim Veazey, PE Louisiana Reg. No. 29335 |
SEC Proved Oil and Gas Reserve Definitions
- Proved Reserves
- Proved Developed Reserves
- Proved Undeveloped Reserves
- Reserve Status Categories - (producing, non-producing, etc)
INTRODUCTION
Financial Accounting and Reporting for Oil and Gas Producing Activities Pursuant to the Federal Securities Laws and the Energy Policy and Conservation Act of 1975
Reg. § 210.4 -10.
This section prescribes financial accounting and reporting standards for registrants with the Commission engaged in oil and gas producing activities in filings under the federal securities laws and for the preparation of accounts by persons engaged, in whole or in part, in the production of crude oil or natural gas in the United States, pursuant to Section 503 of the Energy Policy and Conservation Act of 1975 [42 U.S.C. 6383] ("EPCA") and section 11(c) of the Energy Supply and Environmental Coordination Act of 1974 [IS U.S.C. 796] ("ESECA"), as amended by section 505 of EPCA. The application of this section to those oil and gas producing operations of companies regulated for rate-making purposes on an individual-company-cost-of-service basis may, however, give appropriate recognition to differences arising because of the effect of the rate-making process.
Exemption. Any person exempted by the Department of Energy from any record-keeping or reporting requirements pursuant to Section 11(c) of ESECA, as amended, is similarly exempted from the related provisions of this section in the preparation of accounts pursuant to EPCA. This exemption does not affect the applicability of this section to filings pursuant to the federal securities laws.
Definitions
(a) Definitions. The following definitions apply to the terms listed below as they are used in this section:
(1) Oil and gas producing activities.
(i) Such activities include:
(A) The search for crude oil, including condensate and natural gas liquids, or natural gas ("oil and gas") in their natural states and original locations.
(B) The acquisition of property rights or properties for the purpose of further exploration and/or for the purpose of removing the oil or gas from existing reservoirs on those properties.
(C) The construction, drilling and production activities necessary to retrieve oil and gas from its natural reservoirs, and the acquisition, construction, installation, and maintenance of field gathering and storage systems -including lifting the oil and gas to the surface and gathering, treating, field processing (as in the case of processing gas to extract liquid hydrocarbons) and field storage. For purposes of this section, the oil and gas production function shall normally be regarded as terminating at the outlet valve on the lease or field storage tank; if unusual physical or operational circumstances exist, it may be appropriate to regard the production functions as terminating at the first point at which oil, gas, or gas liquids are delivered to a main pipeline, a common carrier, a refinery, or a marine terminal.
(ii) Oil and gas producing activities do not include:
| (A) | The transporting, refining and marketing of oil and gas. |
| (B) | Activities relating to the production of natural resources other than oil and gas. |
| (C) | The production of geothermal steam or the extraction of hydrocarbons as a by- |
product of the production of geothermal steam or associated geothermal resources as defined in the Geothermal Steam Act of 1970.
(D) The extraction of hydrocarbons from shale, tar sands, or coal.
(2) Proved oil and gas reserves. Proved oil and gas reserves are the estimated quantities of crude oil, natural gas, and natural gas liquids which geological and engineering data demonstrate with reasonable certainty to be recoverable in future years from known reservoirs under existing economic and operating conditions, i.e., prices and costs as of the date the estimate is made. Prices include consideration of changes in existing prices provided only by contractual arrangements, but not on escalations based upon future conditions.
(i) Reservoirs are considered proved if economic producibility is supported by either actual production or conclusive formation test. The area of a reservoir considered proved includes (A) that portion delineated by drilling and defined by gas-oil and/or oil-water contacts, if any; and (B) the immediately adjoining portions not yet drilled, but which can be reasonably judged as economically productive on the basis of available geological and engineering data. In the absence of information on fluid contacts, the lowest known structural occurrence of hydrocarbons controls the lower proved limit of the reservoir.
(ii) Reserves which can be produced economically through application of improved recovery techniques (such as fluid injection) are included in the "proved" classification when successful testing by a pilot project, or the operation of an installed program in the reservoir, provides support for the engineering analysis on which the project or program was based.
(iii) Estimates of proved reserves do not include the following:
(A) oil that may become available from known reservoirs but is classified separately as "indicated additional reserves";
(B) crude oil, natural gas, and natural gas liquids, the recovery of which is subject to reasonable doubt because of uncertainty as to geology, reservoir characteristics, or economic factors;
(C) crude oil, natural gas, and natural gas liquids, that may occur in undrilled prospects; and
(D) crude oil, natural gas, and natural gas liquids, that may be recovered from oil shales, coal, gilsonite and other such sources.
RESERVE STATUS CATEGORIES
(3) Proved developed oil and gas reserves. Proved developed oil and gas reserves are reserves that can be expected to be recovered through existing wells with existing equipment and operating methods. Additional oil and gas expected to be obtained through the application of fluid injection or other improved recovery techniques for supplementing the natural forces and mechanisms of primary recovery should be included as "proved developed reserves" only after testing by a pilot project or after the operation of an installed program has confirmed through production response that increased recovery will be achieved.
(4) Proved undeveloped reserves. Proved undeveloped oil and gas reserves are reserves that are expected to be recovered from new wells on undrilled acreage, or from existing wells where a relatively major expenditure is required for recompletion. Reserves on undrilled acreage shall be limited to those drilling units offsetting productive units that are reasonably certain of production when drilled. Proved reserves for other undrilled units can be claimed only where it can be demonstrated with certainty that there is continuity of production from the existing productive formation. Under no circumstances should estimates, for proved undeveloped reserves be attributable to any acreage for which an application of fluid injection or other improved recovery technique is contemplated, unless such techniques Leave been proved effective by actual tests in the area and in the same reservoir.
(5)Proved properties. Properties with proved reserves.
UNPROVED RESERVES
| (6) | Unproved properties. Properties with no proved reserves. |
| (7) | Proved area. The part of a property to which proved reserves have been specifically |
attributed.
(8)Field. An area consisting of a single reservoir or multiple reservoirs all grouped on or related to the same individual geological structural feature and/or stratigraphic condition.
There may be two or more reservoirs in a field which are separated vertically by intervening impervious strata, or laterally by local geologic barriers, or by both. Reservoirs that are associated by being in overlapping or adjacent fields may be treated as a single or common operational field. The geological terms "structural feature" and "stratigraphic condition" are intended to identify localized geological features as opposed to the broader terms of basins, trends, provinces, plays, areas-of-interest, etc.
(9)Reservoir. A porous and permeable underground formation containing a natural accumulation of producible oil and/or gas that is confined by impermeable rock or water barriers and is individual and separate from other reservoirs.
(10)Exploratory well. A well drilled to find and produce oil or gas in an unproved area, to find a new reservoir in a field previously found to be productive of oil or gas in another reservoir, or to extend a known reservoir. Generally, an exploratory well is any well that is not a development well, a service well, or a stratigraphic test well as those items are defined below.
(11)Development well. A well drilled within the proved area of an oil or gas reservoir to the depth of a stratigraphic horizon known-to be productive.
(12)Service well.A well drilled or completed for the purpose of supporting production in an existing field. Specific purposes of service wells include gas injection, water injection, steam injection, air injection, salt-water disposal, water supply for injection, observation, or injection for in-situ combustion.
(13)Stratigraphic test well. A drilling effort, geologically directed, to obtain information pertaining to a specific geologic condition. Such wells customarily arc drilled without the intention of being completed for hydrocarbon production. This classification also includes tests identified as core tests and all types of expendable holes related to hydrocarbon exploration. Stratigraphic test wells are classified as (i) "exploratory type," if not drilled in a proved area, or (ii) "development type," if drilled in a proved area.
(14)Acquisition of properties. Costs incurred to purchase, lease or otherwise acquire a property, including costs of lease bonuses and options to purchase or lease properties, the portion of costs applicable to minerals when land including mineral rights is purchased in fee, brokers' fees, recording fees, legal costs, and other costs incurred in acquiring properties.
(15)Exploration costs.Costs incurred in identifying areas that may warrant examination and in examining specific areas that are considered to have prospects of containing oil and gas reserves, including costs of drilling exploratory wells and exploratory-type stratigraphic test wells. Exploration costs may be incurred both before acquiring the related property (sometimes referred to in part as prospecting costs) and after acquiring the property. Principal types of exploration costs, which include depreciation and applicable operating costs of support equipment and facilities and other costs of exploration activities, are:
(i) Costs of topographical, geographical and geophysical studies, rights of access to properties to conduct those studies, and salaries and other expenses of geologists, geophysical crews, and others conducting those studies. Collectively, these are sometimes referred to as geological and geophysical or "G&G" costs.
(ii) Costs of carrying and retaining undeveloped properties, such as delay rentals, ad valorem taxes on properties, legal costs for title defense, and the maintenance of land and lease records.
| (iii) | Dry hole contributions and bottom hole contributions. |
| (iv) | Costs of drilling and equipping exploratory wells. |
| (v) �� | Costs of drilling exploratory-type stratigraphic test wells. |
(16)Development costs. Costs incurred to obtain access to proved reserves and to provide facilities for extracting, treating, gathering and storing the oil and gas. More specifically, development costs, including depreciation and applicable operating costs of support equipment and facilities and other costs of development activities, are costs incurred to:
(i) Gain access to and prepare well locations for drilling, including surveying well locations for the purpose of determining specific development drilling sites, clearing ground, draining, road building, and relocating public roads, gas lines, and power lines, to the extent necessary in developing the proved reserves.
(ii) Drill and equip development wells, development-type stratigraphic test wells, and service wells, including the costs of platforms and of well equipment such as casing, tubing, pumping equipment, and the wellhead assembly.
(iii) Acquire, construct, and install production facilities such as lease flow lines, separators, treaters, heaters, manifolds, measuring devices, and production storage tanks, natural gas cycling and processing plants, and central utility and waste disposal systems.
(iv) Provide improved recovery systems.
(17)Production costs.
(i) Costs incurred to operate and maintain wells and related equipment and facilities, including depreciation and applicable operating costs of support equipment and facilities and other costs of operating and maintaining those wells and related equipment and facilities. They become part of the cost of oil and gas produced. Examples of production costs (sometimes called lifting costs) are:
| (A) | Costs of labor to operate the wells and related equipment and facilities. |
| (B) | Repairs and maintenance. |
(C) Materials, supplies, and fuel consumed and supplies utilized in operating the wells and related equipment and facilities.
(D) Property taxes and insurance applicable to proved properties and wells and related equipment and facilities.
(E) Severance taxes.
(ii) Some support equipment or facilities may serve two or more oil and gas producing activities and may also serve transportation, refining, and marketing activities. To the extent that the support equipment and facilities are used in oil and gas producing activities, their depreciation and applicable operating costs become exploration, development or production costs, as appropriate. Depreciation, depletion, and amortization of capitalized acquisition, exploration, and development costs are not production costs but also become part of the cost of oil and gas produced along with production (lifting) costs identified above.
Successful Efforts Method
(b) A reporting entity that follows the successful efforts method shall comply with the accounting and financial reporting disclosure requirements of Statement of Financial Accounting Standards No. 19, as amended.
Full Cost Method
(c) Application of the full cost method of accounting. A reporting entity that follows the full cost method shall apply that method to all of its operations and to the operations of its subsidiaries, as follows:
(1) Determination of cost centers. Cost centers shall be established-on a country-by-country basis.
(2) Costs to be capitalized. All costs associated with property acquisition, exploration, and development activities (as defined in paragraph (a) of this section) shall be capitalized within the appropriate cost center. Any internal costs that are capitalized shall be limited to those costs that can be directly identified with acquisition, exploration, and development activities undertaken by the reporting entity for its own account, and shall not include any costs related to production, general corporate overhead, or similar activities.
(3) Amortization of capitalized costs. Capitalized costs within a cost center shall be amortized on the unit-of-production basis using proved oil and gas reserves, as follows:
(i) Costs to be amortized shall include (A) all capitalized costs, less accumulated amortization, other than the cost of properties described in paragraph (ii) below; (B) the estimated future expenditures (based on current costs) to be incurred in developing
proved reserves; and (C) estimated dismantlement and abandonment costs, net of estimated salvage values.
(ii) The cost of investments in unproved properties and major development projects may be excluded from capitalized costs to be amortized, subject to the following:
(A) All costs directly associated with the acquisition and evaluation of unproved properties may be excluded from the amortization computation until it is determined whether or not proved reserves can be assigned to the properties, subject to the following conditions: (1) Until such a determination is made, the properties shall be assessed at least annually to ascertain whether impairment has occurred. Unevaluated properties whose costs are individually significant shall be assessed individually. Where it is not practicable to individually assess the amount of impairment of properties for which costs are not individually significant, such properties may be grouped for purposes of assessing impairment. Impairment may be estimated by applying factors based on historical experience and other data such as primary Lease terms of the properties, average holding periods of unproved properties, and geographic and geologic data to groupings of individually insignificant properties and projects. The amount of impairment assessed under either of these methods shall be added to the costs to be amortized. (2) The costs of drilling exploratory dry holes shall be included in the amortization base immediately upon determination that the well is dry. (3) If geological and geophysical costs cannot be directly associated with specific unevaluated properties, they shall be included in the amortization base as incurred. Upon complete evaluation of a property, the total remaining excluded cost (net of any impairment) shall be included in the full cost amortization base.
(B) Certain costs may be excluded from amortization when incurred in connection with major development projects expected to entail significant costs to ascertain the quantities of proved reserves attributable to the properties under development (e.g., the installation of an offshore drilling platform from which development wells are to be drilled, the installation of improved recovery programs, and similar major projects undertaken in the expectation of Significant additions to proved reserves). The amounts which may be excluded are applicable portions of (1) the costs that relate to the major development project and have not previously been included in the amortization base, and (2) the estimated future expenditures associated with the development project. The excluded portion of any common costs associated with the development project should be based, as is most appropriate in the circumstances, on a comparison of either (i) existing proved reserves to total proved reserves expected to be established upon completion of the project, or (ii) the number of wells to which proved reserves have been assigned and total number of wells expected to be drilled. Such costs may be excluded from costs to be amortized until the earlier determination of whether additional reserves are proved or impairment occurs.
(C) Excluded costs and the proved reserves related to such costs shall be transferred into the amortization base on an ongoing (well-by-well or property-by-property) basis as the project is evaluated and proved reserves established or impairment determined. Once proved reserves are established, there is no further justification for continued exclusion
from the full cost amortization base even if other factors prevent immediate production or marketing.
(iii) Amortization shall be computed on the basis of physical units, with oil and gas converted to a common unit of measure on the basis of their approximate relative energy content, unless economic circumstances (related to the effects of regulated prices) indicate that use of units of revenue is a more appropriate basis of computing amortization. In the latter case, amortization shall be computed on the basis of current gross revenues (excluding royalty payments and net profits disbursements) from production in relation to future cross revenues, based on current prices (including consideration of changes in existing prices provided only by contractual arrangements), from estimated production of proved oil and gas reserves. The effect of a significant price increase during the year on estimated future gross revenues shall be reflected in the amortization provision only for the period after the price increase occurs.
(iv) In some cases it may be more appropriate to depreciate natural gas cycling and processing plants by a method other than the unit-of-production method.
(v) Amortization computations shall be made on a consolidated basis, including investees accounted for on a proportionate consolidation basis. Investees accounted for on the equity method shall be treated separately.
(4) Limitation on capitalized costs:
(i) For each cost center, capitalized costs, less accumulated amortization and related deferred income taxes, shall not exceed an amount (the cost center ceiling) equal to the sum of:
(A) the present value of estimated future net revenues computed by applying current prices of oil and gas reserves (with consideration of price changes only to the extent provided by contractual arrangements) to estimated future production of proved oil and gas reserves as of the date of the latest balance sheet presented, less estimated future expenditures (based on current costs) to be incurred in developing and producing the proved reserves computed using a discount factor of ten percent and assuming continuation of existing economic conditions; plus
(B) the cost of properties not being amortized pursuant to paragraph (i)(3)(ii) of this section; plus
(C) the lower of cost or estimated fair value of unproven properties included in the costs being amortized; less
(D) income tax effects related to differences between the book and tax basis of the properties referred to in paragraphs (i)(4)(i)(B) and (C) of this section.
(ii) If unamortized costs capitalized within a cost center, less related deferred income taxes, exceed the cost center ceiling, the excess shall be charged to expense and
separately disclosed during the period in which the excess occurs. Amounts thus required to be written off shall not be reinstated for any subsequent increase in the cost center ceiling.
(5) Production costs. All costs relating to production activities, including workover costs incurred solely to maintain or increase levels of production from an existing completion interval, shall be charged to expense as incurred.
(6) Other transactions. The provisions of paragraph (h) of this section, "Mineral property conveyances and related transactions if the successful efforts method of accounting is followed," shall apply also to those reporting entities following the full cost method except as follows:
(i) Sales and abandonments of oil and gas properties. Sales of oil and gas properties, whether or not being amortized currently, shall be accounted for as adjustments of capitalized costs, with no gain or loss recognized, unless such adjustments would significantly alter the relationship between capitalized costs and proved reserves of oil and gas attributable to a cost center. For instance, a significant alteration would not ordinarily be expected to occur for sales involving less than 25 percent of the reserve quantities of a given cost center. If gain or loss is recognized on such a sale, total capitalization costs within the cost center shall be allocated between the reserves sold and reserves retained on the same basis used to compute amortization, unless there are substantial economic differences between the properties sold and those retained, in which case capitalized costs shall be allocated on the basis of the relative fair values of the properties. Abandonments of oil and gas properties shall be accounted for as adjustments of capitalized costs; that is, the cost of abandoned properties shall be charged to the full cost center and amortized (subject to the limitation on capitalized costs in paragraph (b) of this section).
(ii) Purchases of reserves. Purchases of oil and gas reserves in place ordinarily shall be accounted for as additional capitalized costs within the applicable cost center; however, significant purchases of production payments or properties with lives substantially shorter than the composite productive life of the cost center shall be accounted for separately.
(iii) Partnerships, joint ventures and drilling arrangements.
(A) Except as provided in subparagraph (i)(6)(i) of this section, all consideration received from sales or transfers of properties in connection with partnerships, joint venture operations, or various other forms of drilling arrangements involving oil and gas exploration and development activities (e.g., carried interest, turnkey wells, management fees, etc.) shall be credited to the full cost account, except to the extent of amounts that represent reimbursement of organization, offering, general and administrative expenses, etc., that are identifiable with the transaction, if such amounts are currently incurred and charged to expense.
(B) Where a registrant organizes and manages a limited partnership involved only in the purchase of proved developed properties and subsequent distribution of income from
such properties, management fee income may be recognized provided the properties involved do not require aggregate development expenditures in connection with production of existing proved reserves in excess of 10% of the partnership's recorded cost of such properties. Any income not recognized as a result of this limitation would be credited to the full cost account and recognized through a lower amortization provision as reserves are produced.
(iv) Other services. No income shall be recognized in connection with contractual services performed (e.g. drilling, well service, or equipment supply services, etc.) in connection with properties in which the registrant or an affiliate (as defined in § 210.1 -02(b)) holds an ownership or other economic interest, except as follows:
(A) Where the registrant acquires an interest in the properties in connection with the service contract, income may be recognized to the extent the cash consideration received exceeds the related contract costs plus the registrant's share of costs incurred and estimated to be incurred in connection with the properties. Ownership interests acquired within one year of the date of such a contract are considered to be acquired in connection with the service for purposes of applying this rule. The amount of any guarantees or similar arrangements undertaken as part of this contract should be considered as part of the costs related to the properties for purposes of applying this rule.
(B) Where the registrant acquired an interest in the properties at least one year before the date of the service contract through transactions unrelated to the service contract, and that interest is unaffected by the service contract, income from such contract may be recognized subject to the general provisions for elimination of intercompany profit under generally accepted accounting principles.
(C) Notwithstanding the provisions of (A) and (B) above, no income may be recognized for contractual services performed on behalf of investors in oil and gas producing activities managed by the registrant or an affiliate. Furthermore, no income may be recognized for contractual services to the extent that the consideration received for such services represents an interest in the underlying property.
(D) Any income not recognized as a result of these rules would be credited to the full cost account and recognized through a lower amortization provision as reserves are produced.
(7) Disclosures. Reporting entities that follow the full cost method of accounting shall disclose all of the information required by paragraph (k) of this section, with each cost center considered as a separate geographic area, except that reasonable groupings may be made of cost centers that are not significant in the aggregate. In addition:
(i) For each cost center for each year that an income statement is required, disclose the total amount of amortization expense (per equivalent physical unit of production if amortization is computed on the basis of physical units or per dollar of gross revenue from production if amortization is computed on the basis of gross revenue).
(ii) State separately on the face of the balance sheet the aggregate of the capitalized costs of unproved properties and major development projects that are excluded, in accordance with paragraph (i)(3) of this section, from the capitalized costs being amortized. Provide a description in the notes to the financial statements of the current status of the significant properties or projects involved, including the anticipated timing of the inclusion of the costs in the amortization computation. Present a table that shows, by category of cost, (A) the total costs excluded as of the most recent fiscal year; and (B) the amounts of such excluded costs, incurred (1) in each of the three most recent fiscal years and (2) in the aggregate for any earlier fiscal years in which the costs were incurred. Categories of cost to be disclosed include acquisition costs, exploration costs, development costs in the case of significant development projects and capitalized interest.
Income taxes
(d) Income taxes. Comprehensive inter-period income tax allocation by a method which complies with generally accepted accounting principles shall be followed for intangible drilling and development costs and other costs incurred that enter into the determination of taxable income and pretax accounting income in different periods.
| Gross Expenses and Costs | ||||||||||
| Phase I and Phase II Drilling Programs | ||||||||||
| As of 10/31/2008 | ||||||||||
| Lease | Plugging & | |||||||||
| Operating | Work-over | Restoration | ||||||||
| Well Name | Category | Expense | Cost | Drilling Cost | Cost | |||||
| Phase I | ||||||||||
| PP F-12-1 | PDP | $6,452 | --- | --- | $6,000 | |||||
| PP F-12-3 | PDP | $10,519 | --- | --- | $6,000 | |||||
| PP F-39 | PDP | $4,467 | --- | --- | $5,332 | |||||
| PP F-6B | PDP | $7,667 | --- | --- | $4,000 | |||||
| PP F-39 | PDP | $4,467 | --- | --- | --- | |||||
| PP F-42 | PNP | $1,384 | $1,500 | --- | $6,100 | |||||
| PP F-52A | PNP | $9,483 | $66,890 | --- | $7,598 | |||||
| PP F-29 | PNP | $2,800 | $1,500 | --- | --- | |||||
| PP F-29 PNP1 | PNP | $2,800 | $38,000 | --- | --- | |||||
| PP F-29 PNP2 | PNP | $2,800 | $38,000 | --- | $8,200 | |||||
| PP F-39 PNP1 | PNP | $4,467 | $80,000 | --- | $5,332 | |||||
| F-12 Offset Wells | PUD | $8,485/well | --- | $736,500/Well | $6,000/well | |||||
| Phase II | ||||||||||
| USA 1-37 | PDP | $14,307 | --- | --- | $6,360 | |||||
| USA 39-14 | PDP | $6,592 | --- | --- | $6,400 | |||||
| BR F-33 | PNP | $9,395 | $1,500 | --- | $8,000 | |||||
| Faust No. 1 | PNP | $8,000 | $300,000 | --- | $11,000 | |||||
| 12/31/2008 | 3:01:18PM | Economic One-Liners | ||||||||||||||||||||||||||
| Project Name : | 2008 SEC Report | As of Date: | 10/31/2008 | |||||||||||||||||||||||||
| Ownership Group : | Lexaria Corp | |||||||||||||||||||||||||||
| Cash Flow | ||||||||||||||||||||||||||||
| Gross Reserves | Net Reserves | Net Revenue | Expense | |||||||||||||||||||||||||
| Lease Name | Oil | Gas | Oil | Gas | Oil | Gas | Other | & Tax | Invest. | Non-Disc. | Disc. 10% | |||||||||||||||||
| (Mbbl) | (MMcf) | (Mbbl) | (MMcf) | ($) | ($) | ($) | ($) | ($) | ($) | ($) | ||||||||||||||||||
| Risked/UnRisked | ||||||||||||||||||||||||||||
| Proved Rsv Class | ||||||||||||||||||||||||||||
| Producing Rsv Category | ||||||||||||||||||||||||||||
| PP F-39 - No. 1 | 0.00 | 88.93 | 0.00 | 17.01 | 0.00 | 104,940.87 | 0.00 | 42,696.13 | 0.00 | 62,244.74 | 55,932.52 | |||||||||||||||||
| PP F-12-1 | 94.00 | 0.00 | 17.98 | 0.00 | 1,150,560.00 | 0.00 | 0.00 | 172,153.61 | 1,530.00 | 976,876.39 | 827,560.80 | |||||||||||||||||
| PP F-6B - No. 1 | 0.00 | 39.58 | 0.00 | 7.57 | 0.00 | 46,706.45 | 0.00 | 42,148.27 | 1,020.00 | 3,538.18 | 4,078.09 | |||||||||||||||||
| PP F-12-3 | 92.90 | 0.00 | 17.77 | 0.00 | 1,137,083.76 | 0.00 | 0.00 | 270,666.66 | 1,530.00 | 864,887.10 | 691,610.77 | |||||||||||||||||
| 186.90 | 128.51 | 35.74 | 24.58 | 2,287,643.76 | 151,647.32 | 0.00 | 527,664.66 | 4,080.00 | 1,907,546.41 | 1,579,182.18 | ||||||||||||||||||
| Proved Rsv Class | ||||||||||||||||||||||||||||
| Non-Producing Rsv Category | ||||||||||||||||||||||||||||
| PP F-42 - No. 1 | 0.00 | 138.48 | 0.00 | 26.48 | 0.00 | 163,410.49 | 0.00 | 61,065.75 | 1,938.00 | 100,406.75 | 70,529.77 | |||||||||||||||||
| PP F-29 - No. 1 | 0.00 | 54.23 | 0.00 | 10.37 | 0.00 | 63,989.72 | 0.00 | 35,189.25 | 382.50 | 28,417.96 | 25,533.33 | |||||||||||||||||
| PP F-52A - No. 1 | 0.00 | 35.47 | 0.00 | 6.78 | 0.00 | 41,851.50 | 0.00 | 25,054.22 | 18,994.44 | -2,197.16 | -2,603.95 | |||||||||||||||||
| 0.00 | 228.18 | 0.00 | 43.64 | 0.00 | 269,251.71 | 0.00 | 121,309.22 | 21,314.94 | 126,627.55 | 93,459.15 | ||||||||||||||||||
| Proved Rsv Class | ||||||||||||||||||||||||||||
| Undeveloped Rsv Category | ||||||||||||||||||||||||||||
| PP F-12 3rd Offset | 106.98 | 0.00 | 20.46 | 0.00 | 1,309,484.16 | 0.00 | 0.00 | 265,485.38 | 189,337.50 | 854,661.28 | 622,565.14 | |||||||||||||||||
| PP F-12 4th Offset | 106.98 | 0.00 | 20.46 | 0.00 | 1,309,484.16 | 0.00 | 0.00 | 265,927.31 | 222,480.00 | 821,076.85 | 586,395.20 | |||||||||||||||||
| 213.97 | 0.00 | 40.92 | 0.00 | 2,618,968.32 | 0.00 | 0.00 | 531,412.70 | 411,817.50 | 1,675,738.12 | 1,208,960.34 | ||||||||||||||||||
| Proved Rsv Class | 400.87 | 356.69 | 76.67 | 68.22 | 4,906,612.08 | 420,899.03 | 0.00 | 1,180,386.58 | 437,212.44 | 3,709,912.09 | 2,881,601.67 | |||||||||||||||||
| TRC Gross Eco One Liner3.rpt |
| 1 |
| Date :12/31/2008 2:59:23PM | ECONOMIC PROJECTION | |||||||||||||||||||||||
| As Of Date : | 10/31/2008 | Case : | PP F-39 - No. 1 | |||||||||||||||||||||
| Project Name : | 2008 SEC Report | Reserve Cat. : | Proved Producing | |||||||||||||||||||||
| Discount Rate (%) : | 10.00 | |||||||||||||||||||||||
| Partner : | Lexaria Corp | Field : | Artonish, E. | |||||||||||||||||||||
| Custom Selection | ||||||||||||||||||||||||
| Case Type : | LEASE CASE | Operator : | Griffin & Griffin Expl, LLC | |||||||||||||||||||||
| Archive Set : | default | Reservoir : | Frio Sand (2,800 Ft. Sand) | |||||||||||||||||||||
| Co., State : | Wilkinson, MS | |||||||||||||||||||||||
| Cum Oil (Mbbl) : | 0.00 | |||||||||||||||||||||||
| Cum Gas (MMcf) : | 97.86 | |||||||||||||||||||||||
| Gross | Gross | Net | Net | Oil | Gas | Oil | Gas | Misc. | ||||||||||||||||
| Year | Oil | Gas | Oil | Gas | Price | Price | Revenue | Revenue | Revenue | |||||||||||||||
| (Mbbl) | (MMcf) | (Mbbl) | (MMcf) | ($/bbl) | ($/Mcf) | ($) | ($) | ($) | ||||||||||||||||
| 2008 | 0.00 | 7.06 | 0.00 | 1.35 | 0.00 | 6.17 | 0.00 | 8,326.36 | 0.00 | |||||||||||||||
| 2009 | 0.00 | 38.20 | 0.00 | 7.31 | 0.00 | 6.17 | 0.00 | 45,081.37 | 0.00 | |||||||||||||||
| 2010 | 0.00 | 33.29 | 0.00 | 6.37 | 0.00 | 6.17 | 0.00 | 39,287.63 | 0.00 | |||||||||||||||
| 2011 | 0.00 | 10.38 | 0.00 | 1.98 | 0.00 | 6.17 | 0.00 | 12,245.52 | 0.00 | |||||||||||||||
| Rem | 0.00 | 0.00 | 0.00 | 0.00 | 0.00 | 0.00 | 0.00 | 0.00 | 0.00 | |||||||||||||||||
| Total | 0.00 | 88.93 | 0.00 | 17.01 | 0.00 | 6.17 | 0.00 | 104,940.87 | 0.00 | |||||||||||||||||
| Ult | 0.00 | 186.79 | ||||||||||||||||||||||||
| Well | Net Tax | Net Tax | Net | Net | Net | Other | Net | Annual | Cum Disc. | |||||||||||||||||
| Year | Count | Production | AdValorem | Investment | Lease Costs | Well Costs | Costs | Profits | Cash Flow | Cash Flow | ||||||||||||||||
| ($) | ($) | ($) | ($) | ($) | ($) | ($) | ($) | ($) | ||||||||||||||||||
| 2008 | 1.00 | 506.33 | 166.53 | 0.00 | 0.00 | 2,314.91 | 0.00 | 0.00 | 5,338.59 | 5,295.27 | ||||||||||||||||
| 2009 | 1.00 | 2,741.41 | 901.63 | 0.00 | 0.00 | 13,669.02 | 0.00 | 0.00 | 27,769.30 | 31,397.19 | ||||||||||||||||
| 2010 | 1.00 | 2,389.10 | 785.75 | 0.00 | 0.00 | 13,669.02 | 0.00 | 0.00 | 22,443.76 | 50,576.06 | ||||||||||||||||
| 2011 | 0.00 | 744.65 | 244.91 | 0.00 | 0.00 | 4,562.87 | 0.00 | 0.00 | 6,693.09 | 55,932.52 | ||||||||||||||||
| Rem. | 0.00 | 0.00 | 0.00 | 0.00 | 0.00 | 0.00 | 0.00 | 0.00 | 0.00 | |||||||||||||
| Total | 6,381.49 | 2,098.82 | 0.00 | 0.00 | 34,215.82 | 0.00 | 0.00 | 62,244.74 | 55,932.52 | |||||||||||||
| Major Phase : | Gas | Abandonment Date : | 05/04/2011 | |||||||||||||||||||
| Perfs : | 0 - 0 | Working Int : | 0.25500000 | Present Worth Profile ($) | ||||||||||||||||||
| Initial Rate : | 3,384.00 | Mcf/month | Revenue Int : | 0.19125000 | PW | 5.00% : | 58,894.83 | |||||||||||||||
| Abandonment : | 2,491.22 | Mcf/month | Disc. Initial Invest. ($) : | 0.00 | PW | 8.00% : | 57,075.19 | |||||||||||||||
| Initial Decline : | 14.10 | % year | b = 0.600 | ROInvestment (disc/undisc) : | 0.00 / 0.00 | PW | 10.00% : | 55,932.52 | ||||||||||||||
| Beg Ratio : | 0.000 | Years to Payout : | 0.00 | PW | 12.00% : | 54,841.88 | ||||||||||||||||
| End Ratio : | 0.000 | Internal ROR (%) : | 0.00 | PW | 15.00% : | 53,296.16 | ||||||||||||||||
| PW | 20.00% : | 50,936.17 | ||||||||||||||||||||
| TRC Eco Detailed.rpt | 1 | |||||||||||||||||||||
| Date :12/31/2008 2:59:23PM | ECONOMIC PROJECTION | |||||||||||||||||||||||
| As Of Date : | 10/31/2008 | Case : | PP F-12-1 | |||||||||||||||||||||
| Project Name : | 2008 SEC Report | Reserve Cat. : | Proved Producing | |||||||||||||||||||||
| Discount Rate (%) : | 10.00 | |||||||||||||||||||||||
| Partner : | Lexaria Corp | Field : | Belmont | |||||||||||||||||||||
| Custom Selection | ||||||||||||||||||||||||
| Case Type : | LEASE CASE | Operator : | Griffin & Griffin Expl, LLC | |||||||||||||||||||||
| Archive Set : | default | Reservoir : | 2,800 Ft. Sand | |||||||||||||||||||||
| Co., State : | Wilkinson, MS | |||||||||||||||||||||||
| Cum Oil (Mbbl) : | 11.14 | |||||||||||||||||||||||
| Cum Gas (MMcf) : | 0.00 | |||||||||||||||||||||||
| Gross | Gross | Net | Net | Oil | Gas | Oil | Gas | Misc. | ||||||||||||||||
| Year | Oil | Gas | Oil | Gas | Price | Price | Revenue | Revenue | Revenue | |||||||||||||||
| (Mbbl) | (MMcf) | (Mbbl) | (MMcf) | ($/bbl) | ($/Mcf) | ($) | ($) | ($) | ||||||||||||||||
| 2008 | 5.41 | 0.00 | 1.04 | 0.00 | 64.00 | 0.00 | 66,278.69 | 0.00 | 0.00 | |||||||||||||||
| 2009 | 27.99 | 0.00 | 5.35 | 0.00 | 64.00 | 0.00 | 342,585.37 | 0.00 | 0.00 | |||||||||||||||
| 2010 | 23.79 | 0.00 | 4.55 | 0.00 | 64.00 | 0.00 | 291,229.96 | 0.00 | 0.00 | |||||||||||||||
| 2011 | 20.23 | 0.00 | 3.87 | 0.00 | 64.00 | 0.00 | 247,573.01 | 0.00 | 0.00 | |||||||||||||||
| 2012 | 16.58 | 0.00 | 3.17 | 0.00 | 64.00 | 0.00 | 202,892.97 | 0.00 | 0.00 | |||||||||||||||
| Rem | 0.00 | 0.00 | 0.00 | 0.00 | 0.00 | 0.00 | 0.00 | 0.00 | 0.00 | |||||||||||||||||
| Total | 94.00 | 0.00 | 17.98 | 0.00 | 64.00 | 0.00 | 1,150,560.00 | 0.00 | 0.00 | |||||||||||||||||
| Ult | 105.14 | 0.00 | ||||||||||||||||||||||||
| Well | Net Tax | Net Tax | Net | Net | Net | Other | Net | Annual | Cum Disc. | |||||||||||||||||
| Year | Count | Production | AdValorem | Investment | Lease Costs | Well Costs | Costs | Profits | Cash Flow | Cash Flow | ||||||||||||||||
| ($) | ($) | ($) | ($) | ($) | ($) | ($) | ($) | ($) | ||||||||||||||||||
| 2008 | 1.00 | 3,031.61 | 999.09 | 0.00 | 0.00 | 2,522.73 | 0.00 | 0.00 | 59,725.26 | 59,261.34 | ||||||||||||||||
| 2009 | 1.00 | 20,790.65 | 6,851.71 | 0.00 | 0.00 | 19,743.12 | 0.00 | 0.00 | 295,199.90 | 336,672.25 | ||||||||||||||||
| 2010 | 1.00 | 17,674.02 | 5,824.60 | 0.00 | 0.00 | 19,743.12 | 0.00 | 0.00 | 247,988.22 | 548,547.37 | ||||||||||||||||
| 2011 | 1.00 | 15,024.59 | 4,951.46 | 0.00 | 0.00 | 19,743.12 | 0.00 | 0.00 | 207,853.84 | 710,001.71 | ||||||||||||||||
| 2012 | 0.00 | 12,313.07 | 4,057.86 | 1,530.00 | 0.00 | 18,882.87 | 0.00 | 0.00 | 166,109.17 | 827,560.80 | ||||||||||||||||
| Rem. | 0.00 | 0.00 | 0.00 | 0.00 | 0.00 | 0.00 | 0.00 | 0.00 | 0.00 | |||||||||||||||
| Total | 68,833.93 | 22,684.72 | 1,530.00 | 0.00 | 80,634.96 | 0.00 | 0.00 | 976,876.39 | 827,560.80 | |||||||||||||||
| Major Phase : | Oil | Abandonment Date : | 12/15/2012 | |||||||||||||||||||||
| Perfs : | 0 - 0 | Working Int : | 0.25500000 | Present Worth Profile ($) | ||||||||||||||||||||
| Initial Rate : | 2,790.00 | bbl/month | Revenue Int : | 0.19125000 | PW | 5.00% : | 895,965.81 | |||||||||||||||||
| Abandonment : | 1,328.94 | bbl/month | Disc. Initial Invest. ($) : | 1,032.54 | PW | 8.00% : | 853,598.05 | |||||||||||||||||
| Initial Decline : | 15.00 | % year | b = 0.000 | ROInvestment (disc/undisc) : | 802.69 / 639.48 | PW | 10.00% : | 827,560.80 | ||||||||||||||||
| Beg Ratio : | 0.000 | Years to Payout : | 0.01 | PW | 12.00% : | 803,116.78 | ||||||||||||||||||
| End Ratio : | 0.000 | Internal ROR (%) : | 1,000.00 | PW | 15.00% : | 769,154.69 | ||||||||||||||||||
| PW | 20.00% : | 718,837.94 | ||||||||||||||||||||||
| TRC Eco Detailed.rpt | 2 | |||||||||||||||||||||||
| Date :12/31/2008 2:59:23PM | ECONOMIC PROJECTION | |||||||||||||||||||||||
| As Of Date : | 10/31/2008 | Case : | PP F-6B - No. 1 | |||||||||||||||||||||
| Project Name : | 2008 SEC Report | Reserve Cat. : | Proved Producing | |||||||||||||||||||||
| Discount Rate (%) : | 10.00 | |||||||||||||||||||||||
| Partner : | Lexaria Corp | Field : | School Section | |||||||||||||||||||||
| Custom Selection | ||||||||||||||||||||||||
| Case Type : | LEASE CASE | Operator : | Griffin & Griffin Expl, LLC | |||||||||||||||||||||
| Archive Set : | default | Reservoir : | Frio Sand (1,940 Ft. Sand) | |||||||||||||||||||||
| Co., State : | Adams, MS | |||||||||||||||||||||||
| Cum Oil (Mbbl) : | 0.00 | |||||||||||||||||||||||
| Cum Gas (MMcf) : | 35.28 | |||||||||||||||||||||||
| Gross | Gross | Net | Net | Oil | Gas | Oil | Gas | Misc. | ||||||||||||||||
| Year | Oil | Gas | Oil | Gas | Price | Price | Revenue | Revenue | Revenue | |||||||||||||||
| (Mbbl) | (MMcf) | (Mbbl) | (MMcf) | ($/bbl) | ($/Mcf) | ($) | ($) | ($) | ||||||||||||||||
| 2008 | 0.00 | 4.52 | 0.00 | 0.86 | 0.00 | 6.17 | 0.00 | 5,328.98 | 0.00 | |||||||||||||||
| 2009 | 0.00 | 24.57 | 0.00 | 4.70 | 0.00 | 6.17 | 0.00 | 28,996.93 | 0.00 | |||||||||||||||
| 2010 | 0.00 | 10.49 | 0.00 | 2.01 | 0.00 | 6.17 | 0.00 | 12,380.53 | 0.00 | |||||||||||||||
| 2011 | 0.00 | 0.00 | 0.00 | 0.00 | 0.00 | 0.00 | 0.00 | 0.00 | 0.00 | |||||||||||||||
| 2012 | 0.00 | 0.00 | 0.00 | 0.00 | 0.00 | 0.00 | 0.00 | 0.00 | 0.00 | |||||||||||||||
| 2013 | 0.00 | 0.00 | 0.00 | 0.00 | 0.00 | 0.00 | 0.00 | 0.00 | 0.00 | |||||||||||||||
| 2014 | 0.00 | 0.00 | 0.00 | 0.00 | 0.00 | 0.00 | 0.00 | 0.00 | 0.00 | |||||||||||||||
| 2015 | 0.00 | 0.00 | 0.00 | 0.00 | 0.00 | 0.00 | 0.00 | 0.00 | 0.00 | |||||||||||||||
| 2016 | 0.00 | 0.00 | 0.00 | 0.00 | 0.00 | 0.00 | 0.00 | 0.00 | 0.00 | |||||||||||||||
| 2017 | 0.00 | 0.00 | 0.00 | 0.00 | 0.00 | 0.00 | 0.00 | 0.00 | 0.00 | |||||||||||||||
| 2018 | 0.00 | 0.00 | 0.00 | 0.00 | 0.00 | 0.00 | 0.00 | 0.00 | 0.00 | |||||||||||||||
| 2019 | 0.00 | 0.00 | 0.00 | 0.00 | 0.00 | 0.00 | 0.00 | 0.00 | 0.00 | |||||||||||||||
| 2020 | 0.00 | 0.00 | 0.00 | 0.00 | 0.00 | 0.00 | 0.00 | 0.00 | 0.00 | |||||||||||||||
| 2021 | 0.00 | 0.00 | 0.00 | 0.00 | 0.00 | 0.00 | 0.00 | 0.00 | 0.00 | |||||||||||||||
| 2022 | 0.00 | 0.00 | 0.00 | 0.00 | 0.00 | 0.00 | 0.00 | 0.00 | 0.00 | |||||||||||||||
| Rem | 0.00 | 0.00 | 0.00 | 0.00 | 0.00 | 0.00 | 0.00 | 0.00 | 0.00 | |||||||||||||||
| Total | 0.00 | 39.58 | 0.00 | 7.57 | 0.00 | 6.17 | 0.00 | 46,706.45 | 0.00 | |||||||||||||||
| Ult | 0.00 | 74.86 | ||||||||||||||||||||||
| Well | Net Tax | Net Tax | Net | Net | Net | Other | Net | Annual | Cum Disc. | |||||||||||||||||
| Year | Count | Production | AdValorem | Investment | Lease Costs | Well Costs | Costs | Profits | Cash Flow | Cash Flow | ||||||||||||||||
| ($) | ($) | ($) | ($) | ($) | ($) | ($) | ($) | ($) | ||||||||||||||||||
| 2008 | 1.00 | 324.06 | 106.58 | 0.00 | 0.00 | 3,973.24 | 0.00 | 0.00 | 925.11 | 917.35 | ||||||||||||||||
| 2009 | 1.00 | 1,763.31 | 579.94 | 0.00 | 0.00 | 23,461.02 | 0.00 | 0.00 | 3,192.66 | 3,936.18 | ||||||||||||||||
| 2010 | 1.00 | 752.86 | 247.61 | 0.00 | 0.00 | 10,939.64 | 0.00 | 0.00 | 440.42 | 4,323.85 | ||||||||||||||||
| 2011 | 0.00 | 0.00 | 0.00 | 0.00 | 0.00 | 0.00 | 0.00 | 0.00 | 0.00 | 4,323.85 | ||||||||||||||||
| 2012 | 0.00 | 0.00 | 0.00 | 0.00 | 0.00 | 0.00 | 0.00 | 0.00 | 0.00 | 4,323.85 | ||||||||||||||||
| 2013 | 0.00 | 0.00 | 0.00 | 0.00 | 0.00 | 0.00 | 0.00 | 0.00 | 0.00 | 4,323.85 | ||||||||||||||||
| 2014 | 0.00 | 0.00 | 0.00 | 0.00 | 0.00 | 0.00 | 0.00 | 0.00 | 0.00 | 4,323.85 | ||||||||||||||||
| 2015 | 0.00 | 0.00 | 0.00 | 0.00 | 0.00 | 0.00 | 0.00 | 0.00 | 0.00 | 4,323.85 | ||||||||||||||||
| 2016 | 0.00 | 0.00 | 0.00 | 0.00 | 0.00 | 0.00 | 0.00 | 0.00 | 0.00 | 4,323.85 | ||||||||||||||||
| 2017 | 0.00 | 0.00 | 0.00 | 0.00 | 0.00 | 0.00 | 0.00 | 0.00 | 0.00 | 4,323.85 | ||||||||||||||||
| 2018 | 0.00 | 0.00 | 0.00 | 0.00 | 0.00 | 0.00 | 0.00 | 0.00 | 0.00 | 4,323.85 | ||||||||||||||||
| 2019 | 0.00 | 0.00 | 0.00 | 0.00 | 0.00 | 0.00 | 0.00 | 0.00 | 0.00 | 4,323.85 | ||||||||||||||||
| 2020 | 0.00 | 0.00 | 0.00 | 0.00 | 0.00 | 0.00 | 0.00 | 0.00 | 0.00 | 4,323.85 | ||||||||||||||||
| 2021 | 0.00 | 0.00 | 0.00 | 0.00 | 0.00 | 0.00 | 0.00 | 0.00 | 0.00 | 4,323.85 | ||||||||||||||||
| 2022 | 0.00 | 0.00 | 0.00 | 0.00 | 0.00 | 0.00 | 0.00 | 0.00 | 0.00 | 4,323.85 | ||||||||||||||||
| Rem. | 0.00 | 0.00 | 1,020.00 | 0.00 | 0.00 | 0.00 | 0.00 | -1,020.00 | -245.76 | |||||||||||||||||
| Total | 2,840.24 | 934.13 | 1,020.00 | 0.00 | 38,373.90 | 0.00 | 0.00 | 3,538.18 | 4,078.09 | |||||||||||||||||
| Major Phase : | Gas | Abandonment Date : | 06/21/2010 | |||||||||||||||||
| Perfs : | 0 - 0 | Working Int : | 0.25500000 | Present Worth Profile ($) | ||||||||||||||||
| Initial Rate : | 1,839.00 | Mcf/month | Revenue Int : | 0.19125000 | PW | 5.00% : | 3,943.62 | |||||||||||||
| Abandonment : | 1,801.86 | Mcf/month | Disc. Initial Invest. ($) : | 245.76 | PW | 8.00% : | 4,044.29 | |||||||||||||
| Initial Decline : | 13.84 | % year | b = 0.800 | ROInvestment (disc/undisc) : | 17.60 / 4.47 | PW | 10.00% : | 4,078.09 | ||||||||||||
| Beg Ratio : | 0.000 | Years to Payout : | 0.19 | PW | 12.00% : | 4,093.82 | ||||||||||||||
| End Ratio : | 0.000 | Internal ROR (%) : | 1,000.00 | PW | 15.00% : | 4,094.22 | ||||||||||||||
| PW | 20.00% : | 4,058.52 | ||||||||||||||||||
| TRC Eco Detailed.rpt | 3 | |||||||||||||||||||
| Date :12/31/2008 2:59:23PM | ECONOMIC PROJECTION | |||||||||||||||||||||||
| As Of Date : | 10/31/2008 | Case : | PP F-12-3 | |||||||||||||||||||||
| Project Name : | 2008 SEC Report | Reserve Cat. : | Proved Producing | |||||||||||||||||||||
| Discount Rate (%) : | 10.00 | |||||||||||||||||||||||
| Partner : | Lexaria Corp | Field : | Belmont | |||||||||||||||||||||
| Custom Selection | ||||||||||||||||||||||||
| Case Type : | LEASE CASE | Operator : | Griffin & Griffin Expl, LLC | |||||||||||||||||||||
| Archive Set : | default | Reservoir : | 2,800 Ft. Sand | |||||||||||||||||||||
| Co., State : | Wilkinson, MS | |||||||||||||||||||||||
| Cum Oil (Mbbl) : | 13.99 | |||||||||||||||||||||||
| Cum Gas (MMcf) : | 0.00 | |||||||||||||||||||||||
| Gross | Gross | Net | Net | Oil | Gas | Oil | Gas | Misc. | ||||||||||||||||
| Year | Oil | Gas | Oil | Gas | Price | Price | Revenue | Revenue | Revenue | |||||||||||||||
| (Mbbl) | (MMcf) | (Mbbl) | (MMcf) | ($/bbl) | ($/Mcf) | ($) | ($) | ($) | ||||||||||||||||
| 2008 | 3.42 | 0.00 | 0.65 | 0.00 | 64.00 | 0.00 | 41,807.74 | 0.00 | 0.00 | |||||||||||||||
| 2009 | 20.63 | 0.00 | 3.95 | 0.00 | 64.00 | 0.00 | 252,480.74 | 0.00 | 0.00 | |||||||||||||||
| 2010 | 18.56 | 0.00 | 3.55 | 0.00 | 64.00 | 0.00 | 227,226.25 | 0.00 | 0.00 | |||||||||||||||
| 2011 | 16.71 | 0.00 | 3.20 | 0.00 | 64.00 | 0.00 | 204,497.85 | 0.00 | 0.00 | |||||||||||||||
| 2012 | 15.08 | 0.00 | 2.88 | 0.00 | 64.00 | 0.00 | 184,520.92 | 0.00 | 0.00 | |||||||||||||||
| 2013 | 13.53 | 0.00 | 2.59 | 0.00 | 64.00 | 0.00 | 165,586.08 | 0.00 | 0.00 | |||||||||||||||
| 2014 | 4.98 | 0.00 | 0.95 | 0.00 | 64.00 | 0.00 | 60,964.17 | 0.00 | 0.00 | |||||||||||||||
| Rem | 0.00 | 0.00 | 0.00 | 0.00 | 0.00 | 0.00 | 0.00 | 0.00�� | 0.00 | |||||||||||||||||
| Total | 92.90 | 0.00 | 17.77 | 0.00 | 64.00 | 0.00 | 1,137,083.76 | 0.00 | 0.00 | |||||||||||||||||
| Ult | 106.89 | 0.00 | ||||||||||||||||||||||||
| Well | Net Tax | Net Tax | Net | Net | Net | Other | Net | Annual | Cum Disc. | |||||||||||||||||
| Year | Count | Production | AdValorem | Investment | Lease Costs | Well Costs | Costs | Profits | Cash Flow | Cash Flow | ||||||||||||||||
| ($) | ($) | ($) | ($) | ($) | ($) | ($) | ($) | ($) | ||||||||||||||||||
| 2008 | 1.00 | 2,537.21 | 836.15 | 0.00 | 0.00 | 5,451.22 | 0.00 | 0.00 | 32,983.16 | 32,703.56 | ||||||||||||||||
| 2009 | 1.00 | 15,322.43 | 5,049.61 | 0.00 | 0.00 | 32,188.14 | 0.00 | 0.00 | 199,920.56 | 220,497.82 | ||||||||||||||||
| 2010 | 1.00 | 13,789.79 | 4,544.53 | 0.00 | 0.00 | 32,188.14 | 0.00 | 0.00 | 176,703.79 | 371,405.75 | ||||||||||||||||
| 2011 | 1.00 | 12,410.46 | 4,089.96 | 0.00 | 0.00 | 32,188.14 | 0.00 | 0.00 | 155,809.29 | 492,382.46 | ||||||||||||||||
| 2012 | 1.00 | 11,198.11 | 3,690.42 | 0.00 | 0.00 | 32,188.14 | 0.00 | 0.00 | 137,444.25 | 589,395.50 | ||||||||||||||||
| 2013 | 1.00 | 10,049.01 | 3,311.72 | 0.00 | 0.00 | 32,188.14 | 0.00 | 0.00 | 120,037.22 | 666,414.68 | ||||||||||||||||
| 2014 | 0.00 | 3,699.76 | 1,219.28 | 1,530.00 | 0.00 | 12,526.29 | 0.00 | 0.00 | 41,988.83 | 691,610.77 | ||||||||||||||||
| Rem. | 0.00 | 0.00 | 0.00 | 0.00 | 0.00 | 0.00 | 0.00 | 0.00 | 0.00 | |||||||||||||||
| Total | 69,006.77 | 22,741.68 | 1,530.00 | 0.00 | 178,918.21 | 0.00 | 0.00 | 864,887.10 | 691,610.77 | |||||||||||||||
| Major Phase : | Oil | Abandonment Date : | 05/24/2014 | |||||||||||||||||||||
| Perfs : | 0 - 0 | Working Int : | 0.25500000 | Present Worth Profile ($) | ||||||||||||||||||||
| Initial Rate : | 2,837.00 | bbl/month | Revenue Int : | 0.19125000 | PW | 5.00% : | 769,230.17 | |||||||||||||||||
| Abandonment : | 1,025.95 | bbl/month | Disc. Initial Invest. ($) : | 900.35 | PW | 8.00% : | 720,797.81 | |||||||||||||||||
| Initial Decline : | 10.01 | % year | b = 0.000 | ROInvestment (disc/undisc) : | 769.36 / 566.29 | PW | 10.00% : | 691,610.77 | ||||||||||||||||
| Beg Ratio : | 0.000 | Years to Payout : | 0.01 | PW | 12.00% : | 664,614.91 | ||||||||||||||||||
| End Ratio : | 0.000 | Internal ROR (%) : | 1,000.00 | PW | 15.00% : | 627,766.45 | ||||||||||||||||||
| PW | 20.00% : | 574,603.68 | ||||||||||||||||||||||
| TRC Eco Detailed.rpt | 4 | |||||||||||||||||||||||
| Date :12/31/2008 | 2:59:23PM | ECONOMIC SUMMARY PROJECTION | ||||||||||||||||||||||||||
| Proved Rsv Class | ||||||||||||||||||||||||||||
| Project Name : | 2008 SEC Report | As Of Date : | 10/31/2008 | Producing Rsv Category | ||||||||||||||||||||||||
| Partner : | Lexaria Corp | Discount Rate (%) : | 10.00 | |||||||||||||||||||||||||
| Case Type : | REPORT BREAK TOTAL CASE | Custom Selection | ||||||||||||||||||||||||||
| Cum Oil (Mbbl) : | 25.14 | |||||||||||||||||||||||||||
| Cum Gas (MMcf) : | 133.14 | |||||||||||||||||||||||||||
| Gross | Gross | Net | Net | Oil | Gas | Oil | Gas | Misc. | ||||||||||||||||||||
| Year | Oil | Gas | Oil | Gas | Price | Price | Revenue | Revenue | Revenue | |||||||||||||||||||
| (Mbbl) | (MMcf) | (Mbbl) | (MMcf) | ($/bbl) | ($/Mcf) | ($) | ($) | ($) | ||||||||||||||||||||
| 2008 | 8.83 | 11.57 | 1.69 | 2.21 | 64.00 | 6.17 | 108,086.43 | 13,655.34 | 0.00 | |||||||||||||||||||
| 2009 | 48.62 | 62.78 | 9.30 | 12.01 | 64.00 | 6.17 | 595,066.12 | 74,078.29 | 0.00 | |||||||||||||||||||
| 2010 | 42.36 | 43.79 | 8.10 | 8.37 | 64.00 | 6.17 | 518,456.21 | 51,668.16 | 0.00 | |||||||||||||||||||
| 2011 | 36.93 | 10.38 | 7.06 | 1.98 | 64.00 | 6.17 | 452,070.85 | 12,245.52 | 0.00 | |||||||||||||||||||
| 2012 | 31.65 | 0.00 | 6.05 | 0.00 | 64.00 | 0.00 | 387,413.89 | 0.00 | 0.00 | |||||||||||||||||||
| 2013 | 13.53 | 0.00 | 2.59 | 0.00 | 64.00 | 0.00 | 165,586.08 | 0.00 | 0.00 | |||||||||||||||||||
| 2014 | 4.98 | 0.00 | 0.95 | 0.00 | 64.00 | 0.00 | 60,964.17 | 0.00 | 0.00 | |||||||||||||||||||
| 2015 | 0.00 | 0.00 | 0.00 | 0.00 | 0.00 | 0.00 | 0.00 | 0.00 | 0.00 | |||||||||||||||||||
| 2016 | 0.00 | 0.00 | 0.00 | 0.00 | 0.00 | 0.00 | 0.00 | 0.00 | 0.00 | |||||||||||||||||||
| 2017 | 0.00 | 0.00 | 0.00 | 0.00 | 0.00 | 0.00 | 0.00 | 0.00 | 0.00 | |||||||||||||||||||
| 2018 | 0.00 | 0.00 | 0.00 | 0.00 | 0.00 | 0.00 | 0.00 | 0.00 | 0.00 | |||||||||||||||||||
| 2019 | 0.00 | 0.00 | 0.00 | 0.00 | 0.00 | 0.00 | 0.00 | 0.00 | 0.00 | |||||||||||||||||||
| 2020 | 0.00 | 0.00 | 0.00 | 0.00 | 0.00 | 0.00 | 0.00 | 0.00 | 0.00 | |||||||||||||||||||
| 2021 | 0.00 | 0.00 | 0.00 | 0.00 | 0.00 | 0.00 | 0.00 | 0.00 | 0.00 | |||||||||||||||||||
| 2022 | 0.00 | 0.00 | 0.00 | 0.00 | 0.00 | 0.00 | 0.00 | 0.00 | 0.00 | |||||||||||||||||||
| Rem | 0.00 | 0.00 | 0.00 | 0.00 | 0.00 | 0.00 | 0.00 | 0.00 | 0.00 | |||||||||||||||||||
| Total | 186.90 | 128.51 | 35.74 | 24.58 | 64.00 | 6.17 | 2,287,643.76 | 151,647.32 | 0.00 | |||||||||||||||||||
| Ult | 212.04 | 261.65 | ||||||||||||||||||||||||||
| Well | Net Tax | Net Tax | Net | Net | Net | Other | Net | Annual | Cum Disc. | |||||||||||||||||||
| Year | Count | Production | AdValorem | Investment | Lease Costs | Well Costs | Costs | Profits | Cash Flow | Cash Flow | ||||||||||||||||||
| ($) | ($) | ($) | ($) | ($) | ($) | ($) | ($) | ($) | ||||||||||||||||||||
| 2008 | 4.00 | 6,399.21 | 2,108.35 | 0.00 | 0.00 | 14,262.10 | 0.00 | 0.00 | 98,972.12 | 98,177.53 | ||||||||||||||||||
| 2009 | 4.00 | 40,617.80 | 13,382.89 | 0.00 | 0.00 | 89,061.30 | 0.00 | 0.00 | 526,082.42 | 592,503.44 | ||||||||||||||||||
| 2010 | 4.00 | 34,605.77 | 11,402.49 | 0.00 | 0.00 | 76,539.92 | 0.00 | 0.00 | 447,576.19 | 974,853.03 | ||||||||||||||||||
| 2011 | 2.00 | 28,179.70 | 9,286.33 | 0.00 | 0.00 | 56,494.13 | 0.00 | 0.00 | 370,356.22 | 1,262,640.55 | ||||||||||||||||||
| 2012 | 1.00 | 23,511.18 | 7,748.28 | 1,530.00 | 0.00 | 51,071.01 | 0.00 | 0.00 | 303,553.42 | 1,477,212.67 | ||||||||||||||||||
| 2013 | 1.00 | 10,049.01 | 3,311.72 | 0.00 | 0.00 | 32,188.14 | 0.00 | 0.00 | 120,037.22 | 1,554,231.85 | ||||||||||||||||||
| 2014 | 0.00 | 3,699.76 | 1,219.28 | 1,530.00 | 0.00 | 12,526.29 | 0.00 | 0.00 | 41,988.83 | 1,579,427.94 | ||||||||||||||||||
| 2015 | 0.00 | 0.00 | 0.00 | 0.00 | 0.00 | 0.00 | 0.00 | 0.00 | 0.00 | 1,579,427.94 | ||||||||||||||||||
| 2016 | 0.00 | 0.00 | 0.00 | 0.00 | 0.00 | 0.00 | 0.00 | 0.00 | 0.00 | 1,579,427.94 | ||||||||||||||||||
| 2017 | 0.00 | 0.00 | 0.00 | 0.00 | 0.00 | 0.00 | 0.00 | 0.00 | 0.00 | 1,579,427.94 | ||||||||||||||||||
| 2018 | 0.00 | 0.00 | 0.00 | 0.00 | 0.00 | 0.00 | 0.00 | 0.00 | 0.00 | 1,579,427.94 | ||||||||||||||||||
| 2019 | 0.00 | 0.00 | 0.00 | 0.00 | 0.00 | 0.00 | 0.00 | 0.00 | 0.00 | 1,579,427.94 | ||||||||||||||||||
| 2020 | 0.00 | 0.00 | 0.00 | 0.00 | 0.00 | 0.00 | 0.00 | 0.00 | 0.00 | 1,579,427.94 | ||||||||||||||||||
| 2021 | 0.00 | 0.00 | 0.00 | 0.00 | 0.00 | 0.00 | 0.00 | 0.00 | 0.00 | 1,579,427.94 | ||||||||||||||||||
| 2022 | 0.00 | 0.00 | 0.00 | 0.00 | 0.00 | 0.00 | 0.00 | 0.00 | 0.00 | 1,579,427.94 | ||||||||||||||||||
| Rem. | 0.00 | 0.00 | 1,020.00 | 0.00 | 0.00 | 0.00 | 0.00 | -1,020.00 | -245.76 | |||||||||||||||||||
| Total | 147,062.44 | 48,459.34 | 4,080.00 | 0.00 | 332,142.89 | 0.00 | 0.00 | 1,907,546.41 | 1,579,182.18 | |||||||||||||||||||
| Present Worth Profile ($) | ||||||||||||||||||||||||||||
| PW | 5.00% : | 1,728,034.43 | ||||||||||||||||||||||||||
| Disc. Initial Invest. ($) : | 2,178.65 | PW | 8.00% : | 1,635,515.35 | ||||||||||||||||||||||||
| ROInvestment (disc/undisc) : | 725.84 / 468.54 | PW | 10.00% : | 1,579,182.18 | ||||||||||||||||||||||||
| Years to Payout : | 0.02 | PW | 12.00% : | 1,526,667.39 | ||||||||||||||||||||||||
| Internal ROR (%) : | 1,000.00 | PW | 15.00% : | 1,454,311.52 | ||||||||||||||||||||||||
| PW | 20.00% : | 1,348,436.31 | ||||||||||||||||||||||||||
| TRC Eco Detailed.rpt | 5 | |||||||||||||||||||||||||||
| Date :12/31/2008 2:59:23PM | ECONOMIC PROJECTION | |||||||||||||||||||||||
| As Of Date : | 10/31/2008 | Case : | PP F-42 - No. 1 | |||||||||||||||||||||
| Project Name : | 2008 SEC Report | Reserve Cat. : | Proved Non-Producing | |||||||||||||||||||||
| Discount Rate (%) : | 10.00 | |||||||||||||||||||||||
| Partner : | Lexaria Corp | Field : | Stamps | |||||||||||||||||||||
| Custom Selection | ||||||||||||||||||||||||
| Case Type : | LEASE CASE | Operator : | Griffin & Griffin Expl, LLC | |||||||||||||||||||||
| Archive Set : | default | Reservoir : | Frio Gas Pool (2,800' Sand) | |||||||||||||||||||||
| Co., State : | Wilkinson, MS | |||||||||||||||||||||||
| Cum Oil (Mbbl) : | 0.00 | |||||||||||||||||||||||
| Cum Gas (MMcf) : | 30.44 | |||||||||||||||||||||||
| Gross | Gross | Net | Net | Oil | Gas | Oil | Gas | Misc. | ||||||||||||||||
| Year | Oil | Gas | Oil | Gas | Price | Price | Revenue | Revenue | Revenue | |||||||||||||||
| (Mbbl) | (MMcf) | (Mbbl) | (MMcf) | ($/bbl) | ($/Mcf) | ($) | ($) | ($) | ||||||||||||||||
| 2008 | 0.00 | 0.00 | 0.00 | 0.00 | 0.00 | 0.00 | 0.00 | 0.00 | 0.00 | |||||||||||||||
| 2009 | 0.00 | 21.13 | 0.00 | 4.04 | 0.00 | 6.17 | 0.00 | 24,935.64 | 0.00 | |||||||||||||||
| 2010 | 0.00 | 18.29 | 0.00 | 3.50 | 0.00 | 6.17 | 0.00 | 21,580.59 | 0.00 | |||||||||||||||
| 2011 | 0.00 | 15.88 | 0.00 | 3.04 | 0.00 | 6.17 | 0.00 | 18,734.94 | 0.00 | |||||||||||||||
| 2012 | 0.00 | 14.02 | 0.00 | 2.68 | 0.00 | 6.17 | 0.00 | 16,543.16 | 0.00 | |||||||||||||||
| 2013 | 0.00 | 12.46 | 0.00 | 2.38 | 0.00 | 6.17 | 0.00 | 14,699.89 | 0.00 | |||||||||||||||
| 2014 | 0.00 | 11.21 | 0.00 | 2.14 | 0.00 | 6.17 | 0.00 | 13,228.30 | 0.00 | |||||||||||||||
| 2015 | 0.00 | 10.17 | 0.00 | 1.95 | 0.00 | 6.17 | 0.00 | 12,002.31 | 0.00 | |||||||||||||||
| 2016 | 0.00 | 9.32 | 0.00 | 1.78 | 0.00 | 6.17 | 0.00 | 10,995.55 | 0.00 | |||||||||||||||
| 2017 | 0.00 | 8.54 | 0.00 | 1.63 | 0.00 | 6.17 | 0.00 | 10,079.48 | 0.00 | |||||||||||||||
| 2018 | 0.00 | 7.89 | 0.00 | 1.51 | 0.00 | 6.17 | 0.00 | 9,315.51 | 0.00 | |||||||||||||||
| 2019 | 0.00 | 7.33 | 0.00 | 1.40 | 0.00 | 6.17 | 0.00 | 8,649.84 | 0.00 | |||||||||||||||
| 2020 | 0.00 | 2.24 | 0.00 | 0.43 | 0.00 | 6.17 | 0.00 | 2,645.27 | 0.00 | |||||||||||||||
| Rem | 0.00 | 0.00 | 0.00 | 0.00 | 0.00 | 0.00 | 0.00 | 0.00 | 0.00 | |||||||||||||||
| Total | 0.00 | 138.48 | 0.00 | 26.48 | 0.00 | 6.17 | 0.00 | 163,410.49 | 0.00 | |||||||||||||||
| Ult | 0.00 | 168.92 | ||||||||||||||||||||||
| Well | Net Tax | Net Tax | Net | Net | Net | Other | Net | Annual | Cum Disc. | |||||||||||||||||
| Year | Count | Production | AdValorem | Investment | Lease Costs | Well Costs | Costs | Profits | Cash Flow | Cash Flow | ||||||||||||||||
| ($) | ($) | ($) | ($) | ($) | ($) | ($) | ($) | ($) | ||||||||||||||||||
| 2008 | 1.00 | 0.00 | 0.00 | 382.50 | 0.00 | 0.00 | 0.00 | 0.00 | -382.50 | -378.53 | ||||||||||||||||
| 2009 | 1.00 | 1,516.35 | 498.71 | 0.00 | 0.00 | 4,178.12 | 0.00 | 0.00 | 18,742.46 | 17,226.37 | ||||||||||||||||
| 2010 | 1.00 | 1,312.32 | 431.61 | 0.00 | 0.00 | 4,235.04 | 0.00 | 0.00 | 15,601.62 | 30,557.04 | ||||||||||||||||
| 2011 | 1.00 | 1,139.28 | 374.70 | 0.00 | 0.00 | 4,235.04 | 0.00 | 0.00 | 12,985.92 | 40,643.55 | ||||||||||||||||
| 2012 | 1.00 | 1,006.00 | 330.86 | 0.00 | 0.00 | 4,235.04 | 0.00 | 0.00 | 10,971.26 | 48,389.60 | ||||||||||||||||
| 2013 | 1.00 | 893.91 | 294.00 | 0.00 | 0.00 | 4,235.04 | 0.00 | 0.00 | 9,276.95 | 54,342.96 | ||||||||||||||||
| 2014 | 1.00 | 804.42 | 264.57 | 0.00 | 0.00 | 4,235.04 | 0.00 | 0.00 | 7,924.28 | 58,966.00 | ||||||||||||||||
| 2015 | 1.00 | 729.86 | 240.05 | 0.00 | 0.00 | 4,235.04 | 0.00 | 0.00 | 6,797.36 | 62,571.16 | ||||||||||||||||
| 2016 | 1.00 | 668.64 | 219.91 | 0.00 | 0.00 | 4,235.04 | 0.00 | 0.00 | 5,871.95 | 65,402.29 | ||||||||||||||||
| 2017 | 1.00 | 612.94 | 201.59 | 0.00 | 0.00 | 4,235.04 | 0.00 | 0.00 | 5,029.91 | 67,606.62 | ||||||||||||||||
| 2018 | 1.00 | 566.48 | 186.31 | 0.00 | 0.00 | 4,235.04 | 0.00 | 0.00 | 4,327.68 | 69,330.86 | ||||||||||||||||
| 2019 | 1.00 | 526.00 | 173.00 | 0.00 | 0.00 | 4,235.04 | 0.00 | 0.00 | 3,715.81 | 70,676.81 | ||||||||||||||||
| 2020 | 0.00 | 160.86 | 52.91 | 1,555.50 | 0.00 | 1,331.97 | 0.00 | 0.00 | -455.96 | 70,529.77 | ||||||||||||||||
| Rem. | 0.00 | 0.00 | 0.00 | 0.00 | 0.00 | 0.00 | 0.00 | 0.00 | 0.00 | |||||||||||||
| Total | 9,937.05 | 3,268.21 | 1,938.00 | 0.00 | 47,860.48 | 0.00 | 0.00 | 100,406.75 | 70,529.77 | |||||||||||||
| Major Phase : | Gas | Abandonment Date : | 04/25/2020 | |||||||||||||||||||
| Perfs : | 0 - 0 | Working Int : | 0.25500000 | Present Worth Profile ($) | ||||||||||||||||||
| Initial Rate : | 1,943.96 | Mcf/month | Revenue Int : | 0.19125000 | PW | 5.00% : | 83,062.95 | |||||||||||||||
| Abandonment : | 576.79 | Mcf/month | Disc. Initial Invest. ($) : | 899.08 | PW | 8.00% : | 75,087.31 | |||||||||||||||
| Initial Decline : | 16.61 | % year | b = 0.800 | ROInvestment (disc/undisc) : | 79.47 / 52.81 | PW | 10.00% : | 70,529.77 | ||||||||||||||
| Beg Ratio : | 0.000 | Years to Payout : | 0.28 | PW | 12.00% : | 66,475.41 | ||||||||||||||||
| End Ratio : | 0.000 | Internal ROR (%) : | 1,000.00 | PW | 15.00% : | 61,182.88 | ||||||||||||||||
| PW | 20.00% : | 54,015.87 | ||||||||||||||||||||
| TRC Eco Detailed.rpt | 6 | |||||||||||||||||||||
| Date :12/31/2008 2:59:23PM | ECONOMIC PROJECTION | |||||||||||||||||||||||
| As Of Date : | 10/31/2008 | Case : | PP F-29 - No. 1 | |||||||||||||||||||||
| Project Name : | 2008 SEC Report | Reserve Cat. : | Proved Non-Producing | |||||||||||||||||||||
| Discount Rate (%) : | 10.00 | |||||||||||||||||||||||
| Partner : | Lexaria Corp | Field : | Stamps | |||||||||||||||||||||
| Custom Selection | ||||||||||||||||||||||||
| Case Type : | LEASE CASE | Operator : | Griffin & Griffin Expl, LLC | |||||||||||||||||||||
| Archive Set : | default | Reservoir : | Frio Gas Pool (3,400 Ft. Sand) | |||||||||||||||||||||
| Co., State : | Wilkinson, MS | |||||||||||||||||||||||
| Cum Oil (Mbbl) : | 0.00 | |||||||||||||||||||||||
| Cum Gas (MMcf) : | 33.93 | |||||||||||||||||||||||
| Gross | Gross | Net | Net | Oil | Gas | Oil | Gas | Misc. | ||||||||||||||||
| Year | Oil | Gas | Oil | Gas | Price | Price | Revenue | Revenue | Revenue | |||||||||||||||
| (Mbbl) | (MMcf) | (Mbbl) | (MMcf) | ($/bbl) | ($/Mcf) | ($) | ($) | ($) | ||||||||||||||||
| 2008 | 0.00 | 1.77 | 0.00 | 0.34 | 0.00 | 6.17 | 0.00 | 2,085.44 | 0.00 | |||||||||||||||
| 2009 | 0.00 | 22.50 | 0.00 | 4.30 | 0.00 | 6.17 | 0.00 | 26,549.23 | 0.00 | |||||||||||||||
| 2010 | 0.00 | 14.90 | 0.00 | 2.85 | 0.00 | 6.17 | 0.00 | 17,587.43 | 0.00 | |||||||||||||||
| 2011 | 0.00 | 10.95 | 0.00 | 2.09 | 0.00 | 6.17 | 0.00 | 12,924.70 | 0.00 | |||||||||||||||
| 2012 | 0.00 | 4.10 | 0.00 | 0.78 | 0.00 | 6.17 | 0.00 | 4,842.92 | 0.00 | |||||||||||||||
| Rem | 0.00 | 0.00 | 0.00 | 0.00 | 0.00 | 0.00 | 0.00 | 0.00 | 0.00 | |||||||||||||||||
| Total | 0.00 | 54.23 | 0.00 | 10.37 | 0.00 | 6.17 | 0.00 | 63,989.72 | 0.00 | |||||||||||||||||
| Ult | 0.00 | 88.15 | ||||||||||||||||||||||||
| Well | Net Tax | Net Tax | Net | Net | Net | Other | Net | Annual | Cum Disc. | |||||||||||||||||
| Year | Count | Production | AdValorem | Investment | Lease Costs | Well Costs | Costs | Profits | Cash Flow | Cash Flow | ||||||||||||||||
| ($) | ($) | ($) | ($) | ($) | ($) | ($) | ($) | ($) | ||||||||||||||||||
| 2008 | 1.00 | 126.82 | 41.71 | 382.50 | 0.00 | 506.71 | 0.00 | 0.00 | 1,027.70 | 1,013.03 | ||||||||||||||||
| 2009 | 1.00 | 1,614.47 | 530.98 | 0.00 | 0.00 | 8,568.00 | 0.00 | 0.00 | 15,835.78 | 15,959.67 | ||||||||||||||||
| 2010 | 1.00 | 1,069.50 | 351.75 | 0.00 | 0.00 | 8,568.00 | 0.00 | 0.00 | 7,598.19 | 22,478.71 | ||||||||||||||||
| 2011 | 1.00 | 785.96 | 258.49 | 0.00 | 0.00 | 8,568.00 | 0.00 | 0.00 | 3,312.25 | 25,066.33 | ||||||||||||||||
| 2012 | 0.00 | 294.50 | 96.86 | 0.00 | 0.00 | 3,807.51 | 0.00 | 0.00 | 644.05 | 25,533.33 | ||||||||||||||||
| Rem. | 0.00 | 0.00 | 0.00 | 0.00 | 0.00 | 0.00 | 0.00 | 0.00 | 0.00 | |||||||||||||
| Total | 3,891.24 | 1,279.79 | 382.50 | 0.00 | 30,018.22 | 0.00 | 0.00 | 28,417.96 | 25,533.33 | |||||||||||||
| Major Phase : | Gas | Abandonment Date : | 06/12/2012 | |||||||||||||||||||
| Perfs : | 0 - 0 | Working Int : | 0.25500000 | Present Worth Profile ($) | ||||||||||||||||||
| Initial Rate : | 2,489.56 | Mcf/month | Revenue Int : | 0.19125000 | PW | 5.00% : | 26,882.53 | |||||||||||||||
| Abandonment : | 718.90 | Mcf/month | Disc. Initial Invest. ($) : | 378.53 | PW | 8.00% : | 26,052.85 | |||||||||||||||
| Initial Decline : | 45.44 | % year | b = 0.800 | ROInvestment (disc/undisc) : | 68.47 / 75.30 | PW | 10.00% : | 25,533.33 | ||||||||||||||
| Beg Ratio : | 0.000 | Years to Payout : | 0.11 | PW | 12.00% : | 25,038.50 | ||||||||||||||||
| End Ratio : | 0.000 | Internal ROR (%) : | 1,000.00 | PW | 15.00% : | 24,338.87 | ||||||||||||||||
| PW | 20.00% : | 23,274.24 | ||||||||||||||||||||
| TRC Eco Detailed.rpt | 7 | |||||||||||||||||||||
| Date :12/31/2008 | 2:59:23PM | ECONOMIC PROJECTION | ||||||||||||||||||||||
| As Of Date : | 10/31/2008 | Case : | PP F-52A - No. 1 | |||||||||||||||||||||
| Project Name : | 2008 SEC Report | Reserve Cat. : | Proved Non-Producing | |||||||||||||||||||||
| Discount Rate (%) : | 10.00 | |||||||||||||||||||||||
| Partner : | Lexaria Corp | Field : | Wakefield | |||||||||||||||||||||
| Custom Selection | ||||||||||||||||||||||||
| Case Type : | LEASE CASE | Operator : | Griffin & Griffin Expl, LLC | |||||||||||||||||||||
| Archive Set : | default | Reservoir : | Frio Gas Pool (3,430' Sand) | |||||||||||||||||||||
| Co., State : | Wilkinson, MS | |||||||||||||||||||||||
| Cum Oil (Mbbl) : | 0.00 | |||||||||||||||||||||||
| Cum Gas (MMcf) : | 1.63 | |||||||||||||||||||||||
| Gross | Gross | Net | Net | Oil | Gas | Oil | Gas | Misc. | ||||||||||||||||
| Year | Oil | Gas | Oil | Gas | Price | Price | Revenue | Revenue | Revenue | |||||||||||||||
| (Mbbl) | (MMcf) | (Mbbl) | (MMcf) | ($/bbl) | ($/Mcf) | ($) | ($) | ($) | ||||||||||||||||
| 2008 | 0.00 | 2.97 | 0.00 | 0.57 | 0.00 | 6.17 | 0.00 | 3,499.60 | 0.00 | |||||||||||||||
| 2009 | 0.00 | 32.50 | 0.00 | 6.22 | 0.00 | 6.17 | 0.00 | 38,351.91 | 0.00 | |||||||||||||||
| Rem | 0.00 | 0.00 | 0.00 | 0.00 | 0.00 | 0.00 | 0.00 | 0.00 | 0.00 | |||||||||||||||||
| Total | 0.00 | 35.47 | 0.00 | 6.78 | 0.00 | 6.17 | 0.00 | 41,851.50 | 0.00 | |||||||||||||||||
| Ult | 0.00 | 37.10 | ||||||||||||||||||||||||
| Well | Net Tax | Net Tax | Net | Net | Net | Other | Net | Annual | Cum Disc. | |||||||||||||||||
| Year | Count | Production | AdValorem | Investment | Lease Costs | Well Costs | Costs | Profits | Cash Flow | Cash Flow | ||||||||||||||||
| ($) | ($) | ($) | ($) | ($) | ($) | ($) | ($) | ($) | ||||||||||||||||||
| 2008 | 1.00 | 212.81 | 69.99 | 17,056.95 | 0.00 | 1,716.12 | 0.00 | 0.00 | -15,556.27 | -15,399.00 | ||||||||||||||||
| 2009 | 0.00 | 2,332.19 | 767.04 | 1,937.49 | 0.00 | 19,956.07 | 0.00 | 0.00 | 13,359.12 | -2,603.95 | ||||||||||||||||
| Rem. | 0.00 | 0.00 | 0.00 | 0.00 | 0.00 | 0.00 | 0.00 | 0.00 | 0.00 | |||||||||||||
| Total | 2,545.01 | 837.03 | 18,994.44 | 0.00 | 21,672.19 | 0.00 | 0.00 | -2,197.16 | -2,603.95 | |||||||||||||
| Major Phase : | Gas | Abandonment Date : | 09/11/2009 | |||||||||||||||||||
| Perfs : | 0 - 0 | Working Int : | 0.25500000 | Present Worth Profile ($) | ||||||||||||||||||
| Initial Rate : | 4,120.72 | Mcf/month | Revenue Int : | 0.19125000 | PW | 5.00% : | -2,408.60 | |||||||||||||||
| Abandonment : | 3,713.08 | Mcf/month | Disc. Initial Invest. ($) : | 18,663.98 | PW | 8.00% : | -2,527.61 | |||||||||||||||
| Initial Decline : | 13.26 | % year | b = 0.600 | ROInvestment (disc/undisc) : | 0.86 / 0.88 | PW | 10.00% : | -2,603.95 | ||||||||||||||
| Beg Ratio : | 0.000 | Years to Payout : | 0.00 | PW | 12.00% : | -2,678.01 | ||||||||||||||||
| End Ratio : | 0.000 | Internal ROR (%) : | 1,000.00 | PW | 15.00% : | -2,785.06 | ||||||||||||||||
| PW | 20.00% : | -2,953.51 | ||||||||||||||||||||
| TRC Eco Detailed.rpt | 8 | |||||||||||||||||||||
| Date :12/31/2008 | 2:59:23PM | ECONOMIC SUMMARY PROJECTION | ||||||||||||||||||
| Proved Rsv Class | ||||||||||||||||||||
| Project Name : | 2008 SEC Report | As Of Date : | 10/31/2008 | Non-Producing Rsv Category | ||||||||||||||||
| Partner : | Lexaria Corp | Discount Rate (%) : | 10.00 | |||||||||||||||||
| Case Type : | REPORT BREAK TOTAL CASE | Custom Selection | ||||||||||||||||||
| Cum Oil (Mbbl) : | 0.00 | |||||||||||||||||||
| Cum Gas (MMcf) : | 66.00 | |||||||||||||||||||
| Gross | Gross | Net | Net | Oil | Gas | Oil | Gas | Misc. | ||||||||||||
| Year | Oil | Gas | Oil | Gas | Price | Price | Revenue | Revenue | Revenue | |||||||||||
| (Mbbl) | (MMcf) | (Mbbl) | (MMcf) | ($/bbl) | ($/Mcf) | ($) | ($) | ($) | ||||||||||||
| 2008 | 0.00 | 4.73 | 0.00 | 0.91 | 0.00 | 6.17 | 0.00 | 5,585.03 | 0.00 | |||||||||||
| 2009 | 0.00 | 76.13 | 0.00 | 14.56 | 0.00 | 6.17 | 0.00 | 89,836.78 | 0.00 | |||||||||||
| 2010 | 0.00 | 33.19 | 0.00 | 6.35 | 0.00 | 6.17 | 0.00 | 39,168.02 | 0.00 | |||||||||||
| 2011 | 0.00 | 26.83 | 0.00 | 5.13 | 0.00 | 6.17 | 0.00 | 31,659.64 | 0.00 | |||||||||||
| 2012 | 0.00 | 18.12 | 0.00 | 3.47 | 0.00 | 6.17 | 0.00 | 21,386.08 | 0.00 | |||||||||||
| 2013 | 0.00 | 12.46 | 0.00 | 2.38 | 0.00 | 6.17 | 0.00 | 14,699.89 | 0.00 | |||||||||||
| 2014 | 0.00 | 11.21 | 0.00 | 2.14 | 0.00 | 6.17 | 0.00 | 13,228.30 | 0.00 | |||||||||||
| 2015 | 0.00 | 10.17 | 0.00 | 1.95 | 0.00 | 6.17 | 0.00 | 12,002.31 | 0.00 | |||||||||||
| 2016 | 0.00 | 9.32 | 0.00 | 1.78 | 0.00 | 6.17 | 0.00 | 10,995.55 | 0.00 | |||||||||||
| 2017 | 0.00 | 8.54 | 0.00 | 1.63 | 0.00 | 6.17 | 0.00 | 10,079.48 | 0.00 | |||||||||||
| 2018 | 0.00 | 7.89 | 0.00 | 1.51 | 0.00 | 6.17 | 0.00 | 9,315.51 | 0.00 | |||||||||||
| 2019 | 0.00 | 7.33 | 0.00 | 1.40 | 0.00 | 6.17 | 0.00 | 8,649.84 | 0.00 | |||||||||||
| 2020 | 0.00 | 2.24 | 0.00 | 0.43 | 0.00 | 6.17 | 0.00 | 2,645.27 | 0.00 | |||||||||||
| Rem | 0.00 | 0.00 | 0.00 | 0.00 | 0.00 | 0.00 | 0.00 | 0.00 | 0.00 | |||||||||||
| Total | 0.00 | 228.18 | 0.00 | 43.64 | 0.00 | 6.17 | 0.00 | 269,251.71 | 0.00 | |||||||||||
| Ult | 0.00 | 294.17 | ||||||||||||||||||
| Well | Net Tax | Net Tax | Net | Net | Net | Other | Net | Annual | Cum Disc. | |||||||||||||||||
| Year | Count | Production | AdValorem | Investment | Lease Costs | Well Costs | Costs | Profits | Cash Flow | Cash Flow | ||||||||||||||||
| ($) | ($) | ($) | ($) | ($) | ($) | ($) | ($) | ($) | ||||||||||||||||||
| 2008 | 3.00 | 339.63 | 111.70 | 17,821.95 | 0.00 | 2,222.83 | 0.00 | 0.00 | -14,911.07 | -14,764.50 | ||||||||||||||||
| 2009 | 2.00 | 5,463.01 | 1,796.74 | 1,937.49 | 0.00 | 32,702.19 | 0.00 | 0.00 | 47,937.36 | 30,582.09 | ||||||||||||||||
| 2010 | 2.00 | 2,381.82 | 783.36 | 0.00 | 0.00 | 12,803.04 | 0.00 | 0.00 | 23,199.80 | 50,431.80 | ||||||||||||||||
| 2011 | 2.00 | 1,925.23 | 633.19 | 0.00 | 0.00 | 12,803.04 | 0.00 | 0.00 | 16,298.17 | 63,105.93 | ||||||||||||||||
| 2012 | 1.00 | 1,300.50 | 427.72 | 0.00 | 0.00 | 8,042.55 | 0.00 | 0.00 | 11,615.31 | 71,318.99 | ||||||||||||||||
| 2013 | 1.00 | 893.91 | 294.00 | 0.00 | 0.00 | 4,235.04 | 0.00 | 0.00 | 9,276.95 | 77,272.34 | ||||||||||||||||
| 2014 | 1.00 | 804.42 | 264.57 | 0.00 | 0.00 | 4,235.04 | 0.00 | 0.00 | 7,924.28 | 81,895.39 | ||||||||||||||||
| 2015 | 1.00 | 729.86 | 240.05 | 0.00 | 0.00 | 4,235.04 | 0.00 | 0.00 | 6,797.36 | 85,500.54 | ||||||||||||||||
| 2016 | 1.00 | 668.64 | 219.91 | 0.00 | 0.00 | 4,235.04 | 0.00 | 0.00 | 5,871.95 | 88,331.67 | ||||||||||||||||
| 2017 | 1.00 | 612.94 | 201.59 | 0.00 | 0.00 | 4,235.04 | 0.00 | 0.00 | 5,029.91 | 90,536.00 | ||||||||||||||||
| 2018 | 1.00 | 566.48 | 186.31 | 0.00 | 0.00 | 4,235.04 | 0.00 | 0.00 | 4,327.68 | 92,260.24 | ||||||||||||||||
| 2019 | 1.00 | 526.00 | 173.00 | 0.00 | 0.00 | 4,235.04 | 0.00 | 0.00 | 3,715.81 | 93,606.19 | ||||||||||||||||
| 2020 | 0.00 | 160.86 | 52.91 | 1,555.50 | 0.00 | 1,331.97 | 0.00 | 0.00 | -455.96 | 93,459.15 | ||||||||||||||||
| Rem. | 0.00 | 0.00 | 0.00 | 0.00 | 0.00 | 0.00 | 0.00 | 0.00 | 0.00 | |||||||||||||
| Total | 16,373.30 | 5,385.03 | 21,314.94 | 0.00 | 99,550.89 | 0.00 | 0.00 | 126,627.55 | 93,459.15 | |||||||||||||
| Present Worth Profile ($) | ||||||||||||||||||||||
| PW | 5.00% : | 107,536.88 | ||||||||||||||||||||
| Disc. Initial Invest. ($) : | 19,941.58 | PW | 8.00% : | 98,612.54 | ||||||||||||||||||
| ROInvestment (disc/undisc) : | 5.69 / 6.94 | PW | 10.00% : | 93,459.15 | ||||||||||||||||||
| Years to Payout : | 0.47 | PW | 12.00% : | 88,835.90 | ||||||||||||||||||
| Internal ROR (%) : | 1,000.00 | PW | 15.00% : | 82,736.69 | ||||||||||||||||||
| PW | 20.00% : | 74,336.61 | ||||||||||||||||||||
| TRC Eco Detailed.rpt | 9 | |||||||||||||||||||||
| Date :12/31/2008 2:59:23PM | ECONOMIC PROJECTION | |||||||||||||||||||||||
| As Of Date : | 10/31/2008 | Case : | PP F-12 3rd Offset | |||||||||||||||||||||
| Project Name : | 2008 SEC Report | Reserve Cat. : | Proved Undeveloped | |||||||||||||||||||||
| Discount Rate (%) : | 10.00 | |||||||||||||||||||||||
| Partner : | Lexaria Corp | Field : | Belmont | |||||||||||||||||||||
| Custom Selection | ||||||||||||||||||||||||
| Case Type : | LEASE CASE | Operator : | Griffin & Griffin Expl, LLC | |||||||||||||||||||||
| Archive Set : | default | Reservoir : | 2,800 Ft. Sand | |||||||||||||||||||||
| Co., State : | Wilkinson, MS | |||||||||||||||||||||||
| Cum Oil (Mbbl) : | 0.00 | |||||||||||||||||||||||
| Cum Gas (MMcf) : | 0.00 | |||||||||||||||||||||||
| Gross | Gross | Net | Net | Oil | Gas | Oil | Gas | Misc. | ||||||||||||||||
| Year | Oil | Gas | Oil | Gas | Price | Price | Revenue | Revenue | Revenue | |||||||||||||||
| (Mbbl) | (MMcf) | (Mbbl) | (MMcf) | ($/bbl) | ($/Mcf) | ($) | ($) | ($) | ||||||||||||||||
| 2008 | 0.00 | 0.00 | 0.00 | 0.00 | 0.00 | 0.00 | 0.00 | 0.00 | 0.00 | |||||||||||||||
| 2009 | 16.46 | 0.00 | 3.15 | 0.00 | 64.00 | 0.00 | 201,492.89 | 0.00 | 0.00 | |||||||||||||||
| 2010 | 25.32 | 0.00 | 4.84 | 0.00 | 64.00 | 0.00 | 309,882.84 | 0.00 | 0.00 | |||||||||||||||
| 2011 | 20.26 | 0.00 | 3.87 | 0.00 | 64.00 | 0.00 | 247,944.14 | 0.00 | 0.00 | |||||||||||||||
| 2012 | 16.25 | 0.00 | 3.11 | 0.00 | 64.00 | 0.00 | 198,870.64 | 0.00 | 0.00 | |||||||||||||||
| 2013 | 12.96 | 0.00 | 2.48 | 0.00 | 64.00 | 0.00 | 158,635.79 | 0.00 | 0.00 | |||||||||||||||
| 2014 | 10.37 | 0.00 | 1.98 | 0.00 | 64.00 | 0.00 | 126,928.01 | 0.00 | 0.00 | |||||||||||||||
| 2015 | 5.37 | 0.00 | 1.03 | 0.00 | 64.00 | 0.00 | 65,729.85 | 0.00 | 0.00 | |||||||||||||||
| Rem | 0.00 | 0.00 | 0.00 | 0.00 | 0.00 | 0.00 | 0.00 | 0.00 | 0.00 | |||||||||||||||||
| Total | 106.98 | 0.00 | 20.46 | 0.00 | 64.00 | 0.00 | 1,309,484.16 | 0.00 | 0.00 | |||||||||||||||||
| Ult | 106.98 | 0.00 | ||||||||||||||||||||||||
| Well | Net Tax | Net Tax | Net | Net | Net | Other | Net | Annual | Cum Disc. | |||||||||||||||||
| Year | Count | Production | AdValorem | Investment | Lease Costs | Well Costs | Costs | Profits | Cash Flow | Cash Flow | ||||||||||||||||
| ($) | ($) | ($) | ($) | ($) | ($) | ($) | ($) | ($) | ||||||||||||||||||
| 2008 | 0.00 | 0.00 | 0.00 | 0.00 | 0.00 | 0.00 | 0.00 | 0.00 | 0.00 | 0.00 | ||||||||||||||||
| 2009 | 1.00 | 12,228.10 | 4,029.86 | 187,807.50 | 0.00 | 14,136.01 | 0.00 | 0.00 | -16,708.58 | -19,808.06 | ||||||||||||||||
| 2010 | 1.00 | 18,806.02 | 6,197.66 | 0.00 | 0.00 | 25,964.10 | 0.00 | 0.00 | 258,915.07 | 201,523.47 | ||||||||||||||||
| 2011 | 1.00 | 15,047.11 | 4,958.88 | 0.00 | 0.00 | 25,964.10 | 0.00 | 0.00 | 201,974.05 | 358,500.52 | ||||||||||||||||
| 2012 | 1.00 | 12,068.96 | 3,977.41 | 0.00 | 0.00 | 25,964.10 | 0.00 | 0.00 | 156,860.16 | 469,332.45 | ||||||||||||||||
| 2013 | 1.00 | 9,627.21 | 3,172.72 | 0.00 | 0.00 | 25,964.10 | 0.00 | 0.00 | 119,871.76 | 546,329.57 | ||||||||||||||||
| 2014 | 1.00 | 7,702.94 | 2,538.56 | 0.00 | 0.00 | 25,964.10 | 0.00 | 0.00 | 90,722.41 | 599,314.76 | ||||||||||||||||
| 2015 | 1.00 | 3,988.98 | 1,314.60 | 1,530.00 | 0.00 | 15,869.87 | 0.00 | 0.00 | 43,026.41 | 622,565.14 | ||||||||||||||||
| Rem. | 0.00 | 0.00 | 0.00 | 0.00 | 0.00 | 0.00 | 0.00 | 0.00 | 0.00 | |||||||||||||||
| Total | 79,469.32 | 26,189.68 | 189,337.50 | 0.00 | 159,826.38 | 0.00 | 0.00 | 854,661.28 | 622,565.14 | |||||||||||||||
| Major Phase : | Oil | Abandonment Date : | 08/14/2015 | |||||||||||||||||||||
| Perfs : | 0 - 0 | Working Int : | 0.25500000 | Present Worth Profile ($) | ||||||||||||||||||||
| Initial Rate : | 2,661.46 | bbl/month | Revenue Int : | 0.19125000 | PW | 5.00% : | 725,194.02 | |||||||||||||||||
| Abandonment : | 672.06 | bbl/month | Disc. Initial Invest. ($) : | 177,807.11 | PW | 8.00% : | 660,887.93 | |||||||||||||||||
| Initial Decline : | 20.00 | % year | b = 0.000 | ROInvestment (disc/undisc) : | 4.50 / 5.51 | PW | 10.00% : | 622,565.14 | ||||||||||||||||
| Beg Ratio : | 0.000 | Years to Payout : | 1.23 | PW | 12.00% : | 587,419.93 | ||||||||||||||||||
| End Ratio : | 0.000 | Internal ROR (%) : | 364.54 | PW | 15.00% : | 539,933.58 | ||||||||||||||||||
| PW | 20.00% : | 472,469.06 | ||||||||||||||||||||||
| TRC Eco Detailed.rpt | 10 | |||||||||||||||||||||||
| Date :12/31/2008 2:59:23PM | ECONOMIC PROJECTION | |||||||||||||||||||||||
| As Of Date : | 10/31/2008 | Case : | PP F-12 4th Offset | |||||||||||||||||||||
| Project Name : | 2008 SEC Report | Reserve Cat. : | Proved Undeveloped | |||||||||||||||||||||
| Discount Rate (%) : | 10.00 | |||||||||||||||||||||||
| Partner : | Lexaria Corp | Field : | Belmont | |||||||||||||||||||||
| Custom Selection | ||||||||||||||||||||||||
| Case Type : | LEASE CASE | Operator : | Griffin & Griffin Expl, LLC | |||||||||||||||||||||
| Archive Set : | default | Reservoir : | 2,800 Ft. Sand | |||||||||||||||||||||
| Co., State : | Wilkinson, MS | |||||||||||||||||||||||
| Cum Oil (Mbbl) : | 0.00 | |||||||||||||||||||||||
| Cum Gas (MMcf) : | 0.00 | |||||||||||||||||||||||
| Gross | Gross | Net | Net | Oil | Gas | Oil | Gas | Misc. | ||||||||||||||||
| Year | Oil | Gas | Oil | Gas | Price | Price | Revenue | Revenue | Revenue | |||||||||||||||
| (Mbbl) | (MMcf) | (Mbbl) | (MMcf) | ($/bbl) | ($/Mcf) | ($) | ($) | ($) | ||||||||||||||||
| 2008 | 0.00 | 0.00 | 0.00 | 0.00 | 0.00 | 0.00 | 0.00 | 0.00 | 0.00 | |||||||||||||||
| 2009 | 14.12 | 0.00 | 2.70 | 0.00 | 64.00 | 0.00 | 172,815.85 | 0.00 | 0.00 | |||||||||||||||
| 2010 | 25.79 | 0.00 | 4.93 | 0.00 | 64.00 | 0.00 | 315,614.75 | 0.00 | 0.00 | |||||||||||||||
| 2011 | 20.63 | 0.00 | 3.95 | 0.00 | 64.00 | 0.00 | 252,530.36 | 0.00 | 0.00 | |||||||||||||||
| 2012 | 16.55 | 0.00 | 3.16 | 0.00 | 64.00 | 0.00 | 202,549.15 | 0.00 | 0.00 | |||||||||||||||
| 2013 | 13.20 | 0.00 | 2.52 | 0.00 | 64.00 | 0.00 | 161,570.07 | 0.00 | 0.00 | |||||||||||||||
| 2014 | 10.56 | 0.00 | 2.02 | 0.00 | 64.00 | 0.00 | 129,275.80 | 0.00 | 0.00 | |||||||||||||||
| 2015 | 6.14 | 0.00 | 1.17 | 0.00 | 64.00 | 0.00 | 75,128.18 | 0.00 | 0.00 | |||||||||||||||
| Rem | 0.00 | 0.00 | 0.00 | 0.00 | 0.00 | 0.00 | 0.00 | 0.00 | 0.00 | |||||||||||||||||
| Total | 106.98 | 0.00 | 20.46 | 0.00 | 64.00 | 0.00 | 1,309,484.16 | 0.00 | 0.00 | |||||||||||||||||
| Ult | 106.98 | 0.00 | ||||||||||||||||||||||||
| Well | Net Tax | Net Tax | Net | Net | Net | Other | Net | Annual | Cum Disc. | |||||||||||||||||
| Year | Count | Production | AdValorem | Investment | Lease Costs | Well Costs | Costs | Profits | Cash Flow | Cash Flow | ||||||||||||||||
| ($) | ($) | ($) | ($) | ($) | ($) | ($) | ($) | ($) | ||||||||||||||||||
| 2008 | 0.00 | 0.00 | 0.00 | 0.00 | 0.00 | 0.00 | 0.00 | 0.00 | 0.00 | 0.00 | ||||||||||||||||
| 2009 | 1.00 | 10,487.76 | 3,456.32 | 220,950.00 | 0.00 | 12,214.29 | 0.00 | 0.00 | -74,292.52 | -72,432.23 | ||||||||||||||||
| 2010 | 1.00 | 19,153.87 | 6,312.29 | 0.00 | 0.00 | 25,964.10 | 0.00 | 0.00 | 264,184.48 | 153,403.12 | ||||||||||||||||
| 2011 | 1.00 | 15,325.44 | 5,050.61 | 0.00 | 0.00 | 25,964.10 | 0.00 | 0.00 | 206,190.22 | 313,656.38 | ||||||||||||||||
| 2012 | 1.00 | 12,292.20 | 4,050.98 | 0.00 | 0.00 | 25,964.10 | 0.00 | 0.00 | 160,241.86 | 426,877.06 | ||||||||||||||||
| 2013 | 1.00 | 9,805.28 | 3,231.40 | 0.00 | 0.00 | 25,964.10 | 0.00 | 0.00 | 122,569.29 | 505,606.30 | ||||||||||||||||
| 2014 | 1.00 | 7,845.43 | 2,585.52 | 0.00 | 0.00 | 25,964.10 | 0.00 | 0.00 | 92,880.76 | 559,851.49 | ||||||||||||||||
| 2015 | 1.00 | 4,559.34 | 1,502.56 | 1,530.00 | 0.00 | 18,233.52 | 0.00 | 0.00 | 49,302.76 | 586,395.20 | ||||||||||||||||
| Rem. | 0.00 | 0.00 | 0.00 | 0.00 | 0.00 | 0.00 | 0.00 | 0.00 | 0.00 | |||||||||||||||
| Total | 79,469.32 | 26,189.68 | 222,480.00 | 0.00 | 160,268.31 | 0.00 | 0.00 | 821,076.85 | 586,395.20 | |||||||||||||||
| Major Phase : | Oil | Abandonment Date : | 09/13/2015 | |||||||||||||||||||||
| Perfs : | 0 - 0 | Working Int : | 0.30000000 | Present Worth Profile ($) | ||||||||||||||||||||
| Initial Rate : | 2,661.46 | bbl/month | Revenue Int : | 0.19125000 | PW | 5.00% : | 689,896.93 | |||||||||||||||||
| Abandonment : | 672.06 | bbl/month | Disc. Initial Invest. ($) : | 207,413.36 | PW | 8.00% : | 624,987.19 | |||||||||||||||||
| Initial Decline : | 20.00 | % year | b = 0.000 | ROInvestment (disc/undisc) : | 3.83 / 4.69 | PW | 10.00% : | 586,395.20 | ||||||||||||||||
| Beg Ratio : | 0.000 | Years to Payout : | 1.43 | PW | 12.00% : | 551,068.75 | ||||||||||||||||||
| End Ratio : | 0.000 | Internal ROR (%) : | 254.82 | PW | 15.00% : | 503,447.20 | ||||||||||||||||||
| PW | 20.00% : | 436,037.25 | ||||||||||||||||||||||
| TRC Eco Detailed.rpt | 11 | |||||||||||||||||||||||
| Date :12/31/2008 | 2:59:23PM | ECONOMIC SUMMARY PROJECTION | ||||||||||||||||
| Proved Rsv Class | ||||||||||||||||||
| Project Name : | 2008 SEC Report | As Of Date : | 10/31/2008 | Undeveloped Rsv Category | ||||||||||||||
| Partner : | Lexaria Corp | Discount Rate (%) : | 10.00 | |||||||||||||||
| Case Type : | REPORT BREAK TOTAL CASE | Custom Selection | ||||||||||||||||
| Cum Oil (Mbbl) : | 0.00 | |||||||||||||||||
| Cum Gas (MMcf) : | 0.00 | |||||||||||||||||
| Gross | Gross | Net | Net | Oil | Gas | Oil | Gas | Misc. | ||||||||||
| Year | Oil | Gas | Oil | Gas | Price | Price | Revenue | Revenue | Revenue | |||||||||
| (Mbbl) | (MMcf) | (Mbbl) | (MMcf) | ($/bbl) | ($/Mcf) | ($) | ($) | ($) | ||||||||||
| 2008 | 0.00 | 0.00 | 0.00 | 0.00 | 0.00 | 0.00 | 0.00 | 0.00 | 0.00 | |||||||||
| 2009 | 30.58 | 0.00 | 5.85 | 0.00 | 64.00 | 0.00 | 374,308.73 | 0.00 | 0.00 | |||||||||
| 2010 | 51.10 | 0.00 | 9.77 | 0.00 | 64.00 | 0.00 | 625,497.59 | 0.00 | 0.00 | |||||||||
| 2011 | 40.89 | 0.00 | 7.82 | 0.00 | 64.00 | 0.00 | 500,474.51 | 0.00 | 0.00 | |||||||||
| 2012 | 32.80 | 0.00 | 6.27 | 0.00 | 64.00 | 0.00 | 401,419.78 | 0.00 | 0.00 | |||||||||
| 2013 | 26.16 | 0.00 | 5.00 | 0.00 | 64.00 | 0.00 | 320,205.86 | 0.00 | 0.00 | |||||||||
| 2014 | 20.93 | 0.00 | 4.00 | 0.00 | 64.00 | 0.00 | 256,203.81 | 0.00 | 0.00 | |||||||||
| 2015 | 11.51 | 0.00 | 2.20 | 0.00 | 64.00 | 0.00 | 140,858.04 | 0.00 | 0.00 | |||||||||
| Rem | 0.00 | 0.00 | 0.00 | 0.00 | 0.00 | 0.00 | 0.00 | 0.00 | 0.00 | |||||||||||||||||
| Total | 213.97 | 0.00 | 40.92 | 0.00 | 64.00 | 0.00 | 2,618,968.32 | 0.00 | 0.00 | |||||||||||||||||
| Ult | 213.97 | 0.00 | ||||||||||||||||||||||||
| Well | Net Tax | Net Tax | Net | Net | Net | Other | Net | Annual | Cum Disc. | |||||||||||||||||
| Year | Count | Production | AdValorem | Investment | Lease Costs | Well Costs | Costs | Profits | Cash Flow | Cash Flow | ||||||||||||||||
| ($) | ($) | ($) | ($) | ($) | ($) | ($) | ($) | ($) | ||||||||||||||||||
| 2008 | 0.00 | 0.00 | 0.00 | 0.00 | 0.00 | 0.00 | 0.00 | 0.00 | 0.00 | 0.00 | ||||||||||||||||
| 2009 | 2.00 | 22,715.86 | 7,486.17 | 408,757.50 | 0.00 | 26,350.30 | 0.00 | 0.00 | -91,001.11 | -92,240.30 | ||||||||||||||||
| 2010 | 2.00 | 37,959.89 | 12,509.95 | 0.00 | 0.00 | 51,928.20 | 0.00 | 0.00 | 523,099.55 | 354,926.60 | ||||||||||||||||
| 2011 | 2.00 | 30,372.55 | 10,009.49 | 0.00 | 0.00 | 51,928.20 | 0.00 | 0.00 | 408,164.27 | 672,156.90 | ||||||||||||||||
| 2012 | 2.00 | 24,361.16 | 8,028.40 | 0.00 | 0.00 | 51,928.20 | 0.00 | 0.00 | 317,102.02 | 896,209.51 | ||||||||||||||||
| 2013 | 2.00 | 19,432.49 | 6,404.12 | 0.00 | 0.00 | 51,928.20 | 0.00 | 0.00 | 242,441.05 | 1,051,935.87 | ||||||||||||||||
| 2014 | 2.00 | 15,548.37 | 5,124.08 | 0.00 | 0.00 | 51,928.20 | 0.00 | 0.00 | 183,603.17 | 1,159,166.25 | ||||||||||||||||
| 2015 | 2.00 | 8,548.32 | 2,817.16 | 3,060.00 | 0.00 | 34,103.39 | 0.00 | 0.00 | 92,329.17 | 1,208,960.34 | ||||||||||||||||
| Rem. | 0.00 | 0.00 | 0.00 | 0.00 | 0.00 | 0.00 | 0.00 | 0.00 | 0.00 | |||||||||||||
| Total | 158,938.64 | 52,379.37 | 411,817.50 | 0.00 | 320,094.69 | 0.00 | 0.00 | 1,675,738.12 | 1,208,960.34 | |||||||||||||
| Present Worth Profile ($) | ||||||||||||||||||||||
| PW | 5.00% : | 1,415,090.95 | ||||||||||||||||||||
| Disc. Initial Invest. ($) : | 385,220.47 | PW | 8.00% : | 1,285,875.11 | ||||||||||||||||||
| ROInvestment (disc/undisc) : | 4.14 / 5.07 | PW | 10.00% : | 1,208,960.34 | ||||||||||||||||||
| Years to Payout : | 1.33 | PW | 12.00% : | 1,138,488.68 | ||||||||||||||||||
| Internal ROR (%) : | 304.68 | PW | 15.00% : | 1,043,380.78 | ||||||||||||||||||
| PW | 20.00% : | 908,506.31 | ||||||||||||||||||||
| TRC Eco Detailed.rpt | 12 | |||||||||||||||||||||
| Date :12/31/2008 | 2:59:23PM | ECONOMIC SUMMARY PROJECTION | ||||||||||||||||
| Proved Rsv Class | ||||||||||||||||||
| Project Name : | 2008 SEC Report | As Of Date : | 10/31/2008 | |||||||||||||||
| Partner : | Lexaria Corp | Discount Rate (%) : | 10.00 | |||||||||||||||
| Case Type : | REPORT BREAK TOTAL CASE | Custom Selection | ||||||||||||||||
| Cum Oil (Mbbl) : | 25.14 | |||||||||||||||||
| Cum Gas (MMcf) : | 199.13 | |||||||||||||||||
| Gross | Gross | Net | Net | Oil | Gas | Oil | Gas | Misc. | ||||||||||
| Year | Oil | Gas | Oil | Gas | Price | Price | Revenue | Revenue | Revenue | |||||||||
| (Mbbl) | (MMcf) | (Mbbl) | (MMcf) | ($/bbl) | ($/Mcf) | ($) | ($) | ($) | ||||||||||
| 2008 | 8.83 | 16.31 | 1.69 | 3.12 | 64.00 | 6.17 | 108,086.43 | 19,240.38 | 0.00 | |||||||||
| 2009 | 79.20 | 138.91 | 15.15 | 26.57 | 64.00 | 6.17 | 969,374.85 | 163,915.07 | 0.00 | |||||||||
| 2010 | 93.46 | 76.98 | 17.87 | 14.72 | 64.00 | 6.17 | 1,143,953.80 | 90,836.19 | 0.00 | |||||||||
| 2011 | 77.82 | 37.21 | 14.88 | 7.12 | 64.00 | 6.17 | 952,545.36 | 43,905.16 | 0.00 | |||||||||
| 2012 | 64.45 | 18.12 | 12.33 | 3.47 | 64.00 | 6.17 | 788,833.67 | 21,386.08 | 0.00 | |||||||||
| 2013 | 39.69 | 12.46 | 7.59 | 2.38 | 64.00 | 6.17 | 485,791.94 | 14,699.89 | 0.00 | |||||||||
| 2014 | 25.91 | 11.21 | 4.96 | 2.14 | 64.00 | 6.17 | 317,167.98 | 13,228.30 | 0.00 | |||||||||
| 2015 | 11.51 | 10.17 | 2.20 | 1.95 | 64.00 | 6.17 | 140,858.04 | 12,002.31 | 0.00 | |||||||||
| 2016 | 0.00 | 9.32 | 0.00 | 1.78 | 0.00 | 6.17 | 0.00 | 10,995.55 | 0.00 | |||||||||
| 2017 | 0.00 | 8.54 | 0.00 | 1.63 | 0.00 | 6.17 | 0.00 | 10,079.48 | 0.00 | |||||||||
| 2018 | 0.00 | 7.89 | 0.00 | 1.51 | 0.00 | 6.17 | 0.00 | 9,315.51 | 0.00 | |||||||||
| 2019 | 0.00 | 7.33 | 0.00 | 1.40 | 0.00 | 6.17 | 0.00 | 8,649.84 | 0.00 | |||||||||
| 2020 | 0.00 | 2.24 | 0.00 | 0.43 | 0.00 | 6.17 | 0.00 | 2,645.27 | 0.00 | |||||||||
| 2021 | 0.00 | 0.00 | 0.00 | 0.00 | 0.00 | 0.00 | 0.00 | 0.00 | 0.00 | |||||||||
| 2022 | 0.00 | 0.00 | 0.00 | 0.00 | 0.00 | 0.00 | 0.00 | 0.00 | 0.00 | |||||||||
| Rem | 0.00 | 0.00 | 0.00 | 0.00 | 0.00 | 0.00 | 0.00 | 0.00 | 0.00 | |||||||||
| Total | 400.87 | 356.69 | 76.67 | 68.22 | 64.00 | 6.17 | 4,906,612.08 | 420,899.03 | 0.00 | |||||||||
| Ult | 426.00 | 555.82 | ||||||||||||||||
| Well | Net Tax | Net Tax | Net | Net | Net | Other | Net | Annual | Cum Disc. | |||||||||||||||||
| Year | Count | Production | AdValorem | Investment | Lease Costs | Well Costs | Costs | Profits | Cash Flow | Cash Flow | ||||||||||||||||
| ($) | ($) | ($) | ($) | ($) | ($) | ($) | ($) | ($) | ||||||||||||||||||
| 2008 | 7.00 | 6,738.83 | 2,220.05 | 17,821.95 | 0.00 | 16,484.93 | 0.00 | 0.00 | 84,061.04 | 83,413.03 | ||||||||||||||||
| 2009 | 8.00 | 68,796.67 | 22,665.80 | 410,694.99 | 0.00 | 148,113.79 | 0.00 | 0.00 | 483,018.67 | 530,845.23 | ||||||||||||||||
| 2010 | 8.00 | 74,947.48 | 24,695.80 | 0.00 | 0.00 | 141,271.16 | 0.00 | 0.00 | 993,875.55 | 1,380,211.42 | ||||||||||||||||
| 2011 | 6.00 | 60,477.49 | 19,929.01 | 0.00 | 0.00 | 121,225.37 | 0.00 | 0.00 | 794,818.66 | 1,997,903.38 | ||||||||||||||||
| 2012 | 4.00 | 49,172.84 | 16,204.40 | 1,530.00 | 0.00 | 111,041.76 | 0.00 | 0.00 | 632,270.76 | 2,444,741.17 | ||||||||||||||||
| 2013 | 4.00 | 30,375.40 | 10,009.84 | 0.00 | 0.00 | 88,351.38 | 0.00 | 0.00 | 371,755.21 | 2,683,440.07 | ||||||||||||||||
| 2014 | 3.00 | 20,052.55 | 6,607.93 | 1,530.00 | 0.00 | 68,689.53 | 0.00 | 0.00 | 233,516.28 | 2,820,489.58 | ||||||||||||||||
| 2015 | 3.00 | 9,278.19 | 3,057.21 | 3,060.00 | 0.00 | 38,338.43 | 0.00 | 0.00 | 99,126.52 | 2,873,888.82 | ||||||||||||||||
| 2016 | 1.00 | 668.64 | 219.91 | 0.00 | 0.00 | 4,235.04 | 0.00 | 0.00 | 5,871.95 | 2,876,719.95 | ||||||||||||||||
| 2017 | 1.00 | 612.94 | 201.59 | 0.00 | 0.00 | 4,235.04 | 0.00 | 0.00 | 5,029.91 | 2,878,924.28 | ||||||||||||||||
| 2018 | 1.00 | 566.48 | 186.31 | 0.00 | 0.00 | 4,235.04 | 0.00 | 0.00 | 4,327.68 | 2,880,648.52 | ||||||||||||||||
| 2019 | 1.00 | 526.00 | 173.00 | 0.00 | 0.00 | 4,235.04 | 0.00 | 0.00 | 3,715.81 | 2,881,994.46 | ||||||||||||||||
| 2020 | 0.00 | 160.86 | 52.91 | 1,555.50 | 0.00 | 1,331.97 | 0.00 | 0.00 | -455.96 | 2,881,847.43 | ||||||||||||||||
| 2021 | 0.00 | 0.00 | 0.00 | 0.00 | 0.00 | 0.00 | 0.00 | 0.00 | 0.00 | 2,881,847.43 | ||||||||||||||||
| 2022 | 0.00 | 0.00 | 0.00 | 0.00 | 0.00 | 0.00 | 0.00 | 0.00 | 0.00 | 2,881,847.43 | ||||||||||||||||
| Rem. | 0.00 | 0.00 | 1,020.00 | 0.00 | 0.00 | 0.00 | 0.00 | -1,020.00 | -245.76 | |||||||||||||||||
| Total | 322,374.37 | 106,223.74 | 437,212.44 | 0.00 | 751,788.47 | 0.00 | 0.00 | 3,709,912.09 | 2,881,601.67 | |||||||||||||||||
| Present Worth Profile ($) | ||||||||||||||||||||||||||
| PW | 5.00% : | 3,250,662.26 | ||||||||||||||||||||||||
| Disc. Initial Invest. ($) : | 407,340.71 | PW | 8.00% : | 3,020,003.00 | ||||||||||||||||||||||
| ROInvestment (disc/undisc) : | 8.07 / 9.49 | PW | 10.00% : | 2,881,601.67 | ||||||||||||||||||||||
| Years to Payout : | 0.69 | PW | 12.00% : | 2,753,991.97 | ||||||||||||||||||||||
| Internal ROR (%) : | 1,000.00 | PW | 15.00% : | 2,580,428.99 | ||||||||||||||||||||||
| PW | 20.00% : | 2,331,279.22 | ||||||||||||||||||||||||
| TRC Eco Detailed.rpt | 13 | |||||||||||||||||||||||||
| CaseName:PP F-39 Well: No. 1 Reservoir:Frio Sand (2,800 Ft. Sand) |
| Field:Artonish,E. Oper: Griffin & Griffin Expl, LLC Location:Sec. 6, T2N-R5W |

| Gas Rem: 88.93 MMcf Oil Rem: 0.00 Mbbl Class & Cat:Proved Producing |
| Gas Init Qi:4.571MMcf/mo Gas Init Decl: 16 % Gas Bfact: 0.600 |
| Case Name: PP F-12-1 | Field: Belmont | ||
| Well: | Oper: Griffin & Griffin Expl, LLC | ||
| Reservoir: 2,800 Ft. Sand | Location: Sec. 41, T2N - 4W |
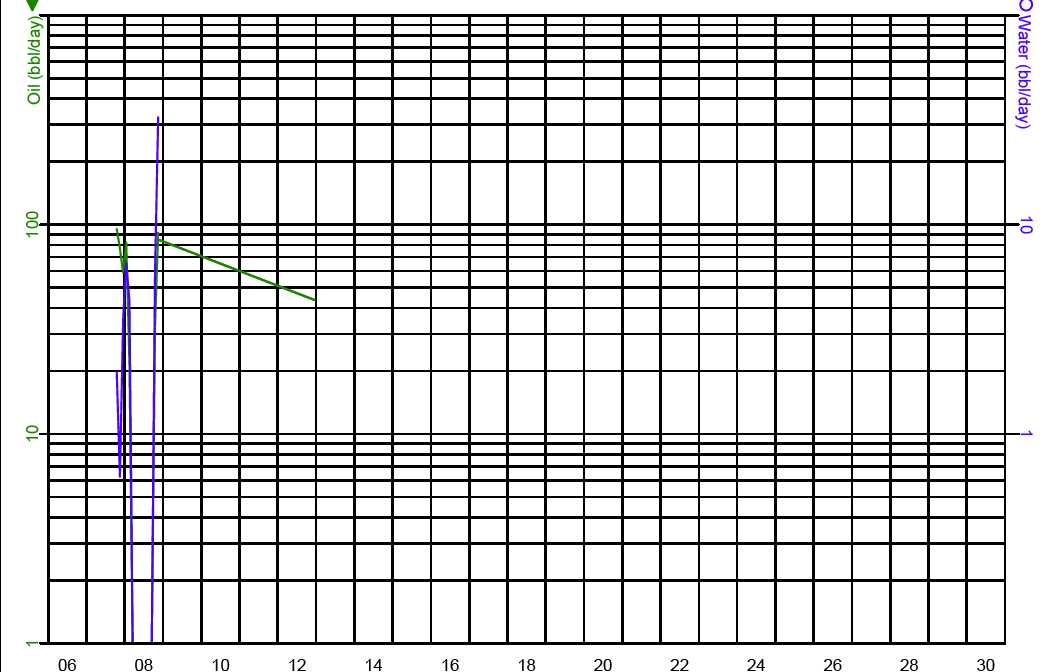
| Oil Rem: 94.00 Mbbl Gas Rem: 0.00 MMcf Class & Cat:Proved Producing |
| Oil Init Qi:2.582Mbbl/mo Oil Init Decl: 15 % Oil Bfact: 0.001 |
| CaseName:PP F-6B Well: No. 1 Reservoir:Frio Sand (1,940 Ft. Sand) |
| Field:School Section Oper: Griffin & Griffin Expl, LLC Location:Sec. AC, T3N-R5W |
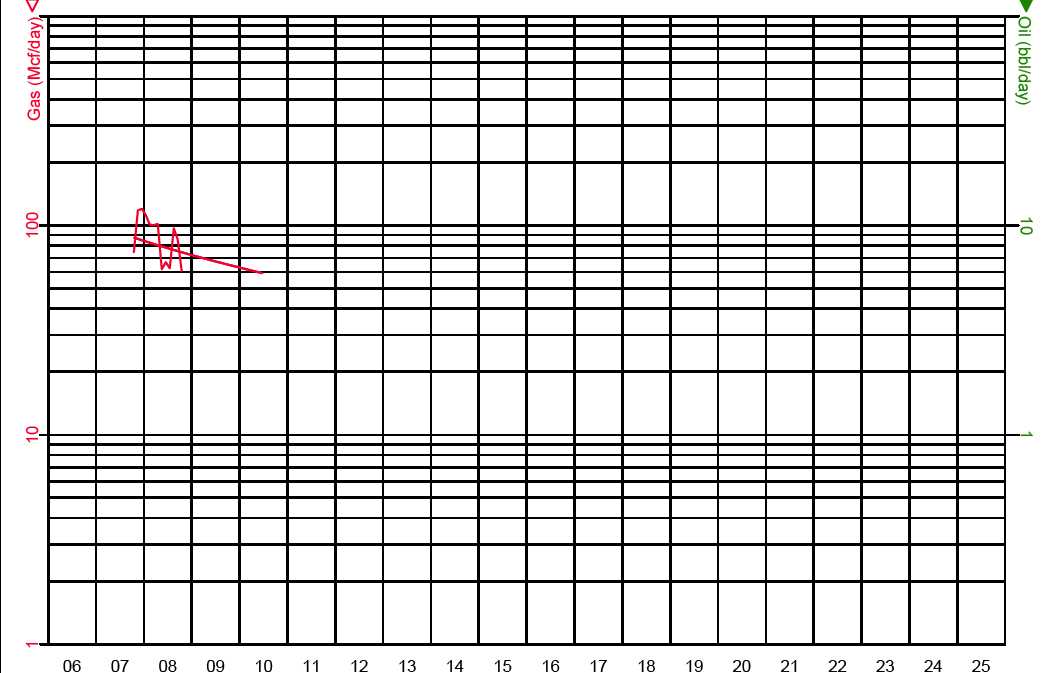
| Gas Rem: 39.58 MMcf Oil Rem: 0.00 Mbbl Class & Cat:Proved Producing |
| Gas Init Qi:2.658MMcf/mo Gas Init Decl: 16 % Gas Bfact: 0.800 |
| Case Name: PP F-12-3 | Field: Belmont | ||
| Well: | Oper: Griffin & Griffin Expl, LLC | ||
| Reservoir: 2,800 Ft. Sand | Location: Sec. 41, T2N - 4W |
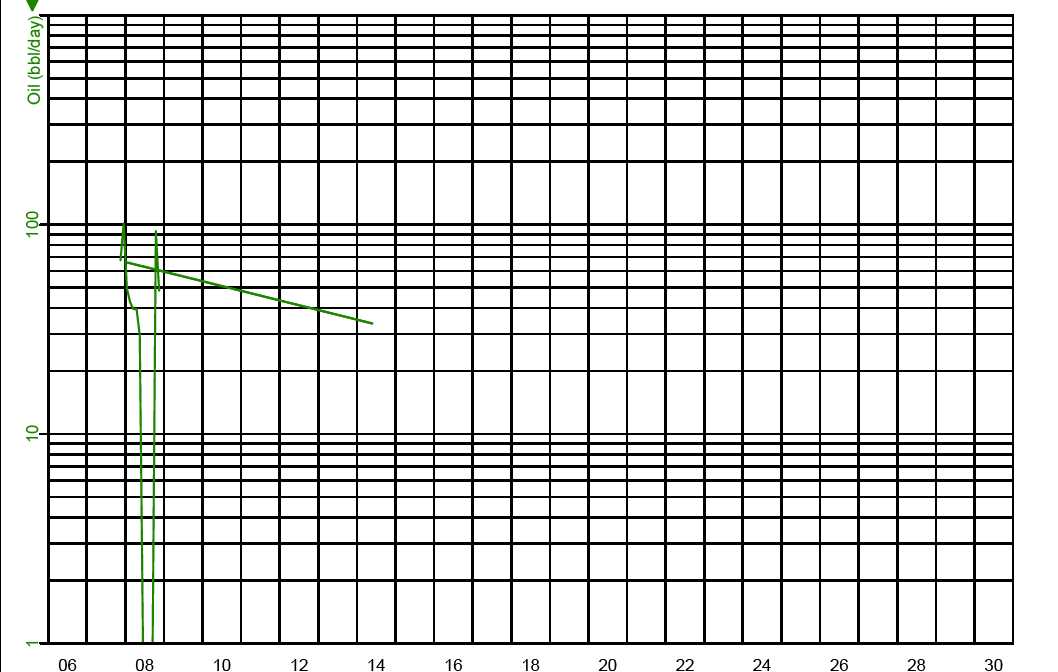
| Oil Rem: 92.90 Mbbl Gas Rem: 0.00 MMcf Class & Cat:Proved Producing |
| Oil Init Qi:2.003Mbbl/mo Oil Init Decl: 10 % Oil Bfact: 0.001 |
| CaseName:PP F-42 Well: No. 1 Reservoir:Frio Gas Pool(2,800'Sand) |
| Field:Stamps Oper: Griffin & Griffin Expl, LLC Location:Sec. 12, T2N - 5W |

| Gas Rem:138.48MMcf Oil Rem: 0.00 Mbbl Class & Cat:ProvedNon-Producing |
| Gas Init Qi:1.944MMcf/mo Gas Init Decl: 17 % Gas Bfact: 0.800 |
| CaseName:PP F-29 Well: No. 1 Reservoir:Frio Gas Pool (3,400 Ft. Sand) |
| Field:Stamps Oper: Griffin & Griffin Expl, LLC Location:Sec. 15, T2N - 5W |
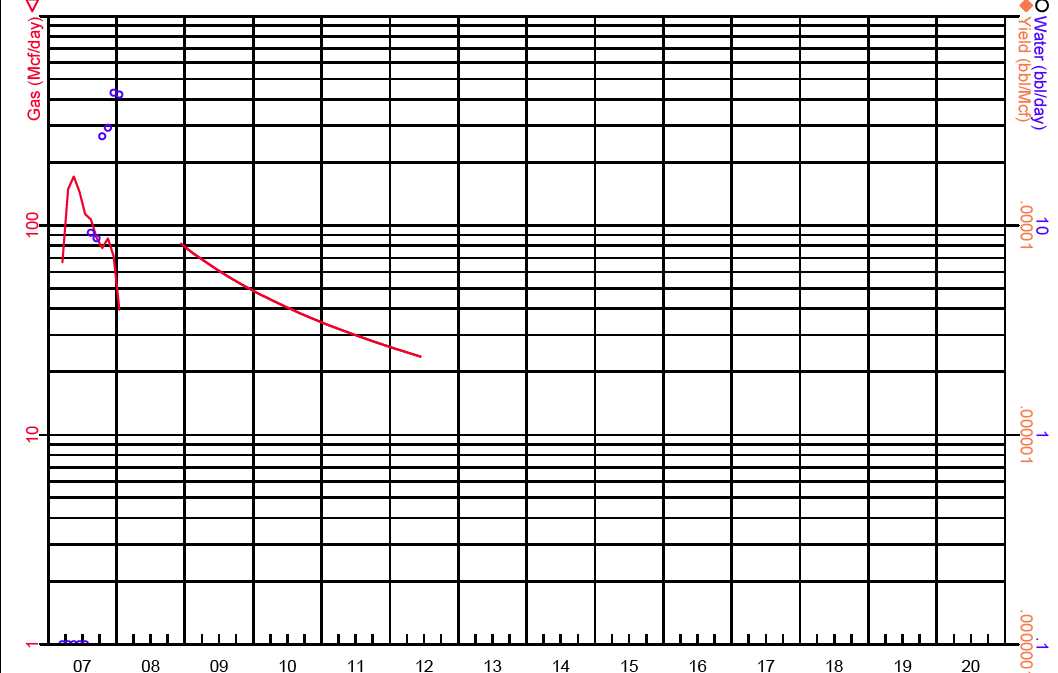
| Gas Rem: 54.23 MMcf Oil Rem: 0.00 Mbbl Class & Cat:ProvedNon-Producing |
| Gas Init Qi:2.490MMcf/mo Gas Init Decl: 45 % Gas Bfact: 0.800 |
| CaseName:PP F-52A Well: No. 1 Reservoir:Frio Gas Pool(3,430'Sand) |
| Field:Wakefield Oper: Griffin & Griffin Expl, LLC Location:Sec. 6, T3N - 5W |

| Gas Rem: 35.47 MMcf Oil Rem: 0.00 Mbbl Class & Cat:ProvedNon-Producing |
| Gas Init Qi:4.121MMcf/mo Gas Init Decl: 13 % Gas Bfact: 0.600 |
| CaseName:PP F-12 3rd Offset Well: Reservoir:2,800 Ft. Sand |
| Field:Belmont Oper: Griffin & Griffin Expl, LLC Location:Sec. 41, T2N - 4W |

| Oil Rem:106.98Mbbl Gas Rem: 0.00 MMcf Class & Cat:Proved Undeveloped |
| Oil Init Qi:2.661Mbbl/mo Oil Init Decl: 20 % Oil Bfact: 0.001 |
| CaseName:PP F-12 4th Offset Well: Reservoir:2,800 Ft. Sand |
| Field:Belmont Oper: Griffin & Griffin Expl, LLC Location:Sec. 41, T2N - 4W |

| Oil Rem:106.98Mbbl Gas Rem: 0.00 MMcf Class & Cat:Proved Undeveloped |
| Oil Init Qi:2.661Mbbl/mo Oil Init Decl: 20 % Oil Bfact: 0.001 |
| 12/31/2008 | 3:05:05PM | Economic One-Liners | ||||||||||||||||||||||||||
| Project Name : | 2008 SEC Report | As of Date: | 10/31/2008 | |||||||||||||||||||||||||
| Ownership Group : | Lexaria Corp | |||||||||||||||||||||||||||
| Cash Flow | ||||||||||||||||||||||||||||
| Gross Reserves | Net Reserves | Net Revenue | Expense | |||||||||||||||||||||||||
| Lease Name | Oil | Gas | Oil | Gas | Oil | Gas | Other | & Tax | Invest. | Non-Disc. | Disc. 10% | |||||||||||||||||
| (Mbbl) | (MMcf) | (Mbbl) | (MMcf) | ($) | ($) | ($) | ($) | ($) | ($) | ($) | ||||||||||||||||||
| Risked/UnRisked | ||||||||||||||||||||||||||||
| Proved Rsv Class | ||||||||||||||||||||||||||||
| Producing Rsv Category | ||||||||||||||||||||||||||||
| USA 39-14 - No. 1 | 0.00 | 55.08 | 0.00 | 14.87 | 0.00 | 91,764.44 | 0.00 | 55,214.15 | 2,304.00 | 34,246.29 | 32,067.79 | |||||||||||||||||
| USA 1-37 - No. 1 | 0.00 | 123.06 | 0.00 | 33.23 | 0.00 | 205,012.32 | 0.00 | 178,958.78 | 2,289.60 | 23,763.93 | 21,949.71 | |||||||||||||||||
| 0.00 | 178.15 | 0.00 | 48.10 | 0.00 | 296,776.75 | 0.00 | 234,172.93 | 4,593.60 | 58,010.22 | 54,017.51 | ||||||||||||||||||
| Proved Rsv Class | ||||||||||||||||||||||||||||
| Non-Producing Rsv Category | ||||||||||||||||||||||||||||
| Faust - No. 1 | 0.00 | 177.24 | 0.00 | 47.85 | 0.00 | 295,259.12 | 0.00 | 107,590.11 | 111,960.00 | 75,709.01 | 52,955.48 | |||||||||||||||||
| BR F-33 - No. 1 | 0.00 | 56.46 | 0.00 | 15.24 | 0.00 | 94,051.72 | 0.00 | 39,355.62 | 3,960.00 | 50,736.09 | 46,176.43 | |||||||||||||||||
| 0.00 | 233.69 | 0.00 | 63.10 | 0.00 | 389,310.83 | 0.00 | 146,945.73 | 115,920.00 | 126,445.10 | 99,131.91 | ||||||||||||||||||
| Proved Rsv Class | 0.00 | 411.84 | 0.00 | 111.20 | 0.00 | 686,087.59 | 0.00 | 381,118.66 | 120,513.60 | 184,455.33 | 153,149.42 | |||||||||||||||||
| TRC Gross Eco One Liner3.rpt |
| 1 |
| Date :12/31/2008 | 3:05:57PM | ECONOMIC PROJECTION | ||||||||||||||||||||||
| As Of Date : | 10/31/2008 | Case : | USA 39-14 - No. 1 | |||||||||||||||||||||
| Project Name : | 2008 SEC Report | Reserve Cat. : | Proved Producing | |||||||||||||||||||||
| Discount Rate (%) : | 10.00 | |||||||||||||||||||||||
| Partner : | Lexaria Corp | Field : | Beaver Creek, W. | |||||||||||||||||||||
| Custom Selection | ||||||||||||||||||||||||
| Case Type : | LEASE CASE | Operator : | Griffin & Griffin Expl, LLC | |||||||||||||||||||||
| Archive Set : | default | Reservoir : | Frio Gas Pool ( 2,850 Ft. Sand) | |||||||||||||||||||||
| Co., State : | Wilkinson, MS | |||||||||||||||||||||||
| Cum Oil (Mbbl) : | 0.00 | |||||||||||||||||||||||
| Cum Gas (MMcf) : | 66.64 | |||||||||||||||||||||||
| Gross | Gross | Net | Net | Oil | Gas | Oil | Gas | Misc. | ||||||||||||||||
| Year | Oil | Gas | Oil | Gas | Price | Price | Revenue | Revenue | Revenue | |||||||||||||||
| (Mbbl) | (MMcf) | (Mbbl) | (MMcf) | ($/bbl) | ($/Mcf) | ($) | ($) | ($) | ||||||||||||||||
| 2008 | 0.00 | 6.28 | 0.00 | 1.69 | 0.00 | 6.17 | 0.00 | 10,457.21 | 0.00 | |||||||||||||||
| 2009 | 0.00 | 33.47 | 0.00 | 9.04 | 0.00 | 6.17 | 0.00 | 55,764.32 | 0.00 | |||||||||||||||
| 2010 | 0.00 | 15.33 | 0.00 | 4.14 | 0.00 | 6.17 | 0.00 | 25,542.90 | 0.00 | |||||||||||||||
| Rem | 0.00 | 0.00 | 0.00 | 0.00 | 0.00 | 0.00 | 0.00 | 0.00 | 0.00 | |||||||||||||||||
| Total | 0.00 | 55.08 | 0.00 | 14.87 | 0.00 | 6.17 | 0.00 | 91,764.44 | 0.00 | |||||||||||||||||
| Ult | 0.00 | 121.72 | ||||||||||||||||||||||||
| Well | Net Tax | Net Tax | Net | Net | Net | Other | Net | Annual | Cum Disc. | |||||||||||||||||
| Year | Count | Production | AdValorem | Investment | Lease Costs | Well Costs | Costs | Profits | Cash Flow | Cash Flow | ||||||||||||||||
| ($) | ($) | ($) | ($) | ($) | ($) | ($) | ($) | ($) | ||||||||||||||||||
| 2008 | 1.00 | 635.91 | 209.14 | 0.00 | 0.00 | 4,822.79 | 0.00 | 0.00 | 4,789.37 | 4,750.51 | ||||||||||||||||
| 2009 | 1.00 | 3,391.05 | 1,115.29 | 0.00 | 0.00 | 28,477.44 | 0.00 | 0.00 | 22,780.55 | 26,186.74 | ||||||||||||||||
| 2010 | 0.00 | 1,553.27 | 510.86 | 2,304.00 | 0.00 | 14,498.39 | 0.00 | 0.00 | 6,676.37 | 32,067.79 | ||||||||||||||||
| Rem. | 0.00 | 0.00 | 0.00 | 0.00 | 0.00 | 0.00 | 0.00 | 0.00 | 0.00 | |||||||||||||
| Total | 5,580.23 | 1,835.29 | 2,304.00 | 0.00 | 47,798.63 | 0.00 | 0.00 | 34,246.29 | 32,067.79 | |||||||||||||
| Major Phase : | Gas | Abandonment Date : | 07/07/2010 | |||||||||||||||||||
| Perfs : | 0 - 0 | Working Int : | 0.36000000 | Present Worth Profile ($) | ||||||||||||||||||
| Initial Rate : | 3,127.54 | Mcf/month | Revenue Int : | 0.27000000 | PW | 5.00% : | 33,106.21 | |||||||||||||||
| Abandonment : | 2,378.19 | Mcf/month | Disc. Initial Invest. ($) : | 1,962.39 | PW | 8.00% : | 32,471.87 | |||||||||||||||
| Initial Decline : | 16.66 | % year | b = 0.800 | ROInvestment (disc/undisc) : | 17.35 / 15.86 | PW | 10.00% : | 32,067.79 | ||||||||||||||
| Beg Ratio : | 0.000 | Years to Payout : | 0.08 | PW | 12.00% : | 31,677.82 | ||||||||||||||||
| End Ratio : | 0.000 | Internal ROR (%) : | 1,000.00 | PW | 15.00% : | 31,117.69 | ||||||||||||||||
| PW | 20.00% : | 30,244.79 | ||||||||||||||||||||
| TRC Eco Detailed.rpt | 1 | |||||||||||||||||||||
| Date :12/31/2008 3:05:57PM | ECONOMIC PROJECTION | |||||||||||||||||||||||
| As Of Date : | 10/31/2008 | Case : | USA 1-37 - No. 1 | |||||||||||||||||||||
| Project Name : | 2008 SEC Report | Reserve Cat. : | Proved Producing | |||||||||||||||||||||
| Discount Rate (%) : | 10.00 | |||||||||||||||||||||||
| Partner : | Lexaria Corp | Field : | Dry Creek, S. | |||||||||||||||||||||
| Custom Selection | ||||||||||||||||||||||||
| Case Type : | LEASE CASE | Operator : | Griffin & Griffin Expl, LLC | |||||||||||||||||||||
| Archive Set : | default | Reservoir : | Frio Gas Pool ( 2,650 Ft. Sand) | |||||||||||||||||||||
| Co., State : | Wilkinson, MS | |||||||||||||||||||||||
| Cum Oil (Mbbl) : | 0.00 | |||||||||||||||||||||||
| Cum Gas (MMcf) : | 45.14 | |||||||||||||||||||||||
| Gross | Gross | Net | Net | Oil | Gas | Oil | Gas | Misc. | ||||||||||||||||
| Year | Oil | Gas | Oil | Gas | Price | Price | Revenue | Revenue | Revenue | |||||||||||||||
| (Mbbl) | (MMcf) | (Mbbl) | (MMcf) | ($/bbl) | ($/Mcf) | ($) | ($) | ($) | ||||||||||||||||
| 2008 | 0.00 | 8.78 | 0.00 | 2.37 | 0.00 | 6.17 | 0.00 | 14,621.13 | 0.00 | |||||||||||||||
| 2009 | 0.00 | 49.15 | 0.00 | 13.27 | 0.00 | 6.17 | 0.00 | 81,885.54 | 0.00 | |||||||||||||||
| 2010 | 0.00 | 45.28 | 0.00 | 12.23 | 0.00 | 6.17 | 0.00 | 75,429.36 | 0.00 | |||||||||||||||
| 2011 | 0.00 | 19.85 | 0.00 | 5.36 | 0.00 | 6.17 | 0.00 | 33,076.29 | 0.00 | |||||||||||||||
| Rem | 0.00 | 0.00 | 0.00 | 0.00 | 0.00 | 0.00 | 0.00 | 0.00 | 0.00 | |||||||||||||||||
| Total | 0.00 | 123.06 | 0.00 | 33.23 | 0.00 | 6.17 | 0.00 | 205,012.32 | 0.00 | |||||||||||||||||
| Ult | 0.00 | 168.20 | ||||||||||||||||||||||||
| Well | Net Tax | Net Tax | Net | Net | Net | Other | Net | Annual | Cum Disc. | |||||||||||||||||
| Year | Count | Production | AdValorem | Investment | Lease Costs | Well Costs | Costs | Profits | Cash Flow | Cash Flow | ||||||||||||||||
| ($) | ($) | ($) | ($) | ($) | ($) | ($) | ($) | ($) | ||||||||||||||||||
| 2008 | 1.00 | 889.12 | 292.42 | 0.00 | 0.00 | 10,467.19 | 0.00 | 0.00 | 2,972.40 | 2,947.81 | ||||||||||||||||
| 2009 | 1.00 | 4,979.49 | 1,637.71 | 0.00 | 0.00 | 61,806.24 | 0.00 | 0.00 | 13,462.10 | 15,616.73 | ||||||||||||||||
| 2010 | 1.00 | 4,586.89 | 1,508.59 | 0.00 | 0.00 | 61,806.24 | 0.00 | 0.00 | 7,527.65 | 22,065.43 | ||||||||||||||||
| 2011 | 0.00 | 2,011.38 | 661.53 | 2,289.60 | 0.00 | 28,312.00 | 0.00 | 0.00 | -198.22 | 21,949.71 | ||||||||||||||||
| Rem. | 0.00 | 0.00 | 0.00 | 0.00 | 0.00 | 0.00 | 0.00 | 0.00 | 0.00 | |||||||||||||
| Total | 12,466.88 | 4,100.25 | 2,289.60 | 0.00 | 162,391.66 | 0.00 | 0.00 | 23,763.93 | 21,949.71 | |||||||||||||
| Major Phase : | Gas | Abandonment Date : | 06/18/2011 | |||||||||||||||||||
| Perfs : | 0 - 0 | Working Int : | 0.36000000 | Present Worth Profile ($) | ||||||||||||||||||
| Initial Rate : | 4,370.00 | Mcf/month | Revenue Int : | 0.27000000 | PW | 5.00% : | 22,810.29 | |||||||||||||||
| Abandonment : | 3,503.63 | Mcf/month | Disc. Initial Invest. ($) : | 1,781.77 | PW | 8.00% : | 22,283.66 | |||||||||||||||
| Initial Decline : | 8.51 | % year | b = 0.800 | ROInvestment (disc/undisc) : | 13.32 / 11.38 | PW | 10.00% : | 21,949.71 | ||||||||||||||
| Beg Ratio : | 0.000 | Years to Payout : | 0.13 | PW | 12.00% : | 21,628.58 | ||||||||||||||||
| End Ratio : | 0.000 | Internal ROR (%) : | 1,000.00 | PW | 15.00% : | 21,169.34 | ||||||||||||||||
| PW | 20.00% : | 20,458.54 | ||||||||||||||||||||
| TRC Eco Detailed.rpt | 2 | |||||||||||||||||||||
| Date :12/31/2008 | 3:05:57PM | ECONOMIC SUMMARY PROJECTION | ||||||||||||||||||
| Proved Rsv Class | ||||||||||||||||||||
| Project Name : | 2008 SEC Report | As Of Date : | 10/31/2008 | Producing Rsv Category | ||||||||||||||||
| Partner : | Lexaria Corp | Discount Rate (%) : | 10.00 | |||||||||||||||||
| Case Type : | REPORT BREAK TOTAL CASE | Custom Selection | ||||||||||||||||||
| Cum Oil (Mbbl) : | 0.00 | |||||||||||||||||||
| Cum Gas (MMcf) : | 111.77 | |||||||||||||||||||
| Gross | Gross | Net | Net | Oil | Gas | Oil | Gas | Misc. | ||||||||||||
| Year | Oil | Gas | Oil | Gas | Price | Price | Revenue | Revenue | Revenue | |||||||||||
| (Mbbl) | (MMcf) | (Mbbl) | (MMcf) | ($/bbl) | ($/Mcf) | ($) | ($) | ($) | ||||||||||||
| 2008 | 0.00 | 15.05 | 0.00 | 4.06 | 0.00 | 6.17 | 0.00 | 25,078.34 | 0.00 | |||||||||||
| 2009 | 0.00 | 82.63 | 0.00 | 22.31 | 0.00 | 6.17 | 0.00 | 137,649.87 | 0.00 | |||||||||||
| 2010 | 0.00 | 60.61 | 0.00 | 16.37 | 0.00 | 6.17 | 0.00 | 100,972.26 | 0.00 | |||||||||||
| 2011 | 0.00 | 19.85 | 0.00 | 5.36 | 0.00 | 6.17 | 0.00 | 33,076.29 | 0.00 | |||||||||||
| Rem | 0.00 | 0.00 | 0.00 | 0.00 | 0.00 | 0.00 | 0.00 | 0.00 | 0.00 | |||||||||||||||||
| Total | 0.00 | 178.15 | 0.00 | 48.10 | 0.00 | 6.17 | 0.00 | 296,776.75 | 0.00 | |||||||||||||||||
| Ult | 0.00 | 289.92 | ||||||||||||||||||||||||
| Well | Net Tax | Net Tax | Net | Net | Net | Other | Net | Annual | Cum Disc. | |||||||||||||||||
| Year | Count | Production | AdValorem | Investment | Lease Costs | Well Costs | Costs | Profits | Cash Flow | Cash Flow | ||||||||||||||||
| ($) | ($) | ($) | ($) | ($) | ($) | ($) | ($) | ($) | ||||||||||||||||||
| 2008 | 2.00 | 1,525.02 | 501.57 | 0.00 | 0.00 | 15,289.98 | 0.00 | 0.00 | 7,761.77 | 7,698.32 | ||||||||||||||||
| 2009 | 2.00 | 8,370.54 | 2,753.00 | 0.00 | 0.00 | 90,283.68 | 0.00 | 0.00 | 36,242.65 | 41,803.46 | ||||||||||||||||
| 2010 | 1.00 | 6,140.16 | 2,019.45 | 2,304.00 | 0.00 | 76,304.63 | 0.00 | 0.00 | 14,204.02 | 54,133.22 | ||||||||||||||||
| 2011 | 0.00 | 2,011.38 | 661.53 | 2,289.60 | 0.00 | 28,312.00 | 0.00 | 0.00 | -198.22 | 54,017.51 | ||||||||||||||||
| Rem. | 0.00 | 0.00 | 0.00 | 0.00 | 0.00 | 0.00 | 0.00 | 0.00 | 0.00 | |||||||||||
| Total | 18,047.10 | 5,935.54 | 4,593.60 | 0.00 | 210,190.29 | 0.00 | 0.00 | 58,010.22 | 54,017.51 | |||||||||||
| Present Worth Profile ($) | ||||||||||||||||||||
| PW | 5.00% : | 55,916.51 | ||||||||||||||||||
| Disc. Initial Invest. ($) : | 3,744.17 | PW | 8.00% : | 54,755.53 | ||||||||||||||||
| ROInvestment (disc/undisc) : | 15.43 / 13.63 | PW | 10.00% : | 54,017.51 | ||||||||||||||||
| Years to Payout : | 0.10 | PW | 12.00% : | 53,306.40 | ||||||||||||||||
| Internal ROR (%) : | 1,000.00 | PW | 15.00% : | 52,287.03 | ||||||||||||||||
| PW | 20.00% : | 50,703.33 | ||||||||||||||||||
| TRC Eco Detailed.rpt | 3 | |||||||||||||||||||
| Date :12/31/2008 3:05:57PM | ECONOMIC PROJECTION | |||||||||||||||||||||||
| As Of Date : | 10/31/2008 | Case : | Faust - No. 1 | |||||||||||||||||||||
| Project Name : | 2008 SEC Report | Reserve Cat. : | Proved Non-Producing | |||||||||||||||||||||
| Discount Rate (%) : | 10.00 | |||||||||||||||||||||||
| Partner : | Lexaria Corp | Field : | Tunica Bayou | |||||||||||||||||||||
| Custom Selection | ||||||||||||||||||||||||
| Case Type : | LEASE CASE | Operator : | Griffin & Griffin Expl, LLC | |||||||||||||||||||||
| Archive Set : | default | Reservoir : | Frio Gas Pool (2,350 Ft. Sand) | |||||||||||||||||||||
| Co., State : | Feliciana, W., LA | |||||||||||||||||||||||
| Cum Oil (Mbbl) : | 0.00 | |||||||||||||||||||||||
| Cum Gas (MMcf) : | 0.00 | |||||||||||||||||||||||
| Gross | Gross | Net | Net | Oil | Gas | Oil | Gas | Misc. | ||||||||||||||||
| Year | Oil | Gas | Oil | Gas | Price | Price | Revenue | Revenue | Revenue | |||||||||||||||
| (Mbbl) | (MMcf) | (Mbbl) | (MMcf) | ($/bbl) | ($/Mcf) | ($) | ($) | ($) | ||||||||||||||||
| 2008 | 0.00 | 0.00 | 0.00 | 0.00 | 0.00 | 0.00 | 0.00 | 0.00 | 0.00 | |||||||||||||||
| 2009 | 0.00 | 41.32 | 0.00 | 11.16 | 0.00 | 6.17 | 0.00 | 68,838.46 | 0.00 | |||||||||||||||
| 2010 | 0.00 | 67.01 | 0.00 | 18.09 | 0.00 | 6.17 | 0.00 | 111,636.66 | 0.00 | |||||||||||||||
| 2011 | 0.00 | 58.12 | 0.00 | 15.69 | 0.00 | 6.17 | 0.00 | 96,815.27 | 0.00 | |||||||||||||||
| 2012 | 0.00 | 10.79 | 0.00 | 2.91 | 0.00 | 6.17 | 0.00 | 17,968.73 | 0.00 | |||||||||||||||
| Rem | 0.00 | 0.00 | 0.00 | 0.00 | 0.00 | 0.00 | 0.00 | 0.00 | 0.00 | |||||||||||||||||
| Total | 0.00 | 177.24 | 0.00 | 47.85 | 0.00 | 6.17 | 0.00 | 295,259.12 | 0.00 | |||||||||||||||||
| Ult | 0.00 | 177.24 | ||||||||||||||||||||||||
| Well | Net Tax | Net Tax | Net | Net | Net | Other | Net | Annual | Cum Disc. | |||||||||||||||||
| Year | Count | Production | AdValorem | Investment | Lease Costs | Well Costs | Costs | Profits | Cash Flow | Cash Flow | ||||||||||||||||
| ($) | ($) | ($) | ($) | ($) | ($) | ($) | ($) | ($) | ||||||||||||||||||
| 2008 | 0.00 | 0.00 | 0.00 | 0.00 | 0.00 | 0.00 | 0.00 | 0.00 | 0.00 | 0.00 | ||||||||||||||||
| 2009 | 1.00 | 3,001.22 | 0.00 | 108,000.00 | 0.00 | 18,816.00 | 0.00 | 0.00 | -60,978.76 | -58,589.37 | ||||||||||||||||
| 2010 | 1.00 | 4,867.14 | 0.00 | 0.00 | 0.00 | 34,560.00 | 0.00 | 0.00 | 72,209.52 | 3,121.10 | ||||||||||||||||
| 2011 | 1.00 | 4,220.96 | 0.00 | 0.00 | 0.00 | 34,560.00 | 0.00 | 0.00 | 58,034.31 | 48,209.77 | ||||||||||||||||
| 2012 | 1.00 | 783.40 | 0.00 | 3,960.00 | 0.00 | 6,781.39 | 0.00 | 0.00 | 6,443.94 | 52,955.48 | ||||||||||||||||
| Rem. | 0.00 | 0.00 | 0.00 | 0.00 | 0.00 | 0.00 | 0.00 | 0.00 | 0.00 | |||||||||||||
| Total | 12,872.72 | 0.00 | 111,960.00 | 0.00 | 94,717.39 | 0.00 | 0.00 | 75,709.01 | 52,955.48 | |||||||||||||
| Major Phase : | Gas | Abandonment Date : | 03/13/2012 | |||||||||||||||||||
| Perfs : | 0 - 0 | Working Int : | 0.36000000 | Present Worth Profile ($) | ||||||||||||||||||
| Initial Rate : | 6,570.00 | Mcf/month | Revenue Int : | 0.27000000 | PW | 5.00% : | 63,376.75 | |||||||||||||||
| Abandonment : | 4,410.65 | Mcf/month | Disc. Initial Invest. ($) : | 104,661.24 | PW | 8.00% : | 56,919.88 | |||||||||||||||
| Initial Decline : | 15.11 | % year | b = 0.600 | ROInvestment (disc/undisc) : | 1.51 / 1.68 | PW | 10.00% : | 52,955.48 | ||||||||||||||
| Beg Ratio : | 0.000 | Years to Payout : | 2.06 | PW | 12.00% : | 49,238.10 | ||||||||||||||||
| End Ratio : | 0.000 | Internal ROR (%) : | 64.79 | PW | 15.00% : | 44,083.65 | ||||||||||||||||
| PW | 20.00% : | 36,480.23 | ||||||||||||||||||||
| TRC Eco Detailed.rpt | 4 | |||||||||||||||||||||
| Date :12/31/2008 | 3:05:57PM | ECONOMIC PROJECTION | ||||||||||||||||||||||
| As Of Date : | 10/31/2008 | Case : | BR F-33 - No. 1 | |||||||||||||||||||||
| Project Name : | 2008 SEC Report | Reserve Cat. : | Proved Non-Producing | |||||||||||||||||||||
| Discount Rate (%) : | 10.00 | |||||||||||||||||||||||
| Partner : | Lexaria Corp | Field : | Ford's Creek, E. | |||||||||||||||||||||
| Custom Selection | ||||||||||||||||||||||||
| Case Type : | LEASE CASE | Operator : | Griffin & Griffin Expl, LLC | |||||||||||||||||||||
| Archive Set : | default | Reservoir : | Frio Gas Pool (2,500 Ft. Sand) | |||||||||||||||||||||
| Co., State : | Wilkinson, MS | |||||||||||||||||||||||
| Cum Oil (Mbbl) : | 0.00 | |||||||||||||||||||||||
| Cum Gas (MMcf) : | 69.09 | |||||||||||||||||||||||
| Gross | Gross | Net | Net | Oil | Gas | Oil | Gas | Misc. | ||||||||||||||||
| Year | Oil | Gas | Oil | Gas | Price | Price | Revenue | Revenue | Revenue | |||||||||||||||
| (Mbbl) | (MMcf) | (Mbbl) | (MMcf) | ($/bbl) | ($/Mcf) | ($) | ($) | ($) | ||||||||||||||||
| 2008 | 0.00 | 0.09 | 0.00 | 0.02 | 0.00 | 6.17 | 0.00 | 152.30 | 0.00 | |||||||||||||||
| 2009 | 0.00 | 38.50 | 0.00 | 10.40 | 0.00 | 6.17 | 0.00 | 64,141.08 | 0.00 | |||||||||||||||
| 2010 | 0.00 | 17.86 | 0.00 | 4.82 | 0.00 | 6.17 | 0.00 | 29,758.34 | 0.00 | |||||||||||||||
| Rem | 0.00 | 0.00 | 0.00 | 0.00 | 0.00 | 0.00 | 0.00 | 0.00 | 0.00 | |||||||||||||||||
| Total | 0.00 | 56.46 | 0.00 | 15.24 | 0.00 | 6.17 | 0.00 | 94,051.72 | 0.00 | |||||||||||||||||
| Ult | 0.00 | 125.55 | ||||||||||||||||||||||||
| Well | Net Tax | Net Tax | Net | Net | Net | Other | Net | Annual | Cum Disc. | |||||||||||||||||
| Year | Count | Production | AdValorem | Investment | Lease Costs | Well Costs | Costs | Profits | Cash Flow | Cash Flow | ||||||||||||||||
| ($) | ($) | ($) | ($) | ($) | ($) | ($) | ($) | ($) | ||||||||||||||||||
| 2008 | 1.00 | 0.00 | 0.00 | 0.00 | 0.00 | 0.00 | 0.00 | 0.00 | 152.30 | 152.26 | ||||||||||||||||
| 2009 | 1.00 | 3,900.44 | 0.00 | 1,080.00 | 0.00 | 21,955.92 | 0.00 | 0.00 | 37,204.71 | 34,335.02 | ||||||||||||||||
| 2010 | 0.00 | 1,809.62 | 0.00 | 2,880.00 | 0.00 | 11,689.64 | 0.00 | 0.00 | 13,379.08 | 46,176.43 | ||||||||||||||||
| Rem. | 0.00 | 0.00 | 0.00 | 0.00 | 0.00 | 0.00 | 0.00 | 0.00 | 0.00 | |||||||||||||
| Total | 5,710.06 | 0.00 | 3,960.00 | 0.00 | 33,645.56 | 0.00 | 0.00 | 50,736.09 | 46,176.43 | |||||||||||||
| Major Phase : | Gas | Abandonment Date : | 04/17/2010 | |||||||||||||||||||
| Perfs : | 0 - 0 | Working Int : | 0.36000000 | Present Worth Profile ($) | ||||||||||||||||||
| Initial Rate : | 6,471.07 | Mcf/month | Revenue Int : | 0.27000000 | PW | 5.00% : | 48,345.60 | |||||||||||||||
| Abandonment : | 4,839.65 | Mcf/month | Disc. Initial Invest. ($) : | 3,523.28 | PW | 8.00% : | 47,019.54 | |||||||||||||||
| Initial Decline : | 32.21 | % year | b = 0.800 | ROInvestment (disc/undisc) : | 14.11 / 13.81 | PW | 10.00% : | 46,176.43 | ||||||||||||||
| Beg Ratio : | 0.000 | Years to Payout : | 0.67 | PW | 12.00% : | 45,363.97 | ||||||||||||||||
| End Ratio : | 0.000 | Internal ROR (%) : | 1,000.00 | PW | 15.00% : | 44,199.19 | ||||||||||||||||
| PW | 20.00% : | 42,389.44 | ||||||||||||||||||||
| TRC Eco Detailed.rpt | 5 | |||||||||||||||||||||
| Date :12/31/2008 | 3:05:57PM | ECONOMIC SUMMARY PROJECTION | ||||||||||||||||||
| Proved Rsv Class | ||||||||||||||||||||
| Project Name : | 2008 SEC Report | As Of Date : | 10/31/2008 | Non-Producing Rsv Category | ||||||||||||||||
| Partner : | Lexaria Corp | Discount Rate (%) : | 10.00 | |||||||||||||||||
| Case Type : | REPORT BREAK TOTAL CASE | Custom Selection | ||||||||||||||||||
| Cum Oil (Mbbl) : | 0.00 | |||||||||||||||||||
| Cum Gas (MMcf) : | 69.09 | |||||||||||||||||||
| Gross | Gross | Net | Net | Oil | Gas | Oil | Gas | Misc. | ||||||||||||
| Year | Oil | Gas | Oil | Gas | Price | Price | Revenue | Revenue | Revenue | |||||||||||
| (Mbbl) | (MMcf) | (Mbbl) | (MMcf) | ($/bbl) | ($/Mcf) | ($) | ($) | ($) | ||||||||||||
| 2008 | 0.00 | 0.09 | 0.00 | 0.02 | 0.00 | 6.17 | 0.00 | 152.30 | 0.00 | |||||||||||
| 2009 | 0.00 | 79.82 | 0.00 | 21.55 | 0.00 | 6.17 | 0.00 | 132,979.54 | 0.00 | |||||||||||
| 2010 | 0.00 | 84.88 | 0.00 | 22.92 | 0.00 | 6.17 | 0.00 | 141,395.00 | 0.00 | |||||||||||
| 2011 | 0.00 | 58.12 | 0.00 | 15.69 | 0.00 | 6.17 | 0.00 | 96,815.27 | 0.00 | |||||||||||
| 2012 | 0.00 | 10.79 | 0.00 | 2.91 | 0.00 | 6.17 | 0.00 | 17,968.73 | 0.00 | |||||||||||
| Rem | 0.00 | 0.00 | 0.00 | 0.00 | 0.00 | 0.00 | 0.00 | 0.00 | 0.00 | |||||||||||||||||
| Total | 0.00 | 233.69 | 0.00 | 63.10 | 0.00 | 6.17 | 0.00 | 389,310.83 | 0.00 | |||||||||||||||||
| Ult | 0.00 | 302.79 | ||||||||||||||||||||||||
| Well | Net Tax | Net Tax | Net | Net | Net | Other | Net | Annual | Cum Disc. | |||||||||||||||||
| Year | Count | Production | AdValorem | Investment | Lease Costs | Well Costs | Costs | Profits | Cash Flow | Cash Flow | ||||||||||||||||
| ($) | ($) | ($) | ($) | ($) | ($) | ($) | ($) | ($) | ||||||||||||||||||
| 2008 | 1.00 | 0.00 | 0.00 | 0.00 | 0.00 | 0.00 | 0.00 | 0.00 | 152.30 | 152.26 | ||||||||||||||||
| 2009 | 2.00 | 6,901.67 | 0.00 | 109,080.00 | 0.00 | 40,771.92 | 0.00 | 0.00 | -23,774.04 | -24,254.35 | ||||||||||||||||
| 2010 | 1.00 | 6,676.76 | 0.00 | 2,880.00 | 0.00 | 46,249.64 | 0.00 | 0.00 | 85,588.60 | 49,297.54 | ||||||||||||||||
| 2011 | 1.00 | 4,220.96 | 0.00 | 0.00 | 0.00 | 34,560.00 | 0.00 | 0.00 | 58,034.31 | 94,386.20 | ||||||||||||||||
| 2012 | 1.00 | 783.40 | 0.00 | 3,960.00 | 0.00 | 6,781.39 | 0.00 | 0.00 | 6,443.94 | 99,131.91 | ||||||||||||||||
| Rem. | 0.00 | 0.00 | 0.00 | 0.00 | 0.00 | 0.00 | 0.00 | 0.00 | 0.00 | |||||||||||||
| Total | 18,582.78 | 0.00 | 115,920.00 | 0.00 | 128,362.95 | 0.00 | 0.00 | 126,445.10 | 99,131.91 | |||||||||||||
| Present Worth Profile ($) | ||||||||||||||||||||||
| PW | 5.00% : | 111,722.35 | ||||||||||||||||||||
| Disc. Initial Invest. ($) : | 108,184.52 | PW | 8.00% : | 103,939.42 | ||||||||||||||||||
| ROInvestment (disc/undisc) : | 1.92 / 2.09 | PW | 10.00% : | 99,131.91 | ||||||||||||||||||
| Years to Payout : | 1.40 | PW | 12.00% : | 94,602.08 | ||||||||||||||||||
| Internal ROR (%) : | 171.33 | PW | 15.00% : | 88,282.84 | ||||||||||||||||||
| PW | 20.00% : | 78,869.67 | ||||||||||||||||||||
| TRC Eco Detailed.rpt | 6 | |||||||||||||||||||||
| Date :12/31/2008 | 3:05:57PM | ECONOMIC SUMMARY PROJECTION | ||||||||||||||||||
| Proved Rsv Class | ||||||||||||||||||||
| Project Name : | 2008 SEC Report | As Of Date : | 10/31/2008 | |||||||||||||||||
| Partner : | Lexaria Corp | Discount Rate (%) : | 10.00 | |||||||||||||||||
| Case Type : | REPORT BREAK TOTAL CASE | Custom Selection | ||||||||||||||||||
| Cum Oil (Mbbl) : | 0.00 | |||||||||||||||||||
| Cum Gas (MMcf) : | 180.86 | |||||||||||||||||||
| Gross | Gross | Net | Net | Oil | Gas | Oil | Gas | Misc. | ||||||||||||
| Year | Oil | Gas | Oil | Gas | Price | Price | Revenue | Revenue | Revenue | |||||||||||
| (Mbbl) | (MMcf) | (Mbbl) | (MMcf) | ($/bbl) | ($/Mcf) | ($) | ($) | ($) | ||||||||||||
| 2008 | 0.00 | 15.15 | 0.00 | 4.09 | 0.00 | 6.17 | 0.00 | 25,230.64 | 0.00 | |||||||||||
| 2009 | 0.00 | 162.45 | 0.00 | 43.86 | 0.00 | 6.17 | 0.00 | 270,629.41 | 0.00 | |||||||||||
| 2010 | 0.00 | 145.49 | 0.00 | 39.28 | 0.00 | 6.17 | 0.00 | 242,367.26 | 0.00 | |||||||||||
| 2011 | 0.00 | 77.97 | 0.00 | 21.05 | 0.00 | 6.17 | 0.00 | 129,891.55 | 0.00 | |||||||||||
| 2012 | 0.00 | 10.79 | 0.00 | 2.91 | 0.00 | 6.17 | 0.00 | 17,968.73 | 0.00 | |||||||||||
| Rem | 0.00 | 0.00 | 0.00 | 0.00 | 0.00 | 0.00 | 0.00 | 0.00 | 0.00 | |||||||||||||||||
| Total | 0.00 | 411.84 | 0.00 | 111.20 | 0.00 | 6.17 | 0.00 | 686,087.59 | 0.00 | |||||||||||||||||
| Ult | 0.00 | 592.70 | ||||||||||||||||||||||||
| Well | Net Tax | Net Tax | Net | Net | Net | Other | Net | Annual | Cum Disc. | |||||||||||||||||
| Year | Count | Production | AdValorem | Investment | Lease Costs | Well Costs | Costs | Profits | Cash Flow | Cash Flow | ||||||||||||||||
| ($) | ($) | ($) | ($) | ($) | ($) | ($) | ($) | ($) | ||||||||||||||||||
| 2008 | 3.00 | 1,525.02 | 501.57 | 0.00 | 0.00 | 15,289.98 | 0.00 | 0.00 | 7,914.07 | 7,850.58 | ||||||||||||||||
| 2009 | 4.00 | 15,272.21 | 2,753.00 | 109,080.00 | 0.00 | 131,055.60 | 0.00 | 0.00 | 12,468.61 | 17,549.11 | ||||||||||||||||
| 2010 | 2.00 | 12,816.92 | 2,019.45 | 5,184.00 | 0.00 | 122,554.28 | 0.00 | 0.00 | 99,792.62 | 103,430.76 | ||||||||||||||||
| 2011 | 1.00 | 6,232.34 | 661.53 | 2,289.60 | 0.00 | 62,872.00 | 0.00 | 0.00 | 57,836.09 | 148,403.71 | ||||||||||||||||
| 2012 | 1.00 | 783.40 | 0.00 | 3,960.00 | 0.00 | 6,781.39 | 0.00 | 0.00 | 6,443.94 | 153,149.42 | ||||||||||||||||
| Rem. | 0.00 | 0.00 | 0.00 | 0.00 | 0.00 | 0.00 | 0.00 | 0.00 | 0.00 | |||||||||||||
| Total | 36,629.89 | 5,935.54 | 120,513.60 | 0.00 | 338,553.24 | 0.00 | 0.00 | 184,455.33 | 153,149.42 | |||||||||||||
| Present Worth Profile ($) | ||||||||||||||||||||||
| PW | 5.00% : | 167,638.85 | ||||||||||||||||||||
| Disc. Initial Invest. ($) : | 111,928.69 | PW | 8.00% : | 158,694.95 | ||||||||||||||||||
| ROInvestment (disc/undisc) : | 2.37 / 2.53 | PW | 10.00% : | 153,149.42 | ||||||||||||||||||
| Years to Payout : | 1.12 | PW | 12.00% : | 147,908.47 | ||||||||||||||||||
| Internal ROR (%) : | 1,000.00 | PW | 15.00% : | 140,569.86 | ||||||||||||||||||
| PW | 20.00% : | 129,573.00 | ||||||||||||||||||||
| TRC Eco Detailed.rpt | 7 | |||||||||||||||||||||
| CaseName:USA 39-14 Well: No. 1 Reservoir:Frio Gas Pool ( 2,850 Ft. Sand) |
| Field:Beaver Creek,W. Oper: Griffin & Griffin Expl, LLC Location:Sec. 39, T4N - R1W |
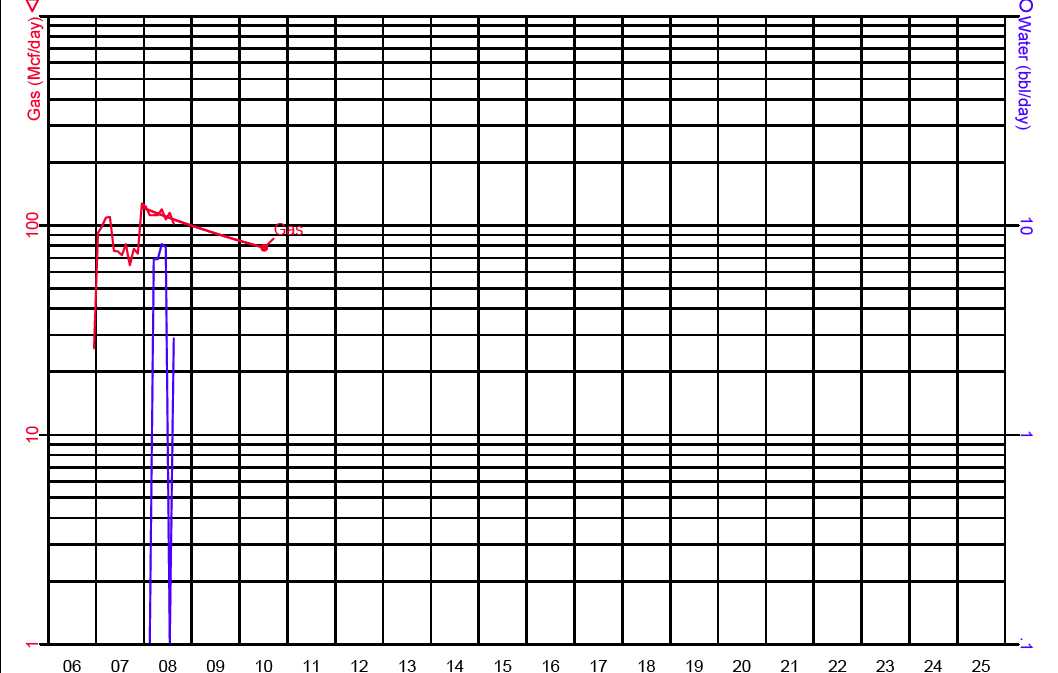
| Gas Rem: 55.08 MMcf Oil Rem: 0.00 Mbbl Class & Cat:Proved Producing |
| Gas Init Qi:3.707MMcf/mo Gas Init Decl: 19 % Gas Bfact: 0.800 |
| CaseName:USA 1-37 Well: No. 1 Reservoir:Frio Gas Pool ( 2,650 Ft. Sand) |
| Field: DryCreek,S. Oper: Griffin & Griffin Expl, LLC Location:Sec. 37, T4N - R1E |
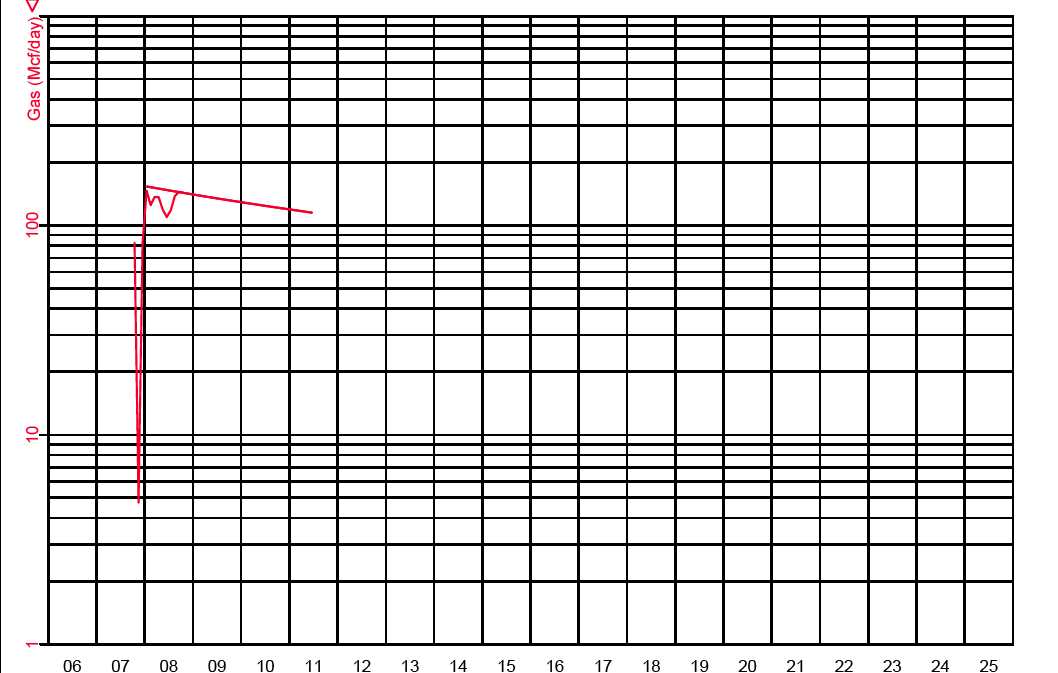
| Gas Rem: 123.06 MMcf | Gas Init Qi: 4.669MMcf/mo | ||
| Oil Rem: 0.00 Mbbl | Gas Init Decl: 9 % | ||
| Class & Cat: Proved Producing | Gas Bfact: 0.800 |
| CaseName:Faust Well: No. 1 Reservoir:Frio Gas Pool (2,350 Ft. Sand) |
| Field:Tunica Bayou Oper: Griffin & Griffin Expl, LLC Location:Sec. 63, T1S - 4W |
![]()
| Gas Rem:177.24MMcf Oil Rem: 0.00 Mbbl Class & Cat:ProvedNon-Producing |
| Gas Init Qi:6.570MMcf/mo Gas Init Decl: 15 % Gas Bfact: 0.600 |
| CaseName:BR F-33 Well: No. 1 Reservoir:Frio Gas Pool (2,500 Ft. Sand) |
| Field: Ford'sCreek,E. Oper: Griffin & Griffin Expl, LLC Location:Sec. 51, T3N - 2W |
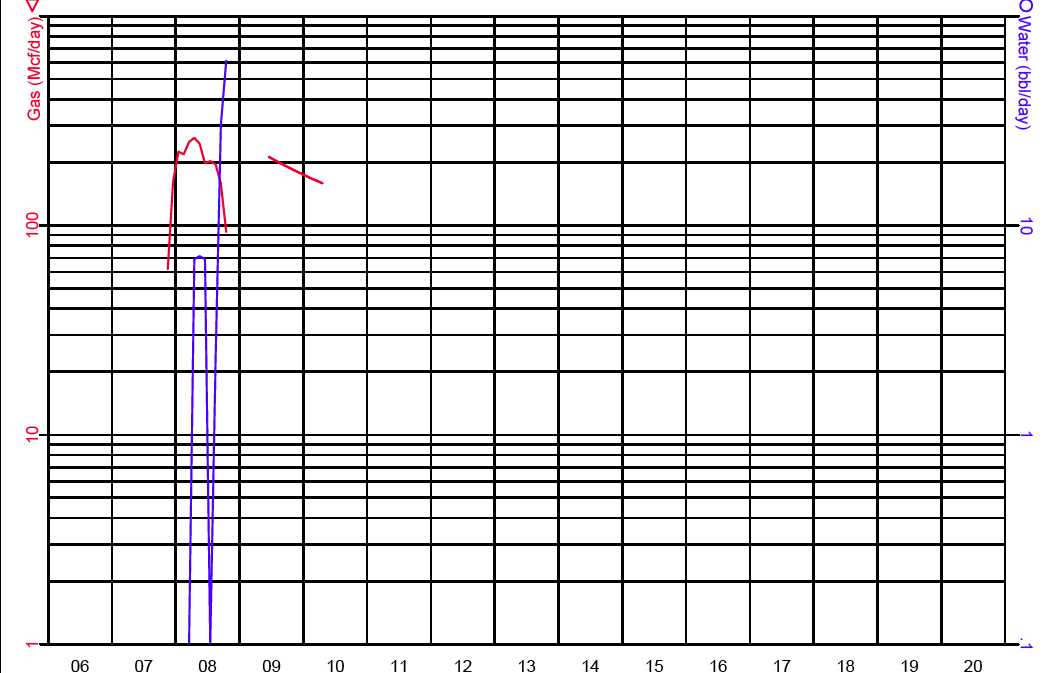
| Gas Rem: 56.46 MMcf Oil Rem: 0.00 Mbbl Class & Cat:ProvedNon-Producing |
| Gas Init Qi:6.471MMcf/mo Gas Init Decl: 32 % Gas Bfact: 0.800 |


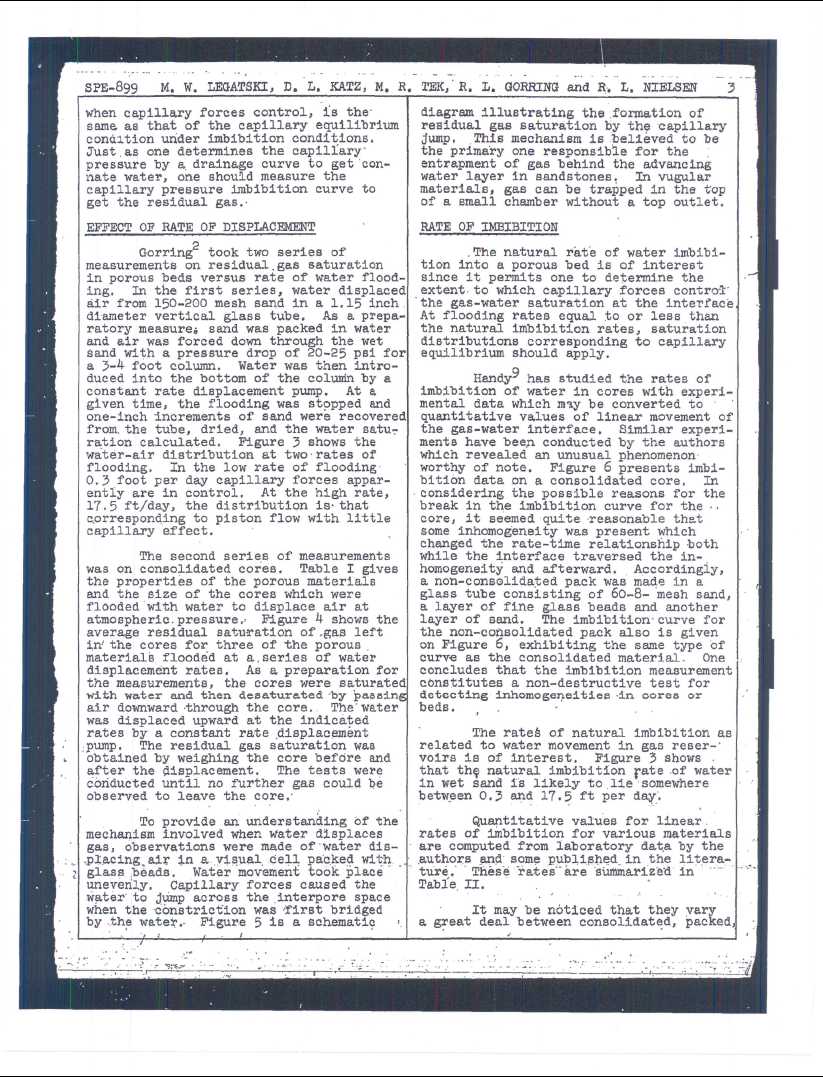
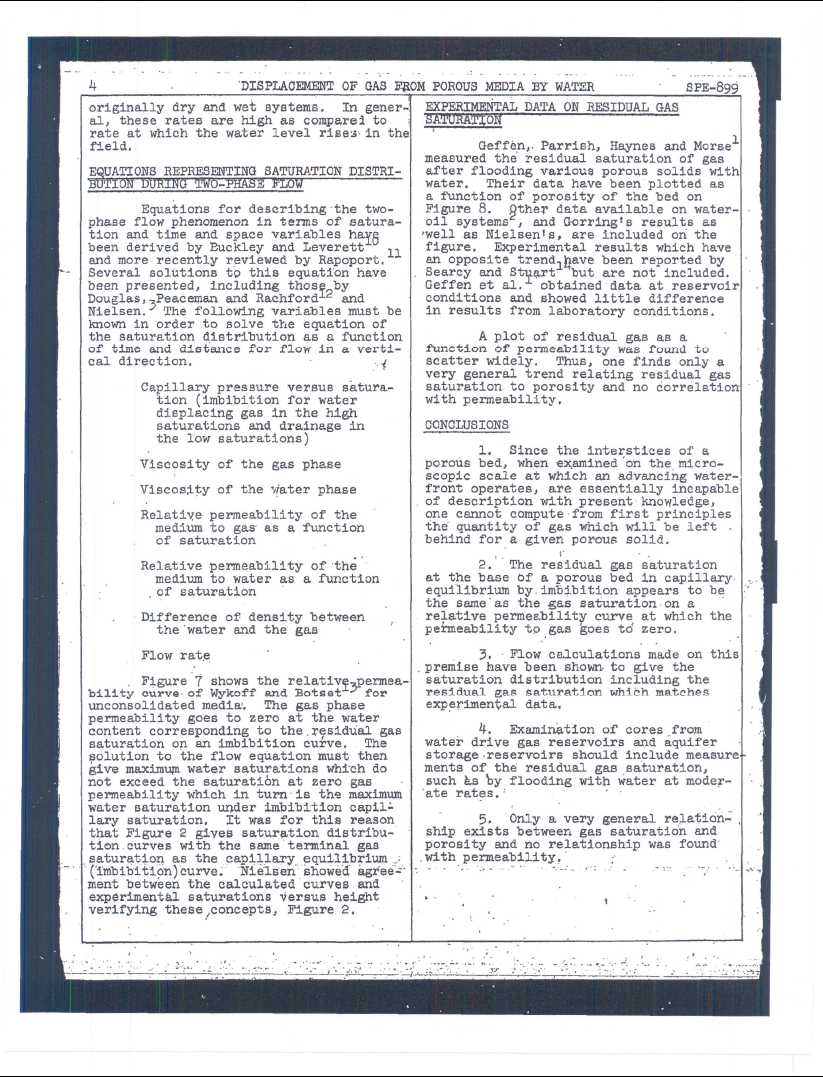
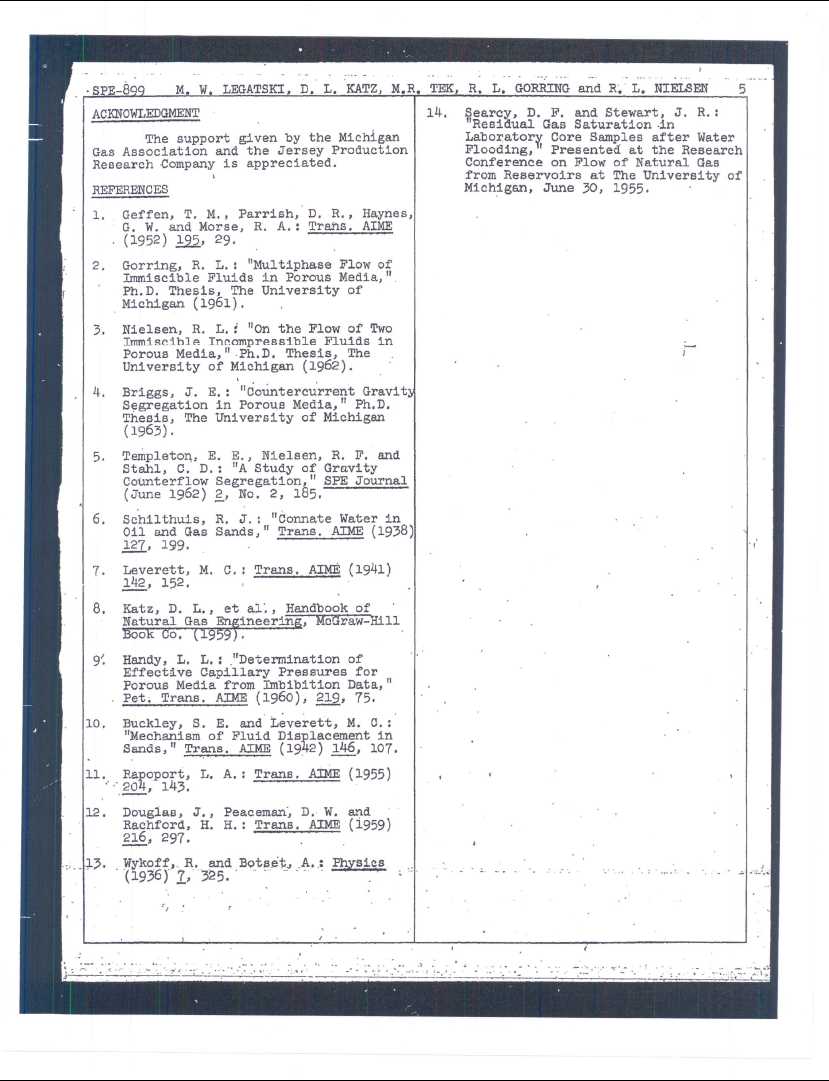

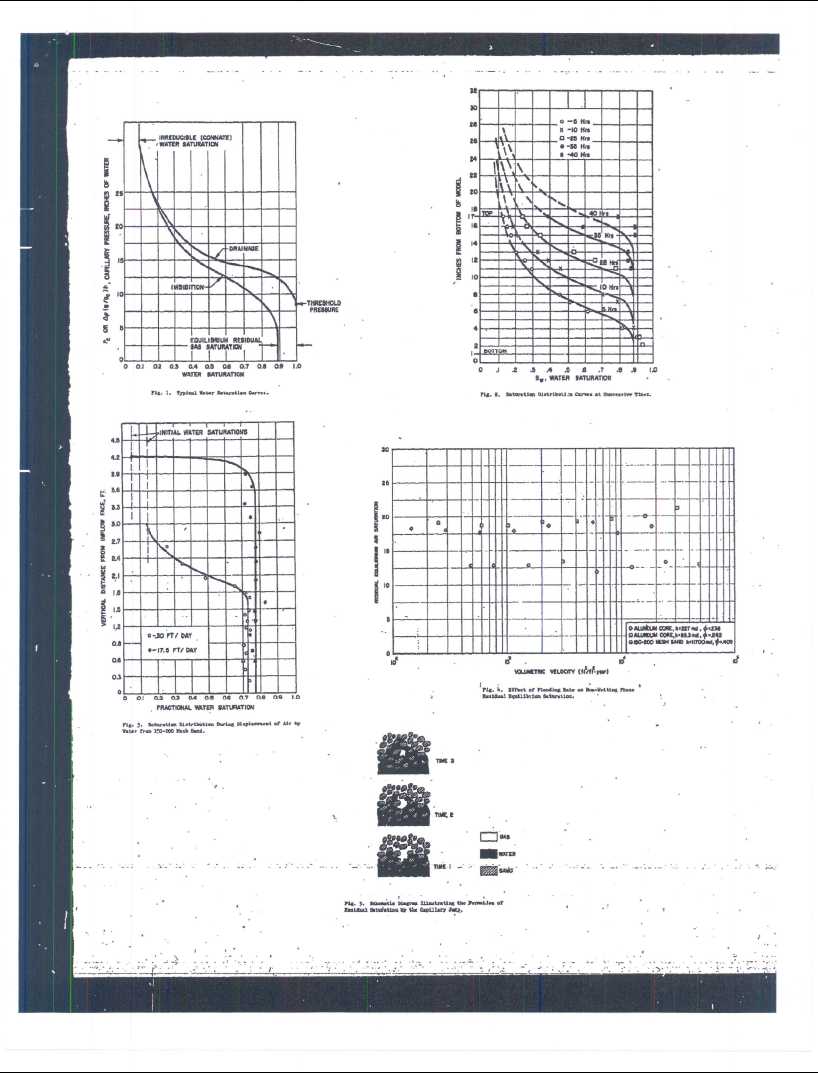
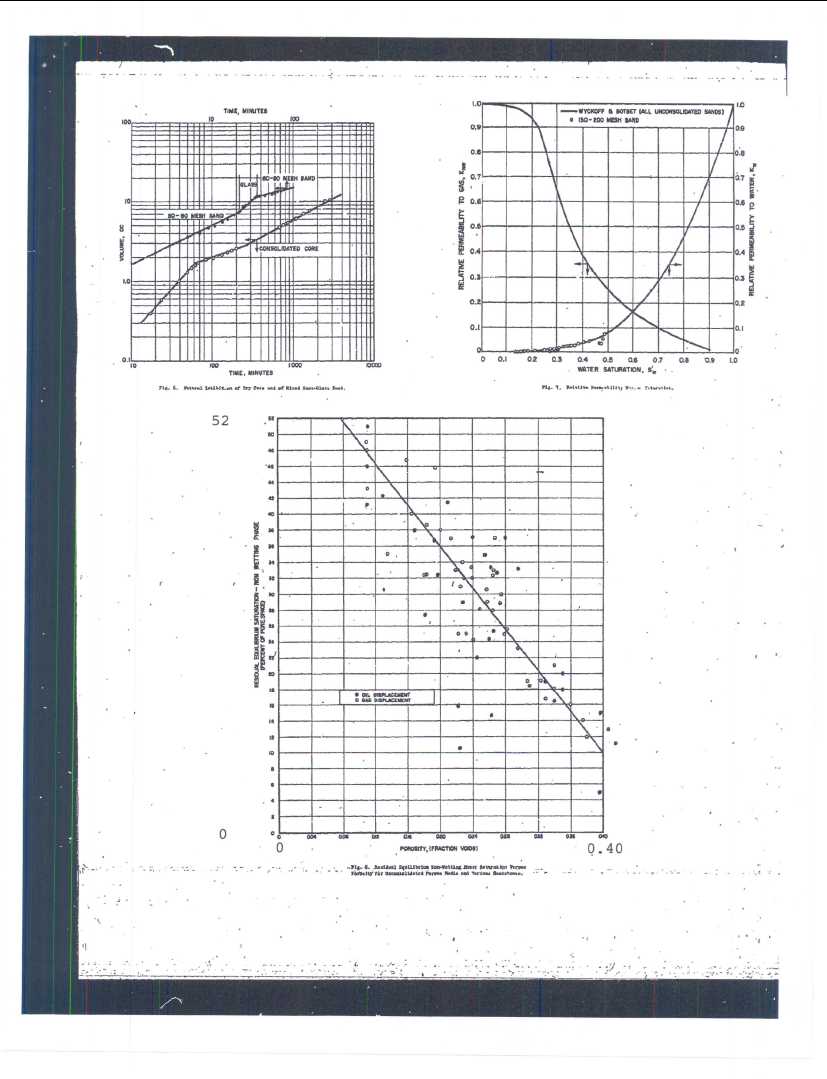
SEC Proved Oil and Gas Reserve Definitions
- Proved Reserves
- Proved Developed Reserves
- Proved Undeveloped Reserves
- Reserve Status Categories - (producing, non-producing, etc)
INTRODUCTION
Financial Accounting and Reporting for Oil and Gas Producing Activities Pursuant to the Federal Securities Laws and the Energy Policy and Conservation Act of 1975
Reg. § 210.4 -10.
This section prescribes financial accounting and reporting standards for registrants with the Commission engaged in oil and gas producing activities in filings under the federal securities laws and for the preparation of accounts by persons engaged, in whole or in part, in the production of crude oil or natural gas in the United States, pursuant to Section 503 of the Energy Policy and Conservation Act of 1975 [42 U.S.C. 6383] ("EPCA") and section 11(c) of the Energy Supply and Environmental Coordination Act of 1974 [IS U.S.C. 796] ("ESECA"), as amended by section 505 of EPCA. The application of this section to those oil and gas producing operations of companies regulated for rate-making purposes on an individual-company-cost-of-service basis may, however, give appropriate recognition to differences arising because of the effect of the rate-making process.
Exemption. Any person exempted by the Department of Energy from any record-keeping or reporting requirements pursuant to Section 11(c) of ESECA, as amended, is similarly exempted from the related provisions of this section in the preparation of accounts pursuant to EPCA. This exemption does not affect the applicability of this section to filings pursuant to the federal securities laws.
Definitions
(a) Definitions. The following definitions apply to the terms listed below as they are used in this section:
(1) Oil and gas producing activities.
(i) Such activities include:
(A) The search for crude oil, including condensate and natural gas liquids, or natural gas ("oil and gas") in their natural states and original locations.
(B) The acquisition of property rights or properties for the purpose of further exploration and/or for the purpose of removing the oil or gas from existing reservoirs on those properties.
(C) The construction, drilling and production activities necessary to retrieve oil and gas from its natural reservoirs, and the acquisition, construction, installation, and maintenance of field gathering and storage systems -including lifting the oil and gas to the surface and gathering, treating, field processing (as in the case of processing gas to extract liquid hydrocarbons) and field storage. For purposes of this section, the oil and gas production function shall normally be regarded as terminating at the outlet valve on the lease or field storage tank; if unusual physical or operational circumstances exist, it may be appropriate to regard the production functions as terminating at the first point at which oil, gas, or gas liquids are delivered to a main pipeline, a common carrier, a refinery, or a marine terminal.
(ii) Oil and gas producing activities do not include:
| (A) | The transporting, refining and marketing of oil and gas. |
| (B) | Activities relating to the production of natural resources other than oil and gas. |
| (C) | The production of geothermal steam or the extraction of hydrocarbons as a by- |
product of the production of geothermal steam or associated geothermal resources as defined in the Geothermal Steam Act of 1970.
(D) The extraction of hydrocarbons from shale, tar sands, or coal.
(2) Proved oil and gas reserves. Proved oil and gas reserves are the estimated quantities of crude oil, natural gas, and natural gas liquids which geological and engineering data demonstrate with reasonable certainty to be recoverable in future years from known reservoirs under existing economic and operating conditions, i.e., prices and costs as of the date the estimate is made. Prices include consideration of changes in existing prices provided only by contractual arrangements, but not on escalations based upon future conditions.
(i) Reservoirs are considered proved if economic producibility is supported by either actual production or conclusive formation test. The area of a reservoir considered proved includes (A) that portion delineated by drilling and defined by gas-oil and/or oil-water contacts, if any; and (B) the immediately adjoining portions not yet drilled, but which can be reasonably judged as economically productive on the basis of available geological and engineering data. In the absence of information on fluid contacts, the lowest known structural occurrence of hydrocarbons controls the lower proved limit of the reservoir.
(ii) Reserves which can be produced economically through application of improved recovery techniques (such as fluid injection) are included in the "proved" classification when successful testing by a pilot project, or the operation of an installed program in the reservoir, provides support for the engineering analysis on which the project or program was based.
(iii) Estimates of proved reserves do not include the following:
(A) oil that may become available from known reservoirs but is classified separately as "indicated additional reserves";
(B) crude oil, natural gas, and natural gas liquids, the recovery of which is subject to reasonable doubt because of uncertainty as to geology, reservoir characteristics, or economic factors;
(C) crude oil, natural gas, and natural gas liquids, that may occur in undrilled prospects; and
(D) crude oil, natural gas, and natural gas liquids, that may be recovered from oil shales, coal, gilsonite and other such sources.
RESERVE STATUS CATEGORIES
(3) Proved developed oil and gas reserves. Proved developed oil and gas reserves are reserves that can be expected to be recovered through existing wells with existing equipment and operating methods. Additional oil and gas expected to be obtained through the application of fluid injection or other improved recovery techniques for supplementing the natural forces and mechanisms of primary recovery should be included as "proved developed reserves" only after testing by a pilot project or after the operation of an installed program has confirmed through production response that increased recovery will be achieved.
(4) Proved undeveloped reserves. Proved undeveloped oil and gas reserves are reserves that are expected to be recovered from new wells on undrilled acreage, or from existing wells where a relatively major expenditure is required for recompletion. Reserves on undrilled acreage shall be limited to those drilling units offsetting productive units that are reasonably certain of production when drilled. Proved reserves for other undrilled units can be claimed only where it can be demonstrated with certainty that there is continuity of production from the existing productive formation. Under no circumstances should estimates, for proved undeveloped reserves be attributable to any acreage for which an application of fluid injection or other improved recovery technique is contemplated, unless such techniques Leave been proved effective by actual tests in the area and in the same reservoir.
(5)Proved properties. Properties with proved reserves.
UNPROVED RESERVES
| (6) | Unproved properties. Properties with no proved reserves. |
| (7) | Proved area. The part of a property to which proved reserves have been specifically |
attributed.
(8)Field. An area consisting of a single reservoir or multiple reservoirs all grouped on or related to the same individual geological structural feature and/or stratigraphic condition.
There may be two or more reservoirs in a field which are separated vertically by intervening impervious strata, or laterally by local geologic barriers, or by both. Reservoirs that are associated by being in overlapping or adjacent fields may be treated as a single or common operational field. The geological terms "structural feature" and "stratigraphic condition" are intended to identify localized geological features as opposed to the broader terms of basins, trends, provinces, plays, areas-of-interest, etc.
(9)Reservoir. A porous and permeable underground formation containing a natural accumulation of producible oil and/or gas that is confined by impermeable rock or water barriers and is individual and separate from other reservoirs.
(10)Exploratory well. A well drilled to find and produce oil or gas in an unproved area, to find a new reservoir in a field previously found to be productive of oil or gas in another reservoir, or to extend a known reservoir. Generally, an exploratory well is any well that is not a development well, a service well, or a stratigraphic test well as those items are defined below.
(11)Development well. A well drilled within the proved area of an oil or gas reservoir to the depth of a stratigraphic horizon known-to be productive.
(12)Service well.A well drilled or completed for the purpose of supporting production in an existing field. Specific purposes of service wells include gas injection, water injection, steam injection, air injection, salt-water disposal, water supply for injection, observation, or injection for in-situ combustion.
(13)Stratigraphic test well. A drilling effort, geologically directed, to obtain information pertaining to a specific geologic condition. Such wells customarily arc drilled without the intention of being completed for hydrocarbon production. This classification also includes tests identified as core tests and all types of expendable holes related to hydrocarbon exploration. Stratigraphic test wells are classified as (i) "exploratory type," if not drilled in a proved area, or (ii) "development type," if drilled in a proved area.
(14)Acquisition of properties. Costs incurred to purchase, lease or otherwise acquire a property, including costs of lease bonuses and options to purchase or lease properties, the portion of costs applicable to minerals when land including mineral rights is purchased in fee, brokers' fees, recording fees, legal costs, and other costs incurred in acquiring properties.
(15)Exploration costs.Costs incurred in identifying areas that may warrant examination and in examining specific areas that are considered to have prospects of containing oil and gas reserves, including costs of drilling exploratory wells and exploratory-type stratigraphic test wells. Exploration costs may be incurred both before acquiring the related property (sometimes referred to in part as prospecting costs) and after acquiring the property. Principal types of exploration costs, which include depreciation and applicable operating costs of support equipment and facilities and other costs of exploration activities, are:
(i) Costs of topographical, geographical and geophysical studies, rights of access to properties to conduct those studies, and salaries and other expenses of geologists, geophysical crews, and others conducting those studies. Collectively, these are sometimes referred to as geological and geophysical or "G&G" costs.
(ii) Costs of carrying and retaining undeveloped properties, such as delay rentals, ad valorem taxes on properties, legal costs for title defense, and the maintenance of land and lease records.
| (iii) | Dry hole contributions and bottom hole contributions. |
| (iv) | Costs of drilling and equipping exploratory wells. |
| (v) | Costs of drilling exploratory-type stratigraphic test wells. |
(16)Development costs. Costs incurred to obtain access to proved reserves and to provide facilities for extracting, treating, gathering and storing the oil and gas. More specifically, development costs, including depreciation and applicable operating costs of support equipment and facilities and other costs of development activities, are costs incurred to:
(i) Gain access to and prepare well locations for drilling, including surveying well locations for the purpose of determining specific development drilling sites, clearing ground, draining, road building, and relocating public roads, gas lines, and power lines, to the extent necessary in developing the proved reserves.
(ii) Drill and equip development wells, development-type stratigraphic test wells, and service wells, including the costs of platforms and of well equipment such as casing, tubing, pumping equipment, and the wellhead assembly.
(iii) Acquire, construct, and install production facilities such as lease flow lines, separators, treaters, heaters, manifolds, measuring devices, and production storage tanks, natural gas cycling and processing plants, and central utility and waste disposal systems.
(iv) Provide improved recovery systems.
(17)Production costs.
(i) Costs incurred to operate and maintain wells and related equipment and facilities, including depreciation and applicable operating costs of support equipment and facilities and other costs of operating and maintaining those wells and related equipment and facilities. They become part of the cost of oil and gas produced. Examples of production costs (sometimes called lifting costs) are:
| (A) | Costs of labor to operate the wells and related equipment and facilities. |
| (B) | Repairs and maintenance. |
(C) Materials, supplies, and fuel consumed and supplies utilized in operating the wells and related equipment and facilities.
(D) Property taxes and insurance applicable to proved properties and wells and related equipment and facilities.
(E) Severance taxes.
(ii) Some support equipment or facilities may serve two or more oil and gas producing activities and may also serve transportation, refining, and marketing activities. To the extent that the support equipment and facilities are used in oil and gas producing activities, their depreciation and applicable operating costs become exploration, development or production costs, as appropriate. Depreciation, depletion, and amortization of capitalized acquisition, exploration, and development costs are not production costs but also become part of the cost of oil and gas produced along with production (lifting) costs identified above.
Successful Efforts Method
(b) A reporting entity that follows the successful efforts method shall comply with the accounting and financial reporting disclosure requirements of Statement of Financial Accounting Standards No. 19, as amended.
Full Cost Method
(c) Application of the full cost method of accounting. A reporting entity that follows the full cost method shall apply that method to all of its operations and to the operations of its subsidiaries, as follows:
(1) Determination of cost centers. Cost centers shall be established-on a country-by-country basis.
(2) Costs to be capitalized. All costs associated with property acquisition, exploration, and development activities (as defined in paragraph (a) of this section) shall be capitalized within the appropriate cost center. Any internal costs that are capitalized shall be limited to those costs that can be directly identified with acquisition, exploration, and development activities undertaken by the reporting entity for its own account, and shall not include any costs related to production, general corporate overhead, or similar activities.
(3) Amortization of capitalized costs. Capitalized costs within a cost center shall be amortized on the unit-of-production basis using proved oil and gas reserves, as follows:
(i) Costs to be amortized shall include (A) all capitalized costs, less accumulated amortization, other than the cost of properties described in paragraph (ii) below; (B) the estimated future expenditures (based on current costs) to be incurred in developing
proved reserves; and (C) estimated dismantlement and abandonment costs, net of estimated salvage values.
(ii) The cost of investments in unproved properties and major development projects may be excluded from capitalized costs to be amortized, subject to the following:
(A) All costs directly associated with the acquisition and evaluation of unproved properties may be excluded from the amortization computation until it is determined whether or not proved reserves can be assigned to the properties, subject to the following conditions: (1) Until such a determination is made, the properties shall be assessed at least annually to ascertain whether impairment has occurred. Unevaluated properties whose costs are individually significant shall be assessed individually. Where it is not practicable to individually assess the amount of impairment of properties for which costs are not individually significant, such properties may be grouped for purposes of assessing impairment. Impairment may be estimated by applying factors based on historical experience and other data such as primary Lease terms of the properties, average holding periods of unproved properties, and geographic and geologic data to groupings of individually insignificant properties and projects. The amount of impairment assessed under either of these methods shall be added to the costs to be amortized. (2) The costs of drilling exploratory dry holes shall be included in the amortization base immediately upon determination that the well is dry. (3) If geological and geophysical costs cannot be directly associated with specific unevaluated properties, they shall be included in the amortization base as incurred. Upon complete evaluation of a property, the total remaining excluded cost (net of any impairment) shall be included in the full cost amortization base.
(B) Certain costs may be excluded from amortization when incurred in connection with major development projects expected to entail significant costs to ascertain the quantities of proved reserves attributable to the properties under development (e.g., the installation of an offshore drilling platform from which development wells are to be drilled, the installation of improved recovery programs, and similar major projects undertaken in the expectation of Significant additions to proved reserves). The amounts which may be excluded are applicable portions of (1) the costs that relate to the major development project and have not previously been included in the amortization base, and (2) the estimated future expenditures associated with the development project. The excluded portion of any common costs associated with the development project should be based, as is most appropriate in the circumstances, on a comparison of either (i) existing proved reserves to total proved reserves expected to be established upon completion of the project, or (ii) the number of wells to which proved reserves have been assigned and total number of wells expected to be drilled. Such costs may be excluded from costs to be amortized until the earlier determination of whether additional reserves are proved or impairment occurs.
(C) Excluded costs and the proved reserves related to such costs shall be transferred into the amortization base on an ongoing (well-by-well or property-by-property) basis as the project is evaluated and proved reserves established or impairment determined. Once proved reserves are established, there is no further justification for continued exclusion
from the full cost amortization base even if other factors prevent immediate production or marketing.
(iii) Amortization shall be computed on the basis of physical units, with oil and gas converted to a common unit of measure on the basis of their approximate relative energy content, unless economic circumstances (related to the effects of regulated prices) indicate that use of units of revenue is a more appropriate basis of computing amortization. In the latter case, amortization shall be computed on the basis of current gross revenues (excluding royalty payments and net profits disbursements) from production in relation to future cross revenues, based on current prices (including consideration of changes in existing prices provided only by contractual arrangements), from estimated production of proved oil and gas reserves. The effect of a significant price increase during the year on estimated future gross revenues shall be reflected in the amortization provision only for the period after the price increase occurs.
(iv) In some cases it may be more appropriate to depreciate natural gas cycling and processing plants by a method other than the unit-of-production method.
(v) Amortization computations shall be made on a consolidated basis, including investees accounted for on a proportionate consolidation basis. Investees accounted for on the equity method shall be treated separately.
(4) Limitation on capitalized costs:
(i) For each cost center, capitalized costs, less accumulated amortization and related deferred income taxes, shall not exceed an amount (the cost center ceiling) equal to the sum of:
(A) the present value of estimated future net revenues computed by applying current prices of oil and gas reserves (with consideration of price changes only to the extent provided by contractual arrangements) to estimated future production of proved oil and gas reserves as of the date of the latest balance sheet presented, less estimated future expenditures (based on current costs) to be incurred in developing and producing the proved reserves computed using a discount factor of ten percent and assuming continuation of existing economic conditions; plus
(B) the cost of properties not being amortized pursuant to paragraph (i)(3)(ii) of this section; plus
(C) the lower of cost or estimated fair value of unproven properties included in the costs being amortized; less
(D) income tax effects related to differences between the book and tax basis of the properties referred to in paragraphs (i)(4)(i)(B) and (C) of this section.
(ii) If unamortized costs capitalized within a cost center, less related deferred income taxes, exceed the cost center ceiling, the excess shall be charged to expense and
separately disclosed during the period in which the excess occurs. Amounts thus required to be written off shall not be reinstated for any subsequent increase in the cost center ceiling.
(5) Production costs. All costs relating to production activities, including workover costs incurred solely to maintain or increase levels of production from an existing completion interval, shall be charged to expense as incurred.
(6) Other transactions. The provisions of paragraph (h) of this section, "Mineral property conveyances and related transactions if the successful efforts method of accounting is followed," shall apply also to those reporting entities following the full cost method except as follows:
(i) Sales and abandonments of oil and gas properties. Sales of oil and gas properties, whether or not being amortized currently, shall be accounted for as adjustments of capitalized costs, with no gain or loss recognized, unless such adjustments would significantly alter the relationship between capitalized costs and proved reserves of oil and gas attributable to a cost center. For instance, a significant alteration would not ordinarily be expected to occur for sales involving less than 25 percent of the reserve quantities of a given cost center. If gain or loss is recognized on such a sale, total capitalization costs within the cost center shall be allocated between the reserves sold and reserves retained on the same basis used to compute amortization, unless there are substantial economic differences between the properties sold and those retained, in which case capitalized costs shall be allocated on the basis of the relative fair values of the properties. Abandonments of oil and gas properties shall be accounted for as adjustments of capitalized costs; that is, the cost of abandoned properties shall be charged to the full cost center and amortized (subject to the limitation on capitalized costs in paragraph (b) of this section).
(ii) Purchases of reserves. Purchases of oil and gas reserves in place ordinarily shall be accounted for as additional capitalized costs within the applicable cost center; however, significant purchases of production payments or properties with lives substantially shorter than the composite productive life of the cost center shall be accounted for separately.
(iii) Partnerships, joint ventures and drilling arrangements.
(A) Except as provided in subparagraph (i)(6)(i) of this section, all consideration received from sales or transfers of properties in connection with partnerships, joint venture operations, or various other forms of drilling arrangements involving oil and gas exploration and development activities (e.g., carried interest, turnkey wells, management fees, etc.) shall be credited to the full cost account, except to the extent of amounts that represent reimbursement of organization, offering, general and administrative expenses, etc., that are identifiable with the transaction, if such amounts are currently incurred and charged to expense.
(B) Where a registrant organizes and manages a limited partnership involved only in the purchase of proved developed properties and subsequent distribution of income from
such properties, management fee income may be recognized provided the properties involved do not require aggregate development expenditures in connection with production of existing proved reserves in excess of 10% of the partnership's recorded cost of such properties. Any income not recognized as a result of this limitation would be credited to the full cost account and recognized through a lower amortization provision as reserves are produced.
(iv) Other services. No income shall be recognized in connection with contractual services performed (e.g. drilling, well service, or equipment supply services, etc.) in connection with properties in which the registrant or an affiliate (as defined in § 210.1 -02(b)) holds an ownership or other economic interest, except as follows:
(A) Where the registrant acquires an interest in the properties in connection with the service contract, income may be recognized to the extent the cash consideration received exceeds the related contract costs plus the registrant's share of costs incurred and estimated to be incurred in connection with the properties. Ownership interests acquired within one year of the date of such a contract are considered to be acquired in connection with the service for purposes of applying this rule. The amount of any guarantees or similar arrangements undertaken as part of this contract should be considered as part of the costs related to the properties for purposes of applying this rule.
(B) Where the registrant acquired an interest in the properties at least one year before the date of the service contract through transactions unrelated to the service contract, and that interest is unaffected by the service contract, income from such contract may be recognized subject to the general provisions for elimination of intercompany profit under generally accepted accounting principles.
(C) Notwithstanding the provisions of (A) and (B) above, no income may be recognized for contractual services performed on behalf of investors in oil and gas producing activities managed by the registrant or an affiliate. Furthermore, no income may be recognized for contractual services to the extent that the consideration received for such services represents an interest in the underlying property.
(D) Any income not recognized as a result of these rules would be credited to the full cost account and recognized through a lower amortization provision as reserves are produced.
(7) Disclosures. Reporting entities that follow the full cost method of accounting shall disclose all of the information required by paragraph (k) of this section, with each cost center considered as a separate geographic area, except that reasonable groupings may be made of cost centers that are not significant in the aggregate. In addition:
(i) For each cost center for each year that an income statement is required, disclose the total amount of amortization expense (per equivalent physical unit of production if amortization is computed on the basis of physical units or per dollar of gross revenue from production if amortization is computed on the basis of gross revenue).
(ii) State separately on the face of the balance sheet the aggregate of the capitalized costs of unproved properties and major development projects that are excluded, in accordance with paragraph (i)(3) of this section, from the capitalized costs being amortized. Provide a description in the notes to the financial statements of the current status of the significant properties or projects involved, including the anticipated timing of the inclusion of the costs in the amortization computation. Present a table that shows, by category of cost, (A) the total costs excluded as of the most recent fiscal year; and (B) the amounts of such excluded costs, incurred (1) in each of the three most recent fiscal years and (2) in the aggregate for any earlier fiscal years in which the costs were incurred. Categories of cost to be disclosed include acquisition costs, exploration costs, development costs in the case of significant development projects and capitalized interest.
Income taxes
(d) Income taxes. Comprehensive inter-period income tax allocation by a method which complies with generally accepted accounting principles shall be followed for intangible drilling and development costs and other costs incurred that enter into the determination of taxable income and pretax accounting income in different periods.
| RESUME |
| MICHAEL J. VEAZEY 5539 Coldwater Creek Baton Rouge, La. 70808 PERSONAL |
| Born June, 1944: Married, two children EDUCATION |
B.S. in Petroleum Engineering, LSU, 1966
Elected to Tau Beta Pi (Honorary Engineering Society)
Elected to Pi Epsilon Tau (Honorary Petroleum Engineering Society) M.S. in Petroleum Engineering, LSU, 1968 Elected to Phi Kappa Phi (National Honorary Society)
PROFESSIONAL SOCIETIES AND ACTIVITIES
Registered Professional Engineer in Louisiana (Petroleum) since 1972 Registered Professional Engineer in Louisiana (Environmental) since 1994 Member of Society of Petroleum Engineers of AIME since 1964 Member of Society of Society of Petroleum Evaluation Engineers American Association of Drilling Engineers (Steering Com.) Faculty Advisor to Student Section of SPE (1978 - 1983) Mineral Consultant to LSU Board of Supervisors (1980 - - 1983) Phi Kappa Phi honor society Tau Beta Pi honor society Pi Epsilon Tau honor society
EXPERIENCE
1983-PRESENT
VEAZEY AND ASSOCIATES, INC. - an oil and gas consulting firm located in Baton Rouge, Louisiana
Mr. Veazey has been the President of Veazey and Associates, Inc. (Formerly MJV, Inc.) since 1978. He continues to serve as an Instructor in the LSU/IADC Well Control School.
Mr. Veazey serves as the primary engineering analyst responsible for the estimation of oil and gas reserve volumes for a number of oil and gas companies. In addition to his role as an estimator of oil and gas reserves, he has provided the primary engineering work upon which many oil and gas reserve acquisitions have been based. He has also performed many Estate Appraisals.
Since 1980, Mr. Veazey has assisted the Vermilion Parish School Board with the management of minerals associated with the 22,000 + acres of State Land held in trust for that School Board, and Mr. Veazey has assisted The Terrebonne Parish School Board since 1986 with similar services for the 22,000+ acres of State Land held in trust for that School Board.
Mr. Veazey has provided Expert Testimony and given sworn depositions in both Federal and State Court. He has qualified as an expert in the field of Petroleum Engineering, Petroleum Reservoir Engineering and Oil Field Operations. He has also testified before the Louisiana Office of Conservation in numerous Unitization hearings.
1978-1983
LOUISIANA STATE UNIVERSITY - Assistant Professor of Petroleum Engineering at LSU.
Mr. Veazey taught undergraduate courses in petroleum economics, drilling, petrophysics, unitization, and phase behavior. During his tenure, he was the Director of LSU/IADC Well Control School from 1980 through 1983. He was also the Mineral Consultant to the LSU Board of Supervisors from 1980 through 1983.
1974-1978
SAMSON RESOURCE COMPANY - A publicly traded, independent oil and gas company specializing in production acquisitions and development drilling, located in Tulsa, Oklahoma.
Mr. Veazey was the Senior Petroleum Engineer responsible for all drilling, production and acquisitions. During the period in which he served as the companies' chief engineering evaluator, Samson was recognized as one of the nation’s most successful and fastest growing independent oil and gas companies. During employment with Samson, Mr. Veazey co-author three technical papers, one of which related to the development of a Monte Carlo Simulation model for a programmable calculator, allowing the general engineering population to access and utilize this powerful statistical tool for oil and gas acquisition and development activities in a manner which had previously been reserved for only those with access to powerful main frame computers.
1972-1974
PLACID OIL COMPANY - An international oil and gas company headquartered in Dallas, Texas.
Mr. Veazey served as a Staff Petroleum Engineer responsible for oil and gas reserve calculations and development drilling programs which concentrated on large offshore Louisiana oil and gas fields. He was also responsible for representing Placid at numerous technical committee meetings with joint venture partners. Mr. Veazey also performed reservoir engineering and statistical evaluations of major undeveloped tracts of land for the purpose of participation in competitive lease sales. As a result of these efforts, the company invested $180MM and was rewarded with the discovery of the South Marsh Island 268 Field. He also worked with other engineers to continually evaluate the companies' producing oil and gas fields. These activities were concentrated in the gulf coast area of Louisiana, but also extended to other geographic areas such as Alabama, Mississippi, the Florida Gulf Coast and the North Sea.
1968-1972
CHEVRON -
Mr. Veazey worked as a Reservoir Engineer and Drilling Engineer in the New Orleans office. He worked on secondary recovery projects and prepared reserve calculations for large oil and gas fields in south Louisiana and offshore Louisiana. He also worked as a field drilling engineer on offshore and inland water rigs for two years.
Summers
1967 Drilling Engineer, Chevron Oil Co. 1966 Reservoir Engineer, Chevron Oil Co. 1965 Lease Pumper, Gulf Oil Co.
1964 Roustabout, Pan American Petroleum Corp. (Amoco).
| SELECTED PUBLICATIONS |
| 1. | Veazey, M.J. and Carlton, A.: RECORD OKLAHOMA WELL DRILLED THROUGH TROUBLESOME ATOKA SHALE, Oil and Gas Journal, August 23, 1976. |
| 2. | Veazey, M.J. and Carlton, A.: NEW LOGGING APPROACH TO OLD WELLS, Petroleum Engineer, July, 1976. |
| 3. | Veazey, M.J. and Smith, P.: SIMPLE EQUATION, CALCULATOR SPEED LEASE EVALUATION, Oil and Gas Journal, May 22, 1978. |
| 4. | Veazey, M.J. and Bassiouni, Z.: THE EVALUATION OF WATER CYCLING AS A TECHNIQUE FOR RECOVERING THE DISSOLVED GAS IN A GEOPRESSURED |
| AQUIFER, LSU Dept. of Petroleum Engineering Report to DOE, August, 1978. | |
| 5. | Veazey, M.J., Hawkins, M.F., et. al.: METHODS FOR DETERMINING VENTED VOLUMES DURING GAS WELL BLOWOUTS, DOE Publication, October, 1980. |
| 6. | Veazey, M.J., Hawkins, M.F., et. al.: METHODS FOR DETERMINING VENTED VOLUMES DURING GAS-CONDENSATE BLOWOUTS, DOE Publication , November, 1981. |
| 7. | Veazey, M.J., Alexander, W.H., and Corty, F.L.: OIL AND GAS LEASING: A MYSTERY IN LOUISIANA, Louisiana Rural Economist, Vol. 44 No. 4, November, 1982. |
| Jim Veazey, P. E. 1221 S. Columbine St. Baton Rouge, LA 70808 W (225) 765-1914 |
Experience
Veazey & Associates, Inc. 8/01 to Present
Provide services related to reservoir engineering, including estate appraisals and various aspects of mineral management. Knowledgeable in calculation of reserves by a multitude of methods and implementing economic software (PHD Win) to relate a present value forecast for said reserves so the client can make informed budget decisions regarding financing, investments, private acquisitions or acquisition by state imminent domain. Manage minerals of over 50,000 acres for public lands. This includes all aspects of permitting, leasing, scouting oil and gas activity, as well as providing a complete inventory of past and present surface and mineral activity. Accounting of surface activity includes multiple site visits to properties. Conducted regulatory filings and plugging operations for operator terminating business in state. Also located and negotiated a suitable new company to take over operations and relieve client from all plugging and environmental responsibility. Capable of extensive due diligence research and permitting at the Office of Conservation, as well as interfacing with Office of Conservation staff regarding regulatory compliance issues and other special situations involving this state agency. Knowledge of and experience with ArcView GIS software.
Department of Natural Resources/Inspection & Enforcement Section 4/98 to 8/01
Manage complaints from land owners or concerned citizens regarding oil and gas operations in the vicinity of their property. Further, if any violations are discovered, initiate corrective action and keep complainant informed of all actions taken by this Office. Review passive closure data for oil field pits to ensure conformance with the applicable State rules and regulations. Responsible for monitoring inactive oil and gas wells in the state to ensure that the sites, which are deemed as having no future utility, are plugged and abandoned in accordance with the requirements of Statewide Order No. 29-B. This involves requesting and evaluating engineering and geological data provided by operators of inactive wells to justify the classification of the well(s) as having future utility. Review Lease Facility Inspection, Production Pit Inspection, Reserve Pit Inspection and Narrative Reports submitted by field agents for the Office of Conservation and take necessary action. Accompany agents on field inspections to insure compliance with rules and regulations of the Office of Conservation. Coordinate and supervise the compilation of statistics relating to oil and gas conservation activities; such as unitization hearings or meetings with industry representatives. Produce quad and satellite maps from Arc View, a GIS software, to aid with site visits in the field or identification of environmentally sensitive areas.
Department of Natural Resources/Orphan Well Section 9/96 to 4/98
Review and audit records in order to prepare bid packages for orphan well projects. Prepare restoration procedures for orphaned sites including down-hole plugging procedures, pit closure and facility removal. Obtain soil analyses on all oil field pits or tank bottoms associated with the orphaned site. Oversee site visits for plugging and restoration contractors so bids can be prepared. Prepare data relative to Act 404 (Oilfield Site Restoration Law) for dissemination to the respective legislative oversight committees, the Oilfield Site Restoration Commission, the Secretary of the Department of Natural Resources, and the Assistant Secretary. Assist in establishment of Site Specific Trust Accounts. Develop and implement appropriate procedures to determine that oil field sites which are not closed or maintained in accordance with provisions of Statewide Order No. 29-B are orphaned. Manage applications for approved contractors applying for work under Oilfield Site Restoration. Organize with Louisiana Oil Spill Coordinator’s Office in order to expend funds from the Oil Spill Contingency Fund in the event of an emergency.
Veazey & Associates, Inc. 9/95 to 9/96
Perform reserve forecasts for annual reports and estate appraisals. Mineral management of two state agencies (total of 40,000 + acres under management). Assist in preparation of unitization hearings for industry and land owner clients.
| Jim Veazey, P. E. 1221 S. Columbine Baton Rouge, LA 70808 W (225) 383-5555 |
| Union Oil Company of California 5/94 to 8/94 |
| Design well workovers and write AFEs, involved in decision making of workover and |
| recompletion procedures in the office and in the field. Assist Senior Production Engineer with |
| daily field activity. |
Veazey & Associates 5/91 to 5/94
Extensive research collection at Department of Natural Resources. Plotting of decline curves, planimetering isopach maps for volumetric reserve calculations. Maintenance of company well history and engineering files. Office management and company finance management.
| L. S. U. Petroleum Engineering Department 9/89 to 5/95 |
| Responsible for maintenance of laboratories, maintenance of supplies and general office work. |
Conoco, Inc. 6/88 to 8/88
Observed secondary and tertiary recovery methods and performed lease maintenance work in the field.
| Professional Organizations Society of Petroleum Engineers Certifications and Short Courses |
Mineral Law Institute, 2001 thru 2007 Registered Professional Engineer License, 2001 NORM Surveying and Control Certification, 1998
Soil Remediation for Petroleum Extraction Industry, 1997 and 1998
Mineral Management Service Well Control and Under Balanced Drilling, 1997 and 1998 Introduction to Arc View GIS, 1998 Engineer-In-Training (EIT) Certification, 1995
Education
Louisiana State University - 1995 Graduate in Petroleum Engineering
Louisiana State University - 1991 Graduate in General Studies with a business emphasis Catholic High School, Baton Rouge - 1986 Graduate
Personal
Married with two children
References
Available Upon Request
PARTIAL CLIENT LIST FOR VEAZEY & ASSOCIATES, LLC
Oil & Gas Companies
| 1. | Burton Industries | |||
| Sulphur, Louisiana | ||||
| References: | Jack Lawton, Jr. | |||
| Thad Minolti | ||||
| 2. | William B. Lawton, Inc. | |||
| Lake Charles, Louisiana | ||||
| Reference: | Will Drost, Vice President | |||
| 3. | Sunbelt Energy | |||
| Lafayette, Louisiana | ||||
| Reference: | Michael Poole | |||
| 4. | Brownland Corporation | |||
| Monroe, Louisiana | ||||
| Reference: | William Brown, Owner | |||
| 5. | Foster Brown | |||
| Monroe, Louisiana | ||||
| Reference: | Dennis Brown, Owner | |||
| 6. | Pennington Oil & Gas Interests | |||
| Baton Rouge, LA | ||||
| Reference: | Bill Hise | |||
Estates, Family Partnerships & Corporations
| 1. | The Lavies Partnership | |||
| New Orleans, Louisiana | ||||
| Reference: | Earl Archer, Managing Partner | |||
| 2. | Southern Assets Management, Inc. | |||
| Baton Rouge, Louisiana | ||||
| Reference: | Daryl Pennington | |||
| Individuals |
| 1. | Mr. George Lacour New Roads, Louisiana |
| 2. | Mr. Tom Goldsby Landowner West Memphis, Arkansas |
| Government Agencies |
| 1. | Vermilion Parish School Board | |||
| Abbeville, Louisiana | ||||
| Reference: | Randy Schexnayner, Superintendent of Schools | |||
| 2. | Terrebonne Parish School Board | |||
| Houma, Louisiana | ||||
| Reference: | Herbert Carreker, Purchasing Agent | |||
| 3. | The Department of Energy Resten, Virginia |
| 4. | The Federal Depository Insurance Commission (FDIC) Shreveport, Louisiana |
| 5. | Vermillion Parish Assessor Abbeville, Louisiana |
| Reference: |
| Michael Langlinais, Assessor |
| 6. | Lafourche Parish School Board 805 East Seventh St. |
| Thibodaux, LA 70301 |
| Reference: |
| Don Gaudet, Business Manager |
| Attorney References |
| 1. | Duval, Funderburk, Sundbery 504 Belanger Street |
| Houma, Louisiana 70361 Reference: James Funderburk |
| 2. | Honorable Stanwood Duval, Jr. U.S. District Court Eastern District of Louisiana 500 Camp Street New Orleans, Louisiana 70130 |
| 3. | Ottinger, Hebert & Sikes, L.L.P. 930 Coolidge Blvd. |
| Lafayette, Louisiana 70505-2606 | ||||
| Reference: | Patrick S. Ottinger | |||
| 4. | Carmouche Group | |||
| Lake Charles, Louisiana 70602 | ||||
| Reference: | Joe Mise | |||
| 5. | The Gray Law Firm | |||
| Lake Charles, Louisiana | ||||
| Reference: | A.J. Gray, III | |||
| 6. | Broussard & Broussard, Ltd. | |||
| Abbeville, Louisiana 70510 | ||||
| Reference: | Judge Marcus Broussard | |||
| 7. | Strain, Dennis, Ellis, Mayhall & Bates | |||
| Baton Rouge, Louisiana 70505 | ||||
| References: | William Strain | |||
| 8. | Richard Putnam | |||
| Abbeville, Louisiana 70510 | ||||
| Reference: | Richard Putnam | |||
| 9. | Taylor, Porter, Brooks, & Phillips | |||
| Baton Rouge, Louisiana 70821 | ||||
| Reference: | Mike Crawford | |||
| Clay Johnson | ||||
| 10. | O'Neil, Eichin, Miller & Breckinridge New Orleans, Louisiana 70113 |
| Reference: |
| Earl S. Eichin, Jr. |
| 11. | Martzell & Bickford 338 Lafayette St. |
| New Orleans, Louisiana 70130-3244 | |
| Reference: |
| Scott R. Bickford |
| 12. | Oats & Hudson |
| 100 East Vermilion St., Ste. 400 Gordon Square Lafayette, LA 70501 | |
| Reference: |
| Larry Marino |