Filed by SandRidge Energy, Inc.
pursuant to Rule 425 under the Securities
Act of 1933, as amended, and deemed filed
pursuant to Rule 14a-12 under the Securities
Exchange Act of 1934, as amended
Subject Company: Arena Resources, Inc.
Commission File No.: 001-31657
IMPORTANT ADDITIONAL INFORMATION WILL BE FILED WITH THE SEC
This communication is being made in respect of the proposed business combination involving SandRidge Energy, Inc. and Arena Resources, Inc. In connection with the proposed transaction, SandRidge Energy, Inc. plans to file with the Securities and Exchange Commission (the “SEC”) a Registration Statement on Form S-4 containing a Joint Proxy Statement/Prospectus, and each of SandRidge Energy, Inc. and Arena Resources, Inc. may file with the SEC other documents regarding the proposed transaction. The definitive Joint Proxy Statement/Prospectus will be mailed to stockholders of SandRidge Energy, Inc. and Arena Resources, Inc.Investors and security holders of SandRidge Energy, Inc. and Arena Resources, Inc. are urged to read the Joint Proxy Statement/Prospectus and other documents filed with the SEC carefully in their entirety when they become available because they will contain important information about the proposed transaction.Investors and security holders will be able to obtain free copies of the Registration Statement and the Joint Proxy Statement/Prospectus (when available) and other documents filed with the SEC by SandRidge Energy, Inc. and Arena Resources, Inc. through the web site maintained by the SEC at www.sec.gov. Free copies of the Registration Statement and the Joint Proxy Statement/Prospectus (when available) and other documents filed with the SEC can also be obtained by directing a request to SandRidge Energy, Inc., 123 Robert S. Kerr Avenue, Oklahoma City, Oklahoma 73102, Attention: Investor Relations, or by directing a request to Arena Resources, Inc., 6555 South Lewis Avenue, Tulsa, Oklahoma 74136, Attention: Investor Relations.
SandRidge Energy, Inc., Arena Resources, Inc and their respective directors and executive officers and other persons may be deemed to be participants in the solicitation of proxies in respect of the proposed transaction. Information regarding SandRidge Energy, Inc.’s directors and executive officers is available in its Annual Report on Form 10-K for the year ended December 31, 2009, which was filed with the SEC on March 1, 2010, and its proxy statement for its 2009 annual meeting of stockholders, which was filed with the SEC on April 22, 2009, and information regarding Arena Resources, Inc.’s directors and executive officers is available in its Annual Report on Form 10-K for the year ended December 31, 2009, which was filed with the SEC on March 1, 2010 and its proxy statement for its 2009 annual meeting of stockholders, which was filed with the SEC on October 29, 2009. Other information regarding the participants in the proxy solicitation and a description of their direct and indirect interests, by security holdings or otherwise, will be contained in the Joint Proxy Statement/Prospectus and other relevant materials to be filed with the SEC when they become available.
Safe Harbor Language on Forward Looking Statements:
This communication includes “forward-looking statements” within the meaning of Section 27A of the Securities Act of 1933, as amended, and Section 21E of the Securities Exchange Act of 1934, as amended. These statements express a belief, expectation or intention and are generally accompanied by words that convey projected future events or outcomes. The forward-looking statements include statements relating to the impact SandRidge Energy, Inc. expects the proposed merger with Arena Resources, Inc. to have on the combined entity’s operations, financial condition, and financial results, and SandRidge Energy, Inc.’s expectations about its ability to successfully integrate the combined businesses and the amount of cost savings and overall operational efficiencies SandRidge Energy, Inc. expects to realize as a result of the proposed merger. The forward-looking statements also include statements about SandRidge Energy, Inc.’s future operations, estimates of reserve and resource volumes, reserve values, future drilling locations, costs, cash flow, hedging transactions, and anticipated timing for filings with regulatory agencies, shareholder meetings and closing of the proposed merger. We have based these forward-looking statements on our current expectations and assumptions and analyses made by us in light of our experience and our perception of historical trends, current conditions and expected future developments, as well as other factors we believe are appropriate under the circumstances. However, whether actual results and developments will conform with our expectations and predictions is subject to a number of risks and uncertainties, includingthe ability to obtain governmental approvals of the merger on the proposed terms and schedule, the failure of SandRidge Energy, Inc. or Arena Resources, Inc. stockholders to approve the merger, the risk that the businesses will not be integrated successfully, the risk that the cost savings and any synergies from the merger may not be fully realized or may take longer to realize than expected, disruption from the merger making it more difficult to maintain relationships with customers, employees or suppliers, the volatility of natural gas and oil prices, our success in discovering, estimating, and developing natural gas and oil reserves, the availability and terms of capital, our timely execution of hedge transactions, credit conditions of global capital markets, changes in economic conditions, regulatory changes, including those related to carbon dioxide and greenhouse gas emissions, and other factors, many of which are beyond our control. We refer you to the discussion of risk factors in Part I, Item 1A - “Risk Factors” of our Annual Report on Form 10-K for the year ended December 31, 2009 and the Annual Report on Form 10-K filed by Arena Resources, Inc. and in comparable “risk factors” sections of our and Arena Resources, Inc.’s Quarterly Reports on Form 10-Q filed after the date of this communication. All of the forward-looking statements made in this communication are qualified by these cautionary statements. The actual results or developments anticipated may not be realized or, even if substantially realized, they may not have the expected consequences to or effects on our company or our business or operations. Such statements are not guarantees of future performance and actual results or developments may differ materially from those projected in the forward-looking statements. We undertake no obligation to update or revise any forward-looking statements.
The following is a slide presentation that will be made available to certain shareholders of SandRidge Energy, Inc. and Arena Resources, Inc. beginning April 6, 2010.
 |
 2 Disclaimer (Page 1 of 2) Safe Harbor Language on Forward Looking Statements: This presentation includes "forward-looking statements" within the meaning of Section 27A of the Securities Act of 1933, as amended, and Section 21E of the Securities Exchange Act of 1934, as amended. These statements express a belief, expectation or intention and are generally accompanied by words that convey projected future events or outcomes. The forward-looking statements include statements relating to the impact SandRidge Energy, Inc. expects the proposed merger with Arena Resources, Inc. to have on the combined entity's operations, financial condition, and financial results, and SandRidge Energy, Inc.’s expectations about its ability to successfully integrate the combined businesses and the amount of cost savings and overall operational efficiencies SandRidge Energy, Inc. expects to realize as a result of the proposed merger. The forward-looking statements also include statements about SandRidge Energy, Inc.’s future operations, estimates of reserve and resource volumes, reserve values, future drilling locations, costs, cash flow, hedging transactions, and anticipated timing for filings with regulatory agencies, shareholder meetings and closing of the proposed merger. We have based these forward-looking statements on our current expectations and assumptions and analyses made by us in light of our experience and our perception of historical trends, current conditions and expected future developments, as well as other factors we believe are appropriate under the circumstances. However, whether actual results and developments will conform with our expectations and predictions is subject to a number of risks and uncertainties, including the ability to obtain governmental approvals of the merger on the proposed terms and schedule, the failure of SandRidge Energy, Inc. or Arena Resources, Inc. stockholders to approve the merger, the risk that the businesses will not be integrated successfully, the risk that the cost savings and any synergies from the merger may not be fully realized or may take longer to realize than expected, disruption from the merger making it more difficult to maintain relationships with customers, employees or suppliers, the volatility of natural gas and oil prices, our success in discovering, estimating, and developing natural gas and oil reserves, the availability and terms of capital, our timely execution of hedge transactions, credit conditions of global capital markets, changes in economic conditions, regulatory changes, including those related to carbon dioxide and greenhouse gas emissions, and other factors, many of which are beyond our control. We refer you to the discussion of risk factors in Part I, Item 1A - “Risk Factors” of our Annual Report on Form 10-K for the year ended December 31, 2009 and the Annual Report on Form 10-K filed by Arena Resources, Inc. and in comparable “risk factors” sections of our and Arena Resources, Inc.’s Quarterly Reports on Form 10-Q filed after the date of this presentation. All of the forward-looking statements made in this presentation are qualified by these cautionary statements. The actual results or developments anticipated may not be realized or, even if substantially realized, they may not have the expected consequences to or effects on our company or our business or operations. Such statements are not guarantees of future performance and actual results or developments may differ materially from those projected in the forward-looking statements. We undertake no obligation to update or revise any forward-looking statements. The SEC permits oil and natural gas companies, in their filings with the SEC, to disclose only proved, probable and possible reserves, as each is defined by the SEC. At times we use the term "EUR" (estimated ultimate recovery) to provide estimates that the SEC’s guidelines prohibit us from including in filings with the SEC. In addition, this presentation includes a table demonstrating the sensitivity of proved oil and natural gas reserves to price fluctuations by comparing the reserves calculated under the price assumptions required by current U.S. Securities and Exchange Commission (“SEC”) rules to (1) spot prices at December 31, 2009, and (2) the 10-year average NYMEX strip prices as of December 31, 2009. The reserves presented under these alternative price assumptions are not calculated in accordance with current SEC rules, and they have not been reviewed by independent petroleum engineers. These estimates are by their nature more speculative than estimates of proved, probable or possible reserves and, accordingly, are subject to substantially greater risk of being actually realized by the company. For a discussion of the company’s proved reserves, as calculated under current SEC rules, we refer you to the company’s Annual Report on Form 10-K referenced above, which is available on our website at www.sandridgeenergy.com and on the SEC's website at www.sec.gov. |
 3 Disclaimer (Page 2 of 2) IMPORTANT ADDITIONAL INFORMATION WILL BE FILED WITH THE SEC This communication is being made in respect of the proposed business combination involving SandRidge Energy, Inc. and Arena Resources, Inc. In connection with the proposed transaction, SandRidge Energy, Inc. plans to file with the Securities and Exchange Commission (the “SEC”) a Registration Statement on Form S-4 containing a Joint Proxy Statement/Prospectus, and each of SandRidge Energy, Inc. and Arena Resources, Inc. may file with the SEC other documents regarding the proposed transaction. The definitive Joint Proxy Statement/Prospectus will be mailed to stockholders of SandRidge Energy, Inc. and Arena Resources, Inc. Investors and security holders of SandRidge Energy, Inc. and Arena Resources, Inc. are urged to read the Joint Proxy Statement/Prospectus and other documents filed with the SEC carefully in their entirety when they become available because they will contain important information about the proposed transaction. Registration Statement and the Joint Proxy Statement/Prospectus (when available) and other documents filed with the SEC by SandRidge Energy, Inc. and Arena Resources, Inc. through the web site maintained by the SEC at www.sec.gov. Free copies of the Registration Statement and the Joint Proxy Statement/Prospectus (when available) and other documents filed with the SEC can also be obtained by directing a request to SandRidge Energy, Inc., 123 Robert S. Kerr Avenue, Oklahoma City, Oklahoma 73102, Attention: Investor Relations, or by directing a request to Arena Resources, Inc., 6555 South Lewis Avenue, Tulsa, Oklahoma 74136, Attention: Investor Relations. SandRidge Energy, Inc., Arena Resources, Inc. and their respective directors and executive officers and other persons may be deemed to be participants in the solicitation of proxies in respect of the proposed transaction. Information regarding SandRidge Energy, Inc.’s directors and executive officers is available in its Annual Report on Form 10-K for the year ended December 31, 2009, which was filed with the SEC on March 1, 2010, and its proxy statement for its 2009 annual meeting of stockholders, which was filed with the SEC on April 22, 2009, and information regarding Arena Resources, Inc.’s directors and executive officers is available in its Annual Report on Form 10-K for the year ended December 31, 2009, which was filed with the SEC on March 1, 2010 and its proxy statement for its 2009 annual meeting of stockholders, which was filed with the SEC on October 29, 2009. Other information regarding the participants in the proxy solicitation and a description of their direct and indirect interests, by security holdings or otherwise, will be contained in the Joint Proxy Statement/Prospectus and other relevant materials to be filed with the SEC when they become available. Investors and security holders will be able to obtain free copies of the |
 4 Transaction – Summary Strategy: Why Arena? Increases exposure to oil (8,500 Boepd – 86% Oil) Single asset focus in the Central Basin Platform • Low risk drilling (2,700 locations) • Shallow vertical wells (less than 6,000 feet) • Proven production history (discovered in 1930) Seamless integration by SandRidge • Extensive existing operations in Permian Basin • Close proximity to Ft. Stockton service base (33 rigs) • Long term cost control with rig ownership SandRidge post acquisition plans to have over $3.0 billion of hedges • Hedges for 2H10 - 2013 • Natural Gas upside for 2011 and beyond Transaction: $1.6 billion acquisition yields post acquisition SandRidge value of $6.2 billion 191 MM new SandRidge shares issued, no assumed debt Post acquisition 58% of SandRidge will be owned by current shareholders Relative PV-10 (debt adjusted) supports ownership percentage Accretive to cash flow per share in 2011 Expected closing June/July 2010 |
 5 Transaction – Arena Key Attributes Production/Reserves 86% Oil Concentrated, operated oil-weighted Permian Basin position March 2 disclosed net production 8,500 Boepd with significant growth potential 69.3 Mmboe proven reserves YE 2009 Permian Basin Oil Approximately 67,600 Net Acres (85% Permian Basin) • High Working Interests ( 95% WI) Predictable Production Growth (from 200 to 8,500 Boepd in 5 years) Value Generation Driven by developing low risk San Andres wells @ 4,300’ • Large, multi-year inventory with over 2,700 San Andres locations Clear Fork potential @ 6,000’ Future Secondary and Tertiary Potential |
 6 San Andres (4,300’) Clear Fork (6,000’) Concentrated West Texas Asset Base SandRidge Arena Delaware Basin Midland Basin MIDLAND Ft. Stockton Service Base (33 drilling rigs) ODESSA WTO CENTRAL BASIN PLATFORM San Andres / Clear Fork Formations Combined West Texas Net Acreage Position 770,000 acres PIÑON FIELD |
                       7 Permian Basin (Fuhrman – Mascho Field) Fuhrman-Mascho / San Andres • 2,700 low risk, 10 acre locations • 35 Mboe gross per primary location • 94.5 Mmboe EUR gross • 950 Producing Wells • 700 Wells Drilled Since 2005 • Well Costs $500,000 • Average Well Depth – 4,300 feet SandRidge Arena CENTRAL BASIN PLATFORM San Andres / Clear Fork Formations |
 8 SandRidge Combined Asset Analysis (1) (1) (1) (4) (1) (2) (3) (1) 2009 SEC 12 month average; $3.87/Mcf, $57.65/Bbl (2) Dec. 31, 2009 spot prices; $5.79/Mcf, $79.34/Bbl (3) Average 10 year NYMEX strip; $6.94/Mcf, $92.24/Bbl (4) Dec. 2009 average for SD, Mar. 2, 2010 for ARD Post-Acquisition Total Proven Reserves (MMBoe) 219 69 288 Proved Developed % 63% 37% 57% Proven Oil Value % 69% 99% 82% Current Production (MBoepd) 49.3 8.5 57.8 PV10 PROVEN (SEC) $MM 1,561 $ 1,121 $ 2,682 $ PV10 PROVEN (12/31 SPOT) $MM 3,590 $ 1,820 $ 5,410 $ PV10 PROVEN (NYMEX 10 yr avg) $MM 5,240 $ 2,234 $ 7,474 $ |
   9 Permian Production (MBoepd) 4.3 13.0 21.5 Net Acres (M Acres) 56 148 205 Total Proven Reserves (MMBoe) 43 117 183 Drilling Locations ( # ) 740 2,694 5,700 PV10 PROVEN (SEC) $MM 424 $ 990 $ 2,053 $ PV10 PROVEN (12/31 SPOT) $MM 778 $ 1,823 $ 3,557 $ PV10 PROVEN (NYMEX 10 yr avg) $MM 1,025 $ 2,414 $ 4,546 $ Permian Metrics as of YE 2009 SandRidge Permian Progression (1) SandRidge: February 2010 Permian average; Arena: March 2, 2010 (2) 2009 SEC 12 month average; $3.87/Mcf, $57.65/Bbl (3) Dec 31, 2009 spot prices; $5.79/Mcf, $79.34/Bbl (4) Average 10 year NYMEX strip; $6.94/Mcf, $92.24/Bbl 12/09 Permian Acquisition 12/09 Permian Acquisition (2) (2) (1) (3) (4) |
 10 Acquisition Financial Review Goals of Transaction Increase exposure to oil Hedge significant amount of production through 2013 Cash flow per share accretion Balance sheet improvement Major Steps to Complete File S-4 File HSR Shareholder Vote (both SD and ARD) Expected Closing: June/July |
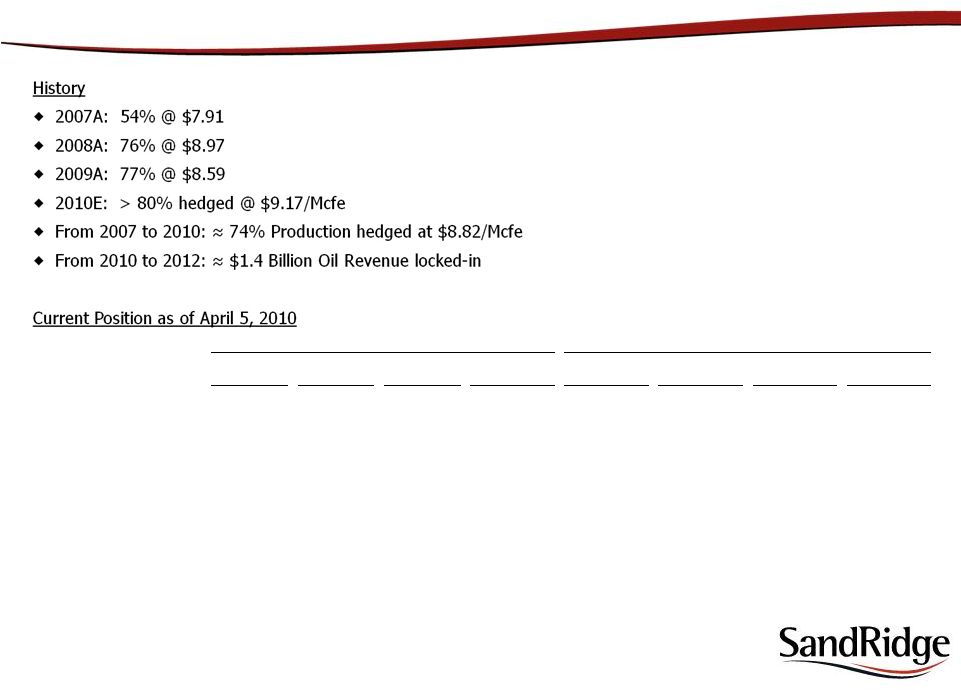
 11 Transaction – Hedge Review Q3 & Q4 2H10 -2013 2010 TOTAL Current SandRidge Crude Oil (Mmbo) 2.3 14.8 Price $82.08 $85.88 Natural Gas (Bcf) 40.0 40.0 Price $7.76 $7.76 Total Revenue Hedged $499 $1,578 Arena Crude Oil (Mmbo) 0.6 0.6 Price (Floor) $66.67 $66.67 Natural Gas (Bcf) 0.9 0.9 Price (Floor) $4.00 $4.00 Total Revenue Hedged $40 $40 Revenue Hedged $540 $1,619 Revenue To Be Hedged $59 $1,416 Total Revenue Hedged $599 $3,034 |
  12 Transaction – Share Analysis SandRidge SandRidge Pre-Acquisition Arena Post-Acquisition SD Shares Outstanding - March 26, 2010 210,797,254 SD 8.5% Preferred Stock 33,083,645 SD 6.0% Preferred Stock 18,416,206 Total SD Fully Diluted 262,297,105 262,297,105 ARD Shares Outstanding - March 15, 2010 39,018,737 ARD Options/Restricted Grants (1) 954,224 Total ARD Fully Diluted 39,972,961 Merger Conversion Ratio (2) 4.7771x Total ARD Merger Fully Diluted 190,953,633 190,953,633 New SandRidge Fully Diluted 453,250,738 (1) Assumes options settled cashless (2) Merger Conversion Ratio: $37.50/$7.85 = 4.7771x |
  13 Transaction – Balance Sheet (as of December 31, 2009) SandRidge Estimated SandRidge Pre-Acquisition Arena Adjustments Post-Acquisition Cash $7.9 $63.6 -$15.0 $56.5 Debt Bank Debt $0.0 $0.0 $100.0 $100.0 Other Senior Debt 35.3 35.3 Floating Senior Notes 350.0 350.0 8.625% Senior Notes 650.0 650.0 9.875% Senior Notes 351.0 351.0 8.0% Senior Notes 750.0 750.0 8.75% Senior Notes 442.6 442.6 Total Debt $2,578.9 $0.0 $100.0 $2,678.9 Equity -$195.9 $522.7 $976.3 $1,303.1 Total Capitalization $2,390.9 $586.3 $1,061.3 $4,038.5 |
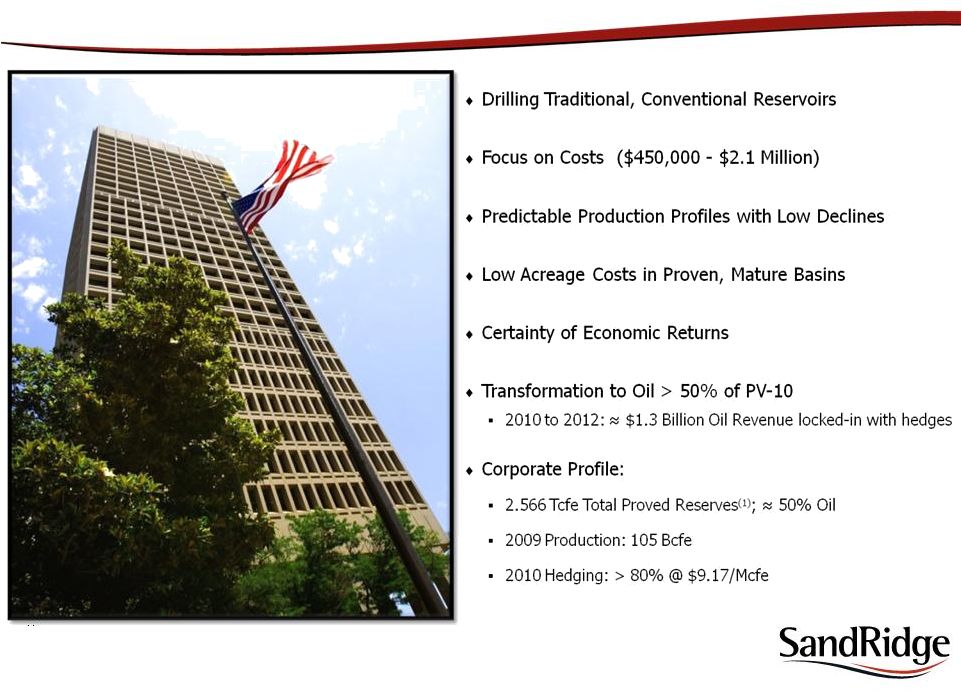 14 SandRidge – Who We Are (1) Using December 31, 2009 Pricing |
 15 Vertical / Fracturing Horizontal Drilling Horizontal w/ Fracing Is There Risk? |
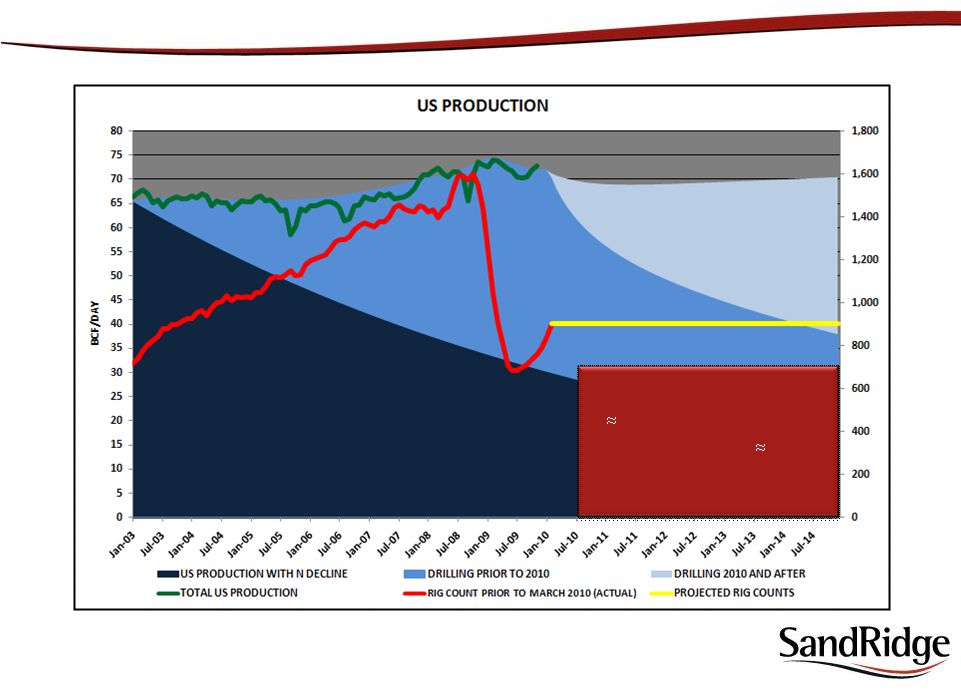 16 US Natural Gas Drilling Activity Will Challenge Natural Gas Price • Assumes 22% US decline • 900 – 950 Current Gas Rigs • Horizontal Drilling 60% efficiency increase • Rig count continues to increase |
 17 Simple Macro Oil Theory on “Why?” • BG • BP • Devon • Exxon-Mobil • Mitsui • StatOil • Total Oil is difficult to find. Companies Focusing on North American Gas: |
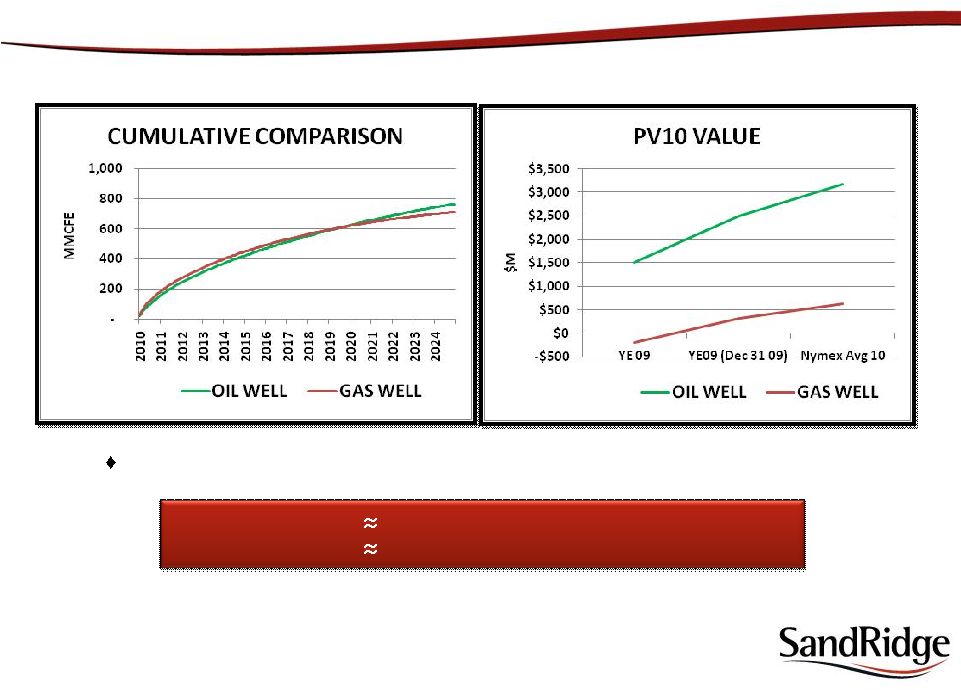   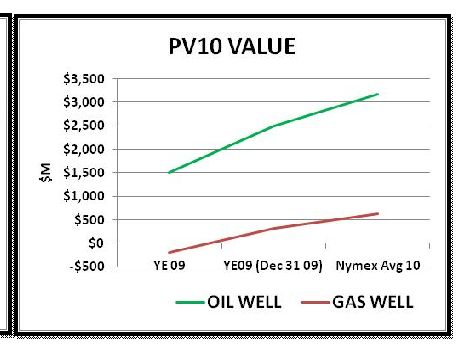 18 Oil Delivers 10X More Value Oil wells are significantly “VALUE” advantaged in today’s pricing environment Oil Well .77 Bcfe Reserves $950M Capex Gas Well .77 Bcfe Reserves $950M Capex |
 19 (a) Includes WAHA and HSC Basis Swaps in 2011 and 2012 Natural Gas Swaps assume a ratio of 1:1 for Mcf to MMBtu Hedging Quarter Ending Ending 3/31/2010 6/30/2010 9/30/2010 12/31/2010 12/31/2010 12/31/2011 12/31/2012 12/31/2013 Natural Gas Swaps: Volume (Bcf) 20.48 19.79 20.01 20.01 80.29 0.00 0.00 0.00 Swap $7.95 $7.32 $7.55 $7.97 $7.70 NM NM NM Natural Gas Basis Swaps: (a) Volume (Bcf) 20.25 20.48 20.70 20.70 82.13 104.03 113.46 14.60 Swap $0.74 $0.74 $0.74 $0.74 $0.74 $0.47 $0.55 $0.46 Crude Oil Swaps: Volume (MMBbls) 0.99 1.09 1.10 1.20 4.38 5.48 6.99 0.00 Swap $81.95 $82.05 $82.05 $82.11 $82.04 $86.07 $86.98 NM |
 20 SandRidge Operating Areas West Texas Overthrust Over 550,000 acres 5,500 drilling locations Exploration Permian Basin – Oil Over 150,000 acres 2,700 drilling locations 4 Main oil plays: • Clear Fork (CBP) • San Andres (CBP) • Wolfberry • Delaware Group (Bone Springs / Bell Canyon / Cherry Canyon) Oklahoma / Developing Plays Mississippian Horizontal • Over 115,000 Acres • 280 drilling locations Woodford Play • Over 45,000 Acres • 280 drilling locations |
 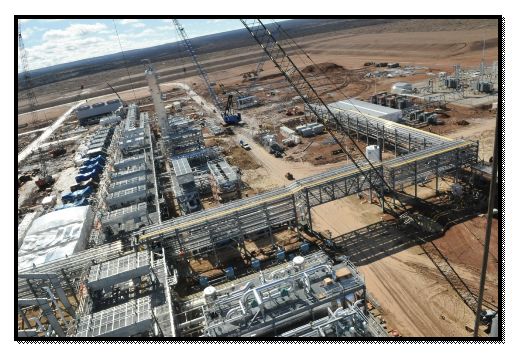   21 Piñon Development: Century Plant Phase I Completion: July – August 2010 Triple Treating Capacity Largest Single Industrial Source CO 2 Capture Facility in North America Currently Qualifies for Tax Credits Will Benefit from Most Cap & Trade Proposals *Century Plant in partnership with Occidental Petroleum as of February 2010. |
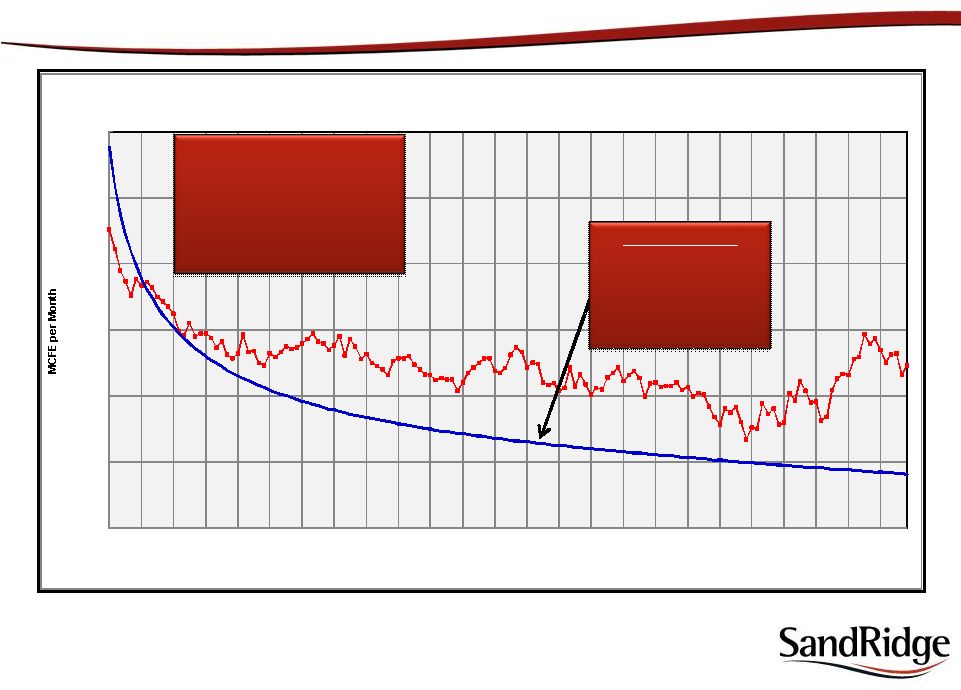 22 - 20,000 40,000 60,000 80,000 100,000 120,000 1 13 25 37 49 61 73 85 97 109 121 133 145 MCFE per Month MONTHS SandRidge Energy Average for Formation vs. Type Curve Warwick Type Curve Wells Piñon Compares Favorably Against ANY U.S. Gas Play *NYMEX 10 Year Average $6.94/Mcf $92.24/Bbl Warwick/Tesnus 7.3 Bcfe wet gas 2.46 Bcfe net *53% ROR Finding Costs $.99/Mcfe • Tier 1 Economics • All HBP • Mature Field • High Perm Reservoir • In-Fill Development Daily Production -- MCFE |
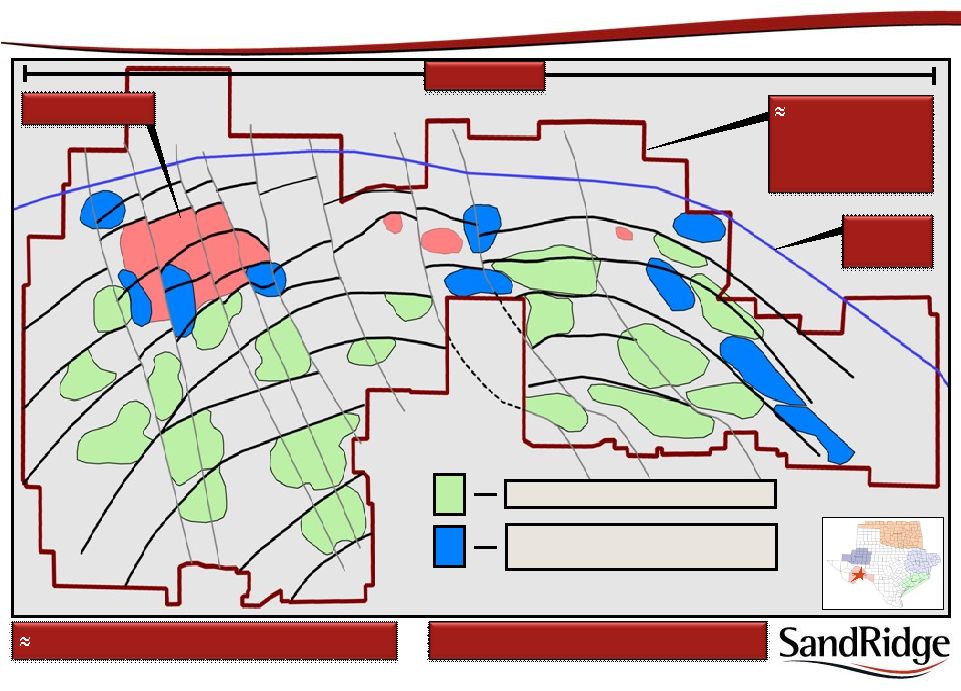
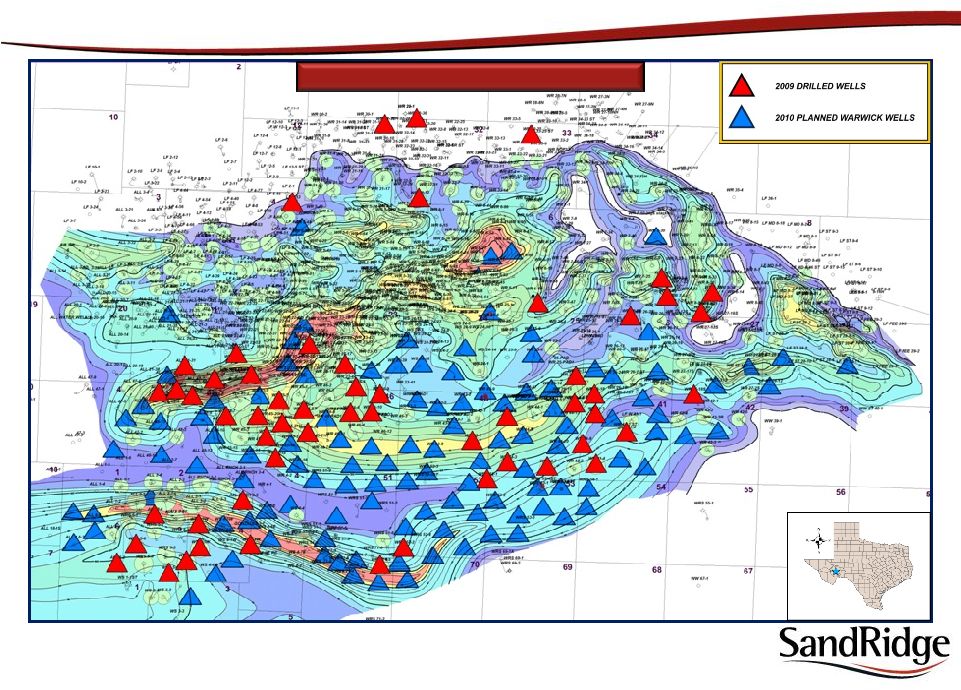 23 Gross Thickness Map of the Warwick Caballos Piñon Field: 2009 Wells Drilled / 2010 Development Drilling |
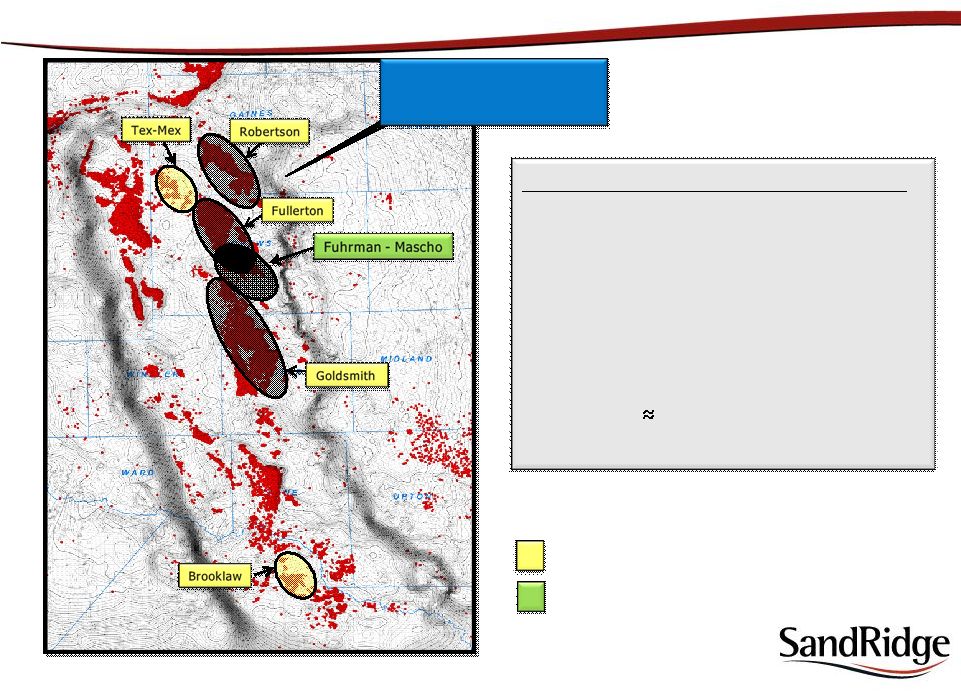
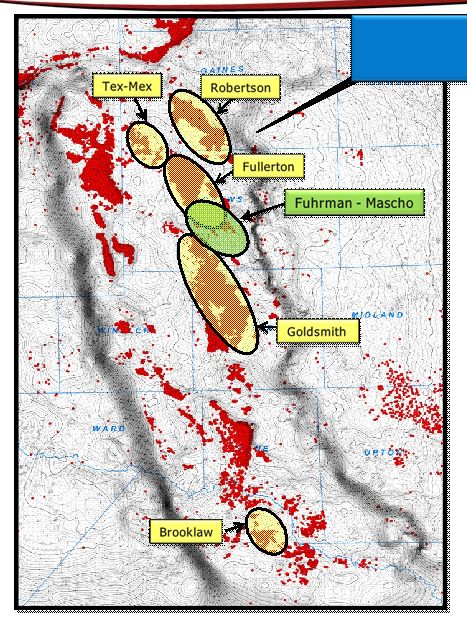
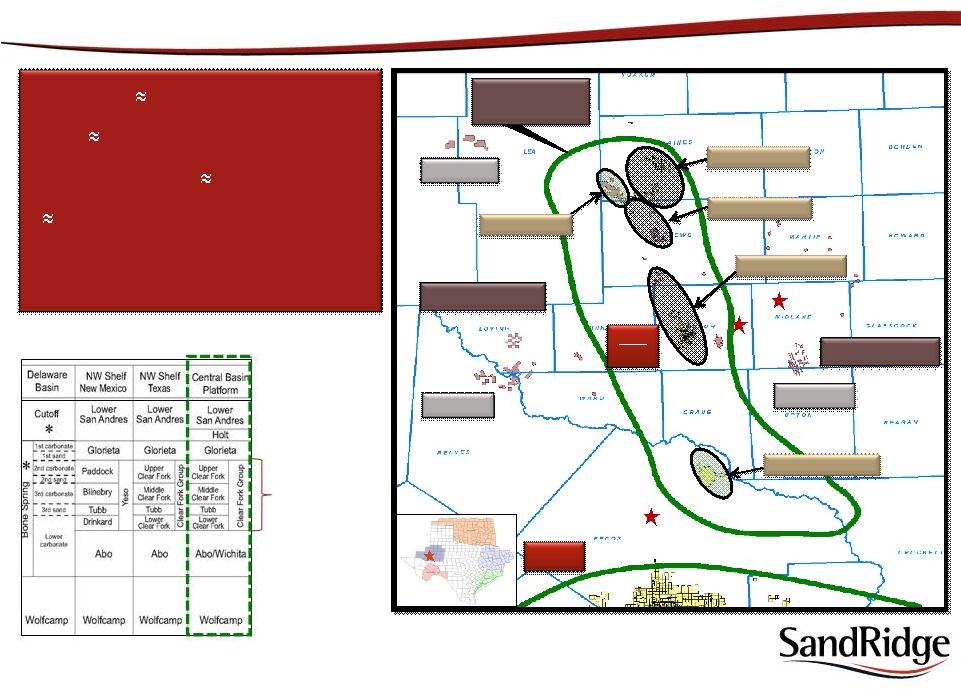                 24 Maljamar Vermejo Spraberry WTO GAU P.M. Delaware Basin Midland Basin Central Basin Platform Robertson Field Fullerton Field Goldsmith Field Tex-Mex Field Brooklaw Field MIDLAND ODESSA FT. STOCKTON • Production 12,000 Boe/d • Land 150,000 acres (net) • Resource potential 287 Mmboe • 2,700 drilling locations • Estimated drilling costs – $0.5MM to $1.2MM SandRidge Permian Basin / TX – Areas of Operations San Andres (4,300’) Clear Fork (6,000’) Wichita- Albany (7,200’) |
  25 Permian Production Forecast - 10,000 20,000 30,000 SandRidge PDP Acquisition PDP Drilling Jan 07 to Feb 09 1.5 Rigs Drilling Program Production Increased from 900 Boe/d to 4100 Boe/d |
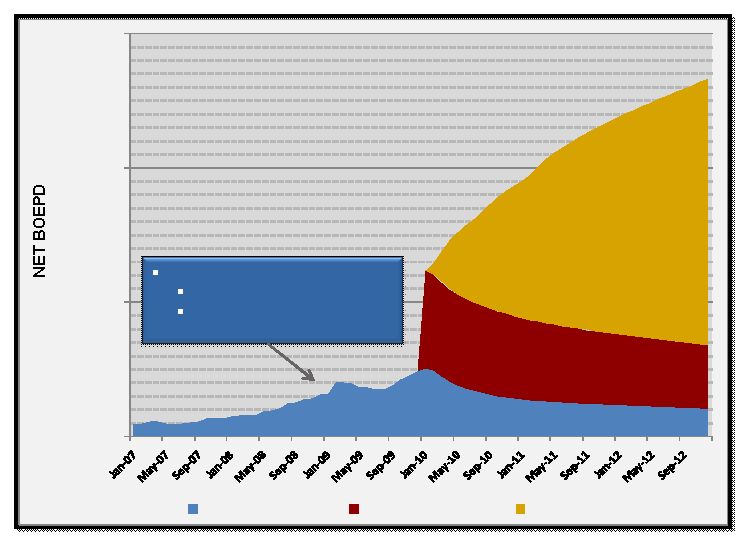
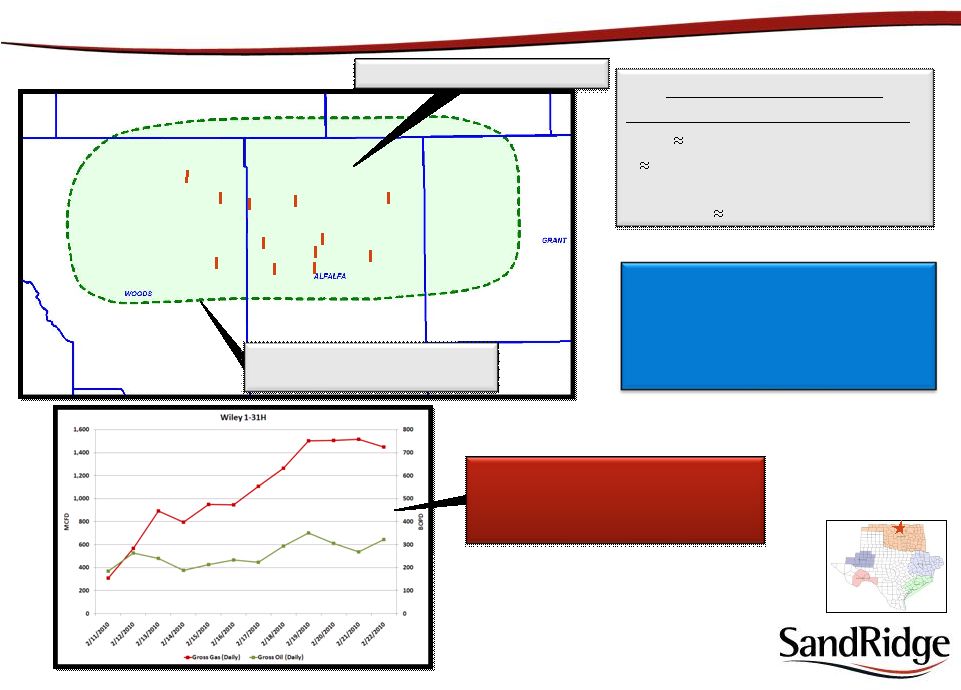  26 SandRidge Potential MISSISSIPPIAN HORIZONTAL POTENTIAL • Land 115,000 acres (net) • 280 drilling locations • > 320 acre spacing assumption • EUR/WELL 160 Mbo, .45 Bcf NW Oklahoma – Mississippian Horizontal Play MISSISSIPPIAN FAIRWAY TARGETED HORIZONTAL INTERVAL > 40’ SandRidge Operated •WILEY 1-32H 350 Bopd, 1,500 Mcfpd •TALON 1-6H Waiting on Completion Non Op / Industry Activity 12 wells producing Avg First Month IP - 150 Bopd, 400 Mcfpd |
 27 SandRidge Position WOODFORD HORIZONTAL POTENTIAL • Land 45,000 acres • 280 drilling locations • 5-8 Bcfe/well WOODFORD FAIRWAY DEVON ACTIVITY 109,000 net acres 6 Tcfe potential Western Oklahoma – Woodford Play WOODFORD INTERVAL > 100’ CIMAREX ACTIVITY 94,000 net acres 2-3 Tcfe potential WOODFORD FAIRWAY Downdip Limit CLR: Brown 1-2H 7 day test: 4,200 Mcfpd , 100 Bopd CLR: Doris 1-25H Currently Drilling “Siliceous is delicious” – Dirk Van Doren Tonkawa Cleveland Cherokee Sand Redfork Atoka Morrow Springer Chester Osage Woodford Hunton Meramac |
 28 SD Controls > 550,000 Net Acres $20MM – $25MM Drilling Budget in 2010 WTO Exploration: Prospects and Leads Piñon Field 65 MILES 1,300 SQUARE MILES OF 3-D SEISMIC COVERAGE Warwick Caballos Prospects / Leads Sub-Thrust Prospects / Leads (Fusselman & Ellenburger) Leading Edge Note: Diagram is not to scale and is for illustration purposes only |
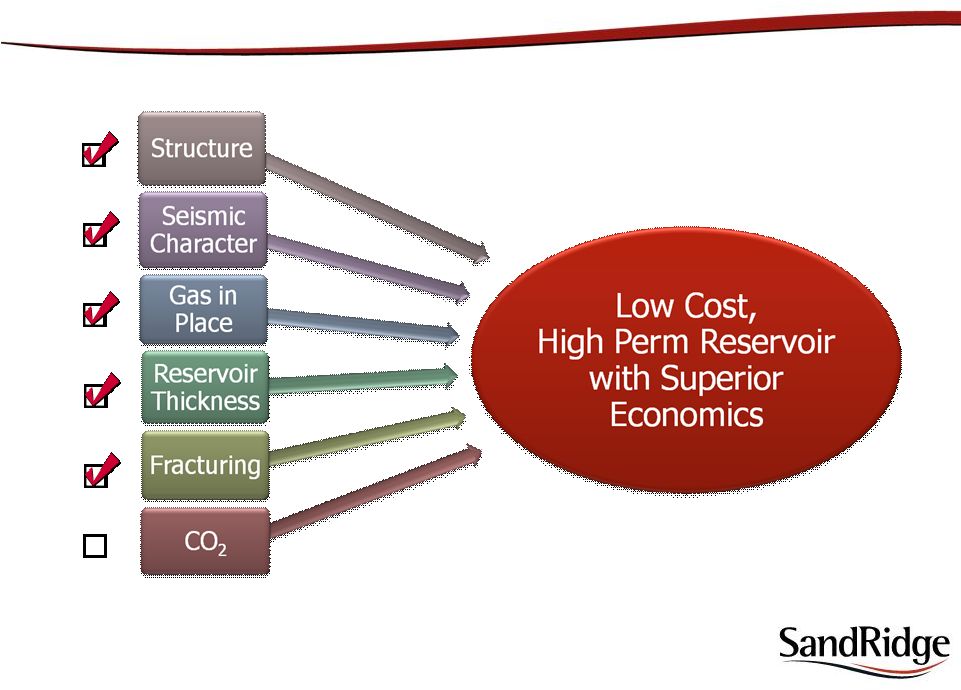 29 6 Exploration Risks in WTO / High Reward |
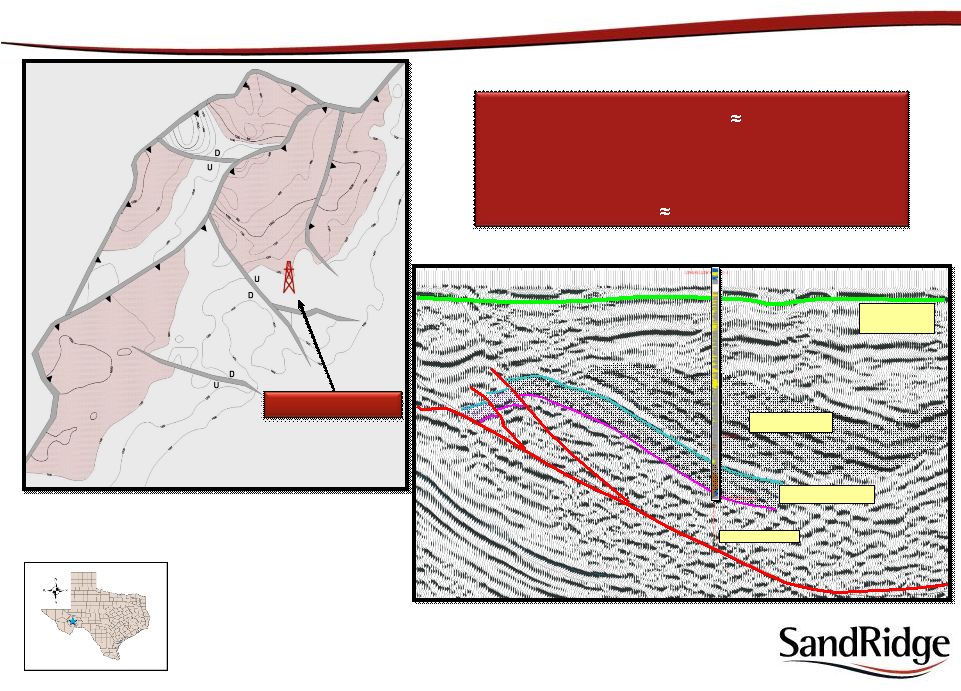   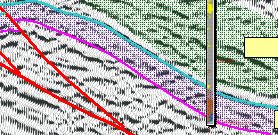      30 Base Cretaceous Top Chert Interval Penn Interval Penn Interval Exploration Well #1 Western WTO: Warwick Caballos Prospect Note: Diagram is not to scale and is for illustration purposes only • Warwick/Caballos Prospect 24,000 Acres • Drill Depth – 10,000 Feet • 5000’ Gross Thrusted Interval • Unrisked Potential 14 Tcfe Top Caballos Interval Time Structure Map |
 31 18 Miles Exploration Well #1 •Top of Cab 8,558’ •Gross interval thickness 904’ •Avg x-plot porosity of 2-3% •High Resistivity in the Chert •On the back-limb of a structural high •Down dip from the crest of the structure •Background gas to 85 units Type Well (Piñon Field) •Top of Cab 8,357’ •Gross interval thickness 637’ •Avg x-plot porosity of 2-3% •High Resistivity in the Chert •On the back-limb of a structural high •Down dip from the crest of a structure •Background gas to 70 units •Production from the Chert •EUR 7.5B wet Type Well (Piñon Field) •Top of Cab 8,357’ •Gross interval thickness 637’ •Avg x-plot porosity of 2-3% •High Resistivity in the Chert •On the back-limb of a structural high •Down dip from the crest of a structure •Background gas to 70 units •Production from the Chert •EUR 7.5B wet Caballos Chert Reservoir Comparison: Piñon Field to Exploration Well #1 Exploration Well #1 TD = 9654’ Type Well (Piñon Field) TD = 9200’ |
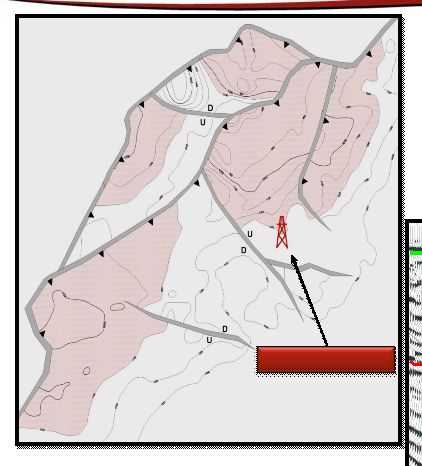
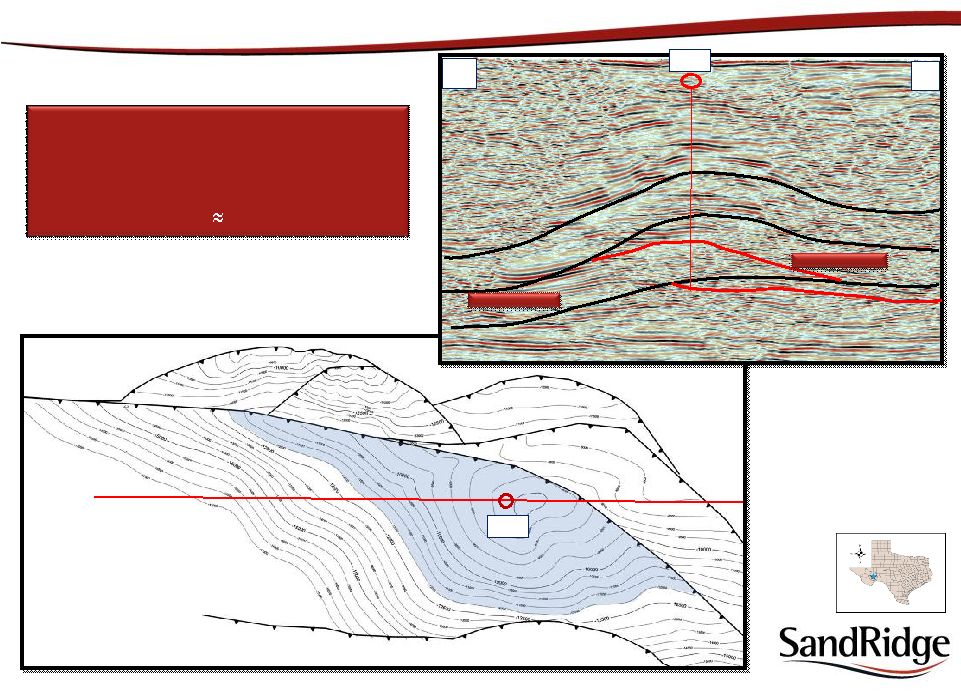 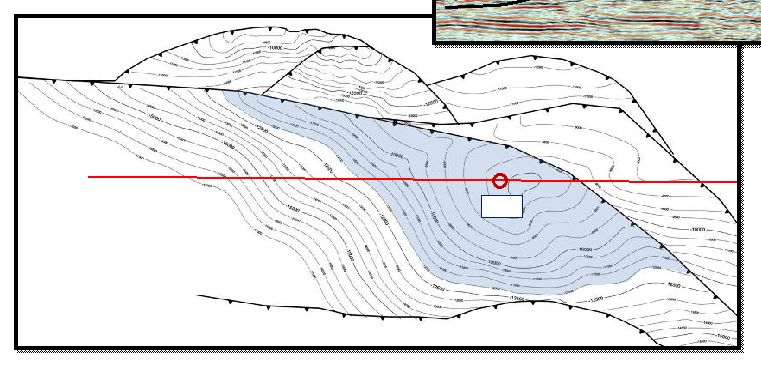 32 • Warwick Prospect – 23,000 Acres • Drill Depth – 9,000 – 11,000 Feet • 5000’ of Structural Closure • Unrisked Potential 16 Tcfe W E Eastern WTO: Warwick Caballos Prospect Top Caballos Interval Depth Structure Map C. I. = 500 ft Thrust Fault Top Cab Interval E W Note: Diagram is not to scale and is for illustration purposes only LOC LOC |
 33 35 Miles Exploration Well #2 Piñon Tesnus Well Tesnus Reservoir Sand Comparison: Piñon Field to Exploration Well #2 Exploration Well #2 •419’ Gross Section •177’ Net Pay •10% Avg X-Plot Porosity •1597u Max Gas Piñon Tesnus Well •464’ Gross Section •190’ Net Pay •13% Avg X-Plot Porosity •1222u Max Gas IP: 2,200 MCF EUR: 1.5 BCF |
 |