Exhibit 99.1
SANDRIDGE ENERGY
INVESTOR PRESENTATION
September 2016
Sandridge the power of us
CAUTIONARY STATEMENTS
Forward Looking Statement
This presentation includes “forward-looking statements” within the meaning of Section 27A of the Securities Act of 1933, as amended, and Section 21E of the Securities Exchange Act of 1934, as amended. These statements express a belief, expectation or intention and are generally accompanied by words that convey projected future events or outcomes. The forward-looking statements include statements about the company’s corporate strategies, future operations, development plans and appraisal programs, our drilling inventory and locations, estimated production, rates of return, reserves, projections and estimates of net income and EBITDA, projected capital expenditures, projected operating, general and administrative and other costs, anticipated efficiency and cost reduction initiative outcomes, the acquisition of seismic data, infrastructure utilization and investment, liquidity, capital structure, hedging position and strategies, and price realizations and differentials. We have based these forward-looking statements on our current expectations and assumptions and analyses made by us in light of our experience and our perception of historical trends, current conditions and expected future developments, as well as other factors we believe are appropriate under the circumstances. However, whether actual results and developments will conform with our expectations and predictions is subject to a number of risks and uncertainties, including the volatility of oil and natural gas prices, our success in discovering, estimating, and developing oil and natural gas reserves, the availability and terms of capital, our timely execution of hedge transactions, credit conditions of global capital markets, changes in economic conditions, regulatory changes and other factors, many of which are beyond our control. We refer you to the discussion of risk factors in Part I, Item 1A – “Risk Factors” of our Annual Report on Form 10-K for the year ended December 31, 2015 and in comparable “Risk Factors” sections of our Quarterly Reports on Form 10-Q filed after the date of this presentation. All of the forward-looking statements made in this presentation are qualified by these cautionary statements. The actual results or developments anticipated may not be realized or, even if substantially realized, they may not have the expected consequences to or effects on our company or our business or operations. Such statements are not guarantees of future performance and actual results or developments may differ materially from those projected in the forward-looking statements. We undertake no obligation to update or revise any forward-looking statements.
The SEC permits oil and natural gas companies, in their filings with the SEC, to disclose only proved, probable and possible reserves, as each is defined by the SEC. At times we use the terms “EUR” (estimated ultimate recovery) and “recoverable reserves” that the SEC’s guidelines prohibit us from including in filings with the SEC. These estimates are by their nature more speculative than estimates of proved, probable or possible reserves and, accordingly, are subject to substantially greater risk of being actually realized by the company. For a discussion of the company’s proved reserves, as calculated under current SEC rules, we refer you to the company’s amended Annual Report on Form 10-K referenced above, which is available on our website at www.sandridgeenergy.com and at the SEC’s website at www.sec.gov.
www.SandRidgeEnergy.com 1
SANDRIDGE ENERGY
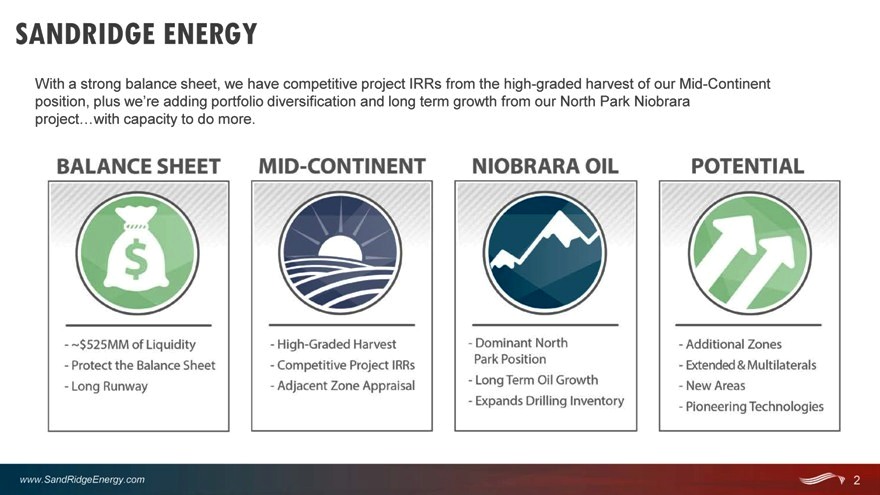
With a strong balance sheet, we have competitive project IRRs from the high-graded harvest of our Mid-Continent position, plus we’re adding portfolio diversification and long term growth from our North Park Niobrara project…with capacity to do more.
balance sheet—~$525 MM of Liquidity – protect the Balance sheet –Long Runway
MID-continent – high-graded harvest – competitive project IRRs –Adjacent Zone Appraisal
Niobrara oil – dominant North park position – log term oil growth – expands drilling inventory
Potential – Additional Zones – Extended & Multilaterals – New Ares –Ploneering Technologies www.SandRidgeEnergy.com 2
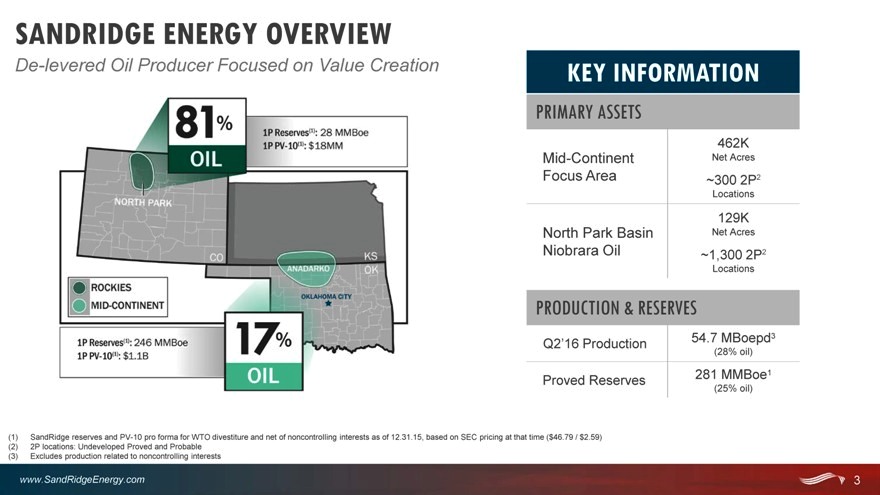
SANDRIDGE ENERGY OVERVIEW
De-levered Oil Producer Focused on Value Creation
KEY INFORMATION
PRIMARY ASSETS
462K
Mid-Continent Net Acres Focus Area ~300 2P2
Locations
129K
North Park Basin Net Acres Niobrara Oil ~1,300 2P2
Locations
PRODUCTION & RESERVES
54.7 MBoepd3 Q2’16 Production
(28% oil)
281 MMBoe1 Proved Reserves
(25% oil)
(1) SandRidge reserves and PV-10 pro forma for WTO divestiture and net of noncontrolling interests as of 12.31.15, based on SEC pricing at that time ($46.79 / $2.59) (2) 2P locations: Undeveloped Proved and Probable (3) Excludes production related to noncontrolling interests
www.SandRidgeEnergy.com 3
MID-CONTINENT EXPERTISE EXPANDING INTO THE NIOBRARA
$225MM—$255MM Capital Budget in 2016 in Two Major Project Areas
MID-CONTINENT: HIGH-GRADED HARVEST
One rig active most of 2016
High-graded harvest of Mid-Continent position to manage decline rates
~$2MM per lateral costs
Appraise adjacent plays
Generate flow stability competitive while advancing returns innovations at the strip and cash
NIOBRARA: INITIATE OIL PROGRAM
One rig active through August 2016
Initiate Niobrara oil development program
Line of sight to sub-$4MM per lateral costs
+ Room to improve costs and optimize completions
Deploy extended laterals and assess multilateral potential and additional Niobrara benches
Our combined programs diversify and reduce risk by drilling a higher percentage of proved locations plus sharing expertise and best practices between the two areas. Continue improving both capital and expense efficiency.
www.SandRidgeEnergy.com 4
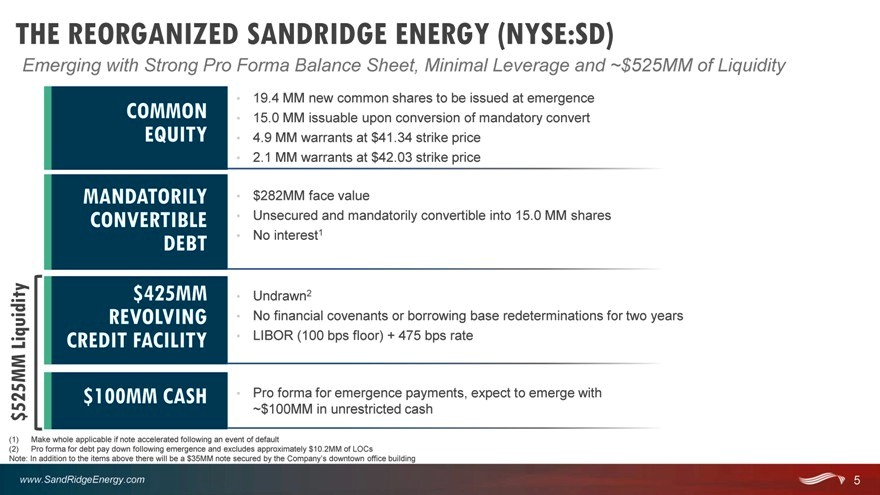
THE REORGANIZED SANDRIDGE ENERGY (NYSE:SD)
Emerging with Strong Pro Forma Balance Sheet, Minimal Leverage and ~$525MM of Liquidity
COMMON 19.4 MM new common shares to be issued at emergence 15.0 MM issuable upon conversion of mandatory convert EQUITY 4.9 MM warrants at $41.34 strike price
2.1 MM warrants at $42.03 strike price
MANDATORILY $282MM face value
CONVERTIBLE Unsecured and mandatorily convertible into 15.0 MM shares DEBT No interest1 $425MM Undrawn2
REVOLVING No financial covenants or borrowing base redeterminations for two years Liquidity CREDIT FACILITY LIBOR (100 bps floor) + 475 bps rate 525MM $100MM CASH Pro forma for emergence payments, expect to emerge with
~$100MM in unrestricted cash
$
(1) | | Make whole applicable if note accelerated following an event of default |
(2) | | Pro forma for debt pay down following emergence and excludes approximately $10.2MM of LOCs |
Note: In addition to the items above there will be a $35MM note secured by the Company’s downtown office building
www.SandRidgeEnergy.com 5
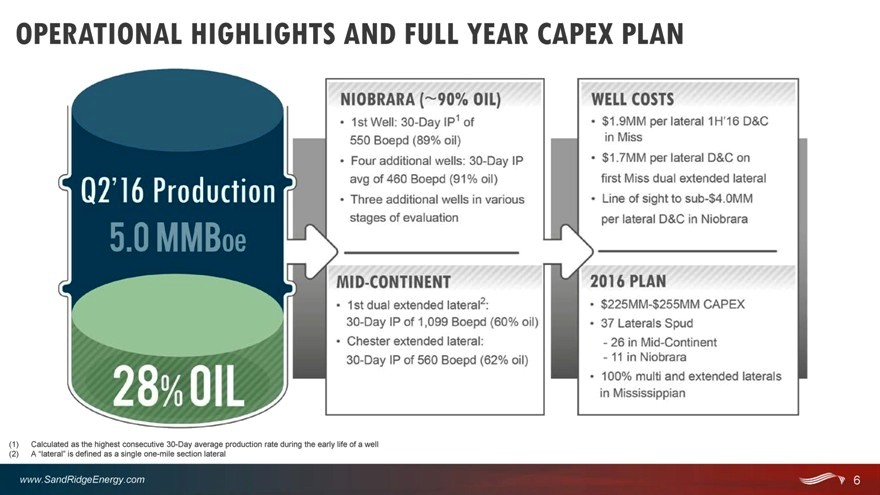
OPERATIONAL HIGHLIGHTS AND FULL YEAR CAPEX PLAN
Q2’16 production 5.0 mmBoe 28% oil
Nibrara (90% oil)
1st well: 30-day IP1 of 550 Boepd (89% oil) four additional wells: 30-day IP avg of 460 Boepd (91% oil) three additional wells in various stages of evaluation
Well costs
$1.9MM per lateral 1H’16 D&C in Miss $1.7MM per lateral D&C on first Miss dual extended lateral Line of sight to sub-$4.0MM per lateral D&C in Niobrara
Mid-continent 1st dual extended laterla2: 30-day IP of 1,099 Boepd (60% oil) chester extended lateral: 30-day ip of 560 boepd (62% oil)
2016 plan $225MM-$255MM CAPEX 37 lateral spud -26 in mid-continent 11 in Niobrara
100% muli and extended laterals in mississippian
(1) Calculated as the highest consecutive 30-Day average production rate during the early life of a well (2) A “lateral” is defined as a single one-mile section lateral
www.SandRidgeEnergy.com 6
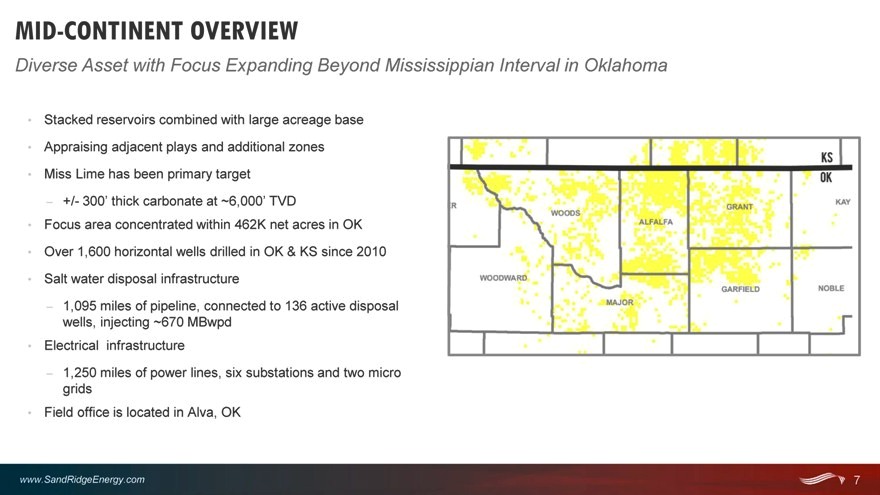
MID-CONTINENT OVERVIEW
Diverse Asset with Focus Expanding Beyond Mississippian Interval in Oklahoma
Stacked reservoirs combined with large acreage base
Appraising adjacent plays and additional zones
Miss Lime has been primary target
? +/- 300’ thick carbonate at ~6,000’ TVD
Focus area concentrated within 462K net acres in OK
Over 1,600 horizontal wells drilled in OK & KS since 2010
Salt water disposal infrastructure
? 1,095 miles of pipeline, connected to 136 active disposal wells, injecting ~670 MBwpd
Electrical infrastructure
? 1,250 miles of power lines, six substations and two micro grids
Field office is located in Alva, OK
KS OK R WOODS WOODWARD ALFALFA MAJOR GARFIELD GRANT KAY NOBLE
www.SandRidgeEnergy.com 7
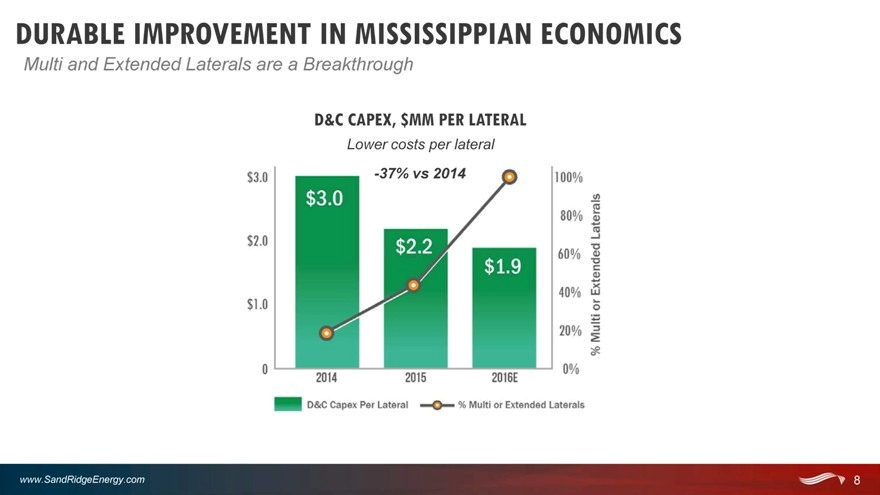
DURABLE IMPROVEMENT IN MISSISSIPPIAN ECONOMICS
Multi and Extended Laterals are a Breakthrough
D&C CAPEX, $MM PER LATERAL
Lower costs per lateral
-37% vs 2014
D&C CAPEX, SMM PER LATERAL
Lower costs per lateral
$3.0 $2.0 $1.0 0
100% 80% 60% 40% 20% 0%
2014 2015 2016E
$3.0 $2.2 $1.9
-37% vs 2014
D&C Capex per Lateral
% Multi or Extended Laterals
www.SandRidgeEnergy.com 8
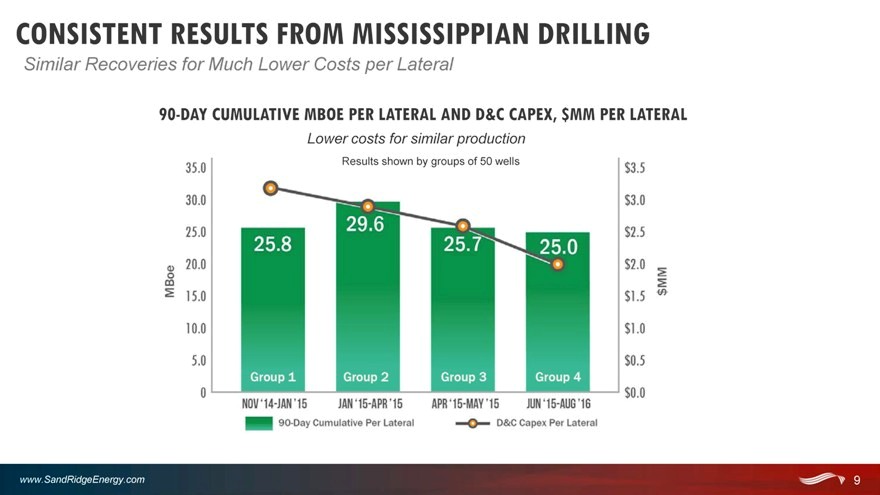
CONSISTENT RESULTS FROM MISSISSIPPIAN DRILLING
Similar Recoveries for Much Lower Costs per Lateral
90-DAY CUMULATIVE MBOE PER LATERAL AND D&C CAPEX, $MM PER LATERAL
Lower costs for similar production
35.0 30.0 25.0 20.0 15.0 10.0 5.0 0
MBoe
25.8
29.6
25.7
25.0
Group 1
Group 2
Group 3
Group 4
NOV ‘14-JAN ‘15
JAN ‘15-AP ‘15
APR 15-MAY ‘15
JUN ‘15-AUG ‘16
$3.5 $3.0 $2.5 $2.0 $1.5 $1.0 $0.5 $0.0
Lower costs for similar production
Results shown by groups of 50 wells
www.SandRidgeEnergy.com 9
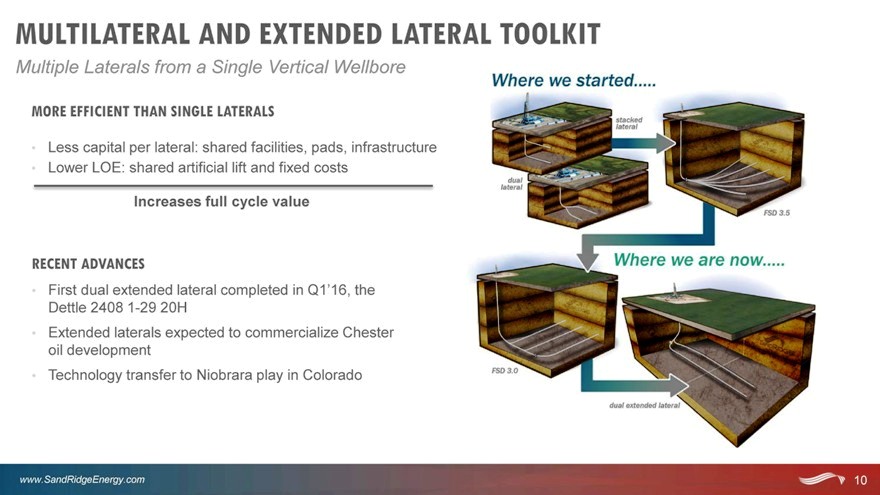
MULTILATERAL AND EXTENDED LATERAL TOOLKIT
Multiple Laterals from a Single Vertical Wellbore
MORE EFFICIENT THAN SINGLE LATERALS
Less capital per lateral: shared facilities, pads, infrastructure
Lower LOE: shared artificial lift and fixed costs
Increases full cycle value
RECENT ADVANCES
First dual extended lateral completed in Q1’16, the Dettle 2408 1-29 20H
Extended laterals expected to commercialize Chester oil development
Technology transfer to Niobrara play in Colorado
www.SandRidgeEnergy.com 10
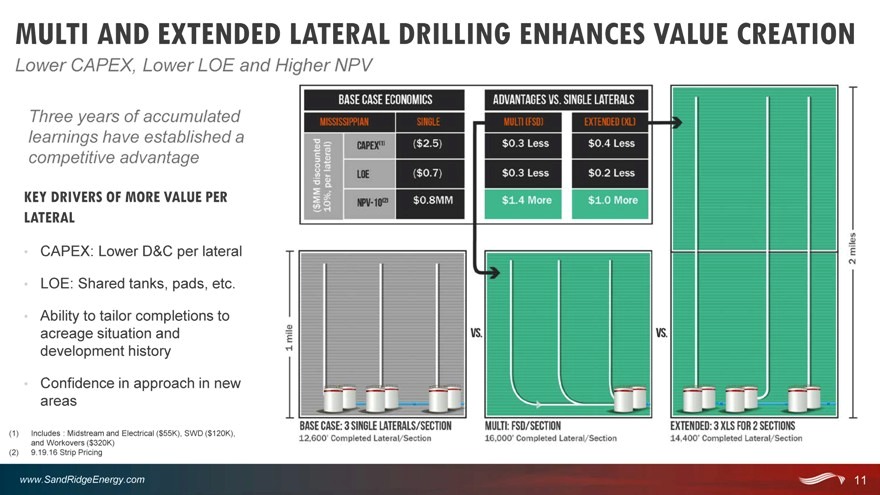
MULTI AND EXTENDED LATERAL DRILLING ENHANCES VALUE CREATION
Lower CAPEX, Lower LOE and Higher NPV
Three years of accumulated learnings have established a competitive advantage
KEY DRIVERS OF MORE VALUE PER LATERAL
CAPEX: Lower D&C per lateral
LOE: Shared tanks, pads, etc.
Ability to tailor completions to acreage situation and development history
Confidence in approach in new areas
(1) | | Includes : Midstream and Electrical ($55K), SWD ($120K), and Workovers ($320K) (2) 9.19.16 Strip Pricing |
www.SandRidgeEnergy.com 11
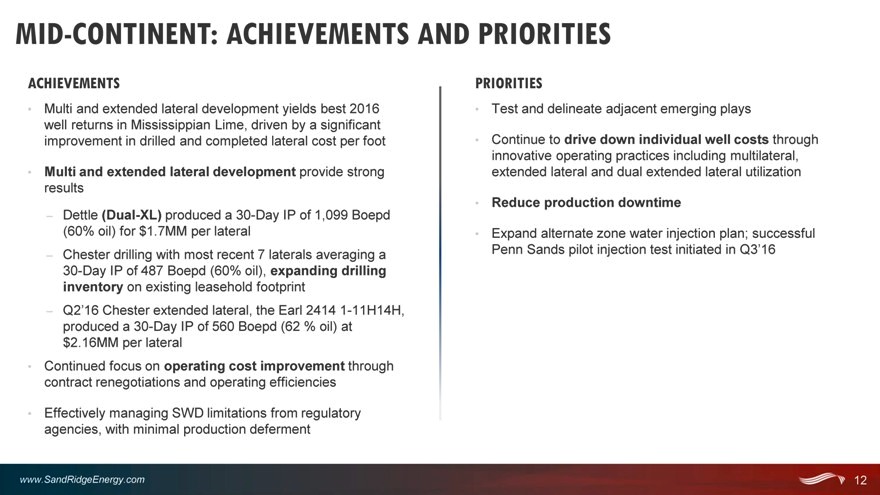
MID-CONTINENT: ACHIEVEMENTS AND PRIORITIES
ACHIEVEMENTS
Multi and extended lateral development yields best 2016 well returns in Mississippian Lime, driven by a significant improvement in drilled and completed lateral cost per foot
Multi and extended lateral development provide strong results
– Dettle (Dual-XL) produced a 30-Day IP of 1,099 Boepd (60% oil) for $1.7MM per lateral
– Chester drilling with most recent 7 laterals averaging a 30-Day IP of 487 Boepd (60% oil), expanding drilling inventory on existing leasehold footprint
– Q2’16 Chester extended lateral, the Earl 2414 1-11H14H, produced a 30-Day IP of 560 Boepd (62 % oil) at $2.16MM per lateral
Continued focus on operating cost improvement through contract renegotiations and operating efficiencies
Effectively managing SWD limitations from regulatory agencies, with minimal production deferment
PRIORITIES
Test and delineate adjacent emerging plays
Continue to drive down individual well costs through innovative operating practices including multilateral, extended lateral and dual extended lateral utilization
Reduce production downtime
Expand alternate zone water injection plan; successful Penn Sands pilot injection test initiated in Q3’16
www.SandRidgeEnergy.com 12
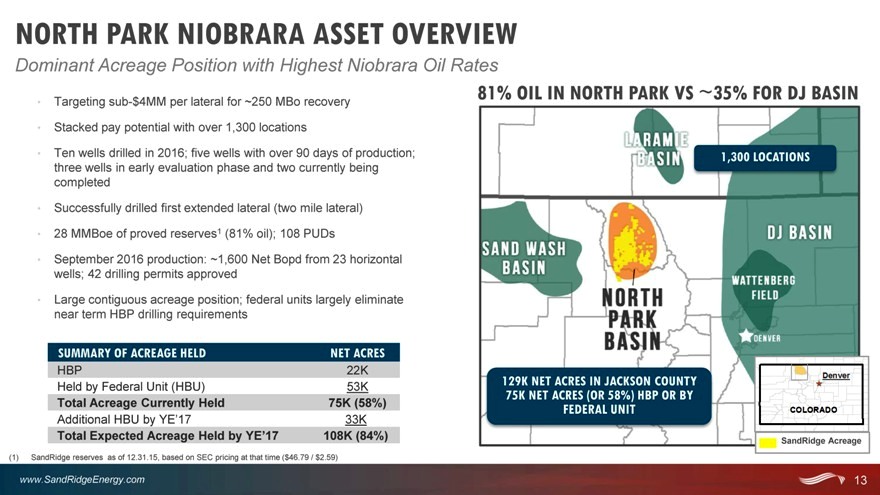
NORTH PARK NIOBRARA ASSET OVERVIEW
Dominant Acreage Position with Highest Niobrara Oil Rates
Targeting sub-$4MM per lateral for ~250 MBo recovery
Stacked pay potential with over 1,300 locations
Ten wells drilled in 2016; five wells with over 90 days of production; three wells in early evaluation phase and two currently being completed
Successfully drilled first extended lateral (two mile lateral)
28 MMBoe of proved reserves1 (81% oil); 108 PUDs
September 2016 production: ~1,600 Net Bopd from 23 horizontal wells; 42 drilling permits approved
Large contiguous acreage position; federal units largely eliminate near term HBP drilling requirements
SUMMARY OF ACREAGE HELD NET ACRES
HBP 22K Held by Federal Unit (HBU) 53K
Total Acreage Currently Held 75K (58%)
Additional HBU by YE’17 33K
Total Expected Acreage Held by YE’17 108K (84%)
(1) | | SandRidge reserves as of 12.31.15, based on SEC pricing at that time ($46.79 / $2.59) |
81% OIL IN NORTH PARK VS ~35% FOR DJ BASIN
1,300 LOCATIONS
129K NET ACRES IN JACKSON COUNTY 75K NET ACRES (OR 58%) HBP OR BY
FEDERAL UNIT
SandRidge Acreage
www.SandRidgeEnergy.com 13
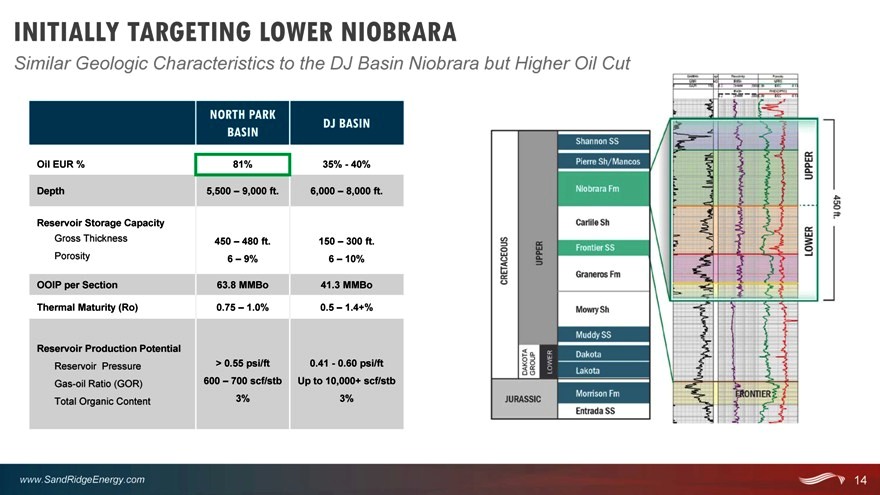
INITIALLY TARGETING LOWER NIOBRARA
Similar Geologic Characteristics to the DJ Basin Niobrara but Higher Oil Cut
NORTH PARK
DJ BASIN BASIN
Oil EUR % 81% 35%—40%
Depth 5,500 – 9,000 ft. 6,000 – 8,000 ft.
Reservoir Storage Capacity Gross Thickness 450 – 480 ft. 150 – 300 ft.
Porosity 6 – 9% 6 – 10%
OOIP per Section 63.8 MMBo 41.3 MMBo Thermal Maturity (Ro) 0.75 – 1.0% 0.5 – 1.4+%
Reservoir Production Potential Reservoir Pressure > 0.55 psi/ft 0.41—0.60 psi/ft Gas-oil Ratio (GOR) 600 – 700 scf/stb Up to 10,000+ scf/stb
Total Organic Content 3% 3%
www.SandRidgeEnergy.com 14
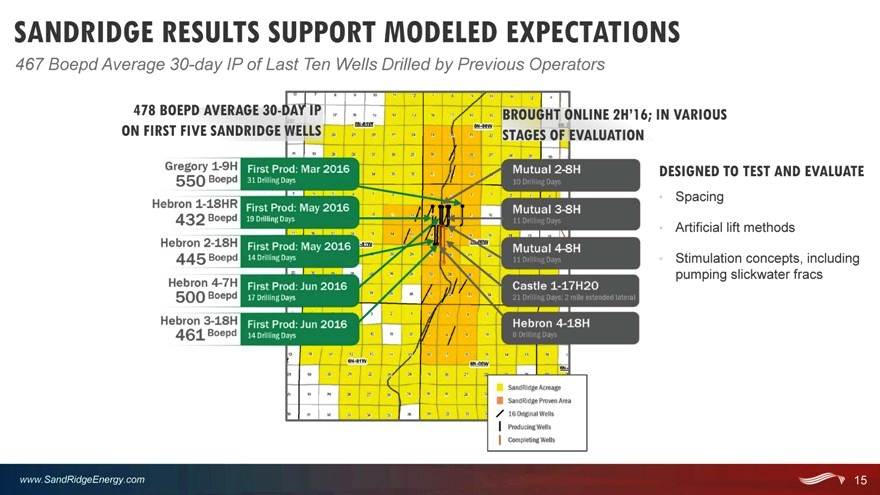
SANDRIDGE RESULTS SUPPORT MODELED EXPECTATIONS
467 Boepd Average 30-day IP of Last Ten Wells Drilled by Previous Operators
478 BOEPD AVERAGE 30-DAY IP BROUGHT ONLINE 2H’16; IN VARIOUS ON FIRST FIVE SANDRIDGE WELLS STAGES OF EVALUATION
DESIGNED TO TEST AND EVALUATE
Spacing
Artificial lift methods
Stimulation concepts, including pumping slickwater fracs
www.SandRidgeEnergy.com 15
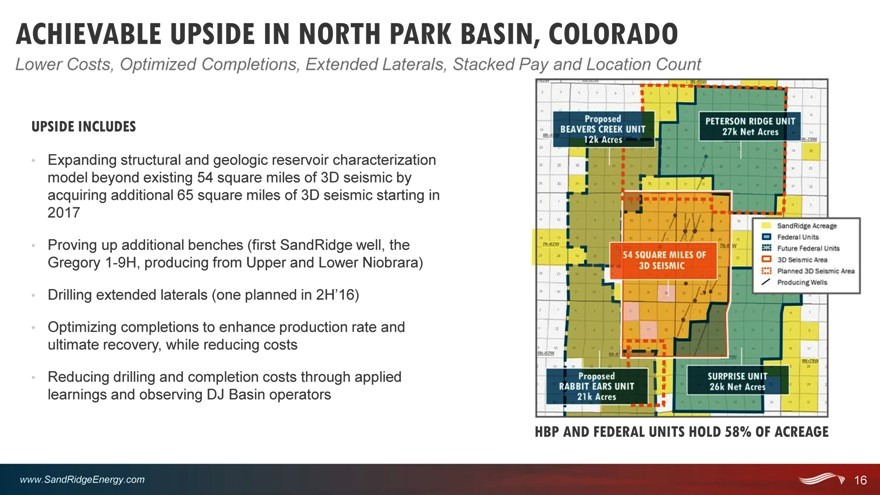
ACHIEVABLE UPSIDE IN NORTH PARK BASIN, COLORADO
Lower Costs, Optimized Completions, Extended Laterals, Stacked Pay and Location Count
UPSIDE INCLUDES
Expanding structural and geologic reservoir characterization model beyond existing 54 square miles of 3D seismic by acquiring additional 65 square miles of 3D seismic starting in 2017
Proving up additional benches (first SandRidge well, the Gregory 1-9H, producing from Upper and Lower Niobrara)
Drilling extended laterals (one planned in 2H’16)
Optimizing completions to enhance production rate and ultimate recovery, while reducing costs
Reducing drilling and completion costs through applied learnings and observing DJ Basin operators
HBP AND FEDERAL UNITS HOLD 58% OF ACREAGE
www.SandRidgeEnergy.com 16
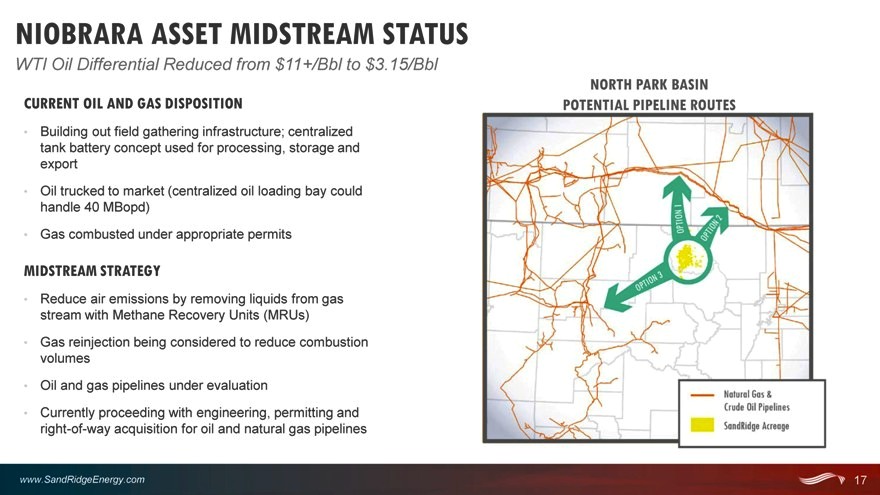
NIOBRARA ASSET MIDSTREAM STATUS
WTI Oil Differential Reduced from $11+/Bbl to $3.15/Bbl
CURRENT OIL AND GAS DISPOSITION
Building out field gathering infrastructure; centralized tank battery concept used for processing, storage and export
Oil trucked to market (centralized oil loading bay could handle 40 MBopd)
Gas combusted under appropriate permits
MIDSTREAM STRATEGY
Reduce air emissions by removing liquids from gas stream with Methane Recovery Units (MRUs)
Gas reinjection being considered to reduce combustion volumes
Oil and gas pipelines under evaluation
Currently proceeding with engineering, permitting and right-of-way acquisition for oil and natural gas pipelines
NORTH PARK BASIN POTENTIAL PIPELINE ROUTES
www.SandRidgeEnergy.com 17
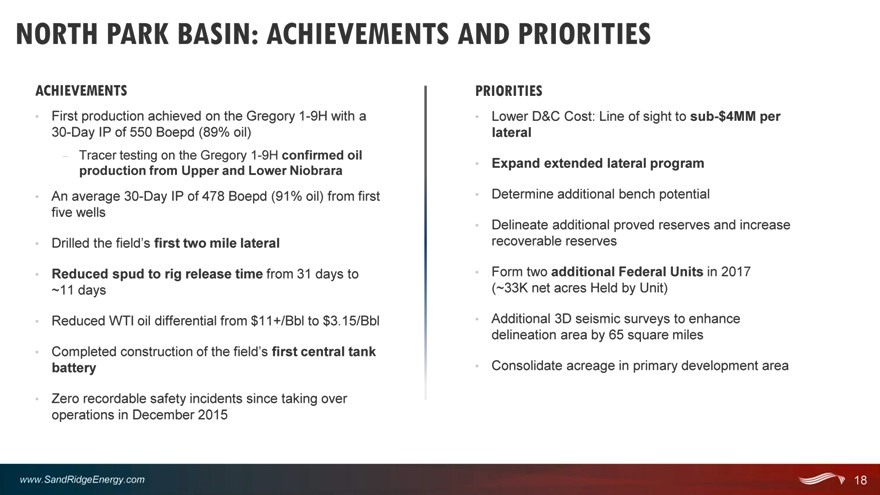
NORTH PARK BASIN: ACHIEVEMENTS AND PRIORITIES
ACHIEVEMENTS
First production achieved on the Gregory 1-9H with a 30-Day IP of 550 Boepd (89% oil)
– Tracer testing on the Gregory 1-9H confirmed oil production from Upper and Lower Niobrara
An average 30-Day IP of 478 Boepd (91% oil) from first five wells
Drilled the field’s first two mile lateral
Reduced spud to rig release time from 31 days to ~11 days
Reduced WTI oil differential from $11+/Bbl to $3.15/Bbl
Completed construction of the field’s first central tank battery
Zero recordable safety incidents since taking over operations in December 2015
PRIORITIES
Lower D&C Cost: Line of sight to sub-$4MM per lateral
Expand extended lateral program
Determine additional bench potential
Delineate additional proved reserves and increase recoverable reserves
Form two additional Federal Units in 2017 (~33K net acres Held by Unit)
Additional 3D seismic surveys to enhance delineation area by 65 square miles
Consolidate acreage in primary development area
www.SandRidgeEnergy.com 18
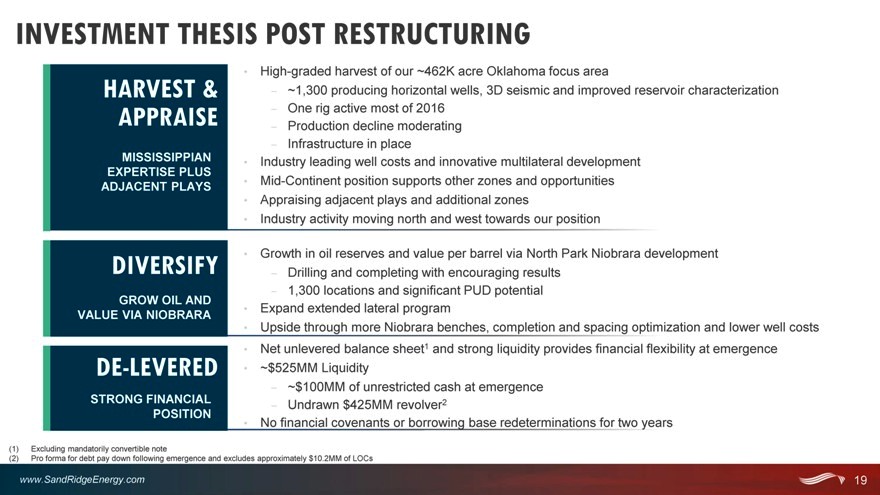
INVESTMENT THESIS POST RESTRUCTURING
HARVEST & APPRAISE
MISSISSIPPIAN EXPERTISE PLUS ADJACENT PLAYS
High-graded harvest of our ~462K acre Oklahoma focus area
– ~1,300 producing horizontal wells, 3D seismic and improved reservoir characterization
– One rig active most of 2016
– Production decline moderating
– Infrastructure in place
Industry leading well costs and innovative multilateral development Mid-Continent position supports other zones and opportunities Appraising adjacent plays and additional zones Industry activity moving north and west towards our position
DIVERSIFY
GROW OIL AND VALUE VIA NIOBRARA
Growth in oil reserves and value per barrel via North Park Niobrara development
– Drilling and completing with encouraging results
– 1,300 locations and significant PUD potential
Expand extended lateral program
Upside through more Niobrara benches, completion and spacing optimization and lower well costs
DE-LEVERED
STRONG FINANCIAL POSITION
Net unlevered balance sheet1 and strong liquidity provides financial flexibility at emergence
~$525MM Liquidity
– ~$100MM of unrestricted cash at emergence
– Undrawn $425MM revolver2
No financial covenants or borrowing base redeterminations for two years
(1) | | Excluding mandatorily convertible note |
(2) | | Pro forma for debt pay down following emergence and excludes approximately $10.2MM of LOCs |
www. SandRidgeEnergy.com 19
APPENDIX
Sandridge the power us
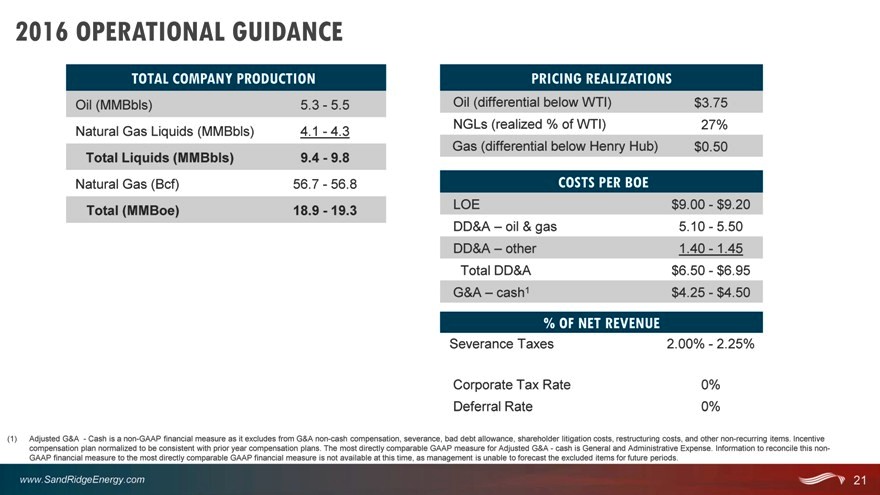
2016 OPERATIONAL GUIDANCE
TOTAL COMPANY PRODUCTION
Oil (MMBbls) 5.3—5.5 Natural Gas Liquids (MMBbls) 4.1—4.3
Total Liquids (MMBbls) 9.4—9.8
Natural Gas (Bcf) 56.7—56.8 Total (MMBoe) 18.9—19.3
PRICING REALIZATIONS
Oil (differential below WTI) $3.75 NGLs (realized % of WTI) 27% Gas (differential below Henry Hub) $0.50
COSTS PER BOE
LOE $9.00—$9.20 DD&A – oil & gas 5.10—5.50 DD&A – other 1.40—1.45 Total DD&A $6.50—$6.95 G&A – cash1 $4.25—$4.50
% OF NET REVENUE
Severance Taxes 2.00%—2.25%
Corporate Tax Rate 0% Deferral Rate 0%
(1) Adjusted G&A—Cash is a non-GAAP financial measure as it excludes from G&A non-cash compensation, severance, bad debt allowance, shareholder litigation costs, restructuring costs, and other non-recurring items. Incentive compensation plan normalized to be consistent with prior year compensation plans. The most directly comparable GAAP measure for Adjusted G&A—cash is General and Administrative Expense. Information to reconcile this non-GAAP financial measure to the most directly comparable GAAP financial measure is not available at this time, as management is unable to forecast the excluded items for future periods.
www.SandRidgeEnergy.com 21
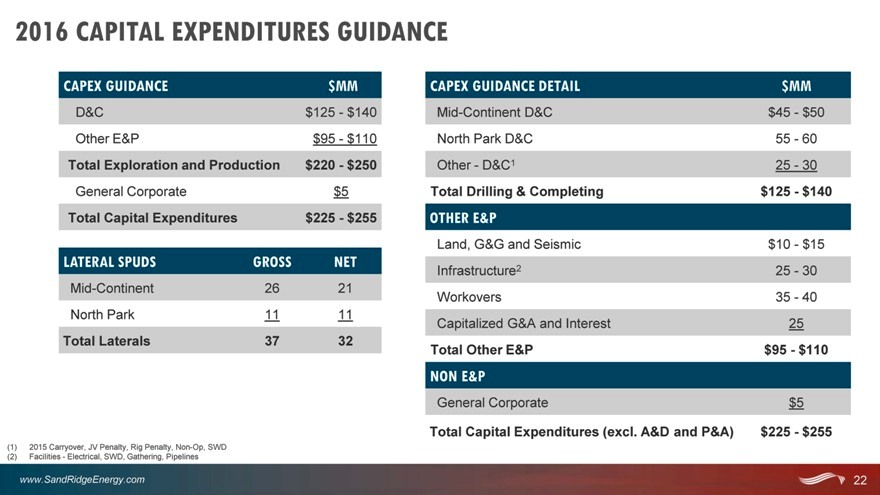
2016 CAPITAL EXPENDITURES GUIDANCE
CAPEX GUIDANCE $MM
D&C $125—$140 Other E&P $95—$110
Total Exploration and Production $220—$250
General Corporate $5
Total Capital Expenditures $225—$255
LATERAL SPUDS GROSS NET
Mid-Continent 26 21 North Park 11 11
Total Laterals 37 32
CAPEX GUIDANCE DETAIL $MM
Mid-Continent D&C $45—$50 North Park D&C 55—60 Other—D&C1 25—30
Total Drilling & Completing $125—$140
OTHER E&P
Land, G&G and Seismic $10—$15 Infrastructure2 25—30 Workovers 35—40 Capitalized G&A and Interest 25
Total Other E&P $95—$110
NON E&P
General Corporate $5
Total Capital Expenditures (excl. A&D and P&A) $225—$255
(1) | | 2015 Carryover, JV Penalty, Rig Penalty, Non-Op, SWD (2) Facilities—Electrical, SWD, Gathering, Pipelines |
www.SandRidgeEnergy.com 22
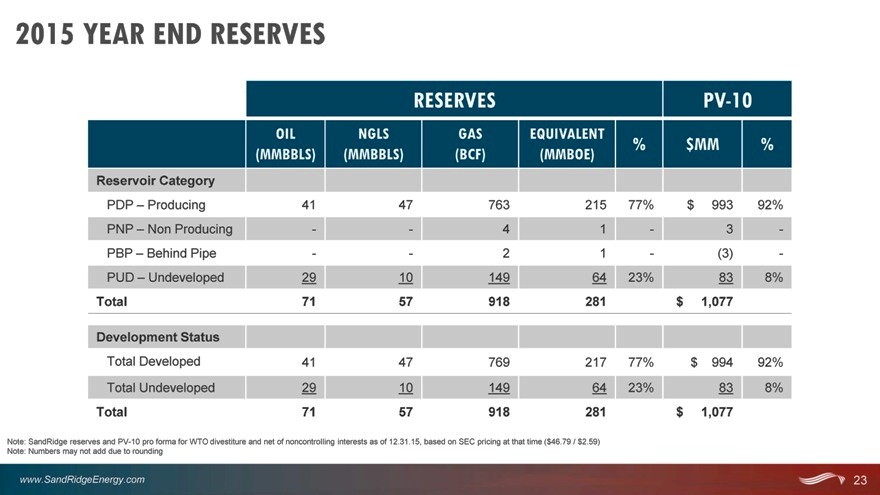
2015 YEAR END RESERVES
RESERVES PV-10
OIL NGLS GAS EQUIVALENT
% $MM %
(MMBBLS) (MMBBLS) (BCF) (MMBOE)
Reservoir Category
PDP – Producing 41 47 763 215 77% $ 993 92% PNP – Non Producing — 4 1—3—PBP – Behind Pipe — 2 1—(3)—PUD – Undeveloped 29 10 149 64 23% 83 8%
Total 71 57 918 281 $ 1,077
Development Status
Total Developed 41 47 769 217 77% $ 994 92% Total Undeveloped 29 10 149 64 23% 83 8%
Total 71 57 918 281 $ 1,077
Note: SandRidge reserves and PV-10 pro forma for WTO divestiture and net of noncontrolling interests as of 12.31.15, based on SEC pricing at that time ($46.79 / $2.59) Note: Numbers may not add due to rounding
www.SandRidgeEnergy.com 23
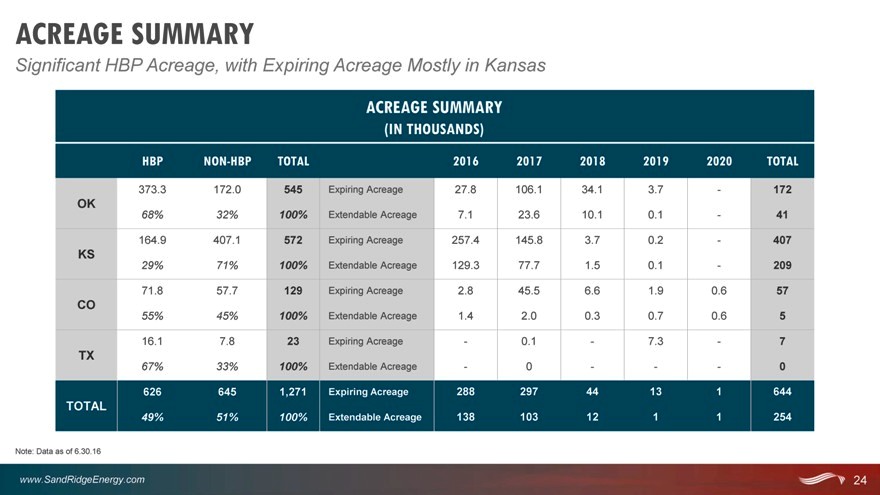
ACREAGE SUMMARY
Significant HBP Acreage, with Expiring Acreage Mostly in Kansas
ACREAGE SUMMARY
(IN THOUSANDS)
HBP NON-HBP TOTAL 2016 2017 2018 2019 2020 TOTAL
373.3 172.0
OK 68% 32%
164.9 407.1
KS 29% 71%
71.8 57.7
CO 55% 45%
16.1 7.8
TX 67% 33%
626 645
TOTAL
49% 51%
545 Expiring Acreage 100% Extendable Acreage 572 Expiring Acreage 100% Extendable Acreage 129 Expiring Acreage 100% Extendable Acreage
23 Expiring Acreage 100% Extendable Acreage
1,271 Expiring Acreage
100% Extendable Acreage
27.8 106.1 34.1 3.7—172
7.1 23.6 10.1 0.1—41 257.4 145.8 3.7 0.2—407 129.3 77.7 1.5 0.1—209
2.8 45.5 6.6 1.9 0.6 57
1.4 2.0 0.3 0.7 0.6 5
- 0.1—7.3—7
- 0 ——0
288 297 44 13 1 644
138 103 12 1 1 254
Note: Data as of 6.30.16
www.SandRidgeEnergy.com 24