March 12, 2015 Q4 and Full Year 2014 Earnings Call

Forward-Looking Statements This presentation contains forward-looking statements within the meaning of the Private Securities Litigation Reform Act of 1995. All statements pertaining to future financial and/or operating results, future growth in research, technology, clinical development and potential opportunities for Cancer Genetics Inc. products and services, Gentris, LLC products and services, or Cancer Genetics (India) Pvt. Ltd. products or services, along with other statements about the future expectations, beliefs, goals, plans or prospects expressed by management constitute forward-looking statements. Any statements that are not historical fact (including, but not limited to, statements that contain words such as, “will,” “believes,” “anticipates,” “expects,” and “estimates”) should also be considered to be forward-looking statements. Forward-looking statements involve risks and uncertainties, including, without limitation, risks inherent in the development and/or commercialization of potential products, risks of cancellation of customer contracts or discontinuance of trials, risks related to integration of the acquisitions of Gentris and BioServe India and the realization of the currently anticipated benefits, uncertainty in the results of clinical trials or regulatory approvals, need and ability to obtain future capital, maintenance of intellectual property rights and other risks discussed in the Company’s Form 10-K for the year ended December 31, 2014** and 2013 and 10-Q for the quarter ended September 30, 2014 along with other filings with the Securities and Exchange Commission. These forward- looking statements speak only as of the date hereof. Cancer Genetics Inc. disclaims any obligation to update these forward-looking statements. ** The 10-K for the year ending December 31, 2014 will be filed no later than March 16, 2015. 2 Cancer Genetics, Inc. | NASDAQ: CGIX | 2014 Earnings Call | March 12, 2015
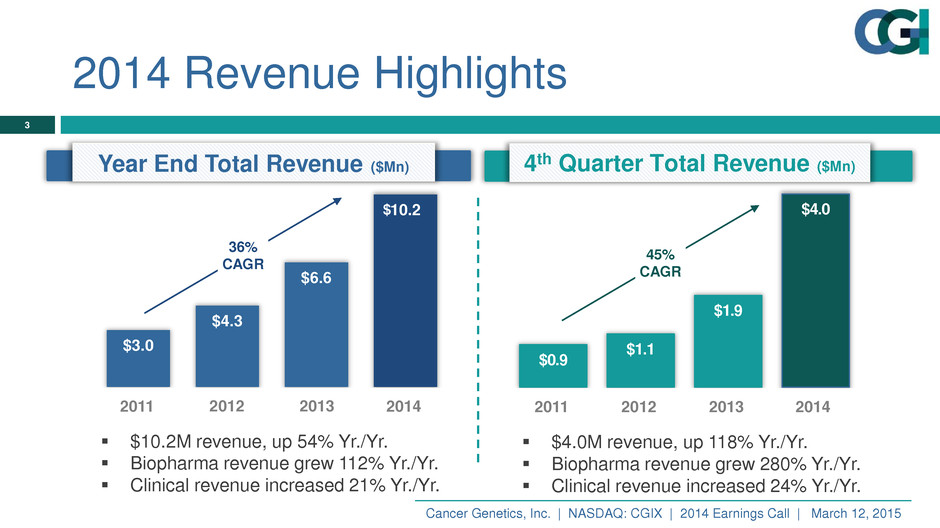
2014 Revenue Highlights 3 Cancer Genetics, Inc. | NASDAQ: CGIX | 2014 Earnings Call | March 12, 2015 $10.2M revenue, up 54% Yr./Yr. Biopharma revenue grew 112% Yr./Yr. Clinical revenue increased 21% Yr./Yr. Year End Total Revenue ($Mn) $3.0 $4.3 $6.6 10.2 2011 2012 2013 2014 $ 36% CAGR 201420132011 2012 4th Quarter Total Revenue ($Mn) $4.0M revenue, up 118% Yr./Yr. Biopharma revenue grew 280% Yr./Yr. Clinical revenue increased 24% Yr./Yr. $0.9 $1.1 $1.9 $4.0 2011 2012 2013 2014 45% CAGR

Revenues By Category 4 Cancer Genetics, Inc. | NASDAQ: CGIX | 2014 Earnings Call | March 12, 2015 * Direct Bill includes hospitals or facilities are billed directly by CGI and not through insurance ** 3rd Party Insurers include non-Medicare and non-Medicaid insurers 2014 43% 55% 2% Clinical Services Biopharma Services Discovery Services Direct Bill* 16% 3rd Party Insurers** 13% Medicare 11% C lin ic a l S er v ic es Grants 5% 55% 40% 5% Clinical Services Biopharma Services Grants 2013 Direct Bill* 18% 3rd Party Insurers** 22% Medicare 13% C lin ic a l S er v ic es
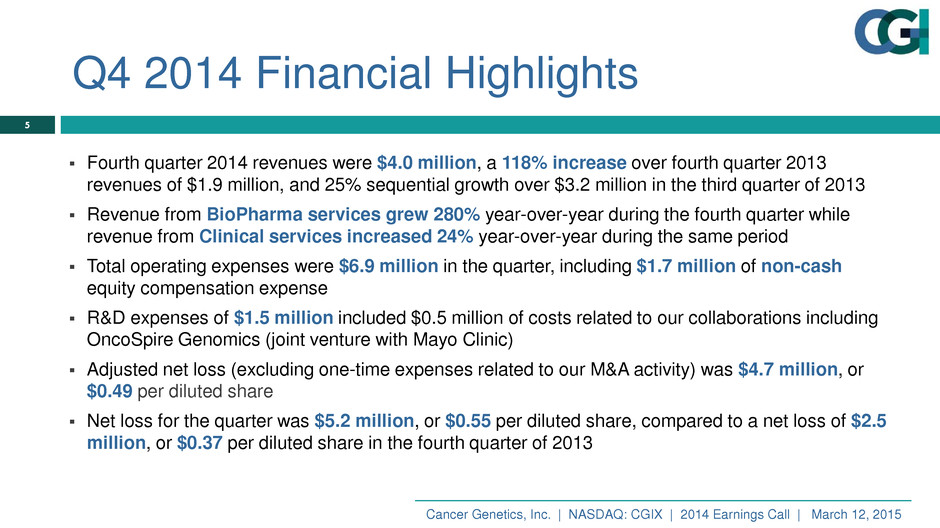
Q4 2014 Financial Highlights 5 Fourth quarter 2014 revenues were $4.0 million, a 118% increase over fourth quarter 2013 revenues of $1.9 million, and 25% sequential growth over $3.2 million in the third quarter of 2013 Revenue from BioPharma services grew 280% year-over-year during the fourth quarter while revenue from Clinical services increased 24% year-over-year during the same period Total operating expenses were $6.9 million in the quarter, including $1.7 million of non-cash equity compensation expense R&D expenses of $1.5 million included $0.5 million of costs related to our collaborations including OncoSpire Genomics (joint venture with Mayo Clinic) Adjusted net loss (excluding one-time expenses related to our M&A activity) was $4.7 million, or $0.49 per diluted share Net loss for the quarter was $5.2 million, or $0.55 per diluted share, compared to a net loss of $2.5 million, or $0.37 per diluted share in the fourth quarter of 2013 Cancer Genetics, Inc. | NASDAQ: CGIX | 2014 Earnings Call | March 12, 2015
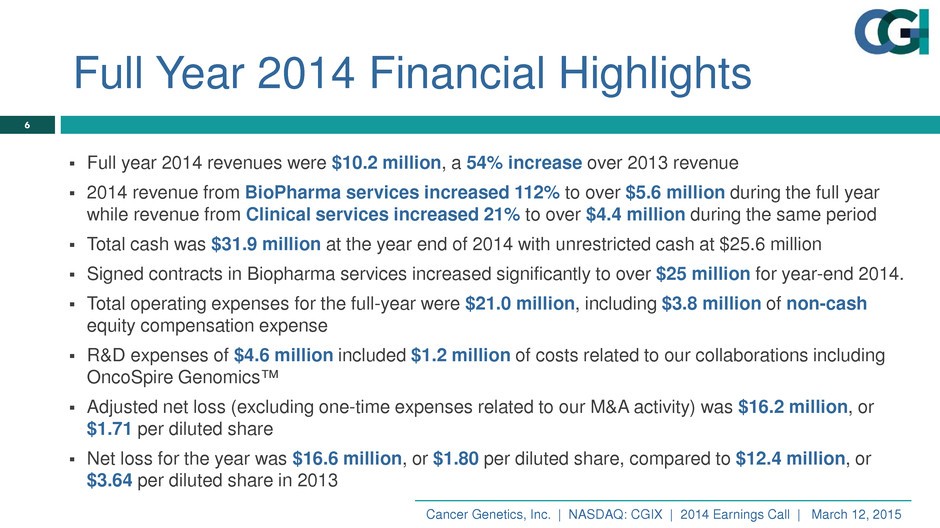
Full Year 2014 Financial Highlights 6 Full year 2014 revenues were $10.2 million, a 54% increase over 2013 revenue 2014 revenue from BioPharma services increased 112% to over $5.6 million during the full year while revenue from Clinical services increased 21% to over $4.4 million during the same period Total cash was $31.9 million at the year end of 2014 with unrestricted cash at $25.6 million Signed contracts in Biopharma services increased significantly to over $25 million for year-end 2014. Total operating expenses for the full-year were $21.0 million, including $3.8 million of non-cash equity compensation expense R&D expenses of $4.6 million included $1.2 million of costs related to our collaborations including OncoSpire Genomics™ Adjusted net loss (excluding one-time expenses related to our M&A activity) was $16.2 million, or $1.71 per diluted share Net loss for the year was $16.6 million, or $1.80 per diluted share, compared to $12.4 million, or $3.64 per diluted share in 2013 Cancer Genetics, Inc. | NASDAQ: CGIX | 2014 Earnings Call | March 12, 2015

Summary Statement of Operations 7 Income Statement Item ($ in Thousands) 2012 2013 2014 Revenue $4,302 $6,610 $10,199 Gross Profit 373 1,685 1,746 Gross Margin (%) 9% 26% 17% Research & Development (R&D) 2,112 2,190 4,623 Sales & Marketing (S&M) 1,399 1,842 3,964 General & Administrative (G&A) 4,503 6,115 12,369 Operating Profit (Loss) (7,641) (8,462) (19,209) Net Income (Loss) (6,666)B (13,036)A (16,643) A 2013 net loss includes non-cash charges of $2.3 million related to debt restructuring and the changes in liabilities related to outstanding warrants. B 2012 net loss includes a net non-cash benefit of $5.7 million related to changes in liabilities related to outstanding warrants and expenses related to debt restructuring. Balance Sheet Information Actual 12/31/14 All Cash* $31,854 Stockholders’ Equity 34,554 $ in thousands * All cash includes $6,000 restricted to collateralize a credit line Cancer Genetics, Inc. | NASDAQ: CGIX | 2014 Earnings Call | March 12, 2015

Value of Contracts: Biopharma Partners 8 Cancer Genetics, Inc. | NASDAQ: CGIX | 2014 Earnings Call | March 12, 2015 201420132012 Approximate future value of signed contracts with biotechnology and pharma customers for testing and services to support clinical trials.

2014 Select Highlights 9 Cancer Genetics, Inc. | NASDAQ: CGIX | 2014 Earnings Call | March 12, 2015 FHACT® for HPV-Associated Cancer Detection Regulatory Affairs and Patents for FHACT® • US Patent No. 8,865,882 • October 21, 2014 • Patent protection for FHACT®’s 4-marker design • US Patent No. 8,883,414 • November 11, 2014 • Patent protection for clinical use of FHACT® to detect HPV- associated cancer and precancer in cervical specimens • CE Marking received September 2, 2014 CGI’s proprietary FHACT® test is designed to detect 4 changes in patient DNA that indicate cervical tissue cancer and precancerous lesions FHACT® has a detection rate of up to 90% and has the potential to prevent up to 1.5 million unnecessary colposcopies in the US each year Market Analysis Focus Groups • Meetings with OB/GYNs and pathologists • Dallas, Raleigh, St. Louis, New York Dedicated Resources • FHACT® Field Product Managers • Reimbursement strategy & billing team • Dedicated advisory network
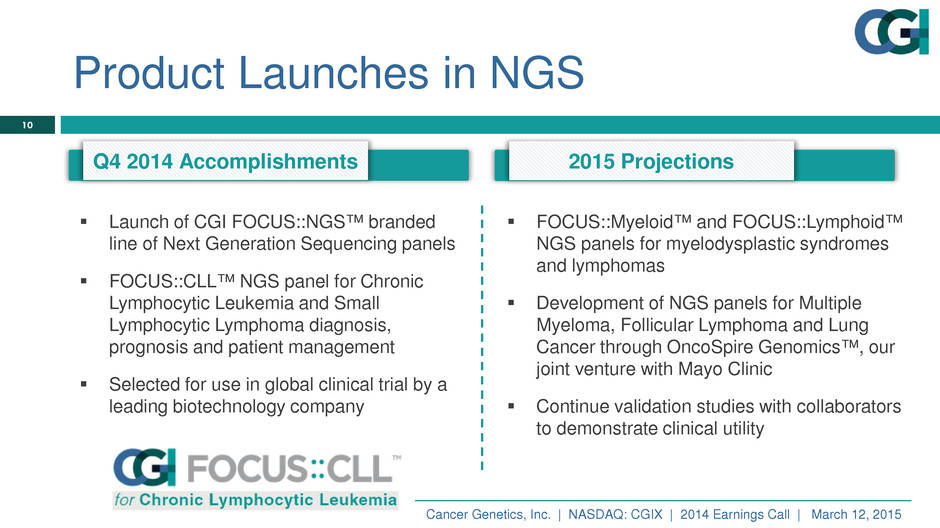
Product Launches in NGS 10 Launch of CGI FOCUS::NGS™ branded line of Next Generation Sequencing panels FOCUS::CLL™ NGS panel for Chronic Lymphocytic Leukemia and Small Lymphocytic Lymphoma diagnosis, prognosis and patient management Selected for use in global clinical trial by a leading biotechnology company FOCUS::Myeloid™ and FOCUS::Lymphoid™ NGS panels for myelodysplastic syndromes and lymphomas Development of NGS panels for Multiple Myeloma, Follicular Lymphoma and Lung Cancer through OncoSpire Genomics™, our joint venture with Mayo Clinic Continue validation studies with collaborators to demonstrate clinical utility Q4 2014 Accomplishments 2015 Projections Cancer Genetics, Inc. | NASDAQ: CGIX | 2014 Earnings Call | March 12, 2015
Upcoming Milestones 11 MARKET ADOPTION Increasing covered lives market access through additional payers & health care organizations Additional international agreements for FHACT® distribution and co-marketing partnerships in key geographies NEXT GENERATION SEQUENCING PANELS Launching multi-marker NGS panels for lymphoid and myeloid malignancies Multiple Myeloma NGS panel launch, OncoSpire Q2, 2015 DATA TO SUPPORT PRODUCTS Lymphoid, Myeloid and CLL Panels - Additional data and results to support clinical usage, patient value and payor coverage BIOPHARMA REVENUES & MARKET SHARE Additional news on biopharma partners & relationships BIOCancer Genetics, Inc. | NASDAQ: CGIX | 2014 Earnings Call | March 12, 2015

Reconciliation of Non-GAAP EPS metrics 12 Cancer Genetics, Inc. | NASDAQ: CGIX | 2014 Earnings Call | March 12, 2015 2014 2013 2014 2013 Net (loss) for diluted earnings per share - GAAP Basis (5,266,261)$ (3,061,389)$ (17,059,919)$ (17,005,553)$ Accelerated stock compensation due to acquisitions 451,757 - 451,757 - Finders, legal and accounting fees 110,000 - 390,872 - Revised fully diluted loss excluding acquisition expenses (4,704,504) (3,061,389) (16,217,291) (17,005,553) Weighted-average fully diluted common shares 9,641,586 8,300,242 9,461,663 4,675,974 Diluted net loss per share excluding acquisition expenses (0.49)$ (0.37)$ (1.71)$ (3.64)$ Diluted net loss per share -- GAAP basis (0.55)$ (0.37)$ (1.80)$ (3.64)$ Three Months Ended December 31, Twelve Months Ended December 31,

Thank You 13 Cancer Genetics, Inc. Meadows Office Complex 201 Route 17 North Rutherford, NJ 07070 (201) 528-9200 www.cancergenetics.com Cancer Genetics, Inc. | NASDAQ: CGIX | 2014 Earnings Call | March 12, 2015


