
InnerWorkings Announces First Quarter 2013 Results
Results Impacted by Previously Announced Spending Reduction from Large Customer;
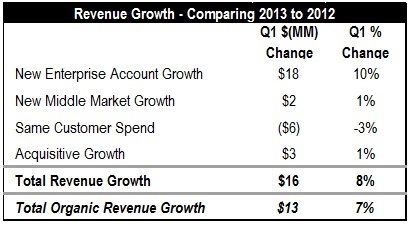
New Organic Enterprise Business Continues to Fuel Growth
CHICAGO, IL May 9, 2013 —InnerWorkings, Inc.(NASDAQ: INWK), aleadingglobal marketing supply chain company, today reported results for the three months ended March 31, 2013.
Quarterly Highlights:
| · | Revenue was $204.3 million, compared to $188.5 million in the first quarter of 2012. |
| · | Non-GAAP Adjusted EBITDA was $5.8 million, compared to Non-GAAP Adjusted EBITDA of $9.6 million in the first quarter of 2012. Please refer to the non-GAAP reconciliation table below for more information. |
| · | GAAP diluted earnings per share were $0.02, compared to GAAP diluted earnings per share of $0.07 in the first quarter of 2012. |
| · | Non-GAAP Adjusted Operating Cash Flow was $6.4 million, compared to Non-GAAP Adjusted Operating Cash Outflow of $3.3 million in the first quarter of 2012. Please refer to the non-GAAP reconciliation table below for more information. |
| · | New organic enterprise account growth was $18.1 million in the first quarter. |
"Our team is excited about our global enterprise opportunity,” said Eric D. Belcher, Chief Executive Officer of InnerWorkings. “Our pipeline is strong and we expect to achieve our new organic enterprise revenue goals again this year.”
Additional first quarter 2013 financial and operational highlights include the following:
| · | The enterprise channel accounted for 79% of revenue and middle market accounted for 21%, consistent with the revenue mix in the first quarter of 2012. |
| · | Gross profit margin was 22.5%, compared to 22.0% in the prior year period. |
| · | DB Studios, a California-based distributor of permanent point-of-purchase displays was acquired in March 2013. DB Studios is expected to generate revenues of approximately $20 million during the period from acquisition date to the end of the year. |
“While we continue to realize solid new enterprise growth, we are disappointed by our modest growth in the first quarter due to a decrease in a large customer’s spending,” said Joseph M. Busky, Chief Financial Officer of InnerWorkings. “Given the new enterprise activity happening across our global footprint, we anticipate stronger results for the balance of the year.”
Outlook
The Company reaffirms its recently revised 2013 revenue and EPS guidance. 2013 revenue guidance of $900 million to $930 million represents 13-17% growth over 2012, and 2013 EPS guidance of $0.45 to $0.50 represents 10-22% growth over 2012 adjusted diluted earnings per share.
Conference Call
A conference call to discuss the Company’s first quarter 2013 results will be broadcast live on Friday, May 10, 2013, at 10:00 a.m. Central Time (11:00 a.m. Eastern Time). The live webcast discussion, which will include a Q&A session, will be hosted by Eric D. Belcher, Chief Executive Officer, and Joseph M. Busky, Chief Financial Officer.
To access the conference call by telephone, interested parties may dial (877) 771-7024. Interested parties are also invited to listen to the live webcast by visiting the Investor "Events & Presentations" section of InnerWorkings' website atinvestor.inwk.com/events.cfm.A replay of the webcast will be available later that day in the same section of the website.
About InnerWorkings
InnerWorkings, Inc.(NASDAQ: INWK) is a leading global marketing supply chain company servicing corporate clients across a wide range of industries. With proprietary technology, an extensive supplier network and deep domain expertise, the Company procures, manages and delivers printed materials and promotional products as part of a comprehensive outsourced enterprise solution. InnerWorkings is based in Chicago, IL, employs approximately 1,400 individuals, and maintains 49 global offices. Among the manyindustriesInnerWorkings services are: retail, financial services, hospitality, non-profits, healthcare, food & beverage, broadcasting & cable, education, transportation and utilities.
For more information visit:www.inwk.com.
Non-GAAP Financial Measures
This press release includes the following financial measures defined as a "non-GAAP financial measures" by the Securities and Exchange Commission: Non-GAAP Adjusted EBITDA and Non-GAAP Adjusted Operating Cash Flow. We believe that Non-GAAP Adjusted EBITDA and Non GAAP Adjusted Operating Cash Flow provide useful information to investors because they provide information about the estimated financial performance of the Company's ongoing business. Non-GAAP Adjusted EBITDA and Non-GAAP Adjusted Operating Cash Flow are used by management in its financial and operational decision-making and evaluation of overall operating performance. Non-GAAP Adjusted EBITDA and Non-GAAP Adjusted Operating Cash Flow may be different from similar measures used by other companies. The presentation of this financial information, which is not prepared under any comprehensive set of accounting rules or principles, is not intended to be considered in isolation or as a substitute for the financial information prepared and presented in accordance with generally accepted accounting principles. For a reconciliation of these non-GAAP financial measures to the nearest comparable GAAP measures, see "Reconciliation of Non-GAAP Adjusted EBITDA and Non-GAAP Adjusted Operating Cash Flow” included in this release.
Forward-Looking Statements
This release contains statements relating to future results. These statements are forward-looking statements under the federal securities laws. We can give no assurance that any future results discussed in these statements will be achieved. Any forward-looking statements represent our views only as of today and should not be relied upon as representing our views as of any subsequent date. These statements are subject to a variety of risks and uncertainties that could cause our actual results to differ materially from the statements contained in this release. For a discussion of important factors that could affect our actual results, please refer to our SEC filings, including the "Risk Factors" section of our most recently filed Form 10-K.
CONTACT:
Brad Moore
InnerWorkings, Inc.
(312) 277-1510
bmoore@inwk.com
| Consolidated Statements of Income | ||||||||
| Three Months Ended March 31, | ||||||||
| 2012 | 2013 | |||||||
| Revenue | $ | 188,546,402 | $ | 204,316,125 | ||||
| Cost of goods sold | 147,153,019 | 158,323,630 | ||||||
| Gross profit | 41,393,383 | 45,992,495 | ||||||
| Operating expenses: | ||||||||
| Selling, general and administrative expenses | 33,083,264 | 41,735,789 | ||||||
| Depreciation and amortization | 2,444,096 | 2,465,667 | ||||||
| Income from operations | 5,866,023 | 1,791,039 | ||||||
| Total other expense | (260,388 | ) | (923,936 | ) | ||||
| Income before income taxes | 5,605,635 | 867,103 | ||||||
| Income tax expense | 1,917,947 | (28,027 | ) | |||||
| Net income | $ | 3,687,688 | $ | 895,130 | ||||
| Basic earnings per share | $ | 0.08 | $ | 0.02 | ||||
| Diluted earnings per share | $ | 0.07 | $ | 0.02 | ||||
| Weighted average shares outstanding, basic | 47,193,327 | 50,338,994 | ||||||
| Weighted average shares outstanding, diluted | 50,013,569 | 52,006,801 | ||||||
| Consolidated Balance Sheets | ||||||||
| December 31, | March 31, | |||||||
| 2012 | 2013 | |||||||
| Cash and cash equivalents | $ | 17,218,899 | $ | 10,609,171 | ||||
| Accounts receivable, net of allowance for doubtful accounts | 149,246,568 | 150,492,103 | ||||||
| Unbilled revenue | 30,798,230 | 30,191,086 | ||||||
| Inventories | 17,406,863 | 15,310,762 | ||||||
| Prepaid expenses | 16,210,053 | 19,880,172 | ||||||
| Other current assets | 22,565,321 | 22,456,346 | ||||||
| Total long-term assets | 268,797,648 | 309,247,680 | ||||||
| Total assets | $ | 522,243,582 | $ | 558,187,320 | ||||
| Accounts payable-trade | $ | 121,132,051 | $ | 126,701,960 | ||||
| Other current liabilities | 44,262,065 | 49,223,149 | ||||||
| Revolving credit facility | 65,000,000 | 70,500,000 | ||||||
| Other long-term liabilities | 68,870,021 | 84,196,997 | ||||||
| Total stockholders' equity | 222,979,445 | 227,565,214 | ||||||
| Total liabilities and stockholders' equity | $ | 522,243,582 | $ | 558,187,320 | ||||
| Cash Flow Data | ||||||||
| Three Months Ended March 31, | ||||||||
| 2012 | 2013 | |||||||
| Net cash provided by (used in) operating activities | $ | (7,472,638 | ) | $ | 4,552,380 | |||
| Net cash used in investing activities | (3,189,117 | ) | (9,148,187 | ) | ||||
| Net cash provided by (used in) financing activities | 12,886,424 | (1,854,875 | ) | |||||
| Effect of exchange rate changes on cash and cash equivalents | 221,918 | (159,046 | ) | |||||
| Increase (decrease) in cash and cash equivalents | 2,446,587 | (6,609,728 | ) | |||||
| Cash and cash equivalents, beginning of period | 13,219,385 | 17,218,899 | ||||||
| Cash and cash equivalents, end of period | $ | 15,665,972 | $ | 10,609,171 | ||||
| Reconciliation of Adjusted EBITDA and Adjusted Operating Cash Flows | ||||||||
| Three Months Ended March 31, | ||||||||
| 2012 | 2013 | |||||||
| Operating income | $ | 5,866,023 | $ | 1,791,039 | ||||
| Depreciation and amortization | 2,444,096 | 2,465,667 | ||||||
| Stock-based compensation expense | 1,047,645 | 973,193 | ||||||
| Change in fair value of contingent consideration | 200,141 | 608,832 | ||||||
| Adjusted EBITDA | $ | 9,557,905 | $ | 5,838,731 | ||||
| Three Months Ended March 31, | ||||||||
| 2012 | �� | 2013 | ||||||
| Net cash provided by (used in) operating activities | $ | (7,472,638 | ) | $ | 4,552,380 | |||
| Excess tax benefit from exercise of stock awards * | 4,163,793 | 951,066 | ||||||
| Cash paid for settlement of preference claim | - | 900,000 | ||||||
| Adjusted net cash provided by (used in) operating activities | $ | (3,308,845 | ) | $ | 6,403,446 | |||
| * Represents a U.S. tax deduction in an amount equal to the excess of the market price of the stock on the date of exercise over exercise price. | ||||||||