Exhibit 99.1
Exhibit 99.1
InnerWorkings Investor Day Presentation
February 22, 2010
Safe Harbor Statement
This presentation contains statements relating to future results. These statements are forward-looking statements under the federal securities laws. We can give no assurance that any future results discussed in these statements will be achieved. Any forward-looking statements represent our views only as of today and should not be relied upon as representing our views as of any subsequent date. These statements are subject to a variety of risks and uncertainties that could cause our actual results to differ materially from the statements contained in this presentation. For a discussion of important factors that could affect our actual results, please refer to the most recent Form 10-K, including the “Risk Factors” section, we filed with the SEC.
2
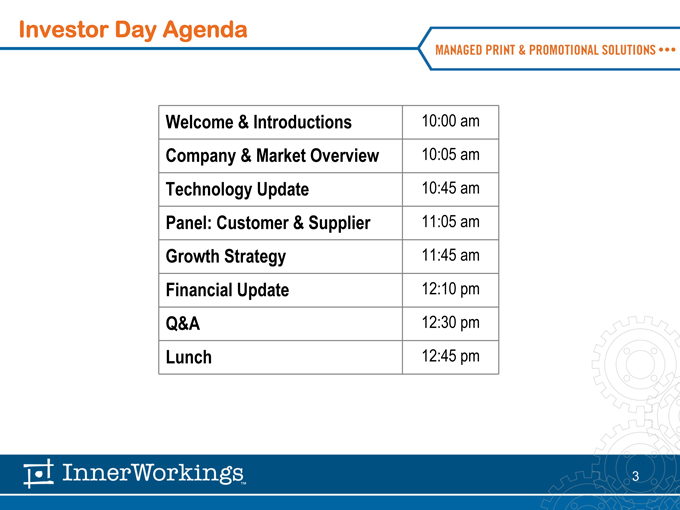
Investor Day Agenda
Welcome & Introductions 10:00 am
Company & Market Overview 10:05 am
Technology Update 10:45 am
Panel: Customer & Supplier 11:05 am
Growth Strategy 11:45 am
Financial Update 12:10 pm
Q&A 12:30 pm
Lunch 12:45 pm
3
Speakers
Eric Belcher
Chief Executive Officer
Joe Busky
Chief Financial Officer
Jonathan Shean
Senior Vice President, Operations
4
Company and Market Overview
Eric Belcher, CEO
5
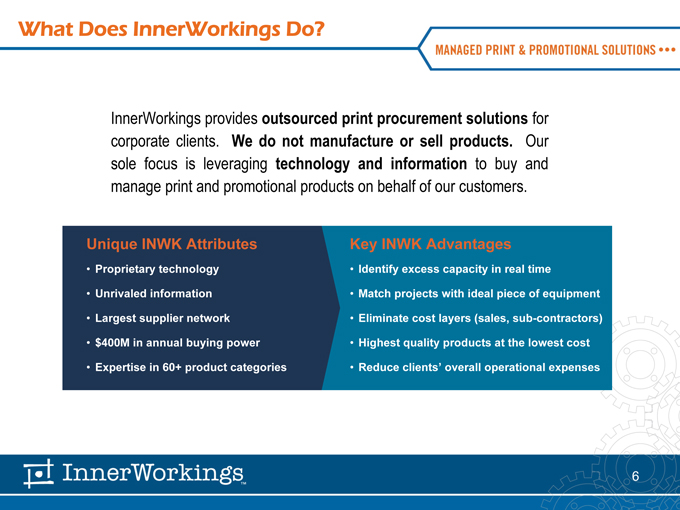
What Does InnerWorkings Do?
InnerWorkings provides outsourced print procurement solutions for corporate clients. We do not manufacture or sell products. Our sole focus is leveraging technology and information to buy and manage print and promotional products on behalf of our customers.
Unique INWK Attributes Key INWK Advantages
• Proprietary technology • Identify excess capacity in real time
• Unrivaled information • Match projects with ideal piece of equipment
• Largest supplier network • Eliminate cost layers (sales, sub-contractors)
• $400M in annual buying power • Highest quality products at the lowest cost
• Expertise in 60+ product categories • Reduce clients’ overall operational expenses
6
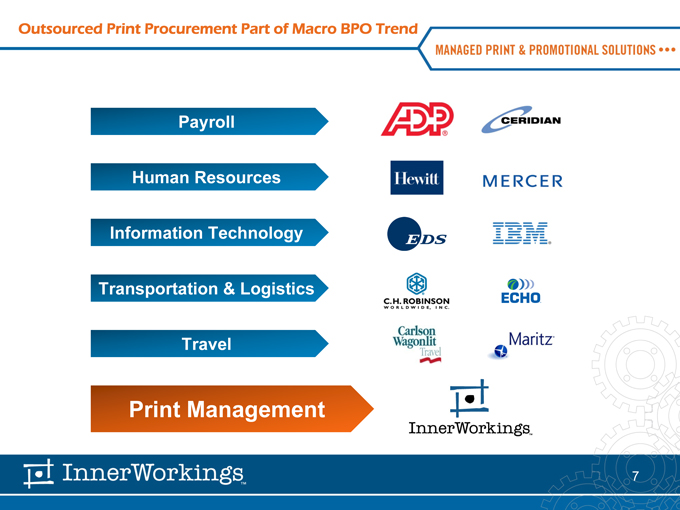
Outsourced Print Procurement Part of Macro BPO Trend
Payroll Human Resources Information Technology Transportation & Logistics Travel
Print Management
7
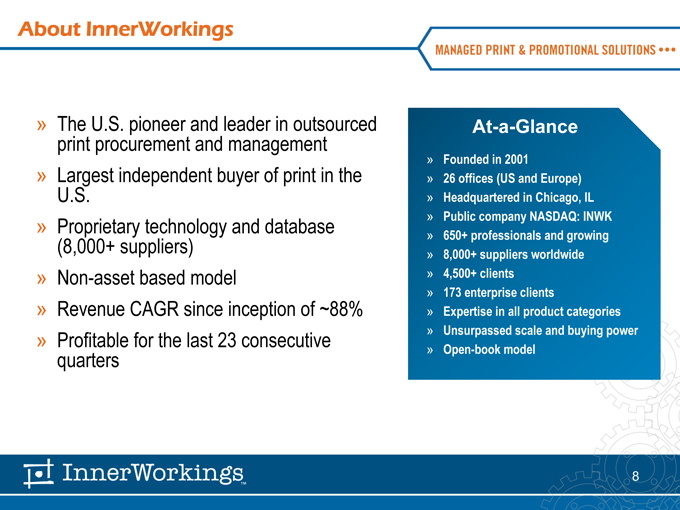
About InnerWorkings
The U.S. pioneer and leader in outsourced print procurement and management
Largest independent buyer of print in the U.S.
Proprietary technology and database (8,000+ suppliers)
Non-asset based model
Revenue CAGR since inception of ~88%
Profitable for the last 23 consecutive quarters
At-a-Glance
Founded in 2001
26 offices (US and Europe)
Headquartered in Chicago, IL
Public Company NASDAQ: INWK
650+ professionals and growing
8,000+ suppliers worldwide
4,500+ clients
173 enterprise clients
Expertise in all products categories
Unsurpassed scale and buying power
Open-book model
8
Print: An industry Ripe for Disruption
A massive market: $100+B
Highly fragmented: 39,000+ U.S. printers
Excess capacity: 30-40%
Pervasive price discrimination
No “killer app” for efficient print procurement
Print is the “last bastion of cost savings”*
With game-changing technology and first mover advantage INWK is ideally positioned to further disrupt the print market to the benefit of its customers and shareholders
*CIO Magazine
9
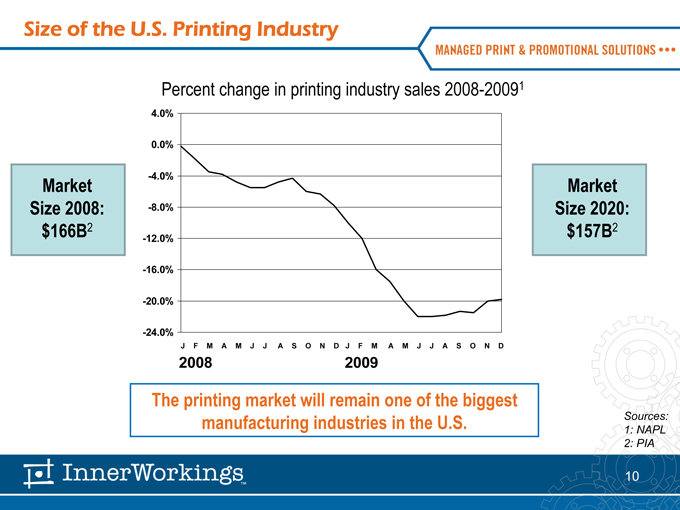
Size of the U.S. Printing Industry
J F M A M J J A S O N D J F M A M J J A S O N D
2008 2009
The printing market will remain one of the biggest manufacturing industries in the U.S. Sources:
1: NAPL
2: PIA
Market Size 2008: $166B2
Market Size 2020: $157B2
Percent change in printing industry sales 2008-20091
4.0% 0.0% -4.0% -8.0%
-12.0% -16.0% -20.0% -24.0%
10
A Huge Growth Opportunity
Approximately 2% of all print in North America is currently run through a print management channel
In the U.K. outsourced print management has a 15-20% share
INWK currently stands at less than one half of 1% share of our addressable market
The market share opportunity for INWK remains enormous
11
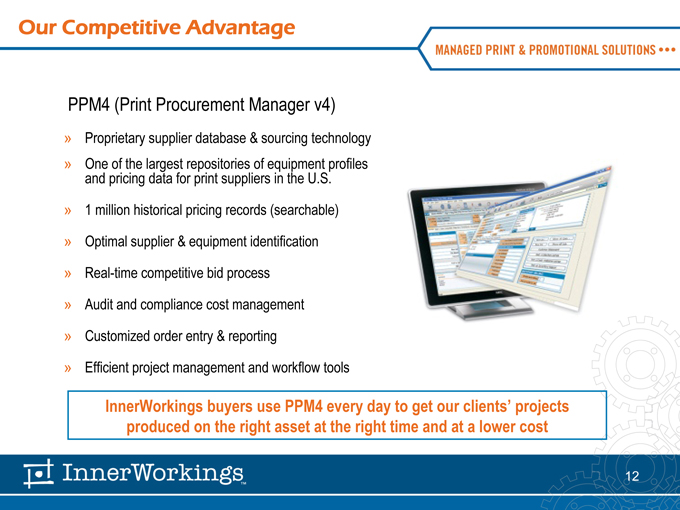
Our Competitive Advantage
PPM4 (Print Procurement Manager v4)
Proprietary supplier database & sourcing technology
One of the largest repositories of equipment profiles and pricing data for print suppliers in the U.S.
1 million historical pricing records (searchable)
Optimal supplier & equipment identification
Real-time competitive bid process
Audit and compliance cost management
Customized order entry & reporting
Efficient project management and workflow tools
InnerWorkings buyers use PPM4 every day to get our clients’ projects produced on the right asset at the right time and at a lower cost
12
Select Enterprise Clients
Enterprise client success encompasses many industries across the Fortune 2000 including finance, retail, healthcare, CPG and more
13
Sample 2009 Enterprise Client Wins
Thirty enterprise wins in 2009 expected to drive more than $50M in new 2010 revenue
14
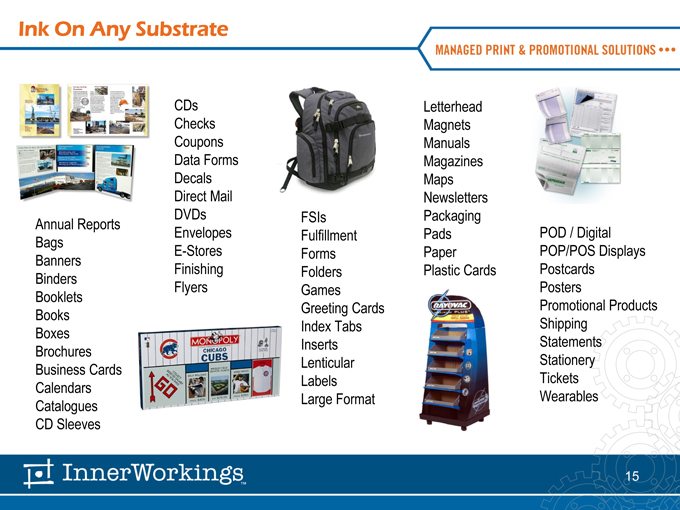
Ink On Any Substrate
CDs Letterhead
Checks Magnets
Coupons Manuals
Data Forms Magazines
Decals Maps
Direct Mail Newsletters
Annual Reports DVDs FSIs Packaging
Bags Envelopes Fulfillment Pads POD / Digital
Banners E-Stores Forms Paper POP/POS Displays
Binders Finishing Folders Plastic Cards Postcards
Booklets Flyers Games Posters
Books Greeting Cards Promotional Products
Boxes Index Tabs Shipping
Brochures Inserts Statements
Business Cards Lenticular Stationery
Calendars Labels Tickets
Catalogues Large Format Wearables
CD Sleeves
15
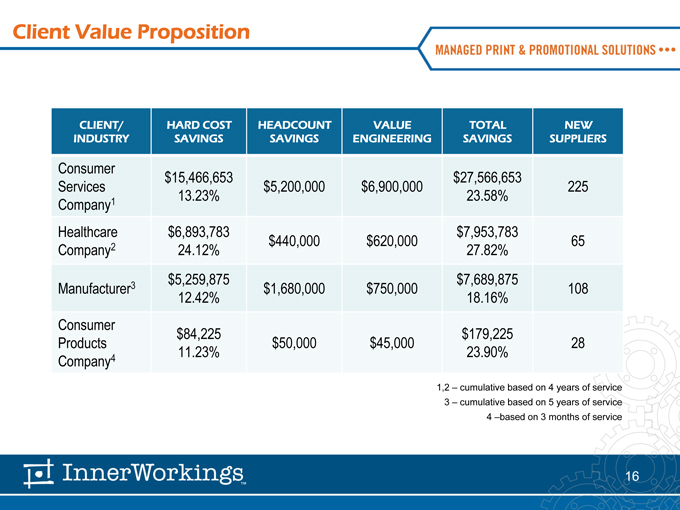
Client Value Proposition
CLIENT/ HARD COST HEADCOUNT VALUE TOTAL NEW
INDUSTRY SAVINGS SAVINGS ENGINEERING SAVINGS SUPPLIERS
Consumer $15,466,653 $27,566,653
Services $5,200,000 $6,900,000 225
Company1 13.23% 23.58%
Healthcare $6,893,783 $7,953,783
$440,000 $620,000 65
Company2 24.12% 27.82%
$5,259,875 $7,689,875
Manufacturer3 $1,680,000 $750,000 108
12.42% 18.16%
Consumer $84,225 $179,225
Products $50,000 $45,000 28
Company4 11.23% 23.90%
1,2 – cumulative based on 4 years of service
3 – cumulative based on 5 years of service
4 –based on 3 months of service
16
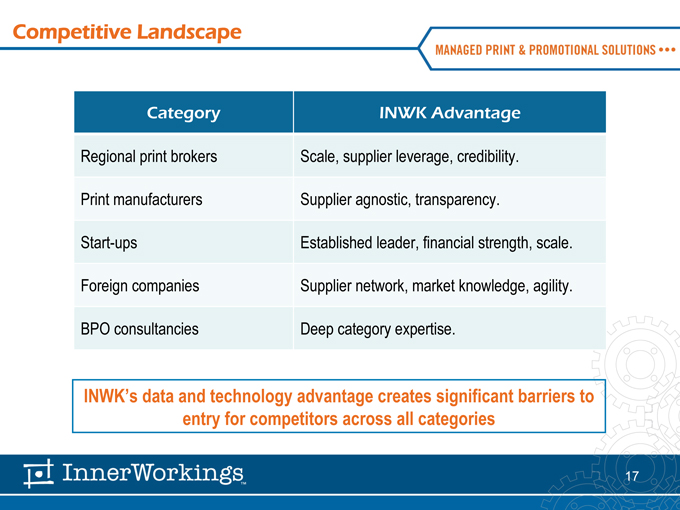
Competitive Landscape
Category INWK Advantage
Regional print brokers Scale, supplier leverage, credibility.
Print manufacturers Supplier agnostic, transparency.
Start-ups Established leader, financial strength, scale.
Foreign companies Supplier network, market knowledge, agility.
BPO consultancies Deep category expertise.
INWK’s data and technology advantage creates significant barriers to entry for competitors across all categories
17
Technology Update
Jonathan Shean, SVP Operations
18
Agenda
PPM4 sourcing and procurement technology
Certified supplier portal
IW eStore demo
19
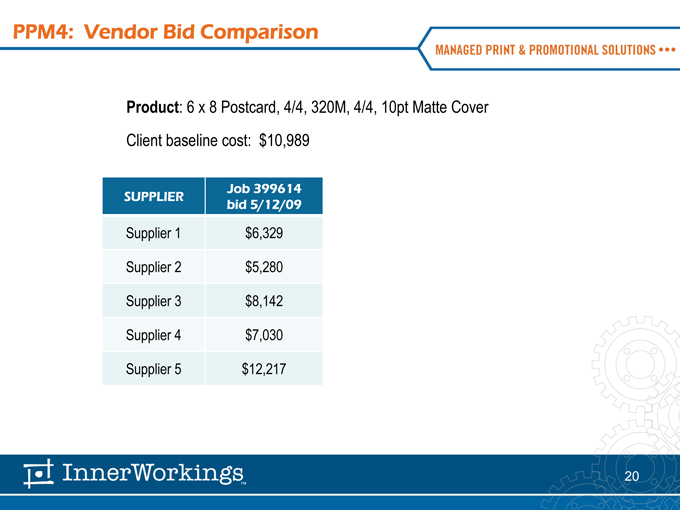
PPM4: Vendor Bid Comparison
Product: 6 x 8 Postcard, 4/4, 320M, 4/4, 10pt Matte Cover Client baseline cost: $10,989
Job 399614
SUPPLIER bid 5/12/09
Supplier 1 $6,329
Supplier 2 $5,280
Supplier 3 $8,142
Supplier 4 $7,030
Supplier 5 $12,217
20
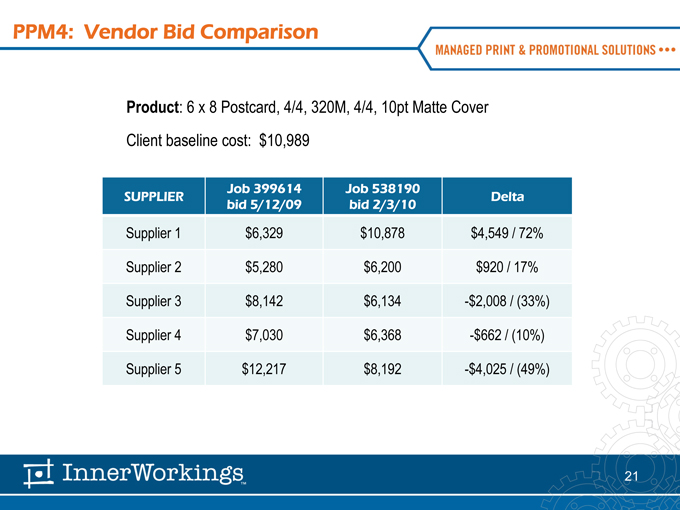
PPM4: Vendor Bid Comparison
Product: 6 x 8 Postcard, 4/4, 320M, 4/4, 10pt Matte Cover Client baseline cost: $10,989
Job 399614 Job 538190
SUPPLIER Delta
bid 5/12/09 bid 2/3/10
Supplier 1 $6,329 $10,878 $4,549 / 72%
Supplier 2 $5,280 $6,200 $920 / 17%
Supplier 3 $8,142 $6,134 -$2,008 / (33%)
Supplier 4 $7,030 $6,368 -$662 / (10%)
Supplier 5 $12,217 $8,192 -$4,025 / (49%)
21

IW eStores
IW eStore Benefits
Sourcing: best practices
Costs: shared leverage
Brand Mgmt.: consistency
Efficiency: automation
Time: ease of use
Access: 24/7 on the web
Quality: pipeline control
Measurement: reporting
22
Panel Discussion
Amy Deveau, Freedom Graphic Systems David Brown, InterContinental Hotels Group
23

A Strategy for Growth
Eric Belcher, CEO
24
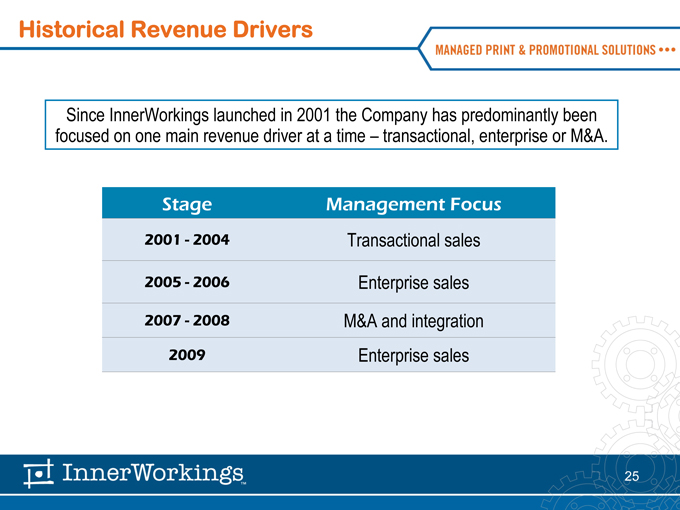
Historical Revenue Drivers
Since InnerWorkings launched in 2001 the Company has predominantly been focused on one main revenue driver at a time – transactional, enterprise or M&A.
Stage Management Focus
2001 - 2004 Transactional sales
2005 - 2006 Enterprise sales
2007 - 2008 M&A and integration
2009 Enterprise sales
25
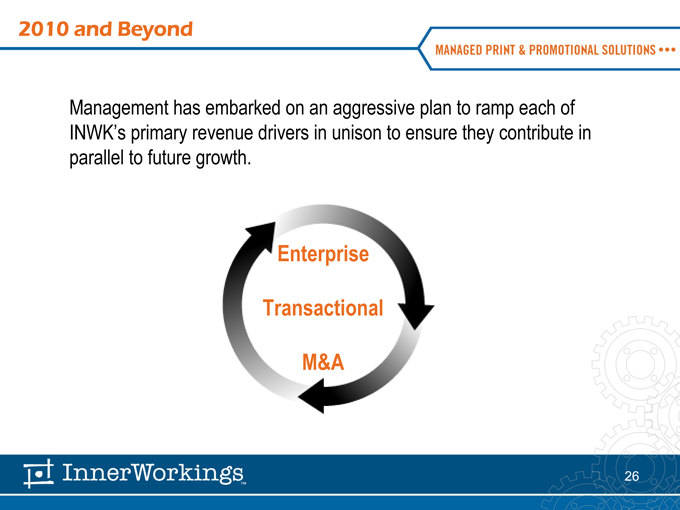
2010 and Beyond
Management has embarked on an aggressive plan to ramp each of INWK’s primary revenue drivers in unison to ensure they contribute in parallel to future growth.
Enterprise
Transactional
M&A
26
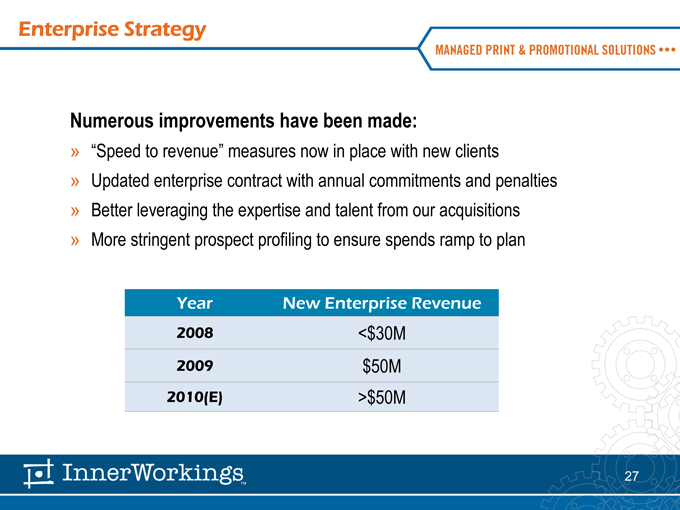
Enterprise Strategy
Numerous improvements have been made:
“Speed to revenue” measures now in place with new clients
Updated enterprise contract with annual commitments and penalties
Better leveraging the expertise and talent from our acquisitions
More stringent prospect profiling to ensure spends ramp to plan
Year New Enterprise Revenue
2008 <$30M
2009 $50M
2010(E) >$50M
27
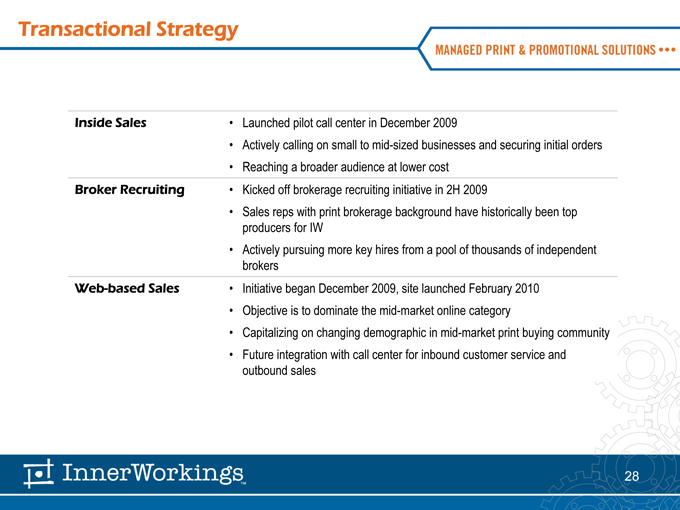
Transactional Strategy
Inside Sales • Launched pilot call center in December 2009
• Actively calling on small to mid-sized businesses and securing initial orders
• Reaching a broader audience at lower cost
Broker Recruiting • Kicked off brokerage recruiting initiative in 2H 2009
• Sales reps with print brokerage background have historically been top
producers for IW
• Actively pursuing more key hires from a pool of thousands of independent
brokers
Web-based Sales • Initiative began December 2009, site launched February 2010
• Objective is to dominate the mid-market online category
• Capitalizing on changing demographic in mid-market print buying community
• Future integration with call center for inbound customer service and
outbound sales
28
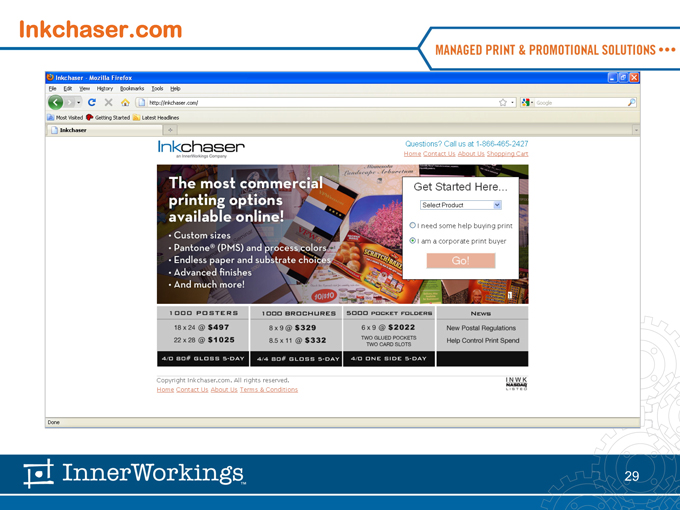
Inkchaser.com
29
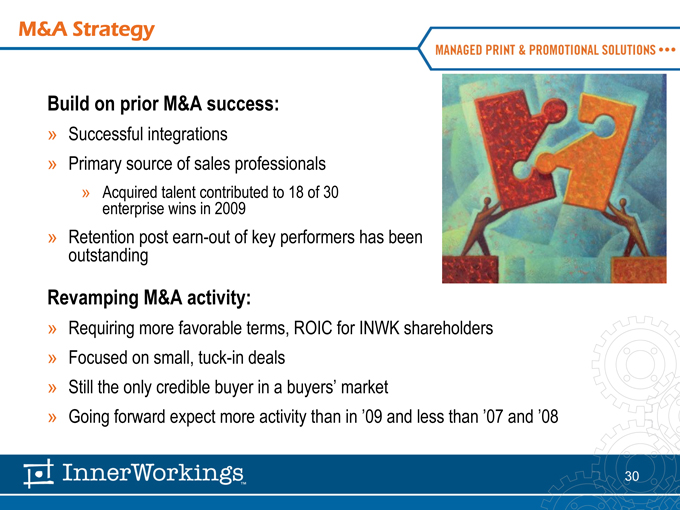
M&A Strategy
Build on prior M&A success:
Successful integrations
Primary source of sales professionals
Acquired talent contributed to 18 of 30 enterprise wins in 2009
Retention post earn-out of key performers has been outstanding
Revamping M&A activity:
Requiring more favorable terms, ROIC for INWK shareholders
Focused on small, tuck-in deals
Still the only credible buyer in a buyers’ market
Going forward expect more activity than in ’09 and less than ’07 and ’08
30
Financials
Joe Busky, CFO
31
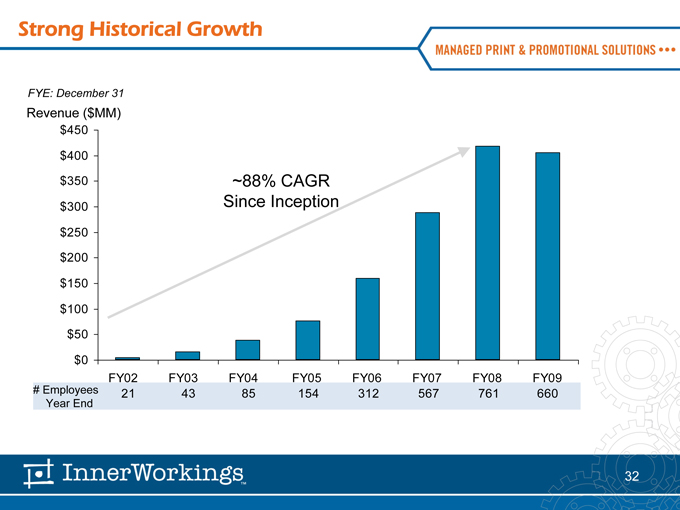
Strong Historical Growth
FY02 FY03 FY04 FY05 FY06 FY07 FY08 FY09
21 43 85 154 312 567 761 660
# Employees Year End
FYE: December 31
Revenue ($MM)
$450 $400 $350 $300 $250 $200 $150 $100 $50 $0
~88% CAGR Since Inception
32
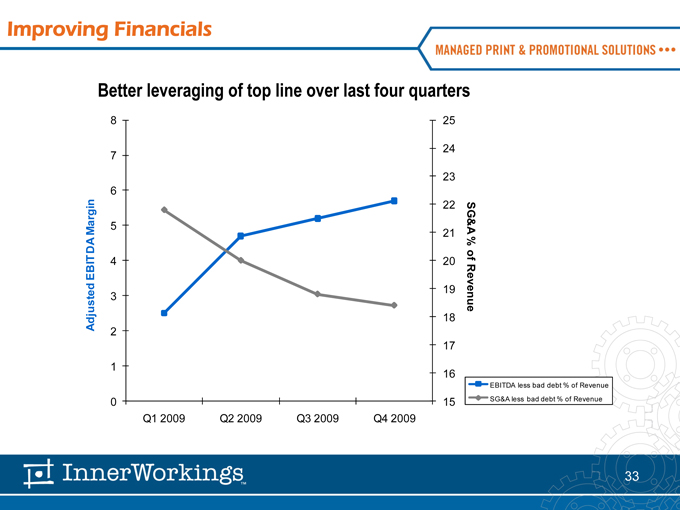
Improving Financials
Better leveraging of top line over last four quarters
Adjusted EBITDA Margin
25 24 23 22 21 20 19 18 17 16 15
SG&A % of Revenue
EBITDA less bad debt % of Revenue SG&A less bad debt % of Revenue
Q1 2009 Q2 2009 Q3 2009 Q4 2009
8 7 6 5 4 3 2 1 0
33
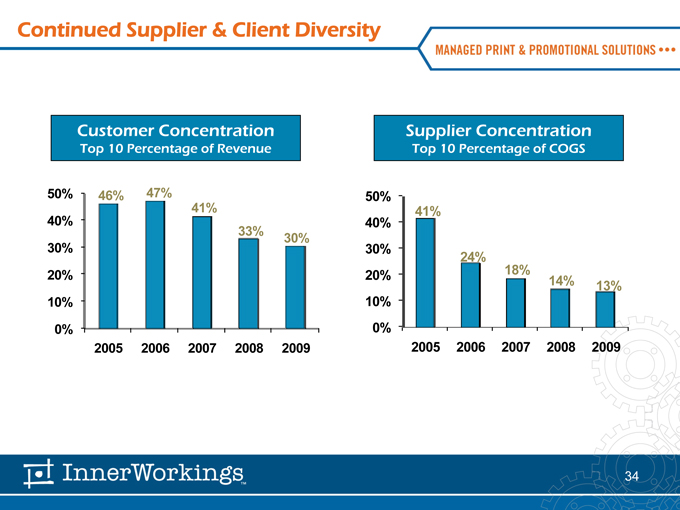
Continued Supplier & Client Diversity
Customer Concentration Supplier Concentration
Top 10 Percentage of Revenue Top 10 Percentage of COGS
50% 46% 47% 50% 41% 41% 40% 40% 33% 30% 30% 30% 24% 20% 20% 18%
14% 13% 10% 10% 0% 0%
2005 2006 2007 2008 2009 2005 2006 2007 2008 2009
34
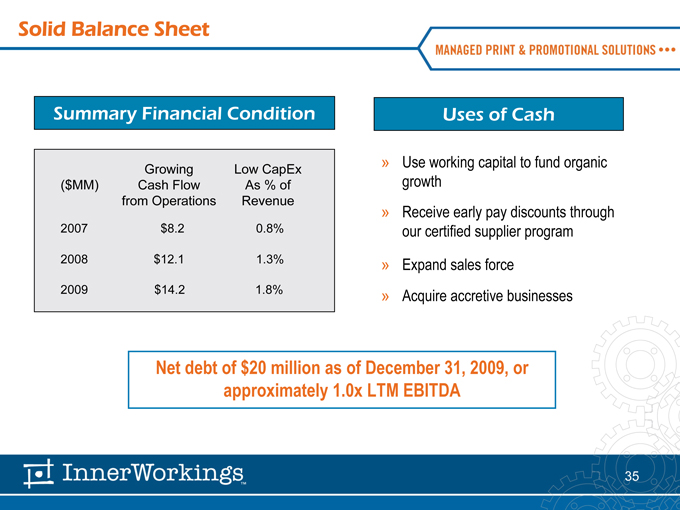
Solid Balance Sheet
Summary Financial Condition
Growing Low CapEx
($MM) Cash Flow As % of
from Operations Revenue
2007 $8.2 0.8%
2008 $12.1 1.3%
2009 $14.2 1.8%
Uses of Cash
Use working capital to fund organic growth
Receive early pay discounts through our certified supplier program
Expand sales force
Acquire accretive businesses
Net debt of $20 million as of December 31, 2009, or approximately 1.0x LTM EBITDA
35
Creating Shareholder Value
We are focused on improving Return on Invested Capital:
Decreased DSOs
Invoicing/collecting faster
Improved terms on current/future enterprise deals
Increase Operating Margins
Continued headcount rationalization
Technology enhanced productivity
Increased use of certified vendors - early pay discounts & rebates
Goal is to return to pre-recession levels
Management incentives aligned with goal
36
2010 Financial Guidance
37
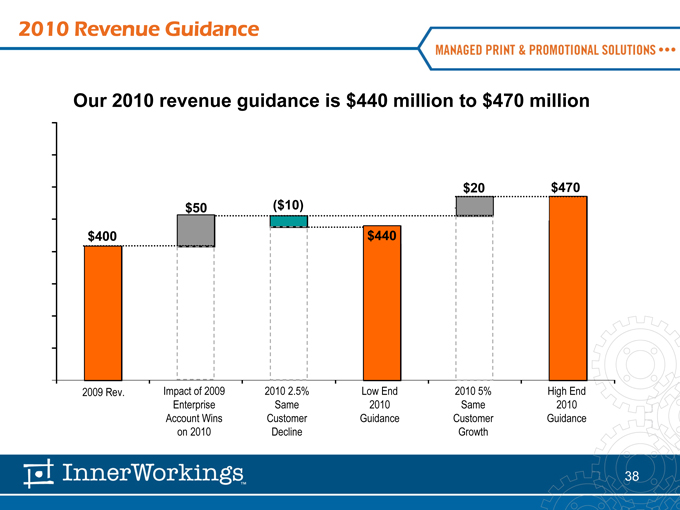
2010 Revenue Guidance
2009 Rev. Impact of 2009 2010 2.5% Low End 2010 5% High End
Enterprise Same 2010 Same 2010
Account Wins Customer Guidance Customer Guidance
on 2010 Decline Growth
Our 2010 revenue guidance is $440 million to $470 million
$20 $470
$50 ($10)
$400
38
2010 EPS Guidance
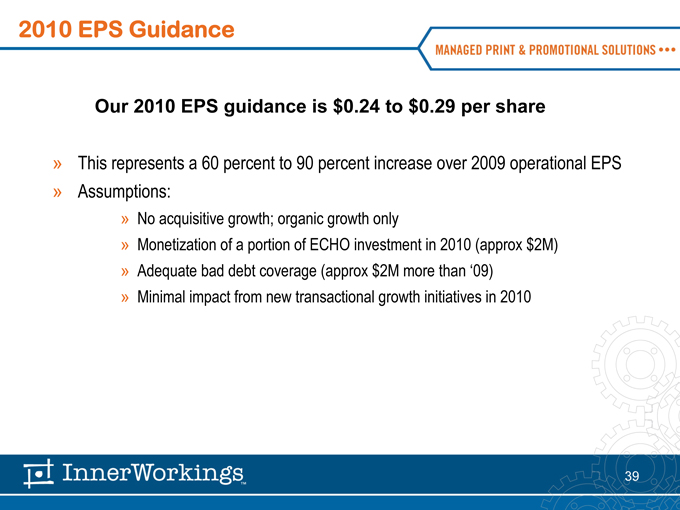
Our 2010 EPS guidance is $0.24 to $0.29 per share
This represents a 60 percent to 90 percent increase over 2009 operational EPS
Assumptions:
No acquisitive growth; organic growth only
Monetization of a portion of ECHO investment in 2010 (approx $2M)
Adequate bad debt coverage (approx $2M more than ‘09)
Minimal impact from new transactional growth initiatives in 2010
39
Increased Operating Leverage
Improved operating margins will be driven by the following:
Productivity gains from growth of the company
Economic rebound leading to larger customer order sizes
Technology productivity enhancements
Autoquote
eStores
Process efficiencies
Prudent growth of G&A expense with top line growth; lessons learned from 2009
40
Moving Forward 3-5 Years
Organic growth rate of ~15% per year
Gross margins of 24-26%
EBITDA margins of 8-9%
ROIC the primary financial metric used to manage the business
41
Why InnerWorkings
Market opportunity remains huge
Established leadership position
Game changing technology
Sustainable competitive advantage
Proven asset-light business model
Proven track record of performance and growth
Solid balance sheet and cash flow
Strong pipeline of enterprise clients
Clear, achievable growth strategy
42
Experienced Management Team
Eric D. Belcher President and Chief Executive Officer
Mr. Belcher is the President and Chief Executive Officer of InnerWorkings. Prior to January 2009, he served as the President and Chief Operating Officer. He joined InnerWorkings in June 2005 as Executive Vice President of Operations. Previously, Mr. Belcher held the positions of Chief Operating Officer and Chief Financial Officer at manroland, a printing equipment manufacturer and distributor. From 1995 to 2000, he led project teams at Marakon Associates, an international management consulting firm. Mr. Belcher holds a B.A. from Bucknell University and an M.B.A. from the University of Chicago Graduate School of Business.
Joseph M. Busky Chief Financial Officer
Mr. Busky is the Chief Financial Officer of InnerWorkings. Previously, Mr. Busky served as Corporate Vice President, Chief Accounting Officer at Dade Behring, Inc. Upon the purchase of Dade Behring by Siemens Healthcare in November 2007, Mr. Busky assumed the role of Vice President, Corporate Controller for the Siemens Healthcare Diagnostics division. Mr. Busky also served in various roles of increasing responsibility at Dade Behring, including as Vice President, Treasurer, Vice President, Corporate Controller, and Vice President, Corporate Planning. Before joining Dade Behring in 1997, Mr. Busky worked in the audit function at Price Waterhouse for nine years. Mr. Busky is a Certified Public Accountant and holds a B.B.A. in Accounting and an M.B.A. from Loyola College. Mr. Busky joined InnerWorkings in July 2008.
Jonathan M. Shean Senior Vice President, Operations
Jonathan M. Shean has served as our Senior Vice President of Operations since October 2007. Prior to joining the Company, Mr. Shean held a senior management position at Domtar Corporation, a global producer of paper. Mr. Shean served in various management roles with increasing responsibilities at Domtar for over 12 years. Mr. Shean holds a Bachelor’s of Business Administration in Marketing from the University of Notre Dame and a Master’s of Business Administration from the University of Michigan Ross School of Business.
43
44